Virtual articulators, virtual occlusal records and virtual ...

Mapping Israel’s Virtual Water Trade
Raphael Astrow
Advisor: Dr. Randy Weinberg
Carnegie Mellon University

Raphael Astrow
Page 1 of 48
Introduction to virtual water trade
Virtual water trade is the hidden flow of water when food or other commodities
are traded from one place to another. For instance, it takes 40 liters of water on average
to produce and ship one slice of toast. When a country like Israel imports a slice of toast,
it indirectly imports 40 liters of water on average. The precise volume of virtual water in
any commodity is affected by climatic conditions and agricultural practice (Allan 2).
Aggregate virtual water trade is a good indicator of how strong a country’s
agricultural sector is and how much agricultural products are consumed in the origin
country and how much are exported abroad. Aggregate virtual water trade is also a
strong indicator of how economically and environmentally sound a country is. When
countries import large amounts of virtual water, it may indicate that the country’s
economy is strong and the country can engage in international trade (Allan 19).
Countries that import more virtual water than they export may be in a water deficit – its
freshwater sources cannot sustain its inhabitants’ water needs. Still, relatively few people
understand the concept or realize its significance to the world’s economy and the natural
environment.
Outline of Essay
This essay will begin with a discussion of virtual water trade in Israel and an
introduction to the app developed to support research about Israel’s virtual water trade.
Then, virtual water will be described in more detail and green, blue, and grey water will
be defined. What follows is a literature review that covers literature about virtual water,
Israeli and Palestinian agriculture, and the role virtual water trade plays in Israel. Then,
the app is showcased in case studies of Israel’s virtual water trade in three different

Raphael Astrow
Page 2 of 48
commodities. Afterwards, a discussion is provided about the data challenges encountered
while developing the app. Finally, a set of instructions for using the app and a glossary
of key terms is found at the end of the paper.
Virtual water trade in Israel
Israel’s has one of strongest economies in the world, especially for a country of its
size, and also is experiencing a longstanding water deficit. This mostly-arid country has a
high population density and its water systems are under demand by Israelis and
Palestinians. According to Wikipedia’s December 2010 figures, Israel has the 32nd
highest population density in the world and the Palestinian territories have the 20th
highest population density ("List of Countries by Population").
In Israel, 81.5% of the water footprint is imported from outside the country.
Israel’s average virtual water footprint is 2303 m3/year/capita, well above the global
average virtual water footprint: 1385 m3/year/capita (Mekonnen and Hoekstra). Since
Israel is located in an arid climate with long, dry summers and inconsistent rainy seasons,
its water economy is reliant on virtual water imports.
Introduction to the app
Given Israel’s reliance on virtual water trade and that Israel has a significant
agricultural sector, there is much to learn from virtual water trade in Israel. An app that
illustrates Israel’s virtual water trade data could support further research into Israel’s
virtual water trade.
Where in the World is Israel’s Virtual Water? is a mobile/web application that
presents data about Israel’s virtual water trade in an accessible format. It teaches users

Raphael Astrow
Page 3 of 48
about Israel’s import and export of 40 commodities and its implications for Israel’s water
economy.
Figure 1: Application logo (UO Teacher Knowledge Journal)
It calculates Israel’s total imports and exports of those 40 commodities by
combining two data sources – the United Nations total trade data between 2001-2012 and
the Water Footprint Network’s conversion factors between trade data and virtual water
sums ("Bilateral Trade" and Mekonnen and Hoekstra 23-49). The data is broken down
by water type – blue (rainwater), green (groundwater), and grey (wastewater offsetting).
The app demonstrates Israel’s virtual water trade imbalance – it imports more virtual
water than it exports.1
The app was deployed to the Internet for public use during summer, 2014 and there are plans to redeploy it, particularly during spring, 2015. The app was developed with nodeJS supported by a mongoDB database and presented with jQuery Mobile. The app was deployed to Nodejitsu and the database was deployed to MongoHQ. When deployed, the app can be accessed on all devices at http://israelvirtualwater.jit.su.

Raphael Astrow
Page 4 of 48
Figure 2: commodity selection options
The 40 commodities demonstrated in the app are diverse – most are produce or
meat, though there are non-food commodities as well, such as rubber2. There is also an
option to view data for all 40 commodities combined into one set of charts.
Introduction to blue/green/grey water
The majority of water on earth is green water – water that the ground absorbed and
is not readily accessible for human consumption. In other words, planet earth absorbs
green water, which allows vegetation to grow naturally without human inputs or
attention. Green water eventually evaporates or transpires through plants.
2 The commodities are: apples, barley, bovine meat, butter, ghee, coconuts - including copra, coffee, cream, eggs, raw animal fats, groundnuts (shelled equivalent), grapes, maize, millet, mutton & goat meat, nuts, oats, offals, olive oil, olives, onions, palm oil, palmkernel oil, pepper, potatoes, rape and mustard oil, rape and mustardseed, rice (milled equivalent), rubber, rye, sorghum, soyabean oil, soyabeans, sugar beet, sugar cane, sunflowerseed oil, sunflowerseed, sweeteners, tea, tobacco, and wheat.
Raphael Astrow
Page 5 of 48
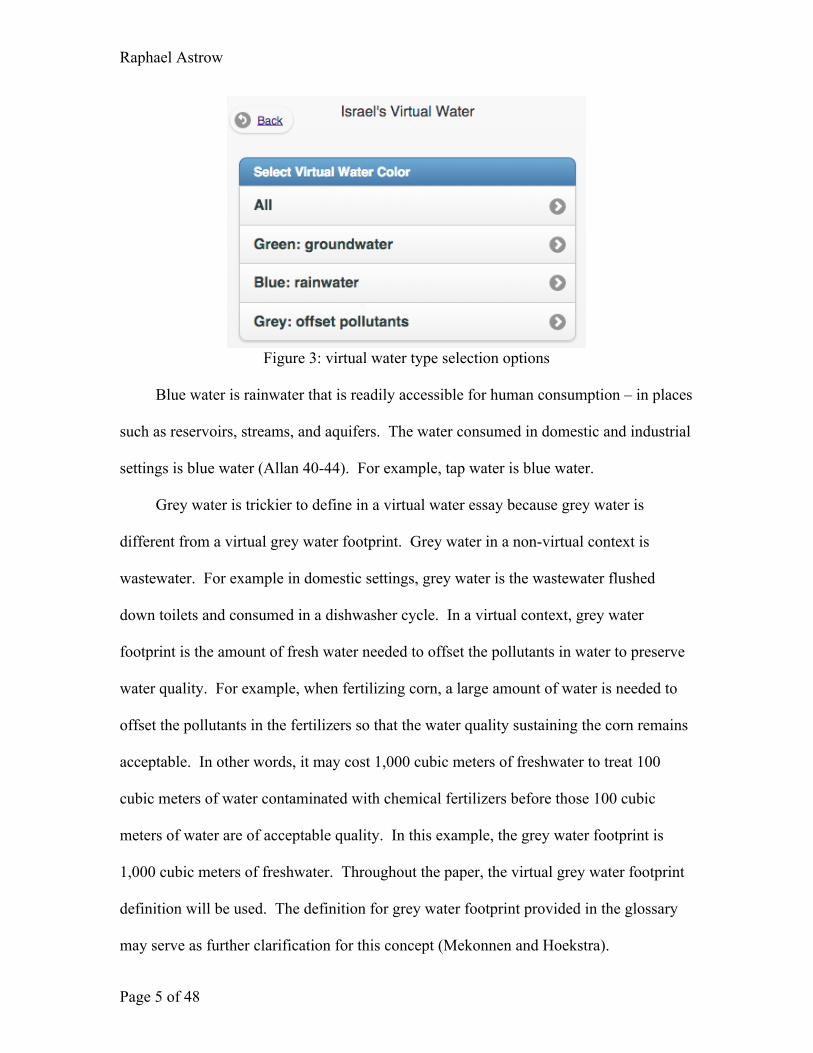
Figure 3: virtual water type selection options
Blue water is rainwater that is readily accessible for human consumption – in places
such as reservoirs, streams, and aquifers. The water consumed in domestic and industrial
settings is blue water (Allan 40-44). For example, tap water is blue water.
Grey water is trickier to define in a virtual water essay because grey water is
different from a virtual grey water footprint. Grey water in a non-virtual context is
wastewater. For example in domestic settings, grey water is the wastewater flushed
down toilets and consumed in a dishwasher cycle. In a virtual context, grey water
footprint is the amount of fresh water needed to offset the pollutants in water to preserve
water quality. For example, when fertilizing corn, a large amount of water is needed to
offset the pollutants in the fertilizers so that the water quality sustaining the corn remains
acceptable. In other words, it may cost 1,000 cubic meters of freshwater to treat 100
cubic meters of water contaminated with chemical fertilizers before those 100 cubic
meters of water are of acceptable quality. In this example, the grey water footprint is
1,000 cubic meters of freshwater. Throughout the paper, the virtual grey water footprint
definition will be used. The definition for grey water footprint provided in the glossary
may serve as further clarification for this concept (Mekonnen and Hoekstra).

Raphael Astrow
Page 6 of 48
Literature Review
Book Review 1
In Tony Allan’s Virtual Water: Tackling the Threat to Our Planet’s Most Precious
Resource, the author argues that virtual water has served as the hidden solution for much
of the world’s food and water insecurity. He claims that large industrialized nations such
as the United States have the most access to virtual water resources and may export it to
more water-starved countries such as Israel through food commodities such as wheat as
necessary (86-87). Given the potential conflicts over native water resources, Allan
believes that virtual water has prevented wars, particularly in the Middle East – and he
uses the 1970 peace treaty between Egypt and Israel as an example (48-49). Egypt
realized that it could receive large quantities of cheap staples foods from the United
States and thus aligned its foreign policy with the US’s. By declaring peace with Israel,
Egypt further aligned its diplomatic relations with the US. In 2010, 40% of Egypt’s
water was virtually imported (262).
Allan views virtual water trade as the best long-term solution for many water
scarce countries, such as Israel. He encourages water-deficient countries to diversify
their economies so that they can export resources that demand little water in exchange for
water intensive commodities grown in countries such as the US and Australia (75).
However, Allan cautions that some of the world’s current virtual water trade patterns are
unsustainable. For example, he insists that people need to become more responsible
eaters – in other words, people must consume less meat (4-5). Additionally, he laments
that arid southern California exports 10 cubic kilometers of virtual water to other
countries each year – arid regions should not export much virtual water, he claims (109).

Raphael Astrow
Page 7 of 48
While over 70% of the world’s water is consumed in producing food, Allan still regrets
that most countries use drinkable water for tasks that could be accomplished with
undrinkable water, such as watering a garden – and even worse for crop irrigation (23).
Overall, this book provides an excellent description of virtual water and is an
excellent starting point for readers interested in understanding virtual water. The author
is a pioneer in the field and has helped define virtual water for many beginners and
experts. Readers who have little prior knowledge about virtual water will find this book
engaging and interesting. While Allan does not discuss Palestinian water issues, he
would likely assert that their water concerns could be met through virtual water imports
and international aid.
Book Review 2
In Thomas Kostigen’s The Green Blue Book: the Simple Water Savings Guide to
Everything in Your Life, the author strongly encourages his readers to conserve water –
he begins the book claiming that the most important activity people can do to save the
planet is to save water. The author reasons that the world is quickly running out of
readily available freshwater and that recent natural disasters in the world and particularly
the United States are a direct result of our unsustainable water economy. The author
cautions that two thirds of the global population will face severe water shortages by 2025
(ix). The book is one of the first to instruct readers how to consume less water in an
accessible way.
Kostigen begins by listing ways the average American can save water in his/her
home – reducing consumption from 400 gallons of water per day to 100 gallons of water
daily on average (3). For example, he suggests that people should install low flush or

Raphael Astrow
Page 8 of 48
dual flush toilets, like those mandatory in Israel (5). He also recommends washing dishes
with dishwasher machines, rather than washing by hand (8). He notes that in some parts
of the United States, 70 percent of domestic water is used for lawn irrigation and that 50
percent of all water used for landscape irrigation is wasted by evaporation, runoff, or
overwatering (13). All of these are examples of conserving the water that people see.
Next, Kostigen discusses how people can conserve virtual water – the water that
people do not see. He explains that 70 percent of freshwater in the world is consumed in
agriculture (44). Then, he lists calculations of how much virtual water a unit of produce,
meat, sweets, and other foods costs. One apple costs 18.5 gallons of virtual water (45).
One pound of potatoes costs 12.7 gallons of virtual water (53). One pound of beef costs
1,581 gallons of virtual water (54). Then, he lists virtual water costs of clothing,
furniture, and machines. One pair of jeans costs 2,866 gallons of virtual water and one
cotton T-shirt costs 569 gallons of virtual water (69, 71). One leather couch costs over
35,600 gallons of virtual water (76). One bar of soap costs 180.4 gallons of virtual water
(82). One computer costs between 10,566 and 42,267 gallons of virtual water and one
car costs 39,000 gallons of virtual water (87, 92). The book concludes with a number of
water footprint calculator tables where readers can calculate their daily water
consumption (113-124).
This book serves as a guidebook for those concerned about conserving water and
learning about the consequences of overusing water, particularly in the United States.
The book paints a dire picture of the United States’ current water economy and the author
is a water conservation activist. Readers who doubt the severity of America’s water
overuse would likely prefer another book that also offers an optimistic point of view
Raphael Astrow
Page 9 of 48
about water consumption patterns. Overall, this book serves as an excellent reference
guide for virtual water conversion factors and actions that can reduce personal water
consumption.
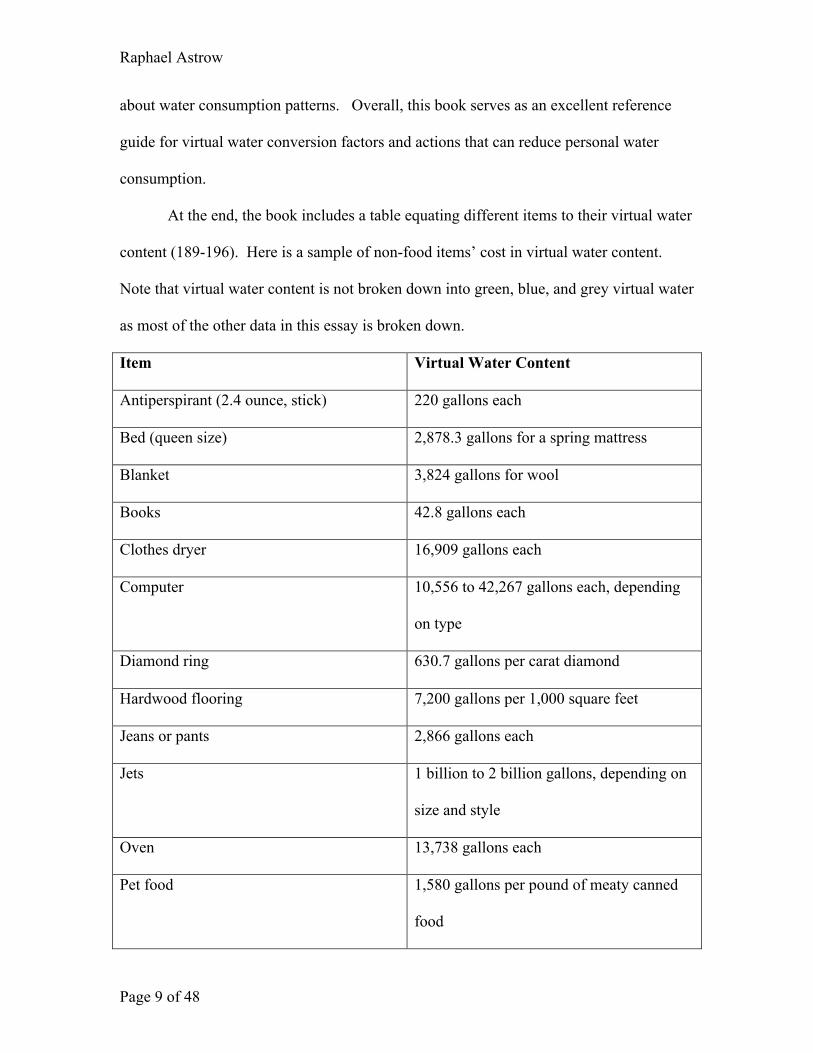
At the end, the book includes a table equating different items to their virtual water
content (189-196). Here is a sample of non-food items’ cost in virtual water content.
Note that virtual water content is not broken down into green, blue, and grey virtual water
as most of the other data in this essay is broken down.
Item Virtual Water Content
Antiperspirant (2.4 ounce, stick) 220 gallons each
Bed (queen size) 2,878.3 gallons for a spring mattress
Blanket 3,824 gallons for wool
Books 42.8 gallons each
Clothes dryer 16,909 gallons each
Computer 10,556 to 42,267 gallons each, depending
on type
Diamond ring 630.7 gallons per carat diamond
Hardwood flooring 7,200 gallons per 1,000 square feet
Jeans or pants 2,866 gallons each
Jets 1 billion to 2 billion gallons, depending on
size and style
Oven 13,738 gallons each
Pet food 1,580 gallons per pound of meaty canned
food

Raphael Astrow
Page 10 of 48
Piping (copper) 6,930 gallons per 280 feet
Refrigerator (standard side-by-side) 25,363.2 gallons each
Running sneakers 1,247 gallons per pair
Shampoo (22 ounces) 17 ounces
T-shirt (cotton) 569 gallons each
Television 3,900 to 65,600 gallons each, depending on
size and type
Figure 4: chart of some non-food items’ virtual water content (Kostigen 189-196)
Book Review 3 – Part 1
In Alon Tal’s and Alfred Abed Rabbo’s Water Wisdom: Preparing the
Groundwork for Cooperative and Sustainable Water Management in the Middle East, the
authors compare essays by Israeli and Palestinian experts in water management to
determine areas of agreement and conflict. The book briefly touches on virtual water,
although its main focus is on the sharing of cross-border aquifers and expanding
wastewater treatment, particularly in Gaza and the West Bank.
The authors’ view on the role of virtual water in Israel is summarized in the
following paragraph.
The relative contribution of agriculture to both economies has generally declined over the years and, in the long run, will continue to do so. In both communities there are those who believe that the overall water scarcity mandates a steady down-sizing in agricultural production. The growing demand of the predominant urban sector is argued to be more important than maintaining production in a water-intensive agricultural sector, notwithstanding the cultural significance and heritage of farming. Expansion of "virtual water" through the increased importation of produce is considered to be inevitable. (224)

Raphael Astrow
Page 11 of 48
In other words, Israel will need to import additional virtual water in the future as
agriculture continues to decline in Israel and Palestine due to its rising costs and water
scarcity. The editors predict that much of what water that Israel and Palestine has will be
reserved for urban life and the general population, not so much for agriculture. As a
result, Israel and Palestine will import more virtual water to offset agriculture’s decline
and the populations’ projected growth. Some of Palestine’s virtual water imports will
come in the form of international aid, sometimes facilitated by the United Nations Relief
and Works Agency (UNRWA). However, the authors stress that both Israelis and
Palestinians will not accept a complete abandonment of agriculture because farming is
ingrained in their cultures.
The authors conclude that the Israeli-Palestinian water conflict can be a subject
for negotiation because Israel is capable of being flexible about water, particularly since
virtual water already reduces Israel’s reliance on agriculture and use of freshwater. They
also claim that future joint management of water resources between Israel and
Palestinians is inevitable (224-226). While virtual water is not a focus of the book, the
authors realize its importance in future water negotiations between Israelis and
Palestinians.
Book Review 3 – Part 2
In the same book, Water Wisdom: Preparing the Groundwork for Cooperative and
Sustainable Water Management in the Middle East, the essay Sustainable Water Supply
for Agriculture in Israel by Alon Ben-Gal provides historical and legislative context to
Israel’s water management strategies. The author begins by describing the kibbutz and

Raphael Astrow
Page 12 of 48
moshav, different types of agricultural communities that many of Israel’s first pioneers
joined. Still today, these communities provide most of the Israel’s fresh produce as well
as processed food products and almost all meat, poultry, and fish. Many of these
communities were established in Israel’s arid south and a popular slogan in Israel has
long been “make the desert bloom” (211).
Ben-Gal writes that as of 2010, The Ministry of Agriculture in Israel still invests
about $70 million a year in agricultural research. Today, the agricultural sector accounts
for about 2.5% of Israel's gross national product and approximately 3% of Israel's
exports. Although water prices have gradually increased and subsidies for agricultural
water have decreased, the agricultural lobby remains very powerful (212).
Ben-Gal provides more data to describe the Israeli agricultural sector’s resilience.
He cites that Israel produces some 70% of its own food requirements and 70% of Israel
agricultural inputs are exported (214). He discusses how Israel has increased agricultural
water efficiency by utilizing brackish and recycled water for crop irrigation (215).
Additionally, he mentions that Israeli greenhouses offer controlled conditions for
lengthening seasons, increasing yields, and saving water (213). Ben-Gal also provides
data about which crops are most frequently grown in Israel.
Fruits account for some $280 million in annual exports, two-thirds of which are citrus. Much of the fruit is harvested out of season for European markets… Approximately 1.7 million tons of fresh vegetables are produced annually, representing 17% of Israel's total agricultural production. Some 110,000 tons of these vegetables, valued at $100 million, are exported each year… Dairy and beef products comprise some 17% of county's total agricultural production. Israel holds the world record for milk production with more than 10,000 kg of 3.3% butterfat milk per cow per year… Grains, oilseeds, meat, fish, sugar, coffee, and cocoa are imported. (213-214)

Raphael Astrow
Page 13 of 48
This data shows that Israel produces a wide range of produce, processed goods,
and meats – some of which feed the country and some help feed other countries –
particularly European countries (213). Considering that agriculture remains heavily
subsidized by taxpayer money, it is likely that some Israelis would prefer that fewer
agricultural goods were exported to other countries.
Ben-Gal’s essay offers an Israeli perspective on water use in agriculture. It is
included in the chapter “Agriculture and Water,” where there is another essay that offers
a Palestinian perspective on water use and Palestinian agricultural needs. Ben-Gal’s
essay was included in this thesis for review because it provides interesting data that helps
describe Israel’s current virtual water trading patterns. A reader interested in Palestinian
water needs and how Israel has fallen short of meeting them might also choose to read the
corresponding Palestinian-perspective essay in the chapter by Said A. Assaf, Sustainable
Water Supply for Agriculture in Palestine (195).
Book Review 4
In Chapter Six: The Agricultural Roots of Israel’s Water Crisis by Hillel Shuval
in the book Between Ruin and Restoration: An Environmental History of Israel by Daniel
Orenstein, Alon Tal, and Char Miller, Shuval claims that Israel’s excessively strong
agricultural sector has overused scarce water resources over the past fifty years (139). He
discusses virtual water imports as a key solution to Israel’s water crisis and argues that
imports should continue to take the place of local agriculture that consumes large
quantities of freshwater (142-143). He also discusses that in part since Israeli farmers re-
use 75% of wastewater, limited agriculture can continue to thrive (132).

Raphael Astrow
Page 14 of 48
He cites Israel’s severe droughts between 2006 and 2009 as a cause for
agricultural cutbacks of up to 40-50% of the annual allocations of freshwater resources in
recent years. In those droughts, rainfall was 15-20% less than average (129). Usually, 90
percent of rainfall falls during the period of September to April, the non-irrigation season
(131). The damage to water resources was perhaps exacerbated by overutilization of
water resources in Israel. Shuval estimates that local freshwater resources can sustain
50% of the agriculture that it did when Israel was first established (138). He also cites
FAO data that has found that globally, each person requires 1,000 to 2,000 cubic meters
of his/her country’s freshwater every year (142). In Israel in 2010, there was less than
200 cubic meters of available freshwater per person– so Israelis can at best meet 10-20%
of their food needs locally (143).
Shuval also discusses the virtual water concept. He writes that almost 100% of
Israel’s wheat, grain, rice, animal feed, edible oils, soybeans, fish, and sugar are imported
from other countries. As a result, 80% of Israel’s caloric intake is imported (142). He
also dissuades Israel’s export of virtual water. For example, he laments how cotton was
grown intensively in the 1980s and 1990s so that it could be exported to other countries -
thereby exporting large amounts of Israel’s freshwater and contributing to permanent
damage to wastewater resources (139). He also suggests a model for Israel’s economy:
more hi-tech, less agriculture.
Painful as it may be, it can be argued that Israel can survive only as a high-tech urban-industrial society and will have to reallocate most of its high-quality drinking water from agriculture to the domestic, urban, tourist, and industrial sectors. (141)

Raphael Astrow
Page 15 of 48
Indeed, Israel has emerged as one of the strongest countries in hi-tech with many
start-ups developing in Tel Aviv and Haifa, where the renowned Technion Institute of
Technology is located. Israel has many other strong sectors that contribute to its robust
economy.
However, Shuval emphasizes that agriculture is strongly ingrained in Israeli
culture and Jewish tradition and this has influenced water policy (134). He quotes two
verses in Deuteronomy, one that extols the availability of water and Israel’s fertile land
and the other that cautions that Israel has relatively few water resources.
For the land which you are going in to take possession of is not like the land of Egypt where you came from, where you sowed your seed and watered your garden easily with your foot like a vegetable garden. But the land which you are going over to, is a land of hills and valleys which drink up the water by the rain of heaven (Deuteronomy 11:8-11). (135)
In this verse, G-d is warning the Jewish people settling in Israel that their new
land has less water than Egypt, where they had previously lived and farmed. G-d thus
implies that Israel should be careful about water resources and pray for strong rainy
seasons. Shuval also describes the Jewish holidays of Sukkot and Rosh Hashanah, where
strong harvests and rainfall is included in a number of prayers. (135)
Shuval’s chapter is included in a book of essays by different authors discussing
Israel’s historical water management. It was selected for review because it includes a
discussion of virtual water that most essays in the book do not. It provides a strong
historical context for Israel’s water consumption in agriculture, however the author rarely
discusses advantages of having stronger agriculture. Readers who are unconvinced that
Israeli agriculture must be limited would likely disagree with many of Shuval’s claims.

Raphael Astrow
Page 16 of 48
Case Studies Using App
Next, Israel’s virtual water trade of a small selection of commodities – apples,
beef, and potatoes – will be examined using data from the app. First, a screenshot of the
app is presented for each virtual water type (green, blue, and grey) and a discussion
follows each screenshot.
Case Study: Apples

Raphael Astrow
Page 17 of 48
Figure 5: apples, green, 2012

Raphael Astrow
Page 18 of 48
Figure 5 shows Israel’s total green virtual water trade in 2012 in apples. The map
in figure 5 shows that Israel imports most of its green virtual water in apples from the
United States (1) and Italy (2). This is indicated by the large orange dots hovering over
those two countries. There are smaller orange dots hovering over France, Germany, and
the United Kingdom because Israel imports less virtual water in apples from those
countries. In comparison, there is a miniscule purple dot hovering over Israel. This
signifies that Israel exported no green virtual water in apples to other countries in 2012.
Recall that green virtual water is water naturally absorbed by the ground and not readily
available for human consumption. This map is demonstrating that Israel imports a lot
more water absorbed by nature in other countries than it exports to other countries.
The calculations behind this data are demonstrated in a table below the map. In that
table, Italy is highlighted. In 2012, Israel imported 7,177 tons of apples from Italy – the
highest quantity of apple imports for any country Israel imported from. That 7,177 tons
figure was taken from United Nations Educational, Scientific and Cultural Organization
(UNESCO) data within an application made by the International Trade Center and is
listed in the leftmost column of the table.
Next, the Water Footprint Network provides conversion factors between tons of
foodstuffs to cubic meters of virtual water based on water type and country. So, the
second column of the table shows the unique conversion factor for apples grown in Italy
from tons of apples to millions of cubic meters of green virtual water. The figure is
0.000167 mcm/ton – mcm means millions of cubic meters – the standard measurement of
large quantities of virtual water. In other words, for every ton of apples, the total green
virtual water costs increase by 0.000167 mcm or 167 cubic meters. Multiplying the first

Raphael Astrow
Page 19 of 48
column (tons – total quantity of apples) by the second column (mcm/ton conversion
factor - millions of cubic meters of green virtual water per ton of apples) equals column 3
– total green virtual water for apple trade in 2012.
The figure in column 3 is thus 1.199 mcm of virtual water because 7,177 *
0.000167 = 1.199. The values in this third column are the values reflected by the dots on
the map above the table. This can be seen because the tooltip hovering over the dot over
Italy shows 1.199 as the figure it is reflecting, the same figure found in the third column
of the table for Italy. It is interesting to note that although Israel’s biggest trading partner
in apples was Italy, the virtual water footprint of Israel’s trade with Italy is second to the
United States. In other words, the United States sent more virtual water in apples to
Israel than Italy did even though Italy sent a higher quantity of apples to Israel. This is
because the conversion factor from tons of apples to millions of cubic meters of virtual
water is different between the United States (0.000192 mcm/ton) and Italy (0.000167
mcm/ton) – Italy produces apples more water efficiently than the United States does.
Virtual water costs differ from country to country because of climatic conditions
and agricultural practices. It is not always easy to understand why, for example, Italy
grows more apples with less water than the United States does – perhaps less water is
naturally evaporated in Italy or perhaps Italy performs more efficient irrigation than the
United States does. The Water Footprint Network’s dataset is remarkable for capturing
the differences between countries and virtual water types. Many virtual water experts
have praised the Water Footprint Network and its leaders Mekonnen and Hoekstra for
being the first to provide extensive quantitative data for international virtual water trade.

Raphael Astrow
Page 20 of 48
The above map shows a small dot over Israel and larger dots over every country
because Israel exported no apples while importing thousands of tons of apples from other
countries. However, this was only the case in 2012. In fact, just one year before – 2011,
Israel exported much more green virtual water in apples than it imported – in fact its
export of apples peaked. This is demonstrated in the time-series chart. This chart shows
the progression of virtual water between 2001 and 2012. Israel’s line is colored blue and
it generally can be seen rising over time. Israel exported the most apples between 2009
and 2011, exported roughly as many apples as it imported between 2005-2007 and
exported very few apples from 2001-2003. Data for 2004 is omitted because the United
Nations’ data was incomplete in 2004. The dramatic dip in 2008 is more significant and
there are many possible factors that contribute to apple trading patterns – one might
speculate that the global recession of 2008 was partially responsible.
Indeed, Israel’s apple export market is very unique and has a back-story: all of
Israel’s apple exports in 2011 went to Syria, the year before it began a long civil war.
Israeli Druze Arabs living in the Golan Heights border region with Syria have been given
free permission to cross the border to Syria to sell the apples they grow at Syrian Druze
markets. This is because these particular Israeli Druze communities used to live within
Syrian borders before the 1974 Yom-Kippur war, which resulted in Israel’s annexation of
a large portion of the Golan Heights. At that point, the Druze living in the annexed
region were given the option to acquire an Israeli citizenship. However, most of the
Druze people declined – feeling more attached to Syria than Israel. Ever since, the Israeli
Druze along the border have continued to be connected to the Druze living on the Syrian
side of the border. Therefore, they chose to sell their apples in Syria and Israel made a
Raphael Astrow
Page 21 of 48
special exception to allow them to freely cross the Syrian border. However, this pattern
stopped in 2012 when Syria engaged in a violent civil war. In 2012, Israeli Druze
stopped bringing their apples across the border for sale in Syria. As a result, Israel’s
export of apples was zero in 2012. However, the Israeli Druze restarted selling apples in
Syria in 2013. (Atkins).
It is also interesting to note that while the United States’ apple trade with Israel has
steadily increased since 2001, Italy’s took a significant jump between 2011 and 2012 – in
the past, Italy exported less apples to Israel than it did in 2012. However, it is important
to note that apples are not a particularly significant component of Israel’s virtual water
trade economy. Commodities such as beef are far more significant, as will be
demonstrated.
The last aspect of figure 5 to point out is that there are 70 liters of virtual water
embedded in one apple on average. This figure incorporates all blue, green, and grey
water needed to produce one conventionally grown apple. This is a relatively small
figure – one hamburger costs 2,400 liters of virtual water on average. This is because in
general, meat costs much more virtual water than produce does. The average non-
vegetarian diet in developed countries such as Israel consumes about 5 cubic meters of
water each day. 5 cubic meters of water is equivalent to 15 bathtubs of water consumed
every day. In comparison, vegetarians consume eight bathtubs of virtual water per day
(Allan 3-4). Indeed, virtual water costs are a big reason for people to eat more sensibly
and for better vegetarian options to be served at popular restaurants that mostly serve
cheap meat whose cost does not assume the virtual water costs of its production (Allan 3-
4).

Raphael Astrow
Page 22 of 48
Figure 6 (below) shows what the app looks like when apples are the commodity, the
virtual water type is blue, and the year is 2011.

Raphael Astrow
Page 23 of 48
Figure 6: apples, blue, 2011

Raphael Astrow
Page 24 of 48
Interestingly, this map looks much different than the previous map, which showed
2012 data for green virtual water. Recall, this map is portraying blue water trade – blue
water is rainfall that is assimilated into drinkable, human accessible water sources such as
aquifers and reservoirs. It is remarkable that for apples, Israel exports far more drinkable
water than it imports – however, Israel’s apple export is isolated to the Golan Heights.
Most of the country likely consumed apples grown in other countries such as the United
States and Italy that year.
It is also interesting to compare the conversion factors in column 2 of the table
between figure 5 (green water conversions) and figure 6 (blue water conversions). For
the United States the conversion factors are 0.000192 green mcm/ton apples (192 cubic
meters/ton) and 0.000211 blue mcm/ton apples (211 cubic meters/ton) – relatively small
differences between the factors. However, for Italy the conversion factors are 0.000167
green mcm/ton (167 cubic meters/ton) apples and 0.000046 blue mcm/ton (46 cubic
meters/ton) apples – much more significant differences between the blue and green
conversion factors.
This means that most of Italy’s apples are naturally supplied more water than
artificially provided water with human irrigation. The United States irrigates its apples
far more than Italy does. Of course, a water economist would therefore suggest that
countries purchase more apples from Italy than the United States whenever possible.
Countries might prefer American apples if they are cheaper than Italian apples and there
is a greater supply of American apples.
For completeness sake, figure 7 (below) is a screenshot of grey virtual water
imports of apples in Israel in 2003. It depicts a time when Israel traded far fewer apples

Raphael Astrow
Page 25 of 48
than it did in 2012. It is important to note that the conversion factors are constant across
the eleven depicted years. The conversion factors were aggregated for 2000. As such, the
app is primarily intended for educational purposes about virtual water; however, some
users may find the data and methodology sufficient for non-academic purposes.

Raphael Astrow
Page 26 of 48
Figure 7: apples, grey, 2003

Raphael Astrow
Page 27 of 48
In figure 7 there is much smaller virtual water totals because in general, much less
grey water is expended when producing food commodities. Recall, grey water is the
amount of freshwater needed to offset the pollutants used in producing foodstuffs. In the
case of apples, grey water is the freshwater likely used to offset chemical fertilizers and
its potentially damaging impact on local ecosystems, arable land, and fresh water sources.
The differences in conversion factors between countries such as the United States
(0.00061 grey mcm/ton apples) versus Israel (0.00039 grey mcm/ton apples) may be due
to differences in agricultural practices. For example, American farmers may use higher
concentrations of chemical fertilizers in their production of apples than Israeli farmers do.
Indeed, sustainable agriculture has been discussed in many settings in the United
States: politics, movies, university courses, and much more. Some believe that American
agricultural practices could be much more environmentally sustainable. Large
agribusinesses such as Monsanto Company have come under fire for harming eco-
diversity with strong chemical fertilizers that significantly increase production of one
crop – such as corn - but may hamper the growth of neighboring crops. Organic farming
has been suggested as one improvement towards achieving sustainable agriculture.
Alternative, small-scale farming has also been viewed by some as part of the solution to
sustainable farming needs in the United States. The data presented by the app does seem
to indicate that American farming is less ecologically efficient that farming is in many
other countries, including Israel. As one virtual water expert, Tony Allan, wrote –
Southern California farming is in particular need of reform because it is very water
inefficient as it is an arid region in a country and state with greater natural sources of

Raphael Astrow
Page 28 of 48
water elsewhere (Allan 109). Figure 8 (below) is a screenshot of Israel’s bovine meat
(beef) imports in 2012.
Case Study: Bovine Meat

Raphael Astrow
Page 29 of 48
Figure 8: bovine meat (beef), green, 2012

Raphael Astrow
Page 30 of 48
In figure 8, there are large dots over Southern American countries Paraguay (largest
dot) and Brazil (2nd largest dot) and a tiny dot over Israel. The chart lists virtual water
totals that are much greater than those apples – because beef has much higher virtual
water costs than apples. In other words, the conversion factors between tons of beef and
total virtual water are much greater for beef than for produce. This is because animals
raised for meat must be fed very well and their slaughter and processing is very water
intensive.
It is interesting that most of Israel’s beef imports are from water-rich South
American countries. For example, the Brazilian Amazon River, the biggest freshwater
source in the world contributes to Brazil’s excesses of water. In fact, green water
(ground water) is in particular excess in Brazil as the soil contains high water
concentrations (Allan 204-206). Perhaps in part due to Brazil’s excesses of blue and
green water, it was Israel’s biggest trade partner in beef between 2005-2011, as the above
time-series shows. The green line that peaks at 600 mcm in 2008 belongs to Brazil.
Brazil’s trade of beef with Israel has steadily declined since then. Again, 2004 data is
omitted because incomplete data was collected for that year. It is also interesting to
observe that even though Argentina exported nearly double the amount of beef that Brazil
did in 2012, its total virtual water export for beef that year is nearly half of Brazil’s. Of
course, this is because Brazil’s conversion factor from beef to virtual water is nearly
quadruple the conversion factor for Argentina. Recall that the conversion factors are
constant across all the years. Therefore, Brazil’s conversion factor is the highest of all
the countries listed between 2001-2012 and as a result, it is shown to have much higher
virtual water trade during the course of the time-series chart.

Raphael Astrow
Page 31 of 48
It is also interesting to note that although Israel did not produce any meat for export,
if Israel did export meat – it would be at a much greater cost than any of the South
American countries it imports meat from. Israel’s conversion factor between beef and
virtual water is 0.023472 mcm/ton, which is greater than each of the South American
countries’ conversion factors listed.
As mentioned above, Brazil’s virtual water trade with Israel peaked in 2008. Figure
9 (below) is a screenshot of blue virtual water trade in 2008. The Amazon River is one of
the largest blue water sources in the world, and surprisingly it remains substantially
untapped. In the future, it may become a more important source of water that helps
sustain water economies around the world.

Raphael Astrow
Page 32 of 48
Figure 9: bovine meat (beef), blue, 2008
Raphael Astrow
Page 33 of 48
In figure 9, the conversion factors for blue water are once again much lower than
the conversion factors for green water. As shown before in this essay, grey water
conversion factors are lower than blue and green water conversion factors. So, the
conversion factors can be seen in relation to each other as green > blue > grey.
Skipping to the time-series graph, notice that it looks much different that the time-
series graph for green virtual water trade of beef. One reason for this is that the
conversion factors are reduced and as a result, the spread of data is more limited.
Additionally, Brazil’s conversion factors between beef and blue virtual water is no longer
the greatest of the countries sampled – it is second lowest in front of Uruguay.
Finally, notice that there are 15,500 liters of virtual water per kilogram of beef.
This is much more than the 70 liters of virtual water per one apple. Producing one pound
of beef also includes all of the animal feed that cattle consumed to become meatier and
the water costs of producing the animal feed. Animal feed usually consists of corn and
soybeans, and can also consist of wheat, oats, barley, and rice. The virtual water costs of
beef also include preparing land for pasture for cattle to graze on. Pasture mostly consists
of grasses and can also include legumes and grains such as sorghum. Virtual water costs
may also consist of barn construction to house the cattle and any other resources required
to own cattle. These virtual water costs add up to make meat the biggest source of virtual
water consumption in the world. As a result, vegetarianism is recommended to limit
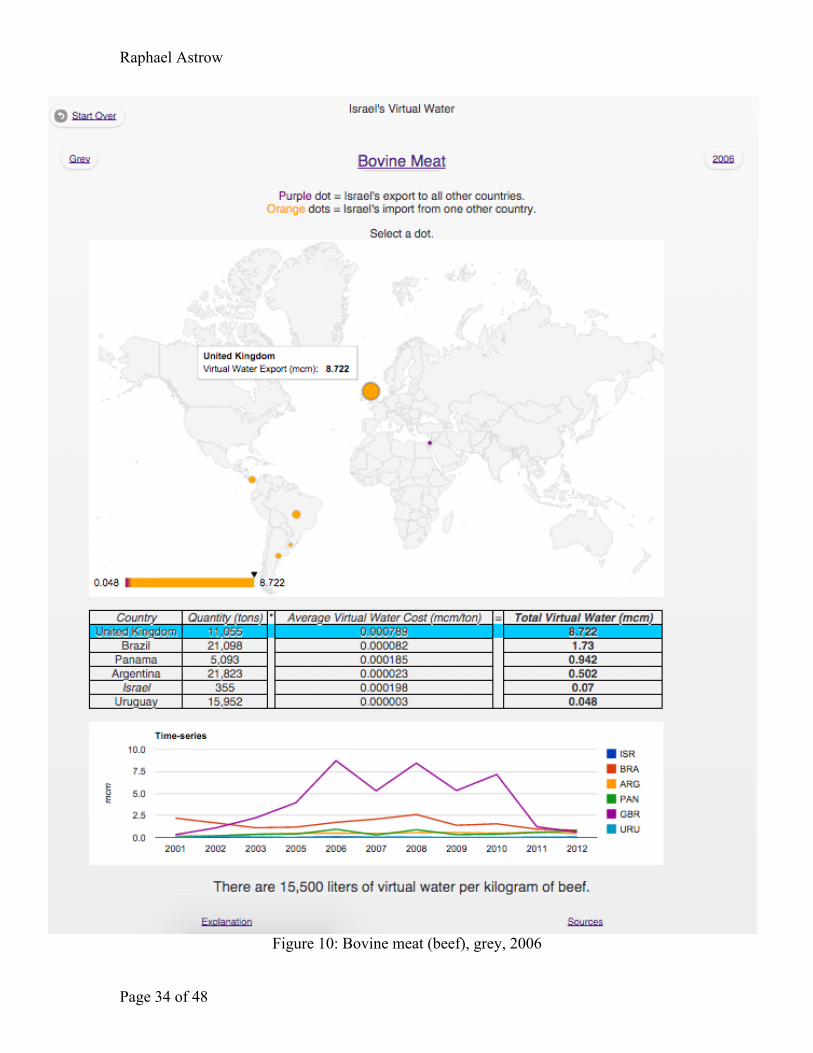
daily virtual water needs. For completeness sake, figure 10 is a view of grey virtual
water trade of beef in 2006, when the United Kingdom achieved a dramatic increase in
beef exports to Israel.
Raphael Astrow
Page 34 of 48
Figure 10: Bovine meat (beef), grey, 2006

Raphael Astrow
Page 35 of 48
In figure 10, a large orange dot appears over the United Kingdom signifying a great
quantity of grey virtual water exports in beef to Israel in 2006. This dot may be
confusing because the UK is not particularly well known for beef exports. In fact, the
United Kingdom did not export the most beef in 2006, they exported just 11,055 tons of
it, half of what Brazil and Argentina exported. However, their conversion factor
(0.000789 mcm/ton) between tons of beef and grey virtual water is the highest of those
countries sampled by nearly four-fold. This means that the UK’s water treatment and
reuse system is water expensive compared to other countries. In other words, a lot of
treated water needs to be consumed in order to support beef production in the United
Kingdom. This could be a good sign that the UK uses a lot of recycled grey water in its
agricultural systems, thereby preserving freshwater consumption.
On the other hand, it is interesting to notice that Uruguay’s conversion factor
between tons of beef and grey virtual water is miniscule (0.000003 mcm/ton) compared
to the other countries sampled. Even though Uruguay traded more beef to Israel is 2006
than the United Kingdom did, its total grey virtual water costs are the lowest of the
countries sampled. This means that very little treated wastewater is consumed when
producing a ton of beef in Uruguay. This potentially means that Uruguay does not use
much treated wastewater in its agriculture and livestock development. Instead, it uses
more blue and green water to sustain its beef production.
Next is an analysis of Israel’s virtual water trade of potatoes.
Case Study: Potatoes

Raphael Astrow
Page 36 of 48
Figure 11: potatoes, green, 2012

Raphael Astrow
Page 37 of 48
In figure 11, notice that for the second time in this essay, the largest dot is the
purple dot over Israel. This indicates that Israel exports far more virtual water in potatoes
than it imports. Additionally, notice that there are only two substantial trading partners
from which Israel imports potatoes – two European countries, the Netherlands and
Belgium. For most other commodities, Israel imports from all over the world and the
app’s algorithm selects the top 5 trading partners. The only commodities sampled that
Israel exported a substantial quantity of were grapes, apples, groundnuts, and potatoes.
Of those four commodities, Israel by far exported the most virtual water in potatoes –
peaking at 20.37 mcm of green virtual water in 2007. Israel exported more virtual water
in grapes than in groundnuts.
Figure 11 shows that the conversion factor between potatoes and green virtual
water is small (0.000045 mcm/ton) or 45 cubic meters/ton. Additionally, this conversion
factor is the lowest of the countries sampled – so growing potatoes is more green water
efficient in Israel than it is in other countries. As a result, Israel is able to produce about
13 times as many potatoes as the Netherlands at a virtual water cost that is only 7 times
greater than the Netherlands’ virtual water cost.
Finally, the time-series chart shows that Israel’s potato export consistently increased
through 2007. Starting in 2008, Israel’s potato export has steadily decreased – perhaps in
part because of the lengthy drought Israel experienced from 2006 – 2009. Also notice
that one kilogram of potatoes costs 287 liters of virtual water – a relatively small amount.
Perhaps this low amount is part of the reason why Israeli farmers chose to export more
potatoes than any of the other commodities sampled.

Raphael Astrow
Page 38 of 48
Figure 12: potatoes, blue, 2007

Raphael Astrow
Page 39 of 48
In figure 12, the peak of Israel’s trade of potatoes is shown as Israel exported the
most potatoes in 2007 (452,776 tons). Additionally, since Israel’s blue water conversion
factor for potatoes is very high (1000 cubic meters per ton), Israel’s total export of blue
virtual water is 45.278 mcm – much higher than any of the countries Israel imported
potatoes from that year. As a result, the dot over Israel is very large while the dots over
all the other countries are very small – a sight seldom seen in the app. Additionally, in
the time series graph where total virtual water data for all six of the countries sampled is
shown, in every year Israel’s line is visible while all the other countries’ line are hovering
so close to 0 that they are barely visible. This is mostly because Israel consumes much
more blue virtual water when producing potatoes than most other countries. This is a
cause for concern because Israel can little afford to consume freshwater to produce
potatoes for export. Instead, Israel should be importing virtual water from other countries
in exchange for goods that require little water for production, such as hi-tech. As
mentioned earlier, Israel’s farmers may have had to cut back on potato farming as water
prices rose during Israel’s recent three-year drought.

Raphael Astrow
Page 40 of 48
Figure 13: Potatoes, grey, 2001

Raphael Astrow
Page 41 of 48
Figure 13 shows Israel’s export of grey virtual water through potatoes in 2001. In
this figure, the dot over Israel is not quite as large because Israel’s conversion factor for
grey virtual water of potatoes is much smaller than the conversion factor for blue virtual
water of potatoes. While Israel still has the largest conversion factor among the countries
sampled for grey virtual water, the factor is much closer to other countries’ than the blue
water factor is. Still, Israel exported far more grey virtual water than it imported between
2001 and 2012, as the time-series chart shows.
Figure 13 also demonstrates the magnifying glass feature of the map: a magnifying
glass appears in Asia and points to the dots over Israel and Jordan because those two dots
overlap. To select either of the dots, users select the dots within the magnifying glass.
The dot over Jordan is rarely seen in the app because even though Israel and Jordan are
trading partners, they are seldom within the top 5 of Israel’s trading partners. One
example where Jordan is a leading trade partner with Israel is olives in 2012 – Israel
imported olives only from Jordan that year.
Overall based on the app, it is difficult to understand why Israel chose to export
more potatoes than most other commodities sampled. According to the conversion
factors, particularly for blue virtual water, Israel expends much more water producing
potatoes than other countries. Additionally, Israel’s conversion factors for potatoes –
particularly the blue virtual water factor - are higher than the factors for other
commodities that Israel could export more of. Perhaps Israeli farmers will reconsider
their potato production if water prices become too high.
Data challenges
A number of other commodities were excluded from the app because the Water

Raphael Astrow
Page 42 of 48
Footprint Network’s (WFN) data used different categories for groups of products than the
International Trade Center (ITC) did. In particular, the ITC data did not include the ideal
categories for different meats and as a result, many types of meat were excluded from the
app. Other commodities where the category in the ITC data did not exactly match the
WFN data were included in the app – although there are potential issues with the
calculations. These commodities include wheat, millet, sugar beet, sweeteners/other,
rape and mustardseed, Rape and Mustard Oil, Palmkernel Oil, Grapes (mostly dried),
Coffee (Values and Quantities differ), Pepper (Not specific), Beer (Cubic Meters in
2012), Bovine Meat (Frozen), Fats, Animals, Raw (Used Bovine, sheep, and goat fats),
Cream (Used Milk and cream, concentrated or sweetened), and Offals + Total (Used
edible offal of red meat). Other commodities that had more minor issues between the
data sources were Rice (Milled Equivalent) - should be Rice, Butter/Ghee - should be
Butter, Groundnuts (Shelled Eq) - should be Groundnuts. Additionally, the ITC had not
published 2012 data for a number of commodities: tobacco, rubber, eggs, tea, and sugar
cane.
An additional two commodities – beer and wine – were demonstrated in a
previous version of the app. They were removed because the ITC data used different
metrics every few years and different metrics for certain countries – potentially adding
layers of complexity to the app’s calculations. Additionally, the app does not include
transportation costs of commodities to and from Israel – these costs should generally be
included in virtual water trade calculations.
46 other commodities with major issues between the data sources were excluded.
Among these 46 excluded commodities were yams, beans, cottonseed, tomatoes, and

Raphael Astrow
Page 43 of 48
oranges. It is unfortunate that oranges and tomatoes had to be excluded. According to
Wikipedia, at one point Israeli farmers reduced their oranges export because oranges
have high virtual water content and their export meant that too much Israeli water was
being consumed elsewhere.
Another major challenge with the app is of third party intermediaries. This is a
challenge that perhaps has no good solution – and the app does not offer a solution. An
example of this issue is shown in figure 14 below.
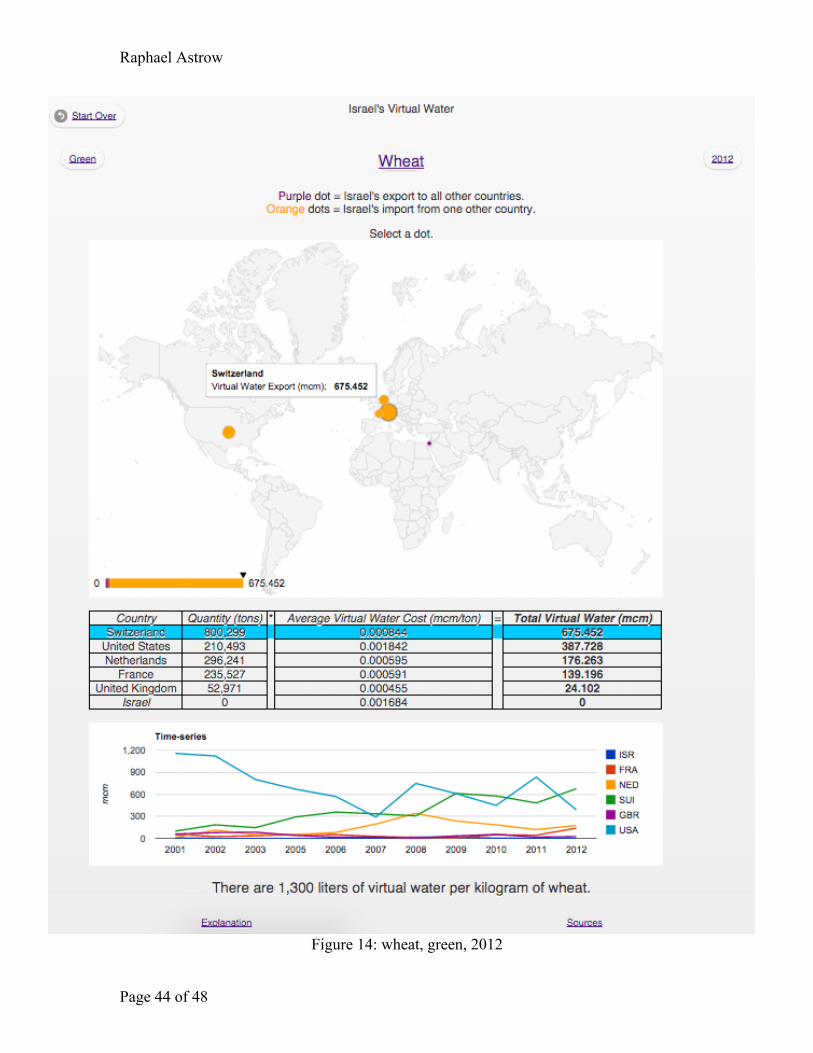
Raphael Astrow
Page 44 of 48
Figure 14: wheat, green, 2012

Raphael Astrow
Page 45 of 48
Figure 14 demonstrates this odd phenomenon where Switzerland is credited as
being Israel’s greatest trading partner in wheat in 2012. In truth, Switzerland is not a
large enough country to produce that much wheat for export – it is likely that there is a
third party intermediary based in Switzerland to facilitate Israel’s import of wheat.
Indeed, Shintraco Ltd., an Israeli company, partnered with one company based in
Geneva, Switzerland – Proalim SA – and claimed $1 billion revenue in 2012 through
importing commodities to Israel. According to an Israeli business analysis website, “The
company imports to Israel various grains and seeds including wheat, beans, corn and
animal feed as well as sugar and pulses” (Globes and Dun & Bradstreet Israel Group). It
is possible that all of Shintraco’s imports to Israel are being credited to Switzerland in the
United Nations data used by the app. In reality, these imports are likely being traded
from all over the world. The chart at the bottom of the figure shows the United States’
export of wheat decreasing at roughly the same rate as Switzerland’s increase in wheat
export. This might signify that much of the wheat trade credited to Switzerland is truly
wheat produced in the United States.
Finally, as aforementioned, the app mixes data from different years – all the
conversion factors are applicable to 2000 while the trading totals are from 2001-2012.
Given this challenge, the app should primarily be used for educational purposes.
Instructions for using the app
1. During the period of time that the author has deployed the app, navigate to
http://israelvirtualwater.jit.su to begin.
2. Click on the button to begin.
3. Select a commodity from the 40 options. To use the default commodity,

Raphael Astrow
Page 46 of 48
select ‘skip’ at the top right corner of the screen.
4. On the main screen, there are a number of customization options.
a. The current virtual water color that data is being displayed for can be
seen in a small oval button at the top left corner of the screen. The
button will either contain the text ‘Green’, ‘Blue’, ‘Grey’, or ‘All’.
‘All’ means that data being displayed is aggregated for all three virtual
water colors green, blue, and grey.
i. To change the virtual water color, select this small oval button
at the top left corner of the screen.
b. The current year that data is being displayed for can be seen in a small
oval button at the top right corner of the screen. This button will
contain text reading any year between 2001-2012. Complete data for
years after 2012 are not yet available.
i. To change the year, select this small oval button at the top right
corner of the screen.
c. The current commodity that data is being displayed for is found in a
large oval button at the top center of the screen. This button will
contain text indicating which of the 40 commodities data is currently
being displayed for.
i. To change the commodity, select this larger oval button at the
top center of the screen.
5. To begin analyzing data, select or hover over any of the dots in the large map
in the center of the screen. On mobile devices, users must select a dot to view

Raphael Astrow
Page 47 of 48
a tooltip containing the data. Once a dot is selected, its corresponding
country’s data will become highlighted in a table below towards the bottom of
the screen. This table is explained in the ‘case study: apples’ section above.
Glossary
The Water Footprint Network, a leader in virtual water data and education,
defines the following key terms (Hoekstra et al.).
Virtual-water content – The virtual-water content of a product is the freshwater
‘embodied’ in the product, not in real sense, but in virtual sense. It refers to the volume of
water consumed or polluted for producing the product, measured over its full production
chain. If a nation exports/imports such a product, it exports/imports water in virtual form.
The ‘virtual-water content of a product’ is the same as ‘the water footprint of a product’,
but the former refers to the water volume embodied in the product alone, while the latter
term refers to that volume, but also to which sort of water is being used and to when and
where that water is being used. The water footprint of a product is thus a
multidimensional indicator, whereas virtual-water content refers to a volume alone.
Virtual-water export – The virtual-water export from a geographically
delineated area (for example, a nation or catchment area) is the volume of virtual water
associated with the export of goods or services from the area. It is the total volume of
freshwater consumed or polluted to produce the products for export.
Virtual-water import – The virtual-water import into a geographically
delineated area (for example, a nation or catchment area) is the volume of virtual water
associated with the import of goods or services into the area. It is the total volume of
freshwater used (in the export areas) to produce the products. Viewed from the

Raphael Astrow
Page 48 of 48
perspective of the importing area, this water can be seen as an additional source of water
that comes on top of the available water resources within the area itself.
Green water footprint – Volume of rainwater consumed during the production
process. This is particularly relevant for agricultural and forestry products (products
based on crops or wood), where it refers to the total rainwater evapotranspiration (from
fields and plantations) plus the water incorporated into the harvested crop or wood.
Blue water footprint – Volume of surface and groundwater consumed as a result
of the production of a good or service. Consumption refers to the volume of freshwater
used and then evaporated or incorporated into a product. It also includes water abstracted
from surface or groundwater in a catchment and returned to another catchment or the sea.
It is the amount of water abstracted from groundwater or surface water that does not
return to the catchment from which it was withdrawn.
Grey water footprint – The grey water footprint of a product is an indicator of
freshwater pollution that can be associated with the production of a product over its full
supply chain. It is defined as the volume of freshwater that is required to assimilate the
load of pollutants based on natural background concentrations and existing ambient water
quality standards. It is calculated as the volume of water that is required to dilute
pollutants to such an extent that the quality of the water remains above agreed water
quality standards.

Raphael Astrow
Works Cited
Allan, Tony. Virtual Water: Tackling the Threat to Our Planet's Most Precious Resource.
London: I.B. Tauris, 2011. Print.
Atkins, Jacob. "Apples from Israel, Another of the Syrian Civil War’s Victims." Times of Israel
14 Sept. 2014: n. pag. Times of Israel. Web. 30 Nov. 2014.
<http://www.timesofisrael.com/apples-from-israel-another-of-the-syrian-civil-wars-
victims/>.
"Bilateral Trade." Table. Trade Map: Trade Statistics for International Business Development.
International Trade Centre, n.d. Web. 21 Oct. 2013. <http://www.trademap.org>.
"Footprint for Nations." Global Footprint Network: Advancing the Science of Sustainability.
N.p., n.d. Web. 21 Oct. 2013.
<http://www.footprintnetwork.org/en/index.php/GFN/page/footprint_for_nations/>.
Globes and Dun & Bradstreet Israel Group. "Shintraco." Globes Dun's 100. N.p., n.d. Web. 30
Nov. 2014. <http://duns100.globes.co.il/en/companies-1000871184>.
Hoekstra, A.Y., et al. "Water Footprint: Glossary." Water Footprint Network. N.p., 2011. Web.
30 Nov. 2014. <http://www.waterfootprint.org/?page=files/Glossary>.
Kostigen, Thomas M. The Green Blue Book: The Simple Water-savings Guide to Everything in
Your Life. New York: Rodale, 2010. Print.
"List of Countries by Population Density." Wikipedia. N.p., 20 Nov. 2014. Web. 30 Nov. 2014.
<http://simple.wikipedia.org/wiki/List_of_countries_by_population_density#cite_note-
13>.

Raphael Astrow
Mekonnen, M.M. "National Water Footprints: Your Country." Water Footprint Network. Ed.
A.Y. Hoekstra. Water Footprint Network, May 2011. Web. 30 Nov. 2014.
<http://www.waterfootprint.org/?page=cal/waterfootprintcalculator_national>.
Mekonnen, M.M., and A.Y. Hoekstra. National Water Footprint Accounts: The Green, Blue, and
Grey Water Footprint of Production and Consumption. Pub. no. 2. Delft: UNESCO-IHE,
2011. Value of Water Research Report Series 50. Water Footprint Network. Web. 25
Mar. 2014. <http://www.waterfootprint.org/Reports/Report50-NationalWaterFootprints-
Vol2.pdf>.
Orenstein, Daniel E., Alon Tal, and Char Miller, eds. Between Ruin and Restoration: An
Environmental History of Israel. Pittsburgh: U of Pittsburgh P, 2013. Print.
Tal, Alon, and Alfred Abed Rabbo, eds. Water Wisdom: Preparing the Groundwork for
Cooperative and Sustainable Water Management in the Middle East. New Brunswick:
Rutgers UP, 2010. Print.
UO Teacher Knowledge Journal. "Where in the World Is UOTeach?" 18 July 2012. PNG file.