Ranking Table 2 Advertising Spending · Ranking Table 2 Advertising Spending ... 1 Coca-Cola...
22
Sugary Drink FACTS 147 Ranking Table 2 Advertising Spending Ranking by total advertising spending in 2010* Includes total spending in all measured media for sugary drinks and energy drinks in 2010** Total ad spending Ad spending by medium (2010) Spanish- 2008 2010 % language Rank Company Brand Category ($000) ($000) change TV Magazine Radio Outdoor TV 1 Coca-Cola Coca-Cola Classic Regular soda 131,529 183,029 39% 107,478 2,030 11,929 23,151 22,664 2 Innovation Ventures 5-hour Energy Energy drink 51,545 107,010 108% 105,268 836 906 0 7,327 3 PepsiCo Gatorade Sports drink 106,250 92,617 -13% 61,558 18,809 2,921 45 440 4 Dr Pepper Snapple Group Dr Pepper Regular soda 43,409 58,987 36% 49,361 1,943 4,755 2,868 752 5 PepsiCo Pepsi Regular soda 64,440 54,158 -16% 41,258 2,302 2,224 2,013 0 6 Dr Pepper Snapple Group 7 Up Regular soda 24,612 39,901 62% 26,165 0 2,551 2,551 6,691 7 Ocean Spray Ocean Spray Fruit drink 30,293 32,651 8% 28,652 3,496 9 0 0 8 Coca-Cola Vitamin Water Flavored water 53,812 31,477 -42% 27,090 1,096 210 732 0 9 Red Bull Red Bull Energy drink 41,719 25,974 -38% 20,034 0 5 4,055 3,063 10 PepsiCo Gatorade G2 Sports drink 46,614 24,298 -48% 15,863 7,735 29 0 0 11 Sunny Delight Beverages Sunny D Fruit drink 23,983 22,906 -4% 17,498 5,273 29 0 3,929 12 PepsiCo Sierra Mist Regular soda 17,785 22,370 26% 16,865 3,589 1,318 343 0 13 PepsiCo Mountain Dew Regular soda 21,132 19,696 -7% 16,295 0 1,216 7 0 14 Coca-Cola Sprite Regular soda 22,852 19,612 -14% 12,983 0 1,233 662 0 15 Coca-Cola Minute Maid Fruit drink 9,296 18,467 99% 18,467 0 0 0 0 16 Unilever Lipton Iced tea 13,690 16,668 22% 15,897 0 0 9 0 17 Coca-Cola Powerade Sports drink 7,921 14,956 89% 12,673 1,776 140 25 6,030 18 PepsiCo Amp Energy drink 18,882 13,608 -28% 12,517 0 696 14 0 19 Kraft Foods Kool-Aid Fruit drink 11,564 12,883 11% 12,630 0 15 0 2,327 20 Kraft Foods Kool-Aid Fun Fizz Fruit drink 0 11,388 - 4,927 5,242 0 0 569 21 Dr Pepper Snapple Group Canada Dry Regular soda 1,542 11,341 636% 10,442 0 310 589 0 22 PepsiCo Trop50 Fruit drink 0 11,176 - 10,077 723 0 0 0 23 Kraft Foods Capri Sun Fruit drink 16,179 10,107 -38% 9,635 0 6 0 0 24 Dr Pepper Snapple Group Sunkist Regular soda 1,825 7,432 307% 7,289 0 0 0 0 25 PepsiCo SoBe Flavored water 26,715 7,358 -72% 2,558 1,270 12 0 0 26 Coca-Cola Fanta Regular soda 14 6,334 - 4,788 0 0 0 3,571 27 Welch Foods Inc. Welch’s Essentials Fruit drink 0 5,185 - 5,083 0 0 0 0 28 Dr Pepper Snapple Group Snapple Iced tea 4,778 4,393 -8% 4,203 122 0 0 0 29 Coca-Cola Simply Lemonade Fruit drink 2,036 2,715 33% 2,186 528 0 0 0 30 Coca-Cola Fuze Fruit drink 11,797 2,380 -80% 0 2,247 10 52 0 31 Coca-Cola NOS Energy drink 79 1,828 2217% 1,532 219 0 77 0 32 Coca-Cola Gold Peak Iced tea 4,146 1,160 -72% 0 287 722 99 0 Most Least
Transcript of Ranking Table 2 Advertising Spending · Ranking Table 2 Advertising Spending ... 1 Coca-Cola...

Sugary Drink FACTS 147
Ranking Table 2
Advertising SpendingRanking by total advertising spending in 2010* Includes total spending in all measured media for sugary drinks and energy drinks in 2010**
Total ad spending Ad spending by medium (2010)
Spanish- 2008 2010 % language Rank Company Brand Category ($000) ($000) change TV Magazine Radio Outdoor TV
1 Coca-Cola Coca-Cola Classic Regular soda 131,529 183,029 39% 107,478 2,030 11,929 23,151 22,664
2 Innovation Ventures 5-hour Energy Energy drink 51,545 107,010 108% 105,268 836 906 0 7,327
3 PepsiCo Gatorade Sports drink 106,250 92,617 -13% 61,558 18,809 2,921 45 440
4 Dr Pepper Snapple Group Dr Pepper Regular soda 43,409 58,987 36% 49,361 1,943 4,755 2,868 752
5 PepsiCo Pepsi Regular soda 64,440 54,158 -16% 41,258 2,302 2,224 2,013 0
6 Dr Pepper Snapple Group 7 Up Regular soda 24,612 39,901 62% 26,165 0 2,551 2,551 6,691
7 Ocean Spray Ocean Spray Fruit drink 30,293 32,651 8% 28,652 3,496 9 0 0
8 Coca-Cola Vitamin Water Flavored water 53,812 31,477 -42% 27,090 1,096 210 732 0
9 Red Bull Red Bull Energy drink 41,719 25,974 -38% 20,034 0 5 4,055 3,063
10 PepsiCo Gatorade G2 Sports drink 46,614 24,298 -48% 15,863 7,735 29 0 0
11 Sunny Delight Beverages Sunny D Fruit drink 23,983 22,906 -4% 17,498 5,273 29 0 3,929
12 PepsiCo Sierra Mist Regular soda 17,785 22,370 26% 16,865 3,589 1,318 343 0
13 PepsiCo Mountain Dew Regular soda 21,132 19,696 -7% 16,295 0 1,216 7 0
14 Coca-Cola Sprite Regular soda 22,852 19,612 -14% 12,983 0 1,233 662 0
15 Coca-Cola Minute Maid Fruit drink 9,296 18,467 99% 18,467 0 0 0 0
16 Unilever Lipton Iced tea 13,690 16,668 22% 15,897 0 0 9 0
17 Coca-Cola Powerade Sports drink 7,921 14,956 89% 12,673 1,776 140 25 6,030
18 PepsiCo Amp Energy drink 18,882 13,608 -28% 12,517 0 696 14 0
19 Kraft Foods Kool-Aid Fruit drink 11,564 12,883 11% 12,630 0 15 0 2,327
20 Kraft Foods Kool-Aid Fun Fizz Fruit drink 0 11,388 - 4,927 5,242 0 0 569
21 Dr Pepper Snapple Group Canada Dry Regular soda 1,542 11,341 636% 10,442 0 310 589 0
22 PepsiCo Trop50 Fruit drink 0 11,176 - 10,077 723 0 0 0
23 Kraft Foods Capri Sun Fruit drink 16,179 10,107 -38% 9,635 0 6 0 0
24 Dr Pepper Snapple Group Sunkist Regular soda 1,825 7,432 307% 7,289 0 0 0 0
25 PepsiCo SoBe Flavored water 26,715 7,358 -72% 2,558 1,270 12 0 0
26 Coca-Cola Fanta Regular soda 14 6,334 - 4,788 0 0 0 3,571
27 Welch Foods Inc. Welch’s Essentials Fruit drink 0 5,185 - 5,083 0 0 0 0
28 Dr Pepper Snapple Group Snapple Iced tea 4,778 4,393 -8% 4,203 122 0 0 0
29 Coca-Cola Simply Lemonade Fruit drink 2,036 2,715 33% 2,186 528 0 0 0
30 Coca-Cola Fuze Fruit drink 11,797 2,380 -80% 0 2,247 10 52 0
31 Coca-Cola NOS Energy drink 79 1,828 2217% 1,532 219 0 77 0
32 Coca-Cola Gold Peak Iced tea 4,146 1,160 -72% 0 287 722 99 0
Most
Least
Sugary Drink FACTS 148
Ranking Table 2
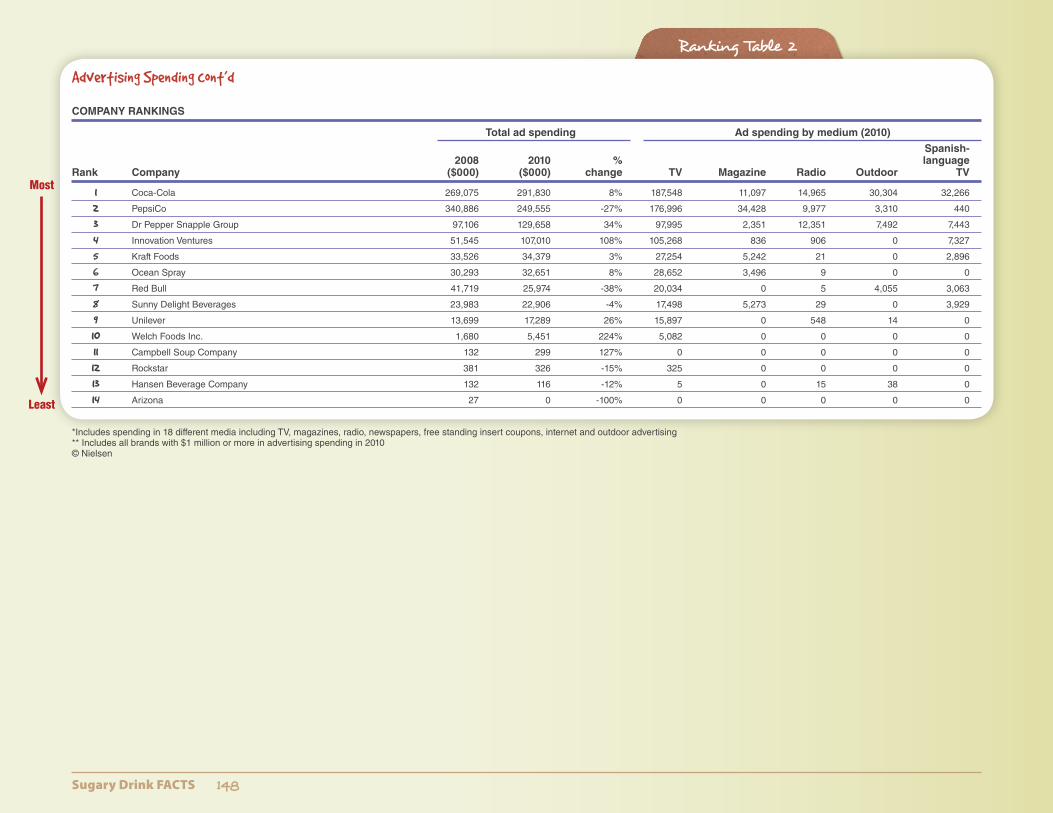
Advertising Spending cont’d
COMPANY RANKINGS
Total ad spending Ad spending by medium (2010)
Spanish- 2008 2010 % language Rank Company ($000) ($000) change TV Magazine Radio Outdoor TV
1 Coca-Cola 269,075 291,830 8% 187,548 11,097 14,965 30,304 32,266
2 PepsiCo 340,886 249,555 -27% 176,996 34,428 9,977 3,310 440
3 Dr Pepper Snapple Group 97,106 129,658 34% 97,995 2,351 12,351 7,492 7,443
4 Innovation Ventures 51,545 107,010 108% 105,268 836 906 0 7,327
5 Kraft Foods 33,526 34,379 3% 27,254 5,242 21 0 2,896
6 Ocean Spray 30,293 32,651 8% 28,652 3,496 9 0 0
7 Red Bull 41,719 25,974 -38% 20,034 0 5 4,055 3,063
8 Sunny Delight Beverages 23,983 22,906 -4% 17,498 5,273 29 0 3,929
9 Unilever 13,699 17,289 26% 15,897 0 548 14 0
10 Welch Foods Inc. 1,680 5,451 224% 5,082 0 0 0 0
11 Campbell Soup Company 132 299 127% 0 0 0 0 0
12 Rockstar 381 326 -15% 325 0 0 0 0
13 Hansen Beverage Company 132 116 -12% 5 0 15 38 0
14 Arizona 27 0 -100% 0 0 0 0 0
*Includes spending in 18 different media including TV, magazines, radio, newspapers, free standing insert coupons, internet and outdoor advertising** Includes all brands with $1 million or more in advertising spending in 2010© Nielsen
Least
Most
Sugary Drink FACTS 149
Ranking Table 3
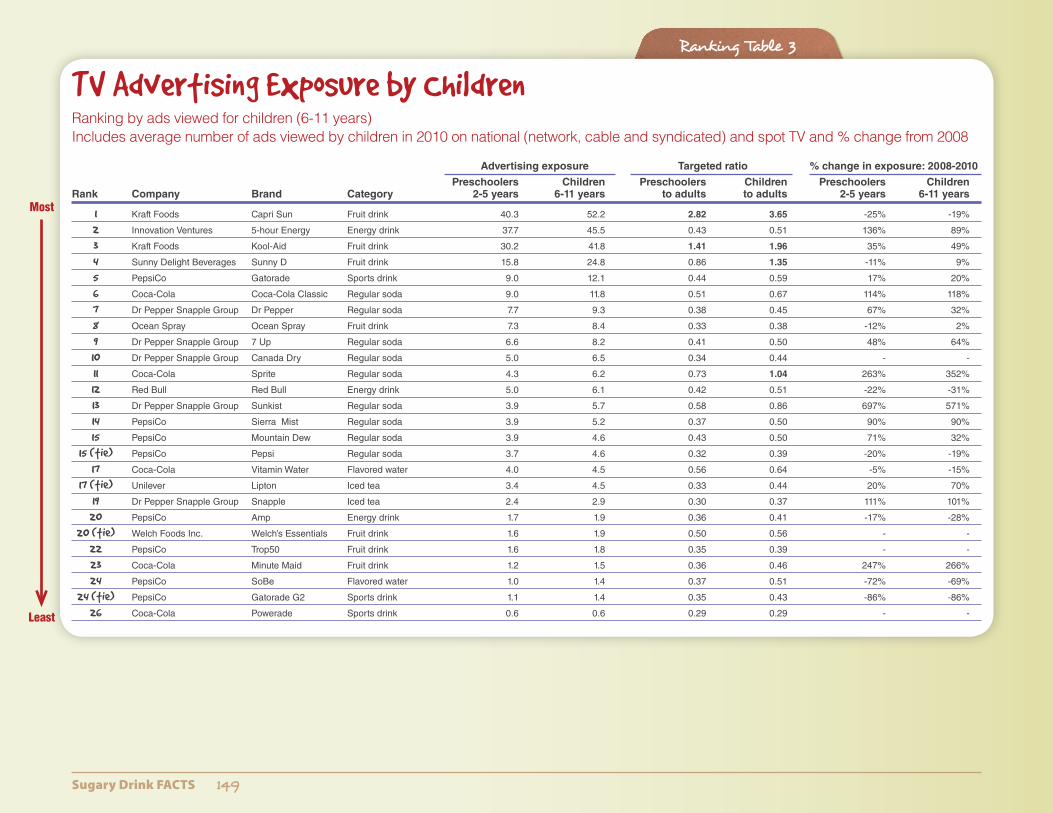
TV Advertising Exposure by ChildrenRanking by ads viewed for children (6-11 years) Includes average number of ads viewed by children in 2010 on national (network, cable and syndicated) and spot TV and % change from 2008
Advertising exposure Targeted ratio % change in exposure: 2008-2010
Preschoolers Children Preschoolers Children Preschoolers Children Rank Company Brand Category 2-5 years 6-11 years to adults to adults 2-5 years 6-11 years
1 Kraft Foods Capri Sun Fruit drink 40.3 52.2 2.82 3.65 -25% -19%
2 Innovation Ventures 5-hour Energy Energy drink 37.7 45.5 0.43 0.51 136% 89%
3 Kraft Foods Kool-Aid Fruit drink 30.2 41.8 1.41 1.96 35% 49%
4 Sunny Delight Beverages Sunny D Fruit drink 15.8 24.8 0.86 1.35 -11% 9%
5 PepsiCo Gatorade Sports drink 9.0 12.1 0.44 0.59 17% 20%
6 Coca-Cola Coca-Cola Classic Regular soda 9.0 11.8 0.51 0.67 114% 118%
7 Dr Pepper Snapple Group Dr Pepper Regular soda 7.7 9.3 0.38 0.45 67% 32%
8 Ocean Spray Ocean Spray Fruit drink 7.3 8.4 0.33 0.38 -12% 2%
9 Dr Pepper Snapple Group 7 Up Regular soda 6.6 8.2 0.41 0.50 48% 64%
10 Dr Pepper Snapple Group Canada Dry Regular soda 5.0 6.5 0.34 0.44 - -
11 Coca-Cola Sprite Regular soda 4.3 6.2 0.73 1.04 263% 352%
12 Red Bull Red Bull Energy drink 5.0 6.1 0.42 0.51 -22% -31%
13 Dr Pepper Snapple Group Sunkist Regular soda 3.9 5.7 0.58 0.86 697% 571%
14 PepsiCo Sierra Mist Regular soda 3.9 5.2 0.37 0.50 90% 90%
15 PepsiCo Mountain Dew Regular soda 3.9 4.6 0.43 0.50 71% 32%
15 (tie) PepsiCo Pepsi Regular soda 3.7 4.6 0.32 0.39 -20% -19%
17 Coca-Cola Vitamin Water Flavored water 4.0 4.5 0.56 0.64 -5% -15%
17 (tie) Unilever Lipton Iced tea 3.4 4.5 0.33 0.44 20% 70%
19 Dr Pepper Snapple Group Snapple Iced tea 2.4 2.9 0.30 0.37 111% 101%
20 PepsiCo Amp Energy drink 1.7 1.9 0.36 0.41 -17% -28%
20 (tie) Welch Foods Inc. Welch’s Essentials Fruit drink 1.6 1.9 0.50 0.56 - -
22 PepsiCo Trop50 Fruit drink 1.6 1.8 0.35 0.39 - -
23 Coca-Cola Minute Maid Fruit drink 1.2 1.5 0.36 0.46 247% 266%
24 PepsiCo SoBe Flavored water 1.0 1.4 0.37 0.51 -72% -69%
24 (tie) PepsiCo Gatorade G2 Sports drink 1.1 1.4 0.35 0.43 -86% -86%
26 Coca-Cola Powerade Sports drink 0.6 0.6 0.29 0.29 - -
Most
Least
Sugary Drink FACTS 150
Ranking Table 3
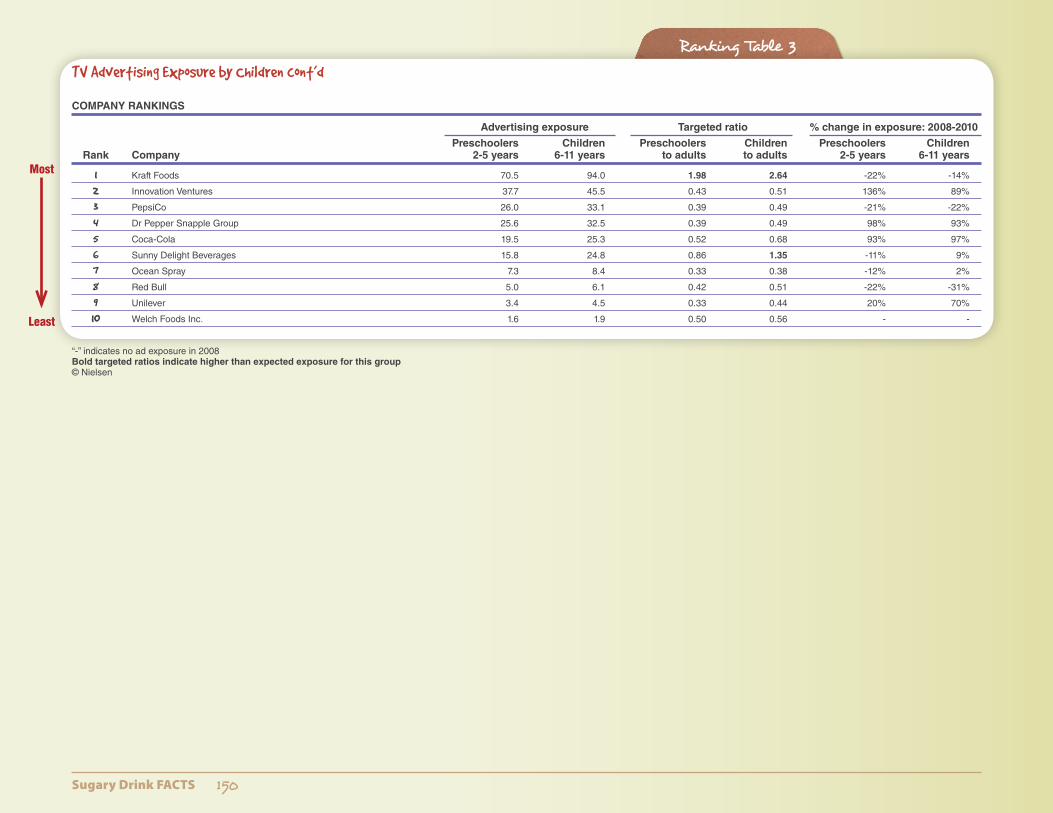
TV Advertising Exposure by Children cont’d
COMPANY RANKINGS
Advertising exposure Targeted ratio % change in exposure: 2008-2010
Preschoolers Children Preschoolers Children Preschoolers Children Rank Company 2-5 years 6-11 years to adults to adults 2-5 years 6-11 years
1 Kraft Foods 70.5 94.0 1.98 2.64 -22% -14%
2 Innovation Ventures 37.7 45.5 0.43 0.51 136% 89%
3 PepsiCo 26.0 33.1 0.39 0.49 -21% -22%
4 Dr Pepper Snapple Group 25.6 32.5 0.39 0.49 98% 93%
5 Coca-Cola 19.5 25.3 0.52 0.68 93% 97%
6 Sunny Delight Beverages 15.8 24.8 0.86 1.35 -11% 9%
7 Ocean Spray 7.3 8.4 0.33 0.38 -12% 2%
8 Red Bull 5.0 6.1 0.42 0.51 -22% -31%
9 Unilever 3.4 4.5 0.33 0.44 20% 70%
10 Welch Foods Inc. 1.6 1.9 0.50 0.56 - -
“-” indicates no ad exposure in 2008 Bold targeted ratios indicate higher than expected exposure for this group © Nielsen
Most
Least
Sugary Drink FACTS 151
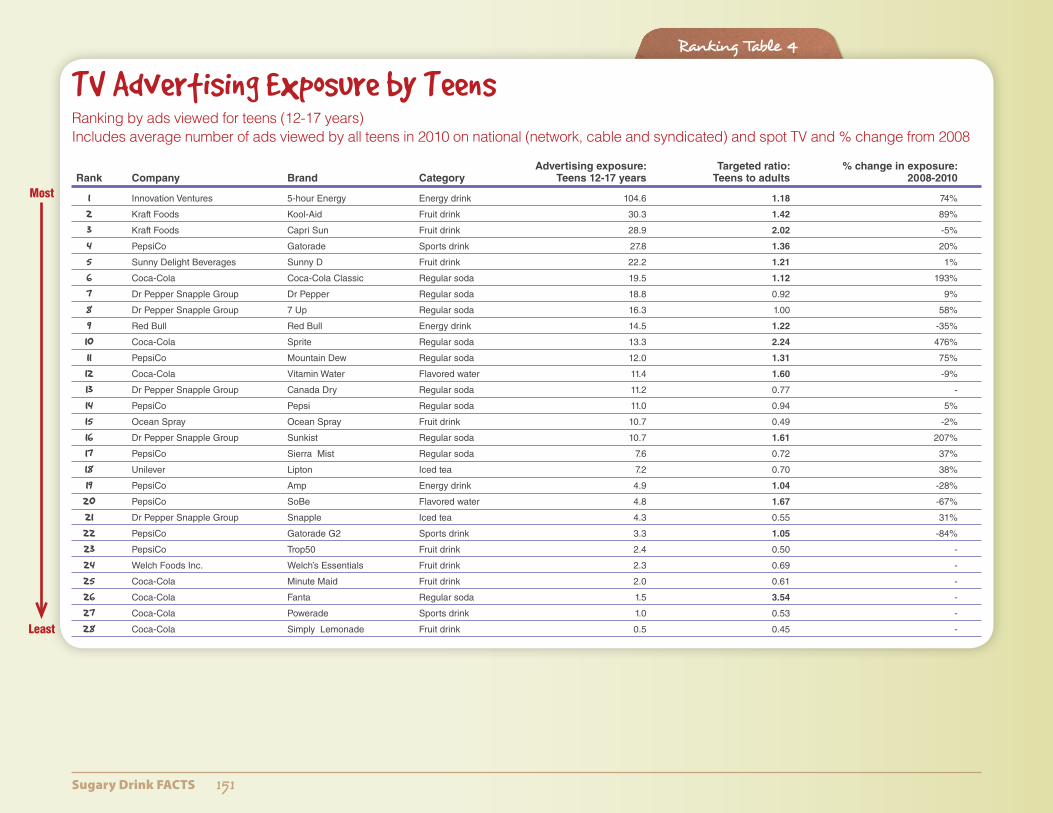
Ranking Table 4
TV Advertising Exposure by TeensRanking by ads viewed for teens (12-17 years) Includes average number of ads viewed by all teens in 2010 on national (network, cable and syndicated) and spot TV and % change from 2008
Advertising exposure: Targeted ratio: % change in exposure: Rank Company Brand Category Teens 12-17 years Teens to adults 2008-2010
1 Innovation Ventures 5-hour Energy Energy drink 104.6 1.18 74%
2 Kraft Foods Kool-Aid Fruit drink 30.3 1.42 89%
3 Kraft Foods Capri Sun Fruit drink 28.9 2.02 -5%
4 PepsiCo Gatorade Sports drink 27.8 1.36 20%
5 Sunny Delight Beverages Sunny D Fruit drink 22.2 1.21 1%
6 Coca-Cola Coca-Cola Classic Regular soda 19.5 1.12 193%
7 Dr Pepper Snapple Group Dr Pepper Regular soda 18.8 0.92 9%
8 Dr Pepper Snapple Group 7 Up Regular soda 16.3 1.00 58%
9 Red Bull Red Bull Energy drink 14.5 1.22 -35%
10 Coca-Cola Sprite Regular soda 13.3 2.24 476%
11 PepsiCo Mountain Dew Regular soda 12.0 1.31 75%
12 Coca-Cola Vitamin Water Flavored water 11.4 1.60 -9%
13 Dr Pepper Snapple Group Canada Dry Regular soda 11.2 0.77 -
14 PepsiCo Pepsi Regular soda 11.0 0.94 5%
15 Ocean Spray Ocean Spray Fruit drink 10.7 0.49 -2%
16 Dr Pepper Snapple Group Sunkist Regular soda 10.7 1.61 207%
17 PepsiCo Sierra Mist Regular soda 7.6 0.72 37%
18 Unilever Lipton Iced tea 7.2 0.70 38%
19 PepsiCo Amp Energy drink 4.9 1.04 -28%
20 PepsiCo SoBe Flavored water 4.8 1.67 -67%
21 Dr Pepper Snapple Group Snapple Iced tea 4.3 0.55 31%
22 PepsiCo Gatorade G2 Sports drink 3.3 1.05 -84%
23 PepsiCo Trop50 Fruit drink 2.4 0.50 -
24 Welch Foods Inc. Welch’s Essentials Fruit drink 2.3 0.69 -
25 Coca-Cola Minute Maid Fruit drink 2.0 0.61 -
26 Coca-Cola Fanta Regular soda 1.5 3.54 -
27 Coca-Cola Powerade Sports drink 1.0 0.53 -
28 Coca-Cola Simply Lemonade Fruit drink 0.5 0.45 -
Most
Least
Sugary Drink FACTS 152
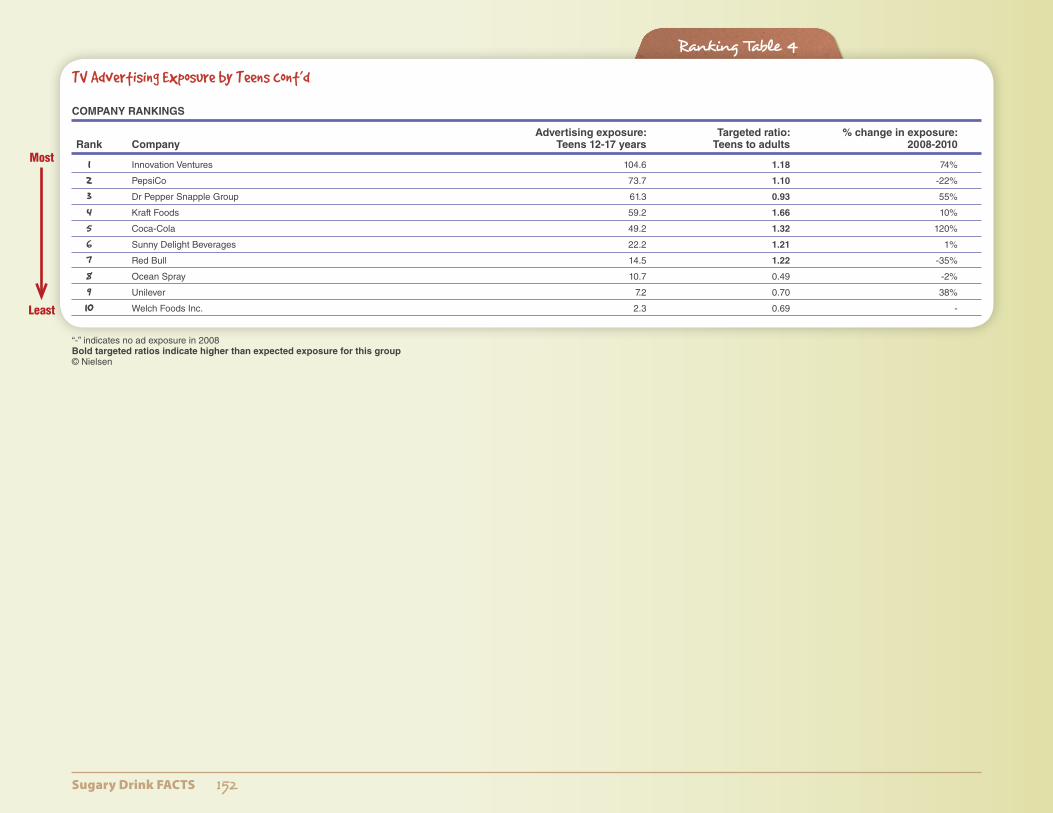
Ranking Table 4
TV Advertising Exposure by Teens cont’d
COMPANY RANKINGS
Advertising exposure: Targeted ratio: % change in exposure: Rank Company Teens 12-17 years Teens to adults 2008-2010
1 Innovation Ventures 104.6 1.18 74%
2 PepsiCo 73.7 1.10 -22%
3 Dr Pepper Snapple Group 61.3 0.93 55%
4 Kraft Foods 59.2 1.66 10%
5 Coca-Cola 49.2 1.32 120%
6 Sunny Delight Beverages 22.2 1.21 1%
7 Red Bull 14.5 1.22 -35%
8 Ocean Spray 10.7 0.49 -2%
9 Unilever 7.2 0.70 38%
10 Welch Foods Inc. 2.3 0.69 -
“-” indicates no ad exposure in 2008Bold targeted ratios indicate higher than expected exposure for this group© Nielsen
Most
Least
Sugary Drink FACTS 153
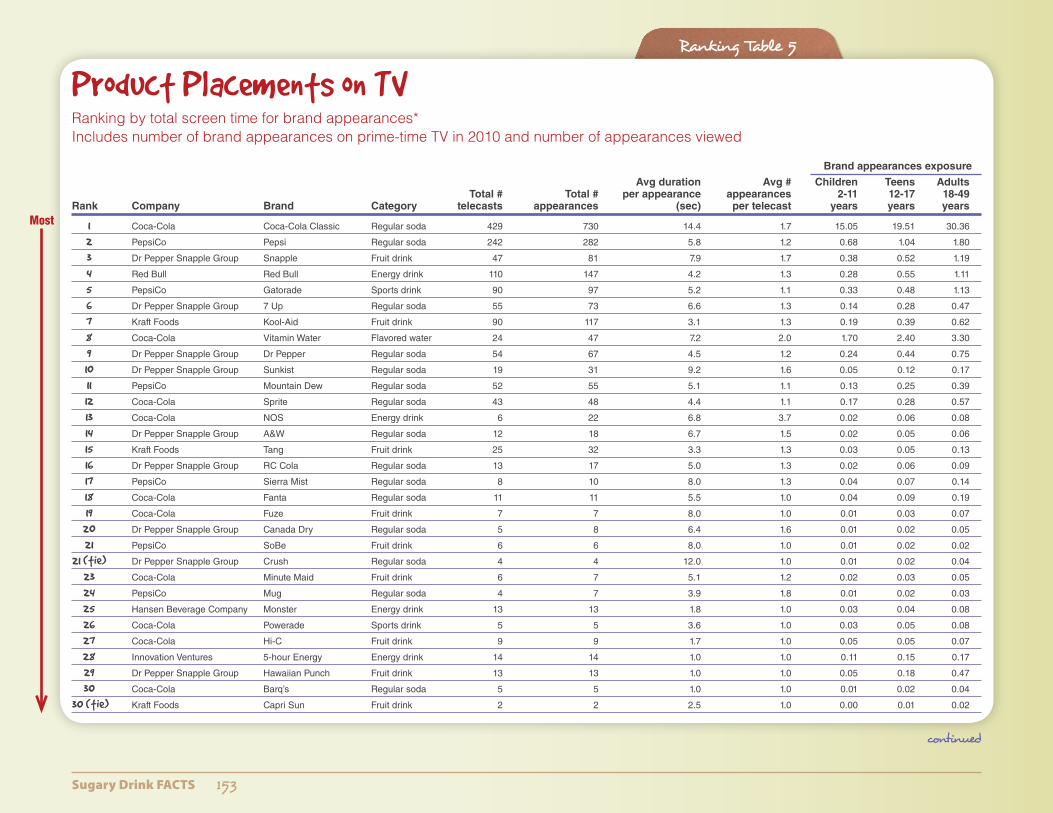
Ranking Table 5
Product Placements on TVRanking by total screen time for brand appearances* Includes number of brand appearances on prime-time TV in 2010 and number of appearances viewed
Brand appearances exposure
Avg duration Avg # Children Teens Adults Total # Total # per appearance appearances 2-11 12-17 18-49 Rank Company Brand Category telecasts appearances (sec) per telecast years years years
1 Coca-Cola Coca-Cola Classic Regular soda 429 730 14.4 1.7 15.05 19.51 30.36
2 PepsiCo Pepsi Regular soda 242 282 5.8 1.2 0.68 1.04 1.80
3 Dr Pepper Snapple Group Snapple Fruit drink 47 81 7.9 1.7 0.38 0.52 1.19
4 Red Bull Red Bull Energy drink 110 147 4.2 1.3 0.28 0.55 1.11
5 PepsiCo Gatorade Sports drink 90 97 5.2 1.1 0.33 0.48 1.13
6 Dr Pepper Snapple Group 7 Up Regular soda 55 73 6.6 1.3 0.14 0.28 0.47
7 Kraft Foods Kool-Aid Fruit drink 90 117 3.1 1.3 0.19 0.39 0.62
8 Coca-Cola Vitamin Water Flavored water 24 47 7.2 2.0 1.70 2.40 3.30
9 Dr Pepper Snapple Group Dr Pepper Regular soda 54 67 4.5 1.2 0.24 0.44 0.75
10 Dr Pepper Snapple Group Sunkist Regular soda 19 31 9.2 1.6 0.05 0.12 0.17
11 PepsiCo Mountain Dew Regular soda 52 55 5.1 1.1 0.13 0.25 0.39
12 Coca-Cola Sprite Regular soda 43 48 4.4 1.1 0.17 0.28 0.57
13 Coca-Cola NOS Energy drink 6 22 6.8 3.7 0.02 0.06 0.08
14 Dr Pepper Snapple Group A&W Regular soda 12 18 6.7 1.5 0.02 0.05 0.06
15 Kraft Foods Tang Fruit drink 25 32 3.3 1.3 0.03 0.05 0.13
16 Dr Pepper Snapple Group RC Cola Regular soda 13 17 5.0 1.3 0.02 0.06 0.09
17 PepsiCo Sierra Mist Regular soda 8 10 8.0 1.3 0.04 0.07 0.14
18 Coca-Cola Fanta Regular soda 11 11 5.5 1.0 0.04 0.09 0.19
19 Coca-Cola Fuze Fruit drink 7 7 8.0 1.0 0.01 0.03 0.07
20 Dr Pepper Snapple Group Canada Dry Regular soda 5 8 6.4 1.6 0.01 0.02 0.05
21 PepsiCo SoBe Fruit drink 6 6 8.0 1.0 0.01 0.02 0.02
21 (tie) Dr Pepper Snapple Group Crush Regular soda 4 4 12.0 1.0 0.01 0.02 0.04
23 Coca-Cola Minute Maid Fruit drink 6 7 5.1 1.2 0.02 0.03 0.05
24 PepsiCo Mug Regular soda 4 7 3.9 1.8 0.01 0.02 0.03
25 Hansen Beverage Company Monster Energy drink 13 13 1.8 1.0 0.03 0.04 0.08
26 Coca-Cola Powerade Sports drink 5 5 3.6 1.0 0.03 0.05 0.08
27 Coca-Cola Hi-C Fruit drink 9 9 1.7 1.0 0.05 0.05 0.07
28 Innovation Ventures 5-hour Energy Energy drink 14 14 1.0 1.0 0.11 0.15 0.17
29 Dr Pepper Snapple Group Hawaiian Punch Fruit drink 13 13 1.0 1.0 0.05 0.18 0.47
30 Coca-Cola Barq’s Regular soda 5 5 1.0 1.0 0.01 0.02 0.04
30 (tie) Kraft Foods Capri Sun Fruit drink 2 2 2.5 1.0 0.00 0.01 0.02
Most
continued
Sugary Drink FACTS 154
Ranking Table 5
Least
Least
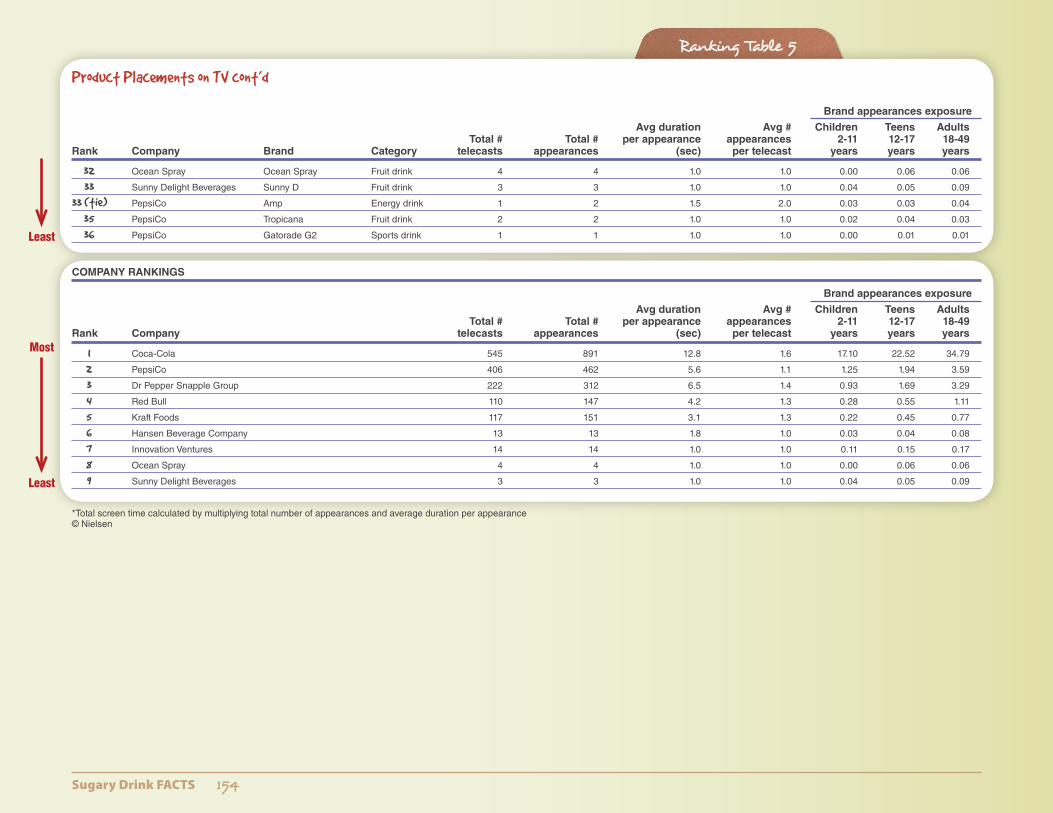
Product Placements on TV cont’d
Brand appearances exposure
Avg duration Avg # Children Teens Adults Total # Total # per appearance appearances 2-11 12-17 18-49 Rank Company Brand Category telecasts appearances (sec) per telecast years years years
32 Ocean Spray Ocean Spray Fruit drink 4 4 1.0 1.0 0.00 0.06 0.06
33 Sunny Delight Beverages Sunny D Fruit drink 3 3 1.0 1.0 0.04 0.05 0.09
33 (tie) PepsiCo Amp Energy drink 1 2 1.5 2.0 0.03 0.03 0.04
35 PepsiCo Tropicana Fruit drink 2 2 1.0 1.0 0.02 0.04 0.03
36 PepsiCo Gatorade G2 Sports drink 1 1 1.0 1.0 0.00 0.01 0.01
COMPANY RANKINGS
Brand appearances exposure
Avg duration Avg # Children Teens Adults Total # Total # per appearance appearances 2-11 12-17 18-49 Rank Company telecasts appearances (sec) per telecast years years years
1 Coca-Cola 545 891 12.8 1.6 17.10 22.52 34.79
2 PepsiCo 406 462 5.6 1.1 1.25 1.94 3.59
3 Dr Pepper Snapple Group 222 312 6.5 1.4 0.93 1.69 3.29
4 Red Bull 110 147 4.2 1.3 0.28 0.55 1.11
5 Kraft Foods 117 151 3.1 1.3 0.22 0.45 0.77
6 Hansen Beverage Company 13 13 1.8 1.0 0.03 0.04 0.08
7 Innovation Ventures 14 14 1.0 1.0 0.11 0.15 0.17
8 Ocean Spray 4 4 1.0 1.0 0.00 0.06 0.06
9 Sunny Delight Beverages 3 3 1.0 1.0 0.04 0.05 0.09
*Total screen time calculated by multiplying total number of appearances and average duration per appearance© Nielsen
Most
Sugary Drink FACTS 155
Ranking Table 6
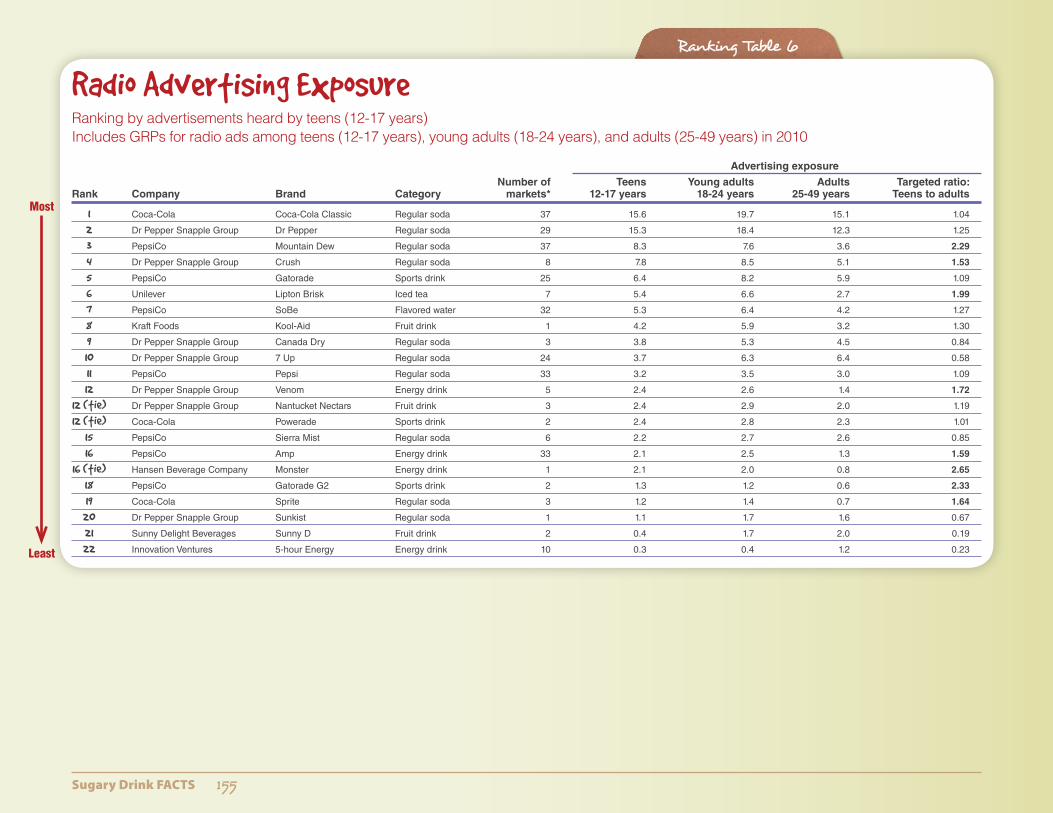
Radio Advertising ExposureRanking by advertisements heard by teens (12-17 years) Includes GRPs for radio ads among teens (12-17 years), young adults (18-24 years), and adults (25-49 years) in 2010
Advertising exposure
Number of Teens Young adults Adults Targeted ratio: Rank Company Brand Category markets* 12-17 years 18-24 years 25-49 years Teens to adults
1 Coca-Cola Coca-Cola Classic Regular soda 37 15.6 19.7 15.1 1.04
2 Dr Pepper Snapple Group Dr Pepper Regular soda 29 15.3 18.4 12.3 1.25
3 PepsiCo Mountain Dew Regular soda 37 8.3 7.6 3.6 2.29
4 Dr Pepper Snapple Group Crush Regular soda 8 7.8 8.5 5.1 1.53
5 PepsiCo Gatorade Sports drink 25 6.4 8.2 5.9 1.09
6 Unilever Lipton Brisk Iced tea 7 5.4 6.6 2.7 1.99
7 PepsiCo SoBe Flavored water 32 5.3 6.4 4.2 1.27
8 Kraft Foods Kool-Aid Fruit drink 1 4.2 5.9 3.2 1.30
9 Dr Pepper Snapple Group Canada Dry Regular soda 3 3.8 5.3 4.5 0.84
10 Dr Pepper Snapple Group 7 Up Regular soda 24 3.7 6.3 6.4 0.58
11 PepsiCo Pepsi Regular soda 33 3.2 3.5 3.0 1.09
12 Dr Pepper Snapple Group Venom Energy drink 5 2.4 2.6 1.4 1.72
12 (tie) Dr Pepper Snapple Group Nantucket Nectars Fruit drink 3 2.4 2.9 2.0 1.19
12 (tie) Coca-Cola Powerade Sports drink 2 2.4 2.8 2.3 1.01
15 PepsiCo Sierra Mist Regular soda 6 2.2 2.7 2.6 0.85
16 PepsiCo Amp Energy drink 33 2.1 2.5 1.3 1.59
16 (tie) Hansen Beverage Company Monster Energy drink 1 2.1 2.0 0.8 2.65
18 PepsiCo Gatorade G2 Sports drink 2 1.3 1.2 0.6 2.33
19 Coca-Cola Sprite Regular soda 3 1.2 1.4 0.7 1.64
20 Dr Pepper Snapple Group Sunkist Regular soda 1 1.1 1.7 1.6 0.67
21 Sunny Delight Beverages Sunny D Fruit drink 2 0.4 1.7 2.0 0.19
22 Innovation Ventures 5-hour Energy Energy drink 10 0.3 0.4 1.2 0.23
Most
Least

Sugary Drink FACTS 156
Ranking Table 6
Radio Advertising Exposure cont’d
COMPANY RANKINGS
Advertising exposure
Number of Teens Young adults Adults Targeted ratio: Rank Company markets* 12-17 years 18-24 years 25-49 years Teens to adults
1 Dr Pepper Snapple Group 29 37.8 48.4 36.0 1.05
2 PepsiCo 37 28.9 32.0 21.2 1.37
3 Coca-Cola 37 26.7 33.6 24.8 1.08
4 Unilever 7 5.4 6.6 2.7 1.99
5 Kraft Foods 1 4.2 5.9 3.2 1.30
6 Hansen Beverage Company 1 2.1 2.0 0.8 2.65
7 Sunny Delight Beverages 2 0.4 1.7 2.0 0.19
8 Innovation Ventures 10 0.3 0.4 1.2 0.23
* Markets with a minimum of 100 GRPs for at least one age group (maximum 39 markets) Bold targeted ratios indicate higher than expected exposure for this group © Nielsen; Arbitron Inc.
Sugary Drink FACTS 157
Ranking Table 7
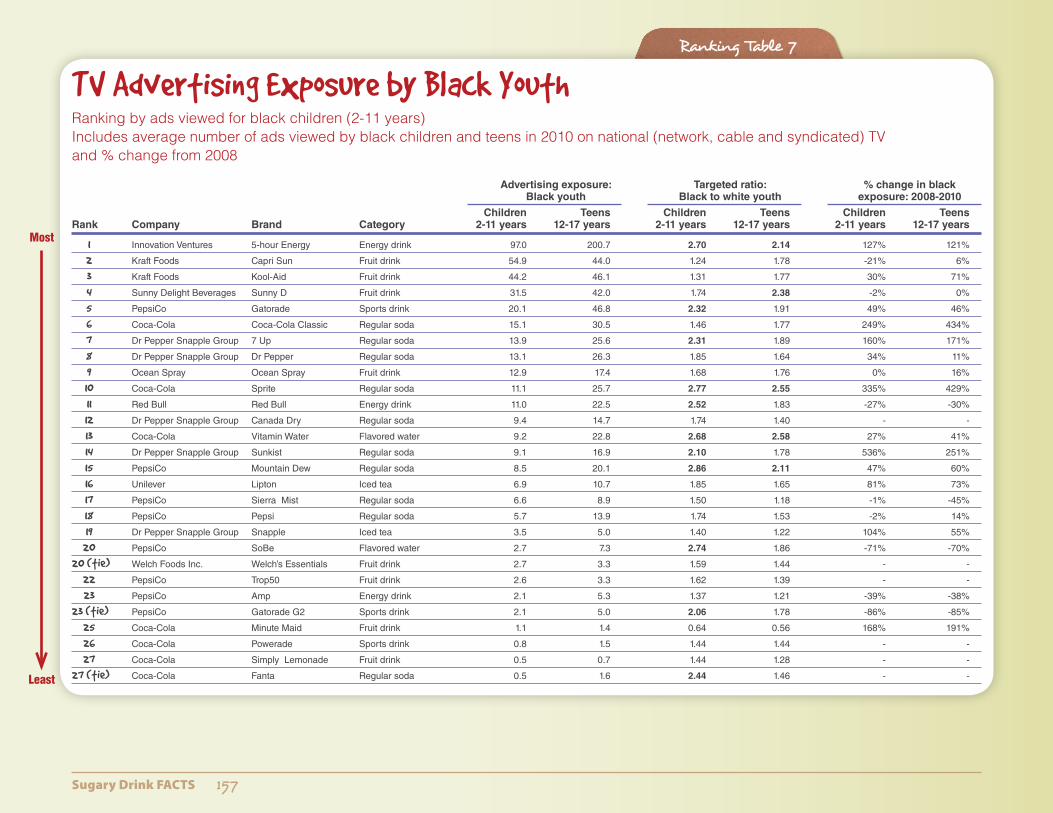
TV Advertising Exposure by Black YouthRanking by ads viewed for black children (2-11 years) Includes average number of ads viewed by black children and teens in 2010 on national (network, cable and syndicated) TV and % change from 2008
Advertising exposure: Targeted ratio: % change in black Black youth Black to white youth exposure: 2008-2010
Children Teens Children Teens Children Teens Rank Company Brand Category 2-11 years 12-17 years 2-11 years 12-17 years 2-11 years 12-17 years
1 Innovation Ventures 5-hour Energy Energy drink 97.0 200.7 2.70 2.14 127% 121%
2 Kraft Foods Capri Sun Fruit drink 54.9 44.0 1.24 1.78 -21% 6%
3 Kraft Foods Kool-Aid Fruit drink 44.2 46.1 1.31 1.77 30% 71%
4 Sunny Delight Beverages Sunny D Fruit drink 31.5 42.0 1.74 2.38 -2% 0%
5 PepsiCo Gatorade Sports drink 20.1 46.8 2.32 1.91 49% 46%
6 Coca-Cola Coca-Cola Classic Regular soda 15.1 30.5 1.46 1.77 249% 434%
7 Dr Pepper Snapple Group 7 Up Regular soda 13.9 25.6 2.31 1.89 160% 171%
8 Dr Pepper Snapple Group Dr Pepper Regular soda 13.1 26.3 1.85 1.64 34% 11%
9 Ocean Spray Ocean Spray Fruit drink 12.9 17.4 1.68 1.76 0% 16%
10 Coca-Cola Sprite Regular soda 11.1 25.7 2.77 2.55 335% 429%
11 Red Bull Red Bull Energy drink 11.0 22.5 2.52 1.83 -27% -30%
12 Dr Pepper Snapple Group Canada Dry Regular soda 9.4 14.7 1.74 1.40 - -
13 Coca-Cola Vitamin Water Flavored water 9.2 22.8 2.68 2.58 27% 41%
14 Dr Pepper Snapple Group Sunkist Regular soda 9.1 16.9 2.10 1.78 536% 251%
15 PepsiCo Mountain Dew Regular soda 8.5 20.1 2.86 2.11 47% 60%
16 Unilever Lipton Iced tea 6.9 10.7 1.85 1.65 81% 73%
17 PepsiCo Sierra Mist Regular soda 6.6 8.9 1.50 1.18 -1% -45%
18 PepsiCo Pepsi Regular soda 5.7 13.9 1.74 1.53 -2% 14%
19 Dr Pepper Snapple Group Snapple Iced tea 3.5 5.0 1.40 1.22 104% 55%
20 PepsiCo SoBe Flavored water 2.7 7.3 2.74 1.86 -71% -70%
20 (tie) Welch Foods Inc. Welch’s Essentials Fruit drink 2.7 3.3 1.59 1.44 - -
22 PepsiCo Trop50 Fruit drink 2.6 3.3 1.62 1.39 - -
23 PepsiCo Amp Energy drink 2.1 5.3 1.37 1.21 -39% -38%
23 (tie) PepsiCo Gatorade G2 Sports drink 2.1 5.0 2.06 1.78 -86% -85%
25 Coca-Cola Minute Maid Fruit drink 1.1 1.4 0.64 0.56 168% 191%
26 Coca-Cola Powerade Sports drink 0.8 1.5 1.44 1.44 - -
27 Coca-Cola Simply Lemonade Fruit drink 0.5 0.7 1.44 1.28 - -
27 (tie) Coca-Cola Fanta Regular soda 0.5 1.6 2.44 1.46 - -
Most
Least

Sugary Drink FACTS 158
Ranking Table 7
TV Advertising Exposure by Black Youth cont’d
COMPANY RANKINGS
Advertising exposure: Targeted ratio: % change in black Black youth Black to white youth exposure: 2008-2010
Children Teens Children Teens Children Teens Rank Company 2-11 years 12-17 years 2-11 years 12-17 years 2-11 years 12-17 years
1 Kraft Foods 99.1 90.1 1.27 1.78 -18% 14%
2 Innovation Ventures 97.0 200.7 2.70 2.14 127% 121%
3 PepsiCo 50.3 110.7 2.06 1.73 -19% -23%
4 Dr Pepper Snapple Group 49.0 88.5 1.93 1.65 135% 93%
5 Coca-Cola 38.4 84.2 1.85 2.04 162% 207%
6 Sunny Delight Beverages 31.5 42.0 1.74 2.38 -2% 0%
7 Ocean Spray 12.9 17.4 1.68 1.76 0% 16%
8 Red Bull 11.0 22.5 2.52 1.83 -27% -30%
9 Unilever 6.9 10.7 1.85 1.65 81% 73%
10 Welch Foods Inc. 2.7 3.3 1.59 1.44 - -
“-” indicates no ad exposure in 2008 Bold targeted ratios indicate higher than expected exposure for blacks compared to whites of the same age © Nielsen
Most
Least
Sugary Drink FACTS 159
Ranking Table 8Ranking Table 8
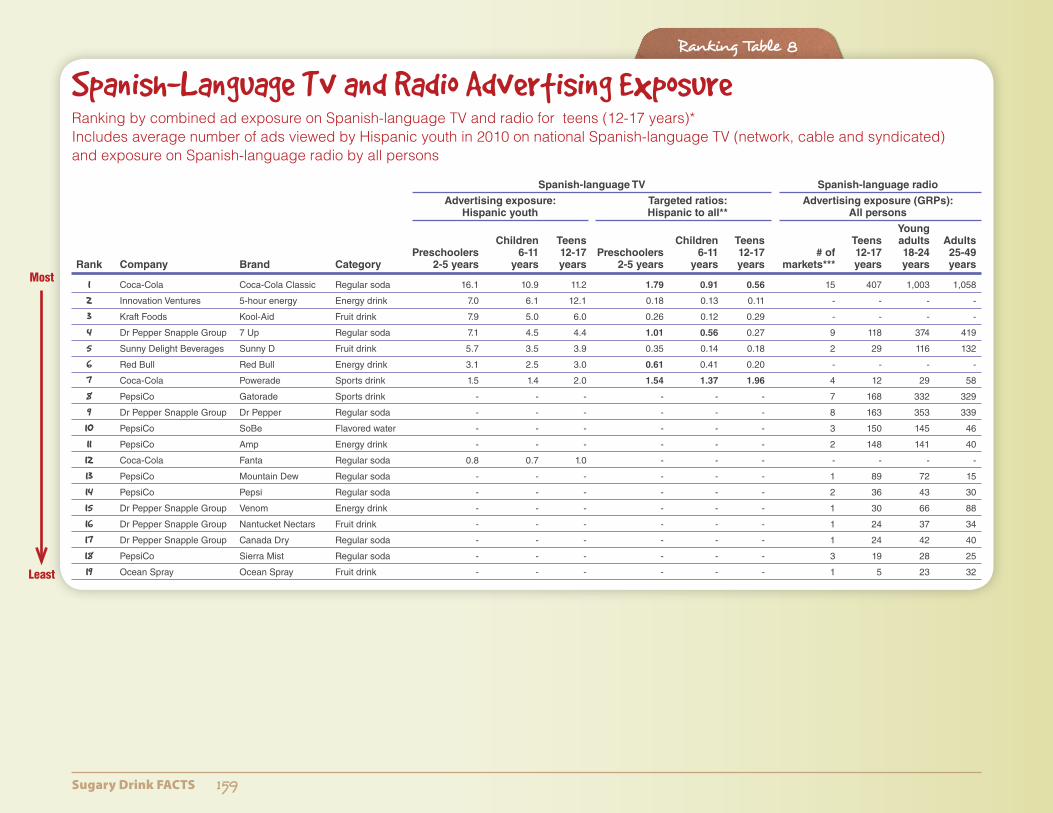
Spanish-Language Tv and Radio Advertising ExposureRanking by combined ad exposure on Spanish-language TV and radio for teens (12-17 years)* Includes average number of ads viewed by Hispanic youth in 2010 on national Spanish-language TV (network, cable and syndicated) and exposure on Spanish-language radio by all persons
Spanish-language TV Spanish-language radio
Advertising exposure: Targeted ratios: Advertising exposure (GRPs): Hispanic youth Hispanic to all** All persons
Young Children Teens Children Teens Teens adults Adults Preschoolers 6-11 12-17 Preschoolers 6-11 12-17 # of 12-17 18-24 25-49 Rank Company Brand Category 2-5 years years years 2-5 years years years markets*** years years years
1 Coca-Cola Coca-Cola Classic Regular soda 16.1 10.9 11.2 1.79 0.91 0.56 15 407 1,003 1,058
2 Innovation Ventures 5-hour energy Energy drink 7.0 6.1 12.1 0.18 0.13 0.11 - - - -
3 Kraft Foods Kool-Aid Fruit drink 7.9 5.0 6.0 0.26 0.12 0.29 - - - -
4 Dr Pepper Snapple Group 7 Up Regular soda 7.1 4.5 4.4 1.01 0.56 0.27 9 118 374 419
5 Sunny Delight Beverages Sunny D Fruit drink 5.7 3.5 3.9 0.35 0.14 0.18 2 29 116 132
6 Red Bull Red Bull Energy drink 3.1 2.5 3.0 0.61 0.41 0.20 - - - -
7 Coca-Cola Powerade Sports drink 1.5 1.4 2.0 1.54 1.37 1.96 4 12 29 58
8 PepsiCo Gatorade Sports drink - - - - - - 7 168 332 329
9 Dr Pepper Snapple Group Dr Pepper Regular soda - - - - - - 8 163 353 339
10 PepsiCo SoBe Flavored water - - - - - - 3 150 145 46
11 PepsiCo Amp Energy drink - - - - - - 2 148 141 40
12 Coca-Cola Fanta Regular soda 0.8 0.7 1.0 - - - - - - -
13 PepsiCo Mountain Dew Regular soda - - - - - - 1 89 72 15
14 PepsiCo Pepsi Regular soda - - - - - - 2 36 43 30
15 Dr Pepper Snapple Group Venom Energy drink - - - - - - 1 30 66 88
16 Dr Pepper Snapple Group Nantucket Nectars Fruit drink - - - - - - 1 24 37 34
17 Dr Pepper Snapple Group Canada Dry Regular soda - - - - - - 1 24 42 40
18 PepsiCo Sierra Mist Regular soda - - - - - - 3 19 28 25
19 Ocean Spray Ocean Spray Fruit drink - - - - - - 1 5 23 32
Most
Least

Sugary Drink FACTS 160
Ranking Table 8Ranking Table 8
Spanish-Language TV and Radio Advertising Exposure cont’d
COMPANY RANKINGS
Spanish-language TV Spanish-language radio
Advertising exposure: Targeted ratios: Advertising exposure (GRPs): Hispanic youth Hispanic to all** All persons
Young Children Teens Children Teens Teens adults Adults Preschoolers 6-11 12-17 Preschoolers 6-11 12-17 # of 12-17 18-24 25-49 Rank Company 2-5 years years years 2-5 years years years markets*** years years years
1 Coca-Cola 19 13 14 1.00 0.50 0.29 15 442 1,084 1,176
2 Innovation Ventures 7 6 12 0.18 0.13 0.11 - - - -
3 Dr Pepper Snapple Group 7 4 4 1.01 0.56 0.27 9 412 1,055 1,115
4 PepsiCo - - - - - - 7 608 761 484
5 Kraft Foods 8 5 6 0.26 0.12 0.29 - - - -
6 Sunny Delight Beverages 6 3 4 0.35 0.14 0.18 2 29 116 132
7 Red Bull 3 2 3 0.61 0.41 0.20 - - - -
8 Ocean Spray - - - - - - 1 5 23 32
*Combined ad exposure calculated as the sum of ads viewed on Spanish-language TV by teens and Spanish-language radio GRPs 12-17 years divided by 100 **Spanish-language TV (Hispanic) to all other TV (all persons) ***Markets with a minimum of 20 GRPs for at least one demographic group (maximum 15 markets) Bold targeted ratios indicate higher than expected exposure for Hispanics compared to all persons of the same age © Nielsen
Most
Least
Sugary Drink FACTS 161
Ranking Table 8
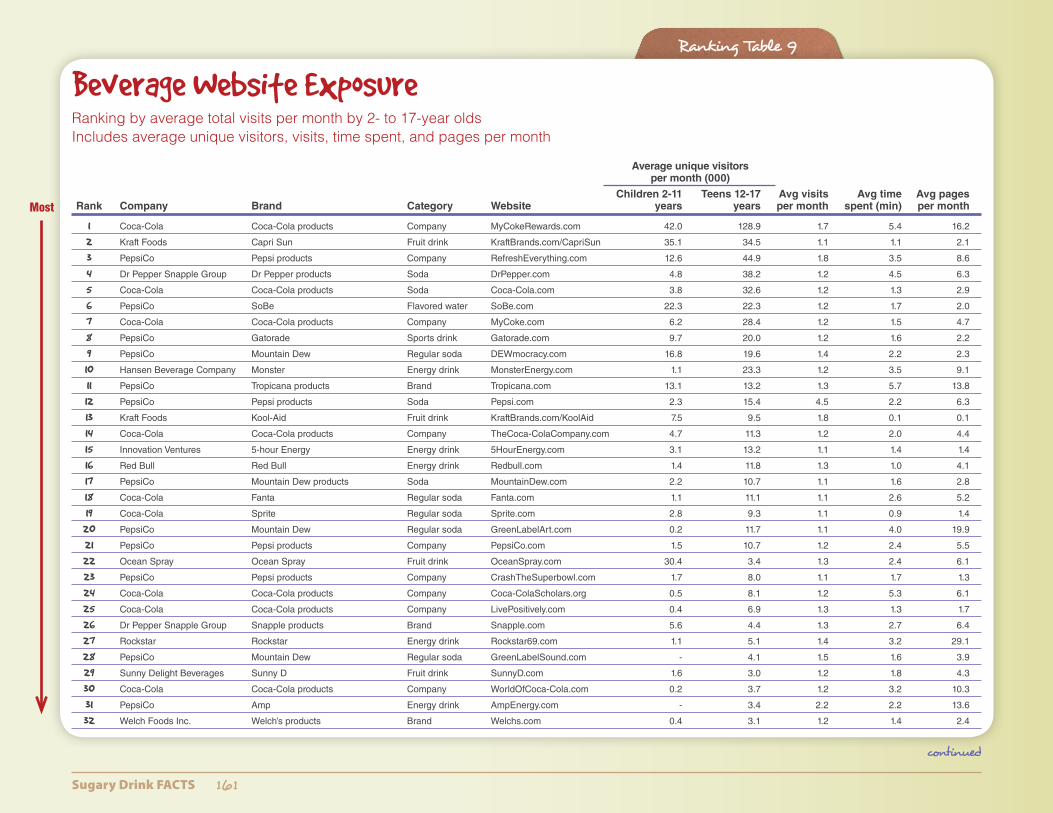
Ranking Table 9
Beverage Website ExposureRanking by average total visits per month by 2- to 17-year olds Includes average unique visitors, visits, time spent, and pages per month
Average unique visitors per month (000)
Children 2-11 Teens 12-17 Avg visits Avg time Avg pages Rank Company Brand Category Website years years per month spent (min) per month
1 Coca-Cola Coca-Cola products Company MyCokeRewards.com 42.0 128.9 1.7 5.4 16.2
2 Kraft Foods Capri Sun Fruit drink KraftBrands.com/CapriSun 35.1 34.5 1.1 1.1 2.1
3 PepsiCo Pepsi products Company RefreshEverything.com 12.6 44.9 1.8 3.5 8.6
4 Dr Pepper Snapple Group Dr Pepper products Soda DrPepper.com 4.8 38.2 1.2 4.5 6.3
5 Coca-Cola Coca-Cola products Soda Coca-Cola.com 3.8 32.6 1.2 1.3 2.9
6 PepsiCo SoBe Flavored water SoBe.com 22.3 22.3 1.2 1.7 2.0
7 Coca-Cola Coca-Cola products Company MyCoke.com 6.2 28.4 1.2 1.5 4.7
8 PepsiCo Gatorade Sports drink Gatorade.com 9.7 20.0 1.2 1.6 2.2
9 PepsiCo Mountain Dew Regular soda DEWmocracy.com 16.8 19.6 1.4 2.2 2.3
10 Hansen Beverage Company Monster Energy drink MonsterEnergy.com 1.1 23.3 1.2 3.5 9.1
11 PepsiCo Tropicana products Brand Tropicana.com 13.1 13.2 1.3 5.7 13.8
12 PepsiCo Pepsi products Soda Pepsi.com 2.3 15.4 4.5 2.2 6.3
13 Kraft Foods Kool-Aid Fruit drink KraftBrands.com/KoolAid 7.5 9.5 1.8 0.1 0.1
14 Coca-Cola Coca-Cola products Company TheCoca-ColaCompany.com 4.7 11.3 1.2 2.0 4.4
15 Innovation Ventures 5-hour Energy Energy drink 5HourEnergy.com 3.1 13.2 1.1 1.4 1.4
16 Red Bull Red Bull Energy drink Redbull.com 1.4 11.8 1.3 1.0 4.1
17 PepsiCo Mountain Dew products Soda MountainDew.com 2.2 10.7 1.1 1.6 2.8
18 Coca-Cola Fanta Regular soda Fanta.com 1.1 11.1 1.1 2.6 5.2
19 Coca-Cola Sprite Regular soda Sprite.com 2.8 9.3 1.1 0.9 1.4
20 PepsiCo Mountain Dew Regular soda GreenLabelArt.com 0.2 11.7 1.1 4.0 19.9
21 PepsiCo Pepsi products Company PepsiCo.com 1.5 10.7 1.2 2.4 5.5
22 Ocean Spray Ocean Spray Fruit drink OceanSpray.com 30.4 3.4 1.3 2.4 6.1
23 PepsiCo Pepsi products Company CrashTheSuperbowl.com 1.7 8.0 1.1 1.7 1.3
24 Coca-Cola Coca-Cola products Company Coca-ColaScholars.org 0.5 8.1 1.2 5.3 6.1
25 Coca-Cola Coca-Cola products Company LivePositively.com 0.4 6.9 1.3 1.3 1.7
26 Dr Pepper Snapple Group Snapple products Brand Snapple.com 5.6 4.4 1.3 2.7 6.4
27 Rockstar Rockstar Energy drink Rockstar69.com 1.1 5.1 1.4 3.2 29.1
28 PepsiCo Mountain Dew Regular soda GreenLabelSound.com - 4.1 1.5 1.6 3.9
29 Sunny Delight Beverages Sunny D Fruit drink SunnyD.com 1.6 3.0 1.2 1.8 4.3
30 Coca-Cola Coca-Cola products Company WorldOfCoca-Cola.com 0.2 3.7 1.2 3.2 10.3
31 PepsiCo Amp Energy drink AmpEnergy.com - 3.4 2.2 2.2 13.6
32 Welch Foods Inc. Welch’s products Brand Welchs.com 0.4 3.1 1.2 1.4 2.4
Most
continued
Sugary Drink FACTS 162
Ranking Table 8
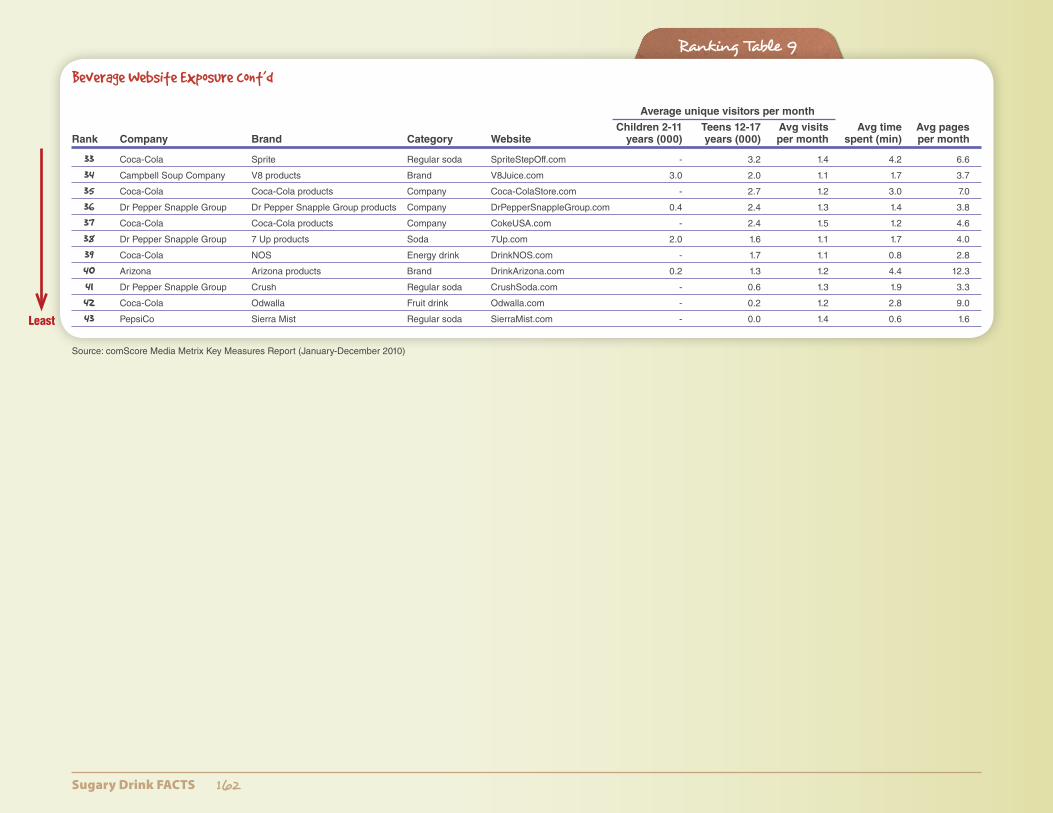
Ranking Table 9
Beverage Website Exposure cont’d
Average unique visitors per month
Children 2-11 Teens 12-17 Avg visits Avg time Avg pages Rank Company Brand Category Website years (000) years (000) per month spent (min) per month
33 Coca-Cola Sprite Regular soda SpriteStepOff.com - 3.2 1.4 4.2 6.6
34 Campbell Soup Company V8 products Brand V8Juice.com 3.0 2.0 1.1 1.7 3.7
35 Coca-Cola Coca-Cola products Company Coca-ColaStore.com - 2.7 1.2 3.0 7.0
36 Dr Pepper Snapple Group Dr Pepper Snapple Group products Company DrPepperSnappleGroup.com 0.4 2.4 1.3 1.4 3.8
37 Coca-Cola Coca-Cola products Company CokeUSA.com - 2.4 1.5 1.2 4.6
38 Dr Pepper Snapple Group 7 Up products Soda 7Up.com 2.0 1.6 1.1 1.7 4.0
39 Coca-Cola NOS Energy drink DrinkNOS.com - 1.7 1.1 0.8 2.8
40 Arizona Arizona products Brand DrinkArizona.com 0.2 1.3 1.2 4.4 12.3
41 Dr Pepper Snapple Group Crush Regular soda CrushSoda.com - 0.6 1.3 1.9 3.3
42 Coca-Cola Odwalla Fruit drink Odwalla.com - 0.2 1.2 2.8 9.0
43 PepsiCo Sierra Mist Regular soda SierraMist.com - 0.0 1.4 0.6 1.6
Source: comScore Media Metrix Key Measures Report (January-December 2010)
Least
Sugary Drink FACTS 163
Ranking Table 8
Ranking Table 10
Most
Least
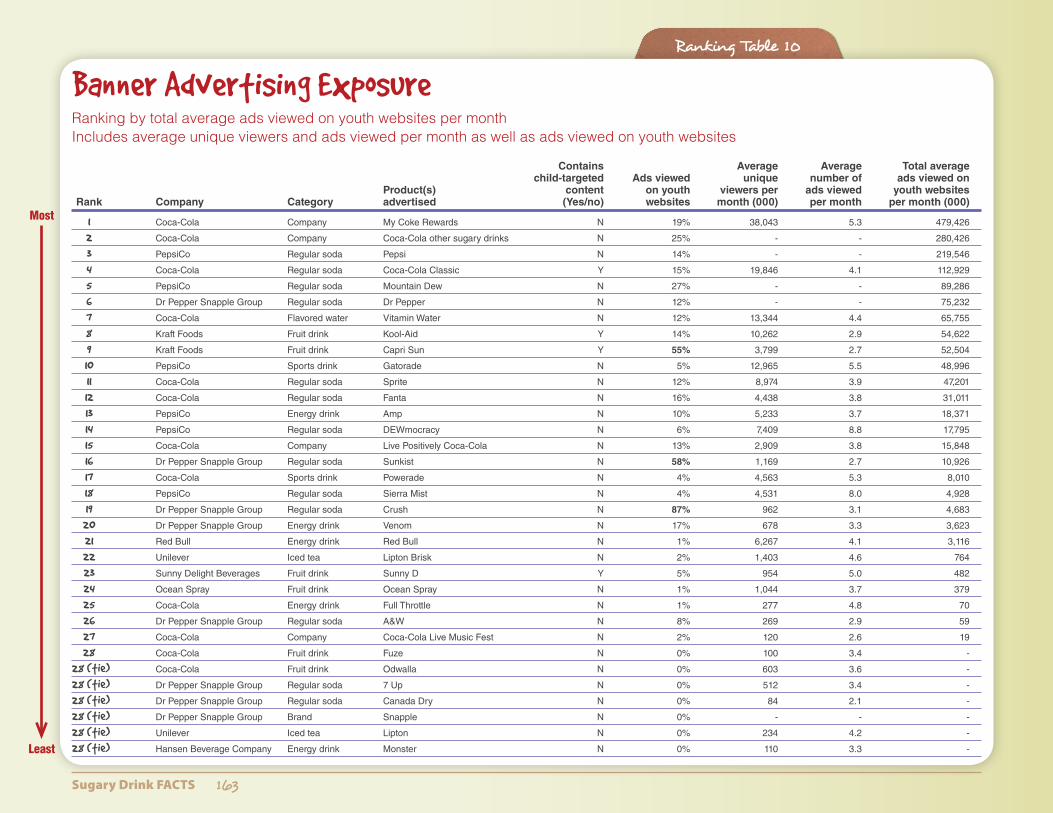
Banner Advertising ExposureRanking by total average ads viewed on youth websites per month Includes average unique viewers and ads viewed per month as well as ads viewed on youth websites
Contains Average Average Total average child-targeted Ads viewed unique number of ads viewed on Product(s) content on youth viewers per ads viewed youth websites Rank Company Category advertised (Yes/no) websites month (000) per month per month (000)
1 Coca-Cola Company My Coke Rewards N 19% 38,043 5.3 479,426
2 Coca-Cola Company Coca-Cola other sugary drinks N 25% - - 280,426
3 PepsiCo Regular soda Pepsi N 14% - - 219,546
4 Coca-Cola Regular soda Coca-Cola Classic Y 15% 19,846 4.1 112,929
5 PepsiCo Regular soda Mountain Dew N 27% - - 89,286
6 Dr Pepper Snapple Group Regular soda Dr Pepper N 12% - - 75,232
7 Coca-Cola Flavored water Vitamin Water N 12% 13,344 4.4 65,755
8 Kraft Foods Fruit drink Kool-Aid Y 14% 10,262 2.9 54,622
9 Kraft Foods Fruit drink Capri Sun Y 55% 3,799 2.7 52,504
10 PepsiCo Sports drink Gatorade N 5% 12,965 5.5 48,996
11 Coca-Cola Regular soda Sprite N 12% 8,974 3.9 47,201
12 Coca-Cola Regular soda Fanta N 16% 4,438 3.8 31,011
13 PepsiCo Energy drink Amp N 10% 5,233 3.7 18,371
14 PepsiCo Regular soda DEWmocracy N 6% 7,409 8.8 17,795
15 Coca-Cola Company Live Positively Coca-Cola N 13% 2,909 3.8 15,848
16 Dr Pepper Snapple Group Regular soda Sunkist N 58% 1,169 2.7 10,926
17 Coca-Cola Sports drink Powerade N 4% 4,563 5.3 8,010
18 PepsiCo Regular soda Sierra Mist N 4% 4,531 8.0 4,928
19 Dr Pepper Snapple Group Regular soda Crush N 87% 962 3.1 4,683
20 Dr Pepper Snapple Group Energy drink Venom N 17% 678 3.3 3,623
21 Red Bull Energy drink Red Bull N 1% 6,267 4.1 3,116
22 Unilever Iced tea Lipton Brisk N 2% 1,403 4.6 764
23 Sunny Delight Beverages Fruit drink Sunny D Y 5% 954 5.0 482
24 Ocean Spray Fruit drink Ocean Spray N 1% 1,044 3.7 379
25 Coca-Cola Energy drink Full Throttle N 1% 277 4.8 70
26 Dr Pepper Snapple Group Regular soda A&W N 8% 269 2.9 59
27 Coca-Cola Company Coca-Cola Live Music Fest N 2% 120 2.6 19
28 Coca-Cola Fruit drink Fuze N 0% 100 3.4 -
28 (tie) Coca-Cola Fruit drink Odwalla N 0% 603 3.6 -
28 (tie) Dr Pepper Snapple Group Regular soda 7 Up N 0% 512 3.4 -
28 (tie) Dr Pepper Snapple Group Regular soda Canada Dry N 0% 84 2.1 -
28 (tie) Dr Pepper Snapple Group Brand Snapple N 0% - - -
28 (tie) Unilever Iced tea Lipton N 0% 234 4.2 -
28 (tie) Hansen Beverage Company Energy drink Monster N 0% 110 3.3 -
Sugary Drink FACTS 164
Ranking Table 8
Ranking Table 10
Most
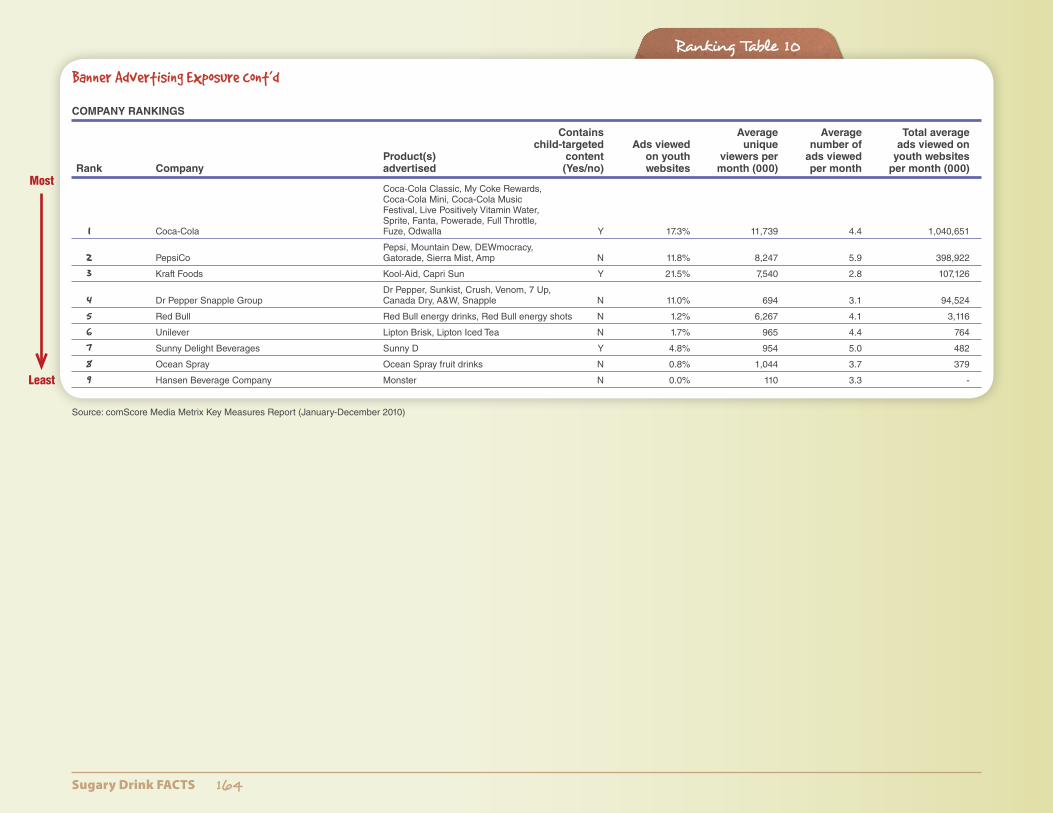
Banner Advertising Exposure cont’d
COMPANY RANKINGS
Contains Average Average Total average child-targeted Ads viewed unique number of ads viewed on Product(s) content on youth viewers per ads viewed youth websites Rank Company advertised (Yes/no) websites month (000) per month per month (000)
Coca-Cola Classic, My Coke Rewards, Coca-Cola Mini, Coca-Cola Music Festival, Live Positively Vitamin Water, Sprite, Fanta, Powerade, Full Throttle, 1 Coca-Cola Fuze, Odwalla Y 17.3% 11,739 4.4 1,040,651
Pepsi, Mountain Dew, DEWmocracy, 2 PepsiCo Gatorade, Sierra Mist, Amp N 11.8% 8,247 5.9 398,922
3 Kraft Foods Kool-Aid, Capri Sun Y 21.5% 7,540 2.8 107,126
Dr Pepper, Sunkist, Crush, Venom, 7 Up, 4 Dr Pepper Snapple Group Canada Dry, A&W, Snapple N 11.0% 694 3.1 94,524
5 Red Bull Red Bull energy drinks, Red Bull energy shots N 1.2% 6,267 4.1 3,116
6 Unilever Lipton Brisk, Lipton Iced Tea N 1.7% 965 4.4 764
7 Sunny Delight Beverages Sunny D Y 4.8% 954 5.0 482
8 Ocean Spray Ocean Spray fruit drinks N 0.8% 1,044 3.7 379
9 Hansen Beverage Company Monster N 0.0% 110 3.3 -
Source: comScore Media Metrix Key Measures Report (January-December 2010)
Least
Sugary Drink FACTS 165
Ranking Table 8
Ranking Table 11
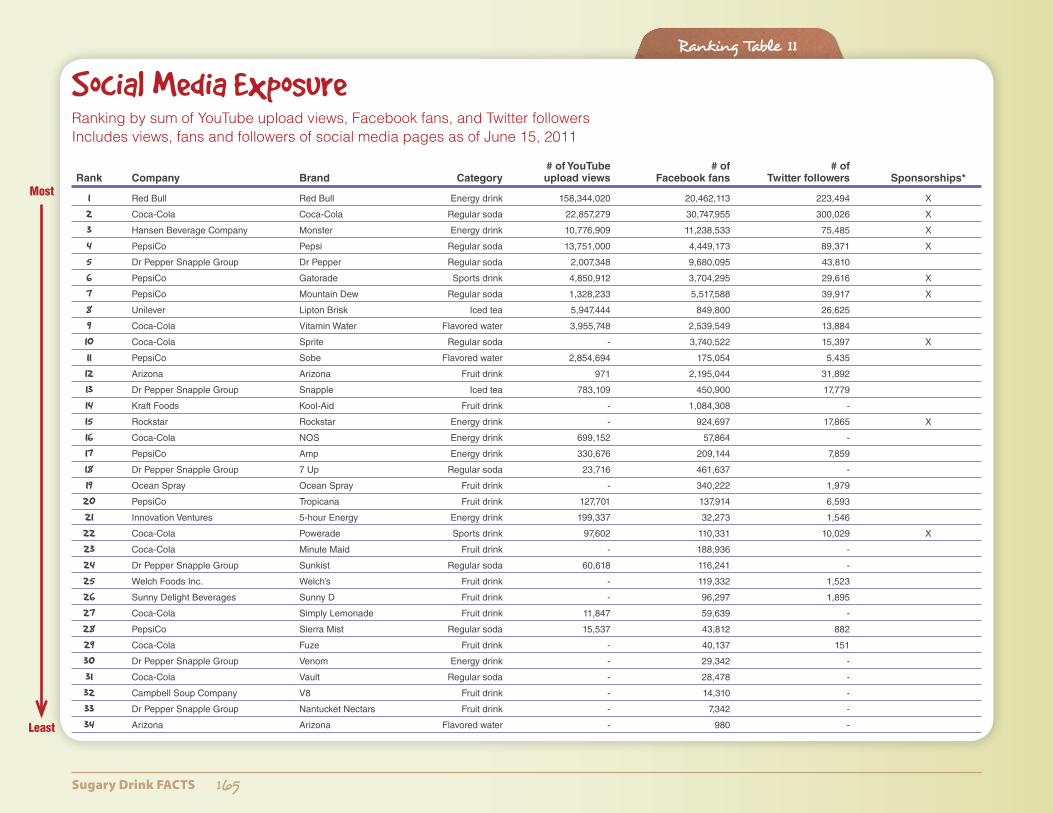
Social Media ExposureRanking by sum of YouTube upload views, Facebook fans, and Twitter followers Includes views, fans and followers of social media pages as of June 15, 2011
# of YouTube # of # of Rank Company Brand Category upload views Facebook fans Twitter followers Sponsorships*
1 Red Bull Red Bull Energy drink 158,344,020 20,462,113 223,494 X
2 Coca-Cola Coca-Cola Regular soda 22,857,279 30,747,955 300,026 X
3 Hansen Beverage Company Monster Energy drink 10,776,909 11,238,533 75,485 X
4 PepsiCo Pepsi Regular soda 13,751,000 4,449,173 89,371 X
5 Dr Pepper Snapple Group Dr Pepper Regular soda 2,007,348 9,680,095 43,810
6 PepsiCo Gatorade Sports drink 4,850,912 3,704,295 29,616 X
7 PepsiCo Mountain Dew Regular soda 1,328,233 5,517,588 39,917 X
8 Unilever Lipton Brisk Iced tea 5,947,444 849,800 26,625
9 Coca-Cola Vitamin Water Flavored water 3,955,748 2,539,549 13,884
10 Coca-Cola Sprite Regular soda - 3,740,522 15,397 X
11 PepsiCo Sobe Flavored water 2,854,694 175,054 5,435
12 Arizona Arizona Fruit drink 971 2,195,044 31,892
13 Dr Pepper Snapple Group Snapple Iced tea 783,109 450,900 17,779
14 Kraft Foods Kool-Aid Fruit drink - 1,084,308 -
15 Rockstar Rockstar Energy drink - 924,697 17,865 X
16 Coca-Cola NOS Energy drink 699,152 57,864 -
17 PepsiCo Amp Energy drink 330,676 209,144 7,859
18 Dr Pepper Snapple Group 7 Up Regular soda 23,716 461,637 -
19 Ocean Spray Ocean Spray Fruit drink - 340,222 1,979
20 PepsiCo Tropicana Fruit drink 127,701 137,914 6,593
21 Innovation Ventures 5-hour Energy Energy drink 199,337 32,273 1,546
22 Coca-Cola Powerade Sports drink 97,602 110,331 10,029 X
23 Coca-Cola Minute Maid Fruit drink - 188,936 -
24 Dr Pepper Snapple Group Sunkist Regular soda 60,618 116,241 -
25 Welch Foods Inc. Welch’s Fruit drink - 119,332 1,523
26 Sunny Delight Beverages Sunny D Fruit drink - 96,297 1,895
27 Coca-Cola Simply Lemonade Fruit drink 11,847 59,639 -
28 PepsiCo Sierra Mist Regular soda 15,537 43,812 882
29 Coca-Cola Fuze Fruit drink - 40,137 151
30 Dr Pepper Snapple Group Venom Energy drink - 29,342 -
31 Coca-Cola Vault Regular soda - 28,478 -
32 Campbell Soup Company V8 Fruit drink - 14,310 -
33 Dr Pepper Snapple Group Nantucket Nectars Fruit drink - 7,342 -
34 Arizona Arizona Flavored water - 980 -
Most
Least
Sugary Drink FACTS 166
Ranking Table 8
Ranking Table 11
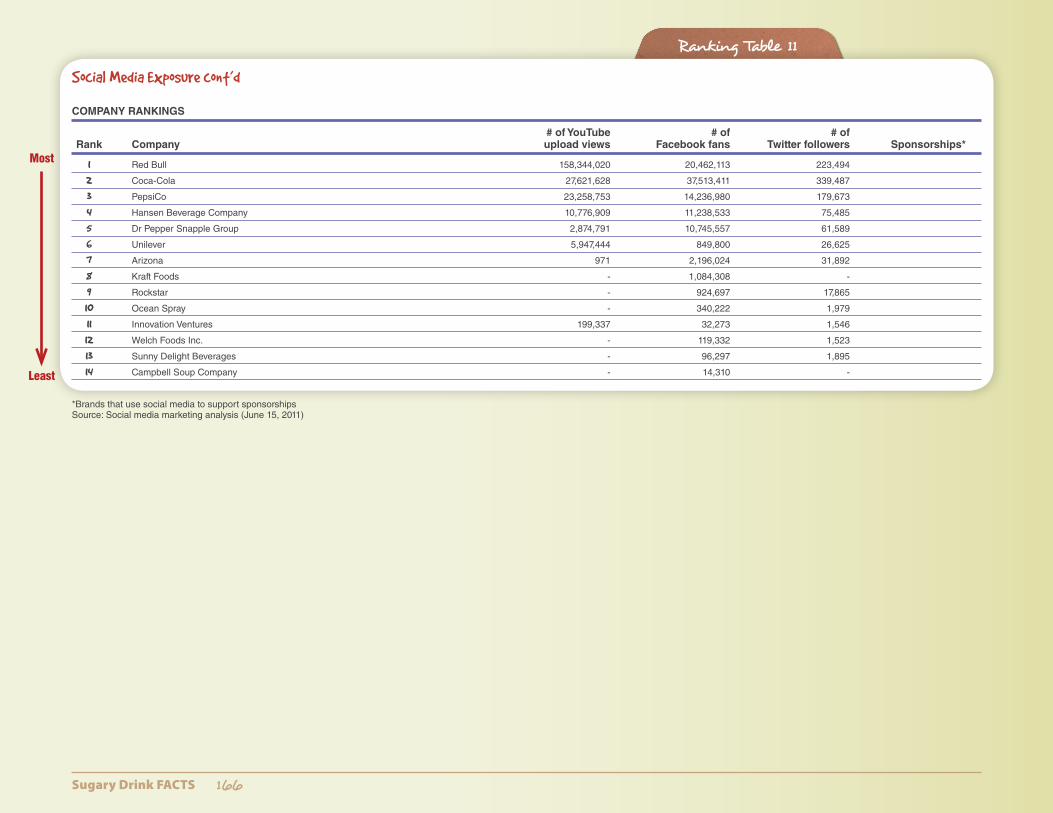
Social Media Exposure cont’d
COMPANY RANKINGS
# of YouTube # of # of Rank Company upload views Facebook fans Twitter followers Sponsorships*
1 Red Bull 158,344,020 20,462,113 223,494
2 Coca-Cola 27,621,628 37,513,411 339,487
3 PepsiCo 23,258,753 14,236,980 179,673
4 Hansen Beverage Company 10,776,909 11,238,533 75,485
5 Dr Pepper Snapple Group 2,874,791 10,745,557 61,589
6 Unilever 5,947,444 849,800 26,625
7 Arizona 971 2,196,024 31,892
8 Kraft Foods - 1,084,308 -
9 Rockstar - 924,697 17,865
10 Ocean Spray - 340,222 1,979
11 Innovation Ventures 199,337 32,273 1,546
12 Welch Foods Inc. - 119,332 1,523
13 Sunny Delight Beverages - 96,297 1,895
14 Campbell Soup Company - 14,310 -
*Brands that use social media to support sponsorships Source: Social media marketing analysis (June 15, 2011)
Most
Least
Sugary Drink FACTS 167
Ranking Table 8
Ranking Table 12
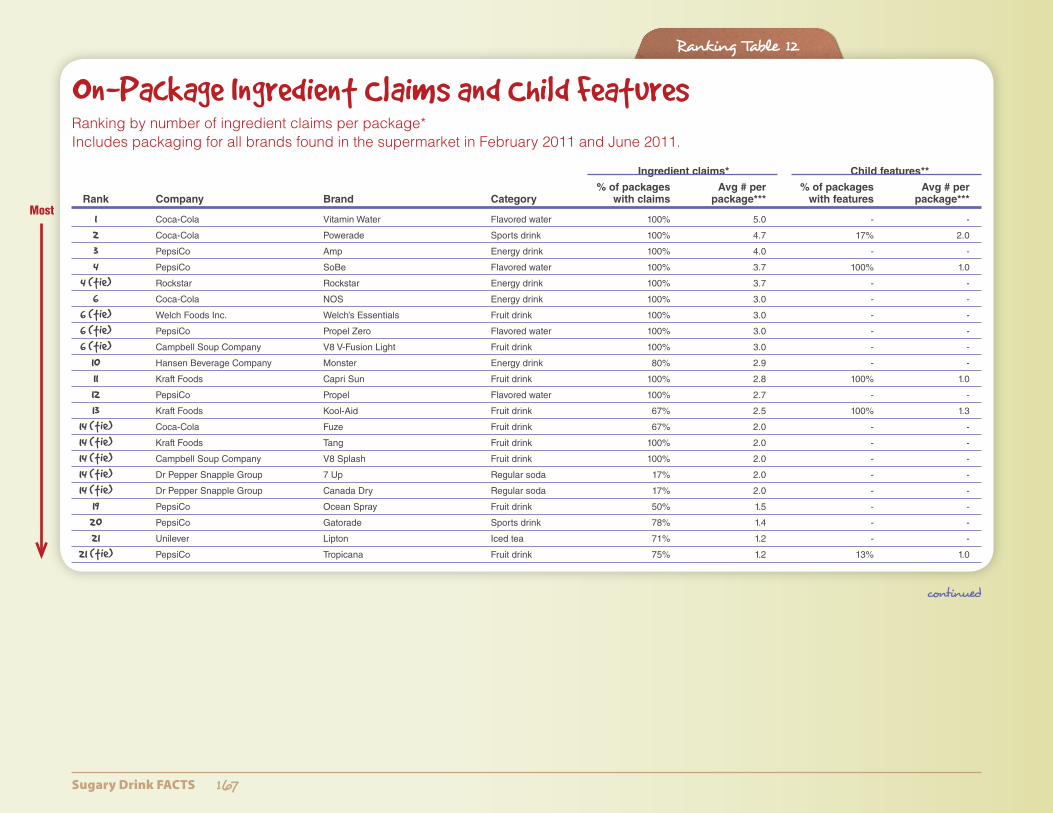
On-Package Ingredient Claims and Child FeaturesRanking by number of ingredient claims per package* Includes packaging for all brands found in the supermarket in February 2011 and June 2011.
Ingredient claims* Child features**
% of packages Avg # per % of packages Avg # per Rank Company Brand Category with claims package*** with features package***
1 Coca-Cola Vitamin Water Flavored water 100% 5.0 - -
2 Coca-Cola Powerade Sports drink 100% 4.7 17% 2.0
3 PepsiCo Amp Energy drink 100% 4.0 - -
4 PepsiCo SoBe Flavored water 100% 3.7 100% 1.0
4 (tie) Rockstar Rockstar Energy drink 100% 3.7 - -
6 Coca-Cola NOS Energy drink 100% 3.0 - -
6 (tie) Welch Foods Inc. Welch’s Essentials Fruit drink 100% 3.0 - -
6 (tie) PepsiCo Propel Zero Flavored water 100% 3.0 - -
6 (tie) Campbell Soup Company V8 V-Fusion Light Fruit drink 100% 3.0 - -
10 Hansen Beverage Company Monster Energy drink 80% 2.9 - -
11 Kraft Foods Capri Sun Fruit drink 100% 2.8 100% 1.0
12 PepsiCo Propel Flavored water 100% 2.7 - -
13 Kraft Foods Kool-Aid Fruit drink 67% 2.5 100% 1.3
14 (tie) Coca-Cola Fuze Fruit drink 67% 2.0 - -
14 (tie) Kraft Foods Tang Fruit drink 100% 2.0 - -
14 (tie) Campbell Soup Company V8 Splash Fruit drink 100% 2.0 - -
14 (tie) Dr Pepper Snapple Group 7 Up Regular soda 17% 2.0 - -
14 (tie) Dr Pepper Snapple Group Canada Dry Regular soda 17% 2.0 - -
19 PepsiCo Ocean Spray Fruit drink 50% 1.5 - -
20 PepsiCo Gatorade Sports drink 78% 1.4 - -
21 Unilever Lipton Iced tea 71% 1.2 - -
21 (tie) PepsiCo Tropicana Fruit drink 75% 1.2 13% 1.0
Most
continued
Sugary Drink FACTS 168
Ranking Table 8
Ranking Table 12
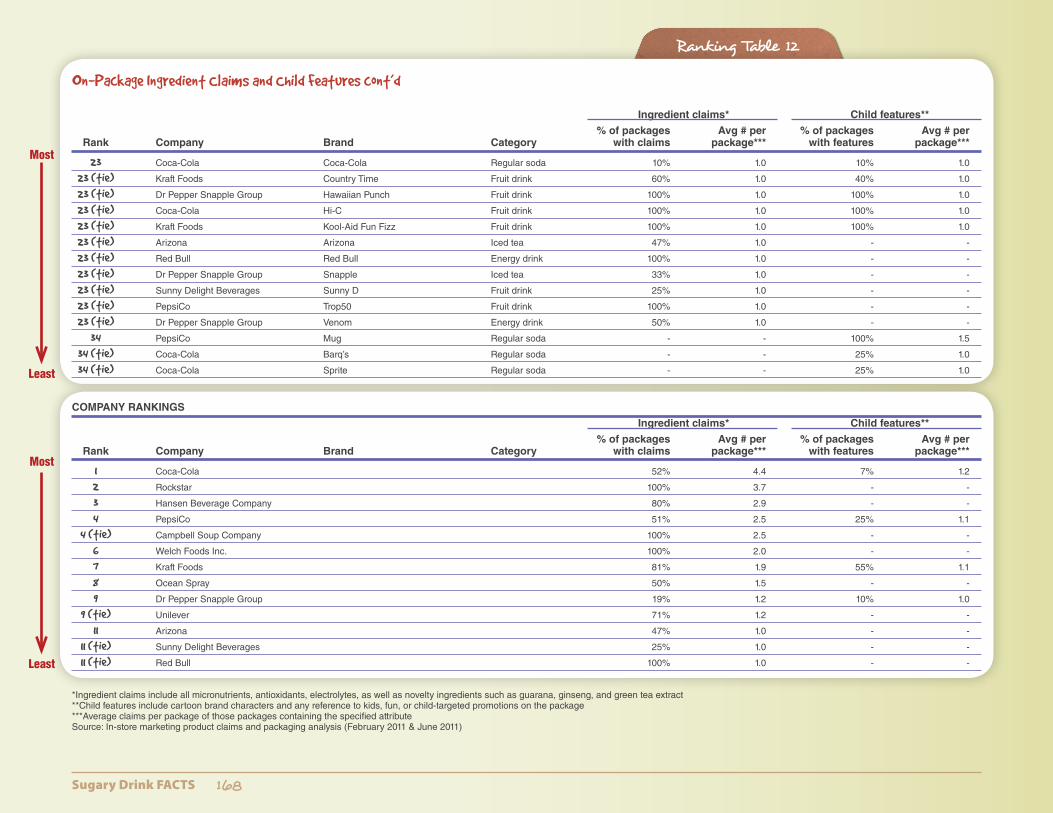
On-Package Ingredient Claims and Child Features cont’d
Ingredient claims* Child features**
% of packages Avg # per % of packages Avg # per Rank Company Brand Category with claims package*** with features package***
23 Coca-Cola Coca-Cola Regular soda 10% 1.0 10% 1.0
23 (tie) Kraft Foods Country Time Fruit drink 60% 1.0 40% 1.0
23 (tie) Dr Pepper Snapple Group Hawaiian Punch Fruit drink 100% 1.0 100% 1.0
23 (tie) Coca-Cola Hi-C Fruit drink 100% 1.0 100% 1.0
23 (tie) Kraft Foods Kool-Aid Fun Fizz Fruit drink 100% 1.0 100% 1.0
23 (tie) Arizona Arizona Iced tea 47% 1.0 - -
23 (tie) Red Bull Red Bull Energy drink 100% 1.0 - -
23 (tie) Dr Pepper Snapple Group Snapple Iced tea 33% 1.0 - -
23 (tie) Sunny Delight Beverages Sunny D Fruit drink 25% 1.0 - -
23 (tie) PepsiCo Trop50 Fruit drink 100% 1.0 - -
23 (tie) Dr Pepper Snapple Group Venom Energy drink 50% 1.0 - -
34 PepsiCo Mug Regular soda - - 100% 1.5
34 (tie) Coca-Cola Barq’s Regular soda - - 25% 1.0
34 (tie) Coca-Cola Sprite Regular soda - - 25% 1.0
COMPANY RANKINGS
Ingredient claims* Child features**
% of packages Avg # per % of packages Avg # per Rank Company Brand Category with claims package*** with features package***
1 Coca-Cola 52% 4.4 7% 1.2
2 Rockstar 100% 3.7 - -
3 Hansen Beverage Company 80% 2.9 - -
4 PepsiCo 51% 2.5 25% 1.1
4 (tie) Campbell Soup Company 100% 2.5 - -
6 Welch Foods Inc. 100% 2.0 - -
7 Kraft Foods 81% 1.9 55% 1.1
8 Ocean Spray 50% 1.5 - -
9 Dr Pepper Snapple Group 19% 1.2 10% 1.0
9 (tie) Unilever 71% 1.2 - -
11 Arizona 47% 1.0 - -
11 (tie) Sunny Delight Beverages 25% 1.0 - -
11 (tie) Red Bull 100% 1.0 - -
*Ingredient claims include all micronutrients, antioxidants, electrolytes, as well as novelty ingredients such as guarana, ginseng, and green tea extract **Child features include cartoon brand characters and any reference to kids, fun, or child-targeted promotions on the package ***Average claims per package of those packages containing the specified attribute Source: In-store marketing product claims and packaging analysis (February 2011 & June 2011)
Least
Least
Most
Most