Ranking Stock Exchange Companies With a Combined...
13
International Journal of Business and Development Studies Vol. 7, No. 1, (2015) pp 63--75 Ranking Stock Exchange Companies With a Combined Approach Based on FAHP-FTOPSIS Financial Ratios and Comparing Them With Tehran Stock Exchange Rankings Mohammad Esmaeil Ezazi 1 , Saeide Ketabi 2 and Seyed Hasan Hosseini 3 Abstract: Ranking of companies listed on the exchange represent their status and considered a criterion for investment. Also, it increases market's competition, development and efficiency. In this study, the fifty superior companies listed in Tehran Stock Exchange were ranked based on financial ratios (liquidity, operational, leverage and profitability) using FAHP- FTOPSIS hybrid approach during the years 2013 . Initially, capital markets authorities and universities' financial masters perspectives about effect of ratios were collected by questionnaire and weighting with FAHP technique and then companies were ranked based on ratios using the FTOPSIS technique. The results indicate that there is a weak correlation between two groups of ranking. In fact, results show that the stock exchange’s selected top companies necessarily do not have higher rankings in terms of financial ratios and the firms’ financial Statements are weak approximation for firms’ superiority likelihood in the stock exchange. Key words: Ranking, Financial Ratios, AHP–TOPSIS, 50 Superior Companies, Tehran Stock Exchange 1. Introduction In the recent years, many developed countries by expanding financial markets pave the ground to finance institutes and enterprises (Madura 2006), and by directing people’s savings and surplus liquidity towards productive investment have played a critical role in economic development and formation of capital (Donyaei et al.,2011). In fact, people by investment in successful manufacturing, business and commercial units may achieve their expected profit (Madura 2006). Development of stock exchange and OTC has resulted in generation and expansion of financial services which at different levels provide investors with consultation services and rank companies and stock exchanges (O'Hara & Vetere,1993). 1 Assistant Professor,Financial Management Department, University of Sistan and Baluchestan,Iran. 2 Associate Professor,Management Department, University of Isfahan, Isfahan, Iran. 3 Ph.D. Candidate in Business Administration,Faculty of Economic Sciences, University of Isfahan, Iran
Transcript of Ranking Stock Exchange Companies With a Combined...

International Journal of Business and Development Studies Vol. 7, No. 1, (2015) pp 63--75
Ranking Stock Exchange Companies With a Combined Approach
Based on FAHP-FTOPSIS Financial Ratios and Comparing Them
With Tehran Stock Exchange Rankings
Mohammad Esmaeil Ezazi1, Saeide Ketabi2 and Seyed Hasan Hosseini3
Abstract:
Ranking of companies listed on the exchange represent their status
and considered a criterion for investment. Also, it increases market's
competition, development and efficiency. In this study, the fifty superior
companies listed in Tehran Stock Exchange were ranked based on
financial ratios (liquidity, operational, leverage and profitability) using
FAHP- FTOPSIS hybrid approach during the years 2013 . Initially,
capital markets authorities and universities' financial masters perspectives
about effect of ratios were collected by questionnaire and weighting with
FAHP technique and then companies were ranked based on ratios using
the FTOPSIS technique. The results indicate that there is a weak
correlation between two groups of ranking. In fact, results show that the
stock exchange’s selected top companies necessarily do not have higher
rankings in terms of financial ratios and the firms’ financial Statements
are weak approximation for firms’ superiority likelihood in the stock
exchange.
Key words: Ranking, Financial Ratios, AHP–TOPSIS, 50 Superior
Companies, Tehran Stock Exchange
1. Introduction
In the recent years, many developed countries by expanding financial markets
pave the ground to finance institutes and enterprises (Madura 2006), and by
directing people’s savings and surplus liquidity towards productive investment
have played a critical role in economic development and formation of capital
(Donyaei et al.,2011). In fact, people by investment in successful manufacturing,
business and commercial units may achieve their expected profit (Madura 2006).
Development of stock exchange and OTC has resulted in generation and
expansion of financial services which at different levels provide investors with
consultation services and rank companies and stock exchanges (O'Hara &
Vetere,1993).
1 Assistant Professor,Financial Management Department, University of Sistan and Baluchestan,Iran. 2 Associate Professor,Management Department, University of Isfahan, Isfahan, Iran. 3 Ph.D. Candidate in Business Administration,Faculty of Economic Sciences, University of Isfahan, Iran
M. E. Ezazi, S. Ketabi and S. H. Hosseini
64
Ranking can reveal weaknesses and strengths of the companies as well as
opportunities and threats for them. In fact, it is a full-length mirror reflecting
their state of affairs. This tool has very crucial role in decisions regarding
companies' trading, investments and financing (Conner, 1973).In developed
countries, ranking institutes provide a list of superiors firms but in Iranian capital
market, the prevalent and valid ranking is ranking of the stock exchange which
concerns the top 50 listed companies in Tehran Stock Exchange and based on a
combination of shares’ liquidity, a firm’s impact on the market and its situation
in terms of financial ratio superiority is periodically assessed in the framework of
the following triple criteria and a hexonal of indicators using harmonic mean: a)
Amount of share trading in the trading hall includes number and value of traded
shares. b) Share trading frequency in the trading hall includes number of days
and trading times. c) Indicator’s scale variables of impact on the market include
mean number of issued shares and mean current value of firm’s share during the
under study period. In this research, for prioritization and ranking of the top-50
listed companies based on their financial ratios and then comparing it with the
ranking of the stock exchange, (FAHP) technique in the hand of each key
indicator (liquidity, leverage, operation and profitability ratios) was employed,
while a relative weight was assigned to each sub-indicator. Next, using
Technique for Order Preferences by Similarity Ideal Solution (FTOPSIS) the
under study firms were ranked based on each one of these indicators. Finally, the
obtained ranking was compared with the ranking provided by the stock exchange
and based on the stock exchange's indices and then their correlation was
examined. In fact, we will use the FTOPSIS method for final ranking and FAHP
to determine the importance of the criteria in the top-50 listed companies in terms
of liquidity, operational, leverage and profitability ratio.Recently, many
researchers have been used several models and techniques for superior decision-
making models via easy in calculation, using of real data, optimization
capabilities, contingency and others. Purpose of this research is comparison
ranking of the top 50 listed companies on Tehran Stock Exchange based on the
firms’ financial ratios (including liquidity, leverage, activity and profitability
ratios) using FAHP-FTOPSIS method and ranked according to the stock
exchange’s indicators and reveal degree of convergence and correlation between
two ranking methods.
2. Theoretical background thread
Stock Exchange Company is defined as part of the capital market and
economic environment defined and index for assessing community demand
which provides companies financing opportunities to earn a return on that
investment(Keshvari,2008)But it should be noted that investors used many
investigation for evaluation of investment decisions, buy and sell shares of

Ranking Stock Exchange Companies With a Combined Approach …
65
companies. They converted the assets to stocks. The informative entities provide
accurate and relevant information for contribute to the decision (Mohanram,
2005). Investors, managers and providers focused on benchmarks to measure the
performance of business unit and analysis of financial ratios. But, a suitable
method in the first step is evaluating and ranking of companies (Piotroski,2000).
Ranking of companies as mirror view of companies condition plays a crucial
role in decisions relating to trade, investment and corporate finance (Mohanram,
2005).Therefore, in ranking of companies and financial institutions, it should be
used the ranking models based on financial performance. However, it is also
important that suitable ranking models, criteria and mathematical techniques
should be used for this matter. Overall, companies’ ranking showed clear and
useful information about the business and economic activities. Besides, this
subject provides suitable opportunity for investors, managers, creditors, policy
makers, owners, competitors which increased competition in the market and
capital market development and better understanding in financial and economic
structure of industries and enterprises (Thomas,1993).
Studies on indices of successful companies indicate a significant relationship
between firms ranking based on performance measurement criteria and financial
criteria (Johnson &Soenen, 2003).Another study in S&P index revealed that such
factors as share price, sales, and profit margin suggested higher rating of
favorable factors for high ranking firms (Polonchek&Krehbiel, 1994). Following
the prior research, Omran and Ragab (2004) examined presence of a linear
relationship between share return and financial ratios and then investigated
presence of a linear relationship between share return and financial ratios
(Omran&Ragab, 2004) .They found that the ratio return on equity (ROE) was
significant for all models.
Hassanzadeh et al (2010) in their study found that there is a significant
association between firms' financial ratios and bank managers' decision on
granting them credit(Hassanzadeh& et all,2010).Lev and Thiagrajan (1993)
following Penman's studies and using financial ratios concluded that fundamental
signals are associated to share return(Lev & Thiagrajan,1993).In addition, recent
findings suggest that although financial information plays a crucial role in
prediction of return on investment (ROI), yet the effect of each financial factor
depends on market condition and under this condition this effect is not
stable(Knif& Miranda,2000).Besides, other studies indicate that financial
statements and financial ratios are used for distinction of successful companies
from unsuccessful ones (Piotroski,2000;Mohanram,2005;Michou,2007). Their
results indicate that companies with a higher book-to- market value have a higher
return on average.

M. E. Ezazi, S. Ketabi and S. H. Hosseini
66
3. Research Methodology:
This research is of descriptive-correlation type in which top-fifty listed
companies for the period 2009-2011 were examined by census. The research
statistical data was gathered by referring to the Securities and Exchange
Organization (SEO) and using Rahavard-e-Novin software. The top-50 listed
companies on TSE are presented in the table in each one of the under study years
according to their industry.
Table 1. Top-50 listed companies on tse in each one of the under study
years per industry
Industry type 2013-14
Financial brokers, investment & holding 19
Cement, lime, chalk & metal ore extraction 6
Automobile manufacturing & base metals 18
Food and chemical products 4
Pharmaceutical materials& products 3
Miscellaneous industries 50
Total (Number) 50
In present research, for the purpose of ranking based on financial ratios, a
questionnaire was composed by means of which weight of financial ratio in the
ranking is obtained. Once the questionnaire's validity has been confirmed, its
reliability using inconsistency rate was found to be 0.06 which was smaller than
0.1 and hence approved. Next, the questionnaire was handed out to 20 experts
and respective officials of the capital market as well as professors of finance and
accounting from various universities and they were asked to give their opinion on
the question as to what extent each one of the financial ratios should be
considered as a critical indicator in firms ranking. Given the type, purpose,
hypotheses and questionnaire of the research, a 1-to-9-hour scale was employed
to form the matrix of paired comparisons in order to evaluate weight of the
indicators and to rank companies using FAHP and FTOPSIS techniques. In the
next step, usingFAHP technique and Expert Choice software, the indicators were
assigned weight and then profiting from FTOPSIS technique under TOPSIS
(2005) software the firms were ranked.The next step uses the FAHP technique to
help software EXCEL, weighted indices, and then the companies were rated by
FTOPSIS techniques.
Weight ratio FAHP technique: For weight maintenance and generalization of the experts involved in the four
financial ratios in present study, it applied the fuzzy analytic hierarchy process
(FAHP). In this investigation, firstly the comments of several of the teachers
involved in the capital markets were used. Then, after calculating of arithmetic
mean, paired comparison matrix was achieved (Table.2). After the modeling and

Ranking Stock Exchange Companies With a Combined Approach …
67
development of decision tree (hierarchical structure), paired comparisons matrix
indicators (financial ratios) were prepared based on importance and priority of
index. Inconsistency rate of matrix was calculated and finally due to priority and
ranking of the top five industries, the relative weight index in EXCEL software
was determined as follows:
Table 2. Matrix of paired comparisons of research's chief criteria in expert choice
Chief criteria Liquidity ratio operational ratio Leverage ratio Profitability ratio
Liquidity ratio (1,1,1) (2,2/5,3) (1,3/2,2) (1,3/2,2)
operational ratio ( 1/3 ،2/5 ،1/2) (1,1,1) (2/5,1/2,2/3) (1/2, 2/3,1)
Leverage ratio (1/3,2/3,1) 5/2)،2 ،3/2 ) (1,1,1) (1,3/2,2)
Profitability ratio (1/3,2/3,1) (1,3/2,2) (1/2, 2/3,1) (1,1,1)
First step) for each of the paired comparisons matrix rows that have been
prepared so that the SK is a triangular fuzzy number is calculated as follows:
0.044 0.053 0.072
Sk
5.000 6.500 8.000
S1 0.221 0.344 0.576
2.233 2.567 3.167
S2 0.099 0.136 0.228
3.833 5.167 6.500
S3 0.169 0.273 0.468
2.833 4.667 5.000
S4 0.125 0.247 0.360
S1=(5, 6.5, 8) *(0/044, 0/053, 0/072)=(.221, .344, .576)
S2=(2.23, 2.56, 3.16)*( 0/044, 0/053, 0/072)=(.099, .136, .228)
S3=(3.83, 5.16, 6.5)*( 0/044, 0/053, 0/072)=(.169, .273, .468)
S4=(2.83, 4.66, 5)*( 0/044, 0/053, 0/072)=(.125, .247, .360)
step2) Calculation of Si, the magnitude relative to each other can be obtained as
follows:
So that:
W'(xi) =Min{V(Si ≥ Sk)}, k=1،2،...؛n

M. E. Ezazi, S. Ketabi and S. H. Hosseini
68
Table 3: Calculation of magnitude compared to the Si
Si Sj S1 S2 S3 S4
S1 1.000 1.000 1.000
S2 0.034 0.299 0.481
S3 0.778 1.000 1.000
S4 0.589 1.000 0.878
V (S1≥S2) = 1 V (S1≥S3) = 1
V (S1≥S4) = 1 V (S2≥S1) = 034./
V (S2≥S3) = 299./ V (S2≥S4) = 481./
V (S3≥S1) = 778./ V (S3≥S2) = 1
V (S3≥S4) = 1 V (S4≥S1) = 589./
V (S4≥S2) = 1 V (S4≥S3) = 878./
Step.3) Calculation of the matrix weights in pair wise comparisons according to
step.2
Weighted non-norm indicators
S1>Si 1.000
S2>Si 0.034
S3>Si 0.778
S4>Si 0.589
Finally, inadequate weight vector of the non-normalized indices were determined
by:
W = (1, ./ 034 , ./ 778, ./ 589) Step.4) Normalizing of weight vector value which achieved in step.3 (Normalized
weight vector values is showed in Table.3) : wi =wi
′
∑ w′
Based on the above calculations, cash-weight ratio has highest impotency as the
top priority (0.417). Gearing weight ratio is in second priority (0.324). Activities
ration is in lowest weight (0.014). The multi-parameters of the fuzzy weights
were shown in table 4-7.
Table4. the weight of financial and stock market indices as fuzzy (effective indices,
weighted fuzzy preference)
index of preference Fuzzy weighted Priority
Liquidity ratio 0.417 1
operational ratio 0.014 2
Leverage ratio 0.324 3
Profitability ratio 0.245 4

Ranking Stock Exchange Companies With a Combined Approach …
69
Table 5. paired comparisons matrix based on sub liquidity ratio
Liquidity ratio sub Instant Ratio Current Ratio
Instant Ratio (1,1,1) (2/5,1/2,2/3)
Current Ratio (3/2 ، 2 ،5/2 ) (1,1,1)
W = (.126, .873)
Table6. paired comparisons matrix based on sub operational ratio
sub operational ratio Period of receiving claims Inventory flow Assets flow
Period of receiving claims (1,1,1) ( 1 ،3/2 ، 2) (1/2,2/3,1)
Inventory flow (1/2,2/3,1) (1,1,1) (2/5,1/2,2/3)
Assets flow ( 1 ،3/2 ، 2) (3/2 ، 2 ،5/2 ) (1,1,1)
𝑤𝑖 =𝑤𝑖
′
∑ 𝑤′ W' = (.617, .173, 1) W = (.345, .096, .558)
Table 7. the weight of sub-criteria and prioritization of activities
Priority Fuzzy weighted Components of risk assessment row
2 .345 Period of receiving claims 1
3 .096 Inventory flow 2
1 .558 Assets flow 3
Table8. paired comparisons matrix based on sub Leverage ratio
sub Leverage ratio Debt to equity ratio Debt ratio
Debt to equity ratio (1,1,1) ( 1 ،3/2 ، 2)
Debt ratio (1/2,2/3,1) (1,1,1)
W = (.6580, .315)
Table9. paired comparisons matrix based on Sub Profitability ratio
Sub Profitability ratio Profit margin ROE ROI ROA
Profit margin (1,1,1) (3/2 ، 2 ،5/2 ) (3/2 ، 2 ،5/2 ) (1 ، 3/2 ،2 )
ROE (2/5,1/2,2/3) (1,1,1) (1/2,2/3,1) (1/2,2/3,1)
ROI (2/5,1/2,2/3) ( 1 ،3/2 ، 2) (1,1,1) ( 1 ،3/2 ، 2)
ROA (1/2,2/3,1) ( 1 ،3/2 ، 2) (1/2,2/3,1) (1,1,1)
Table10. fuzzy decision matrix
index of preference Fuzzy weighted Priority
Profit margin .441 1
ROE .074 4
ROI .274 2
ROA .211 3

M. E. Ezazi, S. Ketabi and S. H. Hosseini
70
decision matrix phase Scale, the harmonious Scale Matrix, finding the positive
and negative ideal, the ideal spacing options (indexes ranked by FTOPSIS).
Fuzzy TOPSIS (FTOPSIS) method:
The multi-attribute decision methods of Fuzzy AHP and Fuzzy TOPSIS form
the theoretical basis of the present research for achieving the stated objectives.
This model was initially presented by Hwang and Yoon (1981), and with
undergoing some modifications subsequently, it has become one of the best and
most accurate multi-attribute decision methods in use among planners. This
technique was founded on stronger theoretical principles relative to other
comparable methods, so as many problems of methods such as the Numerical
Taxonomy were resolved in the new method. According to the conceptual
framework of this technique, first, the positive ideals (the most efficient state)
and the negative ideals (the most inefficient state) are calculated for each
indicator and then, distance of each option from positive and negative ideals is
calculated. The selected option is the option which has the least distance from the
positive ideals and the greatest distance from the negative ideals. This technique
is so designed that allows controlling for the type of indicators in terms of their
positive or negative effect on the end goal of decision making and including
weight and significance level of each indicator in the model. For application of
Fuzzy TOPSIS technique for the purpose of ranking and choice of the best option
from among the available options, the following steps need to be taken in
succession (Knif & et all,2000).
Forming the decision matrix and weight assignment to indicators;
Quantification of decision matrix and setting up the unscaled matrix;
Finding the positive and negative ideals in Fuzzy TOPSIS (with positive ideal
being (1,1,1) and the negative ideal (0,0,0);
Finding distance of each indicator from ideal answers;
Ranking Stock Exchange Companies With a Combined Approach …
71
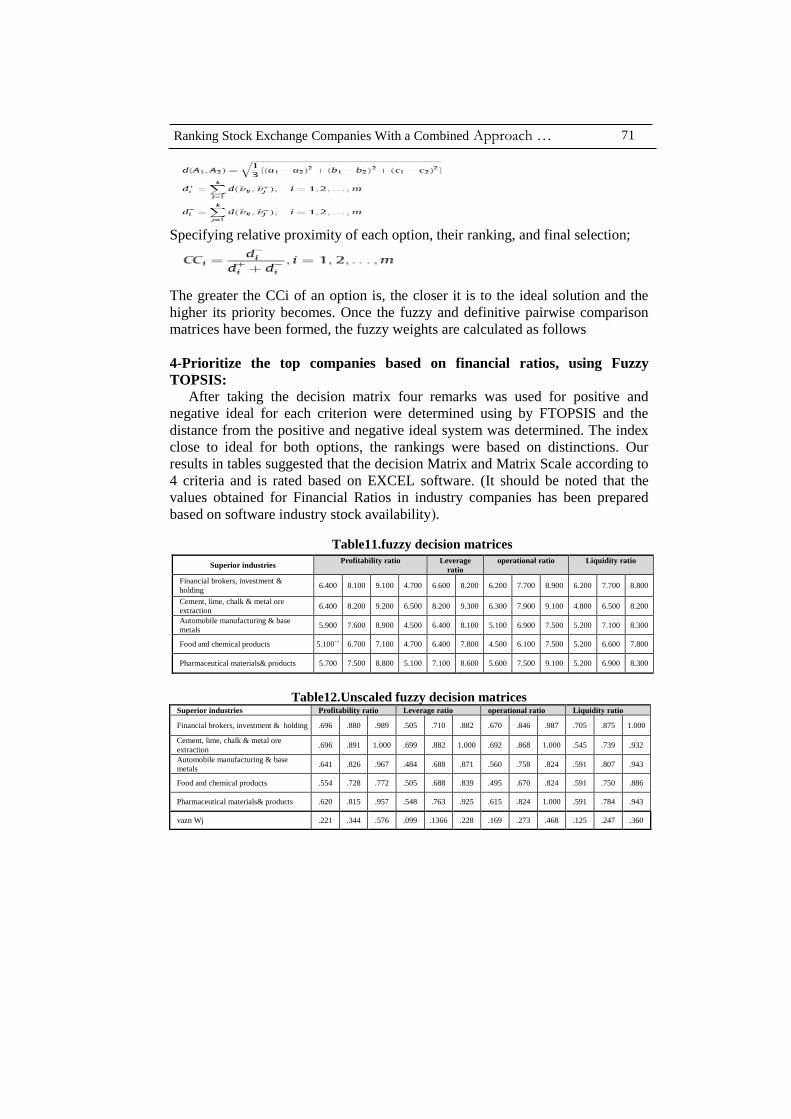
Specifying relative proximity of each option, their ranking, and final selection;
The greater the CCi of an option is, the closer it is to the ideal solution and the
higher its priority becomes. Once the fuzzy and definitive pairwise comparison
matrices have been formed, the fuzzy weights are calculated as follows
4-Prioritize the top companies based on financial ratios, using Fuzzy
TOPSIS:
After taking the decision matrix four remarks was used for positive and
negative ideal for each criterion were determined using by FTOPSIS and the
distance from the positive and negative ideal system was determined. The index
close to ideal for both options, the rankings were based on distinctions. Our
results in tables suggested that the decision Matrix and Matrix Scale according to
4 criteria and is rated based on EXCEL software. (It should be noted that the
values obtained for Financial Ratios in industry companies has been prepared
based on software industry stock availability(.
Table11.fuzzy decision matrices
Table12.Unscaled fuzzy decision matrices Liquidity ratio operational ratio Leverage ratio Profitability ratio Superior industries
1.000 .875 .705 .987 .846 .670 .882 .710 .505 .989 .880 .696 Financial brokers, investment & holding
.932 .739 .545 1.000 .868 .692 1.000 .882 .699 1.000 .891 .696 Cement, lime, chalk & metal ore
extraction
.943 .807 .591 .824 .758 .560 .871 .688 .484 .967 .826 .641 Automobile manufacturing & base
metals
.886 .750 .591 .824 .670 .495 .839 .688 .505 .772 .728 .554 Food and chemical products
.943 .784 .591 1.000 .824 .615 .925 .763 .548 .957 .815 .620 Pharmaceutical materials& products
.360 .247 .125 .468 .273 .169 .228 .1366 .099 .576 .344 .221 vazn Wj
Liquidity ratio operational ratio Leverage
ratio
Profitability ratio Superior industries
8.800 7.700 6.200 8.900 7.700 6.200 8.200 6.600 4.700 9.100 8.100 6.400 Financial brokers, investment &
holding
8.200 6.500 4.800 9.100 7.900 6.300 9.300 8.200 6.500 9.200 8.200 6.400 Cement, lime, chalk & metal ore
extraction
8.300 7.100 5.200 7.500 6.900 5.100 8.100 6.400 4.500 8.900 7.600 5.900 Automobile manufacturing & base
metals
7.800 6.600 5.200 7.500 6.100 4.500 7.800 6.400 4.700 7.100 6.700 5.100`` Food and chemical products
8.300 6.900 5.200 9.100 7.500 5.600 8.600 7.100 5.100 8.800 7.500 5.700 Pharmaceutical materials& products

M. E. Ezazi, S. Ketabi and S. H. Hosseini
72
Table13.Weighted unscaled matrices Liquidity ratio operational ratio Leverage ratio Profitability ratio Superior industries
.360 .216 .088 .458 .231 .113 .201 .097 .050 .570 .303 .154 Financial brokers, investment &
holding
.335 .182 .068 .468 .237 .117 .228 .120 .069 .576 .307 .154 Cement, lime, chalk & metal ore
extraction
.340 .199 .074 .386 .207 .095 .199 .094 .048 .557 .284 .142 Automobile manufacturing & base
metals
.319 .185 .074 .386 .183 .084 .191 .094 .050 .445 .251 .123 Food and chemical products
.340 .194 .074 .468 .225 .104 .211 .104 .054 .551 .280 .138 Pharmaceutical materials& products
Table 14.Finding the negative& positive ideals 1 1 1 1 1 1 1 1 1 1 1 1 di+
0 0 0 0 0 0 0 0 0 0 0 0 di-
Table 15. Distance of options from the ideal (the model ranking based on
TOPSIS method) Superior industries di- di+ di-+di+ Cl = d- / (d- + d*) Priority
Financial brokers, investment & holding 1.066 3.099 4.165 .256 2
Cement, lime, chalk & metal ore extraction 1.075 3.093 4.169 .258 1
Automobile manufacturing & base metals .990 3.166 4.156 .238 4
Food and chemical products .898 3.236 4.133 .217 5
Pharmaceutical materials& products 1.040 3.133 4.173 .249 3
Table 16. Correlations between the rankings of TSE and FAHP-FTOPSIS
approach based on financial ratios Correlations
Discussion:
Firms ranking, while promoting competition and market efficiency, is a useful
guide for investors and market operators. The results obtained from study of
correlation between the ranks made by the financial ratios using FAHP-FTOPSIS
combined approach and those by indicators of the stock exchange regarding top-
50 listed companies in the years 20013-2014indicate that between these two
types of ranking, in the sense that contrary to our expectation, the higher ranked
companies on the stock exchange, were not ranked as much higher based on the
financial ratios. In general, it can be said that there is no significant association
between ranking of the top-50 TSE listed companies based on financial ratios in
rank1 rank2
rank1
Pearson Correlation 1 .600
Sig. (2-tailed) .285
N 5 5
rank2
Pearson Correlation .600 1
Sig. (2-tailed) .285 N 5 5

Ranking Stock Exchange Companies With a Combined Approach …
73
FAHP-FTOPSIS combined approach and their ranking based on the indicators of
the stock exchange and the presented items in firms' financial statements are not
regarded an adequate approximation for their estimation of their excellence. Result:
Firms and industries ranking is of high importance in decisions regarding
shares trading, investment and finance of firms. In this study, the top five
industries introduced by the Tehran Stock Exchange is ranked by a combined
approach based on FAHP-FTOPSIS four financial ratios (liquidity, activity,
leverage and profitability) during the year 2014.Generally, it suggested that there
is no significant in the ranking of the top five industries listed with a combined
approach based on the financial ratios (FAHP–FTOPSIS) and indicators ranking
is based on the exchange relationship. Besides, based on presented results in the
financial statements of companies, there is relatively poor correlation for
superiority in the stock. In order to similar research, Johnson (2003) found a
significant correlation between the rankings of firms based on performance and
financial criteria.Furthermore, Hasanzadeh et al (2010) found a significant
positive relationship between financial ratios of companies and executives in the
credit decision of the bank .Anvari Rostami and Khotan Lu (2006) showed a
weak correlation between the two typically methods (rank companies based on
stock indices and accounting profitability ratios) confirms a significant
correlation between the rankings based on financial ratios and stock market
indicators.
Suggestion:In similar with our results, the following suggestions are offered:
Using of actual financial indicators companies and the most effect in
rankings
Setting up electronic and on-line system to provide in reasonable
investment based on moment rating
and organization of independent rating agencies in ranking affairs

M. E. Ezazi, S. Ketabi and S. H. Hosseini
74
Refrence:
1-Babic, Z., &Plazibat, N. (1998).Ranking of enterprises based on
multicriterialanalysis.International journal of production economics, 56-57, 29-
35.http://dx.doi.org/10.1016/S0925-5273(97)00133-3
2-Conner, M. C. (1973).On the Usefulness of Financial Ratios to
Investors.Journal of Accounting Review,48(2), 551-556.
http://dx.doi.org/10.1111/j.1468-5957.1987.tb00108.x
3- Hassanzadeh, R., Nezhadirani, F., &lootfelahihagi, M. (2010)The comparative
investigation of financial effects on decision-Making of bank manager.Journal of
Beyond Management,3(11),185-211.
4-Johnson, R., &Soenen, L. (2003).Indicators of Successful Companies.European
Management Journal, 21(3), 364-369.http://dx.doi.org/10.1016/S0263-
2373(03)00050-1
5- Keshvari Abolfazl and Alirezaee Mohammad Reza. Ranking Efficient Units
by Weakened References in Data Envelopment Analysis. International Journal of
Engineering Science. 2008. 19 (7): 75-81.
6- Knif, J., Hogholm, K.,& Miranda, F. G. (2000).Ranked market information as
a stock return indicator.The Finnish Journal of Business Economics, 2, 233-244.
7- Lev, B., &Thiagrajan, S.(1993).Fundamental Information Analysis. Journal of
Accounting Research, 31(2), 190-215.http://dx.doi.org/10.2307/2491270.
8- Li, H., & Sun, J. (2008).Ranking-order case-based reasoning for financial
distress prediction.Knowledge-Based Systems,21, 868–878.
http://dx.doi.org/10.1016/j.knosys.2008.03.047
9- Michou, M. (2007).Investing: The Use of Financial Statements to Separate
Winners from Losers.Business School of Edinburgh, University of Edinburgh,
United Kingdom.
10- Mohanram, P.(2005).Separating Winners from Losers among LowBook-to-
Market Stocks using Financial Statement Analysis.Review of Accounting
Studies, 10, 133-170. http://dx.doi.org/10.1007/s11142-005- 1526- 4
11- O'Hara, T. H., &Vetere, J. (1993).An analysis of the Standard and Poor's
Stock Appreciation Ranking System.Journal of Economics and Business, 45(2),
179-182. http://dx.doi.org/10.1016/0148-6195(93) 90031-I
12- Omran, M., &Ragab, A. (2004) Linear versus non-Linear Relationship
between Financial Ratios and Stock Return: An Empirical Evidence from
Egyptian Firms.Review of Accounting and finance, 3(2), 84-
102.http://dx.doi.org/10.1108/eb043404

Ranking Stock Exchange Companies With a Combined Approach …
75
13- Piotroski, J. I. (2000). Value Investing: the Use of Historical Financial
Statement Information to Separate Winners from Losers. Journal of Accounting
Research 38, 1-41. http://dx.doi.org/10.1080/1351847070170 5777
14- Polonchek, J., &Krehbiel, T. (1994). Price and Volume Effects Associated
with Changes in the Dow Jones Averages. The Quarterly Review of Economics
and Finance, 34(4), 305-316. http://dx.doi.org/10.1016/ 1062-9769(94)90016-7
15- Thomas O'Hara H. and Vetere J. An analysis of the Standard and Poor's
Stock Appreciation Ranking System. Journal of Economics and Business. 1993.
45 (2): 179-182.