
Range of human hearing: 20 Hz – 20,000 Hz Sensitivity Threshold for hearing: 1 10 -12 Watt/m 2...
41
nge of human hearing: 20 Hz – 20,000 Hz nsitivity reshold for hearing: 110 -12 Watt/ ncrease of pressure on eardrum 0.00003 Pascals (N/m 2 ) above normal atmospheric pressure: 1 atm = 101,300 Pa ibrating air molecules displaced n amplitude of ~110 -10 m / 10 the diameter of an air molecul reshold for pain: 1 Watt/ 9 Pa above atmospheric pressure mplitude of vibrations 110 -5 m ot perceived as 10 12 times “as loud”
-
date post
20-Dec-2015 -
Category
Documents
-
view
214 -
download
0
Transcript of Range of human hearing: 20 Hz – 20,000 Hz Sensitivity Threshold for hearing: 1 10 -12 Watt/m 2...

Range of human hearing:
20 Hz – 20,000 Hz
SensitivityThreshold for hearing: 110-12 Watt/m2
•Increase of pressure on eardrum0.00003 Pascals (N/m2) abovenormal atmospheric pressure: 1 atm = 101,300 Pa
•vibrating air molecules displaced by an amplitude of ~110-10 m 1/10 the diameter of an air molecule!
Threshold for pain: 1 Watt/m2
•29 Pa above atmospheric pressure•Amplitude of vibrations 110-5 m
Not perceived as 1012 times “as loud”

Moonlight ~ foot-candle110
working conditions 40-50 ft-candles
outdoors at noon 10,000 ft-candles (sunlight)
The human eye also responds logarithmically

10
9
8
7
6
5
4
3
2
1
0

10
9
8
7
6
5
4
3
2
1
0
300000
200000
100000
0

10
9
8
7
6
5
4
3
2
1
0
300000
200000
100000
0
10
9
8
7
6
5
4
3
2
1
0
300000
200000
100000
0

10
9
8
7
6
5
4
3
2
1
0
300000
200000
100000
0

10
9
8
7
6
5
4
3
2
1
0
100000
10000
1000
100
10
1
0.1
0.01

1
10
100
1000
10000
100000
1234567891011121314151617181920212223242526272829303132333435363738394041424344454647484950
0
5000
10000
15000
20000
25000
12345678910111213141516171819202122232425262728293031323334353637383940414243444546474849500 1 2 3 4 5
0 1 2 3 4 5
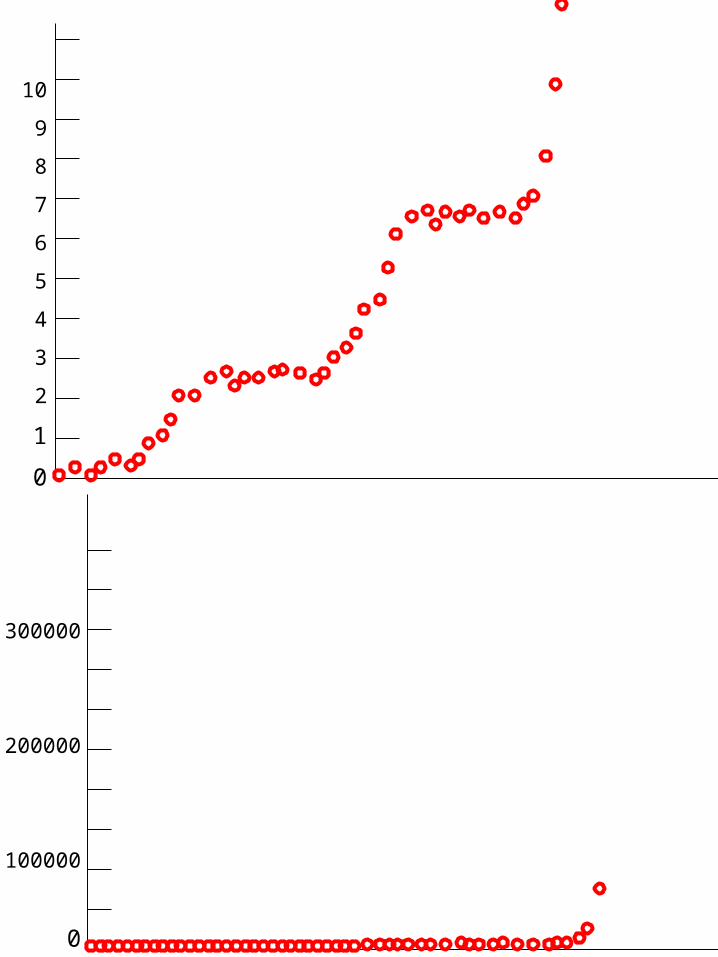
truly exponential graphs
become straight linesin a logarithmic plot!

1
10
100
1000
10000
100000
1234567891011121314151617181920212223242526272829303132333435363738394041424344454647484950
0
5000
10000
15000
20000
25000
12345678910111213141516171819202122232425262728293031323334353637383940414243444546474849500 1 2 3 4 5
0 1 2 3 4 5
truly exponential graphs
become straight linesin a logarithmic plot!
Describes howrapidly the slopein the original plot is changing

What is the world’s most abundant element?

Oxygen O 46.6
Silicon Si 27.7
Aluminum Al 8.1
Iron Fe 5.0
Calcium Ca 3.6
Sodium Na 2.8
Potassium K 2.6
Magnesium Mg 2.1
Subtotal 98.5
Titanium Ti 0.4
Hydrogen H 0.1
Phosphorus P 0.1
Manganese Mn 0.1
Sulfur S 0.05
Carbon C 0.03
Total 99.3
CRUSTAL ABUNDANCE OF THE ELEMENTS (by % weight)

Average composition of clean, dry air at the Earth's surface
ConstituentSymbol
Molecular Weight
Molecular fraction
Fraction by mass
Nitrogen Oxygen Argon Carbon dioxide Neon Helium Methane Krypton Nitrous oxide
Hydrogen Ozone
N2 O2 Ar CO2
Ne He CH4 Kr N2O H2 O3
28 32 40 44
20 4 16 84 44 2 48
78.09 % 20.95 % 0.93 % 320 ppm
18 ppm 5.2 ppm 2.9 ppm 1.1 ppm 0.5 ppm 0.5 ppm 0.01 ppm
75.5% 23.2 % 1.3 % 486 ppm
12 ppm 0.7 ppm 1.6 ppm 3.2 ppm 0.8 ppm 0.03 ppm 0.02 ppm
Water, moisture
H2O 18 - -
Source: Garrels, MacKenzie and Hunt: Chemical cycles. 1975
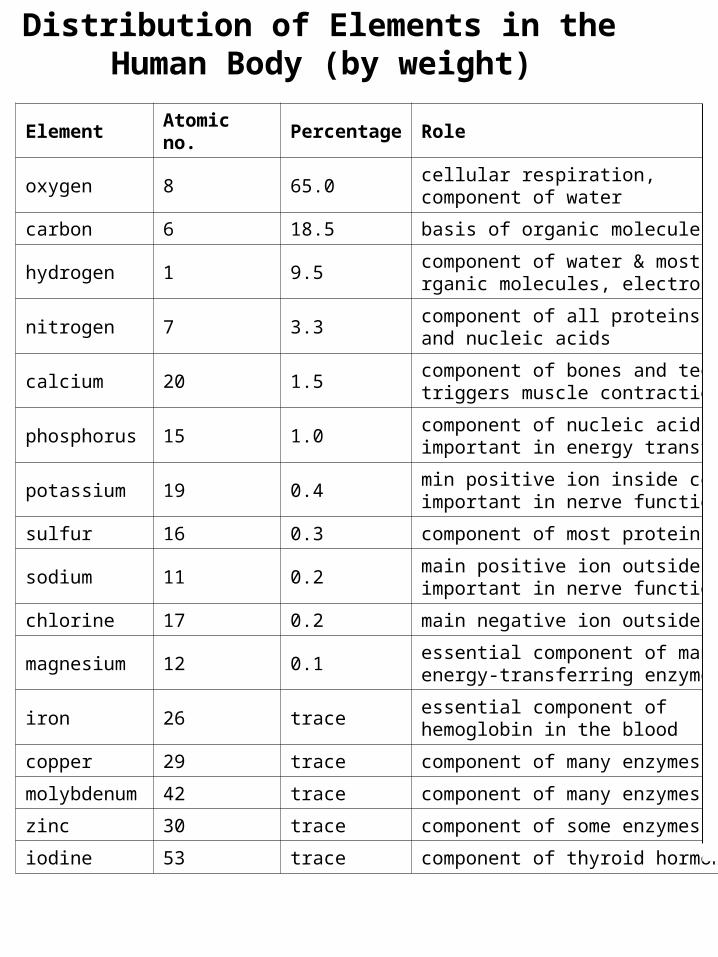
Distribution of Elements in the Human Body (by weight)
Element Atomic no. Percentage Role
oxygen 8 65.0cellular respiration, component of water
carbon 6 18.5 basis of organic molecules
hydrogen 1 9.5component of water & most organic molecules, electron carrier
nitrogen 7 3.3component of all proteins and nucleic acids
calcium 20 1.5component of bones and teeth, triggers muscle contraction
phosphorus 15 1.0component of nucleic acids, important in energy transfer
potassium 19 0.4min positive ion inside cells, important in nerve function
sulfur 16 0.3 component of most proteins
sodium 11 0.2main positive ion outside cells, important in nerve function
chlorine 17 0.2 main negative ion outside cells
magnesium 12 0.1essential component of many energy-transferring enzymes
iron 26 traceessential component of hemoglobin in the blood
copper 29 trace component of many enzymes
molybdenum 42 trace component of many enzymes
zinc 30 trace component of some enzymes
iodine 53 trace component of thyroid hormone


Solar system massesSun 1.981030 kgJupiter 1.901027 kgEarth 5.981024 kg

Absorption “lines”
• First discovered in spectrum
of Sun (by an imaging scientist
named Fraunhofer)• Called “lines” because they
appear as dark lines super-
imposed on the rainbow of the
visible spectrum

Sun’s Fraunhofer absorption lines
(wavelengths listed in Angstroms; 1 A = 0.1 nm)

The Solar Spectrum

Emission line spectra
Insert various emission line spectra here

Emission line images
Planetary nebula NGC 6543
Green: oxygen; red: hydrogen(blue: X-rays)
Orion Nebula

The optical emission line spectrum of a young star

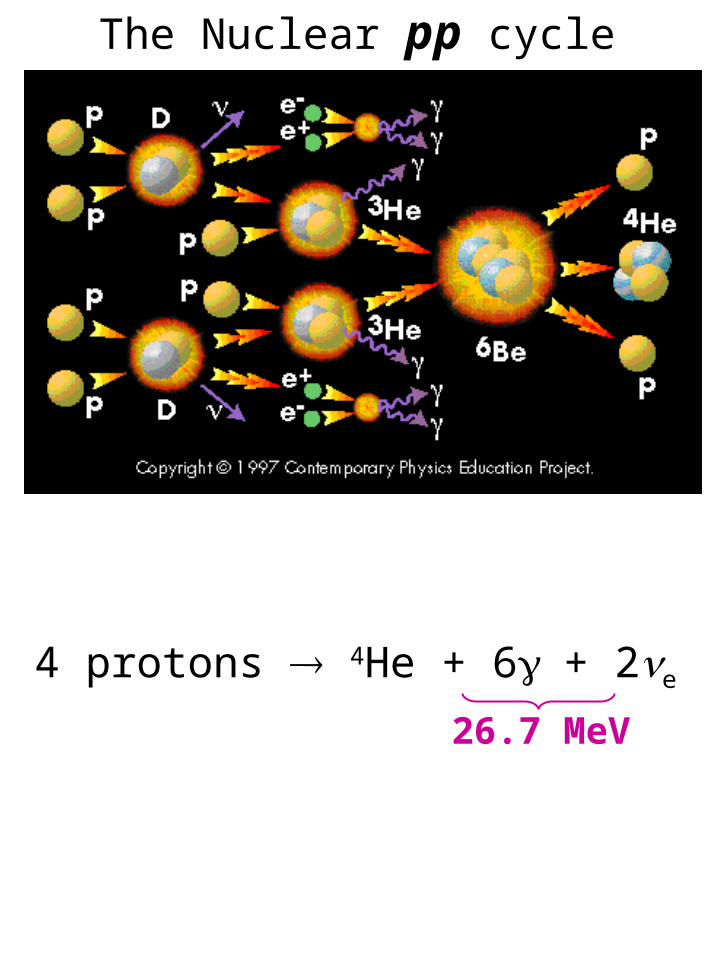
The Nuclear pp cycle
4 protons 4He + 6+ 2e
26.7 MeV

July 1969 Apollo 11 astronauts trap cosmic ray particles on exposed aluminum foil, returned to earth for analysis of its elemental & isotopic composition. With no atmosphere or magnetic field of its own, the moon’s surface is exposed to a constant barrage of particles.

March 3, 1972 Pioneer 10 launched -on its flyby mission, studies Jupiter's magnetic field and radiation belts.
December 1972 Apollo 17’s lunar surface cosmic ray experiment measured the flux of low energy particles in space (foil detectors brought back to Earth for analysis.
October 26, 1973 IMP-8 launched. Continues today measuring cosmic rays, Earth’s magnetic field, and the near-Earth solar wind from a near-circular, 12-day orbit (half the distance to the moon).
October 1975 to the present GOES (Geostationary Orbiting Environmental Satellite) An early warning system which monitors the Sun's surface for flares.
1977 The Voyager 1 and 2 spacecraft are launched. Each will explore acceleration processes of charged particles to cosmic ray energies.

August 31, 1991 Yohkoh spacecraft launched - Japan/USA/England solar probe - studied high-energy radiation from solar flares.July 1992 SAMPEX (Solar Anomalous and Magnetospheric Particle Explorer) in polar orbit. By sampling inter- planetary & magnetospheric particles, contributes to our understanding of nucleosynthesis and the acceleration of charged particles.
July 1992 IMAX (Isotope Matter-Antimatter eXperiment) balloon- borne superconducting magnetic spectrometer measured the galactic cosmic ray abundances of protons, anti-protons, hydrogen, and helium isotopes.
August 25, 1997 Advanced Composition Explorer (ACE) was launched!


Hydrogen (H) 1 1.00 640
Helium (He) 2 6.8 10-2 94
Lithium, beryllium, boron 2.6 10-9 1.5
Carbon, Nitrogen, Oxygen 1.2 10-3 6
Iron (Fe) 26 3.4 10-5 0.24
All heavier atoms 1.9 10-6 0.13
ElementAtomic
Number (Z)
Solar SystemComposition
(relative number of atoms)
PrimaryCosmic Ray
Flux(particles/m-2 sec)


50m
Cosmic ray strikes a nucleuswithin a layer of
photographicemulsion

Primary cosmic ray
Mostly photons, electrons and muons at Earth’s surface

A 1019 eV Extensive Air Shower
100 billion particles
at sea level
89% photons10% electrons~1% muons
12 km
6 km6 km

The Cosmic Ray Energy Spectrum
(1 particle per m2-sec)
(1 particle per m2-year)
(1 particle per km2-year)
Cosmic Ray Flux
Energy (eV)
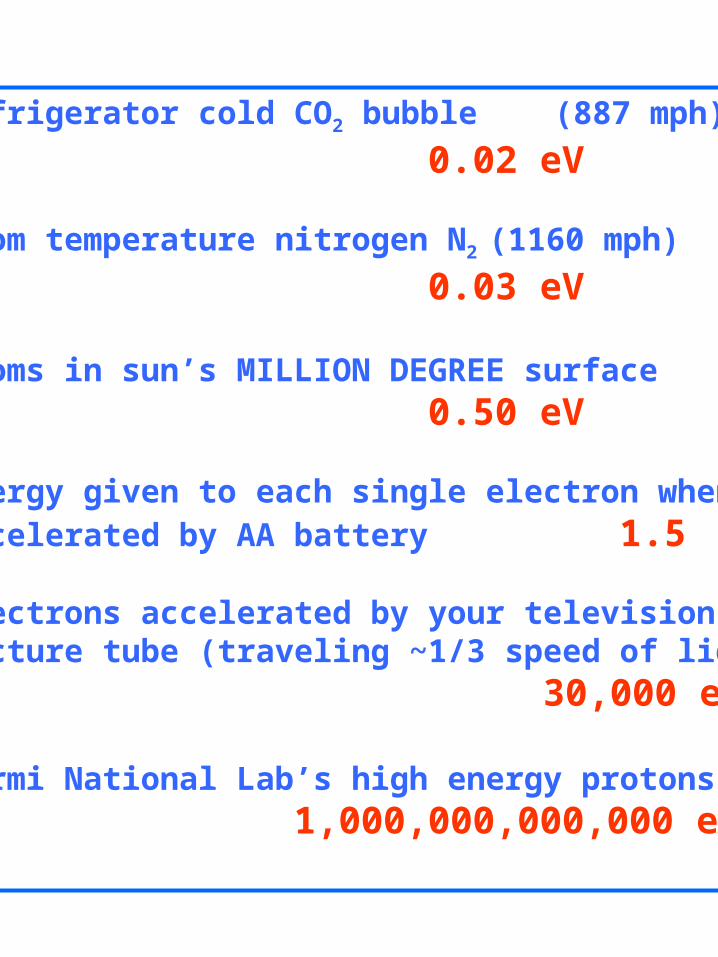
Refrigerator cold CO2 bubble (887 mph)
0.02 eV
Room temperature nitrogen N2 (1160 mph)
0.03 eV
Atoms in sun’s MILLION DEGREE surface0.50 eV
Energy given to each single electron whenaccelerated by AA battery 1.5 eV
Electrons accelerated by your televisionpicture tube (traveling ~1/3 speed of light)
30,000 eV
Fermi National Lab’s high energy protons 1,000,000,000,000 eV

Superball bounced over your house 4 x 10¹⁷ eV
Pitched baseball 4 x 10²⁰ eV
Slammed hockey puck 1 x 10²¹ eV
Recall: 1 joule = 6.2 x 10¹⁸ eV
The highest energy Cosmic Rays areSUBATOMIC particles carrying theenergy of MACROSCOPIC objects!
4 x 10²¹ eV = 60 joules

The Cosmic Ray Energy Spectrum
FERMILAB’s protonsFERMILAB’s protons
Bounced Superball
Bounced Superball
Pitched baseballPitched baseball
Hockey PuckHockey Puck
Energy (eV)

Two possible sources of cosmic rays
Colliding galaxies
Active galacticnucleus

GZK Cutoff
1966 - K. Greisen - G.T.Zatsepin & V.A.Kuz’min
showed the recently discovered cosmic microwave background radiation (CMBR)effectively makes the universe opaque tosufficiently high energy cosmic particles.

GZK Cutoff
For example:
p *+0 p
++ n
and similar resonances yield attenuation lengths mere 10s of Mega parsecs for cosmic ray protons with E>1019 eV.
Center of (our) Virgo supercluster is approximately 20 Mpc away
All E>1019 eV primaries must originate within 100 Mpc of the earth
1966 - K. Greisen - G.T.Zatsepin & V.A.Kuz’min
p

Energy [eV]
ICRC2001 news
AGASA: 717
HiRes: 7 2
events above 1020eV
AGASA


