RANGE M P OF THE D T 2001-2005 SUMMARY REPORT MONITORING OF THE MOJAVE POPULATION OF THE DESERT...
96
RANGE-WIDE MONITORING OF THE MOJAVE POPULATION OF THE DESERT TORTOISE: 2001-2005 SUMMARY REPORT U.S. FISH AND WILDLIFE SERVICE DESERT TORTOISE RECOVERY OFFICE OCTOBER 24, 2006
Transcript of RANGE M P OF THE D T 2001-2005 SUMMARY REPORT MONITORING OF THE MOJAVE POPULATION OF THE DESERT...

RANGE-WIDE MONITORING OF THE MOJAVE POPULATION OF THE DESERT TORTOISE: 2001-2005 SUMMARY REPORT
U.S. FISH AND WILDLIFE SERVICE DESERT TORTOISE RECOVERY OFFICE
OCTOBER 24, 2006

DESERT TORTOISE MONITORING COMMITTEE
This report was prepared by the Desert Tortoise Monitoring Committee (listed in alphabetical order):
Linda J. Allison U.S. Fish and Wildlife Service
Reno, Nevada
Roy C. Averill-Murray U.S. Fish and Wildlife Service
Reno, Nevada
Melissa Brenneman TopoWorks
Noblesville, Indiana
P. Stephen Corn U.S. Geological Survey
Missoula, Montana
Clarence Everly Mojave Desert Ecosystem Program
Barstow, California
Jill S. Heaton University of Nevada, Reno
Reno, Nevada
Ronald W. Marlow University of Nevada, Reno
Henderson, Nevada
Philip A. Medica U.S. Geological Survey
Henderson, Nevada
Kenneth E. Nussear U.S. Geological Survey
Henderson, Nevada
C. Richard Tracy University of Nevada, Reno
Reno, Nevada
Recommended Citation: U.S. Fish and Wildlife Service. 2006. Range-wide Monitoring of the Mojave Population of the Desert Tortoise: 2001-2005 Summary Report. Report by the Desert Tortoise Recovery Office, U.S. Fish and Wildlife Service, Reno, Nevada.

Range-wide Monitoring of the Mojave Population of the Desert Tortoise: 2001-2005 Summary
i
EXECUTIVE SUMMARY
The recovery program for the Mojave population of the desert tortoise requires range-wide, long-term monitoring to determine whether recovery goals are met. Specifically, will population trends within recovery units remain stable for a period of 25 years? From 2001 to 2005, we monitored desert tortoise populations within 5 of the 6 recovery units (the Upper Virgin River Recovery Unit has been monitored independently by the Utah Division of Wildlife Resources) using line distance sampling. The area sampled each year varied due to inconsistent funding levels, permitting, and transect selection methods, but we divided the total area within the recovery units into 20 sampling areas based primarily on critical habitat/Desert Wildlife Management Area/Area of Critical Environmental Concern boundaries. This report summarizes the annual density estimates from this effort for each recovery unit, describes the effectiveness of the current monitoring program, and identifies further analyses and recommendations to improve the precision and utility of the program. Training results illustrate initial differences between inexperienced and experienced crews, but show that repeat training is successful in closing that gap. Capture probabilities of tortoises within 2m of the transect centerline exceed 95%, but even after correcting for capture probabilities on the line <1m, field crews slightly underestimated the true density of tortoise models. This suggests that density estimates of live tortoises may by underestimated by 5-10%. Training could be improved by supplementing the current tortoise models to represent a greater size range, and perhaps by alternate layouts. We surveyed from 3,018km of transects in 2001 to 9,099km in 2005, with variation between years resulting from changes in survey technique and available funding. Field workers found 358-627 live tortoises and 875-1,439 shell remains each year. Changes in transect survey techniques resulted in more total observations in 2004-2005 despite generally higher encounter rates in 2001-2003. Estimates of the density of adult tortoises varied among recovery units and years. If this variability is associated with consistent changes between years, then intermediate-length monitoring (i.e., <25 years) may reveal important trends. For instance, considerable decreases in density were reported in 2003 in the Eastern Colorado and Western Mojave recovery units, with no correspondingly large rebound in subsequent estimates. Range-wide densities reported here were 4.99-5.83 tortoises/km2. Tortoises were least abundant in the Northeast Mojave Recovery Unit (0.84–3.01 tortoises/km2), and the highest reported densities occurred in the first year of the project in the Eastern Colorado Recovery Unit (10.80/km2 in 2001). Current results from the range-wide population monitoring program provide a baseline from which recovery criteria for stable populations within recovery units may be measured. The data from the first years of the monitoring program indicate that the power of this program to detect population trends will require active improvement of transect placement, field techniques, and field implementation. Continued improvements in the training program, field preparation, and field coordination will increase initial data quality and reduce the time required for quality

Range-wide Monitoring of the Mojave Population of the Desert Tortoise: 2001-2005 Summary
ii
control. Improved efficiency and consistency in the field will be accomplished by timely completion of study design and data collection refinements. Fully integrating additional elements of monitoring (habitat and threats, management actions, and local research on effectiveness of management actions) with the population monitoring program will provide a comprehensive perspective of recovery. A coordinated effort between the Desert Tortoise Recovery Office and other management agencies to develop a centralized recovery database will facilitate the collection of information necessary to achieve this perspective. Finally, the success of the range-wide monitoring program also depends on developing reliable, adequate, and consistent funding. Rather than developing monitoring based on annual budgeting considerations, this will allow effective planning, contracting, and hiring to be implemented under a long-term study plan. Recommendations 1. The range-wide monitoring program should continue under a formal study plan subject to
scientific review. 2. Refine LDS techniques to improve sampling efficiency and estimates of trends.
a. Investigate sampling levels or stratification needed to maximize precision of estimates.
i. Conduct a retrospective stratified analysis of the 2001-05 data. ii. Evaluate tradeoffs of randomly selecting transect locations each year vs.
establishing permanent transects based on an initial random sample or systematic design.
iii. Investigate factors contributing to aggregated population distribution. iv. Develop a desert tortoise habitat model.
b. Evaluate effects of variation in detection probability between survey teams, time, and space, as well as between tortoises found above ground and below ground.
c. Evaluate effects of variation in G0 across time and space, as well as possibilities for estimating indirectly through models.
d. Investigate the use of covariates, spatial models, adaptive sampling, and other emerging, innovative approaches to distance sampling.
3. Identify methods to estimate occupancy in order to document changes in the distribution of desert tortoises over time.
a. Conduct a retrospective analysis of existing data. b. Develop sampling scheme to incorporate occupancy estimation into range-wide
surveys. 4. Evaluate the spatial scale of the monitoring program.
a. Consider areas not regularly sampled to date. b. Evaluate why the set of randomly placed transects selected for surveys is not reflected
in the non-randomly placed transects that are actually surveyed. c. Incorporate spatial requirements arising from addition of occupancy estimation into
the monitoring program.

Range-wide Monitoring of the Mojave Population of the Desert Tortoise: 2001-2005 Summary
iii
5. Review the habitat/threats data collected in 2005. a. Determine which variables measured in 2005 or what new variables may be valuable
to continue collecting in the future. b. Evaluate the potential to expand upon individual health data collected in 2005 to
develop a method to assess stress in tortoises, to develop a spatially explicit model of areas in which tortoises are stressed to the point of being vulnerable to disease, and to assess temporal trends in vulnerability to disease.
6. Conduct spatial analyses of live and dead tortoise distribution across the range. a. Compare historical study-plot and sign-count data to current patterns of live and dead
tortoise concentrations. b. Summarize the 2005 habitat and threat data and compare with patterns of live and
dead tortoise concentrations. 7. Improve training lines by:
a. adding a greater number of sizes of tortoise models, b. improving the visibility of the transect markers, and c. developing alternate layouts or additional lines in different environments.
8. Evaluate the use of independent field teams in order to improve data consistency and quality. 9. Refine and formalize/document the QA/QC process. 10. Develop a range-wide recovery database to integrate land management and use data with
population data. a. Conduct an empirical survey of management by DWMA. b. Conduct an empirical survey of activities on public lands such as grazing, roads and
highways (with traffic counts), and recreation (with visitor counts). 11. Identify and assess options for securing continued funding for range-wide population
monitoring, such as developing memorandums of understanding between organizations.

Range-wide Monitoring of the Mojave Population of the Desert Tortoise: 2001-2005 Summary
iv
TABLE OF CONTENTS
LIST OF TABLES ............................................................................................................................... v LIST OF FIGURES ............................................................................................................................. vi ACKNOWLEDGEMENTS.................................................................................................................. viii INTRODUCTION ................................................................................................................................ 1
Background ............................................................................................................................... 1 History of LDS to Monitor Desert Tortoises .......................................................................... 1
METHODS ........................................................................................................................................ 4 Density Estimation .................................................................................................................... 4
Estimating G0 Using Focal Animals ....................................................................................... 5 Training ..................................................................................................................................... 7 Sample Area ............................................................................................................................ 10
2001 Season .......................................................................................................................... 11 2002 Season .......................................................................................................................... 12 2003 Season .......................................................................................................................... 12 2004 Season .......................................................................................................................... 12 2005 Season .......................................................................................................................... 13
Power Analysis ........................................................................................................................ 13 RESULTS ........................................................................................................................................ 19
Training ................................................................................................................................... 19 Desert Tortoise Density within Recovery Units ................................................................... 25
Focal Animals ....................................................................................................................... 31 Power Analysis ........................................................................................................................ 32
DISCUSSION ................................................................................................................................... 33 Training ................................................................................................................................... 33 Density...................................................................................................................................... 33 Precision and Power ............................................................................................................... 34
FUTURE DIRECTIONS...................................................................................................................... 37 Recommendations ................................................................................................................... 40
LITERATURE CITED........................................................................................................................ 42 APPENDIX: DETAILED METHODS ................................................................................................... 46
Spatial Methods of Transect Selection.................................................................................. 46 2001 Season .......................................................................................................................... 46
Step 1: 2001 Exclusion Criteria........................................................................................ 46 Step 2: 2001 Transect Start Point Generation.................................................................. 46 Step 3: 2001 Implementation of Sampling Strategy.......................................................... 46
2002-03 Seasons ................................................................................................................... 47 Step 1: 2002/2003 Available Sample Area ....................................................................... 47 Step 2: 2002/2003 Transect Start Point Generation......................................................... 47 Step 3: Implementation of Sampling Strategy................................................................... 48
2004 Season .......................................................................................................................... 48

Range-wide Monitoring of the Mojave Population of the Desert Tortoise: 2001-2005 Summary
v
Step 1: 2004 Available Sample Area ................................................................................ 48 Step 2: 2004 Transect Start Point Generation.................................................................. 48 Step 3: Implementation of Sampling Strategy................................................................... 49
2005 Season .......................................................................................................................... 49 Step 1: 2005 Available Sample Area ................................................................................ 49 Step 2: 2005 Transect Start Point Generation.................................................................. 49 Step 3: Implementation of Sampling Strategy................................................................... 49
Issues with Transect Selection ............................................................................................... 49 2001 Season .......................................................................................................................... 49
Sample design strategy ..................................................................................................... 50 Sample design strategy implementation............................................................................ 50
2002-03 Seasons ................................................................................................................... 51 2004 Season .......................................................................................................................... 51 2005 Season .......................................................................................................................... 51 Additional Considerations for Spatial Analyses of LDS Data .............................................. 52
Field Methods .......................................................................................................................... 52 2001 Season .......................................................................................................................... 52
Transect Survey Methods .................................................................................................. 52 Data collection.................................................................................................................. 53
2002 Season .......................................................................................................................... 53 2003 Season .......................................................................................................................... 54 2004 Season .......................................................................................................................... 54
Transect Survey Methods .................................................................................................. 54 Data collection.................................................................................................................. 56
2005 Season .......................................................................................................................... 57 Data Quality Analysis/Quality Control................................................................................. 57
Phase 1: Contractor QA/QC................................................................................................. 57 Phase 2: Second-Level QA/QC ............................................................................................. 58 Phase 3: Final QA/QC .......................................................................................................... 59
MAPS ............................................................................................................................................. 60
LIST OF TABLES
Table 1. Number of focal tortoises monitored with radio telemetry to estimate detectability (G0)................................................................................................................................................6
Table 2. Summary of strata sampled during 2001 .........................................................................14 Table 3. Summary of strata sampled during 2002 .........................................................................15 Table 4. Summary of strata sampled during 2003 .........................................................................16 Table 5. Summary of strata sampled during 2004 .........................................................................17 Table 6. Summary of strata sampled during 2005 .........................................................................18

Range-wide Monitoring of the Mojave Population of the Desert Tortoise: 2001-2005 Summary
vi
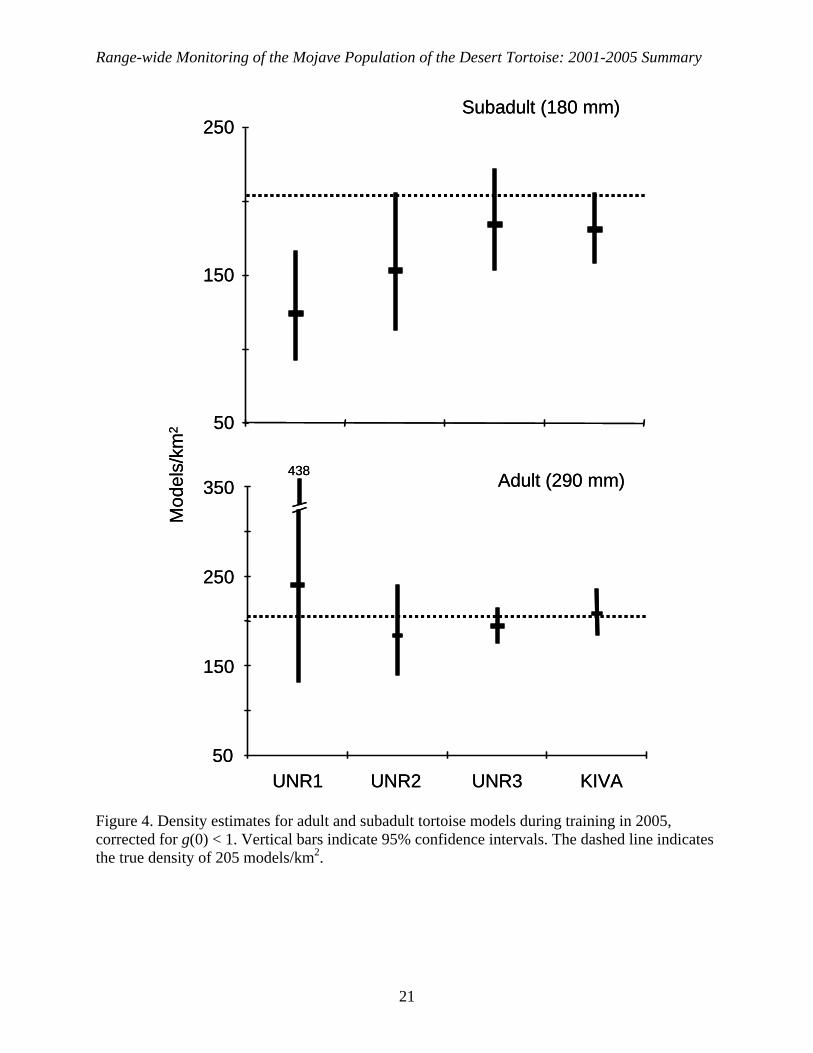
Table 7. Proportion of focal animals visible to sampling (G0); summary of total transects, encounter rates, effective strip half-widths, capture probabilities, and filters for each year ......26
Table 8. Summary of density estimates for each Recovery Unit...................................................27 Table 9. Mean G0 values for each focal site ..................................................................................31 Table 10. Timeline of range-wide monitoring activities ...............................................................40 Table A-1. QA/QC analyses conducted on LDS data, 2001-05 ................................................... 58
LIST OF FIGURES
Figure 1. Training lines for line-distance sampling .........................................................................8 Figure 2. Live desert tortoises and styrofoam models .....................................................................9 Figure 3. Detection probabilities, estimated with a 2-pass removal method, of tortoise models
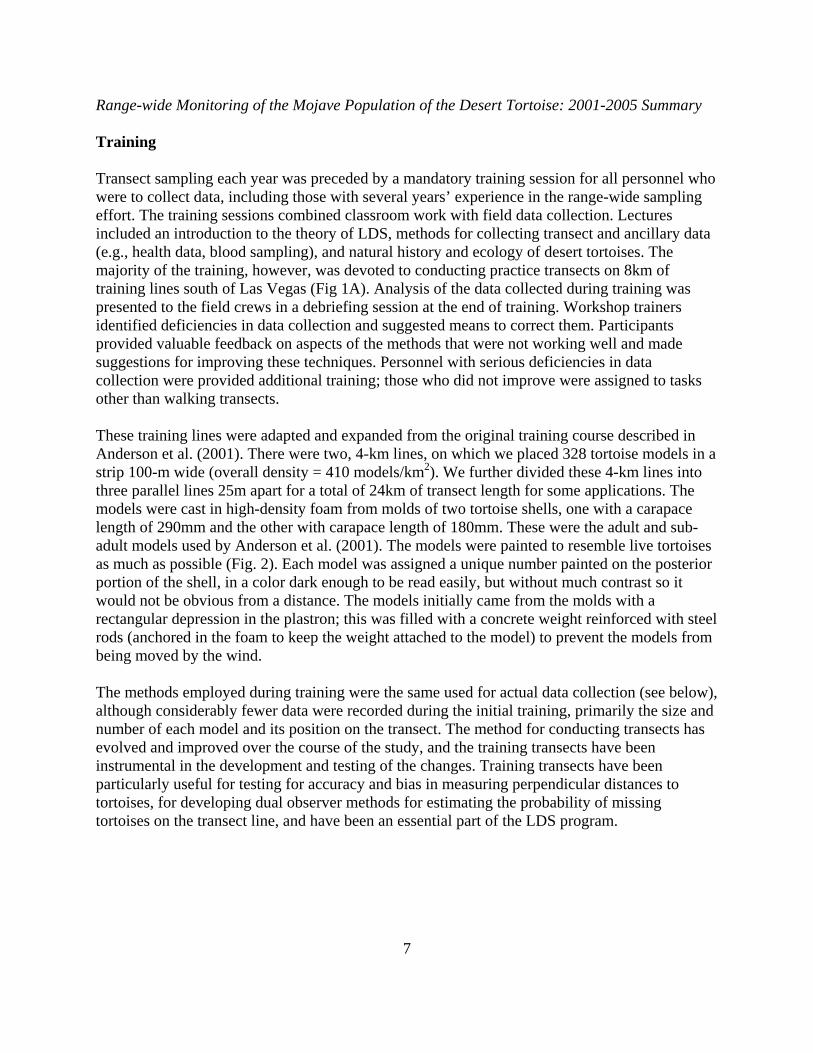
within 2 m of the transect centerline........................................................................................20 Figure 4. Density estimates for adult and immature tortoise models during training in 2005,
corrected for g(0) < 1 ...............................................................................................................21 Figure 5. Histograms of detections of tortoise models during the 1st and 3rd UNR training
episodes in 2005.......................................................................................................................22 Figure 6. Comparison of estimated detections of tortoise models on or near (0-2m) the transect
centerline, calculated from capture probabilities, and actual g(0) determined from tortoise models known to have been missed.........................................................................................23
Figure 7. Detections of tortoise models within 2 m of the transect centerline ..............................24 Figure 8. Detection functions for each year for adult tortoises observed on all transects. ............29 Figure 9. Change in encounter rate of desert tortoises on transects during the 2004 season.........30 Figure 10. Power to detect a trend over a 25-year time period for each of the Recovery Units,
given variance estimates from DISTANCE analysis...............................................................32 Figure 11. Proportion of winter months (October through March) in various Palmer Drought
Severity Index categories, by decade since 1900.....................................................................35 Fig. A-1. Transect-sampling pattern used in 2002 and 2003.........................................................54 Fig. A-2. Example of transect deflection around a steep hill.........................................................56 Fig. A-3. Schematic of position data collected to determine the perpendicular distance from a
tortoise to the transect line .......................................................................................................57
LIST OF MAPS
Map 1. Available sample area during 2001 LDS surveys .............................................................61 Map 2. Available sample area during 2002 LDS surveys .............................................................62 Map 3. Available sample area during 2003 LDS surveys .............................................................63 Map 4. Available sample area during 2004 LDS surveys .............................................................64 Map 5. Available sample area during 2005 LDS surveys .............................................................65

Range-wide Monitoring of the Mojave Population of the Desert Tortoise: 2001-2005 Summary
vii
Map 6. Distribution of transects, live tortoises, and dead tortoises during LDS surveys in the Edwards AFB, Fremont-Kramer, MCAGCC, Ord-Rodman, and Superior-Cronese sampling areas .........................................................................................................................................66
Map 7. Distribution of transects, live tortoises, and dead tortoises during LDS surveys in the Pinto Mountain, Joshua Tree, and Chuckwalla sampling areas...............................................71
Map 8. Distribution of transects, live tortoises, and dead tortoises during LDS surveys in the Ivanpah, Fenner, and Chemehuevi sampling areas..................................................................76
Map 9. Distribution of transects, live tortoises, and dead tortoises during LDS surveys in the Beaver Dam Slope, Coyote Springs, Mormon Mesa, Gold Butte-Pakoon, Lake Mead NRA (North and South), and Piute-Eldorado sampling areas...........................................................81

Range-wide Monitoring of the Mojave Population of the Desert Tortoise: 2001-2005 Summary
viii
ACKNOWLEDGEMENTS D. Anderson and K.P. Burnham (U.S. Geological Survey, University of Colorado, Fort Collins) provided much advice and insight into the selection and use of line distance sampling as a means to monitor desert tortoise populations. J. Hamill (U.S. Department of Interior) coordinated support by land managers (federal and state agencies, including military installations) in the Desert Managers Group for sampling in California. The staff of the U.S. Bureau of Land Management, Riverside, California, provided spare styrotorts and molds for the training lines. R. Fisher and C. Rochester (U.S. Geological Survey, Biological Resources Division, San Diego, California); J. Essex, J. Foisy, J. Briggs, and A. Serio, (Mojave Desert Ecosystem Project, Charis Corporation); and R. Inman (University of Redlands) helped design and develop the Personal Data Assistant (PDA) data-collection procedures used as of 2002 or otherwise provided significant project support. F. Getz (General Services Administration) assisted with contracting work in California. Funding was provided during one or more years by Edwards Air Force Base (S. Collis and R. Wood); Fort Irwin National Training Center (M. Quillman); the Marine Corps Air Ground Combat Center (Major B. Soderberg, Major J. Aytes, and R. Evans); the Marine Corps Logistic Base (A. Gleason and M. Jolla); the Marine Corps Air Station, Yuma; U.S. Navy, Southwest Division (R. Palmer); Joshua Tree National Park (E. Quintana, K. Sauer, and H. McKutchen); Mojave National Preserve (M. Martin and L. Wilson); Clark County, Nevada, Multiple Species Habitat Conservation Plan (C. Truelove and L. Wallenmeyer); Bureau of Land Management (L. Foreman, L. Hansen, E. Lorentzen, M. Poole, T. Read, T. Salt, R. Scofield, and J. Weigand); Arizona Game and Fish Department (R. Averill-Murray); and U.S. Fish and Wildlife Service (S. Thompson, R. Williams, D. Noda, and R. McNatt). Personnel from Chambers Group; Kiva Biological Consulting; Mojave National Preserve; the University of Nevada, Reno; and Utah Division of Wildlife Resources conducted the field surveys. R. Cody, S. Kokos, and P. Woodman were instrumental in field crew coordination, training, data sheet development, etc. A. McLuckie and R. Fridell coordinated field efforts on the Beaver Dam Slope in 2001 and 2002 and provided results from the Upper Virgin River Recovery Unit. We acknowledge the hard work of all the field workers and technicians who collected data: H. Akwa-Mensah, M. Anderson, S. Ankrum, L. Anton, L. Backus, E. Barks, M. Baumflek, C. Beebe, G. Benavides, E. Bernstein, A. Best, C. Blandford, B. Blosser, B. Bodah, E. Borchert, M. Bratton, P. Brewer, S. Brito, K. Buescher, L. Campbell, S. Campbell, D. Carr, D. S. Cetkovsky, Chalmers, F. Chan, C. Chandler, T. Chapman, R. Cody, S. Cohen, J. Collette, S. Coven, R. Crawford, R. Curtis, A. Daly, M. Davis, K. Dicristina, D. Donato, H. Dowis, D. Dunson, K. Dutcher, J. Fekete, K. Field, L. Flory, D. Focardi, G. Forsyth, P. Frank, S. Franklin, C. Furman, K. Galvin, T. Gebhard, J. Golder, G. Goodlett, M. Gowans, E. Green, F. Griego, S. Guinan, C. Haegele, S. Hall, C. Halley, L. Hanson, B. Hart, B. Hasebe, B. Hasskamp, M.A. Hasskamp, J. Heaton, K. Herbinson, N. Herms, D. Hill, K. Hillen, D. Hinderle, L. Holbek, J. Howell, K. Hughes, J. Hyre, J. Ingarra, R. Inman, J. Iwanicha, R. Jarahian, K. Jensen, E. Johnson, L. Johnson, N. Johnson, W. Johnson, C. Jones, S. Jones, J. Jurkowski, H. Kaplan, K. Katsuda, T. Kearns, C. Keaton, K. Kenney, D. Kent, K. Kermoian, P. Kermoian, T. Kipke, S. Kokos, I. Laforet, C. Laktas, M. Landers, E. LaRue, T. Leavitt, A. Legari, D. Leite, J. Liberante, J.

Range-wide Monitoring of the Mojave Population of the Desert Tortoise: 2001-2005 Summary
ix
Liberman, D. Lin, C. Llewellyn, R. Loubeau, S. MacAlpine, R. Malecki, R. Mank, J. Marr, M. Massar, A. McClay, L. McCluskey, M. McMillan, L. McNalley, D. Mende, D. Muir, C. Munill, A. Norwood, M. Ogawa, J. Olmos, M. Omana, L. Pavlisak, A. Peters, K. Potter, A. Pratt, M. Radakovich, R. Rademacher, Y. Ralph, N. Ranalli, E. Ray, B. Reiley, M. Ritz, D. Robosky, S. Rooney, C. Ruiz, A. Sacerdote, E. Saenger, K. Saletel, K. Sams, M. Sanchez, T. Schacht, M. Scheele, J. Schooley, M. Schroeder, S. Scouten, B. Scurlock, A. Seidewand, G. Shaner, D. Sheppard, M. Shivone, D. Silva, C. Slaughter, L. Smith, M. Snow, C. Spake, E. Stands, B. Stein, M. Stidham, J. Swenddal, A. Switalski, A. Teucher, R. Vaghini, K. Vick, A. Viniciguerra, M. Wakik, T. Wallace, J. Weber, J. Weidensee, M. Weingarden, K. Wheeler, E.F. Whitfield, N. Wiley, B. Williams, M. Wilson, S. Wilson, M. Wolfgram, P. Wood, R. Woodard, K. Wright, R. Young. The following people provided much appreciated comments on the draft report: W. Boarman (Conservation Science), M. Connor (Desert Tortoise Preserve Committee), T. Grant and J. Hohman (Fish and Wildlife Service), B. Henen (Marine Corps Air Ground Combat Center), T. Krzysik (Prescott College), K. Ralls (Smithsonian Institution), C. Ronning (Bureau of Land Management), D. Schramm and D. Hughson (Mojave National Preserve), R. Steidl (University of Arizona), C. Wilkerson (Defenders of Wildlife), and C. Furman, M.A. Hasskamp, J. Weidensee, R. Woodard, and P. Woodman (Kiva Biological Consulting).

1
RANGE-WIDE MONITORING OF THE MOJAVE POPULATION OF THE DESERT TORTOISE: 2001-2005 SUMMARY REPORT
INTRODUCTION Background The first delisting criterion in the recovery plan for the Mojave population of the desert tortoise (U.S. Fish and Wildlife Service [USFWS], 1994) specified that population trends within each recovery unit should be stable or increasing over a 25-year period (a single tortoise generation). Appendix A of the recovery plan further recommended comparison of population trends inside and outside Desert Wildlife Management Areas and recommended surveying and monitoring a system of 1-km2 capture-recapture plots. In the past, desert tortoise populations had been monitored using either strip transects (Luckenbach, 1982) or permanent study plots (Berry, 1984). Both of these methods provide data on desert tortoises with varying degrees of accuracy, but logistical constraints and sampling design make their use problematic for range-wide monitoring (Corn, 1994; Bury and Corn, 1995; Tracy et al., 2004). Densities at long-term study plots cannot be directly compared to regional estimates of abundance, because these plots were not established using a probabilistic design, but instead were located intentionally in areas with high tortoise abundance (Berry 1984). Indices of abundance suffer from numerous problems, including most significantly, unknown variation in detection probabilities (Anderson, 2001). Categorical estimates of abundance from sign transects are suspect for the same reasons. Because the relationship between tortoise sign and density is calibrated on the long-term study plots, the relationship has been established at relatively high densities, and is expected to overestimate abundance at larger scales. In February 1995 during a workshop on tortoise monitoring sponsored by the Biological Resources Research Center (BRRC) at the University of Nevada, Reno, tortoise biologists, statisticians, and monitoring experts reviewed previous methods used to monitor tortoise populations and possible methods to use in the future. At this workshop, the method of line distance sampling (LDS; Buckland et al., 1993, 2001) was introduced as a way to mitigate the problems of permanent study plots (Anderson and Burnham, 1996). In June 1999, the Desert Tortoise Management Oversight Group (MOG) endorsed the use of LDS using Program DISTANCE as the method for estimating range-wide desert tortoise density. History of LDS to Monitor Desert Tortoises During the fall and winter of 2000, the USFWS Desert Tortoise Coordinator (P.A. Medica) held a series of meetings, one in each of the Recovery Units (RUs) for the Mojave population of the desert tortoise. At each meeting, land management agency personnel and regional biologists familiar with desert tortoise distribution and the habitat within their RU discussed potential habitat stratification to inform sampling of desert tortoise populations within each RU. The total number of strata identified at these meetings ranged from 44 to 48, largely consistent with soil

Range-wide Monitoring of the Mojave Population of the Desert Tortoise: 2001-2005 Summary
2
and vegetation differences. It was obvious at the conclusion of these meetings that it would not be feasible to sample at that level and still obtain adequate sample sizes within each of the strata with the limited funding available. Instead, available funding dictated that sampling would be restricted to each Desert Wildlife Management Area (DWMA), and RUs would serve as strata for sampling during 2001. The primary emphasis this first year of LDS would be to provide an encounter rate for each DWMA or RU, which would be used to determine the sampling effort required in subsequent years. In January 2001, a monitoring workshop meeting was held in Las Vegas, Nevada, to explain the field protocols for the sampling techniques that would be used that year in the first year’s range-wide monitoring effort. This meeting was attended both by agency and contractor personnel. The workshop management team prepared a handbook in March 2001 to serve as the manual for conducting the density surveys in 2001. In March 2001, approximately 40 field biologists attended each of two, four-day training workshops sponsored and jointly managed by the USFWS Desert Tortoise Coordinator (P.A. Medica), the U.S. Geological Survey Research Zoologist (P.S. Corn), and the University of Nevada, Reno, Biologist (R.W. Marlow). All contractor personnel were required to attend these training workshops, which provided practice for conducting the transect density-sampling techniques and was intended to ensure that the sampling methods were consistent throughout the entire geographic range. Using styrofoam tortoise models (styrotorts) placed in natural habitats near Jean, Nevada, the workshop management team established a 4-km training line at the site of an earlier demonstration workshop conducted in Las Vegas in October 1998 (Anderson et al., 2001). In 1997, the Utah Division of Wildlife Resources (UDWR) had also instituted a LDS monitoring program at the Red Cliffs Desert Reserve within the Upper Virgin River Recovery Unit, which was similar to that implemented in 2001 for the rest of the listed range of tortoises (McLuckie et al., 2002). With variable and reduced funding among years and the need to increase sample size by conducting longer transects, the transects themselves were modified during most years to compensate. In addition, methods were modified to improve efficiency and effectiveness and to increase the power of the monitoring effort in response to experiments and experience. In 2002, transects were enlarged from 1.6km to 4km in length. We improved sampling efficiency through additional modifications made in 2003 in the manner in which transects were walked. However, too narrowly defined geographical parameters in the survey design in 2002 and 2003 surfaced as a result of adapting monitoring each year without a thorough review (Tracy et al., 2004; see Appendix). The lack of certainty in year-to-year funding of range-wide monitoring contributed to an atmosphere of last-minute adjustments to methods in attempts to increase efficiency and decrease cost. However, adjustments to field techniques sometimes emphasized logistics or economical considerations instead of needs for solid scientific design and statistical validity. The Desert Tortoise Monitoring Committee (DTMC) was formally established in the winter prior to the 2004 sampling season to provide more consistent advice and coordination on the monitoring program as an outgrowth of Desert Tortoise Recovery Plan Assessment Committee (DTRPAC) analyses and recommendations. In 2004, the DTMC improved transect selection methods, enlarged transects to 10-12km in length, and modified the manner in which transects were

Range-wide Monitoring of the Mojave Population of the Desert Tortoise: 2001-2005 Summary
3
walked. In 2005, transects were sampled using the same methods as in 2004, although additional data were recorded to begin exploring range-wide threats, and blood samples were collected to document genetic variation and disease status. This report summarizes range-wide desert tortoise monitoring results from the 2001-05 surveys. Detailed methods and discussion of each year’s survey effort are described in the Appendix. The body of the report provides an overview of the density estimation methods, training program, and areas sampled each year. The results focus on the effectiveness of the training program and annual density estimates for each recovery unit. The discussion describes the direction of the monitoring program, including additional analyses that the DTMC intends to conduct to further evaluate and improve the program. Finally, the DTMC makes recommendations to increase the precision and utility of the program and to adapt the scope of the monitoring program to better inform the recovery process.

Range-wide Monitoring of the Mojave Population of the Desert Tortoise: 2001-2005 Summary
4
METHODS Density Estimation Unbiased density estimation using LDS rests on 3 major assumptions: 1) objects on the centerline are always detected (i.e., the probability of detection at perpendicular distance 0, g(0), = 1); 2) objects are detected at their initial location, prior to movement in response to the observer; and 3) perpendicular distances are measured accurately (Buckland et al., 2001). In using LDS for desert tortoises, the latter 2 assumptions are relatively easy to meet. Desert tortoises generally do not move appreciably in response to approaching observers, and perpendicular distances can be accurately measured if the centerline is clearly marked (Anderson et al., 2001) or if field protocols are followed diligently (see training results, below). However, training and field data show that the first assumption is regularly violated during LDS for tortoises. Desert tortoises spend a considerable proportion of time underground in burrows, sometimes deep enough that they are not visible to sampling, and the proportion of the population available for sampling may vary from year to year. To address this problem, we adopted a modified dual-observer technique that allows estimation of this error and correction of the density estimates, if necessary (Anderson and Burnham, 1996). Focal tortoises equipped with radio transmitters are used to estimate the proportion visible to sampling each year (see Focal Animals, below). Transects were conducted by 2-person crews in all 5 years, but we altered the method in 2004 in an effort to increase the sample size (actual tortoise observations; see Appendix, Field Methods for details). Briefly, the technique used in 2001–2003 used a visible transect centerline, laid on the ground in 100-m increments and included searching back and forth from the centerline out to 8–10m. A single crew could complete about 4 km of transect daily (two 1.6-km transects in 2001 and a single 4-km transect in 2002–2003). In 2004, we initiated the technique of walking transects in a continuous fashion, with the lead crew member walking a straight line on a specified compass bearing, trailing about 25m of line, and the second crew member following at the end of the line. This technique involved little lateral searching (other than by eye) and generally resulted in a 30% decrease in encounter rates. However, the length of transect sampled increased to 10–12km a day for each crew, resulting in as many as >200% more adult tortoise observations. The methodological differences between years did not affect model assumptions, so they do not affect accuracy (i.e., bias) of estimates. We used Program DISTANCE, Version 4.1, Release 2 (Thomas et al., 2004b), to estimate density of tortoises. We used the detection-function models (key function/series expansion) recommended by Buckland et al. (2001): uniform/cosine, uniform/simple polynomial, half-normal/cosine, half-normal/hermite polynomial, hazard-rate/cosine, and hazard-rate/simple polynomial. We truncated observations at 15m (2001–2003) or 12m (2004–2005) to improve model fit (Buckland et al., 2001). The shorter truncation distance after 2003 reflects the change in technique with reduced searching away from the transect centerline. We chose the model with the lowest Akaike Information Criterion (AIC) as the best fitting model (Buckland et al., 2001).

Range-wide Monitoring of the Mojave Population of the Desert Tortoise: 2001-2005 Summary
5
To accommodate the limited number of tortoise observations in some RUs, for each year, we pooled all observations to obtain the detection function. Density, however, was estimated separately for the 5 RUs. DISTANCE output is reported for each RU as density (number of tortoises ≥180mm midline carapace length [MCL] per km2), with standard errors, coefficients of variation (%), and 95% confidence intervals (Buckland et al., 2001). We used density estimates in preference to absolute abundance, because changes in the areas sampled each year, described below, directly affect the number of tortoises estimated within those areas. Estimating G0 Using Focal Animals Not all tortoises in a population can be detected by transects, even if they are on the center of the transect line. Typically, these are either undetectable in deep burrows or well hidden in dense vegetation. The existence of a portion of the population that is “invisible” to sampling will bias the density estimates derived from LDS, but if the proportion of the population available for sampling can be estimated, then DISTANCE uses this parameter (G0) to correct the bias. The fact that this quantity must be estimated means that it contributes variability to detection and therefore to density estimates. This estimation comes at the cost of decreased precision of the estimated density. G0 should not be confused with g(x), the probability of detection at distance x. Estimation of G0 consists of the establishment of a cohort of focal tortoises in each monitoring stratum. Most DWMAs within each RU had an associated “focal population” of 5-20 animals (targeting at least 10 sub-/adults), ideally with equal numbers of males and females (Table 1). The focal animals are equipped with radio transmitters and observed daily while transects are being sampled in that area. Generally, transmitters are placed on the carapace so that the highest point of the transmitter is still below the highest point of carapace, in an anterior position on females and posterior on males, so as to not interfere with mating behavior. Some focal populations contained existing tortoises with functioning transmitters from previous studies. If this could be determined prior to searching for new animals, cooperation between researchers for the multiple use of these tortoises was sought, and if these animals could be shared, they were. Contractors developed data sheets to document activity for focal tortoises, with some slight variations, and included the following information: transmitter frequency, GPS coordinates, general weather conditions, sex of the animal, time of day, temperature 1 cm above the ground, behavior (above or below ground or under a shrub), whether the animal was visible or not, signs of disease, etc. When Anderson and Burnham (1996) proposed estimation of G0, it was anticipated that this parameter could be estimated regionally and for different time periods to coincide with transect data collection. However, DISTANCE software still limits specification of G0 to one per analysis. There was no way to utilize separate G0 for each DWMA or Recovery Unit. Under this sub-optimal situation, a single G0 was estimated for each year as the proportion of time an individual animal might be visible. For each telemetered animal with at least 10 observations, we calculated the proportion of observations where the tortoise was visible, either above ground or in a burrow. We calculated G0 as the mean of the individual proportion visible. Program DISTANCE accepts a single

Range-wide Monitoring of the Mojave Population of the Desert Tortoise: 2001-2005 Summary
6
estimate of G0, which we estimated as the mean of the proportion visible of the 57–119 focal animals. The standard errors of these means were the standard errors used in DISTANCE for each annual G0. Tortoises at each focal site were monitored concurrently with transect surveys in the associated DWMA(s), so the global estimate of G0 incorporates variability in tortoise detection probability to match the period over which transects were surveyed in each sampling area. Table 1. Number of focal tortoises (>10 observations/year) monitored with radio telemetry to estimate detectability (G0). Tortoises at each focal site were monitored concurrently with transect surveys in the associated DWMA(s), but all sites were pooled to estimate a global G0. Not all DWMAs that were sampled each year contained a separate focal site. Recovery Unit Assoc. DWMA1 Focal Site 2001 2002 2003 2004 2005E Colorado Chuckwalla Chuckwalla 14 12 7 10 10
Fenner Fenner 5 Ivanpah Ivanpah 12 8 3 Lake Mead NRA (South) Border2 6 6 6 7 7
Piute Eldorado Mid2 7 6 10 8 13
Eastern Mojave
MNP3 MNP 17 LSTS4
Beaver Dam Slope Coyote Springs Gold Butte-Pakoon Lake Mead NRA (North)
Northeast Mojave2
Mormon Mesa
LSTS 8 6 5 5
N Colorado Chemehuevi Chemehuevi 13 4 8 10 Edwards AFB Fremont-Kramer2 Fremont-Kramer 10 10 8
Joshua Tree MCAGCC Pinto Mountain
MCAGCC 12 2 9
Ord-Rodman Ord Rodman 11 10 20 17 9
Western Mojave
Superior-Cronese Superior-Cronese2 18 9 19 15 13 1Includes various Department of Defense and National Park Service units. 2Border and Mid also applied to the Northeast Mojave and Superior-Cronese applied to Fremont-Kramer (2004-05) for purposes of monitoring focal tortoises coincident with transect surveys. 3Mojave National Preserve, California. 4Large Scale Translocation Site, Clark Co., Nevada.
Range-wide Monitoring of the Mojave Population of the Desert Tortoise: 2001-2005 Summary
7
Training Transect sampling each year was preceded by a mandatory training session for all personnel who were to collect data, including those with several years’ experience in the range-wide sampling effort. The training sessions combined classroom work with field data collection. Lectures included an introduction to the theory of LDS, methods for collecting transect and ancillary data (e.g., health data, blood sampling), and natural history and ecology of desert tortoises. The majority of the training, however, was devoted to conducting practice transects on 8km of training lines south of Las Vegas (Fig 1A). Analysis of the data collected during training was presented to the field crews in a debriefing session at the end of training. Workshop trainers identified deficiencies in data collection and suggested means to correct them. Participants provided valuable feedback on aspects of the methods that were not working well and made suggestions for improving these techniques. Personnel with serious deficiencies in data collection were provided additional training; those who did not improve were assigned to tasks other than walking transects. These training lines were adapted and expanded from the original training course described in Anderson et al. (2001). There were two, 4-km lines, on which we placed 328 tortoise models in a strip 100-m wide (overall density = 410 models/km2). We further divided these 4-km lines into three parallel lines 25m apart for a total of 24km of transect length for some applications. The models were cast in high-density foam from molds of two tortoise shells, one with a carapace length of 290mm and the other with carapace length of 180mm. These were the adult and sub-adult models used by Anderson et al. (2001). The models were painted to resemble live tortoises as much as possible (Fig. 2). Each model was assigned a unique number painted on the posterior portion of the shell, in a color dark enough to be read easily, but without much contrast so it would not be obvious from a distance. The models initially came from the molds with a rectangular depression in the plastron; this was filled with a concrete weight reinforced with steel rods (anchored in the foam to keep the weight attached to the model) to prevent the models from being moved by the wind. The methods employed during training were the same used for actual data collection (see below), although considerably fewer data were recorded during the initial training, primarily the size and number of each model and its position on the transect. The method for conducting transects has evolved and improved over the course of the study, and the training transects have been instrumental in the development and testing of the changes. Training transects have been particularly useful for testing for accuracy and bias in measuring perpendicular distances to tortoises, for developing dual observer methods for estimating the probability of missing tortoises on the transect line, and have been an essential part of the LDS program.

Range-wide Monitoring of the Mojave Population of the Desert Tortoise: 2001-2005 Summary
8
Figure 1. Training lines for line-distance sampling. (A) Location of the two lines on either side of Highway 161 NW of Jean, NV; letters indicate 1000-m segments. (B) Distribution of tortoise models in segment A (vertical scale expanded). The solid line at 0m indicates the center of the transect. The dashed lines indicate auxiliary lines 25m from the center.

Range-wide Monitoring of the Mojave Population of the Desert Tortoise: 2001-2005 Summary
9
Figure 2. Live desert tortoises (left) and styrofoam models (right). The 290-mm model (adult) is above, and the 180-mm model (subadult) is below. Models of each size were placed up to 50m from the center line, on either side of the line, with equal numbers of models in each 5-m band of distance from the transect centerline. Perpendicular distances of model positions were 30–40cm apart. This uniform distribution was chosen to simplify the analysis when data were pooled from multiple passes over the transect (to prevent repetition of odd random patterns artificially influencing the detection function). We placed 20–21 models of each size on each 1-km transect segment at random distances from the origin of the segment (Fig. 1B). The primary function of training, however, was to ensure that project personnel collected high-quality data by adhering to the sampling protocol, which was designed to satisfy the assumptions inherent in LDS. Personnel new to tortoises and distance sampling usually required multiple training episodes to reach the proficiency of experienced crews. Those personnel with experience conducting LDS on tortoises generally performed well during the training and required only 2 days (16-km) of transects to ensure proficiency.

Range-wide Monitoring of the Mojave Population of the Desert Tortoise: 2001-2005 Summary
10
Tortoise sampling in Nevada was conducted by the University of Nevada (UNR), using Resource Assistants (RAs) supplied by the Student Conservation Association (SCA) and who were managed by paid employees. Most of the RAs were inexperienced undergraduate biology and wildlife biology students; indeed, many had no prior exposure to desert ecosystems. Sampling in California was conducted by private contractors, including Chambers Group (2001-02), Kiva Biological Consulting (2001-05), and Mojave National Preserve personnel (2001). Kiva employed many of the same biologists from year to year, many of whom participated in 5 years of data collection. Utah Division of Wildlife Resources (UDWR) personnel sampled portions of the Beaver Dam Slope in Arizona, Nevada, and Utah 2001 and 2002. Sample Area The area sampled each year varied due to variable funding levels, permitting, and transect selection methods (see Appendix). We divided the total area within the 6 RUs into 20 sampling areas based primarily on critical habitat and DWMA/Area of Critical Environmental Concern (ACEC) boundaries. The Eastern Colorado RU contains the single Chuckwalla sampling area. This area includes designated critical habitat, the Chuckwalla DWMA/ACEC (Bureau of Land Management [BLM], 2002a), and the Chocolate Mountain Aerial Gunnery Range (CMAGR). Note that for convenience of the current analyses, Joshua Tree National Park, which is divided by the Eastern Colorado and Western Mojave RU boundary, has been lumped within the Western Mojave RU. The Eastern Mojave RU includes the Fenner, Ivanpah, Lake Mead National Recreation Area (South), Mojave National Preserve, and Piute-Eldorado sampling areas. The Fenner area includes designated critical habitat and the Piute-Fenner DWMA/ACEC (BLM, 2002b). The Ivanpah area includes BLM’s Ivanpah DWMA, which itself includes the Ivanpah Valley and Shadow Valley ACECs (BLM, 2002b), as well as associated critical habitat on the Mojave National Preserve. The actual “Mojave National Preserve” sampling area includes Preserve areas outside critical habitat. The Lake Mead NRA (South) sampling area includes NRA lands south of U.S. Highway 93. The Piute-Eldorado sampling area includes the Piute-Eldorado ACEC (BLM 1998b) and associated critical habitat. The Northeast Mojave RU includes the Beaver Dam Slope, Coyote Springs, Gold-Butte-Pakoon, Lake Mead NRA (North), Large-Scale Translocation Site (LSTS), and Mormon Mesa sampling areas. The Beaver Dam Slope sampling area includes designated critical habitat and associated DWMAs and ACECs in Nevada, Utah, and Arizona (BLM, 1998a, 2000). The Coyote Springs sampling area includes the Coyote Springs and Kane Springs ACECs (BLM, 1998b, 2000) and associated critical habitat. The Gold Butte-Pakoon sampling area includes the Gold Butte DWMA/ACEC (BLM, 1998b) in Nevada, the Pakoon Basin and Virgin Mountain ACECs in Arizona (BLM, 1998a), and associated critical habitat in both states. The Lake Mead NRA (North) sampling area includes NRA lands in Nevada north of U.S. Highway 93. The Mormon Mesa sampling area includes the Mormon Mesa ACEC (BLM 1998b, 2000) and associated

Range-wide Monitoring of the Mojave Population of the Desert Tortoise: 2001-2005 Summary
11
critical habitat. The LSTS sampling area is an approximately 104-sq.-km area on the west side of Interstate Highway 15, just north of the California state line. Given that tortoises salvaged from the Las Vegas Valley are translocated into this area, we exclude this area from regional (RU) density estimation. The field component of the annual training workshop occurred at the LSTS. The Western Mojave RU contains the Edwards Air Force Base, Fremont-Kramer, Joshua Tree, Marine Corps Air Ground Combat Center (MCAGCC), Ord-Rodman, Pinto Mountain, and Superior-Cronese sampling areas. The Edwards AFB sampling area includes the relevant Department of Defense lands west of the Fremont-Kramer area. The Fremont-Kramer sampling area includes the proposed Fremont-Kramer DWMA/ACEC (BLM, 2005) and associated critical habitat, including that on Edwards AFB. The Superior-Cronese sampling area includes the proposed Superior-Cronese DWMA/ACEC (BLM, 2005) and associated critical habitat, including that on the National Training Center, Fort Irwin. The Ord-Rodman and Pinto Mountain sampling areas include BLM’s relevant proposed DWMAs/ACECs (BLM, 2005) and associated critical habitat. The Joshua Tree sampling area includes tortoise habitat within Joshua Tree National Park; as noted above, this area has been lumped entirely within the Western Mojave RU for the current analyses, even though the Park is divided by the Western Mojave and Eastern Colorado RU boundary. The MCAGCC sampling area includes tortoise habitat within that installation. The Northern Colorado RU contains the single Chemehuevi sampling area. This area includes the Chemehuevi DWMA/ACEC (BLM, 2002a) and associated critical habitat. Sampling in the Upper Virgin River RU occurred in the Red Cliffs Desert Reserve during 1999-2001, 2003, and 2005. UDWR independently conducted these surveys (McLuckie et al., 2002, 2004, pers. comm.). 2001 Season We surveyed 3,018km of transects range-wide, excluding the Upper Virgin River RU and LSTS. We surveyed 77km in the LSTS, and UDWR surveyed 314km in the Red Cliffs Desert Reserve (RCDR; Table 2). Table 2 and Map 1 (excluding RCDR) illustrate the actual area available to be sampled within each sampling area according to the transect-selection and transect-survey methodologies described in the Appendix. Three field teams conducted surveys in California. Sampling by each team generally began in the more southern localities and proceeded northward. Chambers Group sampled 3 areas: Superior-Cronese, Fremont-Kramer, and Edwards Air Force Base. The National Park Service, with the assistance of SCA volunteers, sampled the Mojave National Preserve and portions of the Ivanpah and Fenner sampling areas. Kiva Biological Consulting surveyed the remaining areas further east in California. Sampling began between 1 April and 25 May in each sampling area and was completed by 16 June.

Range-wide Monitoring of the Mojave Population of the Desert Tortoise: 2001-2005 Summary
12
In Nevada, sampling was conducted primarily by a field team under the direction of UNR, including a team of technicians and SCAs. Sampling began on 4 April and continued through 27 June, starting in the southern areas of Piute-Eldorado and finishing in the northern parts of Coyote Spring Valley and Mormon Mesa. A field team managed by UDWR sampled the Beaver Dam Slope within Nevada, as well as Arizona and Utah. Arizona was sampled by the UNR field team (Gold Butte-Pakoon) and a team managed by UDWR (Beaver Dam Slope). Sampling in Beaver Dam Slope occurred from 10 April through 19 June and between 10 May and 22 June in Gold Butte-Pakoon. UDWR sampled areas in Utah, including the Utah portion of Beaver Dam Slope, as well as the RCDR in the Virgin River RU (McLuckie et al. 2002). 2002 Season We surveyed 4,011km of transects, not including the LSTS and the Northern Colorado and Upper Virgin River RUs (Table 3). We sampled 177km in the LSTS, but limited funding precluded sampling within the Northern Colorado RU. Beginning in 2001, UDWR began sampling the Upper Virgin River RU every other year (McLuckie et al., 2004). Table 3 and Map 2 illustrate the actual area available to be sampled within each sampling area according to the transect-selection and transect-survey methodologies described in the Appendix. Two field teams conducted surveys in California. Chambers Group sampled 2 sampling areas, Superior-Cronese and Fremont-Kramer, while Kiva Biological Consulting surveyed the remaining areas. Sampling began between 1 April and 3 May in each sampling area and was completed by 22 May. In Nevada, the UNR field team conducted most of the surveys (between 8 April and 13 June), while UDWR sampled the Beaver Dam Slope within Nevada, Arizona, and Utah (from 16 April to 17 May). Arizona transects also included those in Gold Butte-Pakoon surveyed by the UNR field team between 24-25 April. 2003 Season We surveyed 3,875km of transects in most areas of each RU, excluding the LSTS and Upper Virgin River RU. We surveyed 157km in the LSTS, and UDWR surveyed 226km in the RCDR (Table 4). Table 4 and Map 3 (excluding RCDR) illustrate the actual area available to be sampled within each sampling area according to the transect-selection and transect-survey methodologies described in the Appendix. Kiva Biological Consulting managed the single field team in California, conducting surveys in all relevant RUs from 7 April to 1 June. The UNR field team sampled the Nevada sampling areas from 10 March through 28 June and the Arizona portion of Gold Butte-Pakoon between 30 April and 17 June. UDWR sampled the Upper Virgin River RU in Utah (McLuckie et al. 2004). 2004 Season We surveyed 7,276km of transects, excluding the LSTS and Upper Virgin River RU (Table 5). We surveyed 158km in the LSTS. Table 5 and Map 4 illustrate the actual area available to be sampled within each sampling area according to the transect-selection and transect-survey methodologies described in the Appendix. Kiva Biological Consulting managed the single field

Range-wide Monitoring of the Mojave Popula
13
tion of the Desert Tortoise: 2001-2005 Summary
team in California, conducting surveys in all relevant RUs from 2 April to 12 May. The UNR field team sampled the Nevada sampling areas from 7 April through 25 June and the Arizona portion of Gold Butte-Pakoon between 21 April and 19 May. 2005 Season We surveyed 9,099km of transects, excluding the LSTS and Upper Virgin River RU. We surveyed 364km in the LSTS, and UDWR surveyed 304.5km in the RCDR (Table 6). Table 6 and Map 5 illustrate the actual area available to be sampled within each sampling area according to the transect-selection and transect-survey methodologies described in the Appendix. Kiva Biological Consulting conducted surveys in all relevant RUs in California from 16 April to 7 June. The UNR field team sampled all sampling areas in Nevada, Arizona, and Utah, except the Upper Virgin River RU, from 12 April through 28 June. UDWR sampled the Upper Virgin River RU in Utah (McLuckie et al., 2006). Power Analysis We conducted an analysis to estimate the statistical power to detect changes in population density estimates over a 25-year sampling period under several rates of population change. The power analysis used computer simulations (Link and Hatfield, 1990) of population growth for populations with a constant average growth rate for a 25-year period. Simulated growth rates ranged from 0 to 5% annual growth in increments of 1% (Hatfield et al., 1996). In order to use estimates from different years, reflecting different areas, we modeled changes in density rather than changes in abundance. The initial population density and the variance in the modeled population growth were calculated from the population density estimates produced by Program DISTANCE for each of the 5 RUs. For each RU, a population of Dt+1 at time (t+1) was calculated as a product of the population one year prior (Dt) multiplied by the discrete population growth rate (λ).Variation proportional to that measured in the field was then added to the resulting population estimate (Di) by drawing a number from a random-normal distribution with a mean of D and a standard deviation equal to the standard error of the density estimate. We simulated population growth over 25 years, then regressed the logarithm of the resulting annual population densities against time (Thomas et al., 2004a). Statistical power was determined from the proportions of 1,000 simulations of population growth with each set of population parameters (λ and CV) that were significantly less than stable population density with an alpha of 0.10 (Hatfield et al., 1996). We set alpha = 0.10 (instead of the customary 0.05) in order to minimize Type II error at the expense of Type I error. This has the conservative effect of guarding against incorrectly concluding a decline in tortoise density has not occurred at the expense of a slightly increased possibility that an increasing or declining trend is “detected” when, in fact, the population is stable (Shrader-Frechette and McCoy, 1993).

Range-wide Monitoring of the Mojave Population of the Desert Tortoise: 2001-2005 Summary
Table 2. Summary of LDS sampling during 2001. Dead tortoises represent accumulations of shells from multiple years. Area Transect length # Tortoises Recovery Unit Sampling Area (sq. km) # Transects (km) Live Dead Eastern Colorado Chuckwalla 2861 205 328 71 193
Fenner 1383 20 31 9 30Ivanpah 1991 117 185 10 36Lake Mead NRA (South) 615 11 25 3 9 Mojave National Preserve 1606 16 24 1 4
Eastern Mojave
Piute-Eldorado 1527 76 138 7 19Beaver Dam Slope 773 53 64 6 5 Coyote Springs 529 51 99 4 8 Gold Butte-Pakoon 1603 65 137 5 9 Lake Mead NRA (North) 774 12 22 1 1
Northeast Mojave
Mormon Mesa 870 47 87 5 19 Northern Colorado Chemehuevi 2989 201 322 63 215
Edwards AFB 1215 106 170 0 14 Fremont-Kramer 1403 211 338 59 163Joshua Tree 1035 77 123 17 28 MCAGCC 2030 90 144 24 33Ord-Rodman 601 197 315 66 149Pinto Mountain 440 80 128 24 24
Western Mojave
Superior-Cronese 2136 211 338 46 118SUBTOTAL 26,381 1,846 3,018 421 1,077Northeast Mojave LSTS1 104 62 77 22 15 Upper Virgin River2 Red Cliffs Desert Reserve 201 159 314 218 34 GRAND TOTAL 26,686 2,067 3,409 661 1,126 1Large Scale Translocation Site, Clark Co., Nevada; excluded from density calculations. 2Data from McLuckie et al. (2002); dead tortoise numbers from McLuckie et al. (2004).
14

Range-wide Monitoring of the Mojave Population of the Desert Tortoise: 2001-2005 Summary
Table 3. Summary of LDS sampling during 2002. Blank cells indicate strata not sampled. Dead tortoises represent accumulations of shells from multiple years. Area Transect length # Tortoises Recovery Unit Sampling Area (sq. km) # Transects (km) Live Dead Eastern Colorado Chuckwalla 1531 104 417 51 128
Fenner 1259 73 293 16 217Ivanpah 1240 112 448 36 185Lake Mead NRA (South) Mojave National Preserve
Eastern Mojave
Piute-Eldorado 735 99 381 12 83 Beaver Dam Slope 201 27 107 0 9 Coyote Springs 152 12 46 2 5 Gold Butte-Pakoon 162 12 48 0 2 Lake Mead NRA (North)
Northeast Mojave
Mormon Mesa 258 24 94 1 20 Northern Colorado Chemehuevi
Edwards AFB Fremont-Kramer 458 132 524 50 278Joshua Tree 332 47 196 11 33 MCAGCC 1052 40 160 18 29Ord-Rodman 68 106 424 87 157Pinto Mountain 192 48 192 12 28
Western Mojave
Superior-Cronese 545 172 681 62 198SUBTOTAL 8,185 1,008 4,011 358 1,372Northeast Mojave LSTS1 104 52 177 26 61 Upper Virgin River Red Cliffs Desert Reserve GRAND TOTAL 8,289 1,060 4,188 384 1,4331Large Scale Translocation Site, Clark Co., Nevada; excluded from density calculations.
15

Range-wide Monitoring of the Mojave Population of the Desert Tortoise: 2001-2005 Summary
Table 4. Summary of LDS sampling during 2003. Blank cells indicate strata not sampled. Dead tortoises represent accumulations of shells from multiple years. Area Transect length # Tortoises Recovery Unit Sampling Area (sq. km) # Transects (km) Live Dead Eastern Colorado Chuckwalla 1531 108 432 40 108
Fenner Ivanpah Lake Mead NRA (South) Mojave National Preserve
Eastern Mojave
Piute-Eldorado 735 59 215 18 40 Beaver Dam Slope Coyote Springs 152 42 165 17 33 Gold Butte-Pakoon 162 70 238 10 24 Lake Mead NRA (North)
Northeast Mojave
Mormon Mesa 258 77 296 25 102 Northern Colorado Chemehuevi 2484 112 445 81 265
Edwards AFB Fremont-Kramer 458 130 519 60 179Joshua Tree 332 50 200 19 34 MCAGCC Ord-Rodman 68 127 506 130 196Pinto Mountain 192 49 196 21 25
Western Mojave
Superior-Cronese 545 166 663 86 122SUBTOTAL 6,917 990 3,875 507 1,128Northeast Mojave LSTS1 104 46 157 63 93 Upper Virgin River2 Red Cliffs Desert Reserve 201 157 309 127 93 GRAND TOTAL 7,222 1,193 4,341 697 1,314 1Large Scale Translocation Site, Clark Co., Nevada; excluded from density calculations. 2Data from McLuckie et al. (2004).
16

Range-wide Monitoring of the Mojave Population of the Desert Tortoise: 2001-2005 Summary
Table 5. Summary of LDS sampling during 2004. Blank cells indicate strata not sampled. Dead tortoises represent accumulations of shells from multiple years. Area Transect length # Tortoises Recovery Unit Sampling Area (sq. km) # Transects (km) Live Dead Eastern Colorado Chuckwalla 4137 132 1414 130 268
Fenner 1833 37 410 61 146Ivanpah 2112 43 515 42 103Lake Mead NRA (South) Mojave National Preserve
Eastern Mojave
Piute-Eldorado 2072 76 747 44 73Beaver Dam Slope 827 10 100 0 1 Coyote Springs 638 56 547 14 20 Gold Butte-Pakoon 1923 37 361 5 10 Lake Mead NRA (North)
Northeast Mojave
Mormon Mesa 957 48 478 15 72 Northern Colorado Chemehuevi 3789 76 836 110 335
Edwards AFB Fremont-Kramer 2070 41 463 57 164Joshua Tree 1313 23 278 12 57 MCAGCC Ord-Rodman 836 35 381 47 70Pinto Mountain 605 5 56 4 4
Western Mojave
Superior-Cronese 3087 62 690 71 116 SUBTOTAL 26,199 681 7,276 612 1,439Northeast Mojave LSTS1 104 17 158 30 28 Upper Virgin River Red Cliffs Desert Reserve GRAND TOTAL 26,303 698 7,434 642 1,467 1Large Scale Translocation Site, Clark Co., Nevada; excluded from density calculations.
17

Range-wide Monitoring of the Mojave Popula
tion of the Desert Tortoise: 2001-2005 Summary
18
Table 6. Summary of LDS sampling during 2005. Blank cells indicate strata not sampled. Dead tortoises represent accumulations of shells from multiple years. Area Transect length # Tortoises Recovery Unit Sampling Area (sq. km) # Transects (km) Live Dead Eastern Colorado Chuckwalla 4199 91 1094 88 126
Fenner 727 24 288 52 84Ivanpah 567 14 168 10 7Lake Mead NRA (South) 824 26 250 5 25 Mojave National Preserve
Eastern Mojave
Piute-Eldorado 1949 116 1270 78 90Beaver Dam Slope 828 50 527 6 6 Coyote Springs 762 26 267 15 7 Gold Butte-Pakoon 1977 64 632 3 6 Lake Mead NRA (North) 1552 20 200 5 3
Northeast Mojave
Mormon Mesa 970 47 526 31 29 Northern Colorado Chemehuevi 4038 94 1129 127 241
Edwards AFB Fremont-Kramer 2405 56 673 50 53Joshua Tree 1774 50 601 22 60 MCAGCC Ord-Rodman 1124 26 310 31 45Pinto Mountain 608 13 155 19 4
Western Mojave
Superior-Cronese 3447 84 1009 85 89 SUBTOTAL 27,751 801 9,099 627 875Northeast Mojave LSTS1 104 37 364 63 68 2Upper Virgin River Red Cliffs Desert Reserve 115 155 304 136 106 GRAND TOTAL 27,970 993 9,767 826 1,049 1Large Scale Translocation Site, Clark Co., Nevada; excluded from density calculations. 2Data from McLuckie et al. (2006).

Range-wide Monitoring of the Mojave Population of the Desert Tortoise: 2001-2005 Summary
RESULTS Training The results from training in 2005 illustrate the differences between inexperienced and experienced crews, but show that repeat training is successful in closing that gap. Although experienced biologists failed to detect some tortoise models on or near (within 2m) the transect centerline, the crews from Kiva had mean estimated capture probabilities of 0.9 for both subadult- and adult-sized models (Fig. 3). Because the capture probability applies per each pass on the centerline, the technique currently in use should result in detection of 99% of tortoises within 2m of the centerline (the leader finds 90% of tortoises on the first pass, and the follower finds 90% of the tortoises the leader missed). However, this assumes that all tortoises available for sampling are equally detectable, which is likely not the case (see below). The inexperienced crews from UNR initially performed poorly in detecting the tortoise models near the centerline, but, by the time they had completed 40km of training transects, capture probabilities for both sizes of models were >0.8 (UNR3; Fig. 3). A capture probability of 0.8 predicts detection of 96% of tortoises within 2m of the transect centerline after 2 passes. Analysis of the differences between the known perpendicular distances of the models from the centerline and the distances estimated during data collection indicates that crews measured distances accurately. The mean difference (estimated – known) for Kiva was -0.14m for both sizes of model (adult SE = 0.048; subadult SE = 0.044), and for the final UNR training episode it was -0.27m for adults (SE = 0.057) and -0.18m for sub-adults (SE = 0.057). In all cases, the mean error was negative, indicating a slight tendency to underestimate the true distance. Because teams establish the transect centerline as they move forward, any tendency to move towards a tortoise before stopping to make measurements would result in an underestimate of the true distance. In extreme cases, this can cause heaping of observations near the centerline, which results in overestimates of true abundance. Crews are instructed to stop (establishing the current position of the transect centerline) as soon as a tortoise is detected or suspected. There is no evidence for any tendency to move towards the models before stopping and establishing the transect. In all cases, the mean errors were less than or equal to the length of a tortoise model. Considering that the models were placed initially using an established transect line, but that these data were collected by crews establishing the transect line as they moved along, the errors are remarkably small and have a trivial effect on the estimates of density. As with the estimates of detection probability, the estimates of density demonstrate the improved performance of the UNR crews during the course of their training (Fig. 4). By the third training session, their performance was equivalent to the Kiva crews in estimating the abundance of both sizes of models. The reasons for this can be seen by comparing the histograms of detections and encounter rates between the first and third training sessions (Fig. 5). The first training session was characterized by a relative inability to find the tortoise models (encounter rates of <3/km) and poor searching technique, indicated by the detection histograms, particularly the heaping of sub-adult observations at 9–11m. Detection probabilities <0.75 (Fig. 3) indicate that the region of the transect centerline was not searched adequately. This result is not unexpected for inexperienced personnel, most of whom would not be expected to have developed the proper search image for tortoises. By the third session, the UNR crews had gained experience observing
19

Range-wide Monitoring of the Mojave Population of the Desert Tortoise: 2001-2005 Summary
and finding live tortoises in the wild and had received additional instruction and practice in conducting transect sampling. Consequently, their ability to find the models improved significantly (the encounter rate for subadults increased about 50%), and the detections conformed to patterns necessary for effective estimation of abundance (Fig. 5).
KIVAUNR1 UNR2 UNR30.0
0.2
0.4
0.6
0.8
1.0
Det
ectio
n pr
obab
ility
SubadultAdult
Model Size
KIVAUNR1 UNR2 UNR30.0
0.2
0.4
0.6
0.8
1.0
Det
ectio
n pr
obab
ility
SubadultAdult
Model Size
Figure 3. Detection probabilities, estimated with a 2-pass removal method, of tortoise models within 2m of the transect centerline. Vertical lines indicate 95% confidence intervals. The inexperienced University of Nevada (UNR) crews performed an initial 8-km trial (UNR1) and then two 16-km trials (UNR2, UNR3), and the experienced crews from Kiva Biological Consulting performed one 16-km trial.
20
Range-wide Monitoring of the Mojave Population of the Desert Tortoise: 2001-2005 Summary
50
150
250
UNR1 UNR2 UNR3 KIVA
Mod
els/
km2
Subadult (180 mm)
150
250
350438
50
Adult (290 mm)
50
150
250
UNR1 UNR2 UNR3 KIVA
Mod
els/
km2
Subadult (180 mm)
150
250
350438
50
Adult (290 mm)
Figure 4. Density estimates for adult and subadult tortoise models during training in 2005, corrected for g(0) < 1. Vertical bars indicate 95% confidence intervals. The dashed line indicates the true density of 205 models/km2.
21

Range-wide Monitoring of the Mojave Population of the Desert Tortoise: 2001-2005 Summary
0.0
0.2
0.4
0.6
0.8
1.0
1.2
0 2 4 6 8 10 12 140.0
0.2
0.4
0.6
0.8
1.0
0 2 4 6 8 10 12 14
Perpendicular distance (m)
Subadult Adult
Det
ectio
n pr
obab
ility
8–9 March (2.1) 8–9 March (2.8)
6–7 April (3.2) 6–7 April (3.5)
0.0
0.2
0.4
0.6
0.8
1.0
1.2
0 2 4 6 8 10 12 140.0
0.2
0.4
0.6
0.8
1.0
0 2 4 6 8 10 12 14
Perpendicular distance (m)
Subadult Adult
Det
ectio
n pr
obab
ility
8–9 March (2.1) 8–9 March (2.8)
6–7 April (3.2) 6–7 April (3.5)
Figure 5. Histograms of detections of tortoise models during the 1st and 3rd UNR training episodes in 2005. Numbers in parentheses are the mean encounter rates (models/km). Both UNR and Kiva crews underestimated the true density of sub-adult models by about 10%, even after correcting for g(0)<1. The primary reason for this is that the true g(0) is considerably less than the g(0) estimated from the capture probabilities (Fig. 6). The true g(0) is known because the distribution of models is known, which makes it possible to determine exactly which models each crew failed to detect. Examination of the detections of each model (Fig. 7) indicates that 2 of the 12 sub-adult models (GI194 and OI72) within 2m of the centerline were missed by more than half of the crews. The tortoise models that were missed were not hidden. GI194 is placed partially underneath overhanging vegetation, but OI72 is located in the open, away from overhanging vegetation. Because these models were largely invisible to sampling, the abundance that can be estimated using DISTANCE is effectively reduced. This bias can be estimated, if the proportion of the population available for sampling (G0) can be estimated. However, using radio telemetry of focal animals to determine G0 likely has limited ability to compensate for the types of errors seen in Fig. 7. The models that were not detected would be judged to be available for sampling. This suggests that distance sampling, even done well, may always underestimate true density to some degree. The tendency for some tortoise models to be invisible was less pronounced, but still present in the adult-sized models. Model GA148 was missed by 6 of 23 crews, despite being only 0.15m from the transect centerline, and GA140 was missed by more than half of all crews. Although the
22

Range-wide Monitoring of the Mojave Population of the Desert Tortoise: 2001-2005 Summary
true g(0) for adult models was less than the estimated g(0), similar to sub-adult models (Fig. 6), the estimates of abundance were not biased (Fig. 4). This is largely an artifact of the training course and the way in which the data were analyzed. The large models can be obvious and visible from long distances when placed in locations with limited vegetative cover. A group of 7 adult models, placed 2.9–3.5m from the transect line, were detected more frequently than the models within 2m of the line. This inflated the detection function and should have caused an overestimate of the true abundance. It is likely serendipitous that this bias was balanced by the negative bias resulting from underestimating g(0). The end result is that density estimates of live tortoises of all sizes may be underestimated by 5–10%, despite correcting for g(0)<1 and G0<1.
1.0 1.0
Figure 6. Comparison of estimated detections of tortoise models on or near (0-2m) the transect centerline, calculated from capture probabilities, and actual g(0) determined from tortoise models known to have been missed.
0.5
0.6
0.7
0.8
0.9
g(0)
Actual Estimated
Adult SubadultKIVA KIVAUNR3 UNR3
Actual
0.5
0.6
0.7
0.8
0.9
g(0)
EstimatedActual Estimated
KIVA UNR3 KIVA UNR3
Adult Subadult
23

Range-wide Monitoring of the Mojave Population of the Desert Tortoise: 2001-2005 Summary
0
25
50
75
100
GI135
GI79OI15
3OI93
GI160
OI75GI19
4OI72 GI76
OI187
GI24OI14
8
UNR3KIVA
0
25
50
75
100
GA148
GA65
OA113OA15
GA11
OA193GA38
OA135
GA119
OA50
GA132
OA26
GA140GA62
OA131
OA7
Adult
Subadult
Tortoise model
Per
cent
age
of te
ams
dete
ctin
g m
odel
0
25
50
75
100
GI135
GI79OI15
3OI93
GI160
OI75GI19
4OI72 GI76
OI187
GI24OI14
8
UNR3KIVA
0
25
50
75
100
GA148
GA65
OA113OA15
GA11
OA193GA38
OA135
GA119
OA50
GA132
OA26
GA140GA62
OA131
OA7
0
25
50
75
100
GI135
GI79OI15
3OI93
GI160
OI75GI19
4OI72 GI76
OI187
GI24OI14
80
25
50
75
100
GI135
GI79OI15
3OI93
GI160
OI75GI19
4OI72 GI76
OI187
GI24OI14
8
UNR3KIVAUNR3KIVA
0
25
50
75
100
GA148
GA65
OA113OA15
GA11
OA193GA38
OA135
GA119
OA50
GA132
OA26
GA140GA62
OA131
OA70
25
50
75
100
GA148
GA65
OA113OA15
GA11
OA193GA38
OA135
GA119
OA50
GA132
OA26
GA140GA62
OA131
OA7
Adult
Subadult
Tortoise model
Per
cent
age
of te
ams
dete
ctin
g m
odel
Figure 7. Detections of tortoise models within 2m of the transect centerline. Models are listed left to right in order of increasing distance from the line.
24

Range-wide Monitoring of the Mojave Popula
25
tion of the Desert Tortoise: 2001-2005 Summary
Desert Tortoise Density within Recovery Units We surveyed from a low of 3,018km of transects in 2001 to a high of 9,099km in 2005, excluding the LSTS and Red Cliffs Desert Reserve (Tables 2–6). Surveyors recorded ranges of 358–627 live tortoises and 875–1,439 tortoise carcasses (encompassing the full range of time since death) each year (Tables 2–6; Maps 6-9). Because of the change in technique for conducting transects beginning in 2004, as well as differences in sample area between years, comparisons of some of the statistics from the DISTANCE analyses should be undertaken cautiously. All analyses used adult tortoises (MCL ≥180mm), and observations were truncated at either 15m (2001–2003) or 12m (2004–2005), reflecting the change in intensity of searching away from the transect centerline (Table 7). The number of focal animals (those with ≥10 observations) used to determine the proportion of tortoises visible to sampling (G0) each year varied between 119 in 2001 and 57 in 2004; the minimum G0 was 0.708 in 2002, and the maximum was 0.874 in 2003 (Table 7). In 2004, there were 125 adult tortoises observed ≤2m from the transect centerline, 115 by the lead observer and 10 by the following observer. This resulted in a detection probability of 0.91 (1 – 10/115). Therefore, with 2 passes covering the centerline (leader, then follower), 99% of tortoises near or on the centerline should have been detected, and no adjustment for g(0) < 1 was made to the density estimate. Detection of adult tortoises on the transect centerline in 2005 was less than in 2004, perhaps because of denser herbaceous vegetation in 2005. Within 2m of the transect centerline, 156 adult tortoises were seen by the lead observer and 39 by the following observer (detection probability = 0.75). The detection of tortoises on or near the centerline after 2 passes was 93.75%, and density estimates in 2005 were adjusted for this departure from g(0) = 1. All the DISTANCE analyses used a detection function that pooled all observations within each year (Table 7) but treated Recovery Units as strata and estimated separate densities for each (Table 8). Model selection in DISTANCE resulted in the half-normal key function in all years (Fig. 8). Encounter rates (ER) and effective strip half-widths (ESW) were generally greater in 2001–2003 than in 2004–2005 (Tables 7-8) because of the change in transect technique. However, the three-fold increase in transect length (4km to 12km) more than compensated for the slight reduction in ER, so that the number of observations of tortoises increased in 2004 and 2005, resulting in increased precision of the detection functions. The capture probabilities, the proportion of tortoises detected between the transect centerline and the truncation distance, were about 60% for both transect methods (Table 7). The analyses used some other conditions that varied from year to year. Few tortoises were observed on transects completed after May in 2001 and 2004 and after mid-June in 2005 (Fig. 9). These late-season transects were dropped from the analyses. In all years, however, detections declined as the seasons progressed, so date was used as a covariate. Beginning in 2003, the same individual surveyors remained together as a team throughout the season, and team numbers were treated as continuous covariates. In 2002, the three contracting groups were used as factorial covariates.

Range-wide Monitoring of the Mojave Population of the Desert Tortoise: 2001-2005 Summary
Table 7. Proportion of focal animals visible to sampling (G0); summary of total transects, effective strip half-widths, capture probabilities, and filters for each year. “Adult tortoises” is the number of adults and subadults (MCL ≥180mm) after truncation in DISTANCE (15m in 2001–2003 and 12m in 2004–2005). No. of Transects does not include transects completed in June in 2001 and 2004 or after 15 June in 2005. Standard errors are in parentheses.
G0
Year n visibleNo. of
Transects Length (km)
Adult Tortoises
Effective Strip (half) Width (m)
Capture Probability Filters
2001 117 0.868 (0.013) 1631 2660 279 8.8
(0.35) 0.586
(0.023)
MCL ≥180mm, observations truncated at 15m, June transects dropped, date used as covariate
2002 76 0.708 (0.031) 1010 4007 289 8.5
(0.34) 0.565
(0.023)
MCL ≥180mm, observations truncated at 15m, date and contracting groups (3) used as covariates
2003 81 0.874 (0.018) 990 3874 354 10.5
(0.31) 0.707
(0.021)
MCL ≥180mm, observations truncated at 15m, date and contracting groups (3) used as covariates
2004 78 0.864 (0.018) 610 6576 445 7.8
(0.22) 0.647
(0.018)
MCL ≥180mm, observations truncated at 12m, June transects dropped, date and contracting groups (2) used as covariates
2005 74 0.840 (0.018) 745 8564 489 6.3
(0.20) 0.525
(0.016)
MCL ≥180mm, observations truncated at 12m, contracting groups (2) used as covariate, transects after 15 June dropped
26

Range-wide Monitoring of the Mojave Population of the Desert Tortoise: 2001-2005 Summary
Table 8. Summary of density estimates for each Recovery Unit. “Adult tortoises” is the number of adults and subadults (MCL ≥180mm) after truncation in DISTANCE (15m in 2001–2003 and 12m in 2004–2005). No. of Transects does not include transects completed in June in 2001 and 2004 or after 15 June in 2005.
95% Confidence Interval
Recovery Unit Year No. of
Transects Length (km)
Adult Tortoises
Encounter Rate
Std Error
Density (km2)
Std Error
Coefficient of Variation (%) Low High
2001 136 254.8 9 0.035 0.012 2.32 0.786 34.0 1.20 4.452002 75 293.2 3 0.010 0.006 0.84 0.476 56.6 0.29 2.402003 189 699.2 39 0.056 0.008 3.01 0.465 15.4 2.22 4.082004 96 947.3 18 0.019 0.004 1.42 0.342 24.2 0.88 2.27
Northeast Mojave
2005 166 1754.4 40 0.023 0.004 2.15 0.400 18.6 1.50 3.102001 224 371.6 17 0.046 0.012 3.00 0.784 26.2 1.81 4.982002 284 1120.4 56 0.050 0.008 4.11 0.797 17.0 2.94 5.722003 59 215.1 11 0.051 0.016 2.76 0.874 31.7 1.49 5.122004 140 1511.2 113 0.075 0.010 5.57 0.750 13.4 4.28 7.26
Eastern Mojave
2005 165 1839.5 108 0.059 0.006 5.54 0.656 11.8 4.39 6.992001 205 328.0 54 0.165 0.025 10.80 1.712 15.9 7.91 14.732002 104 416.7 42 0.101 0.019 8.28 1.670 20.2 5.58 12.302003 108 431.7 32 0.074 0.014 4.00 0.774 19.3 2.74 5.852004 132 1414.0 102 0.072 0.009 5.38 0.684 12.7 4.18 6.91
Eastern Colorado
2005 91 1094.3 74 0.068 0.011 6.38 1.062 16.6 4.60 8.862001 201 321.6 39 0.121 0.020 7.95 1.390 17.5 5.65 11.192002 – – – – – – – – – –2003 112 445.2 54 0.121 0.020 6.55 1.122 17.1 4.67 9.172004 76 835.9 79 0.095 0.014 7.04 1.099 15.6 5.17 9.59
Northern Colorado
2005 94 1128.8 94 0.083 0.010 7.86 1.005 12.8 6.11 10.122001 865 1384.0 160 0.116 0.010 7.58 0.710 9.4 6.31 9.112002 547 2176.8 188 0.086 0.008 7.10 0.756 10.6 5.77 8.732003 522 2083.2 218 0.105 0.008 5.65 0.499 8.8 4.75 6.722004 166 1867.9 133 0.071 0.008 5.31 0.663 12.5 4.15 6.78
Western Mojave
2005 229 2746.6 173 0.063 0.006 5.95 0.612 10.3 4.86 7.28
27

Range-wide Monitoring of the Mojave Popula
28
tion of the Desert Tortoise: 2001-2005 Summary
Table 8. Summary of density estimates for each Recovery Unit (continued).
95% Confidence Interval Recovery Unit Year Transects
Length (km)
Adult Tortoises
Encounter Rate1
Std Error
Density (km2)
Std Error
Coefficient of Variation (%) Low High
2001 1631 2660.0 279 0.17 – 5.83 0.472 8.1 4.97 6.832002 1010 4007.1 289 0.07 – 5.55 0.555 10.0 4.56 6.742003 990 3874.3 354 0.09 – 5.08 0.488 9.6 4.20 6.142004 610 6576.3 445 0.07 – 4.99 0.364 7.3 4.32 5.76
5 Recovery Units
2005 745 8563.6 489 0.06 – 5.43 0.369 6.8 4.75 6.202001 159 313.8 168 0.535 0.069 30.11 4.16 13.83 22.95 39.512002 – – – – – – – – – –2003 157 309.1 96 0.311 0.038 16.88 2.17 12.84 13.11 21.722004 – – – – – – – – – –
Upper Virgin River2
2005 155 304.5 136 0.45 0.05 21.77 3.17 14.57 16.36 28.951Encounter rates pooled across RUs were calculated as simple quotients of the number of tortoises divided by total transect length each year, not through Program DISTANCE. 2Data from McLuckie et al. (2006).

Range-wide Monitoring of the Mojave Population of the Desert Tortoise: 2001-2005 Summary
Figure 8. Detection functions for each year for adult and subadult tortoises observed on all transects.
29

Range-wide Monitoring of the Mojave Population of the Desert Tortoise: 2001-2005 Summary
Figure 9. Change in encounter rate of desert tortoises on transects during the 2004 season. Estimates of the density of adult tortoises varied among RUs and years (Table 8). If this variability is associated with consistent changes between years, then intermediate-length monitoring (i.e., <25 years) may reveal important trends. For instance, considerable decreases in density were reported in 2003 in the Eastern Colorado and Western Mojave RUs, with no correspondingly large rebound in subsequent estimates (Table 8). We do not report abundance (i.e., the estimated absolute numbers of tortoises), because the area surveyed varied among years, meaning that these numbers cannot be compared among years. The range-wide densities reported here were 4.99-5.83 tortoises/km2. Tortoises were least abundant in the Northeast Mojave RU (0.84–3.01 tortoises/km2), and the highest reported densities occurred in the first year of the project in the Eastern Colorado RU (10.80/km2 in 2001). Precision of annual density estimates varied among RUs, according to the total number of encounters on which the estimates were based (Table 8). Highest precision typically occurred for the Western Mojave RU (CV <13%). Coefficients of variation reached highs of 34.0% and 56.6% in the Northeast Mojave RU in 2001 and 2002, respectively, reflecting the fact that only 12 live tortoises were observed in these 2 years combined.
30
Range-wide Monitoring of the Mojave Population of the Desert Tortoise: 2001-2005 Summary
Focal Animals Global estimates of G0 (tortoise detectability) ranged from 0.708 in 2002 to 0.874 in 2003 (Table 7), and we used these estimates in Program DISTANCE to correct for uncertain detection on the transect centerline. Although more regional estimates of G0 could not be used in the current analysis, they provide information about sources of variability that will have to be considered to improve the overall study design. These estimates also form the basis for thinking about separate analyses in particular recovery units. Tortoise detectability within focal sites varied within and between sites and years (Table 9). Tortoise detectability was relatively constant between sites in 2001 (SD = 6.29) and 2005 (SD = 8.76). The highest variation between sites occurred in 2003, ranging from 0.511 at the LSTS to 1.000 at MCAGCC (annual SD = 15.44). Across years, the Ivanpah and Border sites were less variable (SD = 5.12 and 5.88, respectively), while Superior-Cronese and LSTS were most variable (SD = 16.65 and 17.86, respectively). Table 9. Mean G0 values for each focal site (>10 observations/tortoise/year). Means are not weighted by numbers of individuals within each site, so annual means are not equal to the global estimates used in Program DISTANCE (Table 7). Recovery Unit
Focal Site
2001
2002
2003
2004
2005
Mean (SD)
Eastern Colorado Chuckwalla 0.923 0.771 0.918 0.700 0.745 0.811
(10.28)Fenner 0.603 0.603
Ivanpah 0.871 0.946 0.848 0.888 (5.12)
Border (Piute V.) 0.812 0.749 0.739 0.711 0.855 0.773 (5.88)
Mid (Piute Valley) 0.921 0.575 0.793 0.744 0.862 0.779 (13.24)
Eastern Mojave
MNP 0.752 0.752 Northeastern Mojave LSTS 0.875 0.630 0.511 0.861 0.719
(17.86)Northern Colorado Chemehuevi 0.837 0.790 0.868 0.674 0.792
(8.51)
Fremont-Kramer 0.917 0.781 0.966 0.888 (9.58)
MCAGCC 0.908 1.000 0.877 0.928 (6.40)
Ord Rodman 0.958 0.746 0.962 0.965 0.928 0.912 (9.39)
Western Mojave
Superior-Cronese 0.844 0.545 0.913 0.947 0.925 0.835 (16.65)
Mean (SD)
0.875 (6.29)
0.697 (11.14)
0.844 (15.44)
0.843 (11.02)
0.839 (8.76)
31

Range-wide Monitoring of the Mojave Population of the Desert Tortoise: 2001-2005 Summary
Power Analysis With the exception of the West Mojave RU, none of the analyses indicated high power (>0.8) to detect trend of a population change of 1% per year over a 25-year time period. However, the power to detect trends greater than 2% per year over 25 years was possible in all of the 5 RUs (Fig. 10).
0
0.2
0.4
0.6
0.8
1
0 0.01 0.02 0.03 0.04 0.05
NEMEMECNCWM
Pow
er (1
-β)
Rate of Annual Increase
Figure 10. Power to detect a trend over a 25-year time period for each of the Recovery Units, given variance estimates from DISTANCE analysis.
32

Range-wide Monitoring of the Mojave Population of the Desert Tortoise: 2001-2005 Summary
DISCUSSION
Training Ideally, experienced personnel would always be available for desert tortoise surveys. However, the scale and duration of a long-term, range-wide monitoring program virtually guarantee that at least some inexperienced personnel will be necessary each year. Freilich and LaRue (1998) found that inexperienced observers performed as well as experienced observers in locating Styrofoam tortoise models and tortoise sign (scats, burrows) in 1-ha plots. Our experience with training for range-wide sampling does not support this conclusion. Inexperienced observers performed poorly during initial attempts at transect sampling, but rapidly improved with training. Data that meet the quality standards cannot be gathered by poorly trained or inexperienced personnel. However, intensive training allows relatively inexperienced personnel to be able to collect data that are comparable to those collected by biologists with considerably greater experience. Because the positions of the tortoise models are known, the training exercises allow identification of problems in data collection, which would not be possible using data from live tortoises. The training lines could be improved by addition of a greater number of sizes of tortoise models, and perhaps by alternate layouts, but training is an essential component of the range-wide sampling effort. Density The range-wide monitoring program is designed to detect long-term population trends. Density estimates from any brief window of time (e.g., 2001-2005) would be expected to detect only catastrophic declines or remarkable population increases. Therefore, following the first 5 years of a long term monitoring project, the goal is not to document trends within this time period, but to gather information on baseline densities and year-to-year and RU-to-RU variability. This information will also reflect transect-to-transect variability in observations as well as regional variability in detection functions. All of this will affect the ability to detect trends specified in the recovery criteria and must be addressed as study designs are improved. The changes in sampling frame in 2002 and 2004 complicate comparability of density estimates during the first 5 years of range-wide sampling, and future comparisons among years will be conditioned on the fact that the area sampled in 2002 and 2003 was considerably smaller than in 2001 or 2004–2005. Another caveat to consider in making inferences from the current density estimates is that even though transect locations were randomly selected within each year’s sampling areas, the actual transects surveyed were often clumped, leaving significant unsurveyed areas even across years. Transect selection is described more fully in the Appendix, but each year we selected 10-25% more transects than funding was available so that field crews would have sufficient transects to survey if they determined that some in the original set could not be walked for logistical reasons. For example, the transects actually surveyed in the Joshua Tree, Chuckwalla, and Mormon Mesa sampling areas are clearly clumped (Maps 7D-E, 9D-E), even though the original random transects were distributed more evenly across the areas. As a result, what we assumed was the available sample area at the beginning of each season was reduced further by field worker decisions on the ground. We must determine what factors in the field lead to decisions not to
33

Range-wide Monitoring of the Mojave Population of the Desert Tortoise: 2001-2005 Summary
survey a selected transect, so corrections can be made and our assumptions about the available sample area are met. Density estimates from 2001–2005 are lower than estimates from earlier studies (Luckenbach, 1982; Berry, 1984). These simple comparisons, however, cannot be taken at face value when the historical monitoring efforts were conducted using different techniques at different scales and with different goals. Differences may reflect a difference in scale between methods, with relatively large historical tortoise densities estimated in small, local areas being smoothed over larger areas with range-wide sampling. Low tortoise densities across recovery units from 2001-2005 may also represent continued decline of populations throughout the Mojave Desert since the species was emergency listed as Endangered in 1989. Threats to tortoise populations from human encroachment into the desert have been identified (USFWS, 1994), but specific evidence of cause and effect with respect to population declines is generally lacking (Boarman, 2002). Interpretation of the role of human activities in driving population dynamics of desert tortoises will depend on the rest of the environmental context. Therefore, the ability of management to address threats, and the ability to detect positive responses in tortoise populations through the monitoring program, will be affected by the environmental context. Range-wide sampling was initiated during a severe drought that intensified in 2002 and 2003, particularly in the western Mojave Desert in California. At the time the Recovery Plan was written, there was less consideration of the potentially important role of drought in the desert ecosystem, and with regard to desert tortoises in particular. In the meantime, studies have documented vulnerability of juvenile (Wilson et al., 2001) and adult tortoises (Peterson, 1994, 1996; Henen, 1997; Longshore et al., 2003) to drought. Long-term precipitation records in the Mojave Desert show extended periods of below average rainfall (1942-1975) and periods with above average rainfall (1976-1998; Hereford et al., 2004). The Palmer Drought Severity Index (PDSI; http://www.ncdc.noaa.gov/oa/climate/research/ monitoring.html) integrates precipitation, evapo-transpiration, and runoff to provide a measure of moisture available for plant growth. An analysis of climate divisions in the Mojave Desert shows that drought conditions during the winter months (most critical for herbaceous plant growth during the tortoise activity season) were relatively benign during most of the 20th Century, but have intensified during the past decade (Fig. 11). The role of recent drought in the current low range-wide abundance of tortoises needs further investigation. Precision and Power Range-wide sampling of desert tortoises from 2001–2005, consisting of 4,986 transects totaling 25,681km (Table 7) and using a design that allows estimation of abundance over extensive areas of the Mojave Desert, is the most comprehensive attempt undertaken to date to establish the density of this species. Previous studies that have used transect sampling and DISTANCE encompassed smaller areas and suffered from small sample sizes, which resulted in relatively low precision in the resulting estimates of abundance. Swann et al. (2002) conducted 68, 1-km transects in a 3.7km2 area near Tucson, Arizona, and located 46 tortoises with MCL ≥150mm. The resulting detection function had a CV of 17.8%, and the CV of the estimated density was 23%. Averill-Murray and Averill-Murray (2005) conducted 108, 1-km transects in the Ironwood Forest National Monument, Arizona (768 km2), and located 39 tortoises (MCL ≥150mm). In this
34

Range-wide Monitoring of the Mojave Population of the Desert Tortoise: 2001-2005 Summary
study, the detection function CV was 10.9%. Density was estimated for three strata defined by habitat, and CV varied from 42.8% to 94.1% per stratum (37.2% overall). Krzysik (2002) conducted 20, 4-km transects at Sand Hill (80 km2) on MCAGCC and 12, 4-km transects at Pinto Basin (27 km2) on Joshua Tree National Park. Krzysik found 31 tortoises (MCL >100mm) at Sand Hill and 29 at Pinto Basin, and CVs on density estimates were 25.3% and 27.9%, respectively. In contrast, McLuckie et al. (2002) conducted 153-159, 2-km transects between 1999 and 2001 at the RCDR (201 km2), located 150-168 tortoises >180mm, and reported CVs on density estimates of 13.8-14.5% (5.9% pooled over the 3 years).
Figure 11. Proportion of winter months (October through March) in various Palmer Drought Severity Index categories, by decade since 1900. Monthly means from 3 climate divisions (Arizona 1, California 7, and Nevada 4) were averaged. Source: NOAA-CIRES Climate Diagnostics Center (http://www.cdc.noaa.gov/). In our range-wide sampling, because annual detection functions were based on at least 277 observations of tortoises ≥180mm MCL and the pooled observations conformed extremely well to the half-normal detection function model (Fig. 8), CVs of the detection functions varied between 2.8% and 4.1%. Excepting the Northeastern Mojave RU, where sample sizes were small, stratum density estimates in 2004 and 2005 (the years most comparable to future sampling) had CVs generally <15% (Table 8). Variance may be underestimated slightly due to variation among observers and among habitats, however detection functions in DISTANCE are robust to pooling observations from different transects (Buckland et al., 2004). Freilich et al. (2005) analyzed computer-simulated transects through a 2.6-km2 plot with known tortoise positions and found that most data sets overestimated true abundance and had high CVs (14–41%, depending on modeled encounter rate). The positive bias in these analyses is opposite to results obtained from our training lines and by Anderson et al. (2001) and may be an artifact of the analysis. Freilich et al. (2005) applied the condition that all tortoises located ≤3m from
35

Range-wide Monitoring of the Mojave Population of the Desert Tortoise: 2001-2005 Summary
their (virtual) transect centerlines were considered to have been detected. This condition led to heaping of observations near the centerline (Freilich et al., 2005; Fig 2), resulting in over-estimated detection probabilities and inflated estimates of abundance. Actual transects result in a slight negative bias, because not all tortoises on or near the centerline are detected (g(0) < 1). The lack of precision in the results of Freilich et al. (2005) is mainly due to the small sample sizes used in their simulations (total transect length = 24.1km; simulated tortoise observations <22). Their analyses suggest that transects and DISTANCE analysis may not be suitable for estimating abundance in small areas (but see Swann et al., 2002), but their conclusions are not generally applicable to the extensive range-wide surveys now being conducted. While our power analysis suggests that we will be able to detect population trends >2% over 25 years, it should be noted that natural populations are not expected to increase at the same rates over time, and variation in growth rates that are likely for this species (USFWS, 1994) should be investigated. Averill-Murray (1999) illustrated the difficulty of detecting trends biologically meaningful to desert tortoise populations on permanent study plots. Variability captured in this analysis comes from many sources. For example, sampling variance often varies with density and is expected to decrease with increasing density. Higher density will generally improve the precision/power of monitoring programs (Skalski and Robson, 1992). In long-lived animals, such as the desert tortoise (which have dampened population growth rates relative to species with higher population turnover), any resulting decrease in variance may occur over long time periods, and variation will likely instead be dominated by measurement error (Gerrodette, 1987). The long generation time of the desert tortoise means that we cannot expect high-density, low-variance estimates of tortoise density without taking steps to minimize measurement error as much as possible. Measurement error includes considerable spatial variation when density is estimated at the scale of the RU. For example, changes (or the lack thereof) in a single point estimate of tortoise density across the entire Western Mojave RU are difficult to interpret in that the RU includes multiple different tortoise populations that may be recovering on different trajectories and subject to different environmental and management conditions. Trends in density among these populations may vary both in degree and direction. Since recovery should reflect the status of the total collection of populations within each RU, trends in RU-level density would be more precisely detected by explicitly incorporating spatial variation rather than rolling it into the measurement error. The use of sub-strata (e.g., critical habitat units) that summarize transect-level data instead of pooling them across the entire RU will improve detection of trends at the larger spatial scale of the RU. Trends within sub-strata will be imprecise due to fewer tortoise detections at this scale, but they can reasonably be expected to reflect recovery activities and in turn be more meaningful for land managers operating at these smaller scales. Therefore, an improved study design will lead to improved precision through stratification within RUs, as well as increasing encounter rates, either through actual recovery (i.e., increased tortoise numbers) or, in the short term, by increased efficiencies in sampling.
36

Range-wide Monitoring of the Mojave Population of the Desert Tortoise: 2001-2005 Summary
FUTURE DIRECTIONS
The success of desert tortoise population monitoring hinges on its relevance to on-the-ground management and recovery. The 1994 Desert Tortoise Recovery Plan identified five criteria that must be considered before delisting of the tortoise:
(1) As determined by a scientifically credible monitoring plan, the population within a recovery unit must exhibit a statistically significant upward trend or remain stationary for at least 25 years (one desert tortoise generation); (2) enough habitat must be protected within a recovery unit, or the habitat and desert tortoise populations must be managed intensively enough to ensure long-term viability; (3) provisions must be made for population management within each recovery unit so that discrete population growth rates (lambdas) are maintained at or above 1.0; (4) regulatory mechanisms or land management commitments must be implemented that provide for long-term protection of desert tortoises and their habitat; and (5) the population in the recovery unit is unlikely to need protection under the Endangered Species Act in the foreseeable future.
Current results from the range-wide monitoring program provide a baseline for criterion 1 and the detection of lambda in criterion 3. The 5-year dataset has allowed analyses that have identified problematic areas for the program, but it also will allow us to explore possibilities to improve these areas. Additional analyses will provide an increased knowledge base to inform managers and the future of the range-wide desert tortoise monitoring program. Here, we describe a number of the most important areas of investigation for the immediate future. We plan to release supplemental reports to this summary as further evaluation of the current data progresses. In addition, communication of agency monitoring needs will be facilitated by expanding the DTMC to include management agency representatives. Ongoing evaluation and manager-scientist interaction will ensure that the range-wide monitoring program provides the best information possible to inform managers, scientists, and the public on the progress of desert tortoise recovery. A powerful monitoring methodology provides a means to analyze data in different ways. For example, Tracy et al. (2004) emphasized the importance of multi-dimensional monitoring, including tortoises, habitat, and impacts/threats. Addressing habitat- and threats-based recovery criteria, as well as the effectiveness of management actions, are complex challenges that may not be encompassed under the scope of the range-wide population monitoring program. However, data collection in 2005 included for the first time several variables describing putative threats (e.g., roads and trails, trash, invasive plant species, ravens, free-ranging dogs, disease). Further investigation of spatial analyses based on the entire current database, including the 2005 habitat and threat data, may identify preliminary patterns and correlations of habitat quality or threats with tortoise populations. Analyses such as these would ideally provide a basis from which to
37

Range-wide Monitoring of the Mojave Population of the Desert Tortoise: 2001-2005 Summary
identify relevant management actions, as well as hypothesized responses of tortoise populations to those actions. The recovery plan briefly described some of the management actions in the identified RUs and DWMAs as of the early 1990s. Tracy et al. (2004) included a more recent summary of recovery action implementation, but this information was very general and, in some cases, incomplete. Comprehensive monitoring for desert tortoise recovery requires an empirical survey of land modification and uses on public lands such as grazing; roads, highways, and associated traffic; and recreation. We need the assistance of the land management agencies in identifying current management and uses of the land being monitored for tortoise density. Several agencies already collect relevant information for their internal uses. While the resolution of the range-wide monitoring program is too coarse to describe local desert tortoise populations and may only provide indirect information on management effectiveness, data collected on threats and management actions and synthesized with range-wide population data may help inform where to ask more focused questions for experimental follow-up. Similarly, population data collected through the range-wide monitoring program provides a landscape context for evaluation of different management regimes or suites of threats and may provide a framework for more directed and specific research at more local levels. Fully integrating the elements of monitoring described above (tortoise population data within recovery units, habitat and threats, management actions, and local research on effectiveness of management actions) will provide a comprehensive perspective of recovery. A coordinated effort between the Desert Tortoise Recovery Office and other management agencies to develop a centralized recovery database will facilitate the collection of information necessary to achieve this perspective. Below, we describe numerous directions for future work to improve implementation and application of the monitoring program. The Desert Tortoise Science Advisory Committee is currently reviewing recovery criteria for the recovery plan revision, and range-wide distribution has been a primary topic of discussion for a new criterion. Therefore, we need to evaluate the potential for incorporating “occupancy estimation” (MacKenzie et al., 2006) into the range-wide monitoring program. Modeling occupancy identifies the proportion of an area occupied by a species, rather than absolute or relative numbers of that species (although methods also exist to estimate population numbers from an occupancy-estimation platform), and may be useful for monitoring changes in desert tortoise distribution over large landscapes. The potential for integrating occupancy estimation with the current (or modified) LDS program should be assessed. The spatial scale of the monitoring program needs to be evaluated. Sample areas have varied from year to year, with the most consistent monitoring occurring in designated critical habitat and associated DWMAs or ACECs (Tables 2-6, Maps 6-9). Large areas occupied by desert tortoises but outside critical habitat have not been regularly sampled (e.g., national parks; Desert National Wildlife Refuge; Pahrump Valley, Nevada), yet these areas are also important to recovery and are subject to tortoise management actions. Additional analyses should identify levels of sampling or stratification necessary to accurately reflect spatial distribution and maximize precision of estimates. Desert tortoises occur in
38

Range-wide Monitoring of the Mojave Population of the Desert Tortoise: 2001-2005 Summary
clumped or aggregated distributions (Duda et al., 2002; Krzysik, 2002). A better understanding of habitat characteristics that may contribute to clumped tortoise populations would allow stratification on those characteristics and lead to more precise density estimates. Incorporation of burrow and scat estimates, which are observed at higher frequencies than live tortoises, may also provide estimates of local variation in population density within RUs (Krzysik, 2002). A detailed analysis of factors contributing to variance in density estimates will allow us to improve the precision of these estimates. Effects of variation in detection probability (Pa) between survey teams, time, and space need to be evaluated and corrected, if necessary. Effects of variation in Pa between tortoises above and below ground also need to be evaluated (cf. Duda et al., 1999; Freilich et al., 2000; but see Burnham et al., 2004, for a discussion of pooling robustness). Effects of variation in the availability of tortoises for sampling (G0) across time and space need to be evaluated and corrected, as well as determining minimum sample sizes necessary to estimate this parameter, if necessary (cf. Krzysik, 2002). Efforts to model G0 indirectly are currently under way, and these should continue; a successful model of G0 would free resources currently directed toward monitoring focal animal populations. Other topics that should be investigated include the use of covariates, spatial models, and adaptive sampling, among others (Buckland et al., 2004). It may be informative to graphically display long-term plot trends or sign transects on current maps of live and dead tortoise distribution to place these historical data within the current landscape context. Comparing areas of carcass and live tortoise concentrations from the current LDS data (cf. Tracy et al., 2004) with individual study plots may provide insights into larger scale declines relative to those reported from some plots. Conversely, more isolated declines may be identified within larger areas of high live-tortoise concentration. Several practical aspects of the current monitoring program need to be evaluated. Budgeting considerations have driven annual considerations about where to sample for tortoises. Solidifying funding early enough to effectively plan the annual survey effort and award contracts or complete other necessary hiring is also critically important. Other irregularities in sampling have led to less random placement of transects actually surveyed by field teams compared to the placement of original transects selected prior to the season. Even with mandatory pre-season training for all teams, the use of different survey teams in different parts of the tortoise’s range has led to inconsistencies in data collected, which has increased considerably the time spent on the data quality control process. The data from the first years of the monitoring program indicate that the power of this program to detect population trends will require active improvement of transect placement, field techniques, and field implementation. Continued improvements in the training program, field preparation, and field coordination will increase initial data quality and reduce the time required for quality control. Effective coordination and evaluation of the monitoring program requires a clear understanding of the timelines required for the component parts of the program. Table 10 outlines the major milestones for the monitoring program, based on the experience from the last five years. Improved efficiency and consistency in the field will be accomplished by timely completion of study design and data collection refinements. The ability to describe range-wide trends will also depend on developing reliable, adequate, and consistent funding. A key
39

Range-wide Monitoring of the Mojave Population of the Desert Tortoise: 2001-2005 Summary
recommendation of a 2002 audit of the desert tortoise recovery program was that the Departments of the Interior and Defense work with other agencies and organizations “to identify and assess options for securing continued funding for range-wide population monitoring, such as developing memorandums of understanding between organizations” (General Accounting Office, 2002). Rather than developing monitoring based on annual budgeting considerations, this will allow effective planning, contracting, and hiring to be implemented under a long-term study plan. Table 10. Timeline of range-wide monitoring activities. Date Activity October Refine study design. November Conduct spatial selection of transects. December Hire/contract field crew. January Repair training transects. February Train technicians (new field workers). March Conduct training workshop for entire field crew. April – May Conduct surveys. June Conduct QA/QC. July Conduct analyses. August Write annual report. September Report results to managers. Recommendations 1. The range-wide monitoring program should continue under a formal study plan subject to
scientific review. 2. Refine LDS techniques to improve sampling efficiency and estimates of trends.
a. Investigate sampling levels or stratification needed to maximize precision of estimates.
i. Conduct a retrospective stratified analysis of the 2001-05 data. ii. Evaluate tradeoffs of randomly selecting transect locations each year vs.
establishing permanent transects based on an initial random sample or systematic design.
iii. Investigate factors contributing to aggregated population distribution. iv. Develop a desert tortoise habitat model.
b. Evaluate effects of variation in detection probability between survey teams, time, and space, as well as between tortoises found above ground and below ground.
c. Evaluate effects of variation in G0 across time and space, as well as possibilities for estimating indirectly through models.
d. Investigate the use of covariates, spatial models, adaptive sampling, and other emerging, innovative approaches to distance sampling.
3. Identify methods to estimate occupancy in order to document changes in the distribution of desert tortoises over time.
a. Conduct a retrospective analysis of existing data.
40

Range-wide Monitoring of the Mojave Population of the Desert Tortoise: 2001-2005 Summary
b. Develop sampling scheme to incorporate occupancy estimation into range-wide surveys.
4. Evaluate the spatial scale of the monitoring program. a. Consider areas not regularly sampled to date. b. Evaluate why the set of randomly placed transects selected for surveys is not reflected
in the non-randomly placed transects that are actually surveyed. c. Incorporate spatial requirements arising from addition of occupancy estimation into
the monitoring program. 5. Review the habitat/threats data collected in 2005.
a. Determine which variables measured in 2005 or what new variables may be valuable to continue collecting in the future.
b. Evaluate the potential to expand upon individual health data collected in 2005 to develop a method to assess stress in tortoises, to develop a spatially explicit model of areas in which tortoises are stressed to the point of being vulnerable to disease, and to assess temporal trends in vulnerability to disease.
6. Conduct spatial analyses of live and dead tortoise distribution across the range. a. Compare historical study-plot and sign-count data to current patterns of live and dead
tortoise concentrations. b. Summarize the 2005 habitat and threat data and compare with patterns of live and
dead tortoise concentrations. 7. Improve training lines by:
a. adding a greater number of sizes of tortoise models, b. improving the visibility of the transect markers, and c. developing alternate layouts or additional lines in different environments.
8. Evaluate the use of independent field teams in order to improve data consistency and quality. 9. Refine and formalize/document the QA/QC process. 10. Develop a range-wide recovery database to integrate land management and use data with
population data. a. Conduct an empirical survey of management by DWMA. b. Conduct an empirical survey of activities on public lands such as grazing, roads and
highways (with traffic counts), and recreation (with visitor counts). 11. Identify and assess options for securing continued funding for range-wide population
monitoring, such as developing memorandums of understanding between organizations.
41

Range-wide Monitoring of the Mojave Population of the Desert Tortoise: 2001-2005 Summary
LITERATURE CITED Anderson, D.R. 2001. The need to get the basics right in wildlife field studies. Wildlife Society Bulletin 31:1294–1297. Anderson, D.R., and K.P. Burnham. 1996. A monitoring program for the desert tortoise. Report to the Desert Tortoise Management Oversight Group. Anderson, D.R., K.P. Burnham, B.C. Lubow, L. Thomas, P.S. Corn, P.A. Medica, and R.W. Marlow. 2001. Field trials of line transect methods applied to estimation of desert tortoise abundance. Journal of Wildlife Management 65:583-597. Averill-Murray, R.C. 1999. Monitoring tortoise populations in the Sonoran Desert: a power analysis. Proceedings of the Desert Tortoise Council Symposium 1997-1998:1-9. Averill-Murray, R.C., and A. Averill-Murray. 2005. Regional-scale estimation of density and habitat use of the desert tortoise (Gopherus agassizii) in Arizona. Journal of Herpetology 39:65–72. Berry, K.H. 1984. A description and comparison of field methods used in studying and censusing desert tortoises. Appendix 2. Pp 1-33 in K.H. Berry (ed.), The status of the desert tortoise (Gopherus agassizii) in the United States. Report to the U.S. Fish and Wildlife Service from the Desert Tortoise Council. Order No. 11310-0083-81. Boarman, W.I. 2002. Threats to desert tortoise populations: a critical review of the literature. Unpubl. Report, prepared for the West Mojave Planning Team and the Bureau of Land Management. U.S. Geological Survey, Western Ecological Research Center, San Diego, CA. 86 pp. Buckland, S.T., D.R. Anderson, K.P. Burnham, and J.L. Laake. 1993. Distance Sampling: Estimating abundance of biological populations. Chapman and Hall, London. 446 pp. Buckland, S.T., D.R. Anderson, K.P. Burnham, J.L. Laake, D.L. Borchers, and L. Thomas. 2001. Introduction to Distance Sampling: Estimating Abundance of Biological Populations. Oxford Univ. Press, Oxford. 432 pp. Buckland, S.T., D.R. Anderson, K.P. Burnham, J.L. Laake, D.L. Borchers, and L. Thomas. 2004. Advanced Distance Sampling: Estimating Abundance of Biological Populations. Oxford Univ. Press, Oxford. 416 pp. Bureau of Land Management. 1998a. Decision Record for the Mojave Amendment of the Arizona Strip Resource Management Plan. BLM, Arizona Strip Field Office. Bureau of Land Management. 1998b. Las Vegas Resource Management Plan and Environmental Impact Statement. BLM, Las Vegas District.
42

Range-wide Monitoring of the Mojave Population of the Desert Tortoise: 2001-2005 Summary
Bureau of Land Management. 2000. Approved Caliente Management Framework Plan Amendment and Record of Decision for the Management of Desert Tortoise Habitat. BLM, Ely Field Office. Bureau of Land Management. 2002a. Proposed Northern and Eastern Colorado Desert Coordinated Management Plan: An Amendment to the California Desert Conservation Area Plan 1980 and Sikes Act Plan with the California Department of Fish and Game and Final Environmental Impact Statement. BLM, California Desert District, and CDFG, Inland, Desert, and Eastern Sierra Region. Bureau of Land Management. 2002b. Proposed Northern and Eastern Mojave Desert Management Plan: Amendment to the California Desert Conservation Area Plan and Final Environmental Impact Statement. BLM, California Desert District. Bureau of Land Management. 2005. Final Environmental Impact Report and Statement for the West Mojave Plan: A Habitat Conservation Plan and California Desert Conservation Area Plan Amendment. BLM, California Desert District. Burnham, K.P., S.T. Buckland, J.L. Laake, D.L. Borchers, T.A. Marques, J.R.B. Bishop, and L. Thomas. 2004. Further topics in distance sampling. Chapter 11. Pp. 307-392 in S.T. Buckland, D.R. Anderson, K.P. Burnham, J.L. Laake, D.L. Borchers, and L. Thomas (eds.), Advanced Distance Sampling: Estimating Abundance of Biological Populations. Oxford Univ. Press, Oxford. Bury, R.B., and P.S. Corn. 1995. Have desert tortoises undergone a long-term decline in abundance? Wildlife Society Bulletin 23:41-47. Corn, P.S. 1994. Recent trends of desert tortoise populations in the Mojave Desert. Pp. 85-94 in R.B. Bury and D.J. Germano (eds.), Biology of North American Tortoises. Fish and Wildlife Research 13. U.S. National Biological Survey, Washington, D.C. Duda, J.J., A.J. Krzysik, and J.E. Freilich. 1999. Effects of drought on desert tortoise movement and activity. Journal of Wildlife Management 63:1181-1192. Duda, J.J., A.J. Krzysik, and J.M. Meloche. 2002. Spatial organization of desert tortoises and their burrows at a landscape scale. Chelonian Conservation and Biology 4:387-397. Fish and Wildlife Service. 1994. Desert tortoise (Mojave population) recovery plan. U.S. Fish and Wildlife Service, Portland, Oregon. 73 pp plus appendices. Freilich, J.E., and E.L. LaRue. 1998. Importance of observer experience in finding desert tortoises. Journal of Wildlife Management 62:590–596. Freilich, J.E., K.P. Burnham, C.M. Collins, and C.A. Garry. 2000. Factors affecting population assessments of desert tortoises. Conservation Biology 14:1479-1489.
43

Range-wide Monitoring of the Mojave Population of the Desert Tortoise: 2001-2005 Summary
Freilich, J.E., R.J. Camp, J.J. Duda, and A.E. Karl. 2005. Problems with sampling desert tortoises: a simulation analysis based on field data. Journal of Wildlife Management 69:45–56. General Accounting Office. 2002. Endangered species: research strategy and long-term monitoring needed for the Mojave desert tortoise recovery program. GAO-03-23. United States General Accounting Office, Washington, D.C. Gerrodette, T. 1987. A power analysis for detecting trends. Ecology 68:1364-1372. Hatfield, J.S., W.R. Gould, B.A. Hoover, M.R. Fuller, and E.L. Lindquist. 1996. Detecting trends in raptor counts: power and Type I error rates of various statistical tests. Wildlife Society Bulletin 24:505-515. Henen, B.T. 1997. Seasonal and annual energy budgets of female desert tortoises (Gopherus agassizii). Ecology 78:283–296. Hereford, R., R.H. Webb, and C.I. Longpre. 2004. Precipitation history of the Mojave Desert Region, 1893–2001. U.S. Geological Survey. Fact Sheet 117-03, Flagstaff, Arizona. Krzysik, A.J. 2002. A landscape sampling protocol for estimating distribution and density patterns of desert tortoises at multiple spatial scales. Chelonian Conservation and Biology 4:366-379. Link, W.A., and J.S. Hatfield. 1990. Power calculations and model selection for trend analysis: a comment. Ecology 71:1217-1220. Longshore, K.M., J.R. Jaeger, and J.M. Sappington. 2003. Desert tortoise (Gopherus agassizii) survival at two eastern Mojave Desert sites: death by short-term drought? Journal of Herpetology 37:169–177. Luckenbach, R.A. 1982. Ecology and management of the desert tortoise (Gopherus agassizii) in California. Pp 1-37 in R.B. Bury (ed.), North American Tortoises: Conservation and Ecology. U.S. Department of Interior. Fish and Wildlife Service. Wildlife Research Report 12. MacKenzie, D.I., J.D. Nichols, J.A. Royle, K.H. Pollock, L.L. Bailey, and J.E. Hines. 2006. Occupancy Estimation and Modeling: Inferring Patterns and Dynamics of Species Occurrence. Academic Press, Amsterdam. 324 pp. McLuckie, A.M., M.R.M. Bennion, and R.A. Fridell. 2004. Regional desert tortoise monitoring in the Red Cliffs Desert Reserve, 2003. Salt Lake City: Utah Division of Wildlife Resources, Publication Number 04-21. 61pp. McLuckie, A.M., M.R.M. Bennion, and R.A. Fridell. Draft 2006. Regional desert tortoise monitoring in the Red Cliffs Desert Reserve, 2005. Salt Lake City: Utah Division of Wildlife Resources, Publication Number 06-06. 44pp.
44

Range-wide Monitoring of the Mojave Population of the Desert Tortoise: 2001-2005 Summary
McLuckie, A.M., D.L. Harstad, J.W. Marr, and R.A. Fridell. 2002. Regional desert tortoise monitoring in the Upper Virgin River Recovery Unit, Washington County, Utah. Chelonian Conservation and Biology 4:380-386. Peterson, C.C. 1994. Different rates and causes of high mortality in two populations of the threatened desert tortoise Gopherus agassizii. Biological Conservation 70:101–108. Peterson, C.C. 1996. Ecological energetics of the desert tortoise (Gopherus agassizii): effects of rainfall and drought. Ecology 77:1831–1844. Shrader-Frechette, K.S., and E.D. McCoy. 1993. Method in Ecology: Strategies for Conservation. Cambridge University Press, Cambridge. 328pp. Skalski, J.R., and D.S. Robson. 1992. Techniques for Wildlife Investigations: Design and Analysis of Capture Data. Academic Press, San Diego. 237pp. Swann, D.E., R.C. Averill-Murray, and C.R. Schwalbe. 2002. Distance sampling for Sonoran desert tortoises. Journal of Wildlife Management 66:969–975. Thomas, L., K.P. Burnham, and S.T. Buckland. 2004a. Temporal inferences from distance sampling surveys. Pp. 71-107 in S.T. Buckland, D.R. Anderson, K.P. Burnham, J.L. Laake, D.L. Borchers, and L. Thomas (eds.) Advanced Distance Sampling. Oxford University Press, New York. Thomas, L., J.L. Laake, S. Strindberg, F.F.C. Marques, S.T. Buckland, D.L. Borchers, D.R. Anderson, K.P. Burnham, S.L. Hedley, J.H. Pollard, and J.R.B. Bishop. 2004b. Distance 4.1. Release 2. Research Unit for Wildlife Population Assessment, University of St. Andrews, UK. http://www.ruwpa.st-and.ac.uk/distance/ Tracy, C.R., R. Averill-Murray, W.I. Boarman, D. Delehanty, J. Heaton, E. McCoy, D. Morafka, K. Nussear, B. Hagerty, and P. Medica. 2004. Desert Tortoise Recovery Plan Assessment. Report to U.S. Fish and Wildlife Service. 217 pp. Wilson, D.S., K.A. Nagy, C.R. Tracy, D.J. Morafka, and R.A. Yates. 2001. Water balance in neonate and juvenile desert tortoises, Gopherus agassizii. Herpetological Monographs 15:158–170.
45

Range-wide Monitoring of the Mojave Population of the Desert Tortoise: 2001-2005 Summary
APPENDIX: DETAILED METHODS
Spatial Methods of Transect Selection Numerous methodological differences exist in the implementation of LDS between 2001 and 2005. We discuss these differences below. In addition, there was little external scientific review by GIS or spatial statisticians of the methods used in 2001 and 2002-2003 prior to their implementation. The 2004 and 2005 seasons had the benefit of input from such experts. Methods for selecting available sample areas and transect start points changed considerably between 2003 and 2004, with fewer changes implemented in 2005. The following sections outline methods for selecting available sample areas, creating and selecting transect start points, on-the-ground implementation of transects, and issues with the methods used each year. 2001 Season Spatial selection of transects in 2001 occurred in the following three steps: Step 1: 2001 Exclusion Criteria.—We used the following exclusion criteria to delineate the sample area available for generation of transect points. No transect’s origin shall be located:
• above 4,200ft mean sea level. • on slopes of 30% or greater. • within a permanent body of water. • within a playa. • on or within 25m of a major road. • on private land. • within a restricted area of a military base.
We projected all spatial data files in UTM Zone 11 NAD83. We converted all vector data sets to 30m x 30m rasters to coincide with the spatial resolution of the digital elevation model used for elevation and slope calculations. We assigned each data set a cost surface generation field with values of either 1 (not available to be sampled) or 0 (available to be sampled). We then summed the seven input data sets to create the final sampling availability surface. Any cell that summed to the value 0 was available to be sampled; any cell with a summed value of 1 or greater was not available to be sampled. Step 2: 2001 Transect Start Point Generation.—We re-sampled the above sampling availability surface from its 30m x 30m cell size to a 400m x 400m cell size. We extracted the center point of each cell containing a 0 and attributed it with x and y coordinates in UTM meters. We then clipped this point dataset with the various sampling areas (i.e., critical habitat units, national park service boundaries, military base boundaries, etc.) to generate a population of available transect start points. From this data set, we randomly selected a set number of points from each sampling area using a random reselect function in the GIS software. Step 3: 2001 Implementation of Sampling Strategy.—We designated the set of randomly selected points as the southwest corner of transects and provided them to each contractor. Transects were 400m on a side and walked in a square so as to end at the start point. As a contingency in the
46

Range-wide Monitoring of the Mojave Population of the Desert Tortoise: 2001-2005 Summary
event that some selected transects could not be walked for logistical reasons (e.g., major highways, hazardous rock formations, and hills too steep for safe navigation), we provided more transects to the contractors than could be walked. As a result, transects actually walked throughout the season represent the final set of sample transects. 2002-03 Seasons Spatial selection of transects in 2002 and 2003 occurred in the following three steps: Step 1: 2002/2003 Available Sample Area.—GIS methods and procedures were identical for years 2002 and 2003. They are therefore combined for the purposes of this discussion. The following exclusion criteria were used to restrict transect points. No transect’s origin shall be located:
• above 4,200ft mean sea level. • on slopes of 30 degrees or greater. • within a permanent body of water. • within a playa. • on a major road. • on private land. • within a restricted area of a military base.
All spatial data files were projected in UTM Zone 11 NAD83. Raster datasets (i.e., elevation and slope) were converted to vector datasets. Subtle but important distinctions between 2001 and 2002/2003 include:
• a switch from percent to degrees in describing slope, • the entire transect vs. transect origin had to be outside the area described by elimination
criteria, and • all elimination criteria datasets were buffered by 700m.
Step 2: 2002/2003 Transect Start Point Generation.—Following delineation of potential habitat, the surface of the habitat dataset was re-sampled to a cell size of 700m x 700m. We then extracted the center point of each cell, creating a population of transect origins available to be sampled rangewide. Selecting the specific start location of transects to be walked consisted of five steps.
• Step 1. The total number of transect start points required for a given sampling area was identified. The number of start points for a given sampling area was based on the number of km to be walked for the specified area.
• Step 2. The rangewide population of available transect origins, generated above, was segregated into potential transect start point subpopulations by sampling area. The potential transect start point population was further segregated within the sampling area to a population of possible transects within defined areas.
• Step 3. Once possible transect start points were identified (Subgroup 1), transect start points actually walked during 2001 monitoring were spatially analyzed using the 2002
47

Range-wide Monitoring of the Mojave Population of the Desert Tortoise: 2001-2005 Summary
omission criteria. All walked 2001 transect start points surviving the 2002 omission criteria analysis process became transect start points to be walked in 2002 (Subgroup 2).
• Step 4. A 700-m buffer was placed around each point in Subgroup 2. Any point in Subgroup 1 falling within this 700-m buffer was eliminated from further consideration.
• Step 5. Using the random reselect function in the GIS software, sufficient transect start points were randomly selected from Subgroup 1 to meet the requirements outlined in step 1 when combined with the transect points in Subgroup 2. If more start points were required for a particular stratum, the number required was randomly selected from Subgroup 1. This set of points was carried over into 2003.
Step 3: Implementation of Sampling Strategy.—In contrast to 2001, 2002 and 2003 transects were walked in a bowtie fashion, with the southwest corner of Transect 1 corresponding to the northeast corner of Transect 2. Transects were 500m on a side and walked in a square so as to end at the start point. As a contingency in the event that some selected transects could not be walked for logistical reasons, more transects were given to the contractors than could be walked. As a result, transects actually walked during the field season represent the final set of sample transects. Transects were started from the same corner and walked in the same direction. Waypoints were taken at each corner of the transect. 2004 Season Spatial selection of transects in 2004 occurred in the following three steps: Step 1: 2004 Available Sample Area.—In 2004 the only exclusion criterion restricting transect start points was elevation. No transect’s origin was to be located above 4,200ft mean sea level. All spatial data files were projected in UTM Zone 11 NAD83. We converted the elevation raster dataset to a vector dataset. Following removal of the exclusion criterion, we merged all sampling areas into a single 2004 spatial polygon. Step 2: 2004 Transect Start Point Generation.—We generated a bounding box around the sampling areas using its southern, northern, eastern, and western extents. We generated a random sample of 30,000 points within the bounding box. We then clipped the resulting points to each monitoring area, creating a subpopulation of available transect points. Since each point was randomly generated, we selected the first 1 to N points (N being the number of transects required for a given sampling area plus a 25% overage) for use as transect start points and designated this point the southwest corner of a transect. We eliminated possible transect origins that fell within areas of greater then 4,200ft mean sea level. As a final assurance of randomness, we tested these start points for spatial randomness. We regenerated any sampling area in which the proposed start points were not spatially randomly distributed using the same process as defined above. In 2004 transects were not allowed to cross sample area boundaries. To insure this did not occur, we spatially evaluated all selected transect points using a GIS. If a portion of a randomly located transect fell outside the sampling area boundary, we moved the coordinates of the transect start point the minimal distance possible, so that the entire transect was contained within its given sample area. This rule also applied to transects that would cross into a neighboring sampling area (some sampling areas have contiguous borders).
48

Range-wide Monitoring of the Mojave Population of the Desert Tortoise: 2001-2005 Summary
Step 3: Implementation of Sampling Strategy.—Transects continued to be walked in a square such that the end point coincided with the start point. However, in contrast to 2001-2003, in which each meter of a transect was walked three times in 100-m increments, transect lengths were walked only once. As a result, we increased overall transect size to either 10km or 12km. Under this scenario, transects were either 2.25km or 3km on a side. In addition, we provided rules for “bouncing” off of unsafe terrain to contractors. These rules (discussed under Field Methods, below) explain why some transects are not represented by a square. Transect waypoints were collected either every 500m or 1000m, and at every unplanned turn (i.e., “bounce”) along a given transect. 2005 Season Spatial selection of transects in 2005 occurred in the following three steps: Step 1: 2005 Available Sample Area.—Implementation of the 2005 sampling strategy was a culmination of lessons learned from 2001-2004. For the 2005 field season, we used no “exclusion” criteria to limit the possible location of transects within the identified sampling area. We identified areas with elevation above 4,200ft mean sea level solely for field-crew awareness. Step 2: 2005 Transect Start Point Generation.—Using a total required population of 724 transects (number of transects walked in 2004, 658 + 10% excess = 724), we assigned the number of transects to be walked in each sampling area based on the percent area a given area occupied out of the total area of all sampling areas. For each established sampling area, we generated a random sample of points, equal to that required for the given area, within the sampling area boundary. We accomplished this by using the boundary of a given sampling area as a bounding polygon then generating random points within the polygon. We tested the resulting population of transect points in each sampling area for spatial randomness to insure spatial data integrity. Contrary to previous years, where generated transect points were designated southwest corners, we randomly assigned transect points generated in 2005 as northeast, southeast, southwest, or northwest corners. Step 3: Implementation of Sampling Strategy.—Transects continued to be walked in a square, such that the end point coincided with the start point. “Bounce” rules still applied in 2005, allowing field crews to adjust to dangerous terrain. With only a few exceptions, transects were consistently 12km in total length, and waypoints were collected at 500-m intervals and at “bounce” points. Contrary to 2004, transects were not moved to insure that all parts of a given transect were contained within designated sampling areas or to avoid any part of a given transect traversing terrain above 4,200ft elevation. We allowed transects to be walked wherever they lay and only modified them in accordance with the designated bounce rules at the discretion of the field monitoring crew. We developed Data Management and QA/QC Plans prior to data collection. Issues with Transect Selection 2001 Season Describing methods used for transect generation and selection so many years after the fact has been problematic. No formal QA/QC process or data management plan were developed prior to
49

Range-wide Monitoring of the Mojave Population of the Desert Tortoise: 2001-2005 Summary
or in conjunction with the 2001 data collection season. This, in combination with staff turnover within various participating agencies, has made it difficult to identify original data, methods used, processing steps employed, or products used/developed in 2001 with 100% certainty. Despite these difficulties, we have managed to recreate most of the products necessary for adequate documentation and have retroactively implemented a QA/QC plan. Transect selection problems fell primarily within two main categories: sample design strategy and implementation of said strategy in a GIS. Sample design strategy.—Though selection of the elimination criteria seemed logical at the time, the failure to consider the spatial consequences of these criteria created numerous issues. The primary objective of LDS is to estimate population densities on a range-wide basis (as sampled via individual sampling areas such as critical habitat units [CHUs]) and within individual sampling areas themselves. Due to the spatially restrictive nature of the sampling criteria, density estimates are not representative of individual sampling area, but instead represent only those areas available to be sampled. Although sample locations were technically randomly generated, they were not spatially randomly distributed across their respective sampling areas. In many sampling areas, more area was unavailable for sampling than was actually available to be sampled. In addition, problems with the selection of transect start points, as discussed below, further complicates the matter of what was available to be sampled. As such, density estimates must be presented with a caveat. These density estimates cannot be interpreted as representative of their respective sampling areas, but instead, representative only of those areas available to be sampled within a given area. Sample design strategy implementation.—The first problem with implementation of the above sampling criteria in a GIS is the complexity of the process used. The conversion of datasets back and forth between vector and raster was unnecessary and increased the probability of error. Available slope and elevation areas should have been converted to vector data sets. All remaining processing steps could have been conducted using methods available to vector data sets, thereby dramatically reducing the probability for error. Of all the methods used, selection of available transect points on a 400-m spacing interval is the most problematic. First, it is unknown how combinations of 30-m cells with varying degrees of availability (some 0’s and some 1’s) were re-sampled to 400-m cells. Second, areas technically available to be sampled as determined in Step 1 were procedurally eliminated via the choice of this spacing. As a result some areas that should have been available to be sampled had a 0% probability of being selected, thus violating the first rule of a random sample that all locations have an equal probability of being selected. The use of a simple random point generator could have accomplished this. These same generators can be used to establish non-overlapping transects, set a minimum distance between start points, or set a minimum distance to edge without violating the assumptions of a random sample. The second issue involved on-the-ground implementation of the sampling strategy and can be thought of as a spatial integrity problem. Contractors did not always start at the same corner, they did not consistently document the corner they started at, nor the direction walked. Unless live or carcass observations were made along the transect, it was impossible to determine the orientation of that transect. The ideal situation would be to have the line actually walked. Given current data collection methods this is not possible; however, with at least some consistency in start location
50

Range-wide Monitoring of the Mojave Population of the Desert Tortoise: 2001-2005 Summary
and direction walked, a hypothetical transect could have been created. This hypothetical transect, though not ideal, would allow for additional spatial analyses to be conducted. Data collection was not consistent for California and Nevada. As a result, no additional corner coordinates were required to be collected for California transects. 2002-03 Seasons Many of the same problems with development and implementation of the 2001 sample design remained in 2002/2003 (i.e., failure to document, no Data Management or QA/QC Plan, sampling selection strategy, implementation of said strategy in a GIS, etc.). The addition of a 700-m buffer around elimination areas and possible transect start points further amplified the problem of spatial distribution and randomness within intended sample areas. More of the available sample area was eliminated, restricting available sample areas even greater than in 2001. As a result, it is very difficult to draw conclusions on the status of a population in a particular area. As an example, of the 3103 sq km within Superior Cronese, 2136 sq km were available to be sampled in 2001, while only 545 sq km were available in 2002/2003. In addition, between 2001 and 2002 the criteria for slope elimination changed from >30% to >30 degrees. The primary problem with the 2001-2003 seasons was a failure to seek external GIS and spatial statistical review of the sampling design, implementation protocols, and resulting data. Absence of an external critical evaluation of each year’s efforts resulted in a failure to identify key spatial issues and incorporate adaptive changes to the process that would have significantly enhanced the value and usefulness of future years’ data. 2004 Season Transect selection in 2004 improved considerably over 2001-2003. We documented the process in a timely fashion, reduced elimination criteria to only elevation constraints, and streamlined and considerably simplified the GIS processes from previous years. Though not well documented, we developed an infant Data Management and QA/QC Plan. We finalized the QA/QC Plan post data collection and implemented with a final database delivered to USFWS in summer 2005. The only issues known at this time with implementation of the study design were inconsistent transect length (i.e., 10km vs. 12km) and inconsistent waypoint collection interval (i.e., 500m vs. 1000m). Though not ideal, in both cases the inconsistency does not compromise the spatial integrity of the data. 2005 Season While the transect generation/selection process continued to improve in 2005, the 10% excess transects provided to survey crews (compared to 25% in previous years) proved insufficient for achieving the desired number of walked transects. With the elimination of all exclusion criteria, a greater number of transect points likely fell within areas that were deemed “unwalkable” by survey crews. This necessitated, in some cases, regenerating the entire population of random transect points for a given stratum with an increased number of points available. In Nevada, contractors identified the fact additional transect points were required only after they had walked all “walkable” transects in a given sampling area. This necessitated the creation of an additional subpopulation of transect points and required these points be integrated into the original population of transect points and tested for randomness in order to maintain spatial integrity of all randomly generated points within the given sampling area. We also discovered the issue of
51
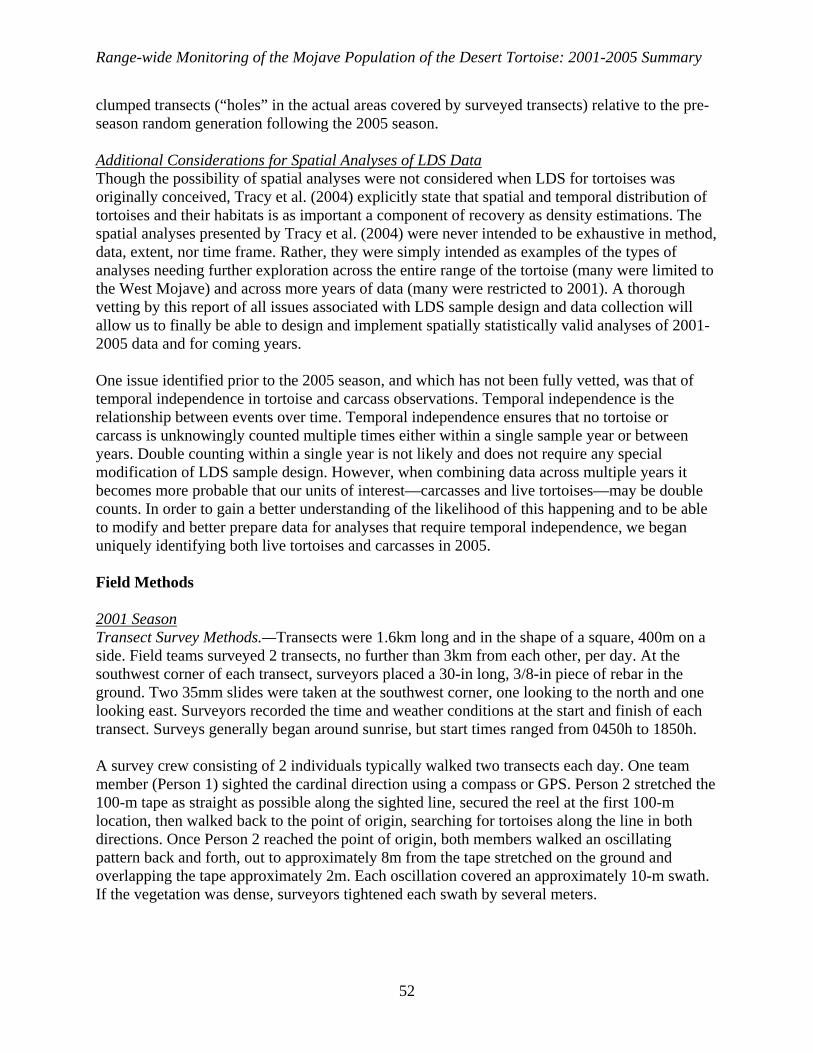
Range-wide Monitoring of the Mojave Population of the Desert Tortoise: 2001-2005 Summary
clumped transects (“holes” in the actual areas covered by surveyed transects) relative to the pre-season random generation following the 2005 season. Additional Considerations for Spatial Analyses of LDS Data Though the possibility of spatial analyses were not considered when LDS for tortoises was originally conceived, Tracy et al. (2004) explicitly state that spatial and temporal distribution of tortoises and their habitats is as important a component of recovery as density estimations. The spatial analyses presented by Tracy et al. (2004) were never intended to be exhaustive in method, data, extent, nor time frame. Rather, they were simply intended as examples of the types of analyses needing further exploration across the entire range of the tortoise (many were limited to the West Mojave) and across more years of data (many were restricted to 2001). A thorough vetting by this report of all issues associated with LDS sample design and data collection will allow us to finally be able to design and implement spatially statistically valid analyses of 2001-2005 data and for coming years. One issue identified prior to the 2005 season, and which has not been fully vetted, was that of temporal independence in tortoise and carcass observations. Temporal independence is the relationship between events over time. Temporal independence ensures that no tortoise or carcass is unknowingly counted multiple times either within a single sample year or between years. Double counting within a single year is not likely and does not require any special modification of LDS sample design. However, when combining data across multiple years it becomes more probable that our units of interest—carcasses and live tortoises—may be double counts. In order to gain a better understanding of the likelihood of this happening and to be able to modify and better prepare data for analyses that require temporal independence, we began uniquely identifying both live tortoises and carcasses in 2005. Field Methods 2001 Season Transect Survey Methods.—Transects were 1.6km long and in the shape of a square, 400m on a side. Field teams surveyed 2 transects, no further than 3km from each other, per day. At the southwest corner of each transect, surveyors placed a 30-in long, 3/8-in piece of rebar in the ground. Two 35mm slides were taken at the southwest corner, one looking to the north and one looking east. Surveyors recorded the time and weather conditions at the start and finish of each transect. Surveys generally began around sunrise, but start times ranged from 0450h to 1850h. A survey crew consisting of 2 individuals typically walked two transects each day. One team member (Person 1) sighted the cardinal direction using a compass or GPS. Person 2 stretched the 100-m tape as straight as possible along the sighted line, secured the reel at the first 100-m location, then walked back to the point of origin, searching for tortoises along the line in both directions. Once Person 2 reached the point of origin, both members walked an oscillating pattern back and forth, out to approximately 8m from the tape stretched on the ground and overlapping the tape approximately 2m. Each oscillation covered an approximately 10-m swath. If the vegetation was dense, surveyors tightened each swath by several meters.
52

Range-wide Monitoring of the Mojave Population of the Desert Tortoise: 2001-2005 Summary
The majority of transects were sampled using the procedure outlined above. Kiva Biological Consulting modified the methods slightly, because the detection curve showed that area within 0-1m of the line was not being searched adequately. Initially, Person 1 walked 100m along the transect and laid out the 100-m tape. Person 2 began immediately walking a zigzag pattern 0-8m along both sides of the line, while Person 1 laid the line. At 100m, Person 1 turned around and walked a zigzag pattern (within 2m of the line) back to the start point. When Person 1 arrived at the start point, they quickly walked up to the point that Person 2 had reached, generally around meter 60. Each crew member would then take a side of the line and walk a zigzag pattern 0-8m from the line. By 9 April, personnel determined the technique was not repeatable and that the technique was not achieving adequate coverage between 0-1m from the line. The procedure was modified so that Person 1 still laid out the line, but Person 2 walked slightly behind Person 1, and 3m from and parallel to the line. At 100m, Person 1 would walk back along the line while Person 2 walked back on the opposite side, lm from and parallel to the line. When both surveyors got back to the 0 point, they would walk the normal zigzag pattern 0-8m from the line. Transects were walked with this methodology from 10-17 April. Checking the field sampling results on 17 April, we determined that the portion from 0-1m from the line was still not being searched adequately. After discussion with U.S. Geological Survey and Fish and Wildlife Service personnel, Person 2 was placed 1m from the line, but otherwise walking the transect in the same fashion as transects had been walked from 10-17 April 2002. The detection curve improved with fewer tortoises being observed between 1-2m from the transect line. This final methodology was used from 18 April until the end of the surveys on 29 May and would subsequently be used during the 2002 field season. Data collection.—Surveyors recorded the perpendicular distance to the nearest 0.1m from the transect line to all live tortoises observed. When a tortoise was located, both crew members participated in collecting data. Surveyors recorded time, air temperature, GPS coordinates and error, elevation, sex, behavior, signs of disease, and any additional noteworthy comments. Surveyors noted whether tortoises in burrows were clearly visible with or without a mirror and recorded visible tortoises as if they were above ground. If the tortoise was in a burrow, surveyors estimated its size and sex and recorded the UTM coordinates. If a tortoise was found above ground, surveyors gathered additional data: MCL in millimeters (mm), weight in grams, and health status. The animal’s face was inspected for signs of Upper Respiratory Tract Disease (URTD), and the shell inspected for signs of cutaneous dyskeratosis (shell disease) lesions. For carcasses (primarily entire shell remains or nearly so), surveyors recorded data similar to that for live tortoises, i.e., UTM, sex, MCL or size class (Juvenile <100mm, Immature 101-180mm, Subadult 181-207mm, Adult >208mm), and time since death, if possible. Surveyors recorded data for live animals and carcasses on field data sheets. 2002 Season In 2002 we enlarged the sampling grid into a bow-tie shape and added 100m to each side of the transect square (Fig. A-1). Thus, each square was 500m on a side with the two transects totaling 4km (2km for each square). We numbered the first half of the bow-tie “Transect 1” (usually the northern-most transect) and the second transect “Transect 2.” Surveyors searched transects similarly to 2001. Transect start times ranged from approximately 0430h to 1500h with a few transects beginning as late as 1800h. Data-collection procedures followed those for 2001, with
53

Range-wide Monitoring of the Mojave Population of the Desert Tortoise: 2001-2005 Summary
the modification that data were recorded electronically using Personal Data Assistants (PDAs), in addition to paper data sheets.
Fig. A-1. Transect-sampling pattern used in 2002 and 2003. Each segment is 500m. 2003 Season Survey protocols generally followed those of 2002 with the exception that in 2003 we did not number each 2-km half of the “bow-tie” as 1 and 2. We considered the entire 4-km bowtie as a continuous transect and numbered each point of inflection differently. All transects were initiated between approximately 0500h and 1145h. Data-collection procedures followed those for 2002. 2004 Season Transect Survey Methods.—The survey technique changed substantially in 2004 compared to 2001–2003. The standard transect was 12km in length, comprised of 24, 500-m segments defined by waypoints at which surveyors recorded UTM coordinates. The transect formed a square with 3-km sides. Some transects were 10km in length with 2.5-km sides. Surveyors recorded transect number, crew member names, time (daylight savings time), date, and initial r coordinates (see Data collection, below) at the beginning of each transect. All transects were initiated between approximately 0550h and 1030h. During each transect, surveyors spent an equal amount of time in the leader and follower positions, alternating positions after each waypoint or side of the transect. Using a compass
54

Range-wide Monitoring of the Mojave Population of the Desert Tortoise: 2001-2005 Summary
(adjusted for declination), the leader walked along the designated bearing and pulled a 25-m length of durable line. The path that the leader walked became the center of the transect, and we calculated transect length geometrically from recorded coordinates. Surveyors devoted special attention to make sure that the transect line did not “drift” toward a tortoise when one was observed. Surveyors passed the line over the top or directly through shrubs or trees lying in the transect path, and special attention was paid to searching vegetation where this was necessary. Surveyors recorded coordinates at 500-m intervals (waypoints) and at corners where the transect turns 90°. The follower trailed the leader at the end of the 25-m line. Both leader and follower scanned for tortoises independently (with no back-tracking or zigzag searching), and the role of the crew member finding each tortoise was recorded. The follower notified the leader immediately if the transect deviated from the designated bearing. As the leader progressed along the transect, he/she scanned the ground in the immediate vicinity (about 5m from the line) for tortoises. The leader did not deviate from the transect path, except in limited instances to investigate whether a tortoise was present in a burrow. If it was necessary to leave the transect path to investigate a burrow or a suspected tortoise more closely, the leader dropped the end of the line in place, so that the transect path would remain constant. The follower used the same search techniques as the leader. If the leader stopped to investigate a burrow, the follower also stopped to maintain position at the end of the 25-m line. If the follower needed to investigate a burrow or suspected tortoise, the leader stopped until this was done. Many transects encountered obstacles that made it impossible to achieve the default transect pattern. Such obstacles included major highways, hazardous rock formations, and hills too steep for safe navigation. When such obstacles were encountered, surveyors adjusted the transect path according to the following rules. Any shifts maintained the 500-m segment lengths.
• Transects did not cross major highways. If the highway was perpendicular to the current bearing, surveyors shifted the transect (south for east-west highways and west for north-south highways) so that a corner occurred about 100m from the edge of the right-of-way (usually a fence).
• Surveyors routed transects away from hazardous cliff areas. Surveyors often achieved this by deflecting the transect around the hazardous terrain in 90° turns at the nearest 500-m waypoint, rather than shifting the entire transect (Fig. A-2).
• Surveyors crossed washes without interrupting the transect. If they encountered a steep bank that would be hazardous to descend or ascend, then the follower stayed at the point where the transect intersected the wash, while the leader found a safe passage. The line was then passed down (or up), and the leader continued on the correct bearing (waiting for the follower to catch up). Surveyors treated large washes without easy passages or rocky canyons as linear obstacles the same as highways.
Using a blank map form, the follower sketched the outline of the transect, showing the numbered waypoints, the bearings, and the lengths of each transect segment to aid the crew in making proper decisions on segment lengths and bearings. The approximate positions of any tortoises found were indicated on the map.
55

Range-wide Monitoring of the Mojave Population of the Desert Tortoise: 2001-2005 Summary
Fig. A-2. Example of transect deflection around a steep hill. Transect bearing north from start point (indicated by red circle) runs into cliff. Transect deflected to the east 500 m, then resumes northern bearing. Data collection.—Data collected when a tortoise or carcass was found differed somewhat from previous years. If the leader located a tortoise or carcass in the 180° semicircle in front of him/her, the leader stopped immediately, establishing the position of the transect line. The follower came forward to assist, and together they measured the azimuth (compass bearing), the distance from the end of the line to the tortoise (the radial distance, r), and the bearing of the 25-m line (the local bearing) (Fig. A-3). Surveyors measured radial distances to the nearest 0.1m and recorded them on the PDA and paper data sheets. A programmed routine in the database calculated the perpendicular distance automatically as r * sin (azimuth – local bearing). Ideally, the bearing of the 25-m line would have been the same as the transect bearing, but discrepancies often occurred, and accounting for these made the perpendicular distances more accurate. Once the transect was resumed, however, the leader progressed along the original, correct bearing. We assumed that the small deviations of the local bearing were random and tended to cancel out, so that use of either the local bearing or the transect bearing produced the same detection function. Occasionally, surveyors found a tortoise or carcass behind the follower. The same procedure described above applied, except that the surveyors measured the azimuth and distance from the trailing end of the line. More frequently, surveyors located a tortoise or carcass between the leader and follower. In this case, they measured perpendicular distance directly to the line. Surveyors collected the same data for each live tortoise or carcass found as in previous years, with the addition that field workers collected blood samples from a total of 140 tortoises for genetics and health analyses (which will be reported in a subsequent report).
56

Range-wide Monitoring of the Mojave Population of the Desert Tortoise: 2001-2005 Summary
Fig. A-3. Schematic of position data collected to determine the perpendicular distance from a tortoise to the transect line. 2005 Season Survey protocols generally followed those of 2004. In addition to the standard data collected on live tortoises and carcasses each of the previous years, field workers collected (or attempted to collect) blood samples from a total of 271 tortoises for genetics and health analyses. Field workers also recorded observations of active burrows, scat, trash dumping, unleashed dogs, roads and tracks, exotic weeds, and ravens along each transect. These additional data will be summarized in a future report and are not described here. Data Quality Analysis/Quality Control Although there were differences in the implementation of Quality Analysis and Quality Control (QA/QC) each year, we applied similar general methods, including the following phases: 1) Contractor QA/QC, conducted by the contractors who surveyed the transects; 2) Second-level QA/QC, conducted by the Mojave Desert Ecosystem Program (MDEP); and 3) Final QA/QC, conducted under contract by TopoWorks (TW). Table A-1 describes the main types of QA/QC checks that we performed throughout the three phases. We re-evaluated some checks in more than one phase of the QA/QC process in order to ensure that those particular types of errors did not make it into the final database. Phase 1: Contractor QA/QC The contractor QA/QC phase included a low degree of complexity and the following steps:
57

Range-wide Monitoring of the Mojave Population of the Desert Tortoise: 2001-2005 Summary
• Import the data from paper data sheets into Microsoft Excel (2001) or from the Pendragon PDA database into Microsoft Access (2002-05).
• Perform checks designed to identify common errors that could be easily corrected by the contractors. It was the contractors’ responsibility to perform an initial level of QA/QC and correct these errors.
• Make and document corrections.
Table A-1. QA/QC analyses conducted on LDS data, 2001-05. Type Description Example Relationship Identifies orphans or deviations in the
expected number of features related to another feature
More than 22 waypoints related to a transect
Domain Identifies values that are not within a specified range or set
Elevation not within range of 0-1281m
Duplicate Identifies duplicate records Duplicate transects Attribute conditions
Identifies records that do not meet specific conditions for attribute values
Observer does not match the lead or follow for the last waypoint
Blood sample attempted, but blood sample method is Null
Spatial conditions
Identifies records that do not satisfy a spatial relationship
Observations that are more than an allowed distance outside of the sampling area
Observations that are more than 50m away from their related transect
Phase 2: Second-Level QA/QC The second-level QA/QC phase included an increasing level of complexity and the following steps: • Import the two contractor databases into a single, integrated database. • Finalization of data entry (for data lost or mishandled during the original data import/entry
process). • Create lookup tables, as necessary (e.g., site and observers). • Calculate UTM easting and northing values. • Initial calculation of each segment, transect and total transect line length walked in the
database. • Standardize field names. • Initial standardization of field values, ensuring the best abbreviations or full text when
feasible. • Initial conversions from erroneous field data type formats. • Standardize field values.
58

Range-wide Monitoring of the Mojave Population of the Desert Tortoise: 2001-2005 Summary
• Perform and document the following types of checks: relationships, domains, duplicates, attribute conditions, and simple spatial conditions (e.g., abnormal segment lengths, visual checks).
• Initial polygon creation for uncovering issues encountered during survey. • Make and document corrections (especially ones that require review of datasheets). • Generate an error report. • Generate metadata. • Generation of a standardized database containing all possible data collected for final QAQC
review. Phase 3: Final QA/QC The final QA/QC phase included an increasing level of complexity and the following steps: • Create an ArcGIS geodatabase. • Import pre-season GIS shapefiles into the geodatabase and generate and import spatial
datasets for the transects, waypoints, observations, and other data relating to transects. • Verify that pre-season GIS shapefile attribution matches database attribution (site,
transects_walked, etc.). • Generate unique identifiers where they may be missing (e.g., observations with a blank
detection_number). • Import tabular data for the errors and DTMIC issues identified by MDEP. • Add a unique identifier for QA/QC. • Create lookup tables. • Link the MDEP error records with their associated database record if no key attribute was
provided. • Integrate the MDEP errors table with the TopoWorks violations tables. • Standardize field values (ensuring the best abbreviations, full text when feasible). • Convert numeric fields from text format to numeric format. • Perform and document the following checks: relationships, domains, duplicates, attribute
conditions, and complex spatial conditions (e.g., an observation is within 50m of its transect line).
• Make and document corrections. • Identify whether corrections were due to an “error” vs. some other reason (such as
equipment failure). • Generate an error report. • Create a final database that included:
o Standardized field names o Field describing whether a GPS grab was successful or not o Field on the stratum boundary for the final number of transects sampled o Field on the transects indicating the name of the associated scanned datasheet file o Fields addressing transect length (may require combining lengths for transects that
are not independent) o Metadata
• Generate final deliverable products in a variety of formats (e.g., geodatabase, shapefiles, Excel, Access).
59

Range-wide Monitoring of the Mojave Population of the Desert Tortoise: 2001-2005 Summary
MAPS
60

Range-wide Monitoring of the Mojave Population of the Desert Tortoise: 2001-2005 Summary
Map 1. Available sample area during 2001 LDS surveys (see Appendix for details on how these areas were selected).
61

Range-wide Monitoring of the Mojave Population of the Desert Tortoise: 2001-2005 Summary
Map 2. Available sample area during 2002 LDS surveys. Buffered elimination criteria restricted available sample areas compared to 2001 (see Appendix for more information).
62

Range-wide Monitoring of the Mojave Population of the Desert Tortoise: 2001-2005 Summary
Map 3. Available sample area during 2003 LDS surveys. Buffered elimination criteria restricted available sample areas compared to 2001 (see Appendix for more information).
63

Range-wide Monitoring of the Mojave Population of the Desert Tortoise: 2001-2005 Summary
Map 4. Available sample area during 2004 LDS surveys (see Appendix for details on how these areas were selected).
64

Range-wide Monitoring of the Mojave Population of the Desert Tortoise: 2001-2005 Summary
Map 5. Available sample area during 2005 LDS surveys (see Appendix for details on how these areas were selected).
65

Range-wide Monitoring of the Mojave Population of the Desert Tortoise: 2001-2005 Summary
Map 6. Distribution of transects, live tortoises, and dead tortoises during LDS surveys in the Edwards AFB, Fremont-Kramer, MCAGCC, Ord-Rodman, and Superior-Cronese sampling areas. (A) 2001.
66
Range-wide Monitoring of the Mojave Population of the Desert Tortoise: 2001-2005 Summary
Map 6. Distribution of transects, live tortoises, and dead tortoises during LDS surveys in the Edwards AFB, Fremont-Kramer, MCAGCC, Ord-Rodman, and Superior-Cronese sampling areas. (B) 2002.
67

Range-wide Monitoring of the Mojave Population of the Desert Tortoise: 2001-2005 Summary
Map 6. Distribution of transects, live tortoises, and dead tortoises during LDS surveys in the Edwards AFB, Fremont-Kramer, MCAGCC, Ord-Rodman, and Superior-Cronese sampling areas. (C) 2003.
68

Range-wide Monitoring of the Mojave Population of the Desert Tortoise: 2001-2005 Summary
Map 6. Distribution of transects, live tortoises, and dead tortoises during LDS surveys in the Edwards AFB, Fremont-Kramer, MCAGCC, Ord-Rodman, and Superior-Cronese sampling areas. (D) 2004.
69

Range-wide Monitoring of the Mojave Population of the Desert Tortoise: 2001-2005 Summary
Map 6. Distribution of transects, live tortoises, and dead tortoises during LDS surveys in the Edwards AFB, Fremont-Kramer, MCAGCC, Ord-Rodman, and Superior-Cronese sampling areas. (E) 2005.
70

Range-wide Monitoring of the Mojave Population of the Desert Tortoise: 2001-2005 Summary
Western Mojave RU
Eastern Colorado RU
Map 7. Distribution of transects, live tortoises, and dead tortoises during LDS surveys in the Pinto Mountain, Joshua Tree, and Chuckwalla sampling areas. The entire Joshua Tree sampling area is included within the Western Mojave Recovery Unit for purpose of analyses in this report. (A) 2001.
71

Range-wide Monitoring of the Mojave Population of the Desert Tortoise: 2001-2005 Summary
Western Mojave RU
Eastern Colorado RU
Map 7. Distribution of transects, live tortoises, and dead tortoises during LDS surveys in the Pinto Mountain, Joshua Tree, and Chuckwalla sampling areas. (B) 2002.
72

Range-wide Monitoring of the Mojave Population of the Desert Tortoise: 2001-2005 Summary
Western Mojave RU
Eastern Colorado RU
Map 7. Distribution of transects, live tortoises, and dead tortoises during LDS surveys in the Pinto Mountain, Joshua Tree, and Chuckwalla sampling areas. (C) 2003.
73

Range-wide Monitoring of the Mojave Population of the Desert Tortoise: 2001-2005 Summary
Western Mojave RU
Eastern Colorado RU
Map 7. Distribution of transects, live tortoises, and dead tortoises during LDS surveys in the Pinto Mountain, Joshua Tree, and Chuckwalla sampling areas. (D) 2004.
74

Range-wide Monitoring of the Mojave Population of the Desert Tortoise: 2001-2005 Summary
Western Mojave RU
Eastern Colorado RU
Map 7. Distribution of transects, live tortoises, and dead tortoises during LDS surveys in the Pinto Mountain, Joshua Tree, and Chuckwalla sampling areas. (E) 2005.
75

Range-wide Monitoring of the Mojave Population of the Desert Tortoise: 2001-2005 Summary
Eastern Mojave RU
Northern Colorado RU
Map 8. Distribution of transects, live tortoises, and dead tortoises during LDS surveys in the Ivanpah, Fenner, MNP, and Chemehuevi sampling areas. (A) 2001.
76

Range-wide Monitoring of the Mojave Population of the Desert Tortoise: 2001-2005 Summary
Eastern Mojave RU
Map 8. Distribution of transects, live tortoises, and dead tortoises during LDS surveys in the Ivanpah, Fenner, MNP, and Chemehuevi sampling areas. (B) 2002.
77

Range-wide Monitoring of the Mojave Population of the Desert Tortoise: 2001-2005 Summary
Northern Colorado RU
Map 8. Distribution of transects, live tortoises, and dead tortoises during LDS surveys in the Ivanpah, Fenner, MNP, and Chemehuevi sampling areas. (C) 2003.
78

Range-wide Monitoring of the Mojave Population of the Desert Tortoise: 2001-2005 Summary
Eastern Mojave RU
Northern Colorado RU
Map 8. Distribution of transects, live tortoises, and dead tortoises during LDS surveys in the Ivanpah, Fenner, MNP, and Chemehuevi sampling areas. (D) 2004.
79

Range-wide Monitoring of the Mojave Population of the Desert Tortoise: 2001-2005 Summary
Eastern Mojave RU
Northern Colorado RU
Map 8. Distribution of transects, live tortoises, and dead tortoises during LDS surveys in the Ivanpah, Fenner, MNP, and Chemehuevi sampling areas. (E) 2005.
80

Range-wide Monitoring of the Mojave Population of the Desert Tortoise: 2001-2005 Summary
Northeastern Mojave RU
Eastern Mojave RU
Map 9. Distribution of transects, live tortoises, and dead tortoises during LDS surveys in the Beaver Dam Slope, Coyote Springs, Mormon Mesa, Gold Butte-Pakoon, Lake Mead NRA (North and South), and Piute-Eldorado sampling areas. (A) 2001.
81

Range-wide Monitoring of the Mojave Population of the Desert Tortoise: 2001-2005 Summary
Map 9. Distribution of transects, live tortoises, and dead tortoises during LDS surveys in the Beaver Dam Slope, Coyote Springs, Mormon Mesa, Gold Butte-Pakoon, Lake Mead NRA (North and South), and Piute-Eldorado sampling areas. (B) 2002.
Eastern Mojave RU
Northeastern Mojave RU
82

Range-wide Monitoring of the Mojave Population of the Desert Tortoise: 2001-2005 Summary
Map 9. Distribution of transects, live tortoises, and dead tortoises during LDS surveys in the Beaver Dam Slope, Coyote Springs, Mormon Mesa, Gold Butte-Pakoon, Lake Mead NRA (North and South), and Piute-Eldorado sampling areas. (C) 2003.
Northeastern Mojave RU
Eastern Mojave RU
83

Range-wide Monitoring of the Mojave Population of the Desert Tortoise: 2001-2005 Summary
Map 9. Distribution of transects, live tortoises, and dead tortoises during LDS surveys in the Beaver Dam Slope, Coyote Springs, Mormon Mesa, Gold Butte-Pakoon, Lake Mead NRA (North and South), and Piute-Eldorado sampling areas. (D) 2004.
Eastern Mojave RU
Northeastern Mojave RU
84

Range-wide Monitoring of the Mojave Population of the Desert Tortoise: 2001-2005 Summary
Map 9. Distribution of transects, live tortoises, and dead tortoises during LDS surveys in the Beaver Dam Slope, Coyote Springs, Mormon Mesa, Gold Butte-Pakoon, Lake Mead NRA (North and South), and Piute-Eldorado sampling areas. (E) 2005.
Northeastern Mojave RU
Eastern Mojave RU
85


