Random Samples and Populations ODULE 10
26
Real-World Video my.hrw.com ESSENTIAL QUESTION ? How can you use random samples and populations to solve real-world problems? Random Samples and Populations 10 Get immediate feedback and help as you work through practice sets. Personal Math Trainer Interactively explore key concepts to see how math works. Animated Math Go digital with your write-in student edition, accessible on any device. Scan with your smart phone to jump directly to the online edition, video tutor, and more. MODULE my.hrw.com my.hrw.com Math On the Spot LESSON 10.1 Populations and Samples LESSON 10.2 Making Inferences from a Random Sample LESSON 10.3 Generating Random Samples Scientists study animals like dart frogs to learn more about characteristics such as behavior, diet, and communication. 7.SP.1 7.RP.2c, 7.SP.1, 7.SP.2 7.SP.2 COMMON CORE COMMON CORE COMMON CORE 307 © Houghton Mifflin Harcourt Publishing Company • Image Credits: ©Michal Durinik/ Shutterstock
Transcript of Random Samples and Populations ODULE 10

Real-World Video
my.hrw.com
ESSENTIAL QUESTION?How can you use random samples and populations to solve real-world problems?
Random Samples and Populations 10
Get immediate feedback and help as
you work through practice sets.
Personal Math Trainer
Interactively explore key concepts to see
how math works.
Animated Math
Go digital with your write-in student
edition, accessible on any device.
Scan with your smart phone to jump directly to the online edition,
video tutor, and more.
MODULE
my.hrw.com my.hrw.com Math On the Spot
LESSON 10.1
Populations and Samples
LESSON 10.2
Making Inferences from a Random Sample
LESSON 10.3
Generating Random Samples
Scientists study animals like dart frogs to learn more about characteristics such as behavior, diet, and communication.
7.SP.1
7.RP.2c, 7.SP.1,
7.SP.2
7.SP.2
COMMON CORE
COMMON CORE
COMMON CORE
307
© H
ough
ton M
ifflin
Har
cour
t Pub
lishin
g Com
pany
• Im
age C
redit
s: ©
Mich
al Du
rinik/
Shut
terst
ock
YOUAre Ready?Personal
Math Trainer
Online Assessment and
Interventionmy.hrw.com
Complete these exercises to review skills you will need
for this module.
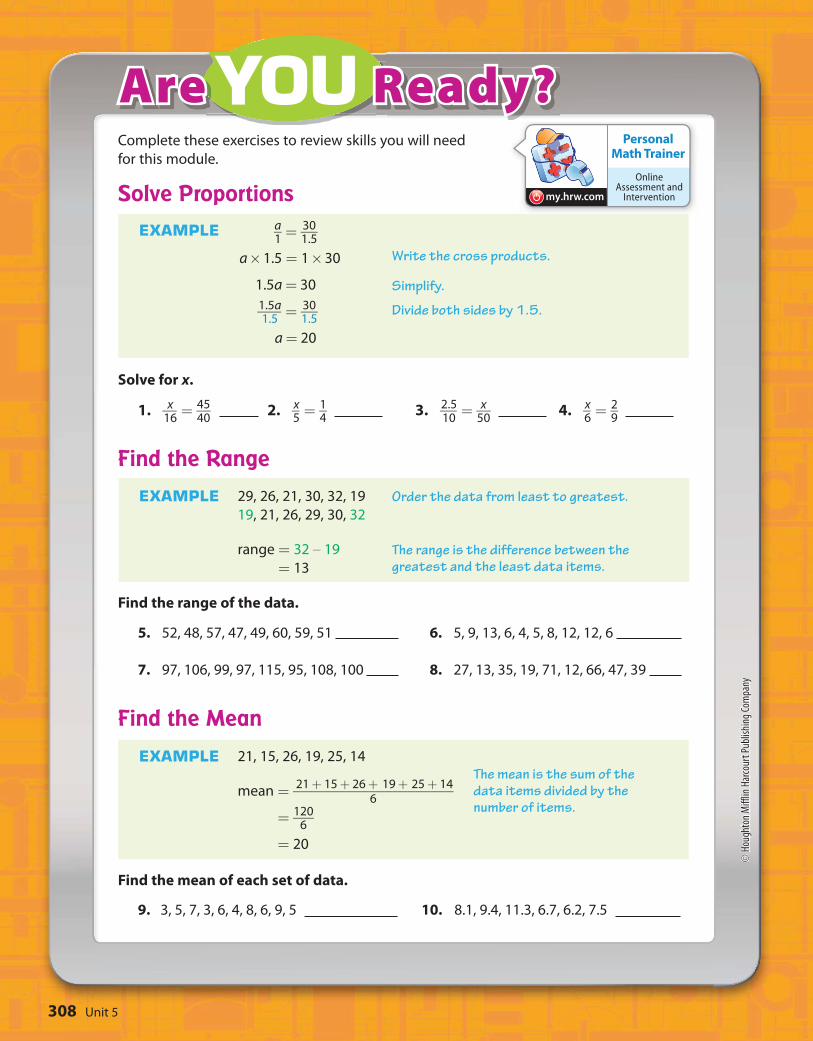
Solve ProportionsEXAMPLE
Solve for x.
1. x __ 16
= 45 __
40 2. x _
5 = 1 _
4 3. 2.5
___ 10
= x __ 50
4. x _ 6
= 2 _ 9
Find the RangeEXAMPLE 29, 26, 21, 30, 32, 19
19, 21, 26, 29, 30, 32
range = 32 – 19
= 13
Find the range of the data.
5. 52, 48, 57, 47, 49, 60, 59, 51 6. 5, 9, 13, 6, 4, 5, 8, 12, 12, 6
7. 97, 106, 99, 97, 115, 95, 108, 100 8. 27, 13, 35, 19, 71, 12, 66, 47, 39
Find the MeanEXAMPLE 21, 15, 26, 19, 25, 14
mean = 21 + 15 + 26 + 19 + 25 + 14 _____________________
6
= 120 ___
6
= 20
Find the mean of each set of data.
9. 3, 5, 7, 3, 6, 4, 8, 6, 9, 5 10. 8.1, 9.4, 11.3, 6.7, 6.2, 7.5
a__1
= 30___1.5
a × 1.5 = 1 × 30
1.5a = 30
1.5a____1.5
= 30___1.5
a = 20
The mean is the sum of the data items divided by the number of items.
Order the data from least to greatest.
The range is the difference between the greatest and the least data items.
Write the cross products.
Simplify.
Divide both sides by 1.5.
Unit 5308
© H
ough
ton
Miff
lin H
arco
urt P
ublis
hing
Com
pany

Reading Start-Up
Active ReadingTri-Fold Before beginning the module, create a
tri-fold to help you learn the concepts and vocabulary
in this module. Fold the paper into three sections.
Label the columns “What I Know,” “What I Need to
Know,” and “What I Learned.” Complete the first
two columns before you read. After studying the
module, complete the third column.
VocabularyReview Words
✔ box plot (diagrama de caja)
data (datos)
dot plot (diagrama de puntos)
interquartile range (rango entre cuartiles)
✔ lower quartile (cuartil inferior)
✔ median (mediana)
spread (dispersión)
survey (estudio)✔ upper quartile
(cuartil superior)
Preview Words biased sample
(muestra sesgada)
population (población) random sample
(muestra aleatoria)
sample (muestra)
Visualize VocabularyUse the ✔ words to complete the right column of the chart.
Understand VocabularyComplete each sentence, using the preview words.
1. An entire group of objects, individuals, or events is a
.
2. A is part of the population chosen to
represent the entire group.
3. A sample that does not accurately represent the population is a
.
Box Plots to Display Data
Definition Review Word
A display that uses values
from a data set to show how
the values are spread out.
The middle value of a
data set.
The median of the lower
half of the data.
The median of the upper
half of the data.
309Module 10
© H
ough
ton
Miff
lin H
arco
urt P
ublis
hing
Com
pany

my.hrw.com
Unpacking the StandardsUnderstanding the standards and the vocabulary terms in the standards will help you know exactly what you are expected to learn in this module.
MODULE 10
Avery wants to survey residents who live in an apartment building.
She writes down all of the apartment numbers on slips of paper,
and draws slips from a box without looking to decide who to
survey. Will this produce a random sample?
The population is all of the residents or people who live in the
apartment building. The sample is a valid random sample because
every apartment number has the same chance of being selected.
What It Means to YouYou will learn how a random sample can be representative of a
population.
Alexi surveys a random sample of 80 students at his school and finds
that 22 of them usually walk to school. There are 1,760 students at the
school. Predict the number of students who usually walk to school.
number in sample who walk
_____________________ size of sample
= number in population who walk
_____________________ size of population
22 __
80 = x ____
1,760
x = 22 ___
80 · 1,760
x = 38,720
_____ 80
= 484
Approximately 484 students usually walk to school.
What It Means to YouYou will use data collected from a random sample to make
inferences about a population.
7.SP.2
Use data from a random sample
to draw inferences about a
population with an unknown
characteristic of interest.
Generate multiple samples (or
simulated samples) of the same
size to gauge the variation in
estimates or predictions.
Key Vocabularypopulation (población)
The entire group of objects or
individuals considered for a
survey.
sample (muestra) A part of the population.
COMMON CORE
7.SP.1
Understand that statistics can
be used to gain information
about a population by
examining a sample of the
population; generalizations
about a population from a
sample are valid only if the
sample is representative of
that population. Understand
that random sampling tends to
produce representative samples
and support valid inferences.
COMMON CORE
Visit my.hrw.com to see all the Common Core Standards unpacked.
UNPACKING EXAMPLE 7.SP.1
UNPACKING EXAMPLE 7.SP.2
Unit 5310
© H
ough
ton
Miff
lin H
arco
urt P
ublis
hing
Com
pany

?
EXPLORE ACTIVITY
ESSENTIAL QUESTIONHow can you use a sample to gain information about a population?
L E S S O N
10.1 Populations and Samples
Random and Non-Random SamplingWhen information is being gathered about a group, the entire group of objects, individuals, or events is called the population. A sample is part of the population that is chosen to represent the entire group.
A vegetable garden has 36 tomato plants arranged in a 6-by-6 array as shown. The number in a given cell tells how many tomatoes are on that plant.
The gardener decides to find the average number of tomatoes on the plants based on a randomly chosen sample, because counting the number of tomatoes on all of the plants is too time-consuming.
To simulate a random selection: roll two number cubes a number of times. Let the first number cube represent the row, and the second represent the column. Record the number in each randomly selected cell. Do not count any cell more than once.
Find the average number of tomatoes on 6 randomly selected plants.
Find the average number of tomatoes on the plants in the first row.
Find the average number of tomatoes on 12 randomly selected plants.
A representative sample has the same characteristics as the population.
In which part, A or B , is the sample more likely representative? Explain.
The samples in Parts A and C were both chosen randomly, but one is more likely to be representative. Which one is it? Explain.
A
B
C
D
E
Row
8 9 13 18 24 15 1
34 42 46 20 13 41 2
29 21 14 45 27 43 3
22 45 46 41 22 33 4
12 42 44 17 42 11 5
18 26 43 32 33 26 6
Column 1 2 3 4 5 6
7.SP.1
… Understand that random sampling tends to produce representative samples and support valid inferences.
COMMONCORE
7.SP.1COMMONCORE
311Lesson 10.1
© H
ough
ton M
ifflin
Har
cour
t Pub
lishin
g Com
pany

Math On the Spotmy.hrw.com
EXPLORE ACTIVITY (cont’d)
Random Samples and Biased SamplesA sample in which every person, object, or event has an equal chance of being
selected is called a random sample. A random sample is more likely to be
representative of a population than a sample not chosen randomly. When a
sample does not accurately represent the population, it is called a biased sample.
Identify the population. Determine whether each sample is a random
sample or a biased sample. Explain your reasoning.
Roberto wants to know the favorite sport of adults in his hometown.
He surveys 50 adults at a baseball game.
The population is adults in Roberto’s hometown.
The sample is biased.
Paula wants to know the favorite type of music for students in her class.
She puts the names of all students in a hat, draws 8 names, and surveys
those students.
The population is students in Paula’s class.
The sample is random.
Reflect3. What if? Suppose Paula draws 14 names for her random sample in
Part B . Predict how this will affect the likelihood that the sample is
representative.
EXAMPLE 1
A
B
Why do you think samples are used? Why not survey
each member of the population?
Reflect 1. How do the averages you got with each sampling method compare to the
average for the entire population, which is 28.25?
2. Why might selecting only the plants in the first row not give a close average?
Math TalkMathematical Practices
7.SP.1COMMONCORE
Think: People who don’t like baseball will not be represented in this sample.
Think: Each student has an equal chance of being selected.
Unit 5312
© H
ough
ton
Miff
lin H
arco
urt P
ublis
hing
Com
pany

Math On the Spot
my.hrw.com
Math Trainer
Online Assessment and Intervention
Personal
my.hrw.com
Math Trainer
Online Assessment and Intervention
Personal
my.hrw.com
Bias in Survey QuestionsOnce you have selected a representative sample of the population, be sure
that the data is gathered without bias. Make sure that the survey questions
themselves do not sway people to respond a certain way.
In Madison County, residents were surveyed about a new skateboard park. Determine whether each survey question may be biased. Explain.
Would you like to waste the taxpayers’ money to build a frivolous
skateboard park?
This question is biased. It discourages residents from saying yes to a new
skateboard park by implying it is a waste of money.
Do you favor a new skateboard park?
This question is not biased. It does not include an opinion on the
skateboard park.
Studies have shown that having a safe place to go keeps kids out of trouble.
Would you like to invest taxpayers’ money to build a skateboard park?
This question is biased. It leads people to say yes because it mentions
having a safe place for kids to go and to stay out of trouble.
EXAMPLEXAMPLE 2
A
B
C
4. For a survey, a company manager assigned a number to each of the
company’s 500 employees, and put the numbers in a bag. The manager
chose 20 numbers and surveyed the employees with those numbers. Did
the manager choose a random sample?
YOUR TURN
Determine whether each question may be biased. Explain.
5. When it comes to pets, do you prefer cats?
6. What is your favorite season?
YOUR TURN
7.SP.1COMMONCORE
313Lesson 10.1
© H
ough
ton M
ifflin
Har
cour
t Pub
lishin
g Com
pany
• Im
age C
redit
s: Ph
otoS
pin, In
c./Al
amy L
imite
d

Random Sample of SeventhGrade Male Students
Student Shoe Size
1. Follow each method described below to collect data to estimate the
average shoe size of seventh grade boys. (Explore Activity)
Method 1
Randomly select 6 seventh grade boys
and ask each his shoe size. Record your
results in a table like the one shown.
Find the mean of this data. Mean:
Method 2
Find the 6 boys in your math class with the largest shoes and ask their
shoe size. Record your results in a table like the one shown in Method 1.
Find the mean of this data. Mean:
2. Method 1 produces results that are more / less representative of the
entire student population because it is a random / biased sample.
(Example 1)
3. Method 2 produces results that are more / less representative of the
entire student population because it is a random / biased sample.
(Example 1)
4. Heidi decides to use a random sample to determine her classmates’
favorite color. She asks, “Is green your favorite color?” Is Heidi’s question
biased? If so, give an example of an unbiased question that would serve
Heidi better. (Example 2)
A
B
A
B
Guided Practice
5. How can you select a sample so that the information gained represents
the entire population?
ESSENTIAL QUESTION CHECK-IN??
Unit 5314
© H
ough
ton M
ifflin
Har
cour
t Pub
lishin
g Com
pany

Personal Math Trainer
Online Assessment and
Interventionmy.hrw.com
Name Class Date
Independent Practice10.1
6. A school cafeteria is considering new menu
options. The manager puts a comment
box in the cafeteria where students can
anonymously submit their choices. Is this
a representative sample? Explain why or
why not.
7. Nancy hears a report that the average
price of gasoline is $2.82. She averages the
prices of stations near her home. She finds
the average price of gas to be $3.03. Why
are the averages different?
For 8–10, determine whether each sample is a
random sample or a biased sample. Explain.
8. Carol wants to find out the favorite foods
of students at her middle school. She asks
the boys’ basketball team about their
favorite foods.
9. Dallas wants to know what elective
subjects the students at his school like
best. He surveys students who are leaving
band class.
10. To choose a sample for a survey of seventh
graders, the student council puts pieces
of paper with the names of all the seventh
graders in a bag, and selects 20 names.
11. Members of a polling organization survey
700 of the 7,453 registered voters in a town
by randomly choosing names from a list of
all registered voters. Is their sample likely
to be representative?
For 12–13, determine whether each question
may be biased. Explain.
12. Joey wants to find out what sport seventh
grade girls like most. He asks girls, “Is
basketball your favorite sport?”
13. Jae wants to find out what type of art her
fellow students enjoy most. She asks her
classmates, “What is your favorite type of
art?”
7.SP.1COMMONCORE
315Lesson 10.1
© H
ough
ton
Miff
lin H
arco
urt P
ublis
hing
Com
pany

Work Area
14. Draw Conclusions Determine which sampling method will better
represent the entire population. Justify your answer.
Student Attendance at Football Games
Sampling Method Results of Survey
Collin surveys 78 students by randomly choosing names from the school directory.
63% attend football games.
Karl surveys 25 students that were sitting near him during lunch.
84% attend football games.
15. Multistep Barbara surveyed students in her school by looking at an
alphabetical list of the 600 student names, dividing them into groups of 10,
and randomly choosing one from each group.
a. How many students did she survey? What type of sample is this?
b. Barbara found that 35 of the survey participants had pets. About
what percent of the students she surveyed had pets? Is it safe to
believe that about the same percent of students in the school have
pets? Explain your thinking.
16. Communicating Mathematical Ideas Carlo is shown the results of two
surveys about the preferred practice day of all players in a soccer league.
The surveys are based on two different samples, and the results are very
different. What information about the samples and surveys might help
Carlo decide which result is likely to be more accurate?
FOCUS ON HIGHER ORDER THINKING
Unit 5316
© H
ough
ton
Miff
lin H
arco
urt P
ublis
hing
Com
pany
?
EXPLORE ACTIVITY
21 5
x
2
1
3 y
43Flour (cups)
Salt
(cups
)
O1
35
135
135
135
135
Getting Ready
ESSENTIAL QUESTION
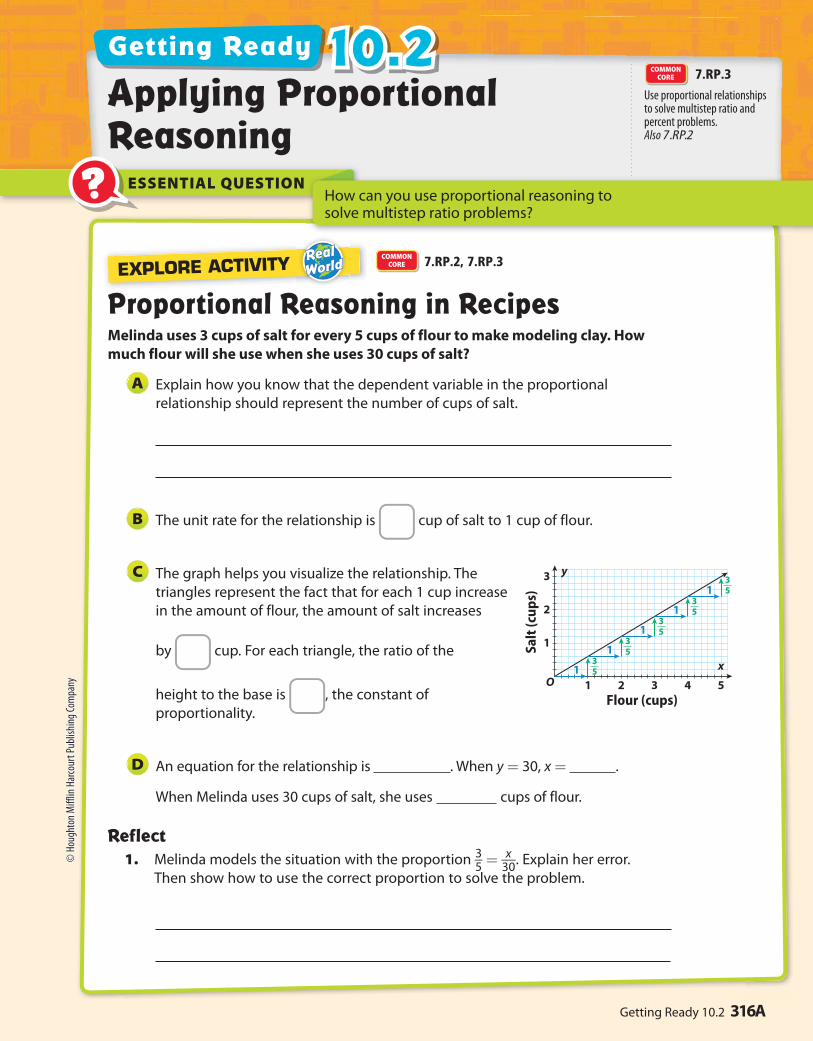
10.2Applying Proportional Reasoning
How can you use proportional reasoning to solve multistep ratio problems?
Proportional Reasoning in RecipesMelinda uses 3 cups of salt for every 5 cups of flour to make modeling clay. How much flour will she use when she uses 30 cups of salt?
Explain how you know that the dependent variable in the proportional
relationship should represent the number of cups of salt.
The unit rate for the relationship is cup of salt to 1 cup of flour.
The graph helps you visualize the relationship. The
triangles represent the fact that for each 1 cup increase
in the amount of flour, the amount of salt increases
by cup. For each triangle, the ratio of the
height to the base is , the constant of
proportionality.
An equation for the relationship is . When y = 30, x = .
When Melinda uses 30 cups of salt, she uses cups of flour.
Reflect1. Melinda models the situation with the proportion 3 _
5 = x __
30 . Explain her error.
Then show how to use the correct proportion to solve the problem.
A
B
C
D
7.RP.3
Use proportional relationships to solve multistep ratio and percent problems. Also 7.RP.2
COMMONCORE
7.RP.2, 7.RP.3COMMONCORE
316AGetting Ready 10.2
© H
ough
ton
Miff
lin H
arco
urt P
ublis
hing
Com
pany

Practice
1. Celine mixes raisins and peanuts to make a snack. She uses 0.75 cup of raisins
for every 0.5 cup of peanuts. Write a proportion and use it to find the number
of cups of raisins she uses if she uses 4.25 cups of peanuts.
2. Corey’s salsa recipe calls for 2 1 _ 2
cups of onions for every 4 pounds of tomatoes.
Corey plans to use 10 pounds of tomatoes and wonders how many cups of
onion he needs.
a. Identify the quantities represented by the dependent and independent
variables in the proportional relationship.
b. Explain the Error Corey writes the equation y = 8 _ 5
x and finds that he
needs 16 cups of onions. Describe and correct his error.
c. Focus on Reasoning Explain why Corey should have known without
calculating that the correct answer could not be 16 cups.
3. Neal makes a cleaning solution by mixing water and vinegar. He uses 7 cups of
water for every 3 cups of vinegar. Write and use an equation to find how many
more cups of vinegar he needs when he uses 7 1 _ 2
cups of water than when he
uses 4 1 _ 2
cups of water. Define the variables.
4. Explain the Error In one middle school, there are 8 girls for every 7 boys. The
total number of students is 330. Mischa wrote the proportion 8 _ 7
= x ___ 330
to find
the number of girls in the school. Describe and correct her error.
Unit 5316B
© H
ough
ton
Miff
lin H
arco
urt P
ublis
hing
Com
pany

?
EXPLORE ACTIVITY 1
ESSENTIAL QUESTIONHow can you use a random sample to make inferences about a population?
L E S S O N
10.2 Making Inferences from a Random Sample
Using Dot Plots to Make InferencesAfter obtaining a random sample of a population, you can make inferences about the population. Random samples are usually representative and support valid inferences.
Rosee asked students on the lunch line how many books they had in their backpacks. She recorded the data as a list: 2, 6, 1, 0, 4, 1, 4, 2, 2. Make a dot plot for the books carried by this sample of students.
Order the data from least to greatest. Find the least and greatest values in the data set.
Draw a number line from 0 to 6. Place a dot above each number on the number line for each time it appears in the data set.
Reflect1. Critical Thinking How are the number of dots you plotted related to
the number of data values?
STEP 1
STEP 2
No students in Rosee’s sample carry 3 books. Do you
think this is true of all the students at the school?
Explain.
2. Draw Conclusions Complete each qualitative inference about the population.
Most students have 1 book in their backpacks.
Most students have fewer than books in their backpacks.
Most students have between books in their backpacks.
3. Analyze Relationships What could Rosee do to improve the quality of her data?
Math TalkMathematical Practices
7.SP.2
Use data from a random sample to draw inferences about a population with an unknown characteristic of interest ... Also 7.RP.2c, 7.SP.1
COMMONCORE
7.SP.2, 7.SP.1COMMONCORE
Notice that the dot plot puts the data values in order.
317Lesson 10.2
© H
ough
ton M
ifflin
Har
cour
t Pub
lishin
g Com
pany

Math On the Spotmy.hrw.com
Least value
Greatest valuequartile quartile
0
20
EXPLORE ACTIVITY 2
Using Box Plots to Make InferencesYou can also analyze box plots to make inferences about a population.
The number of pets owned by a random sample of students at Park
Middle school is shown below. Use the data to make a box plot.
9, 2, 0, 4, 6, 3, 3, 2, 5
Order the data from least to greatest. Then find the least and
greatest values, the median, and the lower and upper quartiles.
The lower and upper quartiles can be calculated by finding the
medians of each “half” of the number line that includes all the
data.
STEP 1
STEP 2
Draw a number line that includes all the data values.
Plot a point for each of the values found in Step 1.
Draw a box from the lower to upper quartile. Inside the box, draw
a vertical line through the median. Finally, draw the whiskers by
connecting the least and greatest values to the box.
Reflect4. Draw Conclusions Complete each qualitative inference about the
population.
A good measure for the most likely number of pets is .
50% of the students have between and 3 pets.
Almost every student in Parkview has at least pet.
STEP 3
What can you see from a box plot that is not readily apparent in a
dot plot?
Math TalkMathematical Practices
7.SP.2COMMONCORE
The lower quartile is the mean of 2 and 2. The upper quartile is the mean of 5 and 6.
318 Unit 5
© H
ough
ton
Miff
lin H
arco
urt P
ublis
hing
Com
pany
• Im
age C
redi
ts: Se
rgey
Galu
shko
/Al
amy

Math On the Spot
my.hrw.com
Math Trainer
Online Assessment and Intervention
Personal
my.hrw.com
Animated Math
my.hrw.com
Using Proportions to Make InferencesIf a sample is representative of the population, then the number of objects in
the population with a given characteristic is proportional to the number of
objects in the sample with that characteristic.
You can use data based on a random sample, along with proportional
reasoning, to make inferences or predictions about the population.
A shipment to a warehouse consists of 3,500 MP3 players. The manager
chooses a random sample of 50 MP3 players and finds that 3 are defective.
How many MP3 players in the shipment are likely to be defective?
It is reasonable to make a prediction about the population
because this sample is random.
Set up a proportion.
defective MP3s in sample
___________________ size of sample
= defective MP3s in population
_____________________ size of population
Substitute values into the proportion.
3 __ 50
= x ____ 3,500
3·70 _____
50·70 = x ____
3,500
210 ____
3,500 = x ____
3,500
210 = x
Based on the sample, you can predict that 210 MP3 players in the
shipment would be defective.
EXAMPLEXAMPLE 1
STEP 1
STEP 2
5. What If? How many MP3 players in the shipment would you
predict to be damaged if 6 MP3s in the sample had been damaged?
Reflect6. Check for Reasonableness How could you use estimation to check if
your answer is reasonable?
YOUR TURN
7.SP.2, 7.RP.2cCOMMONCORE
Substitute known values. Let x be the number of defective MP3 players in the population.
50 ∙ 70 = 3,500, so multiply the numerator and denominator by 70.
319Lesson 10.2
© H
ough
ton
Miff
lin H
arco
urt P
ublis
hing
Com
pany
Guided Practice
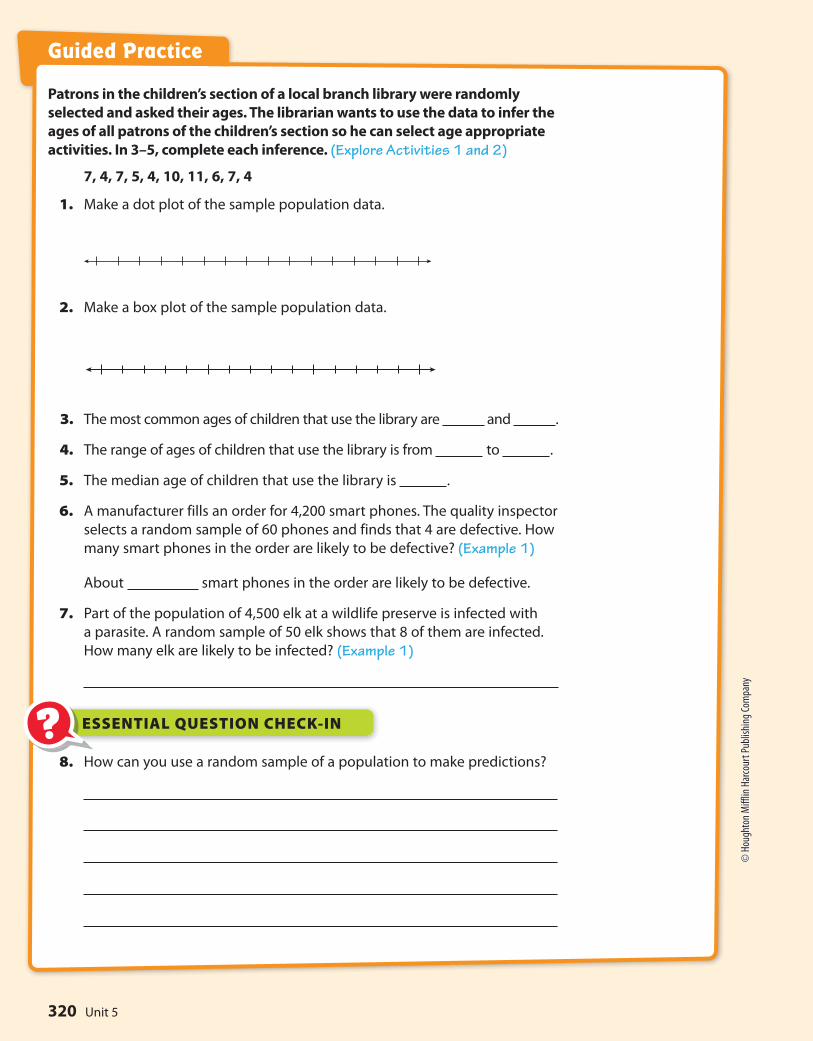
Patrons in the children’s section of a local branch library were randomly
selected and asked their ages. The librarian wants to use the data to infer the
ages of all patrons of the children’s section so he can select age appropriate
activities. In 3–5, complete each inference. (Explore Activities 1 and 2)
7, 4, 7, 5, 4, 10, 11, 6, 7, 4
1. Make a dot plot of the sample population data.
2. Make a box plot of the sample population data.
3. The most common ages of children that use the library are and .
4. The range of ages of children that use the library is from to .
5. The median age of children that use the library is .
6. A manufacturer fills an order for 4,200 smart phones. The quality inspector
selects a random sample of 60 phones and finds that 4 are defective. How
many smart phones in the order are likely to be defective? (Example 1)
About smart phones in the order are likely to be defective.
7. Part of the population of 4,500 elk at a wildlife preserve is infected with
a parasite. A random sample of 50 elk shows that 8 of them are infected.
How many elk are likely to be infected? (Example 1)
8. How can you use a random sample of a population to make predictions?
ESSENTIAL QUESTION CHECK-IN??
Unit 5320
© H
ough
ton
Miff
lin H
arco
urt P
ublis
hing
Com
pany

Personal Math Trainer
Online Assessment and
Interventionmy.hrw.com
Name Class Date
9. A manager samples the receipts of every
fifth person who goes through the line.
Out of 50 people, 4 had a mispriced item.
If 600 people go to this store each day,
how many people would you expect to
have a mispriced item?
10. Jerry randomly selects 20 boxes of crayons
from the shelf and finds 2 boxes with at
least one broken crayon. If the shelf holds
130 boxes, how many would you expect
to have at least one broken crayon?
11. A random sample of dogs at different
animal shelters in a city shows that 12 of
the 60 dogs are puppies. The city’s animal
shelters collectively house 1,200 dogs each
year. About how many dogs in all of the
city’s animal shelters are puppies?
12. Part of the population of 10,800 hawks at a
national park are building a nest. A random
sample of 72 hawks shows that 12 of them
are building a nest. Estimate the number of
hawks building a nest in the population.
13. In a wildlife preserve, a random sample of the
population of 150 raccoons was caught and
weighed. The results, given in pounds, were
17, 19, 20, 21, 23, 27, 28, 28, 28 and 32. Jean
made the qualitative statement, “The average
weight of the raccoon population is 25
pounds.” Is her statement reasonable? Explain.
14. Greta collects the number of miles run
each week from a random sample of
female marathon runners. Her data are
shown below. She made the qualitative
statement, “25% of female marathoners run
13 or more miles a week.” Is her statement
reasonable? Explain. Data: 13, 14, 18, 13,
12, 17, 15, 12, 13, 19, 11, 14, 14, 18, 22, 12
15. A random sample of 20 of the 200 students
at Garland Elementary is asked how many
siblings each has. The data are ordered as
shown. Make a dot plot of the data. Then
make a qualitative statement about the
population. Data: 0, 1, 1, 1, 1, 1, 1, 2, 2, 2, 2,
2, 3, 3, 3, 3, 4, 4, 4, 6
16. Linda collects a random sample of 12 of
the 98 Wilderness Club members’ ages. She
makes an inference that most wilderness
club members are between 20 and 40 years
old. Describe what a box plot that would
confirm Linda’s inference should look like.
Independent Practice10.27.RP.2c, 7.SP.1, 7.SP.2COMMON
CORE
321Lesson 10.2
© H
ough
ton
Miff
lin H
arco
urt P
ublis
hing
Com
pany

Work Area
17. What’s the Error? Kudrey was making a box plot. He first plotted the
least and greatest data values. He then divided the distance into half, and
then did this again for each half. What did Kudrey do wrong and what did
his box plot look like?
18. Communicating Mathematical Ideas A dot plot includes all of the
actual data values. Does a box plot include any of the actual data values?
19. Make a Conjecture Sammy counted the peanuts in several packages of
roasted peanuts. He found that the bags had 102, 114, 97, 85, 106, 120,
107, and 111 peanuts. Should he make a box plot or dot plot to represent
the data? Explain your reasoning.
20. Represent Real-World Problems The salaries for the eight employees at
a small company are $20,000, $20,000, $22,000, $24,000, $24,000, $29,000,
$34,000 and $79,000. Make a qualitative inference about a typical salary
at this company. Would an advertisement that stated that the average
salary earned at the company is $31,500 be misleading? Explain.
FOCUS ON HIGHER ORDER THINKING
Unit 5322
© H
ough
ton
Miff
lin H
arco
urt P
ublis
hing
Com
pany

?
randlnt (1, 200)439375
178
EXPLORE ACTIVITY 1
ESSENTIAL QUESTIONHow can you generate and use random samples to represent a population?
Generating a Random Sample Using TechnologyIn an earlier lesson, you generated random samples by rolling number cubes. You can also generate random samples by using technology. In Explore Activity 1, you will generate samples using a graphing calculator.
Each of the 200 students in a school will have a chance to vote on
one of two names, Tigers or Bears, for the school’s athletic teams. A
group of students decides to select a random sample of 20 students
and ask them for which name they intend to vote. How can the group
choose a random sample to represent the entire population of 200 students?
One way to identify a random sample is to use a graphing calculator to generate random integers.
To simulate choosing 20 students at random from among 200 students:
• Press MATH , scroll right and select PRB, then select 5: randInt(.
• Enter the least value, comma, greatest possible value.
In this specific case, the students will enter randInt ( , )
because there are students in school.
• Hit ENTER times to generate random numbers.
The group gets a list of all the students in the school and assigns a number to each one. The group surveys the students with the given numbers.
Of the 20 students surveyed, 9 chose Tigers. The percent choosing
Tigers was . What might the group infer?
A
L E S S O N
10.3 Generating Random Samples
7.SP.2
Use data from a random sample ... Generate multiple samples (or simulated samples) of the same size to gauge the variation in estimates or predictions.
COMMONCORE
7.SP.2COMMONCORE
323Lesson 10.3
© H
ough
ton M
ifflin
Har
cour
t Pub
lishin
g Com
pany
• Im
age C
redit
s: ©
Rich
ard
Bing
ham
II/Al
amy I
mag
es

You can simulate multiple random samples to see how much statistical
measures vary for different samples of size 20.
Assume that the 200 students are evenly divided among those voting
for Tigers and those voting for Bears. You can generate random
numbers and let each number represent a vote. Let numbers from 1 to
100 represent votes for Tigers, and numbers from 101 to 200 represent
votes for Bears. For each simulated sample, use randInt(1, 200) and
generate 20 numbers.
Perform the simulation 10 times and record how many numbers from
1 to 100 are generated. How many of the samples indicated that there
were 9 or fewer votes for Tigers?
Combine your results with those of your classmates. Make a dot plot
showing the number of numbers from 1 to 100 generated in each
simulation.
Reflect 1. Communicate Mathematical Reasoning Assume that it was accurate
to say that the 200 students are evenly divided among those voting for
Tigers and those voting for Bears. Based on your results, does it seem likely
that in a sample of size 20, there would be 9 or fewer votes for Tigers?
2. Make a Prediction Based on your answers, do you think it is likely
that Tigers will win? Explain.
3. Multiple Representations Suppose you wanted to simulate a
random sample for the situation in Explore Activity 1 without using
technology. One way would be to use marbles of two different colors
to represent students choosing the different names. Describe how you
could perform a simulation.
B
EXPLORE ACTIVITY 1 (cont’d)
Unit 5324
© H
ough
ton
Miff
lin H
arco
urt P
ublis
hing
Com
pany

2524 27 29 31 24 2722 29 30
6222 60 53 62 42 6437 53 41
4054 57 34 44 66 3961 60 65
4233 64 36 33 51 6245 66 42
6634 57 33 47 43 6637 33 61
4845 46 67 60 59 5166 46 67
6446 35 35 55 56 6153 46 38
5351 54 62 55 58 5155 45 41
4738 48 48 43 59 6461 48 49
5953 53 59 58 48 6241 53 45
Generating a Random Sample without TechnologyA tree farm has a 100 acre square field arranged in a 10-by-10
array. The farmer wants to know the average number of trees per
acre. Each cell in the table represents an acre. The number in each
cell represents the number of trees on that acre.
The farmer decides to choose a random sample of 10 of the acres.
EXPLORE ACTIVITY 2
To simulate the random selection, number the table columns 1–10 from left to right,
and the rows 1–10 from top to bottom. Write the numbers 1–10 on identical pieces of
paper. Place the pieces into a bag. Draw one at random, replace it, and draw another.
Let the first number represent a table column, and the second represent a row. For
instance, a draw of 2 and then 3 represents the cell in the second column and third
row of the table, an acre containing 54 trees. Repeat this process 9 more times.
Based on your sample, predict the average number of trees per acre. How does your
answer compare with the actual mean number, 48.4?
Compare your answer to B with several of your classmates’ answers. Do they vary
a lot? Is it likely that you can make a valid prediction about the average number of
trees per acre? Explain.
A
B
C
7.SP.2COMMONCORE
325Lesson 10.3
© H
ough
ton
Miff
lin H
arco
urt P
ublis
hing
Com
pany
• Im
age C
redi
ts: ©
Phot
odisc
/Ge
tty Im
ages
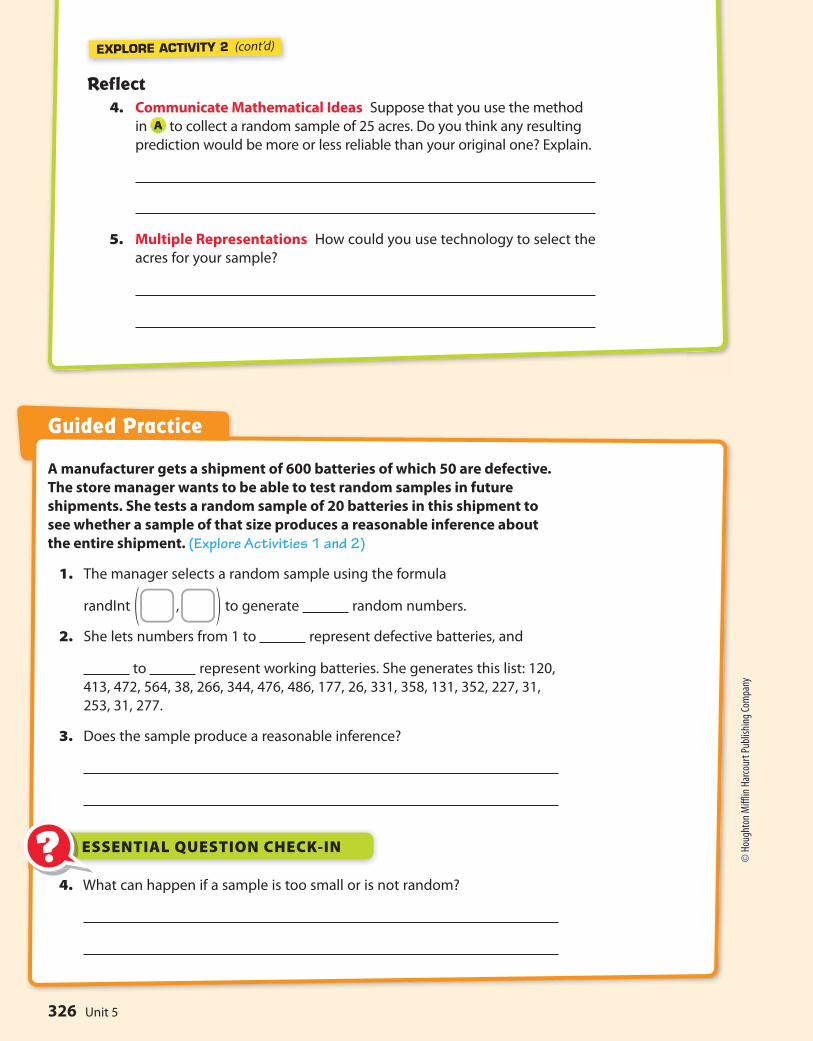
Reflect 4. Communicate Mathematical Ideas Suppose that you use the method
in to collect a random sample of 25 acres. Do you think any resulting
prediction would be more or less reliable than your original one? Explain.
5. Multiple Representations How could you use technology to select the
acres for your sample?
A
A manufacturer gets a shipment of 600 batteries of which 50 are defective.
The store manager wants to be able to test random samples in future
shipments. She tests a random sample of 20 batteries in this shipment to
see whether a sample of that size produces a reasonable inference about
the entire shipment. (Explore Activities 1 and 2)
1. The manager selects a random sample using the formula
randInt ( , ) to generate random numbers.
2. She lets numbers from 1 to represent defective batteries, and
to represent working batteries. She generates this list: 120,
413, 472, 564, 38, 266, 344, 476, 486, 177, 26, 331, 358, 131, 352, 227, 31,
253, 31, 277.
3. Does the sample produce a reasonable inference?
4. What can happen if a sample is too small or is not random?
ESSENTIAL QUESTION CHECK-IN??
Guided Practice
EXPLORE ACTIVITY 2 (cont’d)
Unit 5326
© H
ough
ton
Miff
lin H
arco
urt P
ublis
hing
Com
pany

Personal Math Trainer
Online Assessment and
Interventionmy.hrw.com
Name Class Date
Maureen owns three bagel shops. Each shop sells 500 bagels per day.
Maureen asks her store managers to use a random sample to see how many
whole-wheat bagels are sold at each store each day. The results are shown
in the table. Use the table for 5–7.
Total bagels in sample Whole-wheat bagels
Shop A 50 10
Shop B 100 23
Shop C 25 7
5. If you assume the samples are representative, how many whole-wheat
bagels might you infer are sold at each store?
6. Rank the samples for the shops in terms of how representative they are
likely to be. Explain your rankings.
7. Which sample or samples should Maureen use to tell her managers how
many whole-wheat bagels to make each day? Explain.
8. In a shipment of 1,000 T-shirts, 75 do not meet quality standards. The table
below simulates a manager’s random sample of 20 T-shirts to inspect. For
the simulation, the integers 1 to 75 represent the below-standard shirts.
124 876 76 79 12 878 86 912 435 91
340 213 45 678 544 271 714 777 812 80
In the sample, how many of the shirts are below quality standards?
If someone used the sample to predict the number of below standard
shirts in the shipment, how far off would the prediction be?
Independent Practice10.37.SP.2COMMON
CORE
327Lesson 10.3
© H
ough
ton
Miff
lin H
arco
urt P
ublis
hing
Com
pany
• Im
age C
redi
ts: ©
sadd
ako/
Shut
terst
ock

Work Area
54 40 34 44 66 65
66 33 42 36 33 51
66 33 47 43 66 61
46 35 48 67 60 59 52 67
46 32 64 35 55 47 61
45 53 62 55 58 51 41
48 38 47 48 43 64 54
53 67 59 58 48 62 45
56 43
62 63
33 34
38
51
59
59
12 15 16 9 21 11
9 10 14 10 13 12
16 21 14 12 8 14
16 20 9 16 19 18
17 14 12 15 10 15
12 20 14 10 12 9
9. Multistep A 64-acre coconut farm is arranged in an
8-by-8 array. Mika wants to know the average number
of coconut palms on each acre. Each cell in the table
represents an acre of land. The number in each cell tells
how many coconut palms grow on that particular acre.
a. The numbers in green represent Mika’s random
sample of 10 acres. What is the average number of
coconut palms on the randomly selected acres?
b. Project the number of palms on the entire farm.
10. Draw Conclusions A random sample of 15 of the 78 competitors at a
middle school gymnastics competition are asked their height. The data
set lists the heights in inches: 55, 57, 57, 58, 59, 59, 59, 59, 59, 61, 62, 62,
63, 64, 66. What is the mean height of the sample? Do you think this is a
reasonable prediction of the mean height of all competitors? Explain.
11. Critical Thinking The six-by-six grid
contains the ages of actors in a youth
Shakespeare festival. Describe a method
for randomly selecting 8 cells by using
number cubes. Then calculate the
average of the 8 values you found.
12. Communicating Mathematical Ideas Describe how the size of a random
sample affects how well it represents a population as a whole.
FOCUS ON HIGHER ORDER THINKING
Unit 5328
© H
ough
ton
Miff
lin H
arco
urt P
ublis
hing
Com
pany

Math Trainer
Online Assessment and Intervention
Personal
my.hrw.com
ReadyMODULE QUIZ
10.1 Populations and Samples
1. A company uses a computer to identify their 600 most loyal customers
from its database and then surveys those customers to find out how
they like their service. Identify the population and determine whether
the sample is random or biased.
10.2 Making Inferences from a Random Sample
2. A university has 30,330 students. In a random sample of 270 students,
18 speak three or more languages. Predict the number of students
at the university who speak three or more languages.
10.3 Generating Random Samples A store receives a shipment of 5,000 MP3 players. In a previous shipment
of 5,000 MP3 players, 300 were defective. A store clerk generates random
numbers to simulate a random sample of this shipment. The clerk lets the
numbers 1 through 300 represent defective MP3 players, and the numbers
301 through 5,000 represent working MP3 players. The results are given.
13 2,195 3,873 525 900 167 1,094 1,472 709 5,000
3. Based on the sample, how many of the MP3 players might the clerk
predict would be defective?
4. Can the manufacturer assume the prediction is valid? Explain.
5. How can you use random samples to solve real-world problems?
? ESSENTIAL QUESTION
329Module 10
© H
ough
ton
Miff
lin H
arco
urt P
ublis
hing
Com
pany

Personal Math Trainer
Online Assessment and
Interventionmy.hrw.com
MODULE 10 MIXED REVIEW
Selected Response
1. A farmer is using a random sample to
predict the number of broken eggs in a
shipment of 3,000 eggs. Using a calculator,
the farmer generates the following random
numbers. The numbers 1–250 represent
broken eggs.
477 2,116 1,044 81 619 755
2,704 900 238 1,672 187 1,509
Based on this sample, how many broken
eggs might the farmer expect?
A 250 broken eggs
B 375 broken eggs
C 750 broken eggs
D 900 broken eggs
2. A middle school has 490 students. Mae
surveys a random sample of 60 students and
finds that 24 of them have pet dogs. How
many students are likely to have pet dogs?
A 98
B 196
C 245
D 294
3. A pair of shoes that normally costs $75 is on
sale for $55. What is the percent decrease in
the price, to the nearest whole percent?
A 20%
B 27%
C 36%
D 73%
4. Which of the following is a random sample?
A A radio DJ asks the first 10 listeners
who call in if they liked the last song.
B 20 customers at a chicken restaurant
are surveyed on their favorite food.
C A polling organization numbers all
registered voters, then generates
800 random integers. The polling
organization interviews the 800 voters
assigned those numbers.
D Rebecca used an email poll to survey
100 students about how often they use
the internet.
Mini-Task
5. Each cell in the table represents the
number of people who work in one
25-square-block section of the town of
Middleton. The mayor uses a random
sample to estimate the average number
of workers per block.
a. The circled numbers represent the
mayor’s random sample. What is
the mean number of workers in this
sample?
b. Predict the number of workers in the
entire 25-block section of Middleton.
47 61 56 48 56
60 39 63 60 46
51 58 49 63 45
55 58 50 43 48
62 53 44 66 55
Assessment Readiness
330 Unit 5
© H
ough
ton
Miff
lin H
arco
urt P
ublis
hing
Com
pany