
Rancho Seco, License Termination Plan, Revision 1, Chapter ...
66
Rancho Seco License Termination Plan Revision 1 Chapter 5, Final Status Survey Plan May 2008 Page 5-i TABLE OF CONTENTS 5.0 FINAL STATUS SURVEY PLAN ................................................................................. 5-1 5.1 Introduction................................................................................................................................... 5-1 5.1.1 Purpose.......................................................................................................................................... 5-1 5.1.2 Scope............................................................................................................................................. 5-1 5.1.3 Final Status Survey Preparation and Implementation Overview .................................................. 5-1 5.1.4 Regulatory Requirements and Industry Guidance ........................................................................ 5-4 5.2 Development of Survey Plan ........................................................................................................ 5-5 5.2.1 Radiological Status ....................................................................................................................... 5-5 5.2.2 Classification of Areas .................................................................................................................. 5-9 5.2.3 Establishing Survey Units ........................................................................................................... 5-19 5.2.4 Access Control Measures ............................................................................................................ 5-20 5.3 Survey Design and Data Quality Objectives............................................................................... 5-21 5.3.1 Data Quality Objectives (DQOs) ................................................................................................ 5-21 5.3.2 Scan Survey Coverage ................................................................................................................ 5-22 5.3.3 Sample Size Determination......................................................................................................... 5-22 5.3.4 Background Reference Area ....................................................................................................... 5-24 5.3.5 Reference Grid and Sample Location ......................................................................................... 5-25 5.3.6 Investigation Levels and Elevated Areas Test ............................................................................ 5-26 5.4 Survey Methods and Instrumentation ......................................................................................... 5-31 5.4.1 Survey Measurement Methods ................................................................................................... 5-31 5.4.2 Specific Survey Area Considerations ......................................................................................... 5-33 5.4.3 Instrumentation ........................................................................................................................... 5-35 5.5 Data Collection and Processing .................................................................................................. 5-46 5.5.1 Sample Handling and Record Keeping ....................................................................................... 5-46 5.5.2 Data Management ....................................................................................................................... 5-46 5.5.3 Data Verification and Validation ................................................................................................ 5-47 5.5.4 Graphical Data Review ............................................................................................................... 5-47 5.6 Data Assessment and Compliance .............................................................................................. 5-48 5.6.1 Data Assessment Including Statistical Analysis ......................................................................... 5-48 5.6.2 Unity Rule ................................................................................................................................... 5-50 5.6.3 Data Conclusions ........................................................................................................................ 5-52 5.6.4 Compliance ................................................................................................................................. 5-52 5.7 Reporting Format ........................................................................................................................ 5-53 5.7.1 Operating History ....................................................................................................................... 5-53 5.7.2 Survey Unit Summary Report ..................................................................................................... 5-53 5.7.3 Final Status Survey Report ......................................................................................................... 5-53 5.7.4 Other Reports .............................................................................................................................. 5-54 5.8 Final Status Survey Quality Program ......................................................................................... 5-54 5.8.1 Rancho Seco Quality Assurance Program .................................................................................. 5-54 5.8.2 FSS Quality Assurance Project Plan (QAPP) ............................................................................. 5-54 5.8.3 Assessment and Oversight .......................................................................................................... 5-59 5.8.4 Data Validation and Verification ................................................................................................ 5-59
Transcript of Rancho Seco, License Termination Plan, Revision 1, Chapter ...

Rancho Seco License Termination Plan Revision 1 Chapter 5, Final Status Survey Plan May 2008
Page 5-i
TABLE OF CONTENTS
5.0 FINAL STATUS SURVEY PLAN ................................................................................. 5-1 5.1 Introduction...................................................................................................................................5-1 5.1.1 Purpose..........................................................................................................................................5-1 5.1.2 Scope.............................................................................................................................................5-1 5.1.3 Final Status Survey Preparation and Implementation Overview ..................................................5-1 5.1.4 Regulatory Requirements and Industry Guidance ........................................................................5-4 5.2 Development of Survey Plan ........................................................................................................5-5 5.2.1 Radiological Status .......................................................................................................................5-5 5.2.2 Classification of Areas..................................................................................................................5-9 5.2.3 Establishing Survey Units...........................................................................................................5-19 5.2.4 Access Control Measures............................................................................................................5-20 5.3 Survey Design and Data Quality Objectives...............................................................................5-21 5.3.1 Data Quality Objectives (DQOs) ................................................................................................5-21 5.3.2 Scan Survey Coverage ................................................................................................................5-22 5.3.3 Sample Size Determination.........................................................................................................5-22 5.3.4 Background Reference Area .......................................................................................................5-24 5.3.5 Reference Grid and Sample Location .........................................................................................5-25 5.3.6 Investigation Levels and Elevated Areas Test ............................................................................5-26 5.4 Survey Methods and Instrumentation .........................................................................................5-31 5.4.1 Survey Measurement Methods ...................................................................................................5-31 5.4.2 Specific Survey Area Considerations .........................................................................................5-33 5.4.3 Instrumentation ...........................................................................................................................5-35 5.5 Data Collection and Processing ..................................................................................................5-46 5.5.1 Sample Handling and Record Keeping.......................................................................................5-46 5.5.2 Data Management .......................................................................................................................5-46 5.5.3 Data Verification and Validation ................................................................................................5-47 5.5.4 Graphical Data Review ...............................................................................................................5-47 5.6 Data Assessment and Compliance ..............................................................................................5-48 5.6.1 Data Assessment Including Statistical Analysis .........................................................................5-48 5.6.2 Unity Rule...................................................................................................................................5-50 5.6.3 Data Conclusions ........................................................................................................................5-52 5.6.4 Compliance .................................................................................................................................5-52 5.7 Reporting Format ........................................................................................................................5-53 5.7.1 Operating History .......................................................................................................................5-53 5.7.2 Survey Unit Summary Report.....................................................................................................5-53 5.7.3 Final Status Survey Report .........................................................................................................5-53 5.7.4 Other Reports ..............................................................................................................................5-54 5.8 Final Status Survey Quality Program .........................................................................................5-54 5.8.1 Rancho Seco Quality Assurance Program ..................................................................................5-54 5.8.2 FSS Quality Assurance Project Plan (QAPP) .............................................................................5-54 5.8.3 Assessment and Oversight ..........................................................................................................5-59 5.8.4 Data Validation and Verification ................................................................................................5-59

Rancho Seco License Termination Plan Revision 1 Chapter 5, Final Status Survey Plan May 2008
Page 5-ii
5.8.5 Confirmatory Measurements ......................................................................................................5-59 5.9 References...................................................................................................................................5-62 5.9.1 Applicable Site Procedures For FSS...........................................................................................5-62
TABLES
5-1 Single Nuclide DCGLW Values for Detectable Radionuclides in Soil .........................................5-6
5-2 Calculated Structural Surface Single Nuclide DCFs and DCGLWs..............................................5-7
5-3 Area Designations.......................................................................................................................5-11
5-4A Survey Unit Classifications – General Open Land Areas...........................................................5-12
5-4B Survey Unit Classifications - Site Surface Soils .........................................................................5-13
5-4C Survey Unit Classification – Paved Surfaces and Foundation Pads ...........................................5-14
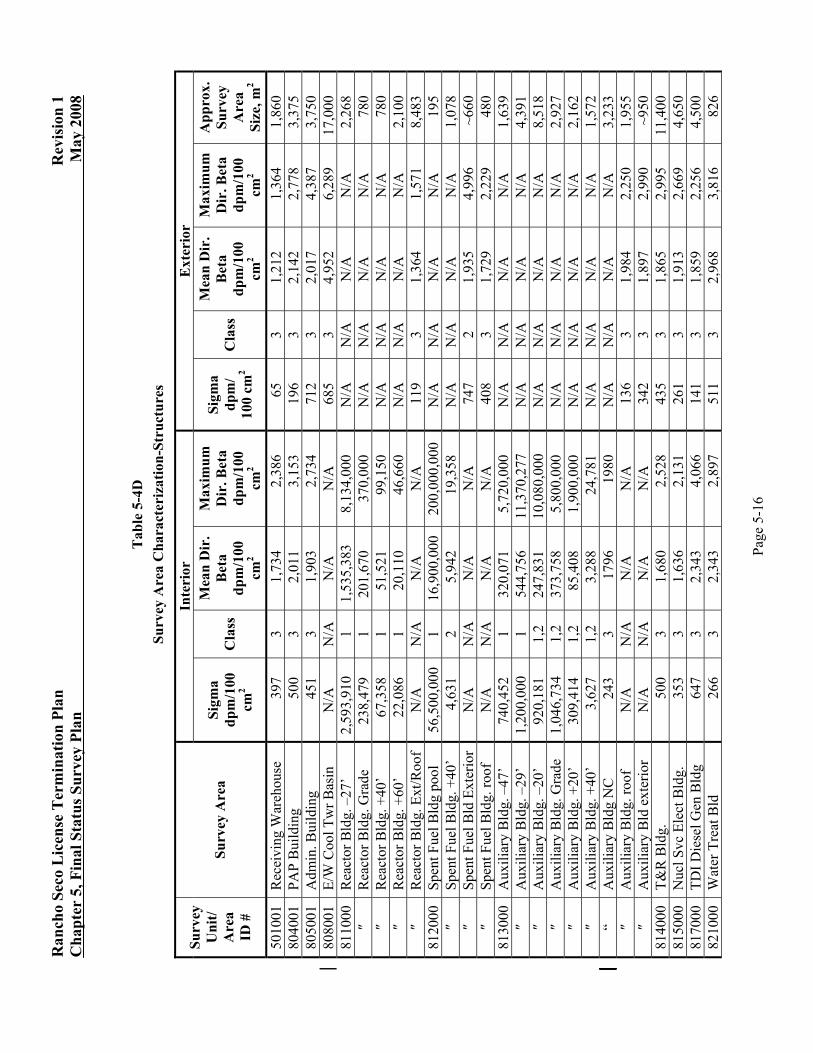
5-4D Survey Area Characterization-Structures....................................................................................5-16
5-4E Survey Area Characterization – Remaining Buried and Embedded Pipe...................................5-18
5-5 Suggested Survey Unit Areas .....................................................................................................5-19
5-6 Scan Measurements ....................................................................................................................5-22
5-7 Investigation Levels ....................................................................................................................5-27
5-8 Calculated Surface Soil Area Factors .........................................................................................5-28
5-9 Calculated Structural Surface Area Factor Values .....................................................................5-29
5-10 Investigation Actions for Individual Survey Unit Measurements...............................................5-30
5-11 Typical FSS Survey Instrumentation ..........................................................................................5-36
5-12 Typical FSS Detection Sensitivities............................................................................................5-38
5-13 Interpretation of Sample Measurements When the WRS Test Is Used ......................................5-48
5-14 Interpretation of Sample Measurements When the Sign Test Is Used........................................5-49
FIGURES
5-1 FSS Process Overview................................................................................................................5-60
5-2 Area Designations.......................................................................................................................5-61

Rancho Seco License Termination Plan Revision 1 Chapter 5, Final Status Survey Plan May 2008
Page 5-1
5.0 FINAL STATUS SURVEY PLAN
5.1 Introduction
The Rancho Seco Nuclear Generating Station (Rancho Seco) Final Status Survey (FSS) Plan has been prepared using the applicable regulatory and industry guidance. This plan will be used to develop site procedures and work instructions to perform the FSS of the Rancho Seco site.
5.1.1 Purpose
The FSS Plan describes the final survey process used to demonstrate that the Rancho Seco facility and site comply with radiological criteria for unrestricted use specified in 10 CFR 20.1402, i.e., annual dose limit of 25 millirem plus ALARA for all dose pathways. Nuclear Regulatory Commission (NRC) regulations applicable to radiation surveys are found in 10 CFR 50.82(a)(9)(ii)(D) and 10 CFR 20.1501(a) and (b).
5.1.2 Scope
The Sacramento Municipal Utility District (District) intends to release site land from the 10 CFR Part 50 license using a phased approach. Phase I includes the majority of the site land and remaining structures (approximately 2,468 of the total 2,480 acres) scheduled for release after all demolition, remediation and FSS activities associated with plant operation are complete. Phase II of site release includes the approximately two acre Interim On-Site Storage Building (IOSB) following class B and C packaged radioactive waste removal, any required facility remediation and FSS. Once both these phases are complete the Rancho Seco site license under 10 CFR Part 50 will be terminated. An approximate 10 acre Independent Spent Fuel Storage Installation (ISFSI) located on the site is licensed under 10 CFR Part 72 and is not subject to the conditions of this License Termination Plan (LTP).
This FSS Plan addresses requirements applicable to Phase I of site release and may also be used during Phase II to release the IOSB following class B and C packaged radioactive waste removal. This Plan addresses only facilities and land areas that are identified as contaminated or potentially contaminated (impacted) resulting from activities associated with commercial nuclear plant operation.
5.1.3 Final Status Survey Preparation and Implementation Overview
The FSS Plan contained in this chapter will be used as the basis for developing FSS procedures and applying existing procedures to the FSS process. Section 5.1.4 contains a list of regulatory documents used as guidance in preparing the FSS Plan. Figure 5-1 provides an overview of the FSS process. Quality Assurance requirements are outlined in Section 5.8 and apply to activities associated with decommissioning and FSS.
An FSS Package will be produced for each survey area; this survey package is a collection of documentation detailing survey design, survey implementation and data evaluation for a final status survey of an area. The sections below describe specific elements of the FSS organization, preparation and implementation. All processes associated with final status surveys will be conducted in accordance with approved site procedures.

Rancho Seco License Termination Plan Revision 1 Chapter 5, Final Status Survey Plan May 2008
Page 5-2
5.1.3.1 FSS Organization
The general FSS organization will consist of supervision, technical specialists, work planning coordinators, field coordinators, data analysts, and technicians. Since the FSS organization has not been fully implemented at the time of LTP development, it is expected that specific job titles may vary over the period of project execution. These titles are used within this document to describe various functional areas of responsibility and do not necessarily refer to specific job titles. Refer to Section 5.8.2.1 and RSAP-1901 which outline the responsibilities and functions of the FSS organization.
5.1.3.2 Survey Preparation
Survey preparation is the first step in the final status survey process and occurs after any necessary remediation is completed. In areas where remediation is required, a remediation survey or equivalent evaluation will be performed to confirm that remediation was successful prior to initiating FSS activities. Remediation surveys, turnover surveys, or equivalent evaluation, for areas not requiring remediation, may be performed using the same process and controls as a FSS so that data from these surveys may be used as part of the FSS data. In order for survey data to be used for FSS, it is intended that it should have been designed and collected in compliance with approved procedures and Sections 5.3 through 5.5 and the area controlled in accordance with approved procedures and Section 5.2.4 (Any surveys performed prior to the approval of the LTP are understood to have been performed “at risk”. Survey design and the data collected would be carefully evaluated to ensure the intent of the LTP and associated procedures were met before using the data). Following turnover/remediation surveys or post-remediation evaluation, the FSS is performed. Areas to be surveyed are isolated and/or controlled to ensure that radioactive material is not reintroduced into the area from ongoing activities nearby and to maintain the “as left” condition of the area. Section 5.2 addresses specific survey preparation requirements and considerations.
Tools, equipment, and materials not needed to support survey activities are removed, unless authorized by the Dismantlement Superintendent (Radiological). Routine access, material storage, and worker transit through the area are not allowed, unless authorized by the FSS Supervisor. However, survey areas may, with proper approval, be used for staging of materials and equipment providing; 1) the staging does not interfere with performance of surveys, and 2) the material or equipment is free of surface contamination or radioactive materials, and 3) the safety of survey personnel is not jeopardized. An inspection of the area is conducted by FSS personnel to ensure that work is complete and the area is ready for final status survey. Approved procedures provide isolation and control measures until the area is released for unrestricted use.
5.1.3.3 Survey Design
The survey design process establishes the methods and performance criteria used to conduct the survey. Survey design assumptions are documented in “Survey Packages” in accordance with approved procedures. The site land, structures, and systems (embedded and buried piping/conduit are the principal potentially contaminated systems that will remain after decommissioning) are organized into survey areas and classified by contamination potential as Class 1, Class 2, Class 3, or non-impacted in accordance with Section 5.2.2.
Survey unit size is based on the assumptions in the dose assessment models in accordance with the guidance provided in NUREG-1757, Volume 2, “Consolidated NMSS Decommissioning

Rancho Seco License Termination Plan Revision 1 Chapter 5, Final Status Survey Plan May 2008
Page 5-3
Guidance - Characterization, Survey, and Determination of Radiological Criteria, Final Report,” [Reference 5-1]. The percent coverage for scan surveys is determined in accordance with Section 5.3.2. The number and location of structure surface measurements (and structure volumetric samples) and soil samples are established in accordance with Sections 5.3.3 and 5.3.5. Investigation levels are also established in accordance with Section 5.3.6.
A survey map is prepared for each survey unit and a reference grid is superimposed on the map to allow use of an (x, y) coordinate system. Random numbers between 0 and 1 are generated, which are then multiplied by the maximum x and y axis values of the sample grid. This provides coordinates for each random sample location, or a random start location for systematic grid, as appropriate. The measurement/sample locations are plotted on the map.
Each measurement/sample location is assigned a unique identification code, which identifies the measurement/sample by survey unit, and sequential number. The appropriate instruments and detectors, instrument operating modes and survey methods to be used to collect and analyze data are also specified.
Replicate measurements are performed as part of the quality process established to identify, assess, and control errors and uncertainty associated with sampling, survey, or analytical activities. This quality control process, described in Section 5.8.2 (FSS QAPP), provides assurance that the survey data meets the accuracy and reliability requirements necessary to support the decision to release or not release a survey unit.
Written survey instructions that incorporate the requirements set forth in the survey design are completed. Direction is provided, as applicable to survey design, for selection of instruments, count times, instrument modes, survey methods, required documentation, alarm/investigation setpoints, alarm actions, background requirements and other appropriate instructions. In conjunction with the survey instructions, survey data forms may be prepared to assist in survey documentation. Alternatively, electronic data recording systems may be utilized. The survey design is reviewed and quality verification steps applied to ensure that appropriate instruments, survey methods and sample locations have been properly identified.
5.1.3.4 Survey Data Collection
After preparation of a survey package, the FSS data are collected. Trained and qualified personnel will perform the necessary measurements using calibrated instruments in accordance with approved procedures and instructions contained in the survey package. Section 5.5 addresses FSS data collection requirements.
Survey areas and/or locations are identified by gridding, markings, or flags as appropriate. A FSS Field Coordinator performs a pre-survey briefing with the survey technicians during which the survey instructions are reviewed and additional survey unit considerations are discussed (e.g., safety). The technicians gather instruments and equipment as indicated and perform surveys in accordance with the appropriate procedures and survey package specifications. Technicians are responsible for documenting survey results and maintaining custody of samples and instrumentation. At the completion of surveys, technicians return instruments and prepare samples for analysis. Survey instruments provided to the technicians are prepared in accordance with approved site procedures and the survey instructions. Instrument calibration and performance checks are performed in accordance with applicable procedures. Data are reviewed to flag any measurements that exceed investigation criteria so that appropriate investigation surveys and remediation can be performed as necessary.

Rancho Seco License Termination Plan Revision 1 Chapter 5, Final Status Survey Plan May 2008
Page 5-4
Following completion of a FSS, if a survey unit has been designated to receive a Quality Control (QC) survey (replicate surveys, sample recounts, etc.), a QC survey package is developed and implemented. QC measurement results are compared to the original measurement results. If QC results do not reach the same conclusion as the original survey, an investigation is performed. Section 5.8 provides additional detail regarding QC survey requirements.
5.1.3.5 Data Assessment
Survey data assessment is performed to verify that the data are sufficient to demonstrate that the survey unit meets the unrestricted use criterion. Statistical analyses are performed on the data and compared to pre-determined investigation levels (see Section 5.3.6). Depending on the results of the data assessment and any required investigation, the survey unit may either be released or require further remediation, reclassification, and/or resurvey. Assumptions and requirements in the survey package are reviewed for applicability and completeness; additional data needs are identified during this review. Specific data assessment requirements are contained in Section 5.6.
A review is performed of survey data and sample counting reports to verify completeness, legibility and compliance with survey design and associated instructions. As directed by FSS supervision, the following types of activities may be performed:
• Convert data to reporting units,
• Calculate mean, median and range of the data set,
• Review the data for outliers,
• Calculate the standard deviation of the data set,
• Calculate minimum detectable concentration (MDC) for each survey type performed, and
• Create posting, frequency or quantile plots for visual interpretation of data.
Computer programs may be utilized for these activities. FSS personnel include data quality verifications in their evaluations of statistical calculations; integrity and usefulness of the data set and the need for further data or investigation are also included in the evaluations. The results of the data evaluation are documented and filed in the survey package.
5.1.3.6 Final Status Survey Package Completion
Survey results are documented by survey unit in corresponding survey packages. Each FSS Package may contain the data from the several survey units that are contained in a given survey area. The data are reviewed, analyzed, and processed and the results documented in the FSS Package. This documentation file provides a record of the information necessary to support the decision to release the survey units for unrestricted use. An FSS Report will be prepared to provide the necessary data and analyses from survey packages for submittal to the NRC. Section 5.7 addresses reporting of survey results and conclusions.
5.1.4 Regulatory Requirements and Industry Guidance
This FSS Plan has been developed using the guidance contained in the following documents:

Rancho Seco License Termination Plan Revision 1 Chapter 5, Final Status Survey Plan May 2008
Page 5-5
• NUREG-1575, “Multi-Agency Radiation Survey and Site Investigation Manual (MARSSIM),” [Reference 5-2],
• NUREG-1505, “A Nonparametric Statistical Methodology for the Design and Analysis of Final Status Decommissioning Surveys,” [Reference 5-3],
• NUREG-1507, “Minimum Detectable Concentrations With Typical Radiation Survey Instruments for Various Contaminants and Field Conditions,” [Reference 5-4],
• NUREG-1700, “Standard Review Plan for Evaluating Nuclear Power Reactor License Termination Plans,” [Reference 5-5],
• NUREG–1757, Vol. 2, “Consolidated NMSS Decommissioning Guidance - Characterization, Survey, and Determination of Radiological Criteria, Final Report,” and
• Regulatory Guide 1.179, “Standard Format and Content of License Termination Plans for Nuclear Power Reactors,” (January 1999) [Reference 5-6].
Other documents used in the preparation of this plan are listed in the References section (see Section 5.9).
The District anticipates the NRC may choose to conduct confirmatory measurements during Rancho Seco FSS activities. The NRC may take confirmatory measurements to make a determination in accordance with 10 CFR 50.82(a)(11) that the FSS and associated documentation demonstrate that the site is suitable for release in accordance with the criteria established in 10 CFR Part 20, subpart E.
5.2 Development of Survey Plan
5.2.1 Radiological Status
The following sections provide a summary of site characterization and dose modeling results applicable to development of the Rancho Seco FSS Plan.
5.2.1.1 Identification of Radiological Contaminants
A site-specific suite of radionuclides potentially present at Rancho Seco has been developed. This suite contains 26 radionuclides that are potentially present in Rancho Seco environs, structures and systems/components. Development of this site-specific suite of radionuclides is described in detail in the LTP Chapter 6, Compliance with the Radiological Criteria for License Termination, Section 6.4.
The District has conducted extensive radiological characterization of the site property to identify and document residual contamination resulting from nuclear plant operation. The effort included reviews of historical information as well as physical measurements of onsite soils, structures, systems and groundwater during scoping and characterization surveys. The LTP Chapter 2, Site Characterization, contains a detailed discussion of this effort.
5.2.1.2 Dose Modeling Summary
Dose models were based on NUREG/CR-5512, Volume 1, “Residual Radioactive Contamination from Decommissioning,” [Reference 5-7] and RESRAD Version 6.22 and

Rancho Seco License Termination Plan Revision 1 Chapter 5, Final Status Survey Plan May 2008
Page 5-6
RESRAD-BUILD Version 3.22 (RESRAD Version 6.3 and RESRAD-BUILD Version 3.3 for calculation revisions) were used to calculate single nuclide Derived Concentration Guideline Levels (DCGLs) for the Rancho Seco site. These dose models translate residual radioactivity levels into potential radiation doses to the public and are defined by three factors: (1) exposure scenario, (2) exposure pathways, and (3) exposed critical group. The scenarios presented in NUREG/CR-5512 address the major exposure pathways of direct exposure to penetrating radiation and inhalation and ingestion of radioactive materials. These scenarios also identify the critical group. The "critical group" is the group of individuals reasonably expected to receive the greatest exposure to residual radioactivity within the assumptions of the particular land and structure use scenario.
As discussed in LTP Chapter 6, Section 6.5, the District has no plans to release any of the District-owned and District-controlled 2,480 acre site for ownership by members of the public. The site continues to be an important electrical generation and distribution center for the District. Therefore, an industrial worker scenario was selected for developing site-specific soil DCGLs and an industrial worker building occupancy scenario was selected for developing site-specific structural surface DCGLs. Table 5-1 provides a list of significant radionuclides that may be present in onsite soils and their corresponding single nuclide DCGL values derived in LTP Chapter 6. Table 5-2 provides a list of significant radionuclides that may be present on structural surfaces and their corresponding single nuclide DCGL values as derived in Chapter 6.
Table 5-1
Single Nuclide DCGLW Values for Detectable Radionuclides in Soil
Radionuclide Peak of the Mean Dose (mrem/y per pCi/g)
DCGLW (pCi/g)
C-14 2.93E-06 8.33E+06 Co-60 1.93E+00 1.26E+01 Ni-63 1.60E-06 1.52E+07 Sr-90 3.76E-03 6.49E+03
Cs-134 1.09E+00 2.24E+01 Cs-137 4.62E-01 5.28E+01

Rancho Seco License Termination Plan Revision 1 Chapter 5, Final Status Survey Plan May 2008
Page 5-7
Table 5-2
Calculated Structural Surface Single Nuclide DCFs and DCGLWs
Radionuclide Dose Conversion Factor
(mrem/yr per dpm/100 cm2) DCGLW
(dpm/100 cm2) H-3 7.94E-08 3.15E+08 C-14 2.92E-06 8.56E+06 Na-22 1.47E-03 1.70E+04 Fe-55 7.31E-07 3.42E+07 Ni-59 3.13E-07 7.99E+07 Co-60 1.64E-03 1.52E+04 Ni-63 8.20E-07 3.05E+07 Sr-90 2.07E-04 1.21E+05 Nb-94 1.09E-03 2.29E+04 Tc-99 2.13E-06 1.17E+07
Ag-108m 1.13E-03 2.21E+04 Sb-125 3.13E-04 7.99E+04 Cs-134 1.14E-03 2.19E+04 Cs-137 4.50E-04 5.56E+04 Pm-147 1.50E-06 1.67E+07 Eu-152 7.86E-04 3.18E+04 Eu-154 8.43E-04 2.97E+04 Eu-155 4.78E-05 5.23E+05 Np-237 1.05E-02 2.38E+03 Pu-238 7.30E-03 3.42E+03 Pu-239 8.19E-03 3.05E+03 Pu-240 8.19E-03 3.05E+03 Pu-241 1.37E-04 1.82E+05 Am-241 8.37E-03 2.99E+03 Pu-242 7.81E-03 3.20E+03 Cm-244 4.15E-03 6.02E+03
Other specialized DCGL values have also been developed in LTP Chapter 6. These include DCGL values for bulk material, containment building interior surfaces, buried piping and embedded piping. Their use is described in subsequent sections of this LTP Chapter.
5.2.1.3 Surrogate Ratio DCGLs
As a general rule, surrogate ratio DCGLs are developed and applied to land areas and materials with volumetric residual radioactivity where fairly constant radionuclide concentration ratios can be demonstrated to exist. They are derived using pre-remediation site characterization data collected prior to the FSS. The established ratio among the radionuclide concentrations allows the concentration of every radionuclide to be expressed in terms of any one of them.
Likewise, a surrogate ratio DCGL allows the DCGLs specific to hard-to-detect radionuclides in a mixture to be expressed in terms of a single radionuclide that is more readily measured. The

Rancho Seco License Termination Plan Revision 1 Chapter 5, Final Status Survey Plan May 2008
Page 5-8
measured radionuclide is called the surrogate radionuclide. Cs-137 is expected to be the surrogate radionuclide.
A sufficient number of measurements, representative of the area of interest, are taken to establish a consistent ratio of radionuclide concentrations. The number of measurements needed to determine the ratio is based on the chemical, physical and radiological characteristics of the radionuclides and the site. Measurements from different media types will not be mixed to derive the ratio. The surrogate ratio is acceptable if the mean values for individual samples for a given media are within two standard deviations of the overall mean value for the media.
Once an appropriate surrogate ratio is determined, the DCGL of the measured radionuclide is modified to account for the represented radionuclide according to the following Equation 5-1 (MARSSIM Equation 4-1):
( )( )[ ] pSurSurp
pSurSR DCGLDCGLCC
DCGLDCGLDCGL
ReRe
Re
+×=
Equation 5-1
where:
DCGLSR = modified DCGL for surrogate ratio,
DCGLSur = DCGL for surrogate radionuclide,
DCGLRep = DCGL for represented radionuclide,
CRep = Concentration of represented radionuclide, and
CSur = Concentration of surrogate radionuclide.
When a surrogate ratio is established using data collected prior to remediation, post-remediation or FSS measurements will be reviewed to ensure that the established ratios are still appropriate. The surrogate ratio DCGL will be evaluated using the Rancho Seco DQOs and modified, if necessary. Professional judgment is used to determine consistency.
5.2.1.4 Gross Activity DCGLs
As a rule, gross activity DCGLs are developed and applied to structures and plant systems with surface residual radioactivity where multiple radionuclides are present at concentrations that exceed 10 percent of their respective DCGLs. The gross activity DCGL is determined in a manner similar to surrogate DCGLs taking into account nuclide detectability to enable field measurement of gross activity, rather than the determination of individual radionuclide activity, for comparison to the radionuclide specific DCGL. The gross activity DCGL, or DCGLGA, for surfaces with multiple radionuclides is calculated using the following Equation 5-2 (MARSSIM, Equation 4-4):

Rancho Seco License Termination Plan Revision 1 Chapter 5, Final Status Survey Plan May 2008
Page 5-9
n
nGA
DCGLf
DCGLf
DCGLfDCGL
...
1
2
2
1
1 ++=
Equation 5-2
where:
fn = fraction of the total activity contributed by radionuclide n, and
DCGLn = DCGL for radionuclide n.
Different radionuclides or radionuclide combinations may exist on different portions of the site and require the calculation of one or more site-specific gross activity DCGLs. Gross activity DCGLs are calculated using the relative nuclide fractions determined from samples of building surface or plant system material, as appropriate, prior to remediation. For areas where the radionuclide distribution has not been determined, the most conservative distribution resulting in the lowest DCGL of those specified areas will be used. The distributions are based on the radionuclides identified in composite samples collected from the specific areas prior to FSS. If new radionuclide distribution data are obtained and determined to be more appropriate for use, the DCGL may be re-evaluated and altered during the course of the FSS, however the single nuclide DCGLs will not be revised without NRC approval.
5.2.2 Classification of Areas
Prior to beginning the final status survey, a thorough characterization of the radiological status and history of the site was performed. Additional data may be collected and evaluated throughout the decommissioning. The methods and results from site characterization are described in Chapter 2 of this LTP. Based on the characterization results, the structures and open land areas were classified following the guidance in Appendix A of NUREG-1757, Volume 2 and Section 4.4 of NUREG-1575. Area classification ensures that the number of measurements, and the scan coverage, are commensurate with the potential for residual contamination to exceed the unrestricted use criteria.
Initial classification of site areas is based on historical information and site scoping and characterization data. Data from operational surveys performed in support of decommissioning, routine surveillance or any other applicable survey data may be used to change the initial classification of an area up to the time of commencement of the final status survey as long as the classification reflects the levels of residual radioactivity that existed prior to remediation. Once the FSS of a given survey unit begins, the basis for any reclassification will be documented, requiring a redesign of the survey unit package and the initiation of a new survey using the redesigned survey unit package. If during the conduct of a FSS, sufficient evidence is accumulated to warrant an investigation and reclassification of the survey unit, the FSS may be terminated without completing the survey unit package.
5.2.2.1 Non-Impacted Areas
Non-impacted areas have no reasonable potential for residual contamination because there was no demonstrable impact from site operations. These areas are not required to be surveyed beyond what has already been completed as a part of the HSA as described in the LTP Chapter 2, Section 2.2, or scoping or site characterization surveys performed to confirm the area’s non-impacted classification. Rancho Seco will continue to implement a Radiological Environmental

Rancho Seco License Termination Plan Revision 1 Chapter 5, Final Status Survey Plan May 2008
Page 5-10
Monitoring Program (REMP) through decommissioning and license termination. The REMP program is focused upon the collection of radiological data from offsite, non-impacted areas. Impacted areas are shown on Figure 2-2, Impacted Areas, in Chapter 2 of this LTP. The remaining areas of the 2,480 acre site listed in Table 5-3 are Non-Impacted.
5.2.2.2 Impacted Areas
Impacted areas may contain residual radioactivity from licensed activities. Based on the levels of residual radioactivity present, impacted areas are further divided into Class 1, Class 2 or Class 3 designations. The definitions provided below are from NUREG-1757, Volume 2, Page A2.
• Class 1 Areas: Class 1 areas are impacted areas that are expected to have concentrations of residual radioactivity that exceed the DCGLW (DCGLW is defined in the Glossary of this LTP)1,
• Class 2 Areas: Class 2 areas are impacted areas that are not likely to have concentrations of residual radioactivity that exceed the DCGLW, and
• Class 3 Areas: Class 3 areas are impacted areas that have a low probability of containing residual radioactivity.
If the available information is not sufficient to designate an area as a particular class, the area will either be classified as Class 1 or be further characterized. Areas that are considered to be on the borderline between classes will receive the more restrictive classification.
5.2.2.3 Initial Classification of Structural Surfaces, Land, Embedded Piping, and Buried Piping
Based on more than 24,000 measurements made during the site characterization and the information evaluated as part of the HSA, all land areas, structural surfaces, and piping to remain after decommissioning were assigned an initial classification.
Characterization was performed and reported by initial survey unit designation. The area designations developed for the characterization process were used, for the most part, to delineate and classify areas for final status survey. This allows characterization data to be efficiently used for final survey area classification and for estimating the sigma value for sample size determination. For operational efficiency, each of the final survey areas listed in Table 5-3 may be subdivided into multiple areas. Smaller survey areas may be necessary to enhance the efficiency of data collection, processing, and review and serve to better support the decommissioning schedule. The classification of all subdivided survey areas will be the same as indicated in Tables 5-4A, 5-4B, 5-4C, 5-4D and 5-4E, unless reclassified in accordance with this LTP. No individual survey unit will have more than one classification.
1 The W In DCGLW refers to the Wilcoxon Rank Sum test per MARSSIM (NUREG-1575, page 2-3) and generally represents the uniform level of residual contamination that results in the dose limit, regardless of the statistical test used. Rancho Seco intends to use the Sign Test and will still use the term DCGLW to denote contamination limits, see Section 5.6.1.3.

Rancho Seco License Termination Plan Revision 1 Chapter 5, Final Status Survey Plan May 2008
Page 5-11
Table 5-3 Area Designations
Area 1 (100000) Non-Impacted* Area 2 (200000) Non-Impacted* Area 3 (300000) Non-Impacted Area 4 (400000) Non-Impacted Area 5 (500000) Non-Impacted* Area 6 (600000) Non-Impacted Area 7 (700000) Non-Impacted Area 8 (800000) Impacted Area 9 (900000) Non-Impacted
*Areas 1, 2 and 5 contain impacted survey units within them

Ran
cho
Seco
Lic
ense
Ter
min
atio
n Pl
an
R
evis
ion
1 C
hapt
er 5
, Fin
al S
tatu
s Sur
vey
Plan
May
200
8
Pa
ge 5
-12
Tab
le 5
-4A
Su
rvey
Uni
t Cla
ssifi
catio
n –
Gen
eral
Ope
n L
and
Are
as
Surv
ey
Uni
t ID
#
Surv
ey A
rea
Sigm
a pC
i/g, C
s-13
7 C
lass
ifica
tion
Mea
n C
s-13
7, p
Ci/g
M
axim
um
Cs-
137,
pC
i/g
App
rox.
Sur
vey
Are
a Si
ze, m
2 10
0000
Pl
ant E
fflu
ent W
ater
Cou
rse
14.7
C
lass
2
9.22
42
.2
42,3
15
1001
00
Are
a A
roun
d Ef
fluen
t Pat
h 0.
14
Non
-Im
pact
ed
0.34
9 0.
483
N/A
20
0000
So
uth
Plan
t Out
fall
0.15
C
lass
3
0.12
9 0.
301
210,
773
3000
00
Sout
h N
on-I
mpa
cted
Are
a 0.
19
Non
-Im
pact
ed
0.32
3 0.
653
N/A
40
0000
So
uth
East
Non
-Im
pact
ed A
rea
0.17
N
on-I
mpa
cted
0.
344
0.46
5 N
/A
5000
00
Nor
th E
ast N
on-I
mpa
cted
Are
a (e
xclu
ding
par
king
lot a
nd w
areh
ouse
) 0.
16
Non
-Im
pact
ed
0.14
5 0.
255
N/A
6000
00
Nor
th N
on-I
mpa
cted
Are
a 0.
10
Non
-Im
pact
ed
0.16
4 0.
293
N/A
70
0000
W
est N
on-I
mpa
cted
Are
a (e
xclu
ding
ISFS
I)
0.12
N
on-I
mpa
cted
0.
202
0.33
2 N
/A
N
/A –
Not
app
licab
le

Ran
cho
Seco
Lic
ense
Ter
min
atio
n Pl
an
R
evis
ion
1 C
hapt
er 5
, Fin
al S
tatu
s Sur
vey
Plan
May
200
8
Pa
ge 5
-13
Tab
le 5
-4B
Su
rvey
Uni
t Cla
ssifi
catio
n –
Site
Sur
face
Soi
ls
Surv
ey
Uni
t ID
#
Surv
ey A
rea
Sigm
a pC
i/g, C
s-13
7 C
lass
ifica
tion
Mea
n pC
i/g, C
s-13
7 M
axim
um
pCi/g
, Cs-
137
App
rox.
Sur
vey
Are
a Si
ze, m
2
8000
01
Fols
om C
anal
Inta
ke
0.01
2 C
lass
3
0.07
3 0.
091
4,64
5 80
0002
H
elic
opte
r Lan
ding
Pad
0.
027
Cla
ss 3
0.
065
0.12
7 4,
506
8000
03
Sout
h Sc
rap
Yar
d 0.
103
Cla
ss 3
0.
121
0.12
1 1,
710
8000
04
Cen
tral N
-S T
rans
it/So
uth
0.01
0 C
lass
3
0.02
8 0.
048
200
8000
05
Sout
h E-
W T
rans
it Zo
ne
0.04
2 C
lass
3
0.08
8 0.
154
3,82
0
8000
06
Stor
m D
rain
Buf
fer Z
one
(Inc
orpo
rate
in
to 2
0000
0)
0.04
7 C
lass
3
0.08
5 0.
179
15,7
94
8000
07
Wes
t Ind
ustri
al A
rea
0.03
4 C
lass
3
0.07
7 0.
144
65,7
76
8000
08
Sout
h Su
ppor
t Stru
ctur
es Y
ard
0.04
1 C
lass
3
0.08
3 0.
083
7,25
0 80
0009
So
uth
East
Indu
stria
l Are
a
0.01
9 C
lass
3
0.08
0 0.
099
10,7
65
8000
12
Indu
stria
l Are
a W
aste
Sto
rage
Buf
fer
0.01
0 C
lass
3
0.05
6 0.
071
6,21
5 80
0013
C
entra
l Ind
ustri
al A
rea
0.03
0 C
lass
3
0.07
0 0.
149
14,6
76
8000
14
Nor
th In
dust
rial A
rea
Bou
ndar
y 0.
007
Cla
ss 3
0.
060
0.06
8 6,
410
5010
04
Exte
nded
Par
king
/Sto
rage
Are
a 0.
058
Cla
ss 3
0.
088
0.23
2 42
,735
80
3002
Q
uons
et-H
ut Y
ard
0.03
0 C
lass
3
0.07
7 0.
146
13,0
75
8060
00
East
/Wes
t Spr
ay P
onds
0.
026
Cla
ss 3
0.
069
0.16
7 21
,600
81
0001
Ta
nk F
arm
10
.7
Cla
ss 1
37
9.0
1040
.0
5,00
0 82
6015
Sp
ent F
uel/D
iese
l Gen
erat
or R
oom
Gap
0.
006
Cla
ss 2
0.
041
0.04
7 25
83
2000
D
iese
l Fue
l Oil
Tank
Are
a 0.
01
Cla
ss 3
0.
028
0.04
8 15
60
8340
02
Rai
l Lin
e 0.
018
Cla
ss 3
0.
073
0.11
4 6,
410
8370
00
RH
UT
Are
a 9.
83
Cla
ss 1
4.
10
31.1
92
9 83
9000
Tr
ansf
orm
er Y
ard
0.43
2 C
lass
3
0.26
6 0.
913
1,85
8 84
3002
B
arre
l Far
m B
uffe
r 1.
460
Cla
ss 2
0.
750
4.25
0 92
9 84
3003
B
arre
l Far
m B
erm
s N
/A
N/A
N
/A
N/A
3,
486
8480
00
Ret
entio
n B
asin
s Buf
fer
0.04
7 C
lass
3
0.08
6 0.
200
17,6
15
8510
00
Switc
hgea
r Yar
d 0.
008
Cla
ss 3
0.
056
0.07
2 32
,970

Ran
cho
Seco
Lic
ense
Ter
min
atio
n Pl
an
R
evis
ion
1 C
hapt
er 5
, Fin
al S
tatu
s Sur
vey
Plan
May
200
8
Pa
ge 5
-14
Tab
le 5
-4C
Su
rvey
Uni
t Cla
ssifi
catio
n –
Pave
d Su
rfac
es a
nd F
ound
atio
n Pa
ds
Pave
men
t/Pad
Su
rvey
U
nit I
D
# Su
rvey
Are
a S
igm
a dp
m/1
00 c
m2
Cla
ssifi
catio
n*
Mea
n D
irec
t Pa
vem
ent/P
ad
dpm
/100
cm
2
Max
imum
Pa
vem
ent/P
ad
dpm
/100
cm
2
App
rox.
Sur
vey
Are
a Si
ze, m
2
8000
01,2
H
elic
opte
r Pad
Are
a 20
7 C
lass
3
2,71
3 3,
158
7,57
3
8000
03
Sout
h Sc
rap
Yar
d (I
ncor
pora
te in
to
8000
01)
255
Cla
ss 3
3,
172
3,51
8 6,
650
8000
04
Cen
tral N
-S T
rans
it/So
uth
102
Cla
ss 3
1,
613
1,71
9 5,
350
8000
05
Sout
h E-
W T
rans
it/Ea
st
243
Cla
ss 3
84
1 1,
344
5,47
0 80
0007
W
est I
ndus
trial
Are
a 49
6 C
lass
3
2,97
7 5,
262
5,75
9 80
0008
So
uth
Supp
ort S
truct
ures
Yar
d 47
8 C
lass
3
2,39
7 3,
517
18,8
20
Inco
rpor
ated
in 8
0000
8
8180
01
Elec
trica
l Fab
Sho
p Pa
d 15
2 C
lass
3
1,39
2 1,
647
233
8200
01
L&D
Bui
ldin
g Pa
d 16
3 C
lass
3
2,59
3 2,
979
103
8270
01
Tool
Roo
m P
ad
136
Cla
ss 3
1,
245
1,59
3 60
5 82
8001
G
RS
War
ehou
se P
ad
141
Cla
ss 3
1,
337
1,89
2 44
6 83
8001
Fa
b Sh
op P
ad
169
Cla
ss 3
1,
413
1,77
2 1,
025
8420
00
War
ehou
se C
Pad
23
5 C
lass
3
2,20
7 2,
468
235
8000
09
Sout
h Ea
st In
dust
rial A
rea
440
Cla
ss 3
2,
424
3,42
5 3,
635
8000
10
IA C
entra
l Yar
d 74
5 C
lass
3
2,26
1 3,
397
6,72
5
In
corp
orat
ed in
800
010
83
9000
Tr
ansf
orm
er P
ads
944
Cla
ss 3
1,
086
3,93
0 10
0 80
0012
IA
Was
te S
tora
ge B
uffe
r N
/A
N/A
N
/A
N/A
4,
935
8000
13
Cen
tral I
A A
rea
496
Cla
ss 3
2,
593
4,40
3 6,
689
8000
14
Nor
th IA
Bou
ndar
y 14
7 C
lass
3
2,69
6 3,
055
1,62
5 Fo
llow
ing
to b
e m
anag
ed o
n un
it sp
ecifi
c ba
sis
5010
03
Upp
er/O
uter
Yar
d 21
2 C
lass
3
2,41
9 2,
805
2,37
5 50
1003
2 H
azar
dous
Was
te B
uild
ing
Pad
533
Cla
ss 3
19
13
2642
26
8 50
1004
Ex
tend
ed P
arki
ng/L
aydo
wn
255
Cla
ss 3
2,
522
3,25
1 28
,150
50
1005
A
cces
s Roa
d 20
0 C
lass
3
2,00
0 2,
240
7,25
0 80
0011
IA
Cen
tral E
-W C
orrid
or
1,25
6 C
lass
2
3,66
4 7,
175
8,06
5
In
corp
orat
ed in
800
011

Ran
cho
Seco
Lic
ense
Ter
min
atio
n Pl
an
R
evis
ion
1 C
hapt
er 5
, Fin
al S
tatu
s Sur
vey
Plan
May
200
8
Pa
ge 5
-15
Tab
le 5
-4C
Su
rvey
Uni
t Cla
ssifi
catio
n –
Pave
d Su
rfac
es a
nd F
ound
atio
n Pa
ds
Pave
men
t/Pad
Su
rvey
U
nit I
D
# Su
rvey
Are
a S
igm
a dp
m/1
00 c
m2
Cla
ssifi
catio
n*
Mea
n D
irec
t Pa
vem
ent/P
ad
dpm
/100
cm
2
Max
imum
Pa
vem
ent/P
ad
dpm
/100
cm
2
App
rox.
Sur
vey
Are
a Si
ze, m
2
8530
01
NPS
Fab
Sho
p Pa
d 82
9 C
lass
3
395
2,09
3 92
9 80
3001
Q
-Hut
Pad
23
4 C
lass
3
3,44
6 3,
821
150
8030
02
Q-H
ut Y
ard
N/A
N
/A
N/A
N
/A
2,25
0 80
6000
A
rea
Aro
und
Spra
y Po
nds
207
Cla
ss 3
2,
680
3,25
1 18
,820
80
8003
C
oolin
g To
wer
Bas
in B
uffe
r 3,
896
Cla
ss 2
2,
894
14,0
25
37,9
96
8090
01
Sew
er P
lant
15
8 C
lass
3
1,89
2 2,
169
227
8190
00
Bul
k W
aste
Bld
g 7,
356
Cla
ss 2
2,
497
69,8
70
475
8230
00
Inta
ke P
ump
Stru
ctur
e 66
7 C
lass
3
260
1,37
5 25
82
4000
PC
W In
take
39
7 C
lass
2
3,94
1 5,
175
5 82
6025
N
Lay
dow
n 25
0 C
lass
3
2,71
8 3,
207
175
8340
00
Rai
l Lin
e 14
70
Cla
ss 1
3,
653
8,56
7**
~100
83
6001
A
ux B
oile
r Pad
1,
109
Cla
ss 2
5,
382
9,51
3 11
2 84
3002
B
arre
l Far
m
3,63
7 C
lass
1
9,39
3 14
,574
1,
170
8480
00
Ret
entio
n B
asin
s 1,
294
Cla
ss 1
,2,3
11
,361
13
,950
3,
750
8510
00
Switc
hgea
r Yar
d 39
7 C
lass
3
2,75
1 3,
696
225
* A
reas
with
mor
e th
an o
ne c
lass
ifica
tion
repr
esen
t the
rang
e of
cla
ssifi
catio
n th
roug
hout
the
area
. Onl
y a
sing
le c
lass
will
app
ly to
a su
rvey
uni
t. **
Con
tam
inat
ed a
spha
lt at
43
pCi/g
dis
cove
red.
N
/A –
Not
app
licab
le
Ran
cho
Seco
Lic
ense
Ter
min
atio
n Pl
an
R
evis
ion
1 C
hapt
er 5
, Fin
al S
tatu
s Sur
vey
Plan
May
200
8
Pa
ge 5
-16
Tab
le 5
-4D
Su
rvey
Are
a C
hara
cter
izat
ion-
Stru
ctur
es
Inte
rior
E
xter
ior
Surv
ey
Uni
t/ A
rea
ID #
Surv
ey A
rea
Sigm
a dp
m/1
00
cm2
Cla
ss
Mea
n D
ir.
Bet
a dp
m/1
00
cm2
Max
imum
D
ir. B
eta
dpm
/100
cm
2
Sigm
a dp
m/
100
cm2
Cla
ss
Mea
n D
ir.
Bet
a dp
m/1
00
cm2
Max
imum
D
ir. B
eta
dpm
/100
cm
2
App
rox.
Su
rvey
A
rea
Size
, m2
5010
01
Rec
eivi
ng W
areh
ouse
39
7 3
1,73
4 2,
386
65
3 1,
212
1,36
4 1,
860
8040
01
PAP
Bui
ldin
g 50
0 3
2,01
1 3,
153
196
3 2,
142
2,77
8 3,
375
8050
01
Adm
in. B
uild
ing
451
3 1,
903
2,73
4 71
2 3
2,01
7 4,
387
3,75
0 80
8001
E/
W C
ool T
wr B
asin
N
/A
N/A
N
/A
N/A
68
5 3
4,95
2 6,
289
17,0
00
8110
00
Rea
ctor
Bld
g. –
27’
2,59
3,91
0 1
1,53
5,38
3 8,
134,
000
N/A
N
/A
N/A
N
/A
2,26
8 ″
Rea
ctor
Bld
g. G
rade
23
8,47
9 1
201,
670
370,
000
N/A
N
/A
N/A
N
/A
780
″ R
eact
or B
ldg.
+40
’ 67
,358
1
51,5
21
99,1
50
N/A
N
/A
N/A
N
/A
780
″ R
eact
or B
ldg.
+60
’ 22
,086
1
20,1
10
46,6
60
N/A
N
/A
N/A
N
/A
2,10
0 ″
Rea
ctor
Bld
g. E
xt/R
oof
N/A
N
/A
N/A
N
/A
119
3 1,
364
1,57
1 8,
483
8120
00
Spen
t Fue
l Bld
g po
ol
56,5
00,0
00
1 16
,900
,000
20
0,00
0,00
0 N
/A
N/A
N
/A
N/A
19
5 ″
Spen
t Fue
l Bld
g. +
40’
4,63
1 2
5,94
2 19
,358
N
/A
N/A
N
/A
N/A
1,
078
″ Sp
ent F
uel B
ld E
xter
ior
N/A
N
/A
N/A
N
/A
747
2 1,
935
4,99
6 ~6
60
″ Sp
ent F
uel B
ldg.
roof
N
/A
N/A
N
/A
N/A
40
8 3
1,72
9 2,
229
480
8130
00
Aux
iliar
y B
ldg.
–47
’ 74
0,45
2 1
320,
071
5,72
0,00
0 N
/A
N/A
N
/A
N/A
1,
639
″ A
uxili
ary
Bld
g. –
29’
1,20
0,00
0 1
544,
756
11,3
70,2
77
N/A
N
/A
N/A
N
/A
4,39
1 ″
Aux
iliar
y B
ldg.
–20
’ 92
0,18
1 1,
2 24
7,83
1 10
,080
,000
N
/A
N/A
N
/A
N/A
8,
518
″ A
uxili
ary
Bld
g. G
rade
1,
046,
734
1,2
373,
758
5,80
0,00
0 N
/A
N/A
N
/A
N/A
2,
927
″ A
uxili
ary
Bld
g. +
20’
309,
414
1,2
85,4
08
1,90
0,00
0 N
/A
N/A
N
/A
N/A
2,
162
″ A
uxili
ary
Bld
g. +
40’
3,62
7 1,
2 3,
288
24,7
81
N/A
N
/A
N/A
N
/A
1,57
2 “
Aux
iliar
y B
ldg
NC
24
3 3
1796
19
80
N/A
N
/A
N/A
N
/A
3,23
3 ″
Aux
iliar
y B
ldg.
roof
N
/A
N/A
N
/A
N/A
13
6 3
1,98
4 2,
250
1,95
5 ″
Aux
iliar
y B
ld e
xter
ior
N/A
N
/A
N/A
N
/A
342
3 1,
897
2,99
0 ~9
50
8140
00
T&R
Bld
g.
500
3 1,
680
2,52
8 43
5 3
1,86
5 2,
995
11,4
00
8150
00
Nuc
l Svc
Ele
ct B
ldg.
35
3 3
1,63
6 2,
131
261
3 1,
913
2,66
9 4,
650
8170
00
TDI D
iese
l Gen
Bld
g 64
7 3
2,34
3 4,
066
141
3 1,
859
2,25
6 4,
500
8210
00
Wat
er T
reat
Bld
26
6 3
2,34
3 2,
897
511
3 2,
968
3,81
6 82
6

Ran
cho
Seco
Lic
ense
Ter
min
atio
n Pl
an
R
evis
ion
1 C
hapt
er 5
, Fin
al S
tatu
s Sur
vey
Plan
May
200
8
Pa
ge 5
-17
Tab
le 5
-4D
Su
rvey
Are
a C
hara
cter
izat
ion-
Stru
ctur
es
Inte
rior
E
xter
ior
Surv
ey
Uni
t/ A
rea
ID #
Surv
ey A
rea
Sigm
a dp
m/1
00
cm2
Cla
ss
Mea
n D
ir.
Bet
a dp
m/1
00
cm2
Max
imum
D
ir. B
eta
dpm
/100
cm
2
Sigm
a dp
m/
100
cm2
Cla
ss
Mea
n D
ir.
Bet
a dp
m/1
00
cm2
Max
imum
D
ir. B
eta
dpm
/100
cm
2
App
rox.
Su
rvey
A
rea
Size
, m2
8220
00
Chl
orin
e B
ld
438
3 82
8 1,
723
1,03
2 3
1,51
7 3,
832
1,05
5 82
6000
Tu
rbin
e B
ldg-
7’
5,99
0 1,
2,3
3,07
7 24
,900
N
/A
N/A
N
/A
N/A
97
4 ″
Turb
ine
Bld
g G
rade
1,
316
1,2,
3 2,
305
6,98
0 N
/A
N/A
N
/A
N/A
4,
190
″ Tu
rbin
e B
ldg
Mez
z 40
2 3
1,56
6 2,
626
N/A
N
/A
N/A
N
/A
2,60
5 ″
Turb
ine
Bld
+40
’& E
xt
277
3 2,
843
3,61
5 1,
723
3 1,
984
10,3
12
4211
83
1000
M
icro
wav
e B
ld
1,63
9 3
1,56
8 6,
344
5,21
0 2
2,87
5 13
,253
35
0 83
3000
W
areh
ouse
B
807
3 63
5 3,
751
10,0
64
2 3,
749
34,7
85
6,34
5 84
0000
W
areh
ouse
A
495
3 1,
941
3,39
7 51
1 3
2,31
0 3,
838
6,87
5 84
8000
R
eten
tion
Bas
in
601
1 45
,485
45
,910
N
/A
N/A
N
/A
N/A
21
,368
85
0000
So
lidifi
catio
n Pa
d/W
all
N/A
N
/A
N/A
N
/A
57,8
32
1 22
,653
32
2,60
0 36
0 85
1000
Sw
itchy
ard
Con
trol B
ld
342
3 1,
663
2,37
6 19
6 3
1,39
7 1,
843
2,97
5 85
2000
M
achi
ne S
hop
288
3 1,
973
2,40
8 21
7 3
2,08
7 2,
620
2,90
0 85
6000
Se
c A
larm
Sta
tion
1,20
5 3
300
2,63
6 4,
317
3 29
3 92
30
350

Ran
cho
Seco
Lic
ense
Ter
min
atio
n Pl
an
R
evis
ion
1 C
hapt
er 5
, Fin
al S
tatu
s Sur
vey
Plan
May
200
8
Pa
ge 5
-18
Tab
le 5
-4E
Su
rvey
Are
a C
hara
cter
izat
ion
– R
emai
ning
Bur
ied
and
Em
bedd
ed P
ipe
Surv
ey
Uni
t/Are
a ID
#
Des
crip
tion
Sigm
a dp
m/1
00
cm2
Mea
n D
irec
t dp
m/1
00 c
m2
Max
imum
D
irec
t dp
m/1
00 c
m2
Cla
ssifi
catio
nIn
tern
al
Surf
ace
Are
a m
2
8990
02
Aux
Fee
dwat
er P
ipin
g 20
7 36
8 63
4 C
lass
3
43
8990
05
Cle
an D
rain
Sys
tem
, Sto
rm D
rain
Dir.
Off
site
39
2 19
6 38
0 C
lass
3
4644
89
9006
C
ompo
nent
Coo
ling
Wat
er S
yste
m P
ipin
g 10
,049
-2
067
32,2
96
Cla
ss 3
49
89
9007
C
lean
Dra
in S
yste
m P
ipin
g –
Turb
ine
Bld
Em
bedd
ed
93,5
19
56,2
08
680,
000
Cla
ss 1
,2
310
8990
08
Cle
an D
rain
Sys
tem
Pip
ing
- Sew
er
4 6
10
NI
N/A
89
9009
C
lean
Dra
in S
yste
m P
ipin
g –
Coo
ling
Tow
er,
BD
,Sto
rm D
rain
to E
ff
431
2,59
0 3,
158
Cla
ss 3
27
34
8990
10
Die
sel F
uel O
il Sy
stem
Pip
ing
4,98
4 -8
,894
18
6 N
I N
/A
8990
11
Dec
ay H
eat S
yste
m P
ipin
g-Em
bedd
ed
630,
324
480,
508
3,41
2,00
0 C
lass
1
54
8990
17
Fire
Pro
tect
ion
Wat
er S
yste
m P
ipin
g 81
5 35
1,
154
NI
N/A
89
9025
In
stru
men
t Air
Syst
em P
ipin
g 3,
793
-5,3
67
1,52
0 N
I N
/A
8990
28
Mai
n C
onde
nser
Mak
eup
1,08
9 59
4 3,
542
Cla
ss 3
10
5 89
9029
M
ain
Circ
ulat
ing
Wat
er S
yste
m P
ipin
g 99
47
5 61
4 C
lass
3
4,38
3 89
9032
N
itrog
en G
as S
yste
m P
ipin
g 9,
677
19,1
00
33,2
00
Cla
ss 2
25
89
9034
N
ucle
ar S
ervi
ce R
aw W
ater
Sys
tem
Pip
ing
157
28
413
NI
N/A
89
9035
N
ucle
ar S
ervi
ce W
ater
Pip
ing
125
-59
174
Cla
ss 3
37
89
9036
Pl
ant C
oolin
g W
ater
Sys
tem
Pip
ing
153
-9
310
NI
N/A
89
9040
R
eact
or C
oola
nt D
rain
Sys
tem
-Em
bedd
ed
TBD
TB
D
TBD
C
lass
1
2 89
9042
R
adw
aste
Sys
tem
Pip
ing-
Embe
dded
66
,200
,000
49
,700
,000
21
1,00
0,00
0 C
lass
1
53
8990
43
Serv
ice
Air
Syst
em P
ipin
g 96
4 -5
1,
740
Cla
ss 3
28
7 89
9044
Sp
ent F
uel C
oolin
g Sy
stem
Pip
ing-
Embe
dded
4,
730,
000
5,19
0,00
0 16
,500
,000
C
lass
1
11
8990
45
Site
Res
ervo
ir Sy
stem
23
2 6
441
NI
N/A
89
9047
Se
rvic
e W
ater
Sys
tem
Pip
ing
1,99
2 18
7 2,
700
Cla
ss 3
10
00
8990
50
Was
te G
as S
yste
m P
ipin
g 2,
977
528
3,66
5 C
lass
3
27
8990
51
Car
bon
Dio
xide
Sys
tem
8,
930
8,58
5 23
,654
C
lass
2
4 89
9052
A
cid
Was
te S
yste
m-E
mbe
dded
13
,000
2,
450,
000
74,6
00,0
00
Cla
ss 1
26
89
9107
C
lean
Dra
in S
yste
m-T
B D
rns,
Oily
Wat
er S
epar
ator
Pi
pe
411
2471
30
14
Cla
ss 3
76
3
8991
09
Cle
an D
rain
Sys
tem
-RH
UT
to C
DS
Dis
char
ge
431
2,59
0 3,
158
Cla
ss 1
* 28
N
I – N
on-I
mpa
cted
*
Pipe
sedi
men
t act
ivity
186
pC
i/g C
s-13
7, 2
3.5
pCi/g
Co-
60

Rancho Seco License Termination Plan Revision 1 Chapter 5, Final Status Survey Plan May 2008
Page 5-19
5.2.2.4 Changes in Classification
Initial classification of site areas is based on historical information, scoping surveys and site characterization data. Data from operational surveys performed in support of decommissioning, routine surveillance and any other applicable survey data may be used to change the initial classification of an area up to the time of commencement of the FSS as long as the classification reflects the levels of residual radioactivity that existed prior to remediation. Areas within initial survey units may be upgraded in classification due to future requirements for laydown and storage areas during demolition activities or incorrect initial classification. If during the conduct of a FSS sufficient evidence is accumulated to warrant an investigation and reclassification of the survey unit in accordance with Section 5.3.6, the survey may be terminated without completing the survey unit package.
5.2.3 Establishing Survey Units
The survey units listed in Tables 5-4A, 5-4B, 5-4C, 5-4D and 5-4E are areas that have similar characteristics and contamination levels. Survey units are assigned only one classification. The site and facility are surveyed, evaluated, and released on a survey unit basis.
5.2.3.1 Survey Unit Size
Survey unit sizes will be selected based on area classification, survey execution logistics, and applicable regulatory guidance documents. NUREG-1757, Volume 2, Appendix A, provides suggested sizes for survey units based on the guidance contained in MARSSIM.
Typical survey unit sizes for structural surfaces and open land area soil are listed below in Table 5-5; these are consistent with NUREG-1757, Volume 2 guidance. Use of 319 m2 for structures meets the 25 mrem/y criterion at the surface DCGL as described in DTBD 06-002, “Use of a Survey Unit Size of 319 m2 for Class One Structure Surveys at Rancho Seco Nuclear Generating Station,” [Reference 5-8]. Class 1 and 2 areas provided in Tables 5-4A, 5-4B, 5-4C, 5-4D and 5-4E may be further subdivided into smaller areas to meet the guidelines present in Table 5-5. If larger survey unit areas are used, a technical evaluation will be presented in the FSS Package for the specific survey unit justifying the survey unit size.
Table 5-5 Suggested Survey Unit Areas
Class Structural Surfaces Open Land Area Soil 1 up to 319 m2 up to 2,000 m2 2 319 to 1000 m2 2,000 to 10,000 m2 3 no limit no limit
5.2.3.2 Reference Coordinate System for Open Land Areas (Reference Grid)
A reference coordinate system is used for impacted areas to facilitate the identification of survey units within the survey area. The reference coordinate system is basically an X-Y plot of the site area referenced to the state of California Mercator projections as shown in Figure 5-2. Once the reference point is established, grids may be overlaid parallel to lines of latitude and longitude.

Rancho Seco License Termination Plan Revision 1 Chapter 5, Final Status Survey Plan May 2008
Page 5-20
5.2.4 Access Control Measures
5.2.4.1 Turnover
Due to the large scope of decommissioning activities, it is anticipated that some surveys will be performed in parallel with dismantlement activities. This will require a systematic approach to turnover of areas be established. Prior to acceptance of a survey unit for FSS, the following conditions must be satisfied in accordance with applicable procedures. These include:
a) Decommissioning activities having the potential to contaminate a survey unit shall be complete or measures taken to eliminate such potential.
b) Tools and equipment not required for the survey must be removed, and housekeeping and cleanup shall be complete.
c) Decontamination activities in the area shall be complete.
d) Access control or other measures to prevent recontamination must be implemented.
e) Turnover or remediation surveys may be performed and documented to the same standards as final status surveys so that data can be used for the FSS.
5.2.4.2 Walkdown
The principal objective of the walkdown is to assess the physical scope of the survey unit. The walkdown ensures that the area has been left in the necessary configuration for FSS or that any further work has been identified. The walkdown provides detailed physical information for survey design. Details such as structural interferences or sources needing special survey techniques can be determined. Specific requirements will be identified for accessing the survey area and obtaining support functions necessary to conduct final status surveys, such as excavation shoring, interference removal, dewatering, etc. Industrial safety and environmental concerns will also be identified during this walkdown.
5.2.4.3 Transfer of Control
Once a walkdown has been performed and the turnover requirements have been met, control of access to the area is transferred from the RP/Chemistry Department to the FSS group. Access control and isolation methods are described in the subsection below.
5.2.4.4 Isolation and Control Measures
Since all decommissioning activities will not be completed prior to the start of the FSS, measures will be implemented to protect survey areas from contamination during and subsequent to the FSS. Decommissioning activities creating a potential for the spread of contamination will be completed within each survey unit prior to the FSS. Additionally, decommissioning activities that create a potential for the spread of contamination to adjacent areas will be evaluated and controlled. Upon commencement of the FSS for survey units where there is a potential for re-contamination, implementation of one or more of the following control measures will be required:

Rancho Seco License Termination Plan Revision 1 Chapter 5, Final Status Survey Plan May 2008
Page 5-21
• Personnel training,
• Installation of barriers to control access to surveyed areas,
• Installation of barriers to prevent the migration of contamination from adjacent or overhead areas from water runoff, etc.,
• Installation of postings requiring contamination monitoring prior to surveyed area access,
• Locking entrances to surveyed areas of the facility,
• Installation of tamper-evident devices at entrance points, or
• Periodic surveillance/inspection to monitor and verify adequacy of isolation and control measures.
Periodic surveillances/inspections will not be required for open land areas that are not normally occupied and are unlikely to be impacted by decommissioning activities. If the periodic surveillance/inspection indicates that the adequacy of isolation and control measures has been compromised with the potential for recontamination of the area, post-FSS radiation survey locations will be judgmentally selected for survey, based on technical or site-specific knowledge and current conditions present in or near the survey area. The selected survey locations will be surveyed using the same instruments and techniques used for the FSS and the results will be compared with those obtained during the FSS to determine whether the area had been re-contaminated. These surveys are primarily designed to detect the potential migration of contaminants from decommissioning activities taking place in adjacent areas.
5.3 Survey Design and Data Quality Objectives
This section describes the methods and data required to determine the number and location of measurements or samples in each survey unit and the coverage fraction for scan surveys. The design activities described in this section will be documented in a survey package for each survey unit. Survey design includes the following:
• Type I and II Errors,
• Scan Survey Coverage,
• Sample Size Determination,
• Instrumentation and Required MDCs,
• Reference Grid and Sample Location, and
• DCGL and DCGLEMC.
5.3.1 Data Quality Objectives (DQOs)
The appropriate design for a given survey area is developed using the DQO process as outlined in MARSSIM, Appendix D. These seven steps are:
1) State the problem,
2) Identify the decision,
3) Identify inputs to the decision,

Rancho Seco License Termination Plan Revision 1 Chapter 5, Final Status Survey Plan May 2008
Page 5-22
4) Define the study boundaries,
5) Develop a decision rule,
6) Specify limits on decision errors, and
7) Optimize the design for obtaining data.
The DQO process will be used for designing and conducting all final status surveys at Rancho Seco. Each survey package will contain the appropriate information, statistical parameters and contingencies to support the DQO process.
5.3.2 Scan Survey Coverage
The area covered by scan measurement is based on the survey unit classification as described in NUREG-1757 and as shown in Table 5-6 below. A 100% accessible area scan of Class 1 survey units will be required. The emphasis will be placed on scanning the higher risk areas of Class 2 survey units such as soils, floors and lower walls. Scanning percentage of Class 3 survey units will be performed on likely areas of contamination based on the judgment of the FSS engineer.
Table 5-6 Scan Measurements
Class 1 Class 2* Class 3 Scan Coverage 100% 10 – 100% Judgmental, 1-10%
* For Class 2 Survey Units, the amount of scan coverage will be proportional to the potential for finding areas of elevated activity or areas close to the release criterion in accordance with MARSSIM Section 5.5.3. Accordingly, Rancho Seco will use the results of individual measurements collected during characterization to correlate this activity potential to scan coverage levels.
5.3.3 Sample Size Determination
NUREG-1757, Volume 2, Appendix A describes the process for determining the number of survey measurements necessary to ensure a data set sufficient for statistical analysis. The sample density for Class 1 structures will be maintained at the level of 1/7 m2 for the larger survey unit size of 319 m2 which results in a total of 46 samples for a relative shift of 3. Sample size is based on the relative shift, the Type I and II errors, sigma, and the specific statistical test used to evaluate the data.
5.3.3.1 Determining Which Test Will Be Used
Appropriate tests will be used for the statistical evaluation of survey data. Tests such as the Sign test and Wilcoxon Rank Sum (WRS) test will be implemented using unity rules, surrogate methodologies, or combinations of unity rules and surrogate methodologies, as described in MARSSIM and NUREG-1505 chapters 11 and 12.
If the contaminant is not in the background or constitutes a small fraction of the DCGL, the Sign test will be used. If background is a significant fraction of the DCGL, the Wilcoxon Rank Sum (WRS) test will be used.

Rancho Seco License Termination Plan Revision 1 Chapter 5, Final Status Survey Plan May 2008
Page 5-23
5.3.3.2 Establishing Decision Errors
The probability of making decision errors is controlled by hypothesis testing. The survey results will be used to select between one condition of the environment (the null hypothesis) and an alternate condition (the alternative hypothesis). These hypotheses, chosen for MARSSIM Scenario A, are defined as follows:
Null Hypothesis (H0): The survey unit does not meet the release criteria. Alternate Hypothesis (Ha): The survey unit does meet the release criteria.
A Type I decision error would result in the release of a survey unit containing residual radioactivity above the release criteria. It occurs when the null hypothesis is rejected when it is true. The probability of making this error is designated as “α”. A Type II decision error would result in the failure to release a survey unit when the residual radioactivity is below the release criteria. This occurs when the Null Hypothesis is accepted when it is not true. The probability of making this error is designated as “β”.
Appendix E of NUREG-1757, Volume 2 recommends using a Type I error probability (α) of 0.05 and states that any value for the Type II error probability (β) is acceptable. Following the NUREG-1757, Volume 2 guidance, α will be set at 0.05. A β of 0.05 will initially be selected based on site specific considerations. The β may be modified, as necessary, after weighing the resulting change in the number of required survey measurements against the risk of unnecessarily investigating and/or remediating survey units that are truly below the release criteria.
5.3.3.3 Relative Shift
The relative shift (Δ / σ) is calculated. Delta (Δ) is equal to the DCGLW minus the Lower Boundary of the Gray Region (LBGR). Calculation of sigma’s is discussed in Section 5.3.3.3.2 and initial values are provided in Table 5-4. The sigma’s used for the relative shift calculation may be recalculated based on the most current data obtained from post-remediation or post-demolition surveys or from background reference areas, as appropriate. The LBGR is initially set at 0.5 times the DCGLW, but may be adjusted to obtain an optimal value, normally between 1 and 3 for the relative shift.
5.3.3.3.1 Lower Boundary of the Gray Region
The Lower Boundary of the Gray Region (LBGR) is the point at which the Type II (β) error applies. The default value of the LBGR is set initially at 0.5 times the DCGL. If the relative shift is greater than 3, then the number of data points, N, listed for the relative shift values of 3 from Table 5-5 or Table 5-3 in MARSSIM will normally be used as the minimum sample size. If the minimum sample size results in a sample density less than the required minimum density (see Section 5.3.3), the sample size will be increased accordingly.
5.3.3.3.2 Sigma
Sigma values (estimate of the standard deviation of the measured values in a survey unit, and/or reference area) were initially calculated from characterization data as listed in DTBD-06-001, “RSNGS Initial Classification of Survey Areas and Survey Design Sigma Values,” [Reference 5-9]. These sigma values can be used in FSS design or more current post-remediation sigma values can be used. The use of the sigma values from the characterization

Rancho Seco License Termination Plan Revision 1 Chapter 5, Final Status Survey Plan May 2008
Page 5-24
data will be conservative for the sample size determination since the post-remediation sigma’s are expected to be smaller. The sigma values for survey areas listed in Tables 5-4A, 5-4B, 5-4C, 5-4D and 5-4E which contain survey units with two different classifications (typically upper walls and ceiling being a Class lower than lower walls and floor of the same room), will be evaluated to ensure that the sigma conservatively represents the contaminant distribution of each associated survey unit; otherwise a specific sigma value will be developed.
5.3.3.3.3 Wilcoxon Rank Sum Test Sample Size
The number of data points, N, to be obtained from each reference area or survey unit are determined using Table 5-3 in MARSSIM. The table includes the recommended 20% adjustment to ensure an adequate sample size.
5.3.3.3.4 Sign Test Sample Size
The number of data points is determined from Table 5-5 in MARSSIM for application of the Sign Test. This table includes the recommended 20% adjustment to ensure an adequate sample size.
5.3.3.3.5 Elevated Measurement Comparison Sample Size Adjustment
If the scan MDC is greater than the DCGLW, the sample size will be calculated using Equation 5-3 provided below. If NEMC exceeds the statistically determined sample size (N), NEMC will replace N.
EMCEMC AAN =
Equation 5-3
where:
NEMC = the elevated measurement comparison sample size,
A = the survey unit area, and
AEMC = the area corresponding to the area factor calculated using the MDCscan concentration.
5.3.4 Background Reference Area
Background reference area measurements are required when the WRS test is used, and background subtraction may be used with the Sign test, under certain conditions such as those described in Chapter 12 of NUREG-1505. Reference area measurements, if needed, will be collected using the methods and procedures required for Class 3 final survey units. For soil, reference areas will have a soil type as similar to the soil type in the survey unit as possible. When there is a reasonable choice of possible soil reference areas with similar soil types, consideration will be given to selecting reference areas that are most similar in terms of other physical, chemical, geological, and biological characteristics. For structure survey units that contain a variety of materials with markedly different backgrounds, a reference area will be selected that has similar materials. If one material is predominant or if there is not too great a variation in background among materials, a background from a reference area containing only a single material is appropriate when it is demonstrated that the selected reference area will not result in underestimating the residual radioactivity in the survey unit.

Rancho Seco License Termination Plan Revision 1 Chapter 5, Final Status Survey Plan May 2008
Page 5-25
It is understood that background reference areas should have physical characteristics (including soil type and rock formation) similar to the site and shall not be contaminated by site activities. Non-impacted areas of the 2,480 acre site may be chosen to serve as background reference areas.
Should significant variations in background reference areas be encountered, appropriate evaluations will be performed to define the background concentration. As noted in NUREG-1757, Appendix A, Section A.3.4, the Kruskal-Wallis test can be conducted in such circumstances to determine that there are no significant differences in the mean background concentrations among potential reference areas. Rancho Seco will consider this and other statistical guidance in the evaluation of apparent significant variations in background reference areas.
If material background subtraction is performed, the sigma value used will take into account the variability of material background.
5.3.5 Reference Grid and Sample Location
Sample location is a function of the number of measurements required, the survey unit classification, and the contaminant variability.
5.3.5.1 Reference Grid
The reference grid is primarily used for reference purposes and is illustrated on sample maps. Physical marking of the reference grid lines in the survey unit will only be performed when necessary. For the sample grid in Class 1 and 2 survey units, a randomly selected sample start point will be identified and sample locations will be laid out in a square grid pattern at distance, L, from the start point in both the horizontal and vertical directions. The sample and reference grids are illustrated on sample maps and may be physically marked in the field. For Class 3 survey units, all sample locations are randomly selected, based on the reference grid. An example is shown in Figure 5-2. Global Positioning System (GPS) instruments may be used in open land areas to determine reference or sample grid locations within the survey area. Locations within a survey area may also be tied to a site USGS survey benchmark (The site drawings, including Figure 5-2, are based on the California Coordinate System 1983). Digital cameras may be employed to provide a record of survey location within the survey unit. When used, these photographic records will be linked to landmark and directional information to ensure reproducibility.
5.3.5.2 Measurement Locations
Measurement locations within the survey unit are clearly identified and documented for purposes of reproducibility. Actual measurement locations are identified by tags, labels, flags, stakes, paint marks, geopositioning units or photographic record. An identification code matches a survey location to a particular survey unit.
Sample points for Class 1 and Class 2 survey units are positioned in a systematic pattern or grid throughout the survey unit by first randomly selecting a start point coordinate. A random number generator is used to determine the start point of the square grid pattern. The grid spacing, L, is a function of the area of the survey unit as shown in Equation 5-4 below for a square grid:

Rancho Seco License Termination Plan Revision 1 Chapter 5, Final Status Survey Plan May 2008
Page 5-26
nAL =
Equation 5-4
where:
A = the area of the survey unit, and
n = the number of sample points in the survey unit.
Sample points are located, L distance from the random start point in both the X and Y directions.
Random measurement patterns are used for Class 3 survey units. Sample location coordinates are randomly picked using a random number generator.
Measurement locations selected using either a random selection process or a randomly-started systematic pattern that do not fall within the survey unit or that cannot be surveyed due to site conditions are replaced with other measurement locations as determined by the FSS Engineer.
5.3.6 Investigation Levels and Elevated Areas Test
During survey unit measurements, levels of radioactivity may be identified that warrant investigation. Depending on the results of the investigation, the survey unit may require no action, remediation, and/or reclassification and resurvey. Investigation process and investigation levels are described below.
5.3.6.1 Investigation Process
During the survey process, locations with potential residual activity exceeding investigation levels are marked for further investigation. The elevated survey measurement is verified by resurvey. For Class 1 areas, size and average activity level in the elevated area is acceptable if it complies with the area factors and other criteria that may apply to evaluation of the DCGL for elevated measurements DCGLEMC. As discussed in Section 5.3.6.3 below, the DCGLEMC is applicable only for Class 1 areas. If any location in a Class 2 area exceeds the DCGL, scanning coverage in the vicinity is increased in order to determine the extent and level of the elevated reading(s) and the area evaluated for reclassification. If the elevated reading occurs in a Class 3 area, the scanning coverage is increased and the area evaluated for reclassification and resurvey under the criteria of the new classification. All survey unit investigations will be conducted in accordance with the applicable FSS Data Quality Objectives (DQOs).
Investigations should address: (1) the assumptions made in the survey unit classification; (2) the most likely or known cause of the contamination; and (3) the effects of summing multiple areas with elevated activity within the survey unit. Depending on the results of the investigation, a portion of the survey unit may be reclassified or combined with an adjacent area with similar characteristics if there is sufficient justification. Either action would result in resurvey of the (new) area(s). The results of the investigation process are documented in the Survey Package. See also Section 5.6 for additional discussion regarding potential reclassification of the survey unit.

Rancho Seco License Termination Plan Revision 1 Chapter 5, Final Status Survey Plan May 2008
Page 5-27
5.3.6.2 Investigation Levels
Technicians will respond to all instrument indications of elevated activity while surveying. Upon receiving an indication, the technician will stop and resurvey the last square meter of area to verify the indication. Technicians are cautioned, in training, about the importance of the indication verification survey and are given specific direction in the procedure as to survey extent and scan speed. If the indication is verified, the technician will mark the area with a flag or other appropriate means. Each area marked will be addressed in an investigation survey instruction prepared for the survey unit. The instruction will specify the required actions, such as a re-scan of the area, direct measurements, field gamma spectroscopy measurement (as appropriate), and collection of a soil sample (for land surveys). Each investigation will be evaluated and reported in the survey unit Release Record. Investigation levels are shown in Table 5-7.
Table 5-7 Investigation Levels
Classification Scan Investigation Levels Direct Investigation Levels Class 1 >DCGLEMC >DCGLEMC
Class 2 >DCGLW or >MDCscan if MDCscan is greater than DCGLW >DCGLW
Class 3 >DCGLW or >MDCscan if MDCscan is greater than DCGLW >0.5 DCGLW
The size and average activity level in the elevated area is determined to demonstrate compliance with the area factors. If any location in a Class 2 area exceeds the DCGL, scanning coverage in the vicinity is increased in order to determine the extent and level of the elevated reading(s). If the elevated reading occurs in a Class 3 area, the scanning coverage is increased and the area should be considered for reclassification.
5.3.6.3 Elevated Measurement Comparison
5.3.6.3.1 Open Land Areas and Structural Surfaces
The elevated measurement comparison is applied to Class 1 survey units when one or more verified scan or static measurement exceeds the investigation level. As stated in MARSSIM, the EMC is intended to flag potential failures in the remediation process and should not be considered the primary means to identify whether or not a survey unit meets the release criterion. The EMC provides assurance that unusually large measurements receive the proper attention and that any area having the potential for significant dose contribution is identified. Locations identified by scan methodology or soil sample analyses measurements with levels of residual radioactivity which exceed the DCGLEMC are subject to additional surveys to determine compliance with the elevated measurement criteria. The size of the area containing the elevated residual radioactivity and the average level of residual activity within the area are determined. The average level of activity is compared to the DCGLW based on the actual area of elevated activity. An a priori DCGLEMC for the area between direct measurements (the likely size of an elevated area) is established during the survey design and is calculated as follows:

Rancho Seco License Termination Plan Revision 1 Chapter 5, Final Status Survey Plan May 2008
Page 5-28
WEMC DCGLFactorAreaDCGL ×=
Equation 5-5
The area factor is the multiple of the DCGLW that is permitted in the area of elevated residual radioactivity without remediation. The area factor is related to the size of the area over which the elevated activity is distributed. The actual area is generally bordered by levels of residual radioactivity below the DCGLW and its size is determined during the investigation process. Area factor calculations are described in LTP Section 6.7 and summarized in Tables 5-8 and 5-9. (As shown in Tables 5-8 and 5-9, Co-60 and Cs-137 are the limiting Area Factors considering that direct exposure is the primary dose concern for structures and soil. Therefore, these area factors will typically be used to evaluate elevated measurements in soil or on surfaces). Alternatively, Figures 6-7 through 6-9 in Chapter 6 of this LTP provide a graphical method for selecting applicable area factors. The actual area of elevated activity is determined by investigation surveys and the area factor is adjusted for the actual area of elevated activity. The product of the adjusted area factor and the DCGLW determines the DCGLEMC. Additional measurements are made to determine the average activity of the elevated area, if necessary. If the DCGLEMC is exceeded, the area is remediated and resurveyed. The results of the elevated area investigations in a given survey unit that are below the DCGLEMC limit are evaluated using Equation 5-6 below. If more than one elevated area is identified in a given survey unit, the unity rule with Equation 5-6 is used to determine compliance. If the formula value is less than unity, no further elevated area testing is required and the EMC test is satisfied.
Table 5-8
Calculated Surface Soil Area Factors
Radionuclide Area Factor (unitless) Contaminated Area (m2) C-14 Co-60 Ni-63 Sr-90 Cs-134 Cs-137
10,000 1.00 1.00 1.00 1.00 1.00 1.00 3,000 1.66 1.02 1.00 1.02 1.02 1.02 1,000 2.52 1.04 1.00 1.04 1.04 1.04 300 4.80 1.12 3.27 1.20 1.12 1.11 100 8.04 1.24 9.30 1.36 1.23 1.23 30 13.6 1.62 26.9 1.77 1.58 1.58 10 21.8 2.39 60.6 2.61 2.31 2.31 3 41.5 5.05 114 5.51 4.89 4.87 1 76.0 11.8 164 12.8 11.3 11.3

Rancho Seco License Termination Plan Revision 1 Chapter 5, Final Status Survey Plan May 2008
Page 5-29
Table 5-9
Calculated Structural Surface Area Factor Values
Radionuclide Area Factor (unitless) Contaminated Area (m2) Co-60 Cs-134 Cs-137 Pu-238 Pu-239 Pu-240
137 1 1 1 1 1 1 68 1.22 1.24 1.26 ― ― ― 36 1.51 1.55 1.59 ― ― ― 25 1.74 1.79 1.85 ― ― ― 16 2.11 2.18 2.26 ― ― ―
9 2.83 2.91 3.03 ― ― ― 4 4.65 4.80 5.02 ― ― ― 1 13.8 14.3 14.9 ― ― ― 0.5 25.9 26.8 28.1 273 272 272
Radionuclide Area Factor (unitless) Contaminated Area (m2) Pu-241 Am-241
137 1 1 68 ― ― 36 ― ― 25 ― ― 16 ― ―
9 ― ― 4 ― ― 1 ― ― 0.5 274 257
Equation 5-5 applies to a single radionuclide contaminant. When multiple radionuclides are present, the calculation in Equation 5-5 is made with a unitized DCGL.
( )( )( ) 1<−
+W
AVE
W DCGLFactorAreaConc
DCGLδδ
Equation 5-6
where:
δ = Estimate of average concentration of residual radioactivity and
ConcAVE = average concentration in elevated area.
If more than one elevated area exists in the survey unit, a separate term will be included for each in Equation 5-6 (refer to Section 5.6.2.2).
5.3.6.3.2 Embedded Piping
The dose model for embedded pipe used a default pipe length of 3 m. Area factors will vary with the internal dimensions of the pipe being surveyed. If it becomes necessary to apply the elevated measurement comparison process to embedded piping, the first step will be to

Rancho Seco License Termination Plan Revision 1 Chapter 5, Final Status Survey Plan May 2008
Page 5-30
determine the length of pipe in the room or area being surveyed. Then the interior surface area will be calculated for given pipe I.D. The specific physical dimensions of the pipe and intervening shielding will be input into MicroShield™ using the “Cylinder Surface, External Dose Point Geometry” to calculate the gamma dose rate at a point one meter from the floor or wall surface. Subsequent calculations will be performed while reducing the contaminated area size for each calculation until the dose rates bound the hot spot area of interest. The dose rate for the initial pipe area will be divided by the dose rate for the reduced area of pipe to calculate area factors for the given hot spot size. Equation 5-5 may then be applied to provide the DCGLEMC.
5.3.6.4 Remediation and Reclassification
As shown in Table 5-10, Class 1 or Class 2 areas of elevated residual activity above the DCGLEMC are remediated to reduce the residual radioactivity to acceptable levels. Based on survey data, it may be necessary to remediate an entire survey unit or only a portion of it. If an individual survey measurement (scan or direct) in a Class 2 survey unit exceeds the DCGLW, the survey unit or a portion of it may be reclassified to a Class 1 survey unit and the survey redesigned and re-performed accordingly. If an individual survey measurement in a Class 3 survey unit exceeds 0.5 DCGLW, the survey unit, or portion of a survey unit, will be evaluated, and if necessary, reclassified to a Class 2 survey unit and the survey redesigned and re-performed accordingly.
Table 5-10 Investigation Actions for Individual Survey Unit Measurements
Action if Investigation Results Exceed: Area Classification DCGLEMC DCGLW 0.5 DCGLW
Class 1 Remediate and
resurvey as necessary
Acceptable* N/A
Class 2
Remediate, reclassify portions as necessary
and investigate**
Reclassify portions as necessary and investigate**
N/A
Class 3
Remediate, reclassify portions as necessary
and investigate**
Reclassify portions as necessary, increase scan coverage and
investigate**
Reclassify portions as necessary and
resurvey, increase scan coverage
*For individual measurements above DCGL, the Sign Test will be conducted on the survey unit and an EMC evaluation performed.
**Requires an investigation of the initial classification process and a survey unit evaluation of sufficient intensity to satisfy the requirements of new classification status.
5.3.6.5 Resurvey
Following an investigation, if a survey unit is reclassified to a more restrictive classification or if remediation activities were performed, a resurvey is performed in accordance with approved procedures. If a Class 2 area had contamination greater than the DCGLW, it should be reclassified to a Class 1 area. If the average value of Class 2 direct survey measurements was less than the DCGLW, the scan MDC was sensitive enough to detect the DCGLEMC and there

Rancho Seco License Termination Plan Revision 1 Chapter 5, Final Status Survey Plan May 2008
Page 5-31
were no areas greater than the DCGLEMC, the survey redesign may be limited to obtaining a 100% scan without having to re-perform the static measurements or soil sample analyses. This condition assumes that the sample density meets the requirements for a Class 1 area.
5.4 Survey Methods and Instrumentation
5.4.1 Survey Measurement Methods
Survey measurements and sample collection are performed by personnel trained and qualified in accordance with the applicable procedure. The techniques for performing survey measurements or collecting samples are specified in approved procedures. FSS measurements include surface scans, direct surface measurements, and gamma spectroscopy of volumetric materials. Methods not specifically described may also be used for final status surveys. If so, Rancho Seco will give the NRC 30 days notice to provide an opportunity to review the associated basis document.
On-site lab facilities are used for gamma spectroscopy, liquid scintillation and gas proportional counting in accordance with applicable procedures. Off-site facilities are used, as necessary. No matter which facilities are used, analytical methods will be administratively established to detect levels of radioactivity at 10% to 50% of the DCGL value.
5.4.1.1 Structures
Structures will receive scan surveys, direct measurements and, when necessary, volumetric sampling.
5.4.1.1.1 Scan Surveys
Scanning is performed in order to locate small, elevated areas of residual activity above the investigation level. Structures are scanned for beta-gamma radiation with appropriate instruments such as those listed in Table 5-11. The measurements will typically be performed at a distance of 1 cm or less from the surface and at a scan speed of 5 cm/sec for hand-held instruments. Adjustments to scan speed and distance may be made in accordance with approved procedures. In situ gamma spectroscopy may be effectively substituted for scanning surveys in accordance with DTBD-06-003, “Use of In Situ Gamma Spectroscopy for Final Status Surveys,” [Reference 5-10].
5.4.1.1.2 Direct Measurements
Direct measurements are performed to detect surface activity levels. Direct measurements are conducted by placing the detector on or very near the surface to be counted and acquiring data over a pre-determined count time. A count time of one minute is typically used for surface measurements and generally provides detection levels well below the DCGL. (The count time may be varied provided the required detection level is achieved).
5.4.1.1.3 Concrete With Activated Radionuclides
Residual radioactivity within activated building materials will be measured volumetrically. Following remediation of activated concrete and rebar down to the activated concrete DCGL, the remaining surface will be volumetrically sampled by coring or other means. DCGLs for activated concrete have been determined and are provided in LTP Chapter 6, Table 6-10. Per

Rancho Seco License Termination Plan Revision 1 Chapter 5, Final Status Survey Plan May 2008
Page 5-32
Table 5-12, the gamma spectroscopy instrumentation achieves an MDC much lower than the DCGL.
5.4.1.1.4 Volumetric Concrete Measurements
Volumetric sampling of contaminated concrete, as opposed to direct measurements may be necessary if the efficiency or uncertainty of the gross beta measurements are too high. Volumetric concrete samples will be analyzed by gamma spectroscopy. The results will either be evaluated by 1) calculating the derived total gross beta dpm/100 cm2 in the sample and comparing the gross beta results directly to the gross beta DCGL or 2) by using the radionuclide specific results to derive the surface activity equivalent and determine compliance using the unity rule. Use of the unity rule will require the use of a surrogate calculation to account for the radionuclides in the mixture not identified by gamma spectroscopy. This will be accomplished using the nuclide mixtures listed in Tables 2-16 or 2-19 in Chapter 2 of this LTP, as appropriate.
Volumetric samples analyzed by gamma spectroscopy will detect the presence of radioactivity below the surface. Such sampling is typically performed following removal of paint and other surface coatings during remediation. After analysis, the data may be converted to equivalent surface activity for crack or rough surface analysis.
5.4.1.2 Soils
Soil will receive scan surveys at the coverage level described in Table 5-6 and volumetric samples will be taken at designated locations. Surface soil samples will normally be taken at a depth of 0 to15 cm. Areas of subsurface soil contamination may require sampling at a depth exceeding 15 cm. The possibility of sub-surface contamination will be considered during the survey design process and the survey design package will contain requirements for sampling soil below 15 cm. Samples will be collected and prepared in accordance with approved procedures.
5.4.1.2.1 Scans
Open land areas are scanned for gamma emitting nuclides. The gamma emitters are used as surrogates for the HTD radionuclides. Sodium iodide detectors are typically used for scanning. For detectors such as the SPA-3, the detector is held within 2.5 to 5 centimeters of the ground surface and is moved at a speed of 0.5 m/sec, traversing each square meter 5 times. The area covered by scan measurements is based on the survey unit classification as described in Section 5.3.2.
5.4.1.2.2 Volumetric Samples
Soil materials are analyzed by gamma spectroscopy. Soil samples of approximately 1,500 grams are normally collected from the surface layer (top 15 cm). If contamination below 15 cm is suspected, split spoon sampling or similar methods, will be used for the final survey. Sample preparation includes removing extraneous material, homogenizing, and drying the soil for gamma isotopic analysis. Separate containers are used for each sample and each container is moved through the analysis process following site procedures. Samples are split when required by the applicable quality control procedures.

Rancho Seco License Termination Plan Revision 1 Chapter 5, Final Status Survey Plan May 2008
Page 5-33
If a survey area has already been excavated and remediated to the soil DCGL, this area will be treated as a surface soil, and the FSS will be performed on the excavated area. Soil samples will be collected to depths at which there is high confidence that deeper samples will not
result in higher concentrations. Alternatively, a sodium-iodide detector or intrinsic germanium detector of sufficient sensitivity to detect DCGL concentrations may be utilized to identify the presence or absence of subsurface contamination, and the extent of such contamination. If the detector identifies the presence of contamination at a significant fraction of the DCGL, confirmatory investigation and analyses of soil samples of the suspect areas will be performed. All subsurface sampling will be performed in accordance with the guidance in Section G.2.1 of NUREG-1757, Volume 2. The sample size for subsurface samples will be determined using the same methods described for surface soil. Per NUREG-1757, Volume 2, scanning is not applicable to subsurface areas; however, Rancho Seco FSSs will employ scanning techniques commensurate with the survey unit classification. Scanning on subsurface soils, where accessible as an excavated surface, will demonstrate compliance with site release criteria.
5.4.2 Specific Survey Area Considerations
5.4.2.1 Pavement-Covered Areas
Survey of paved areas will be required along the roadways providing ingress and egress to the site. Evaluation has determined that paved roadways are Class 3 areas. The survey design of paved areas will be based on soil survey unit sizes since they are outdoor areas where the exposure scenario is most similar to direct radiation from surface soil. The applicable DCGL will be the soil DCGL. Scan and static gamma and beta-gamma surveys are made as determined by the survey unit design. If the potential exists for sub-surface contamination under pavement, either the pavement/asphalt will be removed prior to the FSS or samples/measurements obtained through the pavement. Paved areas may be separate survey units or they may be incorporated into surveys of other adjacent open land areas of like classification. Surveys of paved areas may include road right-of-ways to check for radioactivity relocated from water runoff. Right-of-ways may also be separate survey units.
5.4.2.2 Excavated Soil
Excavated soil may be reused onsite. Prior to reuse, excavated soil will be characterized to determine its suitability. Any surface scanning or volumetric analyses made will be directly compared with DCGL values. Controls will be instituted to prevent mixing of soils from more restrictive survey area classifications (e.g., Class 2 material could be used in either Class 1 or 2 areas and Class 1 material could only be used in Class 1 areas.) Soils satisfying the criteria for unrestricted release may be stockpiled for use as onsite backfill material.
5.4.2.3 Embedded Piping and Buried Piping
Residual radioactivity on internal surfaces, such as floor drains, embedded piping, and buried piping may be inaccessible or difficult to measure directly using field survey detectors and established techniques. Where no remediation has occurred, inaccessible or difficult to measure internal surfaces are assumed to have the same level of residual radioactivity as that found on accessible internal surfaces. No special measurement methods are applied.
Where remediation has occurred, representative samples of the inaccessible internal surfaces are obtained, an assessment of pre-remediation survey data is performed, or other appropriate

Rancho Seco License Termination Plan Revision 1 Chapter 5, Final Status Survey Plan May 2008
Page 5-34
measures are taken (e.g., calibrated detectors extended into piping runs in a controlled manner) such that a reasonable approximation of the residual radioactivity on the inaccessible internal surfaces can be made. Accessible internal surfaces are surveyed the same as other structural surfaces. Scale and sediment samples may be obtained, if appropriate.
5.4.2.4 Cracks, Crevices, Wall-Floor Interfaces and Small Holes
Surface contamination on irregular structure surfaces (e.g., cracks, crevices, and holes) is difficult to survey directly. Where no remediation has occurred and residual activity has not been detected above background, these surface blemishes may be assumed to have the same level of residual activity as that found on adjacent surfaces. The accessible surfaces are surveyed in the same manner as other structural surfaces and no special corrections or adjustments have to be made.
In situations where remediation has taken place or where residual activity has been detected above background, a representative sample of the contamination within the crack or crevice may be obtained or an adjustment for instrument efficiency may be made if justifiable. If an instrument efficiency adjustment cannot be justified based on the depth of contamination or other geometry factors, volumetric samples will be collected. The total dpm/100 cm2 contained in the volumetric sample that is attributable to the beta emitting radionuclides used to determine the DCGL will be compared directly to the concrete gross activity DCGL. As an alternative, radionuclide specific analysis, coupled with application of the unity rule may be used.
Volumetric samples analyzed by gamma spectroscopy will detect the presence of radioactivity below the surface. Such sampling is typically performed following removal of paint and other surface coatings during remediation. After analysis, the data may be converted to equivalent surface activity.
The accessible surfaces are surveyed in the same manner as other structure surfaces except that they are included in areas receiving judgmental scans when scanning is performed over less than 100% of the area.
5.4.2.5 Paint Covered Surfaces
Final status surveys will consider the effect of painted surfaces on instrument efficiency in accordance with DTBD-05-010, “Beta Detection Including Beta Energy and Source Efficiency,” [Reference 5-11]. Gross measurements will not be used in areas covered by thick paints or coatings. The surfaces will be volumetrically sampled or the coating will be removed prior to survey. No special consideration must be given to wall or ceiling areas painted before plant startup and which have not been subjected to repeated exposure to materials that would have penetrated the painted surface.
5.4.2.6 Reactor Building Liner
Because concrete from the shield walls and floors is being removed, FSS surveys of the interior of the reactor building will be limited to measurements of the steel liner. Instrument efficiency will be adjusted following the method described in NUREG-1507 to account for the effects of surface coatings, if necessary. Remaining concrete or structural features will be surveyed as described above.

Rancho Seco License Termination Plan Revision 1 Chapter 5, Final Status Survey Plan May 2008
Page 5-35
5.4.3 Instrumentation
Radiation detection and measurement instrumentation for the FSS is selected to provide both reliable operation and adequate sensitivity to detect the radionuclides identified at the site at levels sufficiently below the DCGL. Detector selection is based on detection sensitivity, operating characteristics and expected performance in the field. The instrumentation will, to the extent practicable, use data logging with bar code scanning capability.
Commercially available portable and laboratory instruments and detectors are typically used to perform the three basic survey measurements: 1) surface scanning; 2) direct surface contamination measurements; and 3) spectroscopy of soil and other bulk materials, such as concrete.
Radiation Protection procedures and Decommissioning Survey Implementing Procedures (DSIPs) control the issuance, use, and calibration of instrumentation. Records supporting the instrumentation program are maintained in accordance with site document control procedures.
5.4.3.1 Instrument Selection
Radiation detection and measurement instrumentation is selected based on the type and quantity of radiation to be measured. The instruments used for direct measurements are capable of detecting the radiation of concern to a Minimum Detectable Concentration (MDC) of between 10% and 50% of the applicable DCGL. The use of 10% to 50% of the DCGL is an administrative limit only. Any value below the DCGL is acceptable in Class 1 or 2 survey units. MDCs of less than 50% of the DCGL allow detection of residual activity in Class 3 survey units at an investigation level of 0.5 times the DCGL. Instruments used for scan measurements in Class 1 areas are required to be capable of detecting radioactive material at the DCGLEMC. Instrumentation currently proposed for use in the FSS is listed in Table 5-11. Instrument MDCs are discussed in Section 5.4.3.4 and nominal MDC values are also listed in Table 5-12.
Other measurement instruments or techniques may be utilized. The acceptability of alternate instruments or technologies for use in the FSS Program would be justified in a technical basis evaluation document. Technical basis evaluations for alternate final status survey instruments or techniques will be provided for NRC review 30 days prior to use. An instrument technical analysis will include the following:
• Description of the conditions under which the method would be used;
• Description of the measurement method, instrumentation and criteria;
• Justification that the technique would provide the required sensitivity for the given survey unit classification in accordance with Table 5-10; and
• Demonstration that the instrument provides sufficient sensitivity for measurement below the release criteria with Type I error equivalent to 5% or less.

Rancho Seco License Termination Plan Revision 1 Chapter 5, Final Status Survey Plan May 2008
Page 5-36
Table 5-11 Typical FSS Survey Instrumentation
Measurement Type Detector Type
Effective Detector Area and
Window Density
Instrument and Model Detector Model
Alpha Static Gas-flow proportional
126 cm2 0.8 mg/cm2
Aluminized Mylar Ludlum 2350-1 Ludlum 43-68
Alpha Scan α Scintillation
0.8 mg/cm2 - 1.2 mg/cm2
ZnS(Ag) 125 cm2
Ludlum 2350-1 Ludlum 43-90
Alpha Static α Scintillation
0.8 mg/cm2 - 1.2 mg/cm2
ZnS(Ag) 125 cm2
Ludlum 2350-1 Ludlum 43-90
Beta Scan β Scintillation
1.2 mg/cm2 0.01” Plastic Scintillation
125 cm2
Ludlum 2350-1 Ludlum 44-116
Beta Static β Scintillation
1.2 mg/cm2 0.01” Plastic Scintillation
125 cm2
Ludlum 2350-1 Ludlum 44-116
Beta Scan G-M 15.5 cm2 1.7 mg/cm2 Ludlum 2350-1 Ludlum 44-40-2
Beta Static G-M 15.5 cm2 1.7 mg/cm2 Ludlum 2350-1 Ludlum 44-40-2
Beta Scan G-M 15.5 cm2 1.7 mg/cm2 Ludlum 2350-1 Ludlum 44-9
Beta Static G-M 15.5 cm2 1.7 mg/cm2 Ludlum 2350-1 Ludlum 44-9
Beta-Gamma Scan
Gas-flow proportional
31 cm2 0.8 mg/cm2
Aluminized Mylar Ludlum 2350-1 Ludlum 43-51
Beta-Gamma Static
Gas-flow proportional
31 cm2 0.8 mg/cm2
Aluminized Mylar Ludlum 2350-1 Ludlum 43-51
Beta-Gamma Scan
Gas-flow proportional
55 cm2 0.8 mg/cm2
Aluminized Mylar Ludlum 2350-1 Ludlum 43-116-1
Beta-Gamma Static
Gas-flow proportional
55 cm2 0.8 mg/cm2
Aluminized Mylar Ludlum 2350-1 Ludlum 43-116-1
Beta-Gamma Scan
Gas-flow proportional
126 cm2 0.8 mg/cm2
Aluminized Mylar Ludlum 2350-1 Ludlum 43-68

Rancho Seco License Termination Plan Revision 1 Chapter 5, Final Status Survey Plan May 2008
Page 5-37
Table 5-11 Typical FSS Survey Instrumentation
Measurement Type Detector Type
Effective Detector Area and
Window Density
Instrument and Model Detector Model
Beta-Gamma Scan
Gas-flow proportional
584 cm2 0.8 mg/cm2
Aluminized Mylar Ludlum 2350-1 Ludlum 43-37
Beta-Gamma Static
Gas-flow proportional
584 cm2 0.8 mg/cm2
Aluminized Mylar Ludlum 2350-1 Ludlum 43-37
Gamma Scan Scintillation 2” diameter x 2” length NaI Ludlum 2350-1 Ludlum 44-10 or
Eberline SPA-3
Static Surface Contamination
Gas-flow proportional
126 cm2 0.8 mg/cm2
Aluminized Mylar Ludlum 2350-1 Ludlum 43-68
Static Surface Contamination Scintillation
126 cm2 1.2 mg/cm2
Aluminized Mylar Ludlum 2350-1 Ludlum 43-90
Ludlum 44-116
Soil, Structure Surfaces and Bulk Material
High-purity Germanium N/A Canberra Lab or
In Situ Detector N/A
Gamma Pipe Directs
CsI NaI NaI NaI Gas-Flow Gas-Flow Gas-Flow
0.75” x 0.75” 2” x 2” 3” x 3”
0.75” x 3” 180 cm2 120 cm2 60 cm2
Ludlum 2350-1
Ludlum 44-159 Ludlum 44-157 Ludlum 44-162 Bicron 1062000 Ludlum 43-98
Ludlum 43-111 Ludlum 43-94

Ran
cho
Seco
Lic
ense
Ter
min
atio
n Pl
an
R
evis
ion
1 C
hapt
er 5
, Fin
al S
tatu
s Sur
vey
Plan
May
200
8
Pa
ge 5
-38
Tab
le 5
-12
Typ
ical
FSS
Det
ectio
n Se
nsiti
vitie
s
Inst
rum
ents
an
d D
etec
tors
a R
adia
tion
Bac
kgro
und
Cou
nt T
ime
(min
utes
)
Bac
kgro
und
(cpm
)
Inst
rum
ent
Eff
icie
ncyb
( εt)
Cou
nt T
ime
(min
utes
) St
atic
MD
Cc
(dpm
/100
cm
2 ) Sc
an M
DC
Mod
el 4
3-68
A
lpha
10
1
0.07
0e 5.
0 27
N
/Af
Mod
el 4
3-68
B
eta-
Gam
ma
1 30
0 0.
153g
1.0
433
1033
d
Mod
el 4
4-11
6 B
eta
1 30
0 0.
124h
1.0
539
1390
d M
odel
43-
90
Alp
ha
10
3 0.
077e
5.0
39
N/A
f M
odel
43-
116-
1 B
eta-
Gam
ma
1 20
0 0.
157h
1.0
796
3,25
8d M
odel
43-
51
Bet
a-G
amm
a 1
37
0.07
5h 1.
0 1,
324
4,49
4d M
odel
43-
37
Bet
a-G
amm
a 1
1,20
0 0.
142h
1.0
198
616d
Mod
el 4
4-9
Bet
a-G
amm
a 1
36
0.09
5 1.
0 2,
150
26,3
27d
Mod
el 4
4-40
-2
Bet
a-G
amm
a 1
27
0.09
5 1.
0 1,
845
5,33
5d M
odel
44-
10
Gam
ma
1 8,
000
N/A
0.
02
N/A
5.
2 pC
i/gi
Mod
el S
PA-3
G
amm
a 1
8,00
0 N
/A
0.02
N
/A
5.2
pCi/g
i
HPG
e G
amm
a U
p to
60
N/A
0.
40 re
lativ
e 10
-60
0.05
pC
i/g
volu
met
ric
2000
to 4
000
dpm
/100
cm
2 0.
15-0
.30
pCi/g
j vo
l. C
anbe
rra
Insp
ecto
r 100
0o G
amm
a U
p to
60
N/A
0.
085
rela
tive
1-60
N
/A
N/A
Bec
kman
Liq
uid
Scin
tilla
tion
H-3
30
& 6
0 40
dpm
0.
40
30 &
60
800
pCi/L
N
/A
Tenn
elec
Low
B
kg C
ount
er
Alp
ha
Bet
a 10
10
0.
1 1.
0 0.
41
0.48
1-
10
<11
< 16
N
/A
N/A
Pi
pe D
etec
tors
: M
odel
44-
159k
Gam
ma
1 70
0 0.
024
1 5,
250
N/A
m
Mod
el 4
4-15
7 k
Gam
ma
1 6,
300
0.21
2 1
1,75
0 N
/Am
Mod
el 4
4-16
2 k
Gam
ma
1 16
,000
0.
510
1 1,
150
N/A
m
Mod
el 1
0620
00 k
Gam
ma
1 1,
200
0.03
5 1
4,68
0 N
/Am
Mod
el 4
3-98
B
eta-
Gam
ma
1 16
3 0.
098 l
1 35
0 63
0n M
odel
43-
111
Bet
a-G
amm
a 1
207
0.15
9 l 1
360
660n
Mod
el 4
3-94
B
eta-
Gam
ma
1 56
0.
179 l
1 35
0 61
0n

Ran
cho
Seco
Lic
ense
Ter
min
atio
n Pl
an
R
evis
ion
1 C
hapt
er 5
, Fin
al S
tatu
s Sur
vey
Plan
May
200
8
Pa
ge 5
-39
a D
etec
tor m
odel
s lis
ted
are
used
with
the
Ludl
um 2
350-
1 D
ata
Logg
er
b Cal
ibra
tion
sour
ces a
re C
s-13
7 an
d Pu
-239
. Th
e ef
ficie
ncy
is d
eter
min
ed b
y co
untin
g th
e so
urce
with
the
dete
ctor
in a
fixe
d po
sitio
n fr
om th
e so
urce
(rep
rodu
cibl
e ge
omet
ry).
The
ε t v
alue
is b
ased
on
ISO
-750
3-1,
“Ev
alua
tion
of S
urfa
ce C
onta
min
atio
n - P
art 1
: Bet
a Em
itter
s and
Alp
ha
Emitt
ers (
first
edi
tion)
,” [
Ref
eren
ce 5
-12]
and
con
ditio
ns n
oted
for e
ach
dete
ctor
. c St
atic
MD
C is
cal
cula
ted
per E
quat
ion
5-7
and
is th
e sa
me
as B
rods
ky a
nd G
alla
gher
in T
able
3.1
of N
UR
EG-1
507.
For
con
ditio
ns w
here
the
back
grou
nd a
nd sa
mpl
e co
unt t
ime
diff
er, t
he fo
rmul
a fr
om S
trom
and
Sta
nbur
y in
Tab
le 3
.1 o
f NU
REG
-150
7 is
use
d.
d Scan
MD
C, i
n dp
m/1
00 c
m2 , i
s cal
cula
ted
per E
quat
ion
5-8
assu
min
g a
scan
rate
of 5
.08
cm/s
ec, w
hich
is e
quiv
alen
t to
a co
unt t
ime
of 1
.73
seco
nds (
0.02
8 m
inut
es) u
sing
a d
etec
tor w
idth
of 8
.8 c
m.
The
43-3
7 de
tect
or a
ssum
es a
scan
rate
of 1
2.7
cm/s
and
resu
lts in
a c
ount
tim
e of
1.0
5 se
cond
s (0.
018
min
utes
) for
a d
etec
tor w
idth
of 1
3.34
cm
. Th
e 44
-116
det
ecto
r’s w
idth
is 7
.5 c
m a
nd re
sults
in a
cou
nt ti
me
of 1
.48
seco
nds a
t 5.
08 c
m/s
scan
spee
d. T
he 4
3-11
6-1
dete
ctor
’s w
idth
is 2
.54
cm a
nd re
sults
in a
cou
nt ti
me
of 1
.0 se
cond
s at a
scan
spee
d of
2.5
4 cm
/s.
The
43-5
1 de
tect
or’s
wid
th is
3.8
1 cm
and
at a
scan
rate
of 5
.08
cm/s
resu
lts in
a c
ount
tim
e of
0.7
5 se
cond
s. B
oth
the
44-9
and
44-
40-2
hav
e w
indo
w
field
s of v
isio
n of
5.0
8 cm
wid
e an
d re
sult
in a
1.0
seco
nd c
ount
tim
e fo
r a
scan
spee
d of
5.0
8 cm
/s.
e The ε t
valu
e fo
r the
alp
ha m
ode
of th
e 43
-68
and
43-9
0 de
tect
ors i
s the
2π
valu
e as
def
ined
in IS
O-7
503-
1 tim
es th
e IS
O-7
503-
1 ε s
valu
e of
0.2
5 fo
r Pu-
239
f Usi
ng th
e ap
proa
ch d
escr
ibed
in S
ectio
n 6.
7.2.
2 of
MA
RR
SIM
and
a sc
an a
lpha
DC
GL
valu
e of
60
dpm
/100
cm
2 resu
lts in
a 2
1% p
roba
bilit
y fo
r a
surv
eyor
to a
udib
ly d
etec
t 1 c
pm, t
hen
acqu
ire a
stat
ic c
ount
for a
ppro
xim
atel
y 15
seco
nds t
o co
nfirm
the
pres
ence
of a
lpha
act
ivity
. A
low
pr
obab
ility
of d
etec
tion
at th
e ty
pica
l DC
GL
leve
l im
plie
s tha
t alp
ha sc
anni
ng m
ay n
ot b
e pr
actic
al.
g The ε t
used
for t
he b
eta
mod
e of
the
43-6
8 is
det
erm
ined
from
ana
lysi
s of c
oncr
ete
sam
ples
at R
anch
o Se
co.
The
eval
uatio
n an
d re
sults
are
foun
d in
DTB
D-0
5-01
0.
h The
43-
116,
51
and
37 a
re g
as fl
ow p
ropo
rtion
al d
etec
tors
(GFP
D) o
f the
sam
e ty
pe a
nd w
indo
w th
ickn
ess a
s the
43-
68 d
etec
tor.
The
ε s v
alue
fo
r the
se d
etec
tors
was
der
ived
from
the
conc
rete
stud
y pe
rfor
med
usi
ng 4
3-68
det
ecto
rs.
i Scan
MD
C in
pC
i/g is
cal
cula
ted
usin
g th
e ap
proa
ch d
escr
ibed
in S
ectio
n 6.
7.2.
1 of
MA
RSS
IM fo
r a C
s-13
7 nu
clid
e fr
actio
n of
0.9
5 an
d a
Co-
60
frac
tion
of 0
.05
with
a d
eter
min
ed d
etec
tor s
ensi
tivity
of 1
000
and
430
cpm
per
uR
/hr f
or e
ach
radi
onuc
lide
resp
ectiv
ely.
The
wei
ghte
d M
icro
Shie
ld-d
eter
min
ed c
onve
rsio
n fa
ctor
was
0.2
82 p
Ci/g
per
uR
/hr.
j In si
tu sp
ectro
scop
y H
PGe
uses
the
“cou
nt to
MD
A”
func
tion
in o
rder
to a
chie
ve th
e re
quire
d M
DC
. k Th
e ef
ficie
ncy
varie
s for
the
pipe
det
ecto
rs d
epen
ding
on
the
pipe
dia
met
er u
sed.
The
eff
icie
ncy
used
for t
he ta
ble
is th
e av
erag
ed e
ffic
ienc
y va
lue
for t
he p
ipe
diam
eter
s. T
he d
etec
tors
and
dia
met
ers a
re: m
odel
44-
159:
2-4
in. d
ia.,
mod
el 1
0620
00: 1
-4 in
. dia
., m
odel
44-
157:
4-8
in. d
ia.,
mod
el 4
4-16
2: 8
-12
in. d
ia.

Ran
cho
Seco
Lic
ense
Ter
min
atio
n Pl
an
R
evis
ion
1 C
hapt
er 5
, Fin
al S
tatu
s Sur
vey
Plan
May
200
8
Pa
ge 5
-40
l The
43-9
4, 9
8 an
d 11
1 ar
e G
FPD
pip
e de
tect
ors a
nd th
e ef
ficie
ncy
used
for t
he ε t
val
ue is
bas
ed o
n IS
O-7
503-
1 fo
r met
al.
The
sour
ce u
sed
is a
m
etal
sour
ce a
nd th
e pi
ping
are
a of
inte
rest
will
be
clea
ned
met
al su
rfac
es. T
he R
anch
o Se
co d
eriv
ed ε
s val
ue o
f 0.2
96 is
use
d fo
r con
cret
e pe
netra
tions
. mPi
ping
surv
eys m
ay b
e co
nduc
ted
with
out s
cann
ing.
Dire
ct m
easu
rem
ents
will
be
acqu
ired
at in
terv
als o
f 6 in
ches
. n Pe
netra
tions
may
be
scan
ned
ant t
he 4
3-94
, 98
and
111
pipe
det
ecto
r sca
n M
DC
’s fo
r pen
etra
tions
are
pro
vide
d.
o Porta
ble
MC
A m
ulti-
face
ted
inst
rum
ent t
o be
use
d to
per
form
fiel
d sp
ectru
m a
naly
sis i
n va
ried
data
col
lect
ion
mod
es w
hich
may
incl
ude
in-s
itu
obje
ct c
alib
ratio
n so
ftwar
e (I
SOC
S).
Site
pro
cedu
res,
inst
ruct
ions
and
as r
equi
red,
DTB
D’s
will
def
ine
the
anal
ysis
par
amet
ers.

Rancho Seco License Termination Plan Revision 1 Chapter 5, Final Status Survey Plan May 2008
Page 5-41
5.4.3.2 Calibration And Maintenance
Instruments and detectors are calibrated for the radiation types and energies of interest at the site. The calibration source for beta survey instruments is Cs-137 because the average beta energy (188 keV) approximates the beta energy of the radionuclides found on surfaces or in piping on site (average beta energy of 166 keV). The alpha calibration source when used is Pu-239 that has an appropriate alpha energy for plant-specific alpha emitting nuclides. Gamma scintillation detectors are typically calibrated using Cs-137.
Instrumentation used for final status survey will be calibrated and maintained in accordance with RP.311.II.03, Ludlum 2350-1 Datalogger Calibration procedure. Radioactive sources used for calibration are traceable to the National Institute of Standards and Technology (NIST) and have been obtained in standard geometries to match the type of samples being counted. When characterized HPGe detectors are used, suitable NIST-traceable sources are used for calibration, and the software is set up appropriately for the desired geometry. If vendor services are used, these will be obtained in accordance with purchasing requirements for quality related services, to ensure the same level of quality.
5.4.3.3 Response Checks
Instrumentation response checks are conducted to assure proper instrument response and operation. An acceptable response for field instrumentation is an instrument reading within ±20% of the established check source value. Laboratory instrumentation standards will be within ±3 sigma as documented on a control chart. Response checks are performed daily before instrument use and again at the end of use. Check sources contain the same type of radiation as that being measured in the field and are held in fixed geometry jigs for reproducibility. If an instrument fails a response check, it is labeled with a Rancho Seco “Radiac Repair Tag” and is removed from service until the problem is corrected in accordance with applicable procedures. Measurements made between the last acceptable check and the failed check are evaluated to determine if they should remain in the data set.
5.4.3.4 Minimum Detectable Concentration (MDC)
The MDC is determined for the instruments and techniques used for final status surveys (Table 5-12). The MDC is the concentration of radioactivity that an instrument can be expected to detect 95 percent of the time.
5.4.3.4.1 Static MDC For Structure Surfaces
For static (direct) surface measurements, with conventional detectors, such as those listed in Table 5-12, the MDC is calculated by Equation 5-7 as follows:
( )( )tKBMDCstatic
65.43 +=
Equation 5-7
where:
MDCstatic = minimum detectable concentration for direct counting (dpm/100 cm2),
B = number of background counts during the count interval t,

Rancho Seco License Termination Plan Revision 1 Chapter 5, Final Status Survey Plan May 2008
Page 5-42
t = count interval (for paired observations of sample and blank, usually 1 minute), and
K = calibration constant (counts/min per dpm/100 cm2 ).
The value of K includes correction factors for efficiency (εi and εs). The value of εs is dependent on the material type. Corrections for radionuclide absorption have been made.
5.4.3.4.2 Structural Surface Beta-Gamma Scan MDCs
Following the guidance of Sections 6.7 and 6.8 of NUREG-1507, MDCs for surface scans of structural surfaces for beta and gamma emitters will be computed by Equation 5-8 below. For determining scan MDCs, a rate of 95% of correct detections is required and a rate of 60% of false positives is determined to be acceptable: therefore, a sensitivity index value of 1.38 was selected from Table 6.1 of NUREG-1507 and Equation 5-7 becomes:
tAp
BcmdpmMDCsi
scansurfacestructural
⎟⎠⎞
⎜⎝⎛
=
100
38.1)100/( 2
εε
Equation 5-8
where:
B = number of background counts during the count interval t,
p = surveyor efficiency,
εi = instrument efficiency for the emitted radiation (cpm per dpm),
εs = source efficiency (intensity) in emissions per disintegration,
A = sensitive area of the detector (cm2), and
t = time interval of the observation while the probe passes over the source (minutes).
The numerator in Equation 5-8 represents the minimum detectable count rate that the observer would "see" at the performance level represented by the sensitivity index. The surveyor efficiency (p) will be taken to be 0.5, as recommended by Section 6.7.1 of NUREG-1507. The factor of 100 corrects for probe areas that are not 100 cm2. In the case of a scan measurement, the counting interval is the time the probe is actually over the source of radioactivity. This time depends on scan speed, the size of the source, and the fraction of the detector's sensitive area that passes over the source; with the latter depending on the direction of probe travel. The source efficiency term (εs) in Equation 5-8 may be adjusted to account for effects such as self-absorption, as appropriate.
5.4.3.4.3 Total Efficiency (εt) and Source Efficiency (εs) for Concrete Contamination
The source term inventory on contaminated concrete appears to be primarily located within the top ten millimeters of the concrete surface. Various fixed point measurement alternatives for determining the source term were evaluated including gross beta measurements on the surfaces, volumetric concrete sampling and in situ gamma spectroscopy. Gross beta fixed point measurements were determined to be cost-effective and technically defensible under the

Rancho Seco License Termination Plan Revision 1 Chapter 5, Final Status Survey Plan May 2008
Page 5-43
assumption that the instrument efficiencies for concrete could be satisfactorily calculated using the methods recommended in NUREG-1507. Determination of the average beta energy and detector response for structure surveys is described in DTBD 05-010.
For scan surveys, gross beta measurements appear to be a practical method. Under certain conditions, in situ gamma spectroscopy may be a reasonable method for replacing beta scan surveys.
The methods for determining efficiency in NUREG-1507 were specifically developed to address situations when the source, in this case concrete, affects radiation emission rate due to self-attenuation, backscatter, thin coverings, etc. This method accounts for these source effects by separating the efficiency calculation into two components, i.e., instrument efficiency εi and source efficiency εs. The total efficiency εt, is the product of εi and εs as shown below.
( )( )sit εεε =
Equation 5-9
The εi was determined by calibration to a NIST traceable, large area Cs-137 source. The εs value was determined empirically through measurements of concrete cores and volumetric samples collected from representative site locations. Samples were taken from each of the buildings. The sample nuclide activities were determined by gamma spectrometry, then the pCi/g result was multiplied by the mass of the core sample and converted to total gross beta dpm. Detector response in c/m was divided by the sample activity in dpm to determine the εt. Dividing εt by εi resulted in the empirically derived εs. The empirically derived εs value of 0.296 compares reasonably with the ISO standard default value of 0.5 for beta energies greater than 0.4 MeV, considering most of the concrete activity is Cs-137 with a beta energy greater than 0.4.
The method used to adjust the efficiency for the effect of surface coatings was taken from NUREG-1705 and is discussed in DTBD 05-010.
5.4.3.4.4 Structural Surface Alpha Scan MDCs
In cases where alpha scan surveys are required, MDCs must be quantified differently than those for beta-gamma surveys because the background count rate from a typical alpha survey instrument is nearly zero (1 to 3 counts per minute typically). Since the time that an area of alpha activity is under the probe varies and the background count rates of alpha survey instruments is so low, it is not practical to determine a fixed MDC for scanning. Instead, it is more useful to determine the probability of detecting an area of contamination at a predetermined DCGL for given scan rates.
For alpha survey instrumentation with a background around one to three counts per minute, a single count will give a surveyor sufficient cause to stop and investigate further. Thus, the probability of detecting given levels of alpha emitting radionuclides can be calculated by use of Poisson summation statistics. Doing so (see MARRSIM Section 6.7.2.2 and Appendix J for details), one finds that the probability of detecting an area of alpha activity of 300 dpm/100 cm2 at a scan rate of 3 cm per second (roughly 1 inch per second) is 90% if the probe dimension in the direction of the scan is 10 cm. If the probe dimension in the scan direction is halved to 5 cm, the detection probability is still 70%. Choosing appropriate values for surveyor efficiency, instrument and surface efficiencies will yield MDCs for alpha surveys for structure

Rancho Seco License Termination Plan Revision 1 Chapter 5, Final Status Survey Plan May 2008
Page 5-44
surfaces. If for some reason lower MDCs are desired, then scan speeds can be adjusted, within practical limits, via the methods of Section 6.7.2.2 and Appendix J of MARSSIM.
5.4.3.4.5 Open Land Area Gamma Scan MDCs
In addition to the MDCR and detector characteristics, the scan MDC (in pCi/g) for land areas is based on areal extent of the hot spot, depth of the hot spot, and the radionuclide (i.e., energy and yield of gamma emissions). If one assumes constant parameters for each of the above variables, with the exception of the specific radionuclide in question, the scan MDC may be reduced to a function of the radionuclide alone.
The evaluation of open land areas requires a detection methodology of sufficient sensitivity for the identification of small areas of potentially elevated activity. Scanning measurements are performed by passing a 2" x 2" NaI(TI) gamma scintillation detector in gross count rate mode across the land surface under investigation. The centerline of the detector is maintained at a source-to-detector distance of less than 10 cm and moved from side to side in a 1-meter wide pattern at a rate of 0.5 m/sec. This serpentine scan pattern is designed to cross each survey cell (one square meter) five times in approximately ten seconds with a maximum separation of less than 50 cm between any path. The audible signal is monitored for detectable increases in count rate. An observed count rate increase results in further investigation to verify findings and define the level and extent of residual radioactivity.
This method represents the Stage 1 and Stage 2 surface scanning process for land areas defined in NUREG-1507 and is the basis for calculation of the scanning detection sensitivity (scan MDC). The sensitivity of this counting system has been verified by empirical measurements (DTBD 05-012, “Eberline SPA-3 and Ludlum 44-10 Detector Sensitivity (MDC),” [Reference 5-13]). The sensitivity is only slightly affected by the relative amounts of Cs-137 and Co-60 in the soil giving typical scan MDC values in the range of 5 to 6 pCi/g (approximately 10 percent of the soil DCGL) for instrument backgrounds of 8,000 to 10,000 cpm. Alternate methods of sufficient sensitivity for the identification of small areas of elevated radioactivity may be used where appropriate.
An a priori determination of scanning sensitivity is performed to ensure that the measurement system is able to detect concentrations of radioactivity at levels below the regulatory release limit. Expressed in terms of Scan MDC, this sensitivity is the lowest concentration of radioactivity for a given background that the measurement system is able to detect at a specified performance level and surveyor efficiency. The scan MDC value (in pCi/g) for open land area surface scanning is developed in the following steps following the guidance of MARSSIM, Section 6.7.2.1.
With a desired performance level of 95% correct detections and 60% false positive rate, the sensitivity index has a value of 1.38 resulting in a minimum detectable count rate (MDCR) of:
)min1sec60(38.1 ×= ibMDCR
Equation 5-10
where:
bi = background counts in the observation interval.

Rancho Seco License Termination Plan Revision 1 Chapter 5, Final Status Survey Plan May 2008
Page 5-45
Introducing the human factor performance element of surveyor efficiency, the surveyor minimum detectable count rate becomes:
pMDCRMDCRsurveyor =
Equation 5-11
where:
MDCRsurveyor = Minimum detectable surveyor count rate (cpm), and
p = Surveyor efficiency = 0.5.
A corresponding minimum detectable exposure rate can be determined for a specified detector and radionuclide by dividing the MDCRsurveyor value by the detector manufacturer’s count rate to exposure rate ratio (cpm per µR/h) to give a minimum detectable exposure rate in units of µR/h. The minimum detectable exposure rate is then used to determine the minimum detectable radionuclide concentration (i.e., the Scan MDC) by modeling a specified small area of elevated activity using MicroShield™ to yield a conversion factor of µR/h per pCi/g. The minimum detectable exposure rate is then divided by the MicroShield™ conversion factor to give a Scan MDC in units of pCi/g.
5.4.3.4.6 HPGe Spectrometer Analysis
The onsite chemistry laboratory maintains two gamma isotopic spectrometers that are calibrated to various sample geometries, including a one-liter marinelli geometry for soil analysis. These systems are calibrated using a NIST-traceable mixed gamma source. Both detectors are manufactured by Canberra and operate using the Genie PC platform from Canberra Industries. Laboratory counting systems have software controlled count times which are set to meet a maximum MDC of 0.15 pCi/g for Cs-137 in soil; this is calculated by Equation 5-12 as follows:
tVKBgpCiMDC
∗∗+
=65.43)/(
Equation 5-12
where:
B = number of background counts during the count interval t,
K = proportionality constant that relates the detector response to the activity level in a sample for a given set of measurement conditions,
V = mass of sample (g), and
t = count time (minutes)
Two HPGe detectors have been obtained for in situ gamma spectroscopy of soils and structures. Their sensitivity is similar to that of the lab spectrometer and is documented in DTBD-06-003.

Rancho Seco License Termination Plan Revision 1 Chapter 5, Final Status Survey Plan May 2008
Page 5-46
5.4.3.4.7 Pipe Survey Instrumentation
Remaining pipe will be surveyed to ensure residual remaining activity is less than the DCGL. Pipe survey instruments proposed for use with pipe having diameters between 0.75 and 18 inches have been shown to have efficiencies ranging from approximately 0.02 to 0.51 (Table 5-12). This equates to detection sensitivities of approximately 350 dpm/100 cm2 to 5,200 dpm/100 cm2. This level of sensitivity is adequate to detect residual activity below the embedded pipe DCGL of 100,000 dpm/100 cm2.
5.5 Data Collection and Processing
This section describes data collection, review, validation and record keeping requirements for final status surveys.
5.5.1 Sample Handling and Record Keeping
Sample collection and handling requirements are provided for each sample from the point of collection through obtaining the final results to ensure the validity of the sample data. Sample tracking records are controlled and maintained and, upon completion of the data cycle, are transferred to Document Control, in accordance with applicable procedures.
Each survey unit has a document package associated with it that covers the design and field implementation of the survey requirements. Survey unit records are quality records.
5.5.2 Data Management
Survey data are collected from several sources during the data life cycle and are evaluated for validity throughout the survey process. QC replicate measurements are not used as final status survey data (See Section 5.8.2.4.1 for design and use of QC measurements.). Measurements performed during turnover and investigation surveys can be used as final status survey data if they were performed according to the same requirements as the final status survey data. These requirements are:
• Survey data shall reflect the as-left survey unit condition; i.e., no further remediation required,
• The application of isolation measures to the survey unit to prevent recontamination and to maintain final configuration are in effect; and
• The data collection and design were in accordance with FSS methods and procedures, e.g., scan MDC, investigation levels, survey data point number and location, statistical tests, and EMC tests.
Measurement results stored as final status survey data constitute the final survey of record and are included in the data set for each survey unit used for determining compliance with the site release criteria. Measurements are recorded in units appropriate for comparison to the applicable DCGL. Numerical values, even negative numbers, are recorded. Measurement records include, at a minimum, the surveyor's name, the location of the measurement, the instrument used, measurement results, the date and time of the measurement, any surveyor comments, and records of applicable reviews.

Rancho Seco License Termination Plan Revision 1 Chapter 5, Final Status Survey Plan May 2008
Page 5-47
5.5.3 Data Verification and Validation
The final status survey data are reviewed before data assessment to ensure that they are complete, fully documented and technically acceptable. The review criteria for data acceptability will include at a minimum, the following items:
a) The instrumentation MDC for fixed or volumetric measurements was below the DCGLW or if not, it was below the DCGLEMC for Class 1, below the DCGLW for Class 2 and below 0.5 DCGLW for Class 3 survey units,
b) The instrument calibration was current and traceable to NIST standards,
c) The field instruments were source checked with satisfactory results before and after use each day data were collected or data were evaluated if instruments did not pass a source check in accordance with Section 5.4.3.3,
d) The MDCs and assumptions used to develop them were appropriate for the instruments and techniques used to perform the survey,
e) The survey methods used to collect data were proper for the types of radiation involved and for the media being surveyed,
f) “Special methods” for data collection were properly applied for the survey unit under review. These special methods are either described in this LTP section or will be the subject of an NRC notice of opportunity for review,
g) The sample was controlled from the point of sample collection to the point of obtaining results,
h) The data set is comprised of qualified measurement results collected in accordance with the survey design which accurately reflect the radiological status of the facility, and
i) The data have been properly recorded.
If the data review criteria are not met, the discrepancy will be evaluated and the decision to accept or reject the data will be documented in accordance with approved procedures. The Rancho Seco Corrective Action Program will be used to document and resolve discrepancies as applicable.
5.5.4 Graphical Data Review
Survey data may be graphed to identify patterns, relationships or possible anomalies which might not be so apparent using other methods of review. A posting plot or a frequency plot may be made. Other special graphical representations of the data will be made as the need dictates.
5.5.4.1 Posting Plots
Posting plots may be used to identify spatial patterns in the data. The posting plot consists of the survey unit map with the numerical data shown at the location from which it was obtained. Posting plots can reveal patches of elevated radioactivity or local areas in which the DCGL is exceeded. Posting plots can be generated for background reference areas to point out spatial trends that might adversely affect the use of the data. Incongruities in the background data may be the result of residual, undetected activity, or they may just reflect background variability.

Rancho Seco License Termination Plan Revision 1 Chapter 5, Final Status Survey Plan May 2008
Page 5-48
5.5.4.2 Frequency Plots
Frequency plots may be used to examine the general shape of the data distribution. Frequency plots are basically bar charts showing data points within a given range of values. Frequency plots reveal such things as skewness and bimodality (having two peaks). Skewness may be the result of a few areas of elevated activity. Multiple peaks in the data may indicate the presence of isolated areas of residual radioactivity or background variability due to soil types or differing materials of construction. Variability may also indicate the need to more carefully match background reference areas to survey units or to subdivide the survey unit by material or soil type.
5.6 Data Assessment and Compliance
An assessment is performed on the final status survey data to ensure that they are adequate to support the determination to release the survey unit. Simple assessment methods such as comparing the survey data to the DCGL or comparing the mean value to the DCGL are first performed. The statistical tests are then applied to the final data set and conclusions are made as to whether the survey unit meets the site release criterion.
5.6.1 Data Assessment Including Statistical Analysis
The results of the survey measurements are evaluated to determine whether the survey unit meets the release criterion. In some cases, the determination can be made without performing complex, statistical analyses.
5.6.1.1 Interpretation of Sample Measurement Results
An assessment of the measurement results is used to quickly determine whether the survey unit passes or fails the release criterion or whether one of the statistical analyses must be performed. The evaluation matrices are presented in Tables 5-13 and 5-14.
Table 5-13 Interpretation of Sample Measurements When the WRS Test Is Used
Measurement Results Conclusion Difference between maximum survey unit concentration and minimum reference area concentration is less than DCGLW
Survey unit meets release criterion
Difference of survey unit average concentration and reference area average concentrations greater than DCGLW Survey unit fails
Difference between any survey unit concentration and any reference area concentration is greater than DCGLW and the difference of survey unit average concentration and reference area average concentration is less than DCGLW
Conduct WRS test and elevated measurements test

Rancho Seco License Termination Plan Revision 1 Chapter 5, Final Status Survey Plan May 2008
Page 5-49
Table 5-14
Interpretation of Sample Measurements When the Sign Test Is Used
Measurement Results Conclusion
All concentrations less than DCGLW Survey unit meets release criterion
Average concentration greater than DCGLW Survey unit fails Any concentration greater than DCGLW and average concentration less than DCGLW
Conduct Sign Test and elevated measurements test
When required, one of four statistical tests will be performed on the survey data:
1) WRS Test
2) Sign Test
3) WRS Test Unity Rule
4) Sign Test Unity Rule
In addition, survey data are evaluated against the EMC criteria as previously described in Section 5.3.6.3 and as required by NUREG-1757, Volume 2. The statistical test is based on the null hypothesis (Ho) that the residual radioactivity in the survey unit exceeds the DCGL. There must be sufficient survey data at or below the DCGL to reject the null hypothesis and conclude the survey unit meets the site release criterion for dose. Statistical analyses are performed using a specially designed software package or, if necessary, using hand calculations.
5.6.1.2 Wilcoxon Rank Sum Test
The WRS test, or WRS Unity Rule (NUREG-1505, Chapter 11), may be used when the radionuclide of concern is present in the background or measurements are used that are not radionuclide-specific. In addition, this test is valid only when “less than” measurement results do not exceed 40 percent of the data set.
The WRS test is applied as follows:
1) The background reference area measurements are adjusted by adding the DCGLW to each background reference area measurement, Xi; i.e., Zi = Xi + DCGL.
2) The number of adjusted background reference area measurements, m, and the number of survey unit measurements, n, are summed to obtain N, (N = m + n).
3) The measurements are pooled and ranked in order of increasing size from 1 to N. If several measurements have the same value, they are assigned the average rank of that group of measurements.
4) The ranks of the adjusted background reference area measurements are summed to obtain Wr.

Rancho Seco License Termination Plan Revision 1 Chapter 5, Final Status Survey Plan May 2008
Page 5-50
5) The value of Wr is compared with the critical value in Table I.4 of MARSSIM. If Wr is greater than the critical value, the survey unit meets the site release dose criterion. If Wr is less than or equal to the critical value, the survey unit fails to meet the criterion.
5.6.1.3 Sign Test
The Sign test and Sign test Unity Rule are one-sample statistical tests used for situations in which the radionuclide of concern is not present in background, or is present at acceptable low fractions compared to the DCGLW. If present in background, the gross measurement is assumed to be entirely from plant activities. This option is used when it can be reasonably expected that including the background concentration will not affect the outcome of the Sign test. The advantage of using the Sign test is that a background reference area is not needed.
The Sign test is conducted as follows:
1) The survey unit measurements, Xi, i = 1, 2, 3, ...N; where N = the number of measurements, are listed.
2) Xi is subtracted from the DCGLW to obtain the difference Di = DCGLW - Xi , where i = 1, 2, 3,..., N.
3) Differences where the value is exactly zero are discarded and N is reduced by the number of such zero measurements.
4) The number of positive differences are counted. The result is the test statistic S+. Note that a positive difference corresponds to a measurement below the DCGLW and contributes evidence that the survey unit meets the site release criterion.
5) The value of S+ is compared to the critical value given in Table I.3 of MARSSIM. The table contains critical values for given values of N and α. The value of α is set at 0.05 during survey design. If S+ is greater than the critical value given in the table, the survey unit meets the site release criterion. If S+ is less than or equal to the critical value, the survey unit fails to meet the release criterion.
5.6.2 Unity Rule
5.6.2.1 Multiple Radionuclide Evaluations
The Cs-137 to Co-60 (or other gamma nuclide) ratio will vary in the final survey soil samples, and this will be accounted for using a “unity rule” approach as described in NUREG-1505 Chapter 11. Unity Rule Equivalents will be calculated for each measurement result using the surrogate adjusted Cs-137 DCGL and the adjusted Co-60 DCGL, as shown in the following Equation 5-13.
N
N
CoCs DCGLR
DCGLCo
DCGLCsEquivalentRuleUnity
S
++−
+−
=≤−−
...60137160137
Equation 5-13

Rancho Seco License Termination Plan Revision 1 Chapter 5, Final Status Survey Plan May 2008
Page 5-51
where:
Cs-137 and Co-60 are the gamma results,
DCGLCs-137s = the surrogate Cs-137s DCGL, as applicable,
DCGLCo-60 = the Co-60 DCGL,
RN = any other identified gamma emitting radionuclide, and
DCGLN = the DCGL for radionuclide N.
The unity rule equivalent results will be used to demonstrate compliance assuming the DCGL is equal to 1.0 using the criteria listed in the LTP, Tables 5-13 and 5-14. If the application of the WRS or Sign test is necessary, these tests will be applied using the unity rule equivalent results and assuming that the DCGL is equal to 1.0. An example of a WRS test using the unity rule is provided in NUREG-1505, Page 11-3, Section 11.4. (If the WRS test were used, or background subtraction were used in conjunction with the Sign test, background concentrations would also be converted to Unity Rule Equivalents prior to performing test.)
The Sign test will be used without background subtraction if background Cs-137 is not considered a significant fraction of the DCGL. Note that the surrogate Cs-137 DCGL will be used for both the statistical tests and comparisons with the criteria in LTP Tables 5-13 and 5-14.
The same general surrogate and unity rule methods described above for soil will be applied to other materials, such as activated concrete, where sample gamma spectroscopy is used for final survey as opposed to gross beta measurements.
5.6.2.2 Elevated Measurement Comparison Evaluations
During final surveys, areas of elevated activity (hot spots) may be detected and they must be evaluated both individually and in total to ensure compliance with the release criteria. The hot spots are each compared to the specific DCGLEMC value calculated for the size of the specific hot spot. If the individual hot spots pass, then they are combined and evaluated under the unity rule.
The average activity of each hot spot is determined as well as the average value for the survey unit. The survey unit average value is divided by the DCGLW, the survey unit average value is subtracted from the hot spot average activity value and the result is divided by the hot spot DCGLEMC. Each hot spot net average activity is evaluated against its DCGLEMC. The fractions are summed and the result must be less than unity for the survey unit to pass. This is summarized in Equation 5-14 below.
121
21 <−
+•••+−
+−
+nEMC
n
EMCEMCW DCGLDCGLDCGLDCGLδτδτδτδ
Equation 5-14
where:
δ = the survey unit average activity,
DCGLW = the survey unit DCGL concentration,

Rancho Seco License Termination Plan Revision 1 Chapter 5, Final Status Survey Plan May 2008
Page 5-52
τn = the average activity value of hot spot n, and
DCGLEMCn = the DCGLEMC concentration of hot spot n.
5.6.3 Data Conclusions
The results of the statistical tests, including application of the EMC, allow one of two conclusions to be made. The first conclusion is that the survey unit meets the site release dose criterion. The data provide statistically significant evidence that the level of residual radioactivity in the survey unit does not exceed the release criterion. The decision to release the survey unit is made with sufficient confidence and without further analysis.
The second conclusion that can be made is that the survey unit fails to meet the release criterion. The data are not conclusive in showing that the residual radioactivity is less than the release criterion. The data are analyzed further to determine the reason for the failure.
Possible reasons are that:
• The average residual radioactivity exceeds the DCGLW,
• The average residual radioactivity is less than the DCGLW; however, the survey unit fails elevated measurement comparison,
• The survey design or implementation was insufficient to demonstrate compliance for unrestricted release, or
• The test did not have sufficient power to reject the null hypothesis (i.e., the result is due to random statistical fluctuation).
The power of the statistical test is a function of the number of measurements made and the standard deviation in measurement data. The power is determined from 1-β where β is the value for Type II errors. A retrospective power analysis may be performed using the methods described in Appendices I.9 and I.10 of MARSSIM. If the power of the test is insufficient due to the number of measurements, additional samples may be collected as directed by procedure. A greater number of measurements increases the probability of passing if the survey unit actually meets the release criterion.
If failure was due to the presence of residual radioactivity in excess of the release criterion, the survey unit shall be remediated. Survey unit failure due to inadequate design or implementation shall require investigation and re-initiation of the FSS process.
5.6.4 Compliance
The FSS is designed to demonstrate licensed radioactive materials have been removed from Rancho Seco property to the extent that remaining residual radioactivity is below the radiological criteria for unrestricted release. The site-specific radiological criteria presented in this plan demonstrate compliance with the criteria of 10 CFR 20.1402. If the measurement results pass the requirements of Table 5-7 and the elevated areas evaluated per Section 5.3.6.3 pass the elevated measurement comparison, the survey unit is suitable for unrestricted release. If survey measurements do not meet the criteria specified in Table 5-7, an investigation will be performed. Investigations will include an evaluation of survey design, instrumentation use and

Rancho Seco License Termination Plan Revision 1 Chapter 5, Final Status Survey Plan May 2008
Page 5-53
calculations, as necessary. Investigations of this nature will be documented using the corrective action process as discussed in Section 5.8.2.
5.7 Reporting Format
Survey results and a brief operating history are documented in survey unit summary report release records and in the FSS Report. Other reports may be generated as requested by the NRC.
5.7.1 Operating History
A brief operational history including relevant operational and decommissioning data is compiled. The purpose of the history information is to provide additional, substantive data which forms a portion of the basis for the survey unit classification, and hence, the level of intensity of the FSS. The history information includes the following items:
• Operating history which could affect radiological status,
• Summarized scoping and site characterization data, and
• Other relevant information, as deemed necessary.
5.7.2 Survey Unit Summary Report
A separate summary report is prepared for each survey unit. The survey unit report is a stand-alone document containing the information necessary to demonstrate compliance with the site release criteria. This record includes:
• Description of the survey unit,
• Survey unit design information,
• Survey unit measurement locations and corresponding data,
• Survey unit investigations performed and their results, and
• Survey unit data assessment results.
When a survey unit summary report is given final approval it becomes a quality record.
5.7.3 Final Status Survey Report
Survey results will be described in a written report to the NRC. The actual structures, land, or piping system included in each written report may vary depending on the status of ongoing decommissioning activities.
The final status survey report provides a summary of the survey results and the overall conclusions that demonstrate that the Rancho Seco facility and site meet the radiological criteria for unrestricted use. Information such as the number and type of measurements, basic statistical quantities, and statistical analysis results are included in the report. The level of detail is sufficient to clearly describe the final status survey program and to certify the results. The format of the final report will contain the following topics:

Rancho Seco License Termination Plan Revision 1 Chapter 5, Final Status Survey Plan May 2008
Page 5-54
• Overview of the Results;
• Discussion of Changes to FSS;
• Final Status Survey Methodology; o Survey unit sample size, o Justification for sample size;
• Final Status Survey Results; o Number of measurements taken, o Survey maps, o Sample concentrations, o Statistical evaluations, o Judgmental and miscellaneous data sets;
• Anomalous Data;
• Conclusion for each survey unit; and
• Any Changes from initial assumptions on extent of residual activity.
5.7.4 Other Reports
Other reports relating to final status survey activities may be prepared and submitted as necessary.
5.8 Final Status Survey Quality Program
Quality is built in to each phase of the FSS Program and measures must be taken during the execution of the plan to determine whether the expected level of quality is being achieved. The FSS Program will ensure that the site will be surveyed, evaluated and determined to be acceptable for unrestricted release if the residual activity results in an annual Total Effective Dose Equivalent (TEDE) to the average member of the critical group of 25 mrem/year or less for all pathways. The following sections provide a description of applicable Rancho Seco quality programs and specific quality elements of the FSS Program.
5.8.1 Rancho Seco Quality Assurance Program
The Rancho Seco Quality Assurance Program (QAP) [Reference 5-14] is applied to systems, structures, components and activities important to the safe storage, control and maintenance of spent nuclear fuel and to the monitoring and control of radiological hazards. The Rancho Seco Quality Manual (RSQM) defines the responsibilities and requirements to ensure decommissioning and operation of the ISFSI comply with licenses and applicable regulations (10 CFR 50 and 10 CFR 72). The RSQM addresses organizational responsibilities, staff qualifications, procedure review and approval, design and modification controls, procurement, measurement and test equipment (M&TE) calibration and control, testing of installed equipment, document control, corrective action and other information pertinent to quality.
5.8.2 FSS Quality Assurance Project Plan (QAPP)
The objective of the FSS QAPP is to ensure the survey data collected are of the type and quality needed to demonstrate with sufficient confidence the site is suitable for unrestricted release. The objective is met through use of the DQO process for FSS design, analysis and evaluation. The plan ensures the following items are accomplished:

Rancho Seco License Termination Plan Revision 1 Chapter 5, Final Status Survey Plan May 2008
Page 5-55
1) The elements of the final status survey plan are implemented in accordance with the approved procedures,
2) Surveys are conducted by trained personnel using calibrated instrumentation,
3) The quality of the data collected is adequate,
4) All phases of package design and survey are properly reviewed, with QC and management oversight provided, and
5) Corrective actions, when identified, are implemented in a timely manner and are determined to be effective.
The following sections describe the basic elements of the FSS QAPP.
5.8.2.1 Project Management and Organization
An FSS organization will be established for the Rancho Seco site in RSAP-1901. This organization will be responsible for planning and implementation of final status surveys. Since the FSS organization has not been fully implemented at the time of LTP development, specific job titles may vary over the period of project execution. However, the following descriptions refer to various functional areas of responsibility and do not necessarily correspond to specific job titles. It is also important to note qualified individuals may assume the responsibilities of more than one of the functional positions described below. The FSS organization consists of the following functional areas.
5.8.2.1.1 Dismantlement Superintendent - Radiological
The Dismantlement Superintendent – Radiological has overall responsibility for program direction, technical content, and ensuring the program complies with applicable NRC regulations and guidance. This supervisor is responsible for preparation and implementation of the FSS procedures. Additional responsibility areas may include resolution of issues or concerns raised by the NRC or other Stakeholders, as well as programmatic issues raised by Rancho Seco site management. The Dismantlement Superintendent – Radiological provides overall FSS project coordination, which may include, but is not limited to, interfaces with site personnel in areas of nuclear licensing, demolition and waste disposal.
5.8.2.1.2 Final Status Survey Technical Specialists
Responsibilities of FSS Technical Specialists may include technical support and development of FSS procedures, design of final status surveys, preparation of survey execution instructions, development of specific technical analysis documents supporting FSS activities, and review of survey packages and data collected in support of the FSS.
5.8.2.1.3 Work Planning Coordinators
Work Planning Coordinators develop detailed, job-specific work instructions using the site work order process. These individuals are tasked with ensuring the appropriate interface between various site functional groups is specified in work order documents. These individuals possess specific knowledge regarding Radiation Protection, FSS, and Industrial Safety requirements.

Rancho Seco License Termination Plan Revision 1 Chapter 5, Final Status Survey Plan May 2008
Page 5-56
5.8.2.1.4 Final Status Survey Field Coordinators
Final Status Survey Field Coordinators are responsible for control and implementation of survey packages during field activities. Specific responsibilities are likely to include:
• Coordination of turnover surveys,
• Survey area preparation (e.g., gridding),
• Ensuring final status survey sampling is conducted in accordance with applicable procedures and work instructions,
• Maintaining access controls over completed FSS survey areas,
• Determining survey area accessibility requirements,
• Coordination and scheduling of FSS Technicians to support the decommissioning schedule, and
• Ensuring all necessary instrumentation and other equipment is available to support survey activities.
5.8.2.1.5 Final Status Survey Data Specialist
The FSS Data Specialist is responsible for maintaining the FSS data records in both electronic formats and hardcopy files, as applicable. This includes maintaining survey measurement data and supporting data files and generating reports of survey results. Responsibilities also include maintaining the integrity of the FSS database and implementing FSS Database QA requirements.
5.8.2.1.6 Final Status Survey Technician
Final Status Survey Technicians are responsible for performance of final status survey measurements and collection of final status survey samples in accordance with applicable site procedures and survey package instructions. An FSS Technician will be responsible for maintaining the pedigree of instrumentation used in the survey by implementing the procedural requirements for calibration, maintenance and daily checks. Final Status Survey Technicians will be trained and task-qualified for the performance of the final status activities assigned to them. Final Status Survey Technicians may also participate in survey area preparations.
5.8.2.2 Written Procedures
Sampling and survey tasks must be performed properly and consistently in order to assure the quality of final status survey results. The measurements will be performed in accordance with approved, written procedures. Approved procedures describe the methods and techniques used for final status survey measurements. Those procedures have been cited in Section 5.9.1.
5.8.2.3 Training and Qualification
Personnel performing final status survey measurements will be trained and qualified. Training will include the following topics:

Rancho Seco License Termination Plan Revision 1 Chapter 5, Final Status Survey Plan May 2008
Page 5-57
• Procedures governing the conduct of the FSS,
• Operation of field and laboratory instrumentation used in the FSS, and
• Collection of final status survey measurements and samples.
Qualification is obtained upon satisfactory demonstration of proficiency in implementation of procedural requirements. The extent of training and qualification will be commensurate with the education, experience and proficiency of the individual and the scope, complexity and nature of the activity required to be performed by that individual. Records of training and qualification will be maintained in accordance with approved training procedures
5.8.2.4 Measurement and Data Acquisitions
The FSS records have been designated as quality documents and will be governed by site quality programs and procedures. Generation, handling and storage of the original final status survey design and data packages will be controlled by site procedures. Each final status survey measurement will be identified by individual, date, instrument, location, type of measurement, and mode of operation.
5.8.2.4.1 Quality Control Surveys
Procedures establish built-in Quality Control checks in the survey process for both field and laboratory measurements, as described in LTP Section 5.8.2.2. For structures and systems, QC replicate scan measurements will consist of resurveys of a minimum of 5% of randomly selected class 1, 2, or 3 survey units typically performed by a different technician with results compared to the original survey result. The acceptance criterion shall be that the same conclusion as the original survey was reached based on the repeat scan. If the acceptance criterion is not met, an investigation will be conducted to determine the cause and corrective action.
Quality Control for direct surface contamination and/or gamma direct measurements will consist of repeat measurements of a minimum of 5% of the survey units using the same instrument type, taken by a different technician (except in cases where there is only one instrument or specialized training is required to operate the equipment) and the results compared to the original measurements using the same instrument type. The acceptance criterion for direct measurements is specified in approved procedures.
For soil, water and sediment samples, Quality Control will consist of participation in the laboratory Inter-comparison Program. However, as an additional quality measure, approximately 5% of such samples may be subjected to blind duplicate samples and/or third party analyses. The acceptance criterion for blank samples is that no plant-derived radionuclides are detected. The criterion for blind duplicates is that the two measurements are within the value specified by approved procedure. For third party analyses, the acceptance criterion is the same as those for blind duplicates. Some sample media, such as asphalt, will not be subjected to split or blind duplicate analyses due to the lack of homogeneity. These samples will simply be recounted to determine if the two counts are within 20% of each other, when necessary.
If QC replicate measurements or sample analyses fall outside of their acceptance criteria, a documented investigation will be performed in accordance with approved procedures; and if necessary, the Corrective Action Process described in Section 5.8.3.3 will be implemented. The

Rancho Seco License Termination Plan Revision 1 Chapter 5, Final Status Survey Plan May 2008
Page 5-58
investigation will typically involve verification that the proper data sets were compared, the relevant instruments were operating properly and the survey/sample points were properly identified and located. Relevant personnel are interviewed, as appropriate, to determine if proper instructions and procedures were followed and proper measurement and handling techniques were used including chain of custody, where applicable. When deemed appropriate, additional measurements are taken. Following the investigation, a documented determination is made regarding the usability of the survey data and if the impact of the discrepancy adversely affects the decision on the radiological status of the survey unit.
5.8.2.4.2 Instrumentation Selection, Calibration and Operation
Proper selection and use of instrumentation will ensure that sensitivities are sufficient to detect radionuclides at the minimum detection capabilities as specified in Section 5.4.3.4 as well as assure the validity of the survey data. Instrument calibration will be performed with NIST traceable sources using approved procedures. Issuance, control and operation of the survey instruments will be conducted in accordance with the Instrumentation Program procedures.
5.8.2.5 Chain of Custody
Responsibility for custody of samples from the point of collection through the determination of the final survey results is established by procedure. When custody is transferred outside of the organization, a chain of custody form will accompany the sample for tracking purposes. Secure storage will be provided for archived samples.
5.8.2.6 Control of Consumables
In order to ensure the quality of data obtained from FSS surveys and samples, new sample containers will be used for each sample taken. Tools used to collect samples will be cleaned to remove contamination prior to taking additional samples. Tools will be decontaminated after each sample collection and surveyed for contamination.
5.8.2.7 Control of Vendor-Supplied Services
Vendor-supplied services, such as instrument calibration and laboratory sample analysis, will be procured from appropriate vendors in accordance with approved quality and procurement procedures.
5.8.2.8 Database Control
Software used for data reduction, storage or evaluation will be fully documented. The software will be tested prior to use by an appropriate test data set.
5.8.2.9 Data Management
Survey data control from the time of collection through evaluation is specified by procedure. Manual data entries will be secondarily verified.

Rancho Seco License Termination Plan Revision 1 Chapter 5, Final Status Survey Plan May 2008
Page 5-59
5.8.3 Assessment and Oversight
5.8.3.1 Assessments
QC will perform assessments of FSS activities in accordance with the Quality Assurance Program. The findings will be tracked and trended in accordance with existing procedures.
5.8.3.2 Independent Review of Survey Results
Randomly selected survey packages (approximately 5%) from survey units will be independently reviewed by the Quality Assurance personnel to ensure that the survey measurements have been taken and documented in accordance with approved procedures.
5.8.3.3 Corrective Action Process
The corrective action process, already established as part of the site’s 10 CFR Part 50 Appendix B Quality Assurance Program, will be applied to FSS for the documentation, evaluation, and implementation of corrective actions. The process will be conducted in accordance with approved procedures which describe the methods used to initiate potential deviation from quality (PDQ) reports and resolve self assessment and corrective action issues related to FSS. The PDQ evaluation effort is commensurate with the classification of the PDQ and could include root cause determination, extent of condition reviews, and preventive and remedial actions.
5.8.3.4 Reports to Management
Reports of audits and trend data will be reported to management in accordance with approved procedures.
5.8.4 Data Validation and Verification
Survey data will be reviewed prior to evaluation or analysis for completeness and for the presence of outliers. Comparisons to investigation levels will be made and measurements exceeding the investigation levels will be evaluated. Procedurally verified data will be subjected to the Sign test, the Unity Sign test, the WRS test, or WRS Unity test as appropriate. Technical evaluations or calculations used to support the development of DCGLs will be independently verified to ensure correctness of the method and the quality of data.
5.8.5 Confirmatory Measurements
The NRC may take confirmatory measurements to make a determination in accordance with 10 CFR 50.82(a)(11) that the FSS and associated documentation demonstrate the site is suitable for release in accordance with the criteria for decommissioning in 10 CFR Part 20, subpart E. Confirmatory measurements may include collecting radiological measurements for the purpose of confirming and verifying compliance with NRC standards for unrestricted license termination. Timely and frequent communications with the NRC will ensure it is afforded sufficient opportunity for these confirmatory measurements prior to implementing any irreversible decommissioning actions.

Rancho Seco License Termination Plan Revision 1 Chapter 5, Final Status Survey Plan May 2008
Page 5-60
Figure 5-1
FSS Process Overview
Develop DQOs Specify hypothesis
And error rates
Perform Readiness Surveys, as applicable
Remediation Required?
Perform Remediation
Yes Design Final Status Surveys
Yes No
Perform Surveys and sample analyses
Perform Data Evaluation Conduct statistical test and
EMC, as applicable
Do any of these tests
fail?
Perform Investigation As Required by Survey Unit
Class
Yes
Survey Unit Meets Release Criteria
Prepare FSS Report
Submit FSS Report to NRC for Acceptance
Review
No

Ran
cho
Seco
Lic
ense
Ter
min
atio
n Pl
an
R
evis
ion
1 C
hapt
er 5
, Fin
al S
tatu
s Sur
vey
Plan
May
200
8
Pa
ge 5
-61

Rancho Seco License Termination Plan Revision 1 Chapter 5, Final Status Survey Plan May 2008
Page 5-62
5.9 References
5-1 U.S. Nuclear Regulatory Commission NUREG–1757, Vol. 2, “Consolidated NMSS Decommissioning Guidance - Characterization, Survey, and Determination of Radiological Criteria, Final Report,” September 2003
5-2 U.S. Nuclear Regulatory Commission NUREG-1575, Revision 1, “Multi-Agency Radiation Survey and Site Investigation Manual (MARSSIM),” August 2000
5-3 U.S. Nuclear Regulatory Commission NUREG-1505, Revision 1, “A Nonparametric Statistical Methodology for the Design and Analysis of Final Status Decommissioning Surveys,” June 1998 draft
5-4 U.S. Nuclear Regulatory Commission NUREG-1507, “Minimum Detectable Concentrations With Typical Radiation Survey Instruments for Various Contaminants and Field Conditions,” June 1998
5-5 U.S. Nuclear Regulatory Commission NUREG-1700, Revision 1, “Standard Review Plan for Evaluating Nuclear Power Reactor License Termination Plans,” April 2003
5-6 U.S. Nuclear Regulatory Commission Regulatory Guide 1.179, “Standard Format and Content of License Termination Plans for Nuclear Power Reactors,” January 1999
5-7 U.S. Nuclear Regulatory Commission NUREG/CR-5512, Volume 1, Final Report, “Residual Radioactive Contamination from Decommissioning,” October 1992
5-8 Rancho Seco Decommissioning Technical Basis Document DTBD-06-002, Revision 0, “Use of a Survey Unit Size of 319 m2 for Class One Structure Surveys at Rancho Seco Nuclear Generating Station”
5-9 Rancho Seco Decommissioning Technical Basis Document DTBD-06-001, Revision 0, “RSNGS Initial Classification of Survey Areas and Survey Design Sigma Values”
5-10 Rancho Seco Decommissioning Technical Basis Document DTBD-06-003, Revision 0, “Use of In Situ Gamma Spectroscopy for Final Status Surveys”
5-11 Rancho Seco Decommissioning Technical Basis Document DTBD-05-010, Revision 0, “Beta Detection Including Beta Energy and Source Efficiency”
5-12 International Organization for Standardization, ISO 7503-1, “Evaluation of Surface Contamination - Part 1: Beta Emitters and Alpha Emitters (first edition),” 1988
5-13 Rancho Seco Decommissioning Technical Basis Document DTBD 05-012, Revision 0, “Eberline SPA-3 and Ludlum 44-10 Detector Sensitivity (MDC)”
5-14 Sacramento Municipal Utility District, Rancho Seco Quality Manual
5.9.1 Applicable Site Procedures For FSS
DSIP-0020 Characterization Survey Assessment
DSIP-0040 Survey Unit Remediation and ALARA Evaluation

Rancho Seco License Termination Plan Revision 1 Chapter 5, Final Status Survey Plan May 2008
Page 5-63
DSIP-0050 FSS Controls
DSIP-0060 Department Training and Qualification
DSIP-0100 Decommissioning Survey Design
DSIP-0101 Final Status Survey Package Design and Preparation
DSIP-0110 Decommissioning Survey Instruction for Structures, Systems, and Soils
DSIP-0120 FSS Data Processing and Reporting
DSIP-0130 Decommissioning Survey Background Reference Area Evaluations
DSIP-0200 Decommissioning Survey Quality Control
DSIP-0210 QC Verification Survey Design
DSIP-0220 QC Verification Survey Performance
DSIP-0300 Decommissioning Sampling and Controls-Solids
DSIP-0310 Surface Soil, Subsurface Soil and Other Bulk Media Sampling and Preparation
DSIP-0500 Instrumentation
DSIP-0510 Ludlum 2350 Operation
DSIP-0520 Ludlum 2350 Download Procedure
DSIP-0530 Operation of the ISOCS Portable Gamma Spectroscopy System
DSIP-0540 Operation of the Inspector 1000 NaI Spectrometer
QAIP-0601 Procedure Control
QAIP-1702 Records Management
RP.305 Radiation Protection Plan
RP.305.11 Radioactive Source Handling
RP.305.22 Departmental Training & Qualification
RP.311 Radiation Protection Instrument Control Program
RP.311.II.03 Ludlum 2350-1 Datalogger Calibration
RP.311.VI.01 RP Counting Statistics
RP.311.VI.02 Radiation Protection Instrument Checks
RP.311.VI.03 Counting Equipment Voltage Plateaus
RP.311.VII.02 Shepard Model 89 Cesium Calibrator
RP.311.VII.02 Verification/Certification of Gamma Calibrators
RSAP-0101 Nuclear Organization Responsibilities & Authorities
RSAP-0309 Vendor Documentation Requirements, Review, and Approval
RSAP-0409 Procurement Program for Defueled Plant
RSAP-0500 Review, Approval and Changes of Procedures
RSAP-0505 Document Control
RSAP-0506 Procedure Review

Rancho Seco License Termination Plan Revision 1 Chapter 5, Final Status Survey Plan May 2008
Page 5-64
RSAP-0601 Nuclear Records Management
RSAP-1101 ALARA Manual
RSAP-1204 Training Programs
RSAP-1301 Corrective Action Program
RSAP-1305 Corrective Action Request
RSAP-1308 Potential Deviation from Quality
RSAP-1310 Deviation from Quality
RSAP-1501 Controlled Software Change Request
RSAP-1702 Quality Assurance for Radiological Monitoring Programs
RSAP-1900 Control of Decommissioning Projects
RSAP-1901 Decommissioning Survey Program