Ramsay Health Care...2020/08/27 · Craig McNally, Managing Director & Chief Executive Officer...
29
ramsayhealth.com Craig McNally, Managing Director & Chief Executive Officer Martyn Roberts, Group Chief Financial Officer 27 August 2020 Ramsay Health Care Limited Results Briefing Year ended 30 June 2020 For personal use only
Transcript of Ramsay Health Care...2020/08/27 · Craig McNally, Managing Director & Chief Executive Officer...

ramsayhealth.com
Craig McNally, Managing Director & Chief Executive OfficerMartyn Roberts, Group Chief Financial Officer
27 August 2020
Ramsay Health Care Limited Results BriefingYear ended 30 June 2020
For
per
sona
l use
onl
y

The information in this presentation is general background information about Ramsay Health Care Limited and its subsidiaries(Ramsay Group) and their activities and is current as at 27 August 2020. It is in summary form and is not necessarily complete. Itshould be read together with the company’s consolidated financial statements lodged with the ASX on 27 August 2020 which are inthe process of being reviewed by the external auditor. The information in this presentation is general information only and is notintended to be relied upon as advice to investors or potential investors and does not take into account your objectives, financialsituation or needs. Investors should consult with their own legal, tax, business and/or financial advisers in connection with anyinvestment decision.
The information in this presentation is believed to be accurate at the time of compilation. Any views expressed in this presentationare opinions of the author at the time of presenting and do not constitute a recommendation to act. No person, including the RamsayGroup, has any responsibility to update any of the information provided in this presentation.
This presentation contains forward looking statements. These forward looking statements should not be relied upon as arepresentation or warranty, express or implied, as to future matters. Prospective financial information has been based on currentexpectations about future events and is, however, subject to risks, uncertainties, contingencies and assumptions that could causeactual results to differ materially from the expectations described in such prospective financial information. The Ramsay Groupundertakes no obligation to update any forward-looking statement to reflect events or circumstances after the date of thispresentation, subject to disclosure obligations under the applicable law and ASX listing rules.
Important information
Results Briefing - Year ended 30 June 20202
Ramsay Health Care LimitedLevel 18, 126 Phillip Street, Sydney NSW 2000The release of this announcement has been authorised by the Ramsay Health Care Board of Directors
For
per
sona
l use
onl
y

3 Results Briefing - Year ended 30 June 2020
Ramsay Health Care Response to COVID-19
People Caring for People
For
per
sona
l use
onl
y

4 Results Briefing - Year ended 30 June 2020
Ramsay Health Care Response to COVID-19
The period has been filled with numerous examples of our doctors and staff going above and beyond including:
• Caring for many thousands of COVID-19 patients around the globe – 7000 in France
• Assisting the NHS England by performing thousands of operations on behalf of the public sector while it focused on COVID-19
• Joondalup Health Campus in Perth - one of the first facilities in Australia to take large cohort of COVID-19 patients with no cross infection to staff or doctors
• In Victoria, our staff are playing a critical role caring for COVID-19 patients, undertaking urgent public surgery & delivering up to 60 shifts a day in affected nursing homes
• Patient & visitor screening; increased cleaning & visitor restrictions adopted early to ensure safety
Caring for our patients
For
per
sona
l use
onl
y

5 Results Briefing - Year ended 30 June 2020
Ramsay Health Care Response to COVID-19
• No employees were stood down because of the pandemic
• Stringent safety policies adopted early to limit transmission to our staff & doctors
• Wellbeing and employee assistance services and resources launched for our staff and doctors
• Frequent communication updates to staff and doctors
• Adopted virtual technology solutions early in the pandemic for improved communications
Caring for our employees & doctors
For
per
sona
l use
onl
y

Caring for our communities
6 Results Briefing - Year ended 30 June 2020
Ramsay Health Care Response to COVID-19
• Leading role in achieving government partnerships to assist with national COVID-19 response efforts
• Assisting local public hospitals/aged care with beds, ventilators and staff
• Contributions to local businesses impacted during the pandemicF
or p
erso
nal u
se o
nly

Leveraging Scale
7 Results Briefing - Year ended 30 June 2020
Ramsay Health Care Response to COVID-19
• Global supply chain management systems leveraged to limit shortfalls in supplies
• Our digital consultation platform, Capio-Flow, in Swedish Proximity Care business expanded threefold to over 33,000 consultations per month
• Agile technology projects that enabled quick response to COVID-19 e.g. mental health and antenatal care programs delivered virtually
• Mobile workforce
For
per
sona
l use
onl
y

Agenda
Group Performance Overview
Segment Performance
Group Financials
Outlook
Results Briefing - Year ended 30 June 20208
Strategy
For
per
sona
l use
onl
y

Group Performance Overview
For
per
sona
l use
onl
y

Group Financial Highlights FY’20Core NPAT down 43% to $336.9 millionOn a like for like basis, under the old Lease Accounting Standard (AASB 117 Leases), Core NPAT down 34.4% on the previous corresponding period
Statutory NPAT down 47.9% to $284mNo Final Dividend declared. Interim Dividend 62.5 cents fully franked
Core EPS down 44.5% to 155.9 centsOn a like for like basis, under the old Lease Accounting Standard (AASB 117 Leases), Core NPAT down 34.4% on the previous corresponding period
Group Revenue up 7.3% to $12.4 billion Core EBITDAR down 7.0% to $2.0 billion
United KingdomRevenue down 4.9% to £494.8 millionEBITDAR down 10.6% to £89.2 million
Continental EuropeRevenue up 14.3% to €3.9 billionEBITDAR up 8.5% to €641.1 million
Australia/AsiaAustralia Revenue down 2.2% to $5.1 billionAustralia EBITDAR down 23.2% to $781.3 millionEquity accounted share of Asia JV net profits down 18.2% to $15.9 million
For
per
sona
l use
onl
y

Segment Summary
For
per
sona
l use
onl
y

Australia
12 Results Briefing - Year ended 30 June 2020
Perf
orm
ance
FY’
20
• Ramsay Australia was on track to meet full year targets as at end Feb 2020but significantly impacted by elective surgery restrictions from March 2020
• Government agreements ran through to 30 June when most agreements werepaused or terminated and Ramsay ceased drawing down on viability payment
• Business was broadly breakeven at the EBIT level for March to June 2020• Early response to COVID-19 crisis ensured access to PPE, communications,
screening and safety policy and processes were in place• NPS for FY’20 was 75 (up from 73 in FY’19). In Q4 we recorded our highest
NPS ever of 77.8• Zero sentinel events recorded in FY’20• Ramsay/Remedy ‘hospital in the home’ JV launched – Ramsay Connect
Out
look
FY’
21
• YTD surgical activity above last year outside of Victoria• Increased costs associated with PPE, screening and cleaning• Elective surgery restrictions reintroduced on 22 July in Victoria will impact Q1
results and potentially beyond – Victorian agreement restarted 23 July• Many uncertainties remain with respect to the extent of the impact of the
pandemic and the broader recovery of the economy• Stronger relationships with public sector herald opportunities for the future
5,182.5 5,068.0
1,016.8 781.3
FY2019 FY2020
Revenue ($m) EBITDAR ($m)
- 23.2%
- 2.2%
For
per
sona
l use
onl
y
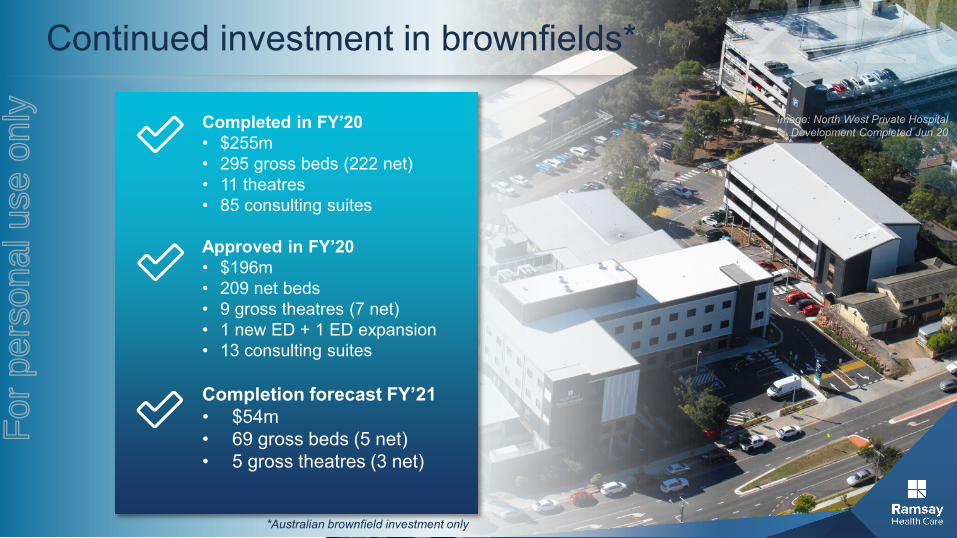
Continued investment in brownfields*
Completed in FY’20• $255m• 295 gross beds (222 net)• 11 theatres• 85 consulting suites
Approved in FY’20• $196m• 209 net beds• 9 gross theatres (7 net)• 1 new ED + 1 ED expansion• 13 consulting suites
Completion forecast FY’21• $54m• 69 gross beds (5 net)• 5 gross theatres (3 net)
*Australian brownfield investment only
For
per
sona
l use
onl
y

Continental Europe
14 Results Briefing - Year ended 30 June 2020
Perf
orm
ance
FY’
20
• Ramsay Santé was on track to meet targets as at February 2020• Activity in Q4 was adversely impacted by COVID-19• The French government decreed a revenue guarantee for the private
hospital sector (Mar – Dec 20)• Our facilities in France, Italy and Sweden cared for over 7000
COVID-19 patients during the height of the pandemic• Strong endorsement by governments of the support provided by
Ramsay Santé in France and Sweden during the crisis
Out
look
FY’
21
• Surgical activity in France and the Nordics has been ramping upsince June
• French government has announced new funding for healthcaresector which includes salary increase and wage scale review - tocommence 1 Sept 2020. Government has committed to funding theseincreases for the private sector
• Uncertainties remain with respect to the duration of the pandemic andthe revenue guarantee
• Identified synergies from integration of Capio will be achieved oncenormal activity resumes
1,934.5 1,952.7
3,887.23,401.1
319.1 322.0641.1 590.9
1st Half 2nd Half FY2020 FY2019
Revenue (€m) EBITDAR (€m)
8.5%
14.3%
44.3%
38.0%
-5.3%
-10.5%
For
per
sona
l use
onl
y

United Kingdom
15 Results Briefing - Year ended 30 June 2020
Perf
orm
ance
FY’
20 • Strong performance to February 2020 – heavily impacted by COVID-19from March 2020
• Ramsay UK’s 33 surgical hospitals were made available to the nationaleffort - performed 13,000 urgent operations
• Ramsay UK received net cost recovery resulting in a broadly breakevenresult at the EBIT level for March to June 2020
Out
look
FY’
21 • During COVID-19 Ramsay UK strengthened NHS relationships andexpanded its capabilities in new service areas including cancer
• Significant waiting lists in the NHS – predicted 10 million by Dec 20• Ramsay UK will participate in contract tender launched by NHS recently to
identify operators to assist with reducing waiting lists (2+2 years)• Uncertainties remain in relation to the pandemic and the duration of the
current NHS agreement which remains on foot with possible December2020 end date
520.2 494.8
99.8 89.2
FY2019 FY2020
Revenue (£m) EBITDAR (£m)
- 10.6%
- 4.9%
For
per
sona
l use
onl
y

Asia
16 Results Briefing - Year ended 30 June 2020
Perf
orm
ance
FY’2
0
• No restrictions imposed on elective surgery during pandemic, howevermovement control orders impacted patient volumes
• Hundreds of COVID-19 patients treated in our Asian facilities,particularly in Indonesia
• No Government viability guarantees were available in Malaysia orIndonesia and employer economic impact support from bothgovernments was minimal.
Out
look
FY’
21
• Most specialties starting to see patient volumes gradually increase
19.4
15.9
FY2019 FY2020
Equity Accounted Share of NetProfit of Joint Venture ($m)
- 18.2%
For
per
sona
l use
onl
y

Group Financials
For
per
sona
l use
onl
y

GROUP PERFORMANCE FY’20
18
New Lease Standard (AASB16 Leases) Old Lease Standard (AASB117 Leases) Impact
Year ended 30 June 2020$m
(1) AASB16Leases
2019$m
(2) AASB117Leases
Inc/(Dec)%
2020$m
(2) AASB117Leases
2019$m
(2) AASB117Leases
Inc/(Dec)%
2020$m
(1) AASB16Leases
Operating Revenue 12,395.5 11,552.8 7.3% 12,395.5 11,552.8 7.3%
EBITDAR 2,009.7 2,161.0 (7.0)% 2,009.7 2,161.0 (7.0)%
Rent and Operating Lease expense 165.8 569.0 (70.9)% 651.8 569.0 14.5% (486.0)
EBITDA 1,843.9 1,592.1 15.8% 1,357.9 1,592.1 (14.7)%
Depreciation 891.7 484.1 84.2% 545.9 484.1 12.9% 345.8
EBIT 952.3 1,108.0 (14.1)% 812.0 1,108.0 (26.7)%
Interest 411.3 169.2 143.1% 179.6 169.2 6.1% 231.7
Core NPAT attributable to members of the parent (3) 336.9 590.9 (43.0)% 387.7 590.9 (34.4)%
Statutory NPAT 284.0 545.5 (47.9%) 327.1 545.5 (40.0%)
Core EPS (4) (cents per share) 155.9 281.0 (44.5)% 180.2 281.0 (35.9)%
Interim Dividend – fully franked (cents per share) 62.5 60.0 4.2% 62.5 60.0 4.2%
Final Dividend – fully franked (cents per share) - 91.5 - - 91.5 -
Full-year Dividend – fully franked (cents per share) 62.5 151.5 (58.7)% 62.5 151.5 (58.7)%
Notes: All numbers are in Australian dollars unless otherwise stated(1) The FY20 results include the impact of AASB16 Leases, while the FY19 period results were prepared under the previous lease accounting requirements (AASB117 Leases). Refer to the Overview section of the Appendix 4E for further information.(2) The FY20 results and the FY19 period results have been prepared on a like for like basis under the previous lease accounting requirements (AASB117 Leases)(3) Core NPAT attributable to members of the parent is before non-core items. The minority interest share of Ramsay Sante' Core NPAT has been removed in arriving at Core NPAT attributable to members of the parent.(4) Core EPS is derived from core net profit after CARES dividends.
Results Briefing - Year ended 30 June 2020
For
per
sona
l use
onl
y

Capital Employed
Results Briefing - Year ended 30 June 202019
Capital employed increased by $4.5 billion following the adoption of AASB16ROCE reduced due to the reduction in EBIT in FY’20 and the acquisition of Capio in FY19
• Working capital decreased due to revenue guarantee payments received in France being in excess of revenue guarantee accruals recognised in the period
• Property, plant & eqpt reduced due to a $368m transfer to right of use asset
• Other assets / (liabilities) has increased due to the derecognition of the previously held deferred lease provision of $294m (AASB16 related)
• ROCE to become an increased focus in future years with disciplined allocation of capital
ROCE = EBIT / average of opening and closing capital employed
A$M 2020 2019 VarWorking capital (875) (440) (435)Property, plant & equipment 4,447 4,643 (196)Intangible assets 4,246 4,263 (17)Current & deferred tax assets 144 16 128 Other assets / (liabilities) (140) (547) 407
7,822 7,935 (113)
Right of use assets 4,478 - 4,478
12,300 7,935 4,365
10.4% 16.3% (5.9) ppts
9.4% 16.3% (6.9) ppts
Capital employed (before right of use assets)
Capital employed
Core Return on Capital Employed (ROCE) (before lease accounting changes)
Core Return on Capital Employed (ROCE)
For
per
sona
l use
onl
y

Cash Flow
Results Briefing - Year ended 30 June 202020
Government guarantee programs assisted operating cashflows (particularly in France)A$1.5 billion equity raising has strengthened the balance sheet and enhanced financial flexibility
• 2020 under AASB16. 2019 under AASB117• 2019 EBITDA includes rent & operating
leases • 2020 finance costs include interest
associated with capitalised leases under AASB16.
• Positive working capital impact from revenue guarantee payments received in France being in excess of revenue guarantee accruals recognised in the period
• Major acquisition in 2019 of Capio• $1.5bn proceeds from 2020 equity raising
has been partially used to pay down debt
A$M 2020 2019 VarCore EBITDA 1,844 1,592 252
Changes in working capital 435 99 336 Finance costs (419) (159) (260)Income tax paid (203) (253) 50 Movement in other items 24 (376) 400
Operating cash flow 1,681 903 778 Capital expenditure (681) (594) (87)
Free cash flow 1,000 309 691 Net acquisitions (22) (1,168) 1,146 Interest & dividends received 47 9 38
Cashflow after investing activities 1,025 (850) 1,875 Dividends paid (335) (321) (14)Other financing cashflows (1,364) 759 (2,123)Net shares issued 1,467 375 1,092
Net increase / (decrease) in cash 793 (37) 830
For
per
sona
l use
onl
y
Leverage and Capital Management
21 Results Briefing - Year ended 30 June 2020
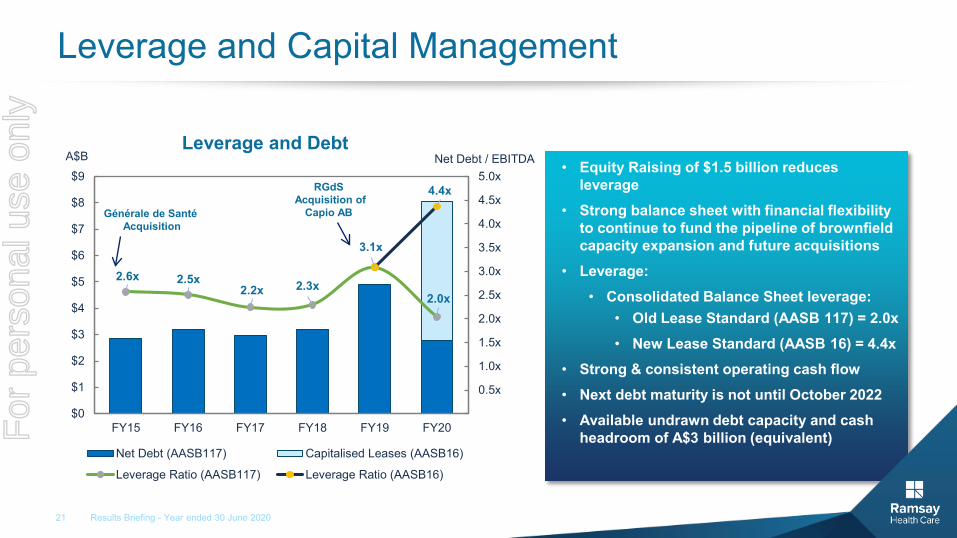
2.6x 2.5x2.2x 2.3x
3.1x
2.0x
4.4x
0.5x
1.0x
1.5x
2.0x
2.5x
3.0x
3.5x
4.0x
4.5x
5.0x
$0
$1
$2
$3
$4
$5
$6
$7
$8
$9
FY15 FY16 FY17 FY18 FY19 FY20
Leverage and Debt
Net Debt (AASB117) Capitalised Leases (AASB16)
Leverage Ratio (AASB117) Leverage Ratio (AASB16)
• Equity Raising of $1.5 billion reduces leverage
• Strong balance sheet with financial flexibility to continue to fund the pipeline of brownfield capacity expansion and future acquisitions
• Leverage:• Consolidated Balance Sheet leverage:
• Old Lease Standard (AASB 117) = 2.0x• New Lease Standard (AASB 16) = 4.4x
• Strong & consistent operating cash flow• Next debt maturity is not until October 2022• Available undrawn debt capacity and cash
headroom of A$3 billion (equivalent)
Générale de SantéAcquisition
RGdSAcquisition of
Capio AB
A$B Net Debt / EBITDA
For
per
sona
l use
onl
y

Strategy
For
per
sona
l use
onl
y

Driving stronger growth from the core
Organic Growth
Brownfield Capacity
Public/Private Collaboration
Strengthening the core
Operational Excellence
Digitalisation
Global Procurement
Building a more sustainable organisation
Patient & Doctor Experience
Clinical Excellence
Innovation
Global Talent
Our strong balance sheet supports our future growth strategy
Group Strategy
…while behaving in accordance with the Ramsay Way
‘People caring for People’
Growth Efficiency Sustainability
Developing new growth platforms
Acquisitions
Integrated Care
New Models of Care
23 Results Briefing - Year ended 30 June 2018
For
per
sona
l use
onl
y

Outlook
For
per
sona
l use
onl
y

• Ramsay’s pandemic response demonstrates sustainability of the Company• Many uncertainties remain with respect to the impact of the pandemic• As a result, Ramsay is unable to provide guidance for FY’21• Notwithstanding the significant near term uncertainties, over the longer term, strong
industry fundamentals remain. • Given the large backlog of patients awaiting surgery, we look forward to playing an
enhanced role in assisting to relieve pressure on public waiting lists into the future. • Following our recent $1.5 billion equity raising, Ramsay is committed to expanding our
business both in Australia and overseas. We have a strong balance sheet to support this growth strategy.
Outlook
Results Briefing - Year ended 30 June 202025
For
per
sona
l use
onl
y

Questions
For
per
sona
l use
onl
y

Appendix
For
per
sona
l use
onl
y

Results Briefing - Year ended 30 June 202028
Partnerships with governmentRamsay made its facilities and capabilities available to support public health systems in the global response to COVID-19. In return, governments
contributed to the overall viability of the sector, including Ramsay, through contractual or legislative support.
Australia United Kingdom France• Federal Government executed a contract with each State
and Territory Government to guarantee the viability of the private hospital sector during the COVID-19 pandemic
• Ramsay entered into agreements with the State Governments of NSW, WA, Queensland and Victoria, which commenced from either 31 March or 1 April 2020
• Ramsay entered into an agreement with NHS England with effect from 23 March 2020 to make the UK facilities and services available to the NHS and its patients
• Ramsay received cost recovery for its services, including operating costs, overheads, use of assets, rent and interest less a deduction for any private urgent elective care provided
• Decree issued on 7 May 2020, which provides a guarantee of revenue from 1 March 2020 to 31 December 2020, equal to 10/12th of the 2019 calendar year revenue from the government, with some small indexation factor
• Ramsay received net recoverable costs (being agreed recoverable costs less any revenue generated from operations, calculated on an accrual basis)
• The principle of cost recovery implied that no profit would be made for the period the agreements are on foot, even if elective surgery resumed during this period
• Ramsay commits to maintain full workforce capacity at the facilities
• Vic and Qld include a “Pause and Restart” mechanism whereby the State can put the agreement on pause
• The basis of the agreement is cost recovery, i.e. no profit will be made for the period the agreement is on foot, even if elective surgery resumes during this period
• The NHS pays Ramsay weekly in advance based on approved budget
• Should the actual billings over this March to December period fall below the guaranteed revenue, then Ramsay Santé is entitled to the shortfall
• The revenue guarantee applies to the March-December 2020 period as a whole facility by facility
• Social Security pays Ramsay Santé a monthly cash advance
• A final square-up of the revenue and cash advances will be performed in March 2021 on a site by site basis
• The Queensland agreement is currently on pause• The WA agreement was terminated with effect from 30
June 2020. However, it was varied to include a right for the WA Department of Health to direct Ramsay for a 12 month period from 30 June 2020 to sign a new agreement on the same terms as the original agreement in order to respond to the COVID-19 pandemic
• The Victorian agreement restarted on 23 July 2020
• The Agreement continues on a rolling basis terminable by NHS England on one month’s notice.
• Negotiations on foot with NHS England to extend and vary the agreement with a possible December 2020 end date
• Arrangement legislated to remain in place until 31 December 2020
Overview
Terms
Duration & StatusF
or p
erso
nal u
se o
nly

Contact UsFor further information:
Media Investor RelationsCarmel Monaghan Kelly HibbinsPhone: +61 29220 1010 Phone: +61 2 9220 [email protected] [email protected]
Group Chief Financial OfficerMartyn Roberts
Phone: +61 29220 [email protected]
For
per
sona
l use
onl
y