RampRate_Green_Data Centers_v1 1
21
Confidential © 2007 RampRate™ Slide 1 Data Center Optimization – Data Center Optimization – A Green Path to Efficiency A Green Path to Efficiency Achieving Measurable Environmental Impact While Managing Data Center Costs Tony Greenberg, CEO Tuesday, February 26, 2008
-
Upload
datacenters -
Category
Business
-
view
180 -
download
0
Transcript of RampRate_Green_Data Centers_v1 1
Confidential © 2007 RampRate™ Slide 1
Data Center Optimization – Data Center Optimization – A Green Path to EfficiencyA Green Path to Efficiency
Achieving Measurable Environmental Impact While Managing Data Center Costs
Tony Greenberg, CEO
Tuesday, February 26, 2008
Confidential © 2007 RampRate™ Slide 2
AgendaAgenda
1. Who Is RampRate
2. RampRate’s Commitment to Green Data Centers
3. 4 Steps Currently Being Implemented With Peers
4. Case Studies / Success Metrics
5. 4 Additional Activities Being Developed / Pursued
6. Potential Ways of Working Together
7. Q&A

Confidential © 2007 RampRate™ Slide 3
Who Is RampRate
RampRate is a trusted advisor to Business Leaders, CIOs, CTOs, and CFOs to evaluate, procure, benchmark, and manage outsourced IT services
RampRate also provides strategic business planning analysis and research for Fortune 2000 companies on digital media, industry and technology trends, and
other critical areas of IT
Confidential © 2007 RampRate™ Slide 4
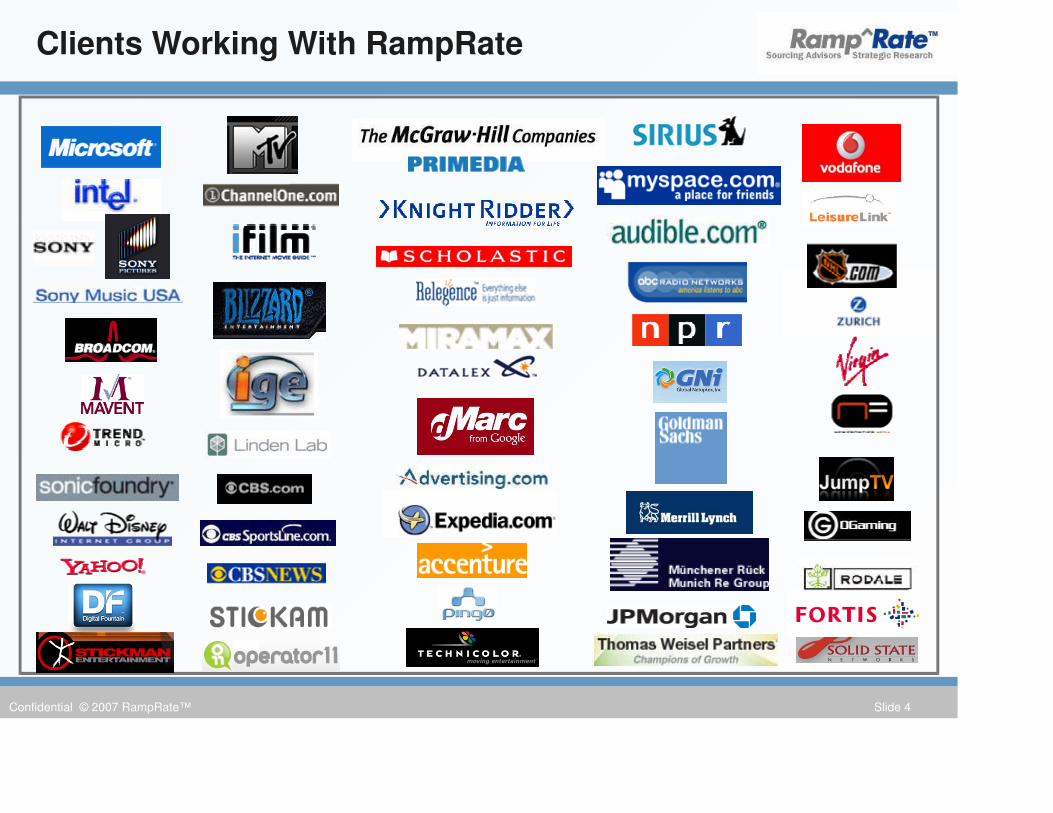
Clients Working With RampRate
Confidential © 2007 RampRate™ Slide 5
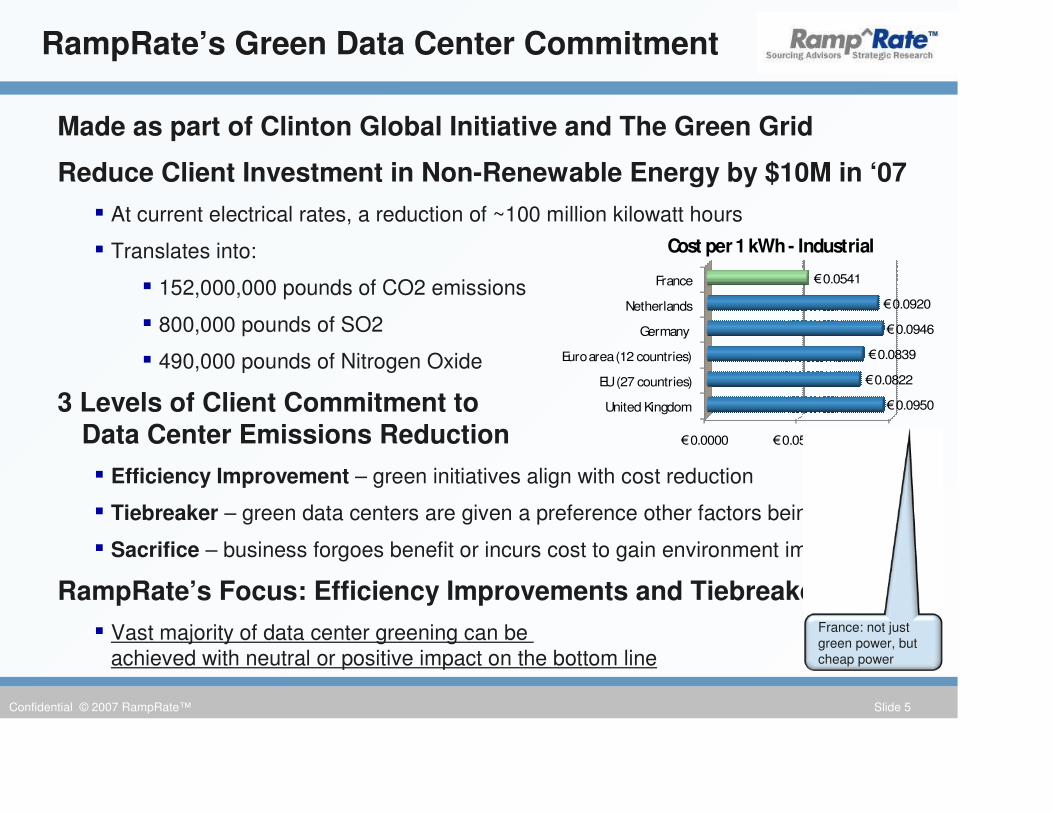
Made as part of Clinton Global Initiative and The Green Grid
Reduce Client Investment in Non-Renewable Energy by $10M in ‘07
� At current electrical rates, a reduction of ~100 million kilowatt hours
� Translates into:
� 152,000,000 pounds of CO2 emissions
� 800,000 pounds of SO2
� 490,000 pounds of Nitrogen Oxide
3 Levels of Client Commitment to Data Center Emissions Reduction
� Efficiency Improvement – green initiatives align with cost reduction
� Tiebreaker – green data centers are given a preference other factors being equal
� Sacrifice – business forgoes benefit or incurs cost to gain environment impact
RampRate’s Focus: Efficiency Improvements and Tiebreakers
� Vast majority of data center greening can be achieved with neutral or positive impact on the bottom line
RampRate’s Green Data Center Commitment
€0.0000 €0.0500 €0.1000
United Kingdom
EU (27 countries)
Euro area (12 countries)
Germany
Netherlands
France
€0.0950
€0.0822
€0.0839
€0.0946
€0.0920
€0.0541
Cost per 1 kWh - Industrial
France: not just green power, but cheap power
Confidential © 2007 RampRate™ Slide 6
IT hardware efficiency
� Which servers are used? Are they the right fit for the business task?
� Consolidation / upgrades of servers to blades, dual core, DC-powered systems
� Virtualization to reduce power-intensive resource utilization such as CPU and I/O
Data center infrastructure efficiency
� Is the UPS and HVAC equipment sized right for current / upcoming needs?
� Is Tier 4 (2N+2) redundancy really needed in all the data centers?
� Are business users encouraged to monitor and manage power consumption?
Geographic efficiency
� Is the data center located in a geography with low HVAC costs and renewable power
Data center vendor tiebreakers
� Is the vendor on an environmentally friendly grid?
� Does the vendor use geothermal heat exchange or similar for cooling?
� Does the vendor use renewable energy for backup power?
4 Current Paths Being Implemented with Peers
Confidential © 2007 RampRate™ Slide 7
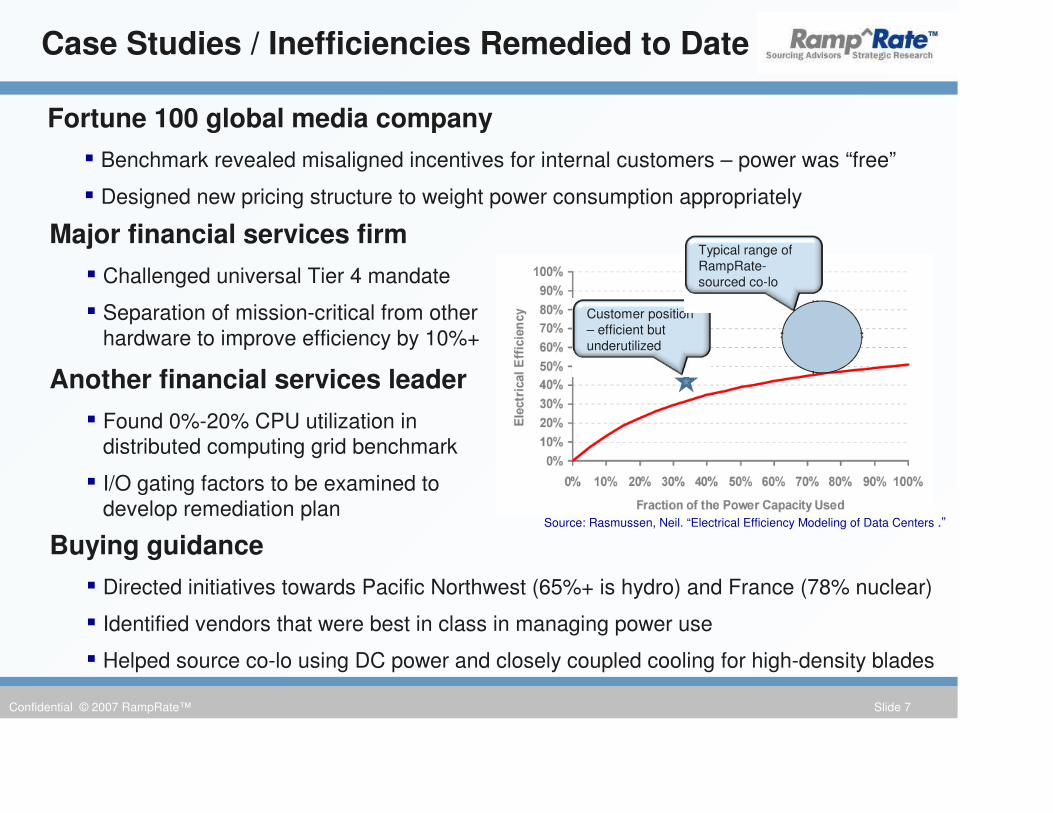
Fortune 100 global media company
� Benchmark revealed misaligned incentives for internal customers – power was “free”
� Designed new pricing structure to weight power consumption appropriately
Case Studies / Inefficiencies Remedied to Date
Major financial services firm
� Challenged universal Tier 4 mandate
� Separation of mission-critical from other hardware to improve efficiency by 10%+
Another financial services leader
� Found 0%-20% CPU utilization in distributed computing grid benchmark
� I/O gating factors to be examined to develop remediation plan
Source: Rasmussen, Neil. “Electrical Efficiency Modeling of Data Centers .”
Customer position – efficient but underutilized
Buying guidance
� Directed initiatives towards Pacific Northwest (65%+ is hydro) and France (78% nuclear)
� Identified vendors that were best in class in managing power use
� Helped source co-lo using DC power and closely coupled cooling for high-density blades
Typical range of RampRate-sourced co-lo
Confidential © 2007 RampRate™ Slide 8
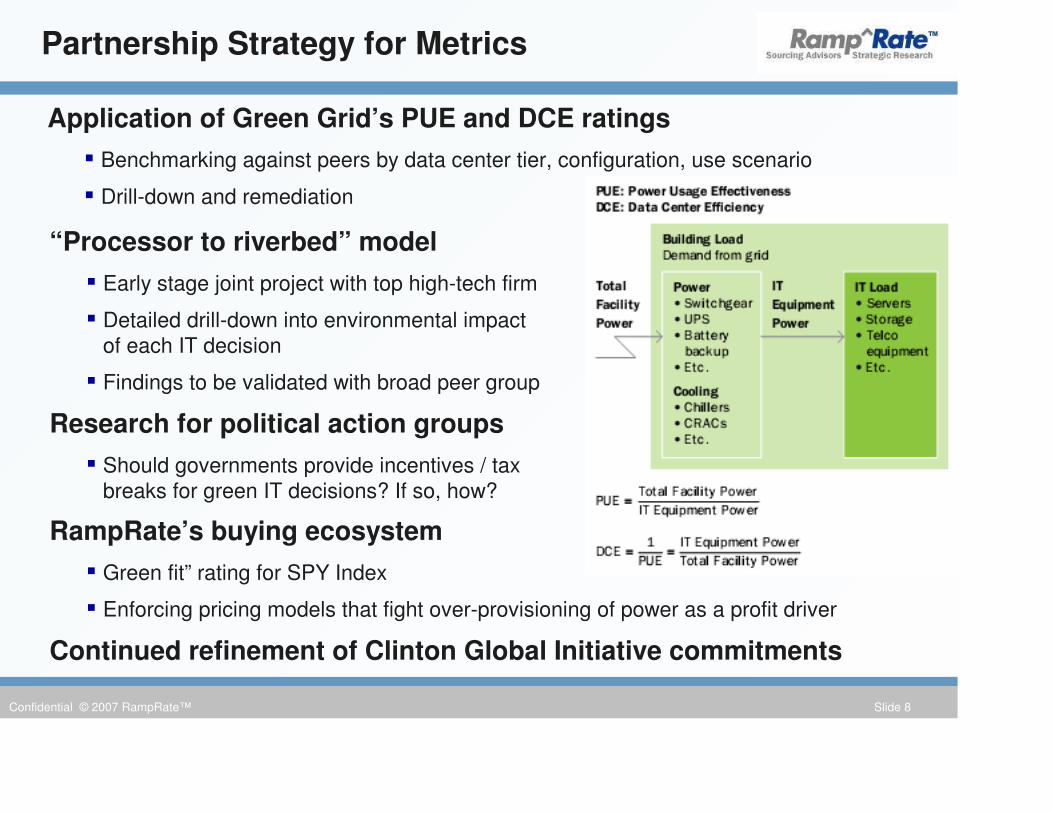
Application of Green Grid’s PUE and DCE ratings
� Benchmarking against peers by data center tier, configuration, use scenario
� Drill-down and remediation
Partnership Strategy for Metrics
“Processor to riverbed” model
� Early stage joint project with top high-tech firm
� Detailed drill-down into environmental impact of each IT decision
� Findings to be validated with broad peer group
Research for political action groups
� Should governments provide incentives / tax breaks for green IT decisions? If so, how?
RampRate’s buying ecosystem
� Green fit” rating for SPY Index
� Enforcing pricing models that fight over-provisioning of power as a profit driver
Continued refinement of Clinton Global Initiative commitments
Confidential © 2007 RampRate™ Slide 9
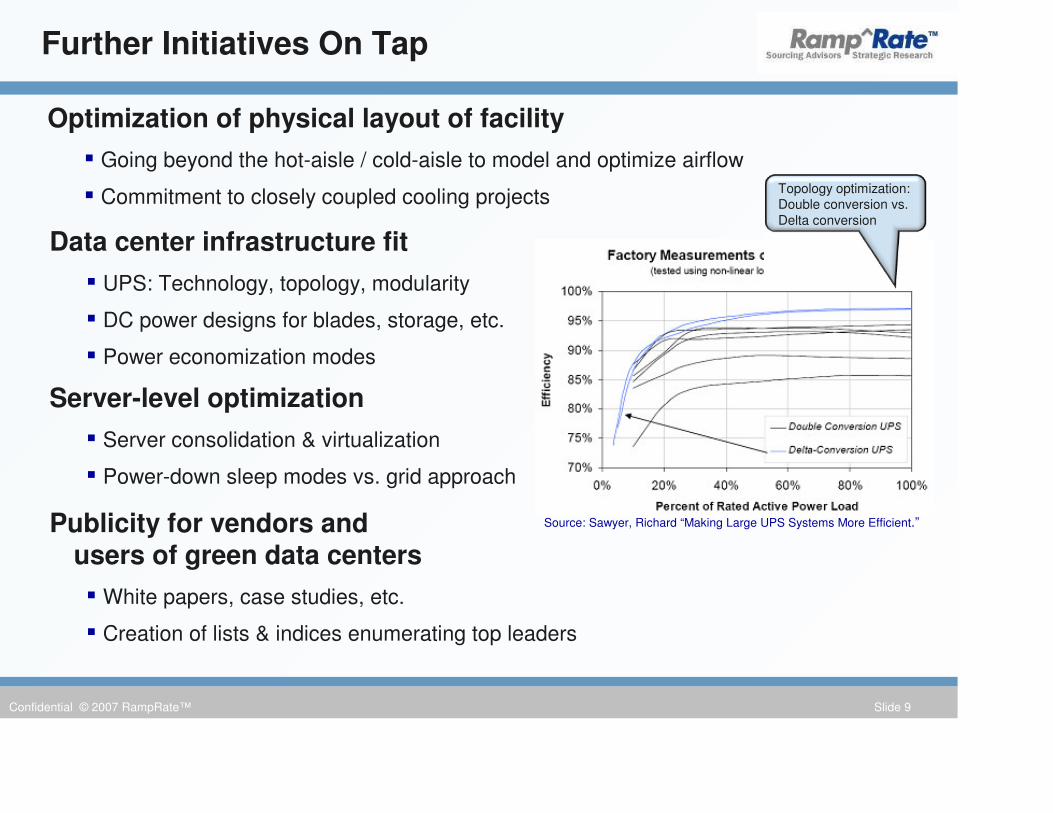
Optimization of physical layout of facility
� Going beyond the hot-aisle / cold-aisle to model and optimize airflow
� Commitment to closely coupled cooling projects
Further Initiatives On Tap
Data center infrastructure fit
� UPS: Technology, topology, modularity
� DC power designs for blades, storage, etc.
� Power economization modes
Server-level optimization
� Server consolidation & virtualization
� Power-down sleep modes vs. grid approach
Source: Sawyer, Richard “Making Large UPS Systems More Efficient.”Publicity for vendors and users of green data centers
� White papers, case studies, etc.
� Creation of lists & indices enumerating top leaders
Topology optimization: Double conversion vs. Delta conversion
Confidential © 2007 RampRate™ Slide 10
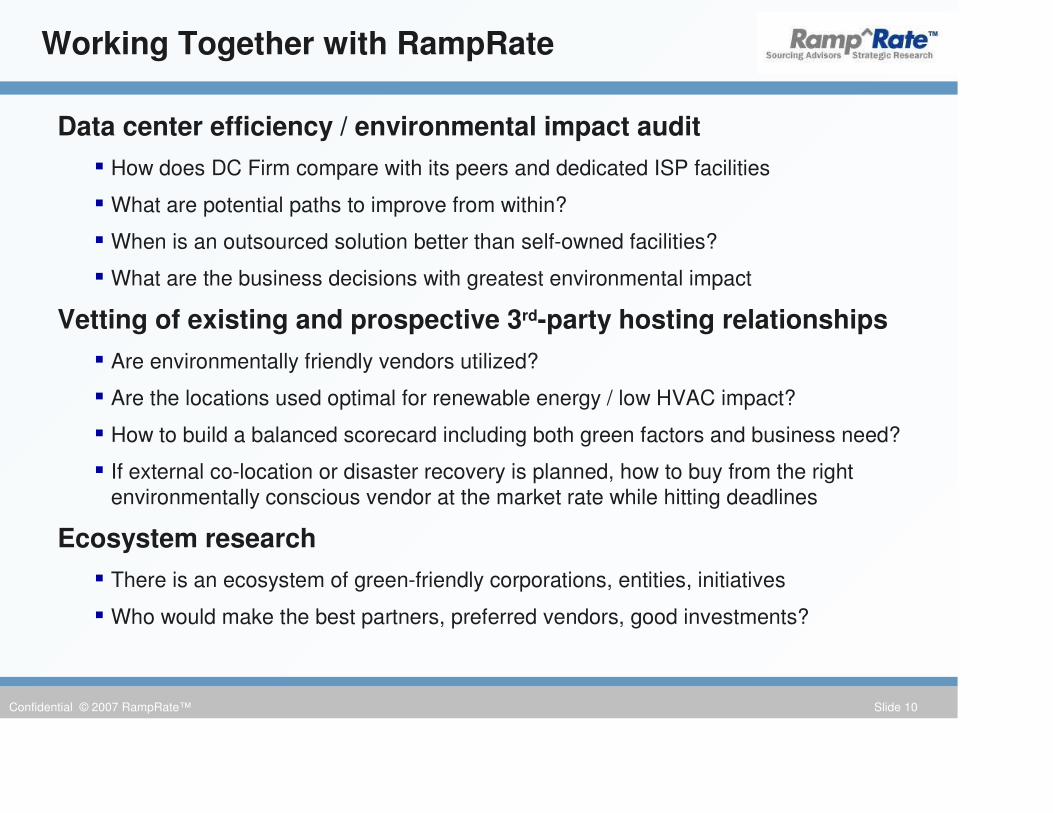
Data center efficiency / environmental impact audit
� How does DC Firm compare with its peers and dedicated ISP facilities
� What are potential paths to improve from within?
� When is an outsourced solution better than self-owned facilities?
� What are the business decisions with greatest environmental impact
Vetting of existing and prospective 3rd-party hosting relationships
� Are environmentally friendly vendors utilized?
� Are the locations used optimal for renewable energy / low HVAC impact?
� How to build a balanced scorecard including both green factors and business need?
� If external co-location or disaster recovery is planned, how to buy from the right environmentally conscious vendor at the market rate while hitting deadlines
Ecosystem research
� There is an ecosystem of green-friendly corporations, entities, initiatives
� Who would make the best partners, preferred vendors, good investments?
Working Together with RampRate
Confidential © 2007 RampRate™ Slide 11
Contact Information
Alex VeytselPrincipal [email protected] (617) 417-2647
Tony GreenbergChief Executive [email protected](310) 985-8669
Michael HochChief Strategy [email protected](917) 453-8464
Confidential © 2007 RampRate™ Slide 12
More on RampRateMore on RampRate
Confidential © 2007 RampRate™ Slide 13
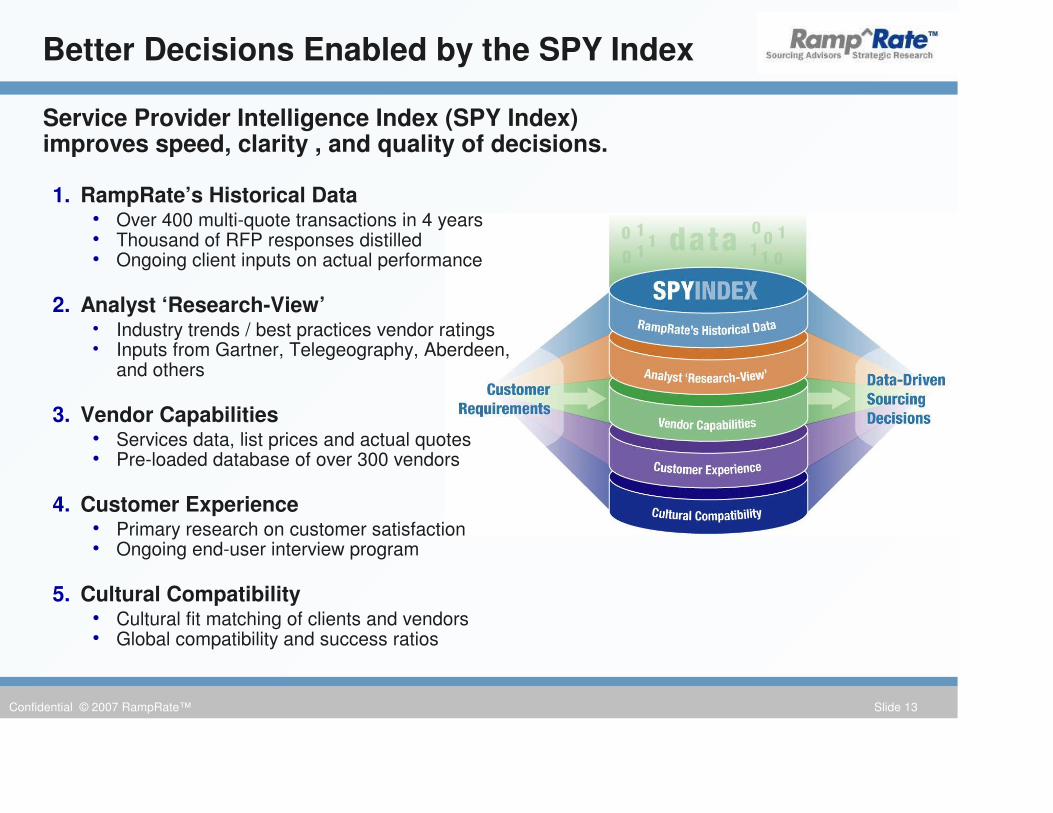
Better Decisions Enabled by the SPY Index
1. RampRate’s Historical Data• Over 400 multi-quote transactions in 4 years• Thousand of RFP responses distilled• Ongoing client inputs on actual performance
2. Analyst ‘Research-View’ • Industry trends / best practices vendor ratings• Inputs from Gartner, Telegeography, Aberdeen,
and others
3. Vendor Capabilities• Services data, list prices and actual quotes• Pre-loaded database of over 300 vendors
4. Customer Experience• Primary research on customer satisfaction• Ongoing end-user interview program
5. Cultural Compatibility• Cultural fit matching of clients and vendors• Global compatibility and success ratios
Service Provider Intelligence Index (SPY Index) improves speed, clarity , and quality of decisions.

Confidential © 2007 RampRate™ Slide 14
RampRate Services
� Data driven business planning� Performance benchmark — top-down audit or bottom-up validation of current budgets / contracts
� Customizable planning tools – dynamic analysis models and written reports covering:� Financial planning – revenue, cost, market size, market share, risk quantification
� Growth planning – ecosystem studies of customers, partners, competitors, prospective acquisitions
� Product / service planning – customer satisfaction, feature / function requests
� Concise market intelligence — brief market summaries and consulting sessions for investors
� Accelerated IT services procurement� Full ecosystem — cost / risk reduction in record time, with minimal internal time spent
� Deal engine — streamline the procurement process and leave clear audit trail for management
� SPY Index review — identify hard-to-find targets and improve due diligence in key service areas
� Continuous deal optimization� Pre-signing optimization — build a contract for future flexibility and risk mitigation
� Exception-based optimization — use RampRate’s leverage in other transactions and ability to escalate issues to ensure fair dealing on both sides
� Ongoing optimization — pre-agreed arrangements to reset terms based on RampRate benchmarks at regular intervals and continuously monitor service performance
� Ad-hoc consulting� SWAT team for emergencies — neutral intermediary in disputes; staff augmentation in shortages
� Topic expertise – vertical (rich media / digital content) and technology (co-lo / hosting, CDN, etc.)
Confidential © 2007 RampRate™ Slide 15
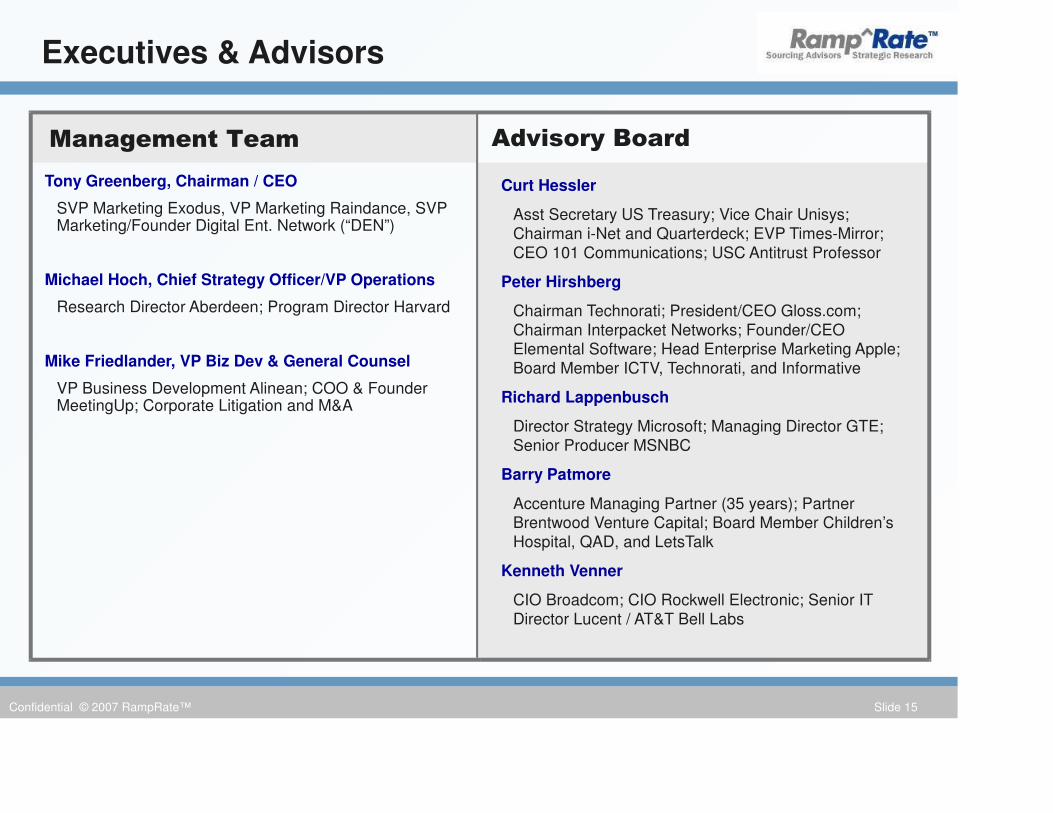
Executives & Advisors
Tony Greenberg, Chairman / CEO
SVP Marketing Exodus, VP Marketing Raindance, SVP Marketing/Founder Digital Ent. Network (“DEN”)
Michael Hoch, Chief Strategy Officer/VP Operations
Research Director Aberdeen; Program Director Harvard
Mike Friedlander, VP Biz Dev & General Counsel
VP Business Development Alinean; COO & Founder MeetingUp; Corporate Litigation and M&A
Curt Hessler
Asst Secretary US Treasury; Vice Chair Unisys; Chairman i-Net and Quarterdeck; EVP Times-Mirror; CEO 101 Communications; USC Antitrust Professor
Peter Hirshberg
Chairman Technorati; President/CEO Gloss.com; Chairman Interpacket Networks; Founder/CEO Elemental Software; Head Enterprise Marketing Apple; Board Member ICTV, Technorati, and Informative
Richard Lappenbusch
Director Strategy Microsoft; Managing Director GTE; Senior Producer MSNBC
Barry Patmore
Accenture Managing Partner (35 years); Partner Brentwood Venture Capital; Board Member Children’s Hospital, QAD, and LetsTalk
Kenneth Venner
CIO Broadcom; CIO Rockwell Electronic; Senior IT Director Lucent / AT&T Bell Labs
Management Team Advisory Board
Confidential © 2007 RampRate™ Slide 16
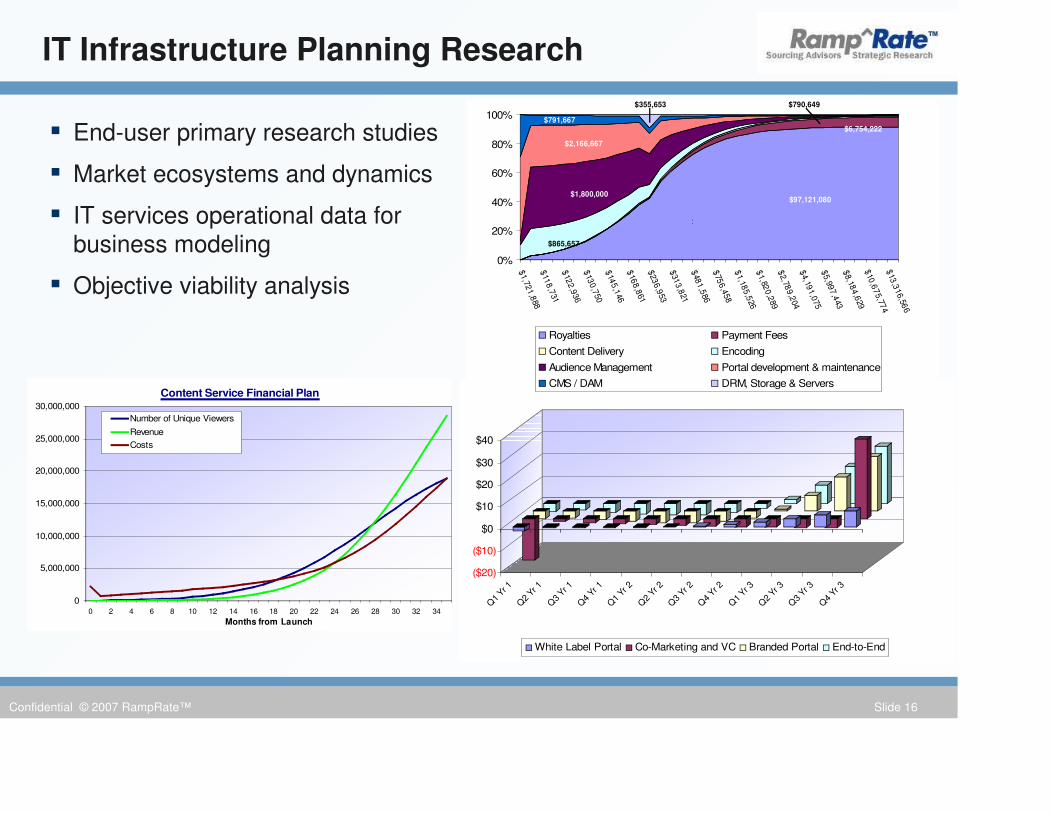
IT Infrastructure Planning Research
Content Service Financial Plan
0
5,000,000
10,000,000
15,000,000
20,000,000
25,000,000
30,000,000
0 2 4 6 8 10 12 14 16 18 20 22 24 26 28 30 32 34
Months from Launch
Number of Unique Viewers
Revenue
Costs
($20)
($10)
$0
$10
$20
$30
$40
Q1
Yr 1
Q2
Yr 1
Q3
Yr 1
Q4
Yr 1
Q1
Yr 2
Q2
Yr 2
Q3
Yr 2
Q4
Yr 2
Q1
Yr 3
Q2
Yr 3
Q3
Yr 3
Q4
Yr 3
White Label Portal Co-Marketing and VC Branded Portal End-to-End
0%
20%
40%
60%
80%
100%
$1,72
1,8
88
$11
8,7
31
$12
2,9
36
$13
0,7
50
$14
5,1
46
$16
8,8
61
$23
6,9
53
$31
3,8
21
$48
1,5
86
$75
6,4
58
$1,18
5,5
26
$1,82
0,2
89
$2,78
9,2
04
$4,19
1,0
75
$5,99
7,4
43
$8,18
4,6
29
$10
,67
5,774
$
13,3
16,56
6
Royalties Payment Fees
Content Delivery Encoding
Audience Management Portal development & maintenance
CMS / DAM DRM, Storage & Servers
$97,121,080 $1,800,000
$2,166,667
$865,657
$791,667 $6,754,222
$790,649
$
$355,653
� End-user primary research studies
� Market ecosystems and dynamics
� IT services operational data for business modeling
� Objective viability analysis
Confidential © 2007 RampRate™ Slide 17
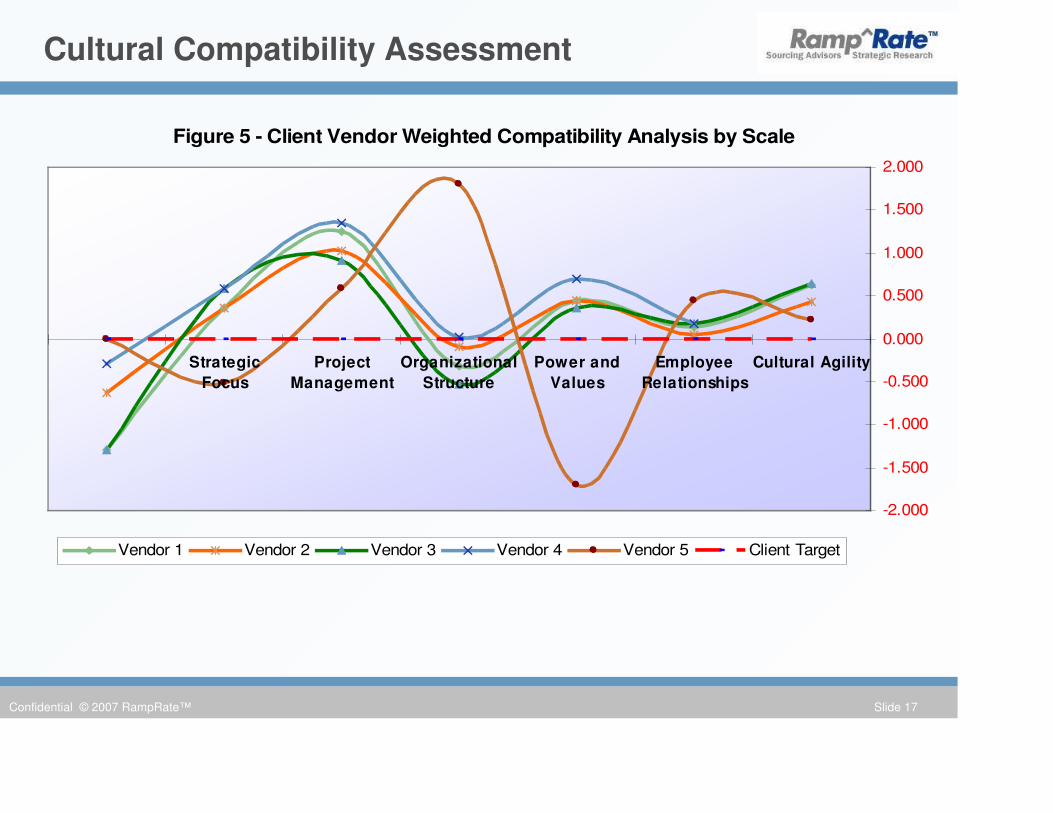
Cultural Compatibility Assessment
Figure 5 - Client Vendor Weighted Compatibility Analysis by Scale
Strategic
Focus
Project
Management
Organizational
Structure
Power and
Values
Employee
Relationships
Cultural Agility
-2.000
-1.500
-1.000
-0.500
0.000
0.500
1.000
1.500
2.000
Vendor 1 Vendor 2 Vendor 3 Vendor 4 Vendor 5 Client Target
Confidential © 2007 RampRate™ Slide 18
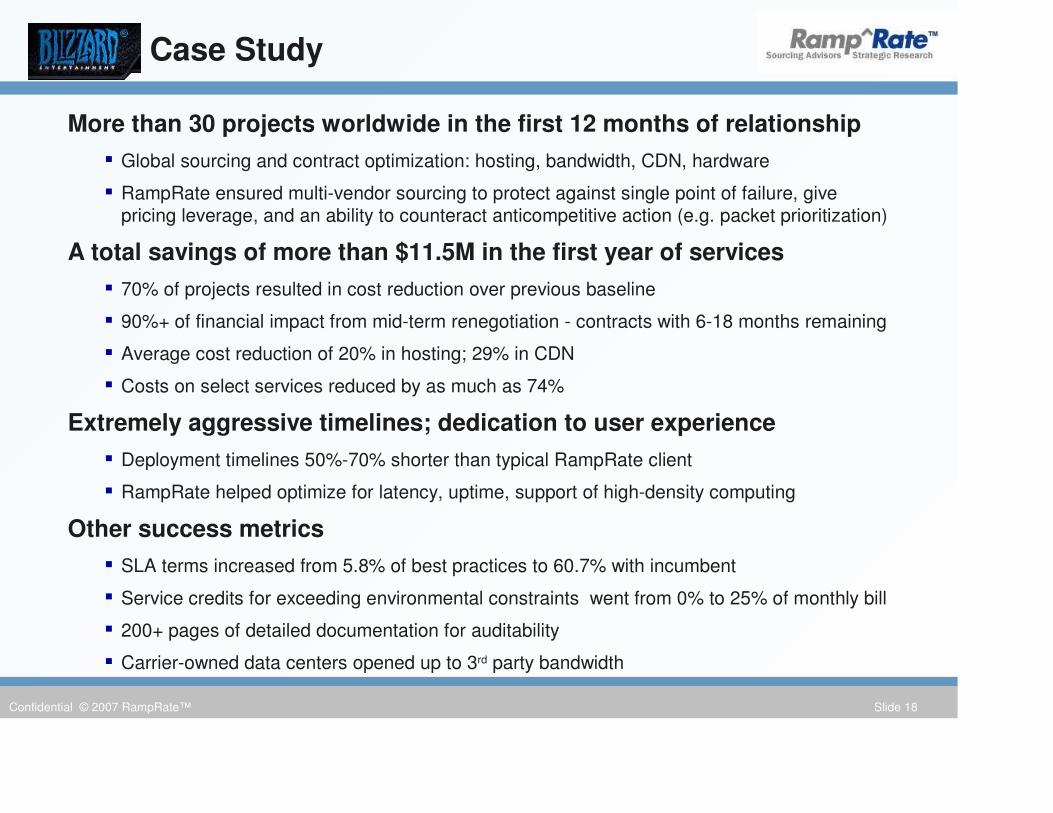
Case Study
More than 30 projects worldwide in the first 12 months of relationship
� Global sourcing and contract optimization: hosting, bandwidth, CDN, hardware
� RampRate ensured multi-vendor sourcing to protect against single point of failure, give pricing leverage, and an ability to counteract anticompetitive action (e.g. packet prioritization)
A total savings of more than $11.5M in the first year of services
� 70% of projects resulted in cost reduction over previous baseline
� 90%+ of financial impact from mid-term renegotiation - contracts with 6-18 months remaining
� Average cost reduction of 20% in hosting; 29% in CDN
� Costs on select services reduced by as much as 74%
Extremely aggressive timelines; dedication to user experience
� Deployment timelines 50%-70% shorter than typical RampRate client
� RampRate helped optimize for latency, uptime, support of high-density computing
Other success metrics
� SLA terms increased from 5.8% of best practices to 60.7% with incumbent
� Service credits for exceeding environmental constraints went from 0% to 25% of monthly bill
� 200+ pages of detailed documentation for auditability
� Carrier-owned data centers opened up to 3rd party bandwidth
Confidential © 2007 RampRate™ Slide 19
Case Study
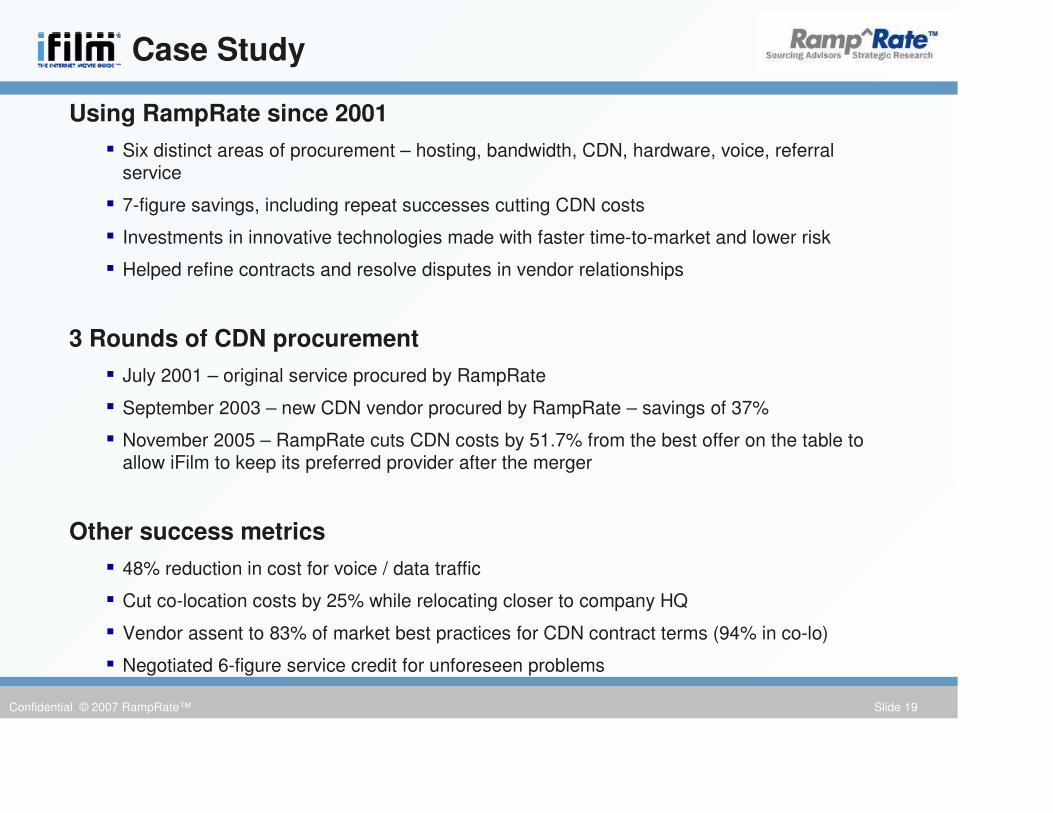
Using RampRate since 2001
� Six distinct areas of procurement – hosting, bandwidth, CDN, hardware, voice, referral service
� 7-figure savings, including repeat successes cutting CDN costs
� Investments in innovative technologies made with faster time-to-market and lower risk
� Helped refine contracts and resolve disputes in vendor relationships
3 Rounds of CDN procurement
� July 2001 – original service procured by RampRate
� September 2003 – new CDN vendor procured by RampRate – savings of 37%
� November 2005 – RampRate cuts CDN costs by 51.7% from the best offer on the table to allow iFilm to keep its preferred provider after the merger
Other success metrics
� 48% reduction in cost for voice / data traffic
� Cut co-location costs by 25% while relocating closer to company HQ
� Vendor assent to 83% of market best practices for CDN contract terms (94% in co-lo)
� Negotiated 6-figure service credit for unforeseen problems
Confidential © 2007 RampRate™ Slide 20
Case Study
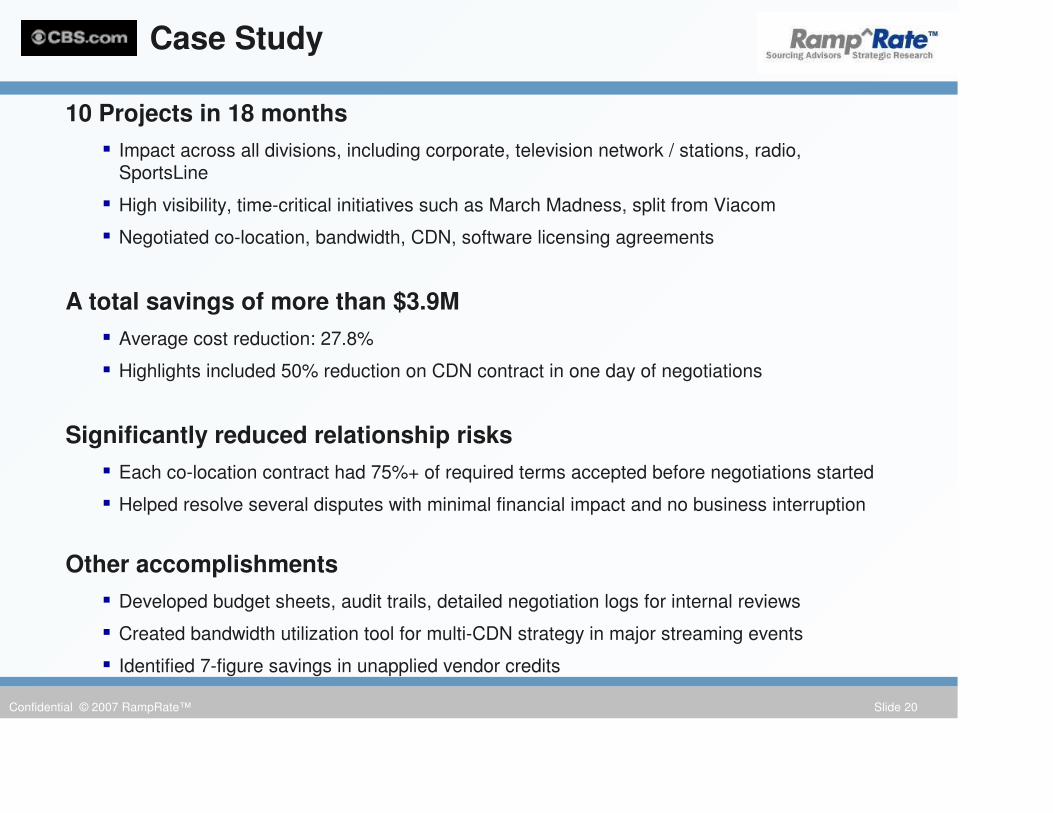
10 Projects in 18 months
� Impact across all divisions, including corporate, television network / stations, radio, SportsLine
� High visibility, time-critical initiatives such as March Madness, split from Viacom
� Negotiated co-location, bandwidth, CDN, software licensing agreements
A total savings of more than $3.9M
� Average cost reduction: 27.8%
� Highlights included 50% reduction on CDN contract in one day of negotiations
Significantly reduced relationship risks
� Each co-location contract had 75%+ of required terms accepted before negotiations started
� Helped resolve several disputes with minimal financial impact and no business interruption
Other accomplishments
� Developed budget sheets, audit trails, detailed negotiation logs for internal reviews
� Created bandwidth utilization tool for multi-CDN strategy in major streaming events
� Identified 7-figure savings in unapplied vendor credits
Confidential © 2007 RampRate™ Slide 21
Major Banking & Insurance Firm Case Study
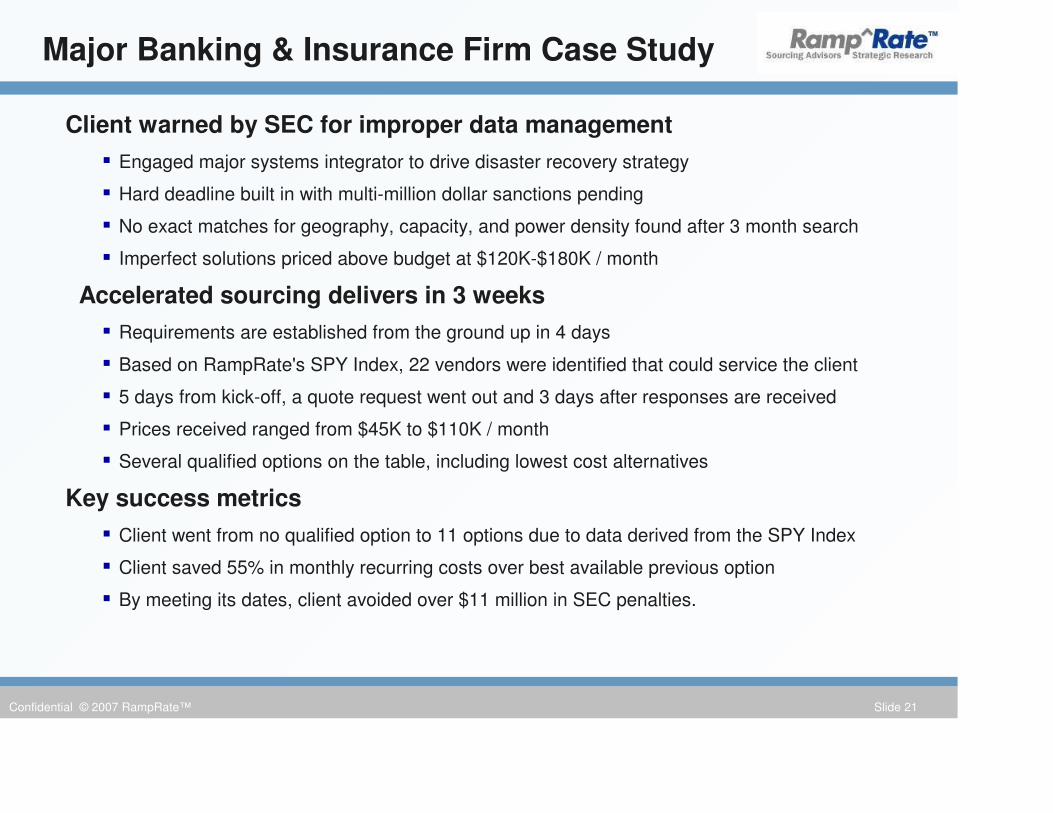
Client warned by SEC for improper data management
� Engaged major systems integrator to drive disaster recovery strategy
� Hard deadline built in with multi-million dollar sanctions pending
� No exact matches for geography, capacity, and power density found after 3 month search
� Imperfect solutions priced above budget at $120K-$180K / month
Accelerated sourcing delivers in 3 weeks
� Requirements are established from the ground up in 4 days
� Based on RampRate's SPY Index, 22 vendors were identified that could service the client
� 5 days from kick-off, a quote request went out and 3 days after responses are received
� Prices received ranged from $45K to $110K / month
� Several qualified options on the table, including lowest cost alternatives
Key success metrics
� Client went from no qualified option to 11 options due to data derived from the SPY Index
� Client saved 55% in monthly recurring costs over best available previous option
� By meeting its dates, client avoided over $11 million in SEC penalties.


![[XLS] · Web view1 1 1 2 3 1 1 2 2 1 1 1 1 1 1 2 1 1 1 1 1 1 2 1 1 1 1 2 2 3 5 1 1 1 1 34 1 1 1 1 1 1 1 1 1 1 240 2 1 1 1 1 1 2 1 3 1 1 2 1 2 5 1 1 1 1 8 1 1 2 1 1 1 1 2 2 1 1 1 1](https://static.fdocuments.us/doc/165x107/5ad1d2817f8b9a05208bfb6d/xls-view1-1-1-2-3-1-1-2-2-1-1-1-1-1-1-2-1-1-1-1-1-1-2-1-1-1-1-2-2-3-5-1-1-1-1.jpg)
![1 1 1 1 1 1 1 ¢ 1 1 1 - pdfs.semanticscholar.org€¦ · 1 1 1 [ v . ] v 1 1 ¢ 1 1 1 1 ý y þ ï 1 1 1 ð 1 1 1 1 1 x ...](https://static.fdocuments.us/doc/165x107/5f7bc722cb31ab243d422a20/1-1-1-1-1-1-1-1-1-1-pdfs-1-1-1-v-v-1-1-1-1-1-1-y-1-1-1-.jpg)