Cognitive Simulations II: What did I do wrong? Using Scorecards

1
R&Dcapitalisation:wheredidwegowrong?
Mark de Haan & Joseph Haynes*
Summary
Globalisation and the activities of multinational enterprises groups (MNE groups)
present an increasing challenge for macroeconomic measures particularly those
designed to reflect domestic economies. The very presence of MNE groups goes against
the basic idea of there being an identifiable and measurable domestic economy
consisting of domestic consumers and producers. In a globalised world with limited to
no trade barriers, MNE groups will operate across multiple national economies, often
under a single management or control structure. One of the serious problems that MNE
groups present for macroeconomic measurement is the issue of assigning economic
ownership of Intellectual Property (IP) to the various fractions of a global value chain
and therefore to domestic economies. This is an issue for which the international
guidance is currently incomplete and still under research by national accountants.
This paper is an attempt to contribute to the discussion of R&D capitalisation by
establishing a bridge between the micro and macro worlds. By analysing real world
companies and their production process this paper aims to highlight some of the issues
with the current recording treatment around IP. This translation of information on the
MNE group’s business structure to the national accounts framework will give an
indication of real world distortions that national accountants will encounter when
measuring the activities of MNE groups on a domestic economy basis.
In this paper the discussion of IP focuses largely on R&D. Though the issue of marketing
assets (trademarks, brand names etc.) is also discussed in relation to their use by MNE
groups and as yet unsolved issues in their recording in macroeconomic statistics.
This paper offers a number of proposals for improvements though definite solutions to
the issues are not possible in one paper alone. Perhaps the greatest contribution of this
paper is in highlighting clearly, through real world examples, the need for openness and
data sharing between national statistics institutes (NSIs). Accurate recording of the
activities of MNE groups requires co‐operation and data sharing at a far greater level
than NSI’s have previously been willing to do.
This paper refers to a number of real businesses to illustrate the issues involved in
recording the activities of MNE groups in national economic statistics. All the
information contained within this paper relating to these MNE groups is taken from
previously published publically available sources. There may deficiencies in the way the
characteristics of these MNE group structurers are being revealed by these sources. We
nevertheless take these available sources as the starting point of this paper with the
main purpose of highlighting the complexities of their recording in the national
accounts.
* Please send your questions or comments to [email protected] or [email protected].

2
The authors would like to thank Dirk van den Bergen, Tihomira Dimova, Henk Nijmeijer, Paul
Konijn Rami Peltola, Peter van de Ven, Piet Verbiest and two anonymous referees for their
excellent comments.
3
1.Introduction
A significant innovation in the latest SNA update (2008 SNA) was the capitalisation of expenditure on
research and development (R&D). In the process of the SNA update, Statistics Netherlands produced
several papers on this issue (cf. De Haan & Van Rooijen‐Horsten, 2004 and Van Rooijen‐Horsten et
al., 2007). These papers highlighted several data issues such as: the translation of Frascati based R&D
statistics to National Accounts data; assessing service lives of R&D assets; and dealing with possible
overlaps between R&D and computer software. This kind of guidance was later formalised in the
OECD Handbook on deriving capital measures of intellectual property products (OECD, 2009). While
the 1993 SNA implementation included the introduction of computer software capitalisation for
which the first country results showed a disparity of applied methods and results, the introduction of
R&D capitalisation was ‘managed’ in a more careful way. Unfortunately, we cannot conclude that
R&D capitalisation in the National Accounts has been totally successful.
In the papers produced by Statistics Netherlands, two conceptual concerns were brought to
attention:
1. R&D in the public domain does not necessarily comply with the general definition of an asset
in the SNA sense. Economic ownership of public knowledge cannot be claimed by one
particular economic agent;
2. Guidance on how to account for R&D flows and stocks inside the multinational enterprise
(MNE) is totally lacking.
Supporters of the first proposition (e.g. representatives from Statistics Denmark, Statistics
Netherlands and the UK Office for National Statistics) “lost the battle”. Ultimately it was decided that
R&D expenditure, both public and private, should be treated equally as fixed assets in the 2008 SNA.
The arguments supporting this choice were pragmatic rather than conceptual. Our impression is still
that publicly available knowledge contrasts with the general SNA definition of an economic asset.1
This broad demarcation of R&D assets is also ambiguous and creates implausible outcomes.
Therefore we revisit this issue in the subsequent section of this paper before moving on to the issue
of globalisation.
In recent years, the second issue on R&D within MNE groups and globalisation has received
increasing attention. For national accountants, one of the key challenges of economic globalisation is
explaining how capital services of intellectual property enter the globally organised production
chains. Several developments are complicating this globalisation puzzle. Firstly, the international
fragmentation of production chains, inside or outside MNE structures, may imply that business
functions such as R&D and software development (i.e. product development and design,
development of software inputs) are being separated and (spatially) disconnected from the process
of physical transformation (the actual manufacturing of the good embedding the intellectual
property). Secondly, production chain fragmentation may also enter the stages of physical
transformation. Examples of highly fractured and specialised manufacturing webs are those found in
the automobile or aircraft industry.
Nowadays some manufacturers entirely offshore the physical transformation stages of production;
such ‘production arrangers’ are also called factoryless goods producers (FGPs). The issue of FGPs was
1 The misplaced conceptual argument in which public R&D is compared to public infrastructure is discussed later on in this paper.

4
intensively discussed in the UNECE task force on global production (UNECE, 2015). Questions about
their economic classification and the kinds of transaction these companies are generally engaged in
were, unfortunately, not brought to a final conclusion. Both issues are closely linked to recording
R&D or, more generally, intellectual property (IP) flows and stocks.
R&D capitalisation suggests that intellectual products can be accounted for like any other fixed asset
in the National Accounts. Our view on globalisation is that this is not the case. This point is picked up
in Section 3 of this paper.
An additional complicating factor is that IP, or intangible assets more broadly, may become a vehicle
for tax planning. MNE groups may locate their IP and report related IP revenues (i.e. royalties) in low
tax jurisdictions and subsequently charge affiliated companies, which report substantive shares of
the group’s turnover, for the use of the IP. Such tax planning arrangements may involve a range of
special purpose entities (SPEs) located in a variety of countries. A national accountant is usually able
to observe only fragments of the tax planning arrangement and is easily misled by the information
being obtained at the level of individual SPEs, or other entities in a tax planning arrangement.
Judgements on substance or divergences in legal vis‐à‐vis economic ownership are extremely
difficult. This is the main issue in Section 4.
Section 5 winds up with (tentative) conclusions and suggestions for future work.

5
2.ThewheelofknowledgeandIPcreation
Knowledge cannot be valued in money terms. Any attempt to do so is doomed to fail as the
importance of knowledge to society cannot be comprehensively evaluated in terms of all ‘capital
services’ obtained by society from our common knowledge base. One crucial characteristic of
knowledge is its use for purely scientific reasons, i.e. building up new knowledge. Knowledge creation
inherently depends on existing knowledge. We call this the ‘wheel of knowledge’ (which also
happens to be a videogame).
Another important problem to confront is that knowledge itself does not depreciate. Codified
knowledge may get lost in the course of catastrophic losses (library fire or computer crash), which is
according to the SNA not the same as depreciation. Crucial too in the process of knowledge creation
is that the complementary tacit knowledge, or human capital, is being maintained, or even
expanded, by our educational systems.
In the process of developing an electric automobile in the twenty first century one cannot say that
the required knowledge obtained in ancient times, say the invention of a wheel millennia ago, is less
significant to the car than more recent inventions, e.g. the development of powerful batteries. As
such we cannot argue that the invention of a wheel is at this point of time (partly or fully)
depreciated. We are still enjoying, as ever, the fine properties of a wheel.
Equally, we cannot say that contributions from ancient philosophers like Pythagoras or Socrates to
contemporary thinking have become less relevant and should therefore be depreciated. But if
knowledge does not depreciate then the wheel of knowledge becomes larger and larger, year after
year.
How does this thinking contribute to national accounting? The last two versions (1993, 2008) of the
SNA underscored rightfully the increasing significance of knowledge as a production factor. Business
value and profits increasingly rely on tacit knowledge (human capital) and codified knowledge
(intellectual property products). This is why computer software, artistic originals, mineral exploration
and research and development were included in the SNA list of fixed assets (not human capital which
is another story).
This issue of whether intellectual property products have equal properties as other (tangible) fixed
assets is picked up in the subsequent sections of this paper. The minimum requirement is that
intellectual property products should comply with the general definition of an asset: they are subject
to economic ownership and provide future benefits to its owner. In addition, a fixed asset must be
the outcome of production.
With respect to intangible assets these conditions should be given careful consideration. In relation
to R&D performed by businesses we can safely assume that companies are able to claim the benefits
from the R&D they fund or carry out themselves. As high tech companies may spend up to ten per
cent of their turnover on R&D, it is quite likely that these companies will be receiving a reasonable
return to R&D capital and are capable of claiming R&D ownership by patenting or other ways of
limiting access.
In the context of globalisation this paper explains that at the level of a multinational company the
concepts of ownership and obtaining related benefits are conceptually sound and applicable. When
stepping down at the level of individual member companies, or when assessing ownership and R&D

6
returns at country level where these member companies are resident, both concepts become fuzzy
and less easily applicable.
We think this is a serious issue. If national accountants are not able to explain how R&D is linked to
production and output, they are not capable of accounting properly for R&D flows and stocks. These
concerns are picked up in the subsequent sections of this paper.
De Haan et al. (2004) raised the question of what are the conditions under which R&D complies with
the general SNA asset definition (at least at the level of a multinational enterprise)? They concluded
that due to the exclusive access to knowledge acquired from R&D, the owner may exert a certain
level of market power which has a clear and distinct market value. This knowledge may be translated
into products with, in the eyes of the consumer, unique and well appreciated properties, not found
in the products offered by rival suppliers. The service obtained from knowledge assets will decay in
correspondence with the loss in monopolistic power the owner will inevitably experience over time.
Competitors will eventually be able to copy the invention or may develop themselves, by way of new
R&D projects, product properties which outperform previous product innovations.
This loss in market power causes the knowledge asset to depreciate over time. This depreciation is by
definition the outcome of obsolescence as R&D or intellectual property generally will not be subject
to wear and tear. The knowledge itself will not disappear, it may generate a positive contribution to
society for many years, yet its commercial value will inevitably decline. This distinction between
knowledge and its possible commercial value is of crucial importance. The knowledge as obtained
from R&D will not depreciate. However, access exclusiveness and its potential commercial value will
depreciate. Depreciation refers to the fact that a patent (or exclusive user rights more generally) is
time limited and the progression of technology inevitably implies advancing obsolescence.
As a thought experiment it may be worth considering the (part fictional) story of the discovery of
penicillin by Alexander Fleming and his refusal to take out a patent, believing that the discovery was
too important to limit its use. As national accountants the question we should be asking is whether
the discovery of penicillin therefore led to a fixed asset? If neither Fleming nor anyone else could
claim economic ownership and accrue future benefits due to the knowledge being freely available
and usable then there is no fixed asset. Instead there is only knowledge. However had Fleming opted
to obtain a patent then there would have been an economic owner and a fixed asset. This example
shows that it is the patent, or more generally obtaining exclusive ownership, that gives rise to the
fixed asset and not the knowledge or discovery itself. Where knowledge is not protected by any
means, a patent or secrecy, a fixed asset cannot be recognised.
Sharing profitable knowledge incurs a cost as it may delimit the monopolistic power of the initial
owner. One should be aware that commercial success is often the combination of codified
knowledge (the R&D asset) and tacit knowledge (the complementary human capital required to
translate knowledge into successful product blueprints). Copying tacit knowledge may be harder
than copying R&D assets. This means that exclusive ownership of scientific knowledge is not
necessarily safeguarded by patenting but can equally be obtained by way of secrecy or by the
exclusive access to the complementary tacit knowledge.
The service lives of patents in the various scientific areas (e.g. pharmaceutics, electronic appliances,
IT) may be a reasonable proxy for assessing service lives of patented and non‐patented R&D projects.
This is how many national statistical institutes go about assessing service lives of R&D assets. As
unsuccessful projects are unavoidable in the process of seeking commercial success, capitalising
7
expenditure on both successful and unsuccessful projects is defendable in the attempt to
approximate the overall market value of business R&D capital.
We have seen that the 2008 SNA recommends all R&D to be capitalised, business research and non‐
commercial research (e.g. university research). The argument used in the 2008 SNA for also
capitalising the latter type of research is that university R&D is a public good which is beneficial to
society for a longer time period, similar to public roads or bridges. The arguments below speak
against this analogy. The 2008 SNA (paragraph 10.98) explains that “the knowledge remains an asset
as long as its use can create some form of monopoly profit for its owners. When it is no longer
protected [..] it ceases to be an asset”. Yet this wording could be read as that the 2008 SNA itself
already rejects the idea of publically shared knowledge as an asset in the SNA sense.
First, looking at the resemblance of public research and public bridges or roads there is generally no
confusion about economic ownership of the latter (we leave aside the complexity of public‐private
operations which is not germane to this discussion). The government is responsible for maintaining
the road and may even be liable for damages to users caused by deficiencies. The government has
decision power. It may, for example, decide to sell the road to a private operator or put the
underlying land to another (public) use. In this sense public infrastructure meets the definition of a
fixed asset. This may not always be the case for R&D in the public domain. Once in the public domain
the R&D asset has become a pure public good. To consider this more fully we first break down, non‐
exhaustively, the kinds of research projects carried out in the public domain.
Government bodies may conduct scientific research for various reasons. Some of this research may
be linked to commercial purposes and may even be patented (e.g. supporting agriculture or
enhancing the circular economy or, more generally, improving the environmental performance of
businesses). This type of research is quite comparable to business R&D. When businesses are able to
claim the (commercial) revenues of this public research, one may argue that this R&D has been
transferred to them. This exclusivity gives rise to economic ownership and therefore is an indicator
that such public R&D should be recorded as a fixed asset. Given its purpose this dedicated R&D is
likely subject to obsolescence as newer techniques may replace old ones. So, this R&D depreciates in
an economically meaningful way. Crucial in this context is whether or not the government
unconditionally grants all parties access to this knowledge. If so, the knowledge is in fact a public
good and cannot be an economic asset in the SNA sense.
Another example is defence related research. This research may be performed either by commercial
or government institutes. One may expect that this research is conducted under strict secrecy since
its key purpose is obtaining a military advantage over (potential) enemy states. In relation to
dedicated military research there will generally be no misunderstanding about ownership and the
beneficiaries of this research. By not publicising such research the government maintains a quasi‐
monopoly position and is the economic owner of a fixed asset. In the arms race equal steps taken by
potential enemy states will inevitably lead to diminishing the defensive advantages of research
projects over time, again implying this research can be depreciated in a meaningful way, even though
the purpose of this R&D may be (partly) non‐commercial.
Another part of R&D performed in the public domain is purely non‐commercial scientific university
research. Obviously the origin of scientific research is being claimed by their authors in scientific
journals. This is not the same as claiming economic ownership. The main purpose of this research is
extending science which requires among other things allowing full access to scientific results, for

8
verification purposes or for allowing other scholars to extend on published findings. The main
purpose of university research is feeding scientific debate. In the strict context of university research,
notions such as economic ownership and economic revenue become meaningless. Scientific results
are shared and applied by others for the sake of conducting new research. Once academic research
has been published the revealed knowledge immediately becomes not only a pure public but also a
free good.2 A pure public good cannot be a fixed asset as no single owner exists who can claim
economic ownership and earn any future benefits. Therefore this element of public R&D does not
meet the definition of a fixed asset as it is not subject to economic ownership.
This paper has already argued that the depreciation of business R&D is the outcome of two factors.
First, competitors in the market may catch up (dispersion or sharing of knowledge). Second, new
research and innovations may outperform previous innovations which will inevitably lead to its
obsolescence. Following this line of thinking one may argue that eventually the R&D assets as owned
by companies will be transformed into R&D in the public domain. At that moment the R&D ceases to
be an asset in the SNA sense as it has become public knowledge.
This leads to the following conclusions. The main purpose of most academic research is generating
public knowledge over which ownership cannot be claimed by one economic agent, not even a
government. The outcome (we hesitate to call this revenue) of research is commonly shared by
academia. Therefore academic research, once published, does not meet the definition of an asset.
Furthermore, academic research and knowledge in general is not subject to economic depreciation
as service lives are, in principle, indefinite. Depreciation functions applied to academic research lack
any conceptual underpinning.
The intrinsic inconsistency of such calculations can be underscored by the following representation of
a production function of academic research (in ISIC Rev.4 code 85). In case of public education and
research, the SNA convention is to value output (X) as the sum of costs. Let us assume a purely
scientific research institute (perhaps allied to a university). Its main current costs are the salaries of
researchers (L). According to the 2008 SNA the output of this research institute is R&D which is
recorded as gross fixed capital formation. Its depreciation feeds back in the production account of
the research institute. We assume that the salaries and labour input are constant in time. We also
assume geometric depreciation (d). The production function is represented by equation (1). The
capital accumulation function is represented by equation (2).
(1) Xt = L + d × R&Dt
(2) R&Dt = (1‐d) × R&Dt‐1 + Xt‐1
→ Xt ‐ Xt‐1 = d × L
So the remarkable outcome of the SNA convention is that while labour input (L) remains constant
over time, each year the R&D output of this research institute will linearly increase by d × L while the
R&D capital stock will annually expand by L.
What is modelled by equations (1) and (2) is the ‘expanding wheel of knowledge’ which has nothing
to do with economic accounting. According to equations 1 and 2, government consumption would
annually increase by d × L according to the SNA convention of non‐market output valued at sum of
2 A public good means that individuals cannot be effectively excluded from use. The use by one individual does not reduce availability to others. Public R&D is also a free good as its use is principally unlimited and not subject to depreciation.

9
costs and ignoring labour productivity changes, while intuitively one would agree that given constant
labour input the research institute would generate constant output.
In other words the R&D output of this research institute should be recorded directly as government
consumption and not as gross fixed capital formation. It should be emphasised that either the
consumption or investment option will have a similar impact on GDP. Though the investment option
leads to the undesirable disturbance of recursive GPD additions as the consumption of fixed capital
will additionally add to the output of the government sector, measured as the sum of costs.

10
3.CorporateR&DpropertyandglobalR&Dnetworks
3.1Introduction
At least two complicating factors limit our understanding of how the services of R&D capital enter
the global production chain. The first one is the global fragmentation of production and, within the
global value chain, the disconnected supply of physical and intangible inputs. The second is that R&D
creation itself can be subject to interlinked global research networks. Both issues are considered in
this section.
3.2Globallyfragmentedvaluechains
Global production contrasts with the idea of ‘national’ accounting and this is why so much effort has
recently been put into developing guidance supplementing the 2008 SNA (cf. UNECE, 2011, 2015,
Eurostat 2014). As explained by the OECD, international production, trade and investments are
increasingly organised within so‐called global value chains (GVCs), where the different stages of the
entire production process, from product design all the way to product distribution and after sales
services, are located across different countries.3
Intellectual property and information technologies play a fundamental, enabling, role in the global
value chain. For example, communication networks enable product development and design to be
geographically disconnected from goods fabrication.
The well‐known value added breakdown of an iPhone indicates that the physical parts and
assembling costs represent roughly half the iPhone retail price.4 All other value added generated by
the iPhone output is connected to the intangible inputs such as R&D, design, marketing and
presumably activities such as supply‐chain management. The income is generated in different
regions of the world.
Graphic presentations of global supply chains nicely show the geographic distribution and clustering
of manufactured parts and assembling making up the iPhone, a motor car or an airplane.5 How R&D
feeds in to the global value chain is harder to explain. This issue is often ignored as analysis of global
production networks often limit themselves to the physical transformation segments of global
production.
However, if according to the 2008 SNA R&D is a fixed asset, like any other (tangible) fixed asset, the
National Accounts should be able to explain which entities inside the MNE structure are actually
investing in R&D and consuming the concomitant R&D services. In other words, we should be able to
explain which (affiliated) entity (in which country) owns the R&D asset and is accountable for its
depreciation or more generally the costs of using the R&D asset. Similarly, the accounts should be
able to explain how R&D and intellectual property (IP) contribute to output and multifactor
productivity on a country‐by‐country basis.
There are several reasons why these questions are difficult to answer:
3 http://www.oecd.org/sti/ind/global‐value‐chains.htm 4 https://www.digitaltrends.com/mobile/IPPhone‐cost‐what‐apple‐is‐paying/ 5 http://www.aeronewstv.com/en/industry/commercial‐aviation/3707‐boeing‐787‐dreamliner‐structure‐parts‐from‐around‐the‐globe.html

11
1. Basic and applied research provides capacity‐enhancing technologies which facilitate product
innovation but will not directly result in blue prints of new products.6 In other words, in contrast to
product development, basic research misses a direct link to the goods and services outputs. This
being the case, the head office of an MNE seems the most obvious candidate for economic owner
of this truly corporate R&D property. It is quite likely that head offices take the (funding) decisions
on basic research investments in line with the overall corporate innovation strategy. The latest
Frascati handbook (OECD, 2015, par. 3.11) confirms this view: “In large and complex organisations,
decisions concerning the strategic direction and financing of R&D activities units tend to occur at a
higher organisational level than does the day‐to‐day management of R&D operations. (..) These
decisions can cut across national borders, thus raising a challenge for the statistical authorities and
agencies, whose responsibility is often limited to gathering information from resident units.” In
other words, allocation of basic and applied research or allocating its capital services, to the goods
manufacturers inside the MNE is inherently without economic meaning.
2. R&D is different from most activities performed by a corporation in the process of its operation.
Research is typically not performed with the expectation of immediate profit. Instead, it is focused
on the long‐term profitability of a company. As such the way in which R&D feeds into to the
production function is unlike other fixed asset categories. Even for computer software, its
presence in a local computer or in the cloud is needed in the course of the transformation process
in order to deliver its capital services. Obviously, a similar presence is also required for tangible
capital items. In contrast, once a potentially successful recipe for a new medical drug, or the
technical design of a new motor car, has been developed, the production process will be set up
according to this new blue print, after which the R&D capital has delivered its contribution to
output. This does not imply there is no return to R&D capital involved in the course of producing
the medical drug or motor car. However, this different mechanism by which R&D contributes to
output implies that the R&D asset is not necessarily found in the balance sheet of the entity
engaged in the transformation, i.e. the actual fabrication of the drug or motor car. Instead the
R&D asset may be on the balance sheet of an affiliated company (in a low tax jurisdiction) or may
not feature on any balance sheet at all, as corporate accounting rules are generally quite
restrictive in capitalizing R&D.
3. Inside or outside the MNE group’s scope, a production network is not just the sum of its
component parts. Product development and design are activities typically carried out by the
arrangers or principal entities inside global production networks. So these entities are often the
main R&D investors inside the global value chain. This is also according to the explanation of
factoryless goods producers (FGPs) in the Guide to Measuring Global Production (UNECE, 2015). In
this regard FGPs and head offices of MNE groups carry out similar tasks: they both manage global
supply chains with the aim of optimising network synergy. They are both expected to bring
together the intangible and physical stages of global production. The main difference is that FGPs
have outsourced the physical transformation activities while inside the MNE these activities are
(partly) carried out by affiliated companies. Also different from an FGP, a head office will not
necessarily report turnover from sales of goods. Alternatively this turnover is expected to be
reported by one or several of the MNE groups affiliated goods producers. As product and process
innovations obtained from R&D may affect several stages in the production network, from a
6 Basic and applied research represents 20% of total business R&D in the US: https://www.nsf.gov/statistics/2017/nsf17320/
12
holistic point of view it seems defendable that the FGP or head office is the typical stage where
R&D enters the global production chain. It does not seem feasible to assign R&D inputs to the
separate transformation stages in the production chain. One R&D asset, or one piece of
knowledge, may lead to multiple product innovations and the enhancing of profits of several
business units inside the MNE group.
4. In the context of an FGP arrangement, R&D may lead to innovations of products assembled and
supplied by non‐affiliated contract producers in the various parts of the world. The value added
and profits generated by these contract producers will typically omit the return to R&D assets as
their production costs, and thus their output prices, will not include R&D costs. The R&D returns
are directly captured by the principal of the global production arrangement. Discussions in the
global production taskforce (UNECE, 2015) showed that, in the case of an FGP, national
accountants have great difficulties in explaining the nature of the transaction between the
contract manufacturer and the principal: the purchase of a good or the purchase of a
(manufacturing) service. Our conclusion is that in economic terms the good purchased from the
contractor differs fundamentally from the good sold to consumers, even though in physical terms
no distinction can be made. This may have implications for the commodity classification in the
national accounts and the balance of payments. In the classifications of goods not only are the
physical characteristics of the product relevant, but also the conditions under which the product is
transferred from one economic owner to another.
5. In the context of an MNE the output price of the affiliated contract producer may indeed include
the return to R&D capital as its output may be directly distributed to the end consumers. However,
the required R&D assets may, or may not, be found on the balance sheet of the affiliated
manufacturer. It is still possible that headquarters, in their role as global production arrangers,
provide the R&D inputs, possibly without any intracompany flows of R&D services being observed.
In such a situation the R&D profits will be repatriated to the headquarters via property income
(dividends or retained earnings).
6. The latter point shows that corporate funding of R&D is not necessarily linked to how and where
the R&D is translated into commercial success. Ignoring tax planning for a moment, from the MNE
group’s perspective a spatial allocation of generated R&D income is irrelevant as this income will
eventually reach the MNE’s shareholders wherever generated. Discussions with a number of R&D
managers of Dutch multinational companies led to the conclusion that cost redistribution is not
common practice (cf. de Haan & van Rooijen‐Horsten, 2004).
7. Ironically R&D cost accounting (IP related royalty payments) within the MNE is particularly
observed in the context of tax planning arrangements. Fair competition authorities, tax authorities
and statisticians alike have to evaluate to what extent IP cost accounting arrangements have
economic substance. Looking at recent events one must conclude that tax planning arrangements
of MNE groups may place national accountants in a very difficult position. This issue is further
discussed in Section 4 of this paper.
To conclude, (national) IP economic ownership in the context of global production is still not a well
understood concept. The arguments above indicate that IP economic ownership seems to usually
coincide with the decision making entities in the global value chain. These are the entities that are
expected to manage overall the intangible and tangible inputs of production. However such a view
has several implications that require further examination:

13
Assigning economic R&D ownership to headquarters on behalf of the MNE requires, amongst
other things, a careful examination of cross border R&D flows as they are be reported in the
international trade in services statistics. R&D conducted by foreign affiliated entities may, or
may not, be (partly) funded by headquarters (or by sister companies) or may even have been
purchased. This means that the practicalities of such an approach need to be carefully
thought through. Some guidance is already provided by Frascati in showing a data collection
scheme for R&D expenditure at the MNE level (Figure 11.2 in OECD, 2015).
The commodity (CPC) classification should be further examined to address the economic
characteristics of the output of contract producers an FGP arrangement.
3.3GlobalR&Dnetworks
R&D (Frascati) statistics provide information on R&D expenditure. This is without any doubt crucial
information for the purpose of measuring R&D investment. The assumption that R&D expenditure is
overall a reasonable approximation of its commercial benefits is not likely to be replaced by an
alternative measurement method. The costs of carrying out R&D and maintaining global R&D
networks can be statistically observed in a meaningful way on a country‐by‐country basis. The
allocation of (economic ownership of) investments of R&D networks on a country‐by‐country basis is
a less clear concept. Of course we can assume that the allocation of costs is representative for the
allocation of investments but this seems to be a rather shaky assumption.
Global R&D networks within MNE groups are best illustrated with the help of a few real life
examples. The technology firm Samsung has over 50,000 employees working in collaboration on R&D
spread across multiple R&D centres in South Korea as well as others in Russia, India, China, Israel,
Japan, Poland, the United States and the United Kingdom7. Table 1 details some of the R&D activities
undertaken by Samsung outside of South Korea.
7 http://www.samsung.com/semiconductor/about‐us/research‐development/

14
Table 1 The Samsung R&D network
Another example is Philips which is a leading technology company operating in the healthcare and
consumer electronics sector and one of the largest Dutch MNE groups with its technology
headquarters located in the Netherlands. However Philips also conducts R&D activities across the
world as shown in Table 28.
Table 2 The Philips R&D network
Although we did not undertake a full investigation, the literature on R&D management seems to
confirm that regional R&D facilities may support local product development as well as the overall
MNE’s longer term research strategy. For example Papanastassiou & Pearce (2005) find that local
R&D laboratories in the UK are mostly funded by the parent company of the MNE group. This is
considered as being powerfully indicative of the manner in which such decentralised operations are
now integral to the ways in which these companies seek to apply existing core technologies and to
regenerate and broaden the scope of these crucial knowledge competences. It depicts a process of
8 https://www.philips.com/a‐w/research/locations.html
Researchinstitute Country TypeofR&Dactivities
1 Beijing Samsung Telecommunication China Mobile telecommunications standardization and
commercialization for China
2 Samsung Semiconductor Chine R&D China Semiconductor packages and solutions
3 Samsung R&D Institute India India System software for digital products, protocals for
wired/wireless networks, application and graphic design
4 Samsung Telecom Research Israel Israel Hebrew software for mobile phones
5 Samsung Yokohama Research Institute Japan Core next‐generation parts and components, digital
technologies
6 Samsung Poland R&D Center Poland STB SW platform development, EU STB/DTV
commercialization
7 Moscow Samsung Research Centre Russia Optics, software algorithms and other new technologies
8 Samsung Electronics Research Institute UK Mobile phones and digital TV software
9 Dallas Telecom Laboratory US Technologies and products for next‐generation
telecommunication systems
10 Samsung Information Systems America US Strategic parts and components, core technologies
Researchinstitute Country TypeofR&Dactivities
1 Philips Research Shanghai China Imaging systems
2 Philips Research Suresnes France Healthcare
3 Philips Research Aachen Germany Healthcare
4 Philips Research Hamburg Germany Imaging systems, biological modelling, computer assisted
detection
5 Philips Research Asia India Healthcare
6 Philips Research Africa Kenya Healthcare, design, user inferface
7 Philips Research Eindhoven Netherlands Healthcare and global headquarters for all R&D
8 Philips Research Cambridge UK Healthcare
9 Philips Research North America US Healthcare, artificial intelligence

15
refocusing decentralised R&D away from the short‐term objective of assisting particular subsidiaries
to apply existing technologies to their specific competitive situation, towards positions integral to the
more sustained technological and competitive development of the MNE group. In contrast to
independently operating R&D facilities, close cooperation between the regional R&D units within an
MNE is expected to provide substantial externalities, in the form of systematic group‐level spill over
benefits. Central financial participation in the funding of laboratories can be seen as crucial in
developing the necessary interdependencies between decentralised R&D units, and in securing the
cohesive growth of intra‐group knowledge flows.
Some MNE groups like Apple follow quite aggressive strategies in obtaining the knowledge required
for strengthening global competitiveness. Recently Apple opened R&D units in Berlin, the French Alps
and New Zealand, all in the close neighbourhood of companies with a strong record in certain
scientific areas (e.g. mapping or augmented reality). In several cases these companies lost employees
to Apple soon after Apple opened its new R&D unit.9 This shows that the choice of location of newly
established R&D units is on occasion solely driven by knowledge acquisition, the availability of human
capital/tacit knowledge and not by locating the R&D unit close to those MNE affiliates that are
supposed to transform the R&D to product innovation, output and commercial success.
The existence of R&D networks within the MNE structure appears to have similar implications for the
National Accounts as the existence of fragmented production chains. While the geographical
distribution of R&D costs within the MNE structure as reflected by Frascati based statistics is likely to
be reasonably well measured, the distribution of (the economic ownership of) the created R&D
assets inside the MNE is not well understood. For smaller national firms, there will likely be a strong
geographical correlation between R&D activities and the obtained commercial gains. In those cases it
is reasonable to assume that the location of R&D activity coincides with R&D asset ownership.
However, within the MNE framework this assumption cannot generally be made on solid grounds. As
R&D strategies and R&D funding are expected to result from the overall corporate strategy, the
choice of considering R&D as genuine corporate property appears attractive. However, as mentioned
the practicalities of such a choice should be carefully considered.
When assigning R&D ownership to the head offices one should assure that the production accounts
for each of the MNE group’s entities represent meaningfully the various fragments of production
encountered inside the MNE group. For example, each of the accounts should sufficiently support
productivity measurement (cf. Schreyer, 2018). This implies that together with R&D ownership, the
R&D revenues needs to be recorded in the accounts of the head office. Equally, the R&D costs needs
to be assigned to the MNE groups’ affiliates. This is not a new phenomenon as head offices will more
broadly provide all sorts of intragroup services to its affiliates i.e. supply chain management services,
financial services, marketing activities and so on.
One way to allocate all of these costs is using allocation mechanisms such as the formulary
apportionment techniques used by Guvenen et al. (2017). The main goal of Guvenen et al. is to
allocate the generated income over those entities in the MNE which are carrying out the actual
production activities. This as an attempt to overcome the disturbances caused by tax planning
arrangements. In this paper we suggest allocating the sum of ‘overhead costs’, or in other words all
intragroup services provided by head offices, to those affiliated companies which carry out part of
9 https://www.bloomberg.com/news/articles/2017‐09‐21/apple‐s‐global‐web‐of‐r‐d‐labs‐doubles‐as‐poaching‐operation.

16
the genuine the economic activities. Obviously such allocation requires a concerted action of all the
NSIs involved. The outcome of this exercise should be an economically sound allocation of the MNE
Group’s value added and gross operating surplus leading to meaningful productivity statistics at the
level of individual enterprises or establishments inside the MNE group. This goal corresponds closely
to formulary apportionment allocation of profits as carried out by Guvenen et al. Please be aware
that the proposed exercise may also help to overcome some of the substantive bilateral asymmetries
in the trade in services statistics today. Perhaps a concerted cost allocation of head offices could also
overcome some of the disturbances of transfer pricing.
The example presented in the annex to this paper is quite simple as all R&D costs are assigned to one
single affiliated company. But in essence it illustrates the cost reallocation proposed in this paper.
17
4.IntellectualPropertyandtaxplanning
One may argue that R&D capitalisation in the 2008 SNA revealed (but not necessarily caused!) the
National Accounts’ vulnerability to problems arising from globalisation, as MNE groups may use IP
assets as vehicles for tax planning. The goal of such tax planning is to shift revenue to units within the
MNE structure that are tax resident in low tax jurisdictions, a consequence of which MNE groups can
minimise their global tax liability. This is often achieved through the use of royalty and licence
agreements linked to IP assets. Units of an MNE will typically be required to pay a royalty charge to
another unit within the MNE for the right to use assets intrinsic to the production process. In doing
so profit from sales in higher tax jurisdictions can be transferred to units in lower tax jurisdictions,
minimising the global tax liability for an MNE. Such constructions are often used by MNE groups in
the technology industry where R&D and other forms of intellectual property play a crucial role. The
lack of a physical presence of IP assets lends themselves to such constructions as they can be easily
located and relocated around the world at little cost. Under such conditions, the observable global
value chain of MNE groups reflects an artificial, tax‐driven, reality rather than what could be
considered the true production process reflecting economic substance. We should also note that
movable tangible assets such as transportation equipment may also be subject to tax planning
arrangements as their (legal) ownership can be assigned to a leasing company resident in a low tax
jurisdiction.
The two real life examples of Google and Nike explored in this section highlight the expected
consequences of following, as a national accountant, the legal reality as revealed in source statistics,
rather than looking through the legal reality and depicting the MNE group’s real economic substance,
which can only be seen once the entire 'elephant' has been observed.
It should again be emphasised that all information on both cases has been obtained from public
sources that have previously been published such as news articles and business reports and does not
disclose information from official statistics as collected for individual companies.
4.1TheDoubleIrishwithaDutchSandwich10
Explainingthecase
The ‘Double Irish with a Dutch sandwich’ is a name given to a legal business arrangement which is
designed to minimise the MNE’s global tax liability. This technique has most prominently been used
by technology companies, because these firms can easily shift large portions of profits to other
countries by assigning intellectual property rights to subsidiaries abroad. From 2015 onwards Irish
tax legislation does not allow companies to use the Double Irish Dutch Sandwich for new tax plans.
Existing plans can be continued until 2020. The latter may have severe repercussions for national
statistics as in response MNE groups may restructure their business and set up alternative tax
planning schemes. Business restructurings may also be the response to the recent US tax reforms.
10 A detailed legal explanation of the Double Irish with a Dutch Sandwich is given in ‘’From the Double Irish to the Bermuda Triangle’’ J. Brothers, November 2014, Tax Analysis.

18
One of the MNE groups using the Double Irish Dutch Sandwich construction is Google.11 The main
ingredients, which are typical for the Double Irish Dutch Sandwich recipe, are as follows.
The parent company at the top of the corporate hierarchy is Alphabet Inc. This company is based in
Mountain View, California, USA. Although most of the ultimate parents of MNE groups using the
Double Irish Dutch Sandwich structure are resident in the US, this is not necessarily the case. Google
Inc. sits below Alphabet Inc. in the hierarchy and is the top of the structure for what can best be
described as the everyday Google internet functions such as search, maps, email. A large number of
companies operating across the world sit below Google Inc. in the hierarchy.
One of these is Google Ireland Holdings Unlimited, which is an Irish incorporated entity managed and
controlled from a Bermuda ‐ a common choice. This is an SPE registered in Ireland but not liable for
tax in Ireland. Rather it is tax liable in Bermuda from where it is officially managed and controlled12.
This type of holding companies with only holding activities has no physical presence and zero
employees, or only sufficient employment to fulfil a strict legal requirement, i.e. the only employees
are directors or shareholders who are normally non‐Irish residents.
Google Netherlands Holding B.V. is a Dutch resident company. It is an SPE type unit with no
employees and no activities other than “financing and participating in affiliated companies”.13 This
Dutch SPE receives royalty payments from Google units in Ireland and Singapore which are directly
transferred to Google Ireland Holdings Unlimited, minus a small amount of administrative costs.
Google Ireland Limited is an Irish registered company that undertakes real economic activities in
Ireland. It also has a wider role outside Ireland of being the company that closes all deals for Google
AdWords across Europe. AdWords represents a large portion of Google’s revenue. It has been
estimated that as much as 88 per cent of Google non‐U.S. revenue is recorded by Google Ireland
Limited14. Together these Google affiliates, representing the double Irish Dutch sandwich, operate as
follows.
Google Ireland Holdings Unlimited Company owns various IP rights which it licences to Google
Netherlands Holding B.V. who in turn are then sublicensing these rights to Google Ireland Limited.
Google Ireland Limited uses the sublicenses in its production process and generates revenue. In
doing so it is liable to pay royalty fees to Google Netherlands Holding B.V. as a result of using the IP.
Google Netherlands Holdings B.V. is also liable to pay royalty fees to Google Ireland Holdings
Unlimited Company on account of the licencing agreement between the two. As such the royalty
payments make their way from Ireland via the Netherlands back to an Irish registered company
which is however controlled, managed and liable to pay corporation tax in Bermuda. Google
Netherlands Holdings B.V. acts only to channel cash flows between units. In comparison with the
value of the royalty flows little profit remains in the Netherlands.
The Dutch SPE is not an essential hub in the tax planning arrangement. Rather it is an additional
insurance layer against potential withholding tax liabilities arising on direct royalty payments. The
zero rate of withholding taxes on incoming and outgoing royalty payments between Ireland and the
Netherlands allows this royalty flow to be seen as being taxed already (though at a zero rate)
11 https://fd.nl/ondernemen/1180304/google‐sluisde‐vorig‐jaar‐15‐mrd‐royalties‐door‐nederland 12 idem 13 Google Netherlands Holdings B.V. Annual Report 2016 14 van Geest, van Kleer and Smits, 2015, p.64
19
meaning the potential tax liability is therefore removed. Typically the Dutch SPE will pay on virtually
identical royalty payments to the Irish Holding unit as it receives. In 2015 over 99.9% of the royalties
received by Google Netherlands Holdings B.V. were repaid to Google Ireland Holdings.15 An overview
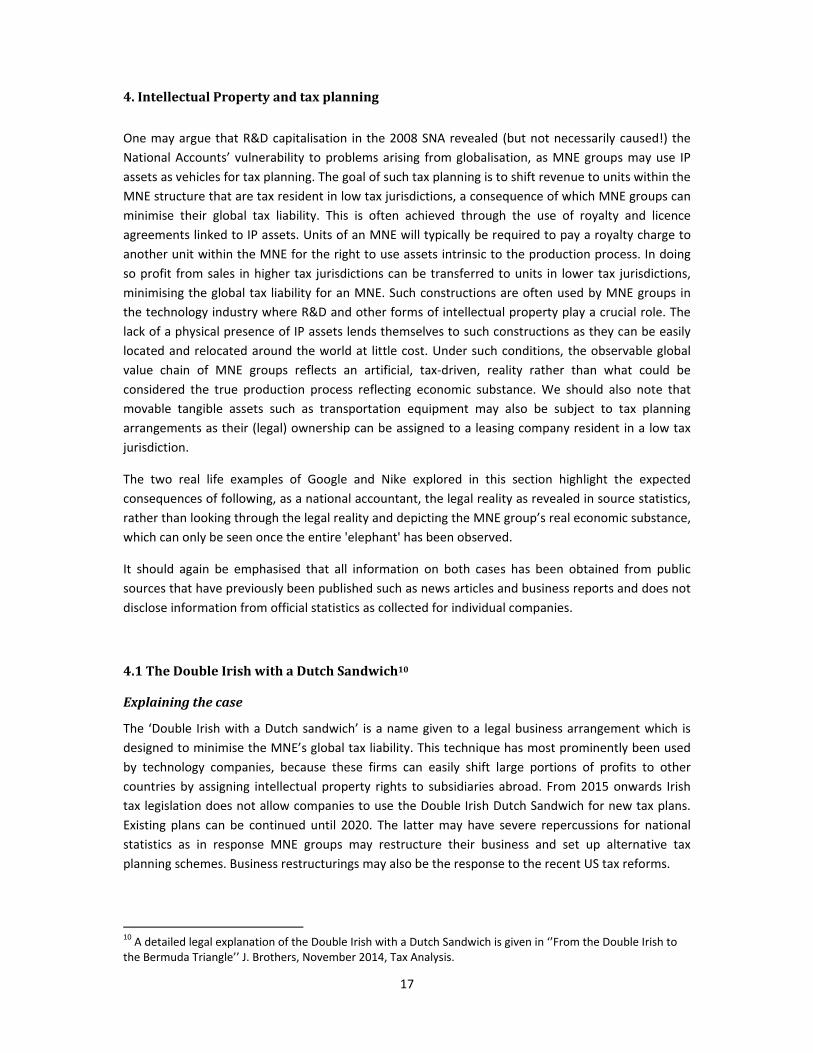
of the Google structure is presented in Figure 1.
Figure 1 A double Irish Dutch sandwich: the Google case
NationalAccountsimplications
There are several concerns when translating the information obtained from each of these entities to
National Accounts statistics.
The arrangement requires that IP ownership is transferred from the ultimate parent (in the
US) to the royalty and licence company in a low tax jurisdiction (Bermuda), in the Google
case this is Google Ireland Holdings. This apparent IP transfer, raises several questions. For
example, would this be an IP purchase/sale, and if so, what would be a representative
market value of such an intra‐company transaction? But perhaps an even more fundamental
issue is whether or not this transaction has economic substance at all. Is Google Ireland
Holdings, besides the legal owner, also the economic owner of this IP? One may expect that,
despite this arrangement, strategic decisions about IP creation and allocation continue to be
made in the US, even in cases where part of its IP ownership is transferred to an affiliated
15 As calculated based on data from Google Netherlands Holding B.V. annual report 2015, publically available at www.kvk.nl. Royalties received 14,963 billion euros, royalties repaid 14,951 billion euros.
Alphabet/Google Inc.
• Controls Google Ireland Holdings
• Creates the IP
• Grants the rights of IP use outside the US
(partial) transfer of IP to Google Ireland Holdings
Google Ireland Holdings Unlimited Company Google Ireland Limited
• Owns the rights of IP use outside the US • Reports turnover from advertising
• Sub‐licences IP rights to Google Netherlands • Exploits and reports costs of IP
Google Netherlands Holding B.V.
Royalty payments • Is granted a sub licence to the right of IP use Royalty payments
2016: 15 billion € • Re‐licences this sub‐licence to Google Ireland 2016: 12 billion €
Limited
Royalty payments
2016: 3 billion €
Google Asia Pacific

20
company abroad. A practical question is whether such international intragroup IP
transactions will be recorded in all the countries involved in a symmetrical way. In other
words, will the value representing the export of the IP from the US equal the import value as
reported in Bermuda/Ireland?
Another question is the country of residence of the Google Ireland Holdings Unlimited, as
this company is registered in Ireland but managed and controlled in Bermuda and also tax
liable in Bermuda. Which country should conceptually be recording this unit in their National
Accounts and which country is actually doing this?
Google Netherlands Holding B.V. is registered in the Netherlands, files annual returns to the
Dutch Chamber of Commerce and is liable for tax in the Netherlands. As Google Netherlands
Holding B.V. lacks a domestic parent it must be considered an independent resident
institutional unit in the Netherlands. Google Netherlands Holding B.V. is granted a sub‐
licence for the IP assets but no information of its value is shown in business reports. Google
Netherlands Holding B.V. does not carry out significant economic activity from a national
accounts perspective, has no employment and appears to do no more than channelling
financial flows from one country to another. In doing so it fully acts on behalf of its foreign
parent. The inflow of funds equal outflows with a small margin covering local costs. From the
point of view of the Netherlands, it is defendable that these in‐ and outflows are recorded as
financial transactions and not as IP related services imports and exports. But from the point
of view of Ireland such a recording would create an asymmetry as Google Ireland Limited is
expected to report an import of IP services from the Netherlands. Or perhaps directly from
Bermuda?
TheBermudatriangle
Given the residency issue of Google Ireland Holdings Unlimited, it is not unlikely that this entity will
show up neither in Irish nor in Bermudan statistics. In other words, in the world of statistics the
Bermuda triangle appears a real threat. This view is strengthened by simply comparing the value of
the royalty transactions involved to the annual GDP figure for Bermuda. In 2015 Bermudan GDP was
5.9 billion US dollars.16 This amount is far less than the 14.9 billion euros that Google’s Dutch
subsidiary paid in 2016 to its Bermudan subsidiary. The tentative conclusion is that earnings of
Google Ireland Holdings Unlimited Company are not included in Bermudan measures of GDP. The
compilers of Bermudan GDP may not view this unit as being resident in Bermuda, or otherwise may
not conceive Google Ireland Holdings Unlimited as the producer of IP services with a 14.9 billion
euros turnover.
The Double Irish with a Dutch Sandwich strategy is known to be used, or has been used by other
large companies than just Google. Attempting to extrapolate out from this one case study to quantify
with any degree of accuracy what might be the total of unrecorded GDP is nearly impossible without
vast amounts of time and resources. Even then the wall of corporate secrecy would act as a serious
impediment to obtaining good estimates of globally unrecorded output.
Research undertaken in other areas does allow some read across of attempts to come to a ball‐park
estimate for the global problem. For instance Garcia‐Bernardo et al (2017) analyse global corporate
16 Official estimate of Bermudan government, https://www.gov.bm/bermuda‐economic‐statistics
21
ownership structures from a network analysis approach and in doing so designate certain countries
as either sink or conduit financial centres. The authors identify Bermuda as one of the largest sink
offshore financial centres in that it is the net recipient of far more foreign capital than would be
expected given Bermuda’s level of GDP. The question remains whether this lost income should be
recorded in Bermuda’s GDP at all.
Guvenen et al (2017) attempt to reattribute foreign earnings of U.S. led MNE groups to study what
impact this has on measures of U.S output and industry productivity. In doing so they reattribute
earnings from Bermuda to the US of 35 billion US dollars which represents the equivalent of almost 6
times Bermudan GDP. The authors conclude that current US measures of output suffer from
measurement errors as a result of earnings by US corporations being shifted to countries with
relatively low tax rates. The authors also indicate that repatriated earnings from the United Kingdom
Islands in the Caribbean including the British Virgin Islands, Cayman Islands and Turks and Caicos
Islands as equal to 4.8 times the GDP of these lands. The largest repatriation, 28% of the total, is
actually from the Netherlands. This shows that the problem of profit shifting does not necessarily
have to involve what could be termed the traditional tax paradises.
This paper makes no attempt to put a value on the total of global unreported value added. Rather it
concludes that this total is expected to be substantial. If the coverage of just one MNE in the National
Accounts alone is responsible for 15 billion US dollars of missed output then the total of all MNE
groups could easily exceed 100 billion dollars. Zucman (2015) indicates that profit shifting to low tax
jurisdictions outside the US represents an amount of 130 billion US dollars. One may expect that
most of this capital income will not be reported in any country’s GDP. Compared to global GDP of
around 75 trillion dollars this unobserved income may still seem small. But as indicated by Guvenen
et al. tax planning arrangements may have significant and undesirable effects on the macroeconomic
indicators at national level.
4.2ThecaseofNike
A so‐called “closed” Dutch limited partnership, in Dutch a ‘commanditaire vennootschap’ or C.V., is
used by several American MNE groups such as Nike, General Electric, Heinz, Caterpillar, Time Warner
and Foot Locker.17 The C.V. tax planning route has brought the Netherlands under accusation of
being a tax haven for American companies similar to places as the Caymans Islands, Switzerland and
Bermuda. How the C.V. construction works is explained with the help of the Nike example.
Also in this case IP assets are a key element in the tax planning arrangement. As explained in the
UNECE Global Production Guide (paragraph 2.17) the value of sports brands such as Nike may partly
originate from R&D, i.e. the development of “a the midsole, the most important part of an athletic
shoe, that cushions and protects the foot”. However, it is quite clear that sports brands such as Nike
are also the outcome of intensive marketing which is in the strict 2008 SNA sense a non‐produced
asset. When observing the profit and loss accounts and balance sheets of royalty and licences
companies the distinction between produced and non‐produced intangible assets, also in terms of
related capital services or royalty receipts, is not easily made. This point is addressed later on in this
section.
17 https://thecorrespondent.com/6942/bermuda‐guess‐again‐turns‐out‐holland‐is‐the‐tax‐haven‐of‐choice‐for‐us‐companies/417639737658‐b85252de

22
From a national accounts perspective the case of Nike looks similar to that of Google in that specific
units within the MNE own IP assets intrinsic to the production process for which they are reimbursed
by other units within the MNE group’s global value chain for the use of those IP assets. However Nike
does not use Irish registered units but rather a specific type of Dutch legal construction Nike Innovate
C.V. which is a subsidiary of the Nike Group. It is registered with the Dutch Chamber of Commerce,
though with its official address recorded as being in Oregon in the United States. The activities of the
business are recorded by the Dutch Chamber of Commerce as ‘holding IPP rights, financing R&D and
buying‐out third party licences’. As reported in the international media, Nike Innovate C.V. is the
legal owner of IP assets including trademarks and designs belonging to the Nike Group18. It is useful
to emphasise that purchased marketing assets and goodwill are also assets in the SNA sense,
however they are classified as non‐produced and therefore not considered as intellectual property
products.
According to the Dutch tax law C.V.’s are not themselves liable to pay Dutch corporate income tax. It
is assumed that the sponsor or owner of the C.V. is liable to pay corporate income tax. However
under US tax law the C.V. is seen as liable for tax in the Netherlands. This misclassification can result
in certain C.V.’s being liable for corporate income tax in neither the Netherlands nor the US. In effect
such C.V.’s become stateless19.
If Nike Innovate C.V. is not liable to pay corporation tax in the Netherlands, it will also not appear in
tax data used by Statistics Netherlands for compiling economic statistics. Also, as Nike Innovate C.V.
is not registered with an address in the Netherlands, this entity is not surveyed for official statistics.
As a result, Nike Innovate C.V. remains uncovered by the official statistics for the Netherlands. Nor
should it be expected that this entity will show up in the statistics of any other country.
The Netherlands also hosts Nike Europe Holding B.V., which is a holding company for other Nike units
within Europe including Nike Europe Operations Netherlands B.V.. This unit is the European
headquarters of Nike with around 2000 employees in the Netherlands. Nike Europe Holding B.V. has
a branch located in Belgium, where the Nike Customer Service Center is located. The customer
service centre provides central warehousing activities to its subsidiary Nike Europe Operations
Netherlands B.V. which is the owner of the inventory held at the warehouse and which is the main
commercial entity of the Nike group in Europe and the Middle East. As explained in the financial
report20 the warehousing activities involve all supply‐chain related activities, including receipt,
storage, order handling and shipment of Nike products.
The principal business activity of Nike European Operations Netherlands B.V. is given as the
marketing and selling of athletic footwear, apparel, equipment, accessories and services21. For the
year June 2015 to June 2016 the unit recorded revenues of 8.4 billion euros, the majority of which
were generated outside the Netherlands by its subsidiaries. Nike Europe Operations Netherlands B.V.
and its subsidiaries generate revenue by selling goods across Europe and beyond, either directly to
consumers, or via independent distributors and licensees.
18 https://www.irishtimes.com/business/how‐nike‐slashes‐its‐tax‐bill‐between‐the‐netherlands‐and‐bermuda‐
1.3281665 19 http://leidenlawblog.nl/articles/what‐about‐cv‐bv‐structures‐and‐state‐aid 20 Nike Europe Holding B.V. financial report for year ending May 2016, publically available from www.kvk.nl 21 Nike European Operations Netherlands B.V. financial report for year ending May 2016, publically available from www.kvk.nl

23
Revenue of Nike Europe Holding B.V. is solely limited to the services provided by the customer
service centre to Nike Europe Operations Netherlands B.V. for which they are reimbursed on a cost
plus mark‐up basis. For the year from June 2015 to June 2016 this revenue is recorded as 262 million
euros. However Nike Europe Holding B.V. recorded for the same period general and administrative
expenses of 1.268 billion euros. Of this 1.017 billion euros is recorded as trademark royalties, ‘’in
connection with the distribution and commercial exploitation of Nike Intangible Property and Nike
marks.’’22 The result of making a royalty payment far in excess of revenue is that Nike Europe Holding
B.V. records an operating loss which is then financed by dividends from its subsidiaries and
principally from Nike Europe Operations Netherlands B.V.. This description of Nike’s operations in the
Netherlands has been the case since November 2012 when Nike Europe Holding B.V entered into “a
certain agreement in connection with the distribution and commercial exploitation of Nike intangible
property and Nike marks.’’23
Figure 2 details the transactions that take place between the units under discussion with additional
details taken from the publically available annual reports filed at the Dutch Chamber of Commerce.
Figure 2 The Nike case
The case of a sports shoes manufacturer was also a prominently used example in the UNECE Guide to
Measuring Global Production (UNECE, 2015). The example was used to discuss the production
arrangements between a principal and contracted foreign suppliers including the more specific issues
of merchanting and FGPs. However the particular issue of IP assets being held in an, as far as
National Accounts measures are concerned, stateless entity was not discussed. Before the
information revealed by the Paradise Papers, such an example was simply too bizarre to imagine.
22 ibid 23 Nike Europe Holding B.V. financial report for year ending May 2013 publically available from www.kvk.nl
Nike Inc.
• Top of global Nike Group
• Creates IP
• Grants the rights of IP use outside in Europe to
transfer of IP Nike Innovate CV
Nike Innovate CV Nike Europe Operations Netherlands B.V.
• Registered in the Netherlands. • Reports turnover from selling sporting goods
• Owns certain IP within the Nike group • Legal and economic owner of inventory at
• Not seen as a resident institutional unit in the European distribtuion centre
Netherlands • Resident institutional unit in the Netherlands
Nike Europe Holding B.V.
Royalty payments • Holding company for Nike subsidiaries in Europe Dividend payments
2015/16: 1 billion € • Operates distribution centre via Belgian branch 2015/16: 575 million €
• Resident instituional unit in the Netherlands
Dividend payments
2015/16: 377 million €
Other subsidiaries

24
As a commanditaire vennootschap, Nike Innovate C.V. is not required to file annual accounts with the
Dutch Chamber of Commerce. Obtaining details on any of this entity’s transactions is therefore
difficult. The accounts of Nike Europe Holding B.V. do not reveal the names of the recipients of the
royalty payments within the Nike Group. Media reports have identified Nike Innovate C.V. as being
the recipient of royalty payments from Nike’s European headquarters in the Netherlands24.
From a conceptual viewpoint, it is not clear how the income flows related to non‐produced intangible
assets such as brand names should be recorded in the National Accounts. Marketing assets,
trademarks and designs fall outside the fixed assets boundary. As explained by BMP6 (par. 10.140)
trademark revenue, payments for use of brand names, and so forth include aspects of property
income (i.e., putting a non‐financial non‐produced asset at the disposal of another unit) as well as
aspects of services (such as the active processes of technical support, product research, marketing,
and quality control). The recording of income flows obtained from non‐produced intangible assets
such as trademarks and brand names is not explicitly addressed in the 2008 SNA.
NationalAccountsimplications
It is expected that the revenues of the above C.V.’s will not be accounted for in either the
GDP of the US or the Netherlands. This is due to the peculiar tax status of these C.V.’s. The
repercussion for statistical measurement is that Nike Innovate C.V. has no resident status.
This would imply that the more benign sounding Dutch Polder is equally as dangerous to
global GDP as the Bermuda Triangle. Both places function as royalty income sinks. Looking at
the substance of the arrangement one would probably argue that the actual economic
ownership of the Nike brand name is still in the hands of Nike headquarters in Beaverton,
Oregon, US.
At the same time, one may expect that the service charges for using the Nike brand will be
(implicitly) recorded in business surveys as production costs of Nike European Operations
Netherlands and perhaps of other affiliated companies. Whether these cost charges are ‘at
arm’s length’ cannot be assessed.
Also, the 2008 SNA is not particularly clear on whether these expenses should be part of the
current cost of production, i.e. intermediate consumption, at all. The Nike case shows that
non‐produced assets can be put at the disposal of other units for use in their production
process. If done so the owner of the assets may receive royalty or licence payments in
exchange. This can be the case with marketing assets such as trademarks, logos or brand
names. Royalty payments in exchange for the use of marketing assets would differ from
those for produced assets as marketing assets are classified in the SNA as non‐produced
assets. This raises the question of how royalty payments for the use of non‐produced assets
should be recorded.
Besides loopholes caused by differences in tax policies, the National Accounts seem to suffer from a
similar kind of mismatches. Entities such as Google Ireland Holdings and Nike Innovate CV appear to
be stateless in the eyes of the national accountant. This may partly result from differences in how
national accountants put in practice the SNA guidelines on e.g. the residency principle of statistical
units.
24 https://www.theguardian.com/news/2017/nov/06/nike‐tax‐paradise‐papers

25
5.Conclusion
Unlike Lynch & Thage (2017) we generally support the choice of capitalising R&D expenditure in the
National Accounts. It is beyond doubt that knowledge investments are crucial for the
competitiveness of firms. As successful knowledge investments will generate returns over a range of
years, it is difficult to ignore the concept of knowledge capital in the National Accounts. Doing so
would inevitably diminish the relevance of national accounting.
At the same time we argue that the 2008 SNA approach of R&D capitalisation has gone too far. The
2008 SNA is insufficiently clear in explaining under which conditions knowledge truly represents an
economic asset in the SNA sense. As argued in this paper, knowledge becomes an economic asset
under the following conditions:
1. The economic owner has exclusive ownership over the knowledge;
2. This exclusive ownership is expected to generate for its owner an economic (competitive)
advantage and a return on investment.
Exclusive ownership enforced by a patent, secrecy or by other means (having access to the
complementary tacit knowledge) is, in our opinion, a precondition for the existence of a knowledge
asset. As a consequence, capitalisation of freely accessible academic research as recommended in
the 2008 SNA should be reconsidered.
Also within the enterprise group the concept of knowledge (R&D) ownership is insufficiently
understood. The National Accounts methodology does not acknowledge that decisions on R&D
programs and funding are often made by headquarters and affect the entire MNE structure. As such
the international guidelines do not adequately explain how knowledge capital is linked to the MNE
and international value chains. For example the SNA should provide guidance on whether knowledge
capital ownership should be identified at the level of the establishments, enterprises or enterprise
groups. Additional guidance on these general principles is highly needed. This paper shows that R&D
ownership is most easily identified at the level of the enterprise group. Assigning its ownership to
lower levels in the MNE structure such as establishments, as is done for other fixed capital asset
categories, is not straightforward.
In the National Accounts production is described at the level of establishments or kind of activity
units. Their classification is according to ISIC. Similarly, a multifactor type productivity analysis usually
requires that inputs and outputs of production can be statistically described at the level of
establishments. Our impression is that R&D is different from other fixed assets. Particularly within
the global value chain R&D asset ownership is not easily linked to the individual fragments of the
global value chain and cannot be assigned to individual ISIC establishment classes. The Frascati
Manual (OECD, 2015) recommends collecting R&D statistics at the level of the institutional unit (i.e.
the enterprise) and not the kind of activity unit. Vancauteren et al. (2018) show that for the analysis
of patent ownership the enterprise is essential in the construction of patent datasets as firms tend to
register patents (and R&D) under separate firm names.
Additionally, the 2008 SNA should provide much more guidance on how to treat R&D (or IP)
ownership in the context of tax planning. The UNECE Global Production Guide suggests following

26
legal ownership as a second best alternative. This paper shows that this solution is unsatisfactory
from an analytical point of view. Following legal ownership seems to imply that portions of IP related
income are not accounted for at all, neither from a national nor global viewpoint.
Finally this paper shows that official statistics as collected at national level will not necessarily reveal
the tax planning arrangements MNE groups are undertaking. Official statistics can only fulfil their key
task of informing the public about macro‐economic developments, if national accountants combine
their efforts in making sense of the data collected from internationally operating companies. The
work on data sharing that is currently being undertaken is therefore very welcome. Also, one may
hope that the OECD Base Erosion and Profit Shifting (BEPS) initiative will provide improved data
sources on the activities of MNE groups.
Our recommendations to improve the recording of R&D and IP in National Accounts are the
following:
As explained the definition of (R&D) knowledge assets in the SNA requires refinement to
explain that freely shared knowledge is not an asset in the SNA sense;
The issue of R&D asset ownership inside the MNE requires continued investigation. As a
starting point it is worth investigating whether R&D ownership could and should be assigned
to the enterprise group or it’s headquarter. This is where decision making on R&D programs
and budgets often take place. However, from a statistical measurement point of view this
proposal has undoubtedly several practical implications. For example:
o As explained in Section 3 this would require modifications in the accounts and close
cooperation between all the national statistical institutes involved. A rerouting of a
more limited scope would address the IP transactions of artificial brass plate type
royalty and licences companies. A worked example is presented in the annex. The
operation increases in complexity once several affiliates or business units inside the
MNE group may generate profits which partly originate from the MNE group’s
intellectual property. The option of applying cost retribution methods in the national
accounts, not only for IP costs but generally for all sorts of intragroup services
provided by head offices, should be investigated.
o Another proposed step is assigning the R&D from regional R&D units to headquarters
(cf. Tables 1 and 2). From the perspective of the country (A) in which this R&D facility
is resident the recording of its output would be export rather than gross fixed capital
formation. The accounts of country (B) domiciling the headquarters would show the
R&D gross fixed capital formation which originates from import. The R&D would
subsequently be depreciated in country (B).
o The extent to which MNE group activities can impact macroeconomic statistics may
require the need for more radical solutions that go beyond rerouting within the
current SNA framework. For example Rassier (2017) has raised the question of
whether MNE group activities would be better recorded in a SNA framework that
offers dual presentation measures rather than single measures that conflate
operating entities with special purpose entities.

27
Obviously, all such options require a concerted action of all the countries involved. Such
accounting solutions can only work when national statistical offices start working closely
together. In the current information society this should work, particularly when NSI’s are able
to overcome legal constraints when strictly co‐operating within multinational official
statistics networks.
Throughout the world, and of course on a confidential basis, national accountants must start
sharing their data and knowledge on MNE groups with the main goal of improving the
common understanding of MNE group structurers and the recording of MNE group activities
on a country by country basis. Recent experiences show that accounting for MNE groups is
no longer achievable on an individual country basis. The accurate recording of IP transactions
and ownership inside the MNE groups requires international statistical coordination in order
to avoid the existence of GDP sinks such as the Bermuda Triangle and the Dutch Polder. The
international organisations should facilitate such data sharing initiatives. Some of them,
Eurostat, UNECE and OECD have already started doing so.
Statisticians and National Accounts compilers should inform the public that tax planning is
not only an issue for government revenue but also for official statistics. This may sound naïve
as tax base erosion is of course primarily an issue of social fairness in terms of fair tax bill
sharing between citizens and companies and in terms of fair corporate competition.
However, one of the undesired consequences of non‐published arrangements between MNE
groups and tax authorities is that statisticians are seriously hampered in their task to inform
the public properly on the actual state of economic affairs and the nature of activities
companies are undertaking in their countries.
National accountants need to be vocally supportive of a country by country company
reporting as recommended in the OECD’s Base Erosion and Profit Shifting prevention
initiative as a way to ensure an improved monitoring of national and global economic
developments.25
Future updates of SNA should consider the recording of non‐produced non‐financial assets
(marketing assets) and royalties earned on them particularly in the context of tax planning
strategies within MNE groups. The 2008 SNA should as a minimum elaborate on the advice of
BPM6 for how to deal with income (rent) obtained from the ownership of non‐produced
assets (i.e. trademark and marketing assets).
25 http://www.oecd.org/tax/beps/country‐by‐country‐reporting.htm

28
References
Brothers, J. ‘From the Double Irish to the Bermuda Triangle’, Tax Analysis, November 2014.
Eurostat, ‘Manual on goods sent abroad for processing’, 2014.
Garcia‐Bernardo, J., Fichtner, J. Takes, F.W. Heemskerk, M. Eelke ‘Uncovering Offshore Financial Centers: Conduits and Sinks in the Global Corporate Ownership IPP Network’, Scientific Reports. 2017
Geest, M. van, J. van Kleef, H. Smits ‘Het Belastingparadijs. Waarom niemand hier belasting betaalt ‐ behalve u’, Business Contact, 2015.
Guvenen, F. et al. ‘Offshore Profit Shifting and Domestic Productivity Measurement’, NBER Working Paper, 2017. Available at http://www.nber.org/papers/w23324
Haan, M. de & M. van Rooijen‐Horsten (2004) ‘Measuring R&D Output and Knowledge Capital Formation in Open Economies’. Paper Prepared for the 28th General Conference of The International Association for Research in Income and Wealth Cork, Ireland, August 22 – 28, 2004
Haan, M. de, P.H. van Mulligen, P. van de Ven & K. Zeelenberg, ‘National accounting in the knowledge and information society’, paper prepared for the 28th General Conference of The International Association for Research in Income and Wealth, Cork, Ireland, August 22 – 28, 2004.
European Commission, IMF, OECD, UN & World Bank, ‘System of National Accounts 2008’, 2008.
Lynch R. & B. Thage ‘Maintaining the National Accounts as official statistics’, Review of Income and Wealth 63, supplement 2, 411‐436, 2017.
OECD, ‘Handbook on deriving Capital Measures of Intellectual Property Products’, 2009.
OECD, ‘Frascati Manual’, 2015.
Papanastassiou, M. & R. Pearce, ‘Are Funding sources and the strategic roles of decentralised R&D in multinationals’, R&D Management, Volume 35, Issue 1, January 2005.
Rassier, D. ‘Improving the SNA treatment of multinational enterprises’, Review of Income and Wealth 63, supplement 2, 2017.
Rooijen‐Horsten, M. van, M. Tanriseven & M. de Haan R&D, ‘Satellite accounts in the Netherlands, a progress report’, paper prepared for the OECD Working Party on National Accounts, Paris, 3‐5 October 2007 Session: Measuring capital stock, capital services and productivity.
Schreyer, P., ‘Globalisation, Intellectual Property Products and Measurement of GDP: Issues and Some Proposals’, backpaper for the CSSP Informal Reflection Group, 2018.
UNECE, ‘The impact of globalization on the National Accounts’, 2011.
UNECE, ‘A guide to measuring global production’, 2015.
Vancauteren, M. , M. Polder & M. van den Berg, ‘The relationship between tax payments and MNEs patenting activities and implications for real economic activity: Evidence from the Netherlands’. Paper for Conference on Research in Income and Wealth, The Challenges of Globalisation in the Measurement of National Accounts, March 9‐10 2018, Washington DC.
Zucman, G. ‘The hidden wealth of nations’, The University of Chicago Press, 2015.

29
Annex–Googlecase:reroutingofIPtransactions
The concerted accounting treatment of Google, as proposed in this paper, would be to identify
Alphabet as the genuine producer of the IP services as consumed by Google Ireland Limited (and of
course as consumed by any other non‐US Google affiliate). This coincides with the economic
ownership of the IP being assigned to Alphabet in the US (in contrast of legal ownership). Of course
this would imply that Google Ireland Holding is no longer identified as a royalty and licences firm. In
fact both Google Ireland and Google Netherlands holdings would be classified as purely financial
vehicles, “Other financial intermediaries” (S.127), with no output. Their main purpose seems to be
managing the international cash flows on behalf of the mother company.
Legal representation
Economic interpretation
Google Netherlands
Alphabet Google Ireland Holding Holding Google Ireland Limited
P.1* 12 P.2 12 P.1 12 P.2 12
AF.2 12 Af.2 12 AF.2 ‐12
AF.2 ‐12
Google Netherlands
Alphabet Google Ireland Holding Holding Google Ireland Limited
P.1 12 P.2 12
AF.5 12 AF.2 12 AF.5 12 AF.2 12 AF.2 ‐12
AF.2 ‐12