Raminderjit Singh Wasu
303
Transcript of Raminderjit Singh Wasu

Edition : 2018............................14,968 Copies
Raminderjit Singh WasuSubject Expert (Geography & Media Studies)
82.00
M/s Holyfaith International Pvt. Ltd. C-57-58 Focal Point Extension,


1
CHAPTER I
INDIA – An Introduction
On examining the globe carefully, we could locate a huge landmass oftriangular shape, in the Indian Ocean. This landmass is none other than yourown country, India, which gave its name to this Indian Ocean also. Surroundedfrom three sides by the Indian Ocean and in the north by the high mountainsof Himalaya, India is a vast country of great capabilities. It ranks second afterChina in terms of population and seventh in terms of area in the world.
This huge landmass and populated country of south Asia, which is knownfor its old tradition is gradually entering into the changing world. Its size is sohuge from east to west that when there is sunrise in the east i.e. ArunachalPradesh, then in the west i.e. Saurashtra region of Gujarat, there is still night.Due to the variability of temperature, a wide variety of crops can be grownhere.
This country of hundred crore population is comprised of almost 6 lakhvillages and 5 thousand towns and cities.
Making republic, secularism and socialism as a basis of its national policyafter its independence, it attracted the attention of the world community. TodayIndia is the largest Republic country of the world. In the middle of the 1960’s,it again, stunted the whole world by the tremendous increase in foodgrainproduction through “Green Revolution”. Now it has strong agricultural andindustrial base. Today the foreign capital investors are very much eager toinvest their capital in the Indian economy. It had made a tremendous progressin the space technology.
But, besides these achievements, there exist many black spots. In India,highest number of world’s illiterates reside. More than one third of the country’spopulation is living below the poverty line. It has great social, political andeconomic inequalities. On the one hand in Kerala, 9 out of 10 females are literate.But in Bihar on the other extreme, this average is just 3 out of 10. Situation ofeconomic inequalities is indicated by the fact, that 20 percent people of highclass share 50 percent share of national income, whereas, 70 percent peoplebelonging to lower strata poor state have just 20 percent share in the nationalincome.
Would you like to know more about your country which is full ofdiversities and inequalities? How the people of India have used or misused itsland, water and air resources and what are their regional patterns, is not onlyan important thing to know but also a subject of intensive discussion.

2
To search for the answers of these questions would not only be interestingfor the student of geography but is also compulsory from the geographicalpoint of view. A systematic detailed description of various elements ofgeography of India has been given in the proceeding pages. But before that,the general introduction of India has been given, in which a brief descriptionabout name, situation, regional or locational extent and socio-economic setuphas been dealt with.
Many concepts related to the name of India are found in the ancientliterature. According to that, its first name was ‘Himalaya – Shet – Prayatani’,which means a country between Himachal and Rameshvaram. Secondly, due toits occupance by the Aryan people, this region was also known as the ‘Aryavarta’.Thirdly, after the name of ‘Bharat’ a strong king, who was the son of kingDushyant and Shakuntala, this country was named as ‘Bharat’. Fourthly, itsrecent name ‘India’ has been taken from the north-west flowing river ‘Sindhu’by the Aryan people of vedic age. The people of its neighbouring country Iranpronounced this ‘Sindhu’ as ‘Hindu’. The people living around this river becamethe residents of ‘Hindustan’. The Greeks converted this word ‘Hindu’ into‘Indos’. After reforming this word, the Romans named it as ‘Indus’. In thisway our country is called by different names as ‘India’, 'Hindustan’ and ‘Bharat’.
Situation
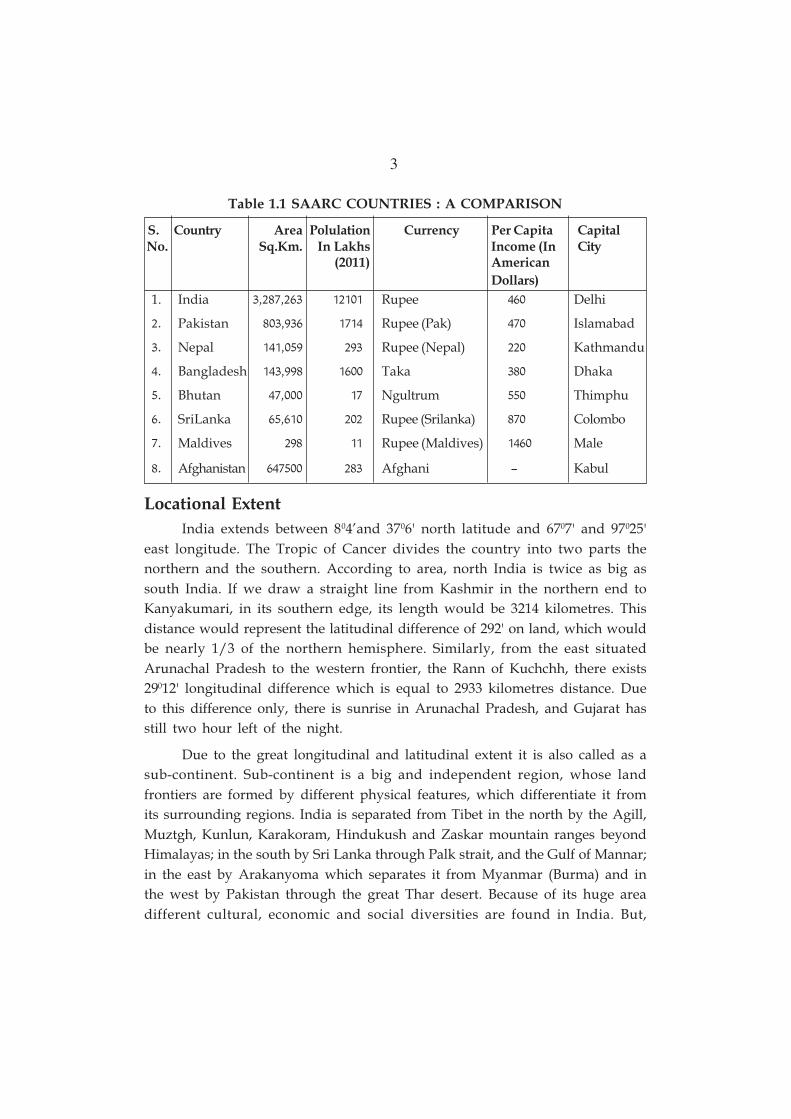
India is a giant country which extends into the south of the continent ofAsia. It has a triangular shape due to the great mountainous wall of Himalayasin the north and Indian Ocean in south. It also has Arabian Sea on its one sideand Bay of Bengal on the other side. Due to its location in the easternhemisphere, it is counted among the eastern countries. The inter-national searoutes passing through the Indian Ocean connect India to the developedcountries (European and American) of west on one hand and on the other witheast and far-east countries of China, Japan, Indonesia and Australia. Exceptthese, trade relations through sea route are also emerging with Africa andmiddle-east countries. Its trading importance also increased after the openingof the suez canal. This canal has reduced the distance by 4800 kilometres betweenIndia and parts of western Europe. In this way India has central location in theIndian Ocean. Only due to its central location, it could on the one hand oppressthe militancy, which is operating in Sri Lanka and Maldives and on the otherprotect ocean highway men/robbers in the last decade to the other hand byutilizing its powerful navy and ultimately helped to restore peace. That is whyIndia has important place in the group of ‘SAARC’ countries. Table 1.1 representssome important data about SAARC nations. This clearly reflects the importanceof India in terms of area and population.
3
Table 1.1 SAARC COUNTRIES : A COMPARISON
S. Country Area Polulation Currency Per Capita Capital No. Sq.Km. In Lakhs Income (In City
(2011) American
Dollars)
1. India x,w}|,w{x vwvÆv Rupee y{Æ Delhi
w. Pakistan }Æx,~x{ v|vy Rupee (Pak) y|Æ Islamabad
x. Nepal vyv,Æz~ w~x Rupee (Nepal) wwÆ Kathmandu
y. Bangladesh vyx,~~} v{ÆÆ Taka x}Æ Dhaka
z. Bhutan y|,ÆÆÆ v| Ngultrum zzÆ Thimphu
{. SriLanka {z,{vÆ wÆw Rupee (Srilanka) }|Æ Colombo
|. Maldives w~} vv Rupee (Maldives) vy{Æ Male
}. Afghanistan {y|zÆÆ w}x Afghani – Kabul
Locational Extent
India extends between 804’and 3706' north latitude and 6707' and 97025'
east longitude. The Tropic of Cancer divides the country into two parts the
northern and the southern. According to area, north India is twice as big as
south India. If we draw a straight line from Kashmir in the northern end to
Kanyakumari, in its southern edge, its length would be 3214 kilometres. This
distance would represent the latitudinal difference of 292' on land, which would
be nearly 1/3 of the northern hemisphere. Similarly, from the east situated
Arunachal Pradesh to the western frontier, the Rann of Kuchchh, there exists
29012' longitudinal difference which is equal to 2933 kilometres distance. Due
to this difference only, there is sunrise in Arunachal Pradesh, and Gujarat has
still two hour left of the night.
Due to the great longitudinal and latitudinal extent it is also called as a
sub-continent. Sub-continent is a big and independent region, whose land
frontiers are formed by different physical features, which differentiate it from
its surrounding regions. India is separated from Tibet in the north by the Agill,
Muztgh, Kunlun, Karakoram, Hindukush and Zaskar mountain ranges beyond
Himalayas; in the south by Sri Lanka through Palk strait, and the Gulf of Mannar;
in the east by Arakanyoma which separates it from Myanmar (Burma) and in
the west by Pakistan through the great Thar desert. Because of its huge area
different cultural, economic and social diversities are found in India. But,

4
irrespective of this, there exist unity in the country, in terms of climate and
culture etc.
Size and Area
The shape of India is a triangle whose base is in north and top towards
the south above Kanyakumari. It is not too big and not too small in terms of
area. Total area of our country is about 3287263 sq. km, which is 2.2 per cent of
the world total area. In this way, according to area, India is seventh largest
country of the world. The other six nations are Russia, Canada, China, United
States of America, Brazil and Australia respectively. In comparison to big
countries, it is just equal to the about one-seventh part of Russia and one-third
part of Canada. Whereas it is twelve times bigger than from England and eight
times bigger than Japan in comparison to small countries.
Neighbouring Countries
Seven nations are having common land frontiers with India. To its north-
west and north, Pakistan, Afghanistan, China and Nepal are its neighbouring
countries and Bhutan, Myanmar (Burma) and Bangladesh are frontier countries
in the north-east.
Political Setup
Prior to Independence, India was divided into 562 small princely states
and 9 British Provinces. After getting Independence on 15th August 1947, an
effort was made to merge small states in the adjoining states. A State’s
Reorganisation Commission was constituted in 1953 to reorganize boundaries
of the states on linguistic basis. In this way, whole country was divided into 14
state and 6 union territories. Afterward, these divisions lead to the formation
of many states, which were given new names and many union territories were
provided with the state status. Today’s, Punjab also came into being after the
recommendation of Shah Commission, as a Punjabi speaking state on 1st
November 1966.
Present day India comprises 28 states and 7 centrally administered
territories. States and their capitals are shown in the following table and map.

5
1.1
INDIAAdministrative Divisions
JAMMU & KASHMIR
Srinagar
HIMACHALPRADESH
ShimlaPUNJAB
ChandigarhDehradun
UttrakhandHARYANA
DELHI
RAJASTHAN
Jaipur UTTAR PRADESHLucknow
Ganganagar
GUJARAT
Bhopal
MADHYA PRADESH
SIKKIM GangtokHangar
ASSAM
ARUNACHALPRADESH
NAGALANDKohimaDispur
MEGHALYAShillong
Imphal
MANIPUR
AizswTRIPURA
Agartala
MIZORAM
Patna
BIHAR
JHARKHAND
Ranchi
WESTBENGAL
Calcutta
CHHATTISHGARH
Raipur Bhubaneshwar
ODISHA
KARNATAKA
ANDHRAPRADESH
BangaloreMadras
TAMIL NADU
Hyderabad
GOA
KERALA
Panji
Boundaries :
National
Capitals
State/Union Territory
National
State/Union TerritoryANDAMAN &NICOBAR
0 500
kms.
Union Terrllories ared named in Italics
Port Bihar
Thiruvanathapuram
Kavarati
LAKASHDWEEP
Silvassa
DNHNAGAR HAVELI
MAHARASHTRA
DiuDAMAN
Bombay

6
Table 1.2 : Features of Indias Population, 2011
S.No. Name of state Capital Area Total Density Literacy
(Sq. Km.) Population (Persons rate
per Sq. Km.) (Percent)
INDIA New Delhi xw,}|,wyÆ v,wv,Æv,~x,yww x}w |y.Æy(i) STATE
v. Andhra Pradesh Hyderabad v,{Æ,wÆz y,~x,v},{{} xÆ{ {|.}yw. Arunachal Pradesh Itanagar }x,|yx vx,}w,{vv v| {{.~zx. Assam Dispur |},yx} x,vv,{~,w|w x~| |x.v}y. Bihar Patna ~yv{x vÆ,x},Æy,{x| vvÆw {x.}wz. Chhattisgarh Raipur vxz,v~v w,zz,yÆ,v~{ v}~ |v.Æy{. Goa Panaji x,|Æw vy,z|,|wx x~y }|.yÆ|. Gujarat Gandhi Nagar v~{,Æwy {,Æx,}x,{w} xÆ} |~.xv}. Haryana Chandigarh yy,wvw w,zx,zx,Æ}v z|x |{.{y~. Himachal Pradesh Shimla zz,{|x {},z{,zÆ~ vwx }x.|}vÆ. Jammu and
Kashmir Srinagar www,wx{ v,wz,y},~w{ z{ {}.|yvv. Jharkhand Ranchi |~,|vy xw,~{{,wx} yvy {|.{xvw. Karnataka Bangalore v~v,|~v {,vv,xÆ,|Æy xv~ |z.{Ævx. Kerala Trivandrum x},}{x x,xx,}|,{|| }z~ ~x.~vvy. Madhya Pradesh Bhopal xÆ},wyz |,wz,~|,z{z wx{ |Æ.{xvz. Maharashtra Mumbai xÆ|,|vx vv,wx,|w,~|w x{z }w.~vv{. Manipur Imphal ww,xw| w|,wv,|z{ vww |~.}zv|. Meghalaya Shillong ww,y~w w~,{y,ÆÆ| vxw |z.zÆv}. Mizoram Aizawl wv,Æ}v vÆ,~v,Ævy zw ~v.z}v~. Nagaland Kohima v{,z|~ v~,}Æ,{wÆ vv~ }Æ.vvwÆ. Oddisha Bhubaneshwar U vzz,|Æ| y,v~,y|,xz} w{~ |x.yzwv. Punjab Chandigarh zÆ,x{w w,||,Æy,wx{ zzÆ |{.{}ww. Rajasthan Jaipur xyw,wx~ {,}{,wv,Ævw wÆv {|.Æ{wx. Sikkim Gangtok |,Æ~{ {,Æ|,{}} }{ }w.wwy. Tamilnadu Chennai vxÆ,Æz} |,wv,x},~z} zzz }Æ.xxwz. Telangana Hyderabad v,vy,}yÆ x,zx,y{,}{z xvÆ {|.www{. Tripura Agartala vÆ,y}{ x{,|v,Æxw xzÆ }|.|zw|. Uttrakhand Dehradun zx,y}x v,Æv,v{,|zw v}~ |~.{xw}. Uttar Pradesh Lucknow w,yÆ,~w} v~,~z,}v,y|| }w} {~.|ww~. West Bengal Kolkata }},|zw ~,vx,y|,|x{ ~y| ||.Æ}

7
(ii) UNION TERRITORIES
v. Andaman and
Nicobar Islands Port Blair },wy~ x,|~,~yy y{ }{.w| w. Chandigarh Chandigarh vvy vÆ,zy,{}{ ~wzw }{.yx x. Dadra and
Nagar Haweli Silvassa y~v x,yw,}zx {~} ||.{z y. Daman and Diu Daman vvw w,yw,~vv wv{~ }|.Æ| z. Delhi (N.C.T.) Delhi v,y}x v,{|,zx,wxz ~xyÆ }{.xy {. Lakshadweep Kavarati xw {y,yw~ wÆvx ~w.w} |. Pudducharry Pudducharry y|~ vw,yy,y{y wz~} }{.zz
Source : Census of India (2011) : "Provisional Population Statistics", India Series-1, Paper of 2011, India
Registrar General and Census Commissioner, India, New Delhi.
India is the largest Republic, which was setup on 26th January 1950. Inthis, President is the head of country who is elected by the representatives ofParliament and States for a duration of five years. Indian Parliament is dividedinto two houses - the upper and the lower. Upper house is known as RajyaSabha and lower house as Lok Sabha.
Population Profile
India ranks second only to China according to population in the world.Here, on the 2.2 per cent area of the world, 16.7 per cent of the world’spopulation lives. According to 2011 census, its total population was 121.01 crore,with 62.4 crore males and 58.6 crore females. In this way according to the 2011census, its population density is 382 persons per square kilometre. Only 74.04per cent persons are literate the gender-ratio, as per 1000 males there are just940 females.
India’s population is increasing at a fast rate. According to estimates,every year there is an increase of almost 2 crore persons, which is more thanthe total population of Australia.
Regional Diversity: Due to its vast expanse, many diversities exist inIndia. That is why, many a times it is also known as the ‘Land of Diversities’.These diversities exist due to the presence of, mainly four elements:
1. Huge Expanse : Due to its great east-west and north-south expansion,existence of diversities is but natural. It is called as the sub-continent only dueto its regional expansion. Differences can easily be seen in every sphere of itsnatural or physical and human elements.
2. Relief : In India, where on the one hand oldest Aravalli Mountains of theworld are found, there also exist young Himalayan Mountains. Similarly, thereis peninsular plateau formed of hard and old rocks in the south and at thesame time we find huge and fertile plains of Satluj – Ganga –Brahmputra made

8
by the newer soils brought down by the rivers originating from the Himalayanmountain ranges.
3. Climate: (a) The Tropic of Cancer passes through the centre of India andthe area to its north has temperate type of climate. Most of this being far fromthe sea, comes mostly under the influence of continental type of climate.However, areas to the south of the Tropic of Cancer, being nearer to the Equatorare under the influence of tropical type of climate. Surrounded by sea from thethree sides, temperature here is always less than 400C, due to which hot andmaritime type of climate prevails in the Deccan Plateau region.
(b) The north-east receives more rainfall than the west. WhileCherrapunji is counted among the world’s highest rainfall receiving places, therealso exists dry region of Thar desert in extreme west of India.
4. Migration : People of different tribes, castes, religions, soldiers, and rulersfrom neighbouring and outer world countries have been coming from differentroutes and settling in India from thousands of years. We could find differentgroups of people. For example Mongolian tribes came through China frommiddle-Asia and north-east regions; Tibetan people came in through northernwest. Himalayan region; Aryans and Muslims came through Khyber and Bolanpasses from western Asian region and settled in north-western plain areas;Dravidians settled in plateau areas of south India and Tamils came from SriLanka and settled in Tamil Nadu.
5. Culture : Due to different ethnic and religious groups, found in differentregions of India, we find clear diversity in terms of language, life style, dress,eating habits, architecture, folk songs, folk dances, fairs, festivals and customsetc. Almost 187 languages are found in India, out of which only 23 languagesare spoken by 97 per cent people of the country. However, major Indianlanguages recognised by the constitution are 18 in number. In regard to folk-dances, Bharat Natyam, Kathakali, Kathak, Kuchi-pudi and Manipuri developedin the South, north and north-eastern parts of the country. In relation to religion,Jainis are found mostly in Saurashtra, Buddhists in Himalayan areas, Sikhs inPunjab, Muslims in Kashmir and Telengana and Christians in north-eastern parts.
As regards agriculture, due to availability of the great alluvial fertileplains in the north, alongwith mechanization, regular water supply managementand developed transport etc. agriculture has developed on modern lines. Onthe other hand, shifting (subsistence) agriculture is still being practised in dry(arid) Rajasthan, middle Vindhyachal and Maikal mountainous region, ChotaNagpur plateau, and north-eastern hilly areas of the country. Different groupsof tribal population of these areas have varied customs and cultures.
Unity in Diversity
Above mentioned elements prove that India is a country of diversities.Variations are found in its physical, economic, social and cultural elements. But

9
irrespective of these variations, unity prevails in the Indian society. Followingelements describe the unity in diversity in the country: -
(1) Monsoon Season
Our country has tropical monsoonal climate with agriculture as the mainoccupation, in which there is almost uniform sequence of seasons. Most of therainfall in the country comes in the summer season. That is why agricultureand economy of the entire country depends on the onset or coming of monsoons.These winds provide water to the agricultural land of the great plains. Theyalso help by making electricity supply certain which is generated in waterreservoirs in hilly areas. In this way these winds are a great boon to life in theurban and rural areas. That is why entire population of the country eagerlywaits for the monsoon winds.
(2) Religion and Culture
(a) Religious places: India is a country of many religions and devoteesof these religions are scattered in different parts of our country. But thesereligious places being the centres of spiritual power have at different timesjoined thousands of people living at different places and helped to inspire thefeeling of unity through religious integrity. Hindu devotees from every cornerof the country visit the religious places as Jagan Nath puri, Kashi, Badrinath,Amar Nath etc. for worship. Similarly large number of people from Muslimreligion visit places like Shrine (Mosque) of Khwaja Chisti at Ajmer, Jama Masjidand Bibi Ka Maqbara at Delhi for prayers. Devotees of Sikh religion come fromall over the country to the places like Harimandir Sahib, Ponta Sahib, HemkuntSahib, Hazur Sahib (Nandedh) etc. But an interesting thing to note here is, thatwhether it’s a temple of Hindu Gods and Goddesses, mosques of Pir-Faqir orGurudawara’s of Sikhs, people of different religions could be seen together atany one place, offering the prayers which is a strong sign of unity.
(b) Religious Saints: Besides religious places, religious Gurus, Pirs,Prophets, Sufi Saints etc. through their spiritual meetings and preaching providestrong base to the cultural integrity by generating brotherhood and communalharmony. Saints like Kabir, Guru Nanak, Tuka Ram, Surdas, Chisti, Ramanuj inevery part of the country through the message of unity and religious feelingsstrengthened the movement of cultural integrity. Guru Arjun Dev included thewritings of sufi saints of different religions in the Holy Guru Granth Sahib andestablished a new religious movement.
(c) Language and Art: Language plays a precious role in culturalcommunication and dispersal in different parts of the country. During the Vedicage, hymns were spoken in Sanskrit language only. The reason behind theimpact of Vedas and Puranas from Kashmir to Sri Lanka and from Rajasthan toManipur was that, their publicity was through the Sanskrit language. Even today,the base of all regional languages is Sanskrit. During medieval times Persianlanguage was in the full vogue. Sultans of Delhi recognized a new language

10
Urdu which was the mixture of Persian and Sanskrit, all over the country. Tilltoday this is known as Hindustani language. After independence, Hindi wasgiven the status of national language and English was considered as the linklanguage. Now, tri-language Agreement prevails in India. According to whichHindi would be National language, English would work as the link languageand in various regions efforts would be made to develop and popularize thelocal regional languages. But actually importance is being given to the use ofEnglish language. Although only two per cent people of the country know andunderstand English properly. In this kind of a situation maximum loss anddifficulty is faced by the tribals. Because in most of the states, school educationis not provided in their mother tongue. They had to learn firstly their regionallanguage, then national language Hindi and ultimately English. That is whytribal population (or people of tribal areas) had to cover a long distance of theknowledge of language to come in the main stream of the country.
According to the folk tales, folk songs sung in relation to monsoon atdifferent places are almost the same. As for instance, Tij in Punjab, Savan inHaryana, Kajri in Bhojpur and Malhar in Braj etc. Besides this, organizing Ballads,folk dances, music and plays under folk arts in different fairs, festivals andfete’s through inter-exchange, are developing the feeling of unity in the country.Also the Indian movies, not only in entire India but also in its neighbouringcountries are putting strong impact of the great Indian civilization and culture.
(d) Means of transport and communication: Development of thesemeans had played an important role in joining the different parts of the country.Railways and Roadways by connecting villages with the towns and difficulthilly areas with the developed centres had removed the regional hurdles whichcame in the way of marketing goods in economy. In this way, due to theestablishment of economic and social linkages people are joining the nationalstream and not ibkt the regional trend. Development of Doordarshan(television), Newspapers and Magazines have strengthened the national thinking.
(e) Migration: No doubt with the migration of villagers to the urbanareas and with their settling in the towns have given birth to the slums nearurban centres but coming in contact of people of different religious and socialgroups, has strengthened the feeling of brotherhood and unity.
In addition to the above mentioned elements, the central government isproviding jobs to the people of different regions in public and defence services.They are transferred to different regions of the country during their job tennure.This ends regional and individual narrowness and strengthens the feeling ofnational unity. Similarly, one constitution, one head of the forces, one currencyand democratic system etc. in the country have strengthened the feeling ofunity in the country.
In this way, we may say that inspite of great diversities, unity is there,and these two are not opposite to each other but are closely related and both

11
provide strength to the spirit of national unity. National unity is not just aspecific religion or special class or caste but is a mixed form of various culturesspread over India.
Exercise
I. Answer the following questions objectively :
1. What is the basis of naming Bharat as ‘India’ ?
2. What is the situation of India on the globe ?
3. What are the geographical divisions of Northern and Southern India ?
4. What is the location of India in respect of Indian ocean ?
5. Which countries came in direct contact with India because of the nearnessof its coastal boundaries with Indian ocean?
6. What are the evidences for the powerful naval force of India?
7. What is the extent of India ?
8. What is area, population and per capita income of India ?
9. Compare the area, currency, population and literacy of India with that ofPakistan ?
10. What is the North-South and East-West extent of India ?
11. What is the length of land and coastal boundaries of India?
12. What do you mean by sub-continent.
13. What is cultural fusion ?
14. What is the rank of India in the world in terms of area ?
15. Which countries share the land frontiers with India ?
16. What were the political division of India before Independence?
17. What work was done by the State Reorganization Commission ?
18. When was the Present Punjab State Created ?
19. What is the present administrative division of geographical set up of India?
20. Name the largest and smallest States of India in terms of area and population.
21. What is the number of members in the two houses of Parliament ?
22. Name some of the important religious places of India.
23. To which regions of India major groups of people came through migration.
24. In which areas/fields the country has failed on large scale ?
25. Write the names of major folk dances of India.

12
II. Answer the following questions in short :
1. Is India a sub-continent ?
2. What type of cultural diversities are found in India ?
3. What is the composition of India’s population ?
4. Write a note on India’s land extent.
5. What is the contribution of Indian languages and art to the unity in diversityof India?
6. Describe India’s regional diversity through any two facts.
7. Eleborate India’s unity in diversity in any two factors?
8. What has been the contribution of natural diversity towards culturalvariations in the country ?
9. “When the sun is rising in Arunachal, there is still night in Gujrat” Explain.
10. What is the place of India among SAARC countries ?
III. Answer the following questions subjectively :
1. How does India got its name ? Describe in detail its size and administrativedivisions.
2. What is the impact of India’s geographical location on its security, climate,trade and culture ?
3. “India is country of diversities” ? Explain the statement.
4. Which factors influence the regional disparities found in India ?
5. Which factors are responsible for maintaining India’s unity in Diversity ?
6. “In India. Diversity and unity are neither opposite to each other and nordevelop at the cost of each other, rather both are inter-related.” Give yourarguments in favour of and against this statement.
IV. Show the following facts on the map of Indian sub-continent :
1. India’s neighboring countries (with different colours).
2. Oceanic regions adjoining India (with names).
3. States, Union territories and capitals of states of India.
4. Runn of Kuchchh, Kanyakumari, Arunachal Pradesh and Srinagar.
5. SAARC countries and their capitals.
6. States and their capitals, adjoining Bangladesh.
7. New Moor Island, Diu, Lakshadweep, and Indira Point.
8. Boundaries of Countries Joining at the Pamir Knot.
9. Mackmohan Line, Red Cliff.
*****

13
CHAPTER 2
LAND
After the brief introduction about the country, we shall be getting adetailed information about its relief features.
The relief of India is not even everywhere. In the north, there exist theHimalayan mountains and the great plains formed by rivers. In its south, thereexists a plateau plate which is formed by the old rocks. Being old, this triangularplate has played a very important role in the formation of the landforms ofIndia. All other physiographic features of the country came into existence afterthe formation of this plate. That is why this peninsular part is also called thecentre of Indian Geology. The coastal plains are formed on the three sides ofthis plate along the sea-coasts. In addition to these, many island groups arefound in the ocean regions.
According to the estimation of the census commissioner of India, thedivision of physical units of the country’s total area is as follows:
Mountains: 10.7 per cent, Hills:18.6 per cent, Plateau: 27.7 per cent, Plains:43.0 per cent
The surface of India is mainly divided into five parts at the macro level(see Model 2.1): -
(I) Himalayan Mountainous Region
(II) The Great Northern Plain
(III) Peninsular Plateau Region
(IV) Coastal Plains
(V) The Indian Islands
(1) Himalayan Mountainous Region
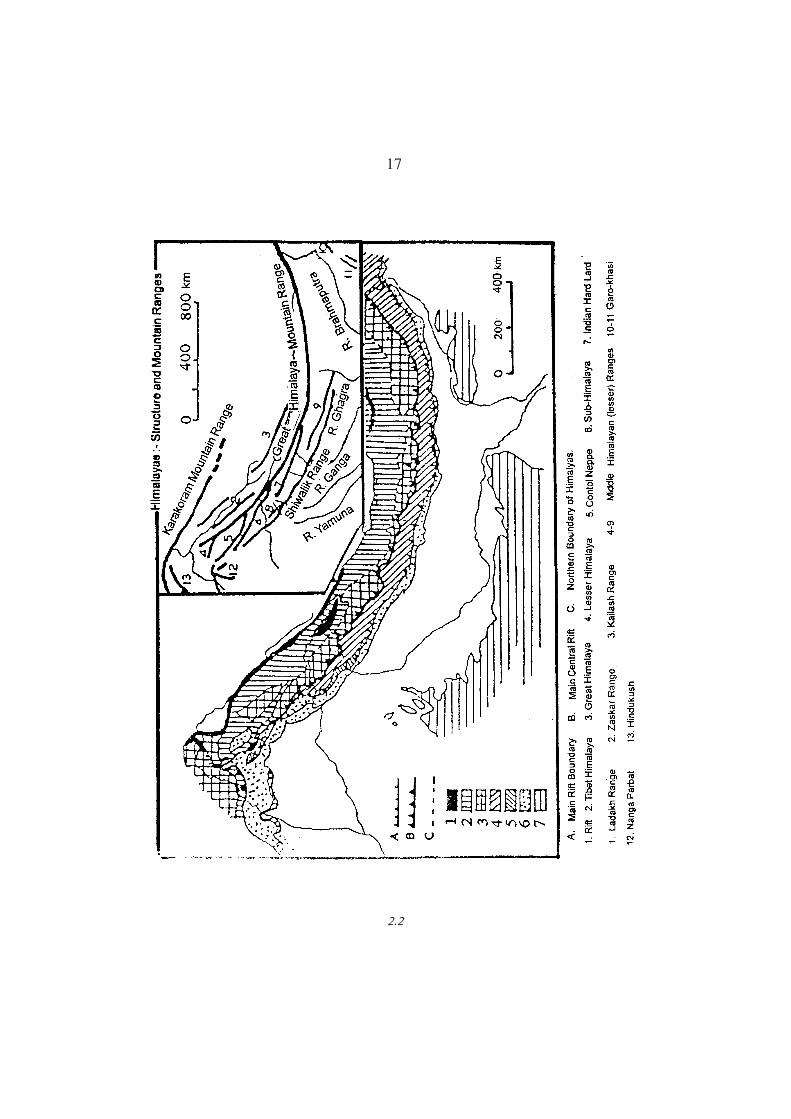
(A) Extent: Running in an east-west arced curve, the Himalayas form India’snorthern frontier. This great mountainous region extends for about 2400 kmfrom Arunachal Pradesh in the east to Jammu and Kashmir in the west. Its widthvaries between 240 km and 320km The total area of this region is 5 lakh km2 andaverage height is about 5100 metres or 17000 feet.
(B) Origin: - These mountain ranges began to be uplifted about 400 lakhsyears ago. At the present site of the Himalayas there was a sea of Tethys andon sea bed sediments were deposited which were brought by the then riversfrom the Tibetan plateau in the north and Gondwana land (Deccan Plateau) inthe south. Due to the internal forces of the earth both the plates started movingtowards each other. As a result folds occurred in their sediments and theirheight increased. These mountains are still rising. Due to the great heights,these young folded mountains are snow covered as ‘Himalayas’ or Him wala.These mountains are also known as the ‘Himvan’ or Himadri’ or Himachal’.

14
Model 2.1: Classification of India's Physical Divisions
Himalayan Mountain The Great Northern Peninsular Coastal plains Islands
Region Plain Plateau
Trans Greater lesser outer Hills
Western Eastern
Off shore Coastal
Eastern Western
Bari Doab Bist Doab Malwa Haryana
Upper Middle Lower
Punjab-Haryana Thar Desert Ganga Plain Brahmaputra Plain
Malwa Plateau Deccan Plateau
Aravali Vindhyachal Satpura
MaharashtraU Dandakarnan- Telengana Karnataka Western Eastern Southern
Chhattisgarh Ghats Ghats Hills
Gujarat Konkan Malabar Kerala
North coastal Plain South coastal Plain
Arabian sea Bay of Bengal

15
2.1

16
(C) Shape:- The shape of the Himalayas is like a convex curve towards ourcountry, whose middle portion is curved till the Nepal border. Many a times itlooks like a bow which has threads on its two ends in the form of mountains,reaching on one side from Safed Koh, Suleman and Kuithar to Arabian sea inthe north-western part and to the other side in the north-eastern part, goingupto the Bay of Bengal, along Indo-Burma hills from Arakanyoma to Tenasserimmountain ranges. Try to see the extent of these mountain ranges in your Atlas.
(D) Slope: - Slope of these mountain ranges in south towards India is verysteep, whereas it has gentle slope towards China in the north. That is why it isdifficult to cross these from the south. Due to steep slope and height, waterfalland narrow river valleys are found mostly on the southern slopes. They providewater to the rivers of north India, throughout the year, which is a naturalboon to the great plains of India.
(E) Classification: - The Himalayan complex can be sub-divided on the basis ofheight into the following five sub-divisions from north to the south:
(I) The Trans Himalayas
(II) The Great Himalayas
(III) The Lesser Himalayas
(IV) The Outer Himalayas
(V) Off - Shoots.
(I) The Trans Himalayas
These great ranges of the Himalayan mountains extend from the PamirKnot in the north-west of India towards north-east parallel to each other. Theseare also known as ‘Tibet Himalaya’ because most of these fall in Tibet. Theirtotal length is 970 kilometres. Their width at the ends is 40 kilometres while incentral part, the width is almost 222 kilometres. Their average height is 6100metres. The important mountain ranges are Zaskar, Karakoram, Ladakh andKailash. This mountainous region is famous for high and folded peaks and forhuge glaciers. Mount K2 Mount Godwin Austin (8611 metres) is the highestpeak of this region and is second highest peak of the world. Hidden Peak(8068 metres), Brand Peak (8047 metres), Gaysherboom (8035 metres), Racka-Pashi (7788 metres), and Harmosh (7397 metres) etc are its other importantpeaks. Hispar and Batugh (57 Kilometres) and Beacko and Baltoro (60 kilometres)are the famous glaciers of this range.
(II) The Great Himalayas
(a) Name: This part of Himalayan region is also known as Himadri, or InnerHimalayas or the central Himalayas.
(b) Extent: This sub-division is the longest and highest mountain range of thecountry which extends from the deep Gorge of Indus river in the west to theDihang Valley of the Brahmaputra river in the north-east. These mountains are
17
w.w

18
composed of the Archean era's crystalline metamorphic rocks like granite,gneisses and the schiests of old geological ages.
(c) Size: The length of this mountain range is 2400 kilometres and averageheight is 6000 metres or 20000 feet. Its breadth ranges from 100 to 190 kilometres.
(d) Summits/peaks: Some of the highest peaks of the world are situated inthis range. The Mt. Everest (8848 m.) is the highest peak of the world. Theother important high peaks are Kanchanjanga (8598 m.), Makalu (8481 m.)Dhaulagiri (8172 m.), Mansalu (8156 m.), Choe-Olju (8153 m.), Nangaparbat(8126 m.), Annapurana (8078 m.) Nanda Devi (7871 m.), Nancha Barwa(7756 m.) and Harmosh (7397 m.).
(e) Passes: It is very difficult and dangerous to cross this mountainous sub-division. But still many passes are found to go to Tibet at the height above4500 metres. Main examples of such passes are Burzil and Zojila in Kashmir,Lanak La, Chang La, Khurnak La in Ladakh, Bata Khepcha La, Korika andShipki La in Himachal Pradesh, Thag La, Niti, Lipu Lekh, Tatkala Kot in UttarPradesh and Nathula, Jelep La in Sikkim.
The trade between India and Tibet by road is only through two passes out offrom the above mentioned passes. Shipki La joins Shimla and Gartok and Jeepla joins Kalimpong and Lhasa through the Indo-Tibet roads.
(f) Valleys: Being snow bound for most of the year the mountain ranges of thegreater Himalayas are also known as the snowy ranges. Because of this perennialrivers have originated. Due to the deposition of the sediments brought bythese rivers into lakes at the height of 1500 metres, large valleys have beenformed. The valley of Kathmandu and valley of Kashmir are famous from thisview point.
(III) The Lesser Himalayas
This third division of Himalayan region is also known as Himachal orMiddle Himalaya. They were originated about 30 lakh years ago. Its averageheight is between 3500 and 5000 metres while average width is between 60 to80 km The ‘southern spurs’ of the Great Himalayas join this region. On higherreaches, the snow falls in the winter season and pleasant weather conditionsprevails in summers.
(a) Ranges: Pir Panjal and Nag Tibba in Kashmir, Dhauladhar in Himachal,Mahabharat in Nepal, Mussorie in Uttar Pradesh and Thimphu in Bhutan arethe main mountain ranges of this mountainous division.
(b) Valleys: This region has long and recreational valleys, like Kashmir Valley,Kangra Valley, Kullu Valley, Bhagirati Valley and Mandakini Valleys.
(c) Health resorts and tourist centres: Many beautiful tourist and health centreslike Shimla, Srinagar, Mussoorie, Nainital, Darjiling and Chakrata etc. are foundin this region.

19
(IV) The Outer Himalayas
This mountainous region of Himalaya is also known as the Shiwaliks,Sub-Himalayas and southern Himalayas. These mountain ranges extend parallelin the south of lesser Himalayas from east to west direction. Their averageheight varies between is 900 to 1200 metres and width is between 15 to 50kilometres. This region was formed during the tertiary period. Long and deepsedimentary rocks are found in this region. These are formed by the depositionof clayey soil, sand stones, and slate etc. eroded by rivers from the Himalayas.Later on during the tertiary period these sedimentary rocks got converted intothe folded mountains due the internal forces of the earth. These mountainsblocked the passage of the south flowing rivers and formed lakes, which werefilled with sediments and came to be known as ‘doons’. In the east these arecalled ‘Duars’. Most famous among these are Dehradun, Patlidun, Kothridun,Chaukhamba, Udhampur and Kotli.
(V) The Off-Shoots
The Himalayan mountain ranges at their eastern and western marginstake the north –south direction. These hills found on the edges are known aseastern and western off-shoots respectively.
(a) The Eastern Off-Soots: These off-shoots are also known as Purvanchal.These ranges start from Dihang gorge of Brahmpurtra in Arunachal Pradesh,and gets divided into two parts after making the boundary between easternIndia and Myanmar (Burma):
(i) Formed by Ganga-Brahamputra, one off-shoot reaches the plainsof Bangladesh, in which Dapha Bum, Patkai Bum, Garo, Khasi, Jaintia andTripura hills are included.
(ii) The second off-shoot reaches the delta of Irawadi, starting fromPatkai Bum to Naga hills, Brail, and Lusai.
Dapha Bum (4578 metres), Saramati (3926 metres) and Jpau are the mainpeaks in these eastern off-shoots of Himalayas.
(b) The Western Off-Shoots: From the Pamir Knot in the north-west, theHimalayan ranges gets divided into two sub-off-shoots. The first off-shootreaches the Arabian Sea in the south-western direction running through themiddle of Salt Range of Pakistan, Suleman and Kirthar. The second off-shootjoins the HinduKush of Afghanistan and Caucasus mountains.
(2) The Great Northern Plains
(i) Situation: These plains stretch from the Indus river in the west to theBrahmputra river in the east. These plains of India stretches from the aridplains of Rajasthan to the humid areas of Assam. To the north of these greatplains lie the southern slopes of Himalaya mountains, while to their south theseare adjoined by the northern dissected parts of the Deccan plateau.
(ii) Size: Between the river Ravi and the delta of Ganga the total length of

20
these plains approximates 2400 kilometres and their width is between 100 to300 kilometres. However, their width varies from 90 kilometres in the valleyof Assam in the east, and 200 kilometres in Bihar upto 500 kilometres in theRajasthan regions in west. Its height above the mean sea level is 180 metres or600 feet. The depth of this plain is estimated between 5 to 32 kilometres andcovers a total area of about 7.5 lakh sq. km
(iii) Formation: The deposition by three main river systems has contributedto the formation of these great plains. Sutlej in the west, Ganga in the middleand lower parts and Brahamaputra in east, along with their tributaries depositedhuge amount of soils. This deep and elongated trough was formed betweenthe Himalayas and the peninsular plateau during the Tertiary era with theinternal compressional activities of the earth, in which water of the Tethys hadbeen collected after the rise of Himalayas. Rivers originating from the Himalayasand the Gondwana land had regularly been depositing sediments for a longperiod and in present times also due to the deposition of 3 lakh tons of alluviumevery year by the Ganga river in the Bay of Bengal, this plain is continuouslyincreasing in its length.
(iv) Surface features:
(a) Levelled Plains: Whole of the north Indian plain is flat and levelled. Theslope is so gentle that generally it is difficult to recognize.
(b) River Network: This entire plain region has a network of rivers and choesdue to which Doab regions have been formed. The name of our Punjab state isalso due to the flow of five rivers and due to the continuous deposition ofalluvium by the waters of these five rivers. In Persian language Punj meansfive and aab means water. Hence the name ‘Punjab’ has been given to thisarea.
(c) Landforms: Because whole of the plain is formed by the deposition ofalluvium by the rivers, that is why landforms like alluvial fans, alluvial cones,meandering river terraces, natural levees, flood plains are found in it.
(d) Sediments: The deposition of different layers of soils by deposition in theseplains has uninterruptedly been going on from very long times. The sedimentstherefore include clay, sand loam and silt in larger amounts. The clay is foundmore near the mouths of rivers, whereas the sands are predominant in theupper reaches.
(e) Surface variations: Although these plains are flat but when seen closely,their relief varies in terms of deposition of sediments. Due to the continuousdeposition of sediments over a long period of time, the formation of followingalluvial plains has taken place.
(i) Khadar plains: Due to annual floods in the rivers of Uttar Pradesh,Bihar and West Bengal, there is deposition of newer alluvium. Such areas whichare under the influence of floods, close to the rivers are known as the Khadarplains. These plain areas are known as ‘Bet’ in Punjab.

21
(ii) Bangar plains: Those uplands which remains almost free from theflood water and there is greater amount of lime-stone in the older alluviumare known as Bangar plains. In Punjab, Haryana and Uttar Pradesh these arecalled as Reh, Kallar or Dhaya.
(iii) Bhabar plains: When the rivers of North India after leaving theShiwalik hill regions, enter the flat plains, then they deposit sand, pebbles, silt,stones and gravels etc brought down by them and give rise to plains which areknown locally as Bhabar or Ghar. In such plain areas, the water of small streamsgenerally flows below the surface of land rather than on the surface.
(iv) Terai plains: The water that sinks underground in the Bhabar plains,reappears on the surface, and this water converts large areas along the riversinto marshy lands. This humid and marshy land, running parallel to the Shiwalikhills in a long belt, has hot and humid conditions and hence there is abundanceof dense forests and wild life. This region is known as the terai plain.
(v) Bad lands: In north peninsular plateau and foothills of western Shiwalikhills, due to gully erosion by the rivers, streams and rain, narrow valleys andravines are formed. The land not fit for agriculture in such plain areas is knownas the bad land. The fertility of land in these plains is almost negligible.
(f) Division: Besides the variations in deposition of alluvium, the macro levelregional distribution of these plains is equally important. This east-westextending vast plain can be divided into following four macro regions:
(i) The Punjab-Haryana plains
(ii) The Thar desert plains
(iii) The Ganga plains
(iv) The Brahmaputra plains
(i) The Punjab-Haryana plains: These owe their origin to theaggradational work of the Sutlej, the Beas and the Ravi rivers. This uniformand flat plain is formed by the Indus and its five tributaries. Due to the creationof the international border between India and Pakistan in 1947, greater part ofit went to Pakistan. To the other side, due to the rise of the surface near Delhi,the Yamuna had started flowing towards east. Delhi and its surrounding areawork as a water-divide between the Ganga and the Indus river drainagesystems. Its length in east and south-west direction from Pakistan border tothe Yamuna river is 500 kilometres and is 640 km long from north-east to south-west. The height of the plains varies from 300 m in the north to 200 m in thesouth-east. The slope of this plain is towards south-west. The low and hardresidential rocks of Delhi and Mahendergarh district separate it from the Gangaplains. The total area of this fertile plain is 1.75 lakh km2. The interfluves formedon the basis of river boundaries can be divided into four sub-divisions:
(a) Area between the Ravi and the Beas is known as Bari Doab or theMajha plain

22
(b) Area between the Beas and the Satluj is called Bist Doab or theDoaba region
(c) Plain area spreading from the Satluj to the Malwa plateau is termedas the Malwa plain, and
(d) The flat area from the Ghaggar to the Yamuna is known as theplain of Haryana.
(ii) The Thar Desert Plains: The drier and flat area extending from thesouthern parts of Punjab and Haryana to the Rann of Kuchchh of Gujarat isknown as the Thar-Desert. The Aravalli mountain ranges form its easternboundary and the international boundary falls to its west. This tract is about640 km long and 300 km wide and covers an area of 1,75,000 sq. km It is alsocalled the western plain. Its height above the mean sea level is between 120 to150 metres. Most of this arid plain was under the sea from permo-carboniferousperiod untill it was uplifted during the Pleistocene. The existence of severalland forms features of river Sabarmati and Markanda indicate that the regionwas once fertile. At present seasonal streams like Bandi, Jajri, Sukri etc andmany salt lakes like Sambhar are found in this region. Due to the scarcity ofrain whole of the region has become sand duned. The sand dunes are 50 to 100metres high in Barmer district. In whole of this dry region the action of windis very fast. Westward along the Aravallis, there are found fertile plains (Rohi),important among which are the Gang Rohi and the Godawar Rohi.
(iii) The Ganga Plains:
(i) Situation: This plain is spread over the states of Uttar Pradesh, Bihar.Extending from Yamuna in the west, the international boundary of Bengladeshin east, Shiwaliks in the north and the northern extension of the peninsularplateau in the south, this vast and fertile plains important from the historical,agriculture and dense population point of view.
(ii) Rivers: The Ganga, the Yamuna, the Ghaghra, the Gandaer, the Sone,the Kosi, the Betwa and the Chambal rivers have deposited a 2000 metres deepsediments here.
(iii) Landform Names: The marshy belts formed in the northern Terairegion of this plain are known as Caurs, whereas along the southern bordersof this plain there are large Ravines which are called ‘Jala’ and ‘Tal’ or Badlands. Beside these, the whole plain has long belts of deposits of older alluviumor Bangar and Newer deposits of Khadar alluvium which vary in height between15 to 30 metres. These are known as ‘Khols’ here. The belts of sand dunesformed by the depositional action of the wind are found in the Doab region ofthe Ganga and the Yamuna. These are called the ‘Bhur’ in Muradabad andBijnaur districts of Uttar Pradesh.
(iv) Slope: The slope of entire Ganga plain is towards east. The plaincovers an area of about 3.57 lakh km2.

23
(v) Division: The Ganga plains can be divided into three sub-divisionson the basis of height:
(a) The upper Ganga plain: This is also called the Ganga-Yamuna Doab.The Yamuna rivers is to its west and the gently sloping areas with 100 m.height forms its eastern border. Ruhelkhand and Awadh plains are also itsparts. Besides the Ganga-Yamuna rivers, the Ramganga, the Hinden, theChambal, the Betwa, the Kali, and the Pandu etc rivers deposits have alsocontributed in the formation of these plains.
(b) The middle Ganga plain: This plain is also known as the Bihar plainor the Mithila plain. Its height is between 50 to 100 metres. It covers an area of35000 km2 from the Ghaghra river to the Kosi river. The rivers Ganga, Ghaghra,Gandak, Kosi, Son and Rohini etc. had deposited sediments in it. Due to thevery gentle slope, landforms like oxbow-lakes, natural levees, and shiftingmeanders are found in large numbers.
(c) The lower Ganga plain: This plain area of Ganga, upto an height of50 m. above mean sea level, is a flat deltaic region lying between the gap in theRajmahal and the Garo hill ranges. It is located in the state of West Bengal andBangladesh. Duars of the terai tract are found in its north and the world’slargest Sunderbans Delta is located in its southern parts. This alluvial plain isformed by the deposition of sediment brought down by the Ganga and itstributaries (Bhaghirati and Hugli), Damodar, Suvarn Rekha and Tista.
(iv) The Brahmputra plains: These plains are also called the Assam plains.This plain region extend from the western border of Assam to the extremenorth-eastern part Sadiya of Assam. It is a narrow plain which is about 640 kmlong and 90 to 100 km wide. The Brahamputra, Sesari, Dibang and the Lohitrivers has brought the alluvium (soil) from the Himalayas and surrounding hillranges and has deposited here. Due to yearly floods this narrow plain isrenewed by the deposition of newer sediments. The slope of this plain is fromnorth-east to west.
(3) Peninsular Plateau Region:
(i) Situation: This plateau region stretches to the south of the GreatNorthern Plains and is a triangular ancient tabular block which has its apex isin the south at Cape Comorin (Kanyakumari). It is formed essentially of theancient Gondwana land hard and crystallainic rocks. Its base areas are adjoinedby the Indian Ocean towards south, the Bay of Bengal to the east and theArabian sea towards west. Surrounded by sea from three sides, this triangularland block is also known as the Peninsula. On the basis of its situation,surrounded from all sides by the flat plains, this plateau region is also consideredas a continental plateau.
(ii) Size: Extending from Aravallis in the north-west to the Shilong plateauin the north-east and Kanyakumari in the south, this triangular hard block ofland occupies almost 50 per cent of the total land area of the country. Its totalarea is 16 lakh km2 and the elevation varies from 600 to 900 metres.

24
(iii) Surface Formation:
(a) Origin: Entire peninsular plateau was born before the origin of theHimalayas during pre-cambrian era i.e., 50 crore years ago, with the silentflow of lava which had come to the southern part of India due to the internalmovements of the earth almost 7 crore years ago during the tertiary period.
(b) Structure: This plateau is formed of ancient igneous rocks. In thehigh hills and the plateau region, the hard rocks like Gneisses, Quartz andmarble are found. These hilly regions are found in residual form due to theirerosion over millions of years. Besides this, due to the pressure from the Tibetplateau, it has experienced fracturing and faulting.
(iv)Division: The peninsular plateau region is not even. Rather thereexist variations in height, slope and erosion in its surface. Therefore, on thebasis of east-west extending Satpura ranges and the slope of the land, thispeninsular region is broadly divided into two parts. Its northern part slopestowards north or north-east and the general slope of the southern part istowards south-east. The northern part is known as the Malwa plateau whilethe southern part is known as the Deccan plateau.
(i) The Malwa Plateau: Bounded by the Aravalli mountains in the west;Bundel Khand and Baghel in the north; Chota Nagpur, Rajmahal Hills to theShilong plateau, in the east; and the Satpura hills in south, this triangularlandmass is called the Malwa plateau. Its apex is at the Shillong plateau. Thenorthern border of this plateau is concave in shape. This northern part of thePeninsular plateau slopes towards the north and rivers like Banas, Chambal,Ken and Betwa has converted it into deep and narrow valleys called ravines.The Chota Nagpur plateau is to the east of this plateau. Rich in natural minerals,this dissected lava plateau includes Hazaribagh, Gaya and Ranchi plateaus also.Its average height is 900 metres. Parasnath (1365 m.) and Netrahappat (1119m.) are its highest peaks. Due to the deposition of 100 m. thick alluvium soil inthe gap between its adjoining Rajmahal hills and the Shillong plateau, there hasemerged a south-east sloping plain relief. This Malwa plateau has three majormountain ranges: (1) The Aravalli mountain range (2) The Vindhyachal mountainrange (3) The Satpura hills.
(1) The Aravalli Mountain Range: Extending for about 725 kilometresfrom Delhi to Gujarat (Gir Hills) in the south west direction, these parallelranges are residential hills, which has Guru Shikhar Peak (1722 metres) of MountAbu as the highest peak.
(2) The Vindhyachal Mountain Range: Actually, on the southern slopesof the Vindhyachal mountain ranges, the escarpment boundary of the Malwaplateau is formed, under which the rift valley is formed and Narmada riverflows in this valley towards the west. The western part of these mountainranges is formed of lava. The eastern lava free parts are called the Kaimur andBhanrer ranges.

25
(3) The Satpura Hills: The Satpura hills are formed of the seven layersof lava. Running along the southern bank of Narmada river, with the Maikaland Mahadeo hills in the east, these reach the Chota Nagpur plateau ofJharkhand. Dhumgarh (1350 m.) and Amarkantaka (1127 m.) near Panchmarhiare among the highest peaks of these hills. The length of the Satpura ranges is1120 km Their western parts are knows as the Rajpipla hills and eastern part asthe Amarkantaka plateau. Rising from the eastern parts, the river Tapti alsoflows in the rift valley in westerly direction and enters the Arabian sea withoutforming a delta.
(ii) The Deccan Plateau: Falling between the Shatmala, Ajanta andBalaghat hills in the north; the western ghats in the west; the eastern ghat inthe east; and the cardamom hills in the south, this huge plateau was formeddue to the continuous flow of lava during the tertiary era (122 crore yearsago). It covers an area of about 7 lakh sq. km and slopes from northwest tosoutheast. Its average elevation is from 300 to 900 metres. Seasonal streamshad badly dissected its surface and has divided it into a number of clearlydemarcated physical units: (1) Maharashtra table-land (2) Dandkaryana-Chattisgarh region (3) Telangana plateau (4) Karnataka plateau (5) western ghats(6) eastern ghats, and (7) southern hill group.
1. The Maharashtra Table-Land: This plateau region is formed of the Basalticlava rocks, which has been converted into a numbers of basins by the erosionalactivity of many rivers like Godavari, Bhima, Krishna, Vardha and Venganga.The north-western part is known as the Marathwara table land, where Godawariand Majhira basins are found. The Vardha and Venganga with the help of theirbasins had formed the Vidharbha region in its eastern part. The upper basinsare formed by the Krishna, Bhema and Sind rivers in the south.
2. The Dandakaryana-Chhattisgarh Region: This region lies between theBastar district of Chhattisgarh and Koraput district of Orissa. The upper valleysof Mahanadi and Venganga and Sivunath and Indravati river basins are foundin it. This undulating, dissected and hard rock forested region is known asDandakaryana. It has basaltic rocks of the Cuddapah age, alongwith limestoneand shale. The Chhattisgarh plain formed by the Mahandi, covers an area of7300 km2 in this region.
3. The Telengana Plateau: The gently sloping area of the Karnataka plateauin Andhra Pradesh, which extends towards the east is known as the Telenganaplateau. It is characterised by rounded hills, rolling plains, broad open rivervalleys and big rocky boulders. It is also called as the Andhra Pradesh plateau.
4. The Karnataka Plateau: Areas, situated in the middle parts of Deccanplateau, having an elevation of 600 m. above mean sea level are known asKarnataka plateau. Its height increases to 1100 m. towards the south whereasthe high table land of 900 to 1100 m. is called as the Mysore plateau. Themaximum height in this part of the deccan plateau is of Baba Budan Hills.

26
These have a width of 35-45 km The hilly and dissected parts are known asMalnad while the rolling plain areas covered with granite layer are known asthe Maidan. In the entire plateau, deep valleys had been formed due to theweathering and erosional work done by the Krishna, Tungabhadra, Pennarand Cauvery rivers.
5. The Western Ghat: The mountain range running continuously parallel tothe coast for about 1600 km along the western border of the Deccan plateau,from that of the river Tapi to Cape Comorin (Kanyamumari) is known as theWestern Ghat or the Sahyadris hills. Their average height is 1200 metres. Thewaterfalls gorges and steep slopes present a view of the landscape of youthfulstage. In this long north-south range of mountains, there are three passesThalghat, Bhorghat and Palghat. Jog or Gersoppa falls (250 m.) are formed onthe west flowing Sharvati river. From Thalghat pass to southern hill group,Vavul Mala (2339 m.) Kudremukh (1894 m.), Pushapagiri (1714 m.), Kal Subai(1646 m.), Salher (1567 m.), Mahabaleshwar (1438 m.) and Harichandragarh(1424 m.) are among the highest peaks.
6. The Eastern Ghat: The semi-plateau areas of the Deccan plateau, which areabout 800 km in length and are 500 metre high and run from the Mahanadivalley in the north to Niligiri hills in south are known as the eastern ghats. Ascompared to the western ghats, these are wider, dissected, parallel to the coast,and are landmasses of low and broken hills. The east flowing rivers dividethese ghats into three parts – the northern, the middle and the southern.
(i) The hill ranges of the northern division are found between Mahandiand Godavari rivers, with an average height of 900 m. In these theMahendragiri (1500 m.) is the highest peak.
(ii) The middle division is located between the Krishna and Pennarrivers in the Cuddapah and Kurnool districts. The Nallamalli,Palkonda and Velikonda hills are found in this part.
(iii) In the southern division from Pennar river to the Niligiri hills, thereare found Jawaddi, Gingee, Shivrai, Kollaimalai, Pachaimalai,Gondumalai, Beligir and Rangan hills.
7. The Southern Hill Group: The place where the hills from the northernparts of the Deccan plateau, join the hills of the western and the eastern ghats,in the extreme south, is known as the southern hill groups or the Niligiri hills.The Nilgiris or the Blue mountains have an average height is 1220 m. Due tothe meeting of three mountain ranges coming from different directions on thesehills, there is formed a 2695 m. high Anaimudi Knot. The mountain ranges likecardamom or Elami from the south; Anaimalai from the north; and Palni fromnortheast meet here. The highest peaks in this whole hill group are Doda Betta(2637 m.) and Makurti (2554 m.). Doda Betta, Ootacamund, Palni and Kodaikana(2195 m.) are the main hills stations.

27
(4) Coastal Plains
The Deccan plateau is surrounded on three sides by long low lying plainsrunning along the coast from Kuchchh area of Gujarat through kanyakumari tothe Mahanadi delta. These narrow plains have been formed by the depositionwork of the sea or rivers and the emergence or submergence of ocean coasts.The coastal plains formed at the eastern and western margins of the peninsularplateau are very different from each other. As compared to the eastern plainsthe western plains are less wide more humid, have larger number of narrowbays, beautiful lagoons, marshy areas and parallel reefs. Therefore, on the basisof their situation, the coastal plains can be divided into two parts: (i) The westerncoastal plains (ii) The eastern coastal plains.
(i) The Western Coastal Plain: The narrow and flat plains extending inthe north to south direction, for about 1500 km in length and 30 to 80 km inwidth, between the Arabian sea and the western ghats is known as the westerncoastal plain. They slopes towards the south and south-west. On the basis ofsurface characteristics these plains can be divided into four main parts. 1) TheGujarat coastal plain, 2) The Konkan coastal plain, 3) The Malabar coastal plain,and 4) The Kerala coastal plain.
(1) The Gujarat Coastal Plain: This coastal plain lies in the north ofwestern coast. The deposition of sediments by the rivers like Sabarmati, Mahi,Luni, Banas, Narmada and Tapi has given rise to the formation of peninsularplains of Kuchchh and Kathiawad and elongated plain of Saurashtra. The Rannof Kuchchh is still marshy and below the sea level. Gir mountain ranges of lavaare also found in the peninsular part of Kathiawar. The Gorakhnath (1117 m.)is the highest peak in the Girnar hills. This coastal plain of Gujarat is 400 kmlong, 200 km wide and 300 m. high. But after reaching Daman and Diu inSaurashtra, their width reduces to 80 km and height becomes only 150 m.
(2) The Konkan Coastal Plain: The plain stretching from Daman to Goais known as the Konkan coast. The submergence of coastal parts is generallyseen. That is why, this 500 km long plain strip reduces to the width of 50 to 80km Due to the impact of strong sea waves many narrow bays, gulfs, internalcoves and beaches of sand etc landforms are found in this plain. The famousMumbai island is situated in the creek of Thana. Besides these, two very smalland steep sloping river valleys namely Vaitarna and Ulhas are also found inthis coastal region.
(3) The Malabar Coastal Plain: Almost 225 km long and 24 km wideplain form Goa to Mangalore is also known as the plain of Malabar coast or theKarnataka coastal plain. It is narrow in the north and wide in the south.However, at many places it extends upto Kanyakumari (Cape Comorin).Submerged Estuaries of river Marmagoa, Mandaui and Sheravati are found inthis plain.
(4) The Kerala Coastal Plain: Nearly 500 km long, 10 km wide and 30 m

28
high plain areas extending from Mangalore to cape comorin (Kanyakumari) areknown as the Kerala plain. It has a number of lakes (lagoons). The off-shoreparallel reefs make the water of land to stand in the form of backwaters, whichare locally named as Kayal. These are linked together to permit continuousnavigation by country-crafts. The Ashtamudi and the Vembanad lakes are spreadon a large area and are used for boating.
(ii) The Eastern Coastal Plain: These coastal plains have the Bay of Bengalto their east and the eastern ghats to their west. These extend from the deltaof Subaranrekha river in the north to Kanyamumari in the south for about2000 km Their average width is 150 km and height 100 m. As compared to thewestern plains, these are more wide, higher, arid, are formed of deltaic alluviumand have big lagoons. On the basis of location, these plains are divided intotwo sub-divisions : a) the Northern coastal plain b) the southern coastal plain
(a) The northern coastal plain: The extent of these plains is near the 160
north latitude, from the mouth of Krishna river to the mouth of the Subaranrekhariver. It is nearly 1100 km long and 120 km wide. This plain is also known asthe Golcunda, North Cricar and Kokunada plains. The deltaic plain of Mahanadinear the coast of Orissa is also known as the Orissa plain or the Utkal coastalplain.
Low and wider deltaic areas have been formed in this plain region bythe deposition of soil brought from the Deccan plateau by the Subaranrekha,Brahmani, Mahanadi, Indravati, Godavari and Krishana rivers. Besides thesedeltaic regions, two big lakes are also found here. The Chilka lake is 70 kmlong, in which Bhargavi and Daya rivers fall. Between the Krishna and Godavarideltas is the second large lake namely the Kolleru lake.
(b) The southern coastal plains: These plains extending for about 900km from the delta of Krishana river to Kanyakumari, are also called as theCoromandal Coast. These are much wider than the northern plains. At manyplaces their width exceeds 150 km The rivers like Krishna, Pannar, Cauveryand Viagia have brought the soil from southern hills groups and have formedvast, fertile deltas. Pulicat lake and Cauvery delta are the main surface featuresof this plain.
(5) The Indian Islands
Besides the main land, Indian Republic has its control over the islands inthe sea also. India has almost a total of 250 islands. On the basis of their location,Indian islands are divided into two main sub-divisions – a) offshore b) onshore.
(a) The offshore islands: The total number of such islands is about 230.According to their sea location these are sub-divided into two groups. (1)The island group of Arabian sea (2) The island group of Bay of Bengal
(1) The island group of Arabian Sea: Formed with the deposition ofcoral reefs in south-eastern Arabian sea these islands are known as Lakshadweep
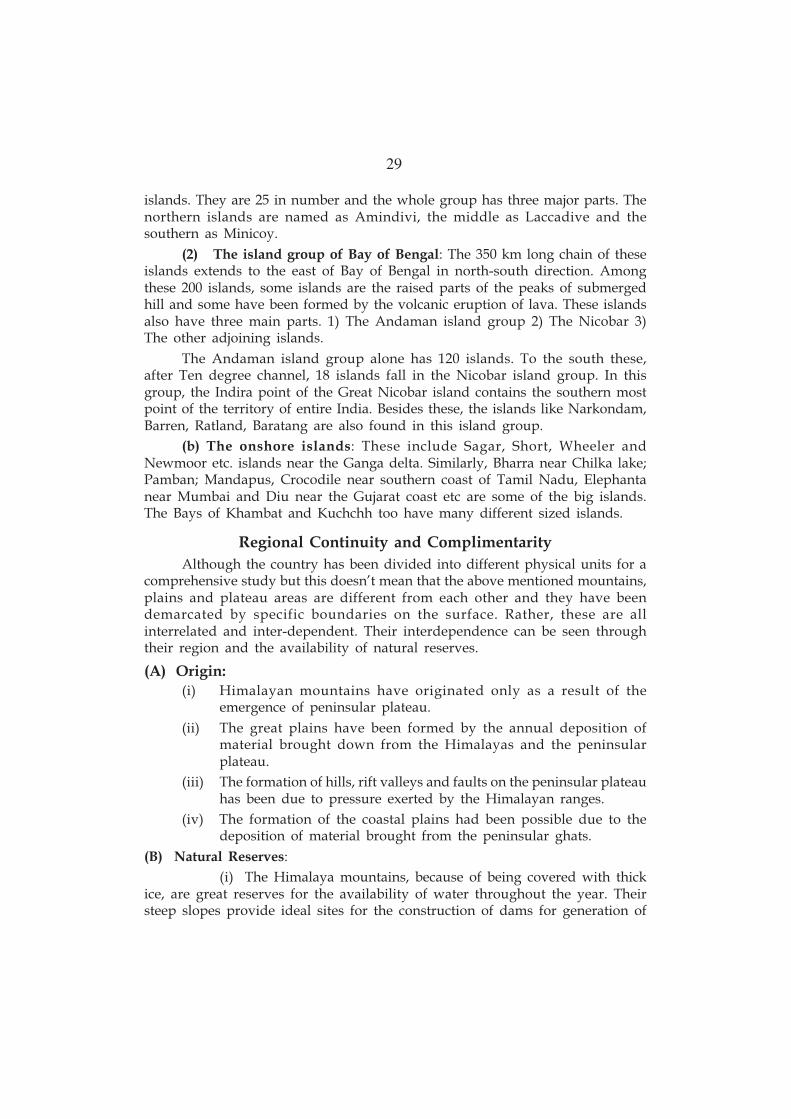
29
islands. They are 25 in number and the whole group has three major parts. Thenorthern islands are named as Amindivi, the middle as Laccadive and thesouthern as Minicoy.
(2) The island group of Bay of Bengal: The 350 km long chain of theseislands extends to the east of Bay of Bengal in north-south direction. Amongthese 200 islands, some islands are the raised parts of the peaks of submergedhill and some have been formed by the volcanic eruption of lava. These islandsalso have three main parts. 1) The Andaman island group 2) The Nicobar 3)The other adjoining islands.
The Andaman island group alone has 120 islands. To the south these,after Ten degree channel, 18 islands fall in the Nicobar island group. In thisgroup, the Indira point of the Great Nicobar island contains the southern mostpoint of the territory of entire India. Besides these, the islands like Narkondam,Barren, Ratland, Baratang are also found in this island group.
(b) The onshore islands: These include Sagar, Short, Wheeler andNewmoor etc. islands near the Ganga delta. Similarly, Bharra near Chilka lake;Pamban; Mandapus, Crocodile near southern coast of Tamil Nadu, Elephantanear Mumbai and Diu near the Gujarat coast etc are some of the big islands.The Bays of Khambat and Kuchchh too have many different sized islands.
Regional Continuity and Complimentarity
Although the country has been divided into different physical units for acomprehensive study but this doesn’t mean that the above mentioned mountains,plains and plateau areas are different from each other and they have beendemarcated by specific boundaries on the surface. Rather, these are allinterrelated and inter-dependent. Their interdependence can be seen throughtheir region and the availability of natural reserves.
(A) Origin:
(i) Himalayan mountains have originated only as a result of theemergence of peninsular plateau.
(ii) The great plains have been formed by the annual deposition ofmaterial brought down from the Himalayas and the peninsularplateau.
(iii) The formation of hills, rift valleys and faults on the peninsular plateauhas been due to pressure exerted by the Himalayan ranges.
(iv) The formation of the coastal plains had been possible due to thedeposition of material brought from the peninsular ghats.
(B) Natural Reserves:
(i) The Himalaya mountains, because of being covered with thickice, are great reserves for the availability of water throughout the year. Theirsteep slopes provide ideal sites for the construction of dams for generation of

30
hydro-electricity. The adjoining fertile river valley plains have been formedonly with the soils obtained from these mountains. The soft wood forests foundon these mountain ranges are the main sources of fuelwood, various medicinalherbs and timber for furniture etc. These mountains have beautiful and winsomehealth resorts, rare wild life, hilly fruits, herbs and tourist places etc. whichmake them important. Besides these facts, in the north, the Himalayan mountainshave always stood as a great wall and has not only helped in protecting thesecurity and culture of the country from foreign invasions but they have alsobeen protecting India from the cold blizzards generated by the continentalwinter high pressure system of north-eastern and central Asia. In this way lifeand agriculture in the plain and plateau areas of the country have been protected.
(ii) The great northern plain along the Himalayas provide support tonearly 40% population of the country. Their fertile soils, favourable climateand flat terrain has made a great contribution to extension of canals, roads,railways and cities and in the development of agriculture. Due to this, theseplain areas have pride for being the food basket of the country and save thecountry from hunger and famines. These have created a special kind of cultureand society since the Aryans to the recent times. The river Ganga is still thesacred for people all over the country and the places like Rishikesh, Haridwar,Mathura, Prayag, Ayodhya and Kashi etc. in its valley are the centre of attractionfor Sufis and religious peoples living in different parts of the country. Later, inthese plain areas only the Sikh Gurus, Mahatama Buddha, Mahavira Jain etcwere born and different religions related with them prospered. The strongimpact of these religions could be seen on Himalayas and on south India. MughalEmpires were so impressed by the towns and cities located in these plain areasthat they established their capitals here and ruled the country.
(iii) The peninsular plateau is a great store house of almost all types ofminerals. These include huge reserves of iron, coal, manganese, copper, mica,bauxite, etc. The modern industry of the country depends on these. The lavasoils provide a base for cotton and laterite soils for tea, coffee and rubber andhence are making an important contribution to the development of agricultureand agro-based industries. The mixed deciduous species of forests like Teak &Sandal satisfy the demands of timber wood of the entire country. The waterfalls and dams located on both sides of the ghats of the plateau provide waterfor irrigation in the coastal plains and electricity for industrial development.
(iv) Country’s coastal plains and islands are famous for the productionand international trade of quality rice, arecanut, date-palm, coconut, spices,pepper, ginger, cloves and cardamom. Though these plains quality fish aresupplied to all parts of the country. Harbours on the sea coasts of these plainsconnect the entire country with other countries. Sea Beaches of Goa, Mumbai,Tamil Nadu and Orissa attract tourists form all over the country.

31
Besides, salt used in our homes is also prepared in the western coastalplains. Thus, we find that different physical units of the land of the country arenot independent and isolated units but with complete interdependence, theseare contributing very strongly to strengthen the culture and economy of thecountry.
Exercise
I. Answer the following questions objectively :
1. Name main units of India’s physical divisions?
2. What is the size of Himalayan mountain range?
3. How did Himalayan mountain regions originate?
4. Name the major peaks of Trans-Himalaya?
5. Which mountain peaks are found at the height above 8000 metres in GreaterHimalayas?
6. Name the young and old mountains of India.
7. Where are rift valleys located in India?
8. What is meant by delta?
9. Name some important deltaic regions of India.
10. Which passes are found in Himalayan mountains.
11. Name the important mountain ranges of lesser Himalayan.
12. Which hill stations and valleys are found in lesser Himalayas?
13. Name the main doon valleys of our country.
14. Name the major eastern off shoots of Himalayas.
15. Which landform features formed by rivers found in the Great Northernplains?
16. Which inter-fluves are formed in North-Western plains?
17. What is the size of the Brahamaputra plain?
18. What is the extent of Aravalli Mountain range? Give the name of its highestpeak.
19. What are the sub-divisons of Mysore plateau?
20. Name the major peaks of the western ghats.
21. Name the Southern mountains of the Eastern ghats.
22. Which mountains ranges meets at the Anai Mudi Knot?
23. Which Hill Stations are found in Deccan plateau’s hilly region?
24. What are the sub-divisons of North-Eastern coastal plains?
25. Name the Islands in Arabian Sea !
26. Which onshore Islands are found near the coasts of India?
27. Where is the Southern frontier-point located?
28. Give any five uses of Himalayan Mountains.

32
29. Give any three important effects of the peninsular plateau.
30. Give any three uses of the coastal plains to the entire country.
II. Answer the following questions in short :
1. Give any two proofs of Himalayas successive upliftments.
2. Do we find any similarities between the Himalayan Mountains and theDaccan plateau?
3. Are the Himalayan Mountains still in their youth or young stage?
4. Throw some light on the surface features of the Great Himalayas.
5. Which alluvial plains have been formed in the Great Northern plains?
6. Write a geographical note on the Thar desert.
7. What could be the different divisions of Indian Islands on the basis of theirlocation? Explain with examples and diagram.
8. What is the contribution of coastal plains to the entire country?
9. The western coastal plains of India are not only narrow but are also withoutDeltaic deposits, explains.
10. What is the contribution of Himalayan Regions to the development of thecountry as a whole.
11. How does the Peninsular plateau affect the other physical regions of India?
12. Differentiate between
(i) Terai and Bhabhar
(ii) Bangar and Khadar
(iii) Choe and waste land
(iv) Estuary and Delta
III. Answer the following questions subjectively :
1. Divide the relief of India and explain in detail any one region.
2. Write a note on the origin and structure of Himalayas and are they stillrising?
3. Compare the Western and Eastern coastal plains.
4. Divide the Himalayan mountains with the help of a stretch diagram andgive the characteristics of all the sub-divisions.
5. Give a detailed description of size, origin and regional division of India’sGreat Northern plains.
6. What is the extent and surface formation of Peninsular plateau? Describeits different sub-divisions on the basis of slope of the land.
7. Compare and contrast the surface features of the Himalayas and thePeninsular plateau.
8. Explain with the help of diagram, the Western and Eastern Himalayansub-ranges.

33
9. Write short notes on:
(a) Vindhyachal (d) Malwa plateau, and
(b) Satpura (e) Nilgiri Hills
(c) Aravalli Mountains
10. “Are the different physical divisons of India Separate and Independentunits or they are complementary to each other?” Explain this statementwith examples.
IV. Show the following on the outline map of India:
1. Karakoram, Zaskar, Kailash, Pir Panjal and Shivalik hill ranges.
2. Malwa, Chota Nagpur, Shillong and Telangana plateau regions.
3. Coromandal, Konkan and Malabar coastal areas.
4. Passes of Thal Ghat, Bhor Ghat and Pal Ghat
5. Passes of Zojila, Nathula, Jelep La and Shipikila
6. Aravalli, Palkonda, Anaimalai and Lusai Hill regions
7. Mount Abu, Darjeeling, Shimla, Kodaikanal, Jog falls and four touristcenters.
8. Mount Everest, Nanda Devi, Kanchanjunga, Mount K2 Godwin Austin,Parasnath, Kudremukh and Doda Beta Peaks.
*****

34
CHAPTER 3
THE CLIMATE
The word ‘Climate’ refers to the particular weather conditions prevailingat a place over a larger period of time i.e. the temperature, the water contentpresent in the flowing air at a place etc. These weather conditions are largelydetermined by three important factors like variations, in relief, distance fromthe sea and distance from the equator and it very strongly affects man and hisactivities.
India is a vast country. Its major physiographic units, peninsular locationand position of the Tropic of Cancer clearly affect its climate. Due to the widevariations in the surface features of country, its temperature, rainfall, storms,extent of winds and clouds, too vary greatly.
REGIONAL DIFFERENCES
(i) With respect to temperature, during winters while, the temperaturedecreases to – 450 C (below freezing point) at Daras near Kargil in theGreater Himalayas, it rises to above 200C at Chennai (Madras) inTamilnadu. Similarly, during summers, when it crosses the 500 C mark inJaisalmer, located west side of the Aravalli mountains, it is recorded lessthan 200 C in Srinagar.
(ii) With respect to rainfall village Mawsynram, located 16 Km west ofCheerapunji in Khasi hills, experiences an average rainfall of 1080 cm whileonly 12 cm of rainfall is recorded in western Thar desert. In other words,Mawsynram receives as much rainfall in one day as is received in eightyears in the areas west of the Aravalli mountains.
(iii) While people of Barmer and Jaisalmer in Rajasthan yearn for clouds, inMeghalaya the sky remains covered with clouds throughout the year.
(iv) Similarly as moderate temperature prevails throughout the year inMumbai and other coastal areas due to the nearness to the ocean, theinterior areas like Delhi, Chandigarh and Ludhiana experience extremeand harsh type of climate. That is, winters are extremely cold and summersare extremely hot.
FACTORS DETERMINING THE CLIMATE
The Tropic of Cancer passes through the middle of the country, and itdivides its climate into two different types. Those parts of the country which fallto the south of the Tropic of Cancer become closer to the equator. Therefore,they have high temperature with no winter season. But their climate should havebeen of tropical type. In areas north of the Tropic of Cancer, due to lowtemperature the winter and summer seasons are there, not the climate shouldhave been of the sub-tropical type. But this is not so because the climate of theentire country is full of diversities which is affected by many other factors, besidesthe location of the country.

35
(i) Distance from the Equator: India is located near the equator in theNorthern Hemisphere. That is why, except the Himalayan mountain region,high temperature prevails throughout the year in almost all areas of thecountry. Therefore, it is also considered as a country of hot climate.
(ii) Relief: The east-west extending high mountain range of Himalayas inthe north, exerts a very strong influence on the climate of India. On theone hand, this mountain range protects India from the cold blizzardsblowing from Central Asia, because of which the temperatures remainabove freezing point during winters in the plain areas. On the other hand,because of being high, this range act as a barrier for the monsoon windsblowing from the Bay of Bengal and divert them to the north –westernparts of the country and brings change in the extremely hot and dryclimate of these parts. These winds bring heavy rainfall to the sea facingslopes of Western Ghats and hilly regions of Assam. But the Deccan plateauand the trans –Himalayan regions, being located on the leaward sidecome in the rain-shadow zone and remain dry. Similarly, the Aravallimountain region also remains devoid of rainfall because of its location innorth-south direction parallel to the direction of southwest monsoons.Therefore, the presence of the Himalayas, is the biggest factor inmaintaining the monsoon type of climate in the country.
(iii) Air Pressure System: With the onset of summer season, the sunrays startfalling directly on the Tropic of Cancer in the Northern Hemisphere, as aresult of which the temperature of northern parts of the country startsrising. With the increase in temperature, low pressure centres (994 mb)begins to form over the North Indian Great Plains, which are also calledas the Inter Tropical Convergence Zone (ITCZ). During winters, thesevery plain areas get converted into high pressure zones, due to the extremecold conditions while low pressure is created over the Indian Ocean.
(iv) Seasonal Winds:
(a) Due to the change in the air pressure during summers and winters, seasonalwinds blow in the country. Winds blowing from sea to land for six monthsduring summers are hot and humid whereas winds blowing from landtowards the sea during six months of winters are cold and dry. The differentseasons in the country are based on these winds only.
(b) The direction of these seasonal or monsoon winds blowing over the earth’ssurface is also affected by the upper air circulation present at the height of3 kms above the surface, which is also called the Jet Stream. During summers,these cold and high pressure fast winds crosses the Tibetan plateau behindthe Himalayan mountain ranges and in winters are shifted to 250 C northlatitude. Due to these winds, the cyclones of summers and western seasonaldisturbances of Mediterranean regions reach northern parts of the countryand bring heavy rainfall.

36
(v) Nearness to the Indian Ocean: The adjoining great Indian Ocean has lefta very strong imprint on the climate of the entire nation. Due to the evensurface of the Indian Ocean, the south –western monsoon winds, comingfrom areas south of equator also blow with full speed towards India.These moisture-laden winds bring life in the life-style of the entire countryby distributing the moisture absorbed from the sea. The Coromandelcoast receives rainfall in winters only due to the location of Bay of Bengaland cyclones developed here also bring heavy rainfall during summers.The peninsular areas being surrounded from three sides by sea providemoderate climate to coastal areas where summers are less hot and wintersless cold.
Therefore, the above mentioned factors clearly indicate that in Indiahot-tropical monsoon type climate is found, in which monsoon winds exert astrong impact on almost all parts of the country at different times.
INDIAN MONSOON SYSTEMS
The word ‘monsoon’ owes its origin to the Arabic word ‘Mausam’ whichmeans change in elements (temperature, humidity, pressure and direction of localwinds) due to the change in season. A surface wind that blows in a particulardirection in one season but reverses completely in the other season is known asmonsoon wind. The cycle of these monsoon winds is largely confined to theTropical zone, that is, between 35ON and 20O S latitudes. This cycle of windsowes its origin to the differential heating of land and sea. Due to this change, theequatorial low pressure belt shifts towards the Tropic of Cancer in summers.This belt is known as the ‘Inter Tropical Convergence Zone - ITCZ’. To fill thislow pressure, south-east trade winds from the southern Indian ocean are deflectedto the right by earth’s rotation on crossing the equator and as a consequence alarge part of the air acquires an anti-cyclonic (clockwise) circulation from south-west to north-east direction. These winds after travelling a long distance reachthe west coast of India on first of June and brings heavy rainfall which is knownas the ‘monsoon burst’. When the winds from around the Kerala coast cross thewest coast, then also moderate rainfall even before first June, which is known asthe ‘pre-monsoonal rainfall’. These monsoon winds provide rainfall to the entirecountry after June to mid-September. Heavy rainfall received by Tamilnadu inwinters is brought by the retreating monsoon winds.
Besides, the above mentioned theory of temperature differential, theupper air circulation is also considered as the reason for the origin of these winds,because of which the arrival of these monsoon winds in the north-western partsof the country is attributed to the ‘Jet’ stream present at heights in NorthernIndia. With its movement only, these winds bring rainfall to northwestern regions.Third and modern reason is the El-Nino current flowing near the coast of Chilein the Pacific ocean. However, its scientific analysis is yet not available.

37
CHARACTERISTICS OF MONSOONAL RAINFALL
The amount of average annual rainfall of the country is about 118centimeters, which is mostly brought by the monsoon winds. This monsoonalrainfall has many characteristics in the country:
(i) Rainy Season and Quantity: India receives most of its rainfall (87%) duringsummer, from March to September by monsoon winds. The remaining 13%of the rainfall is received after the monsoon season from September toOctober, 3% of which is received in the month of January and Februaryand 10% in the month of March to May before the onset of monsoon. Nearly74% of the rainfall in the country is received in the rainy season from Juneto Mid-September.
(ii) Variability: The monsoonal rainfall received in India is not reliable.Sometimes it is excessive and sometimes it does not occur at all. And thisvariability of rainfall often results in the famine and starvation conditions.This variability goes on increasing towards the state of Rajasthan and interiorareas of the country.
(iii) Uneven Distribution: The distribution of rainfall in the country is uneven.The average annual rainfall varies from 250 cms. in hills of Meghalaya, andAssam and western slopes of western Ghats to less than 25 cms. in WesternRajasthan, Western Gujarat and North Kashmir.
(iv) Uncertainty: The quantity of monsoonal rainfall received in India isuncertain. Sometimes, monsoon winds arrive in an area before its normaltime and create a flood-like situation in many areas because of heavy rainfall.And sometimes it is insufficient or ends before its normal times whichcauses drought and damage to crops. Also the water which is stored forirrigation throughout the year is supplied to the canals in highly restrictedamount.
(v) Dry Spells: During summers, many a times monsoonal rainfall is not regularand it occurs occasionally after an interval of few days or weeks. As aresult rain cycle breaks and a long and dry spell occurs in the rainy season.This dry period is known as the monsoonal break, which develops as aconsequence of tropical cyclones developed in the Bay of Bengal or theArabian Sea.
(vi) Orographic rainfall: Monsoonal rainfall actually is originated due to thecooling of moist winds by rising at heights along the mountains and plainareas. Due to this, southern or windward sides of mountains receive heavyrainfall and northern and leeward sides being in the rain-shadow arearemain dry.
(vii) Torrential rainfall: Monsoonal rainfall often occurs in large quantity andfor days together. Therefore, there is a proverb that ‘it never rains in Indiabut it pours’.

38
DISTRIBUTION OF ANNUAL RAINFALL IN INDIA
A wide range of regional variations is found in the annual distribution ofrainfall in India, which have a deep impact on the climate and agriculture of thecountry. Orographic rainfall occurs in southern slopes of the Himalayas and inwestern slopes of western Ghats. Southern parts of the country receiveconvectional rainfall and northwestern regions receive cyclonic rainfall. The entirecountry receives mostly orographic rainfall and every month there is rainfall inone part of the country or another. The main reason for the uneven distributionof rainfall in the country is the relationship between distance from sea and locationof mountains.
The average annual rainfall in India is 118cm. The hills of Meghalayareceive the maximum rainfall which is, more than 1000 cm, whereas Thar desertreceives less than 20 cm of rainfall in one year. On the basis of annual amount ofrainfall, the country may be divided into five major areas :
(a) Areas of Heavy rainfall (Above 200cm)
(b) Areas of High rainfall (from 150 to 200cm)
(c) Areas of Moderate rainfall (From 100 to 150cm)
(d) Areas of Low rainfall (from 50 to 100cm)
(e) Areas of very Low or Scanty rainfall (Below 50cm)
(a) Areas of Heavy Rainfall: These areas exist in narrow belts in which annualrainfall is more than 200cm.
(i) In the long and narrow coastal belt from Dadra and Nagar Havelli toTrivandrum, the south –western monsoon winds coming from Arabian seato the western slopes of western Ghats bring heavy rainfall. Konkan andMalabar coasts receives continuous rainfall (May to October) for five months.
(ii) The second area of heavy rainfall lies in the north-eastern part of the country.It includes Darjeeling, Bengal Duars, middle and lower valleys of Assam,southern Arunachal Pradesh and mountainous areas of Meghalaya. TheShillong plateau and slopes facing Bangladesh receive heavy rainfall. Here,Cherrapunji gets 1087 cm and its nearby located Mawsynram receives 1141cm rainfall. These places are the rainiest in the world. Arunachal Pradeshreceives more than 250 cm of rainfall for six months from April to themonth of September.
(iii) Besides these, the islands of Andaman & Nicobar and Lakshadweep alsofall under the category of areas of heavy rainfall.
(b) Areas of high rainfall: There are three different regions in the entire country,where rainfall is heavy and is between 150 – 200 cm. These are:
(i) A very narrow belt of 20 km. width along the western Ghats in thenorthsouth direction which extends from the mouth of river Tapti tothe plains of Kerala.

39
(ii) Second belt of heavy rainfall runs along the southern slopes ofHimalayas, from Himachal Pradesh through Kumaon Himalayas andreaches the lower valley of Assam.
(iii) Third belt extends in northsouth direction, which includes Tripura,Manipur and Mikir hills. They receive almost 200 cm. of rainfall.Table 3.1 shows the temperature and precipitation of some importantstations in India. Read it carefully and note the uneven nature ofrainfall and range of temperature.
(c) Areas of Moderate Rainfall : These areas receive the less reliable annualrainfall between 100 to 150cm. Three large areas of moderate rainfall are foundin India :
(i) The largest area extends in a long narrow belt along Orissa, northernAndhra Pradesh, Madhya Pradesh, Bihar, Eastern Uttar Pradesh andShivalik Hills, upto the hills of Jammu which is delineated by the100cm isohyte. The hilly relief of Chota Nagpur plateau receivesrainfall by the two branches of monsoon winds and cyclones of Bayof Bengal.
(ii) The second belt of moderate rainfall is stretched for 80 km. width onthe eastern coast extending from Nellore (Andhra Pradesh) to theSouthern Calimere point, which is also called the Coromandal Coast.However, this coastal area receive rainfall in both the seasons(winterand summer) but retreating monsoon gives more rainfall in winters.
(iii) The expanse of third elongated belt is from the mouth of Narmadariver on the eastern slopes of Western Ghats to Kanyakumari. Heresouthwestern monsoon winds give rainfall while blowing down theslopes.
(d) Areas of Low Rainfall: In this category, semi-arid areas, which receive anaverage rainfall of 50 to 100 cm. are included. This area extends along the frontiersof India with Jammu in the north to Kanyakumari in the extreme south. It includeswestern Madhya Pradesh, western Uttar Pradesh, Punjab, Haryana, easternRajasthan, eastern Gujarat, interior Maharashtra, Tamil Nadu, Karnataka andsouthern Andhra Pradesh. Generally these are all rainshadow areas lying in theWestern parts of the states. Monsoon winds either become dry till they reachhere or due to surface configuration, they can’t reach the right heights andstraightaway pass along these areas.
(e) Areas of Scanty Rainfall: These dry areas receive less than 50 cm. of annualrainfall. These include the territory behind the Zaskar mountain range fromLadakh to Karakoram; areas of Kuchchh and Western Rajasthan, and southwesternareas of Punjab and Haryana. Besides these areas, about 100 km. wide belt fallingin the Deccan plateau in northsouth direction also receives scanty rainfall. Thisarea extends from Satpura hills and runs along the eastern slopes of westernGhats through the central districts of Karnataka and reaches the Kurnool district

Tab
le 3
.1 :
Tem
per
atu
re a
nd
Rai
nfa
ll s
tati
stic
s st
atio
ns
are
in I
nd
ia
(Av
erag
e -
Mo
nth
ly T
emp
erat
ure
in
Deg
ree
celc
ius,
Av
erag
e ra
infa
ll i
n c
enti
met
res)
Sta
tio
nL
atit
ud
eH
eig
ht
Jan
u-
Feb
r-M
arch
Ap
ril
Ma
yJu
ne
July
Au
gu
stS
epte
m-
Oct
o-
No
ve
-D
ece-
A
nn
ual
(In
m.)
ary
u
ary
b
erb
er
m
ber
mb
er
Av
er.
Ra
infa
llÆ C
wÆ.z
ww.|
wz.w
w|.v
w{.|
wy.w
wx.Æ
wx.Æ
wx.v
ww.~
v}.~
wÆ.w
Ba
ng
alo
revw
Æ z}'
N~Æ
~C
MÆ.|
Æ.~v.v
y.zvÆ
.||.v
vv.v
vx.|
v{.y
vz.x
{.vv.x
}}.~
Æ Cwy
.ywy
.yw{
.|w}
.xxÆ
.Æw}
.~w|
.ww|
.ww|
.ww|
.}w|
.wvz
.ÆM
um
bai
v~Æ N
vv
CM
Æ.wÆ.w
óó
v.}zÆ
.{{v
.Æx{
.~w{
.~y.}
v.Æó
v}x.y
Æ Cv~
.{ww
.Æw|
.vxÆ
.vxÆ
.yw~
.~w}
.~w}
.}w}
.~w|
.{wx
.yv~
.|K
olk
ata
wwÆ x
y' N
{C
Mv.w
w.}x.y
z.vvx
.yw~
.Æxv
.vxx
.ywz
.xvw
.|w.|
Æ.yv{
w.zÆ C
vy.y
v{.|
wx.x
xÆ.Æ
xx.x
xx.x
xÆ.Æ
w~.y
w}.~
wz.{
v~.y
vz.{
Del
hi
w~Æ N
wv~
CM
w.zv.z
v.xv.Æ
v.}|.y
v~.x
v|.}
vv.~
v.xÆ.w
v.Æ{|
.ÆÆ C
v{.}
v~.w
w{.{
w~.}
xx.x
xx.~
xv.x
w~.Æ
w~.v
w|.Æ
wÆ.v
vy.~
Jod
hp
ur
w{Æ v
}' N
wyy
CM
Æ.zÆ.{
Æ.xÆ.x
v.Æx.v
vÆ.}
vx.v
z.|Æ.}
Æ.wÆ.w
x{.{
Ch
enn
aiÆ C
wy.z
wz.|
w|.|
xÆ.y
xx.Æ
xw.z
xv.Æ
xÆ.w
w~.}
w}.Æ
wz.~
wy.|
vxÆ ~
' N|
CM
y.{v.x
v.xv.}
x.}y.z
}.|vv
.xvv
.~xÆ
.{xz
.Ævx
.~vw
}.{Æ C
wv.z
wx.~
w}.x
xw.|
xz.z
xw.Æ
w|.|
w|.x
w|.~
w{.|
wx.v
wÆ.|
Nag
pu
rwv
Æ ~' N
xvw
CM
v.vw.x
v.|v.{
w.vww
.wx|
.{w}
.{v}
.zz.z
w.Æv.Æ
vwy.w
Æ C~.}
vv.x
vz.~
v}.z
v~.w
wÆ.z
wv.v
wÆ.~
wÆ.Æ
v|.w
vx.x
vÆ.y
Sh
illo
ng
wyÆ x
y' N
vy{v
CM
v.yw.~
z.{vy
.{w~
.zy|
.{xz
.~xy
.wxÆ
.wv}
.}x.}
Æ.{ww
z.xÆ C
w{.|
w|.x
w}.x
w}.|
w}.{
w{.{
w{.w
w{.w
w{.z
w{.|
w{.{
w{.z
Th
iru
van
an
t P
ura
m }
Æ w~'
N{
CM
w.xw.v
x.|vÆ
.{wÆ
.}xz
.{ww
.xvy
.{vx
.}w|
.xwÆ
.{|.z
v}v.w
Æ C-}
.z-|
.w-Æ
.{{.
vvÆ
.Ævy
.yv|
.wv{
.vvw
.w{.
vÆ.
Æ-z
.{L
ehxy
Æ Nxz
Æ{C
Mv.Æ
Æ.}Æ.}
Æ.zÆ.z
Æ.zv.x
v.xÆ.}
Æ.zó
Æ.z}.z
yÆ
41
of Andhra Pradesh. These are all totally rain shadow areas except Rajasthan. InRajasthan region, hot and dry winds moving from Baluchistan (Pakistan) obstructthe path of Monsoon winds of Arabian sea due to which there is no rain in thisarea. The Monsoon winds of Bay of Bengal Branch shower most of the rainfall ineastern parts of the country and they are almost dry when they reach this area.
Thus, we may conclude that the annual distribution of rainfall in thecountry has three main features:
(i) The amount of rainfall gradually decreases from Bengal towardsthe west and the northwest.
(ii) In case of peninsular plateau also, the amount of rainfall decreasesas one moves from western and eastern ghats towards the interiorparts.
(iii) The windward side slopes receive higher rainfall.
CYCLE OF SEASONS
Cycle of seasons is formed due to change in the direction of monsoonwinds from time to time. The Indian Meteorological Department has dividedthe climate of the country into following four distinct seasons; on the basis ofchange in winds:
(i) The cold weather season (from mid-December to February);
(ii) The hot weather season (from March to mid-June);
(iii) The wet rainy season (from mid-June to mid-September);
(iv) The season of retreating Monsoon winds (from mid-Septemberto mid-December).
(i) The Cold Weather Season: According to Indian traditional system ofseasons, Hemanta and Shishira combine to form the winter season.
(a) Temperature: In the winter season sunrays fall straight on the Tropic ofCapricon in the Southern Hemisphere. That is, why the temperature goeson decreasing from southern to northern parts of the country. The 20oCisotherm runs parallel to the 20o north latitude in east-west direction throughthe middle of India. Places like Mumbai and Chennai have an averagetemperature of upto 25oC whereas it decreases to 10oC in the great plain ofnorth India. Whole of the entire Ganga valley experiences a severe coldseason. In places like Amritsar, Jalandhar and Delhi, some times thetemperature falls below the freezing point, due to the cold wave. Becauseof tropical location, the southern parts of the country do not experience thewinter season.
(b) Pressure: With the fall in temperature, the entire northern India is convertedinto a high pressure area. This area comes under the sub-tropical highpressure belt with the shift in the position of Sun towards the south. Thisbelt of high pressure, extending from the Mediterranean sea throughWestern Asia, Persian Gulf, Iran and Pakistan, crosses the great plains of

42
India and reaches the China sea. A condition of anti-cyclone is formed bythe isobar of 1020 mb. in Pakistan near Peshawar and in the northwesternparts of India. Sometimes, state of Madhya Pradesh, Jharkhand and Biharalso come under its influence. In southern and adjoining coastal parts ofthe country, isobars of low pressure of upto 1013 millibars are found.
Sometimes, the high pressure conditions in the northern parts ofthe country experience changes especially when many depressions (lowpressure centres) enter the interior part of the country from western andnorthwestern parts. These are also called as the western disturbances orcyclones.
(c) Winds: At the same time, high pressure areas develop over central andwestern Asia. Dry and cold continental winds from these areas enter thecountry through northwestern parts which cause a fall of many degrees inthe temperature of the great plains. These northwestern cold winds, movingat a speed of 3 to 5 km. per hour are termed as the Cold Waves. Onreaching the delta region of Ganga, these winds take a southerly turntowards the Bay of Bengal.
Winds blowing with a very high speed at a height of above 3 km.from the surface in the upper atmosphere, are called the ‘Jet Stream’. Thesewinds starting from the Mediterranean Ocean blow under the influence ofwesterlies towards the Tibetan Plateau in east direction. The Jet Streamgets divided into two branches – the northern and the southern, due tocoming to high Himalayas in its way. The northern Jet streams moves northof Tibet, from west to east and the southern Jet Stream moves to the southof Himalayas till 25o north latitude. It is this southern Jet Stream, whichaffects the climate of the country to a very large extent. Because of thisstream only about 5 cyclones enter India every month during winters, fromthe low pressure source region near Mediterranean ocean, after crossingPersian Gulf, Iran and Pakistan. With their arrival temperature increasesand winds calm down. But after their departure western and northwesterncold winds again set themselves in motion.
(d) Rainfall: During winter season, the rainfall occurs in interior places in thecountry. In northwestern parts, areas falling over Punjab, Haryana, northernRajasthan, Jammu and Kashmir and Western Uttar Pradesh receives anaverage of 20 to 50 cm of cyclonic rainfall, which is very useful for the rabicrops. Whereas neighbouring Himachal Pradesh, Kashmir and Kumaon Hillsexperience snowfall. On the other hand, coastal areas of Tamilnadu andKerala receive more rainfall in winters as compared to summers by thenorth-eastern monsoons.
(e) Weather: Weather is pleasant in winters. Days are mainly warm (moderate)and nights are cold. Due to sharp fall in night temperature, sometimesdense or heavy fog appears. Also due to the cold waves in the plains, asever frost occurs.

43
(ii) The Hot Weather Season:
(a) Temperature: Three and a half month long summer weather season is thelongest season in India. After March, when direct rays of the sun startafter crossing the equator, shifting towards the Northern Hemisphere, thetemperature in the interior parts of the country start rising. The maximumdaily temperature exceeds 38o C in Nagpur in the month of March, 40 oC inMadhya Pradesh in April and 45oC in the month of May - June in the north–western parts. Minimum temperature at night remains between 21o to27oC. The average temperature in the southern parts remains comparativelylow (25o C) due to the nearness to the ocean.
(b) Air Pressure: With increase in temperature, areas of low pressure startshifting towards the northern parts. Equatorial low pressure belt extendsparallel to the Himalayas in the north till Chota Nagpur Plateau and alongthe 25o N latitude in the south. This is also known as the Inter TropicalConvergence Zone and it attracts the monsoon winds from south to north.
In the month of May and June due to high temperature a low pressureThermal Depression develops in the north –western parts of the country.And the southern ‘Jet’ stream shifts towards north of Himalayas. That iswhy, due to temperature inversion, a dynamic low pressure cycle developsin the air above the surface. In this way, a special situation develops in thenorth–west, in which till the height of 6–7 Km from the surface of the land,the low pressure cycles join each other and attract the monsoon windsfastly towards themselves.
(c) Winds: Due to the establishment of vast areas of low pressure in the countrythe local winds start blowing at different places. Hot and dry westernwinds move in the north –western parts during daytime, which becomeweek at night. Due to this, sometimes strong thunderstorms and in theafternoon, dust storms come. These cause heavy loss of life and property.After crossing the dry and hot desert areas, these western winds orwesterlies become extremely hot, and are locally named as ‘loo’. Manypeople die due to the effect of this ‘loo’. Because of its continuous blowing,the north –Indian plains, become very hot and the intensity of low pressureincreases further.
When hot and dry loo coming from the northwestern parts comes incontact with hot and humid winds from Bay of Bengal near Chota Nagpurplateau, it gives rise to stormy cyclones, which are again pushed to thenorthwestern parts by the strong southwestern monsoon winds. Thesetornado like cyclones are known as Norwester or Kalbaisakhis in WestBengal.
Even without the above mentioned surface wind cycles, changes dooccur in summers in the upper atmosphere. The southern ‘Jet’ stream ofthe winters shifts towards the north and starts flowing in the northeasterndirection in the north of the Tibet Plateau. To fill the vacum of equatorial

44
low pressure in the south of Himalayas, the easterly Jet stream takes itsplace along the southern parts of the Tibetan plateau. It keeps on pushingthe tropical cyclones towards western parts of India. In this way, due tothe release of temperature during summers, the Tibetan highland turnsinto a radiation window around which Jet streams start moving in theclockwise direction.
(d) Rainfall: Although this hot season is extremely dry but still some rainfalloccurs due to the cyclonic cycle which provides some relief to the peoplefrom the scorching heat. Torrential rainfall which occurs in West Bengal inknown as the Spring season rainfall. In regions such as Kerala and southKarnataka in south India, pre-monsoonal rainfall of bigger droplets occursdue to the blowing in of the sea breezes. This is locally known as the ‘mango-shower’ or ‘Blossoms showers or Cherry showers’. Weather remains almostdry in rest of the country. Under local tradition, this season is consideredto be the convergence of the summer and the spring season.
(iii) The Wet Rainy Season:
This season is also known as southwestern monsoon season. It extendsfrom June to Mid-September in the country. At this time, the Inter-tropicalconvergence zone formed over northern great plains is able to attract thesoutheastern trade winds from the Indian Ocean beyond equator. These moisturelaiden moist eastern winds, after crossing the equator, change their directiondue to the earth’s rotation and start flowing from southwest to northeast at aspeed of 30 km per hour. And on reaching the Kerala coast on 1st June, theysuddenly bring heavy rainfall which is known as the ‘burst of monsoon’. Due totheir high speed only, these winds spread over the entire country within a periodof one month.
These winds are divided into two branches by the peninsular plateau ofthe country. The first and the Arabian Sea branch moves towards the northalong the western coast. Full of moisture, when this branch tries to cross the2000 metres. high western Ghats, it gets cooled due to the ‘lapse rate’ and startsraining. The amount of rainfall goes on decreasing as the moisture decreaseswhile moving north of the Arabian Sea. For example, Mangalore receives 330cm. of rainfall, Mumbai 100 cm., whereas Bhuj receives only 30 cm. of rainfall.One sub-branch of this main branch moves through the valleys of Narmada andTapti and reaches the Chota Nagpur Plateau and joins the Monsoon winds comingfrom the Bay of Bengal and gives more than 150 cm. of rainfall. Second branch ofthe monsoon winds of the Arabian sea moves towards the north, through Gujaratand Sind delta. By this time, firstly, the moisture content is largely decreasedand therefore the Thar desert of Rajasthan remains dry. Secondly, due to thecreation of a situation of temperature inversion by the sandy soil of the desertregion, these winds are unable to enter this area. Thirdly, Aravalli mountainswith lower altitude are also parallel to these winds and these just move straightwithout rising high, along these mountains. These moving winds on reaching

45
Punjab and Himachal Pradesh join the Bay of Bengal monsoon branch and as aresult bring heavy rainfall near Dharamsala.
The second major and important branch of monsoon winds is known asthe Bay of Bengal Branch. This branch moving from the eastern and westernparts of Sri Lanka joins with the monsoon winds coming from above the Keralahills and takes northerly direction. The monsoon winds coming down from thehills of Kerala cross the rainshadow areas of Tamil Nadu without any rain andagain absorb moisture while moving over the Bay of Bengal. Moving over theGanga Delta, the hills of Meghalaya come in their way. These saturated windswhile crossing the 1500 m. high Meghalaya hills brings heavy rainfall. Duringthis season, about 700 cm. of rainfall is received at Chirapunji and this is 60 percent of the total rainfall received here.
After crossing Meghalaya hills, these winds fastly take northerly directionwhere high Himalayas come in their way. The Himalayas also divide them intosub branches, parallel to themselves by deflecting them into two directions ofeast and west. The eastern branch moves upward from the Brahmputra valley toArunachal Pradesh and provides heavy rainfall. The amount of rainfall decreasesfrom Darjeeling (315 cm.) to Guwahati (110 cm.).
The second sub branch takes a turn towards west and through the greatnorthern plain and gradually rising reaches the border areas of Punjab and Jammu& Kashmir. Here in this vast region these winds give 100 to 200 cm. of rainfall.The amount of rainfall also goes on decreasing with increase in distance fromsea. The amount of rainfall at Kolkata is 120 cm., Patna 105 cm., Allahabad 76cm., Delhi 56 cm., and Ludhiana 40 cm. and Amritsar receives only 25 cm. ofrainfall. South of Shiwalik hills, with increase in the distance and temperature ofthese winds in southern parts of Punjab and Haryana, the amount of rainfalldeclines to only 10 to 20 cm.
During this season, although the Terai and southern slopes of hilly areasreceive higher rainfall but declining trend in the amount of rainfall received isseen in these hilly areas too. For example, Nainital gets 200 cm., Shimla 130 cm.and Srinagar receives only 60 cm. of rainfall. Even if these winds continuouslyflow from the east and go on raining, but sometimes a dry spell or break of 3 to4 days also occurs in between. The origin of these obstructions in rainfall isattributed to the pushing off tropical depressions of the areas around the Bay ofBengal, in the way of southwestern winds by the north trade winds. Highernumber of these tropical depressions symbolises heavy rainfall. This rainy seasoncomes to an end in the beginning of September with the fall in temperature.
(iv) The Season of Retreating Monsoons:
This season is also known as the ‘Sharada Ritu’ according to the traditionalsystem of seasons in our country. In this season, the vertical of the sun, aftergradually shifting from areas south of Tropic of Cancer start moving towardsthe equator. Therefore due to decline in the solar radiation and due to heavyrainfall, the temperature in the northern areas falls greatly as a result of which

46
mights start becoming cooler. The sky is clear during daytime, and temperatureincreases slightly to 25oC. The amount of moisture left in the air by the recentlyended rainy season is increased and such a condition is also called as the ‘humus’.
In this season, the low pressure centres leave the northwestern parts andmove towards Bay of Bengal to reach the Indian Ocean. These cyclones bringheavy rainfall in the eastern coastal areas and in the interior parts of Tamil Nadu.
These monsoon winds retreat in almost the same sequence as they arrivein the country. They firstly leave Punjab till 15th September, Uttar Pradesh till1st October, Ganges Delta till 15th October and till 15th November these leavesouthern parts of Karnataka and Andhra Pradesh. So, in the great north Indianplains, due to the increase in dry climate, this season is also known as the autumnseason.
INDIAN LIFE AND MONSOONSThe climate of an area or region has a deep impact on its economic,
religious and social development. The Economic progress of that region can beseen through the development of its agriculture, industry and mineral wealth.In India life is primarily dependent on agriculture. Monsoon rainfall has animportant contribution in providing a strong basis for its development. Monsoonis considered as that pivotal point of the country, on which is based the entireeconomic structure besides agriculture. When monsoon rains are timely and inadequate amount, agricultural production in the country increases and greeneryis seen all around. But their failure leads to the drying of crops. Droughtconditions prevail in the country and there is shortage of foodgrains in the stocks.Similarly, if these monsoons arrive early then floods are caused. Due to theirlate onset however, the crops cannot be sown in time and as a result productiondecreases. In this way a very strong relationship is developed between thedevelopment of agriculture and monsoonal rainfall in the country, as only onethird of the country’s land is still without water due to the non availability ofproper irrigation facilities. Not only in dry regions but the people living in areasof developed irrigation, also feel great relief at the arrival of monsoon rains withwhich the falling level of underground water rises. In this way the economy ofthe country depends on the agriculture and in turn agriculture is totally dependenton the monsoonal rains. That is why the Indian Budget is largely called as the‘Gamble of Monsoons’.
Besides agriculture, the development of industry, minerals, tele-communication systems and administrative structure is based on the availabilityof large amount of energy. In this, the hydel power is the most commonly usedsource of energy. In case of failure of monsoons, the shortage of water occurs inwater reservoirs. As a result, the regular supply of water for irrigation and thegeneration of hydel power is reduced. This leads to the decline both in productionand in human efficiency. Also due to power cuts in industries the use of mineralresources decreases and the wages of mine workers also get reduced. Therefore,the economic structure of the entire country gets badly shattered.

47
Besides economic life, the religious as well as the social life are alsoaffected. Monsoonal climate makes the people fortunate. People perform yajnasand sing folk songs while waiting for the onset of monsoons, like kajri in Bhojpur,Malhar in Braj, sawan of Haryana and Teejan of sawan in Punjab etc.
Thus, monsoon winds make a valuable contribution towards having asimilar kind of thinking and life style within the country. Due to this, in everysphere, whether it is arid sandy land or it is a developed irrigated area, or ahumid area, each gets affected. As a result of the change in these winds accordingto seasons, the rainfall occurring due to the sea winds and western cyclonesbecomes a part of the huge monsoonal structure. It is only because of the highHimalayan mountain ranges that the effect of monsoon winds has been possiblein the country, over a vast area from the Tropic of Cancer to the Kashmir innorthern parts.
Exercise
I. Answer the following questions in brief :
1. Distinguish between climate and weather.
2. Name the factors affecting the climate of India.
3. Name the places in India having maximum and minimum temperature duringwinter season.
4. Give the names of hottest and coldest places in India during various season.
5. Name the driest and wettest regions of the country.
6. Name two places in India having moderate and extreme climate.
7. What do you mean by Inter-Tropical convergence zone (I.T.C.Z.)?
8. What is the importance of relief in determining the climate?
9. What is Jet Stream?
10. What do you mean by the term ‘Monsoon’?
11. Give any five characteristics of Indian Monsoons.
12. What is ‘Burst of Monsoons’?
13. What do you mean by “Loo”?
14. What is ‘Break of Monsoons’?
15. What is the month wise distribution of various seasons found in India?
16. Where does EL NINO Ocean current flow?
17. What is ‘kalbaishakhi’ or Norwester ?
18. What is meant by ‘Mango Shower’ ?
19. At which places do the Monsoon winds coming from Arabian Sea and Bayof Bengal meet ?
20. How would you explain the state of humidity ?
21. Name the traditional Indian system of seasons.

48
II. Give reasons of the following in brief :
1. Mumbai is colder than Nagpur.
2. Most of the average Annual rainfall in India comes in just four months ofthe year.
3. Chirrapunji receives maximum rainfall in the world.
4. Kolkata receives 145cm of rainfall where as Jasalmer receives only 12cm ofrainfall by the South-West monsoon.
5. Chennai receives more rainfall during winter season.
6. North-Western India receives rainfall in winter season.
III. Answer the following questions in short :-
1. What are the regional variations in the climate of India ?
2. Give an account of the main reasons for the climate variations in the country.
3. Why does the Pre-Monsoonal rainfall occurs ?
4. Describe India’s rainy season.
5. Which places receive maximum rainfall in India ?
6. Give any three characteristics of Indian monsoon.
7. What is the contribution of Western Jet stream in bringing cyclonic rainfall?
8. In spite of being close to the Arabian Sea, why does Rajasthan remain dry?
9. Why there is winter rainfall in North-Western India ?
10. How do South-East trade winds monsoon rainfall?
IV. Answer the following questions subjectively :
1. Which elements affect the climate of India?
2. Describe the main characteristics of monsoon rainfall in India.
3. Explain the characteristics of different seasons of India.
4. Compare the summer and winter seasons of India.
5. Explain with the help of examples, the impact of monsoon winds on life inIndia.
6. Why is the Budget in India known as the Gamble of monsoons? Explainwith examples.
7. Inspite of vast monsoon unity, those exist wide regional disparities in India,Explain with examples.
8. What is the annual distribution of rainfall in India?
V. Represent the following on the outline map of India:
1. Low pressure area in summer and direction of winds.
2. Areas of winter rainfall and direction of North-East monsoon winds.
3. Cherrapunji, Jaisalmer, Allahabad, Chennai.
4. Regions of very less rainfall.
5. Location of Inter-tropical convergence zone in the month of June.
6. Regions of more than 200 centimetres rainfall.
****
49
CHAPTER 4
NATURAL VEGETATION,
WILD LIFE AND SOILS
In earlier chapters, we have studied in detail about the variations inrelief and climate, present in our country. Both these elements directly influencethe natural vegetation of the country. Besides these elements, natural vegetationalso depends on the type of soil and depth of the underground water found indifferent regions. Climate, among these, is the most important influencingelement. The types of natural vegetation, their development and geographicaldistribution are clearly influenced by the difference in the distribution oftemperature, amount of moisture, rain and snow etc. Therefore, naturalvegetation of any region is considered as the mirror reflection of the climate ofthat region.
(A) NATURAL VEGETATIONNatural vegetation includes all those trees, shrubs, plants and grasses
etc. which grow without human interference. Before studying it, the knowledgeabout related terms like flora, vegetation and forests is necessary. Flora includesdifferent species of plants that grow at a specific time in a particular area. Thebushes, plants, grasses etc. that grow at a place under a particular environmentare known as vegetation. Whereas dense, closely grown trees, plants, shrubs,grass etc. found over a vast area are called as forests. The word forest is usedmostly by geographers, administrators and forest guards, in view of theeconomic benefits and conservation of environment.
Each type of developed vegetation had to maintain a delicate balancewith its environment to cover a long life-cycle, which depends on its qualitiessuch as mutual cooperation and adaptability according to the season. Entireflora found in our country is not local. Rather, 40% of it consists of foreignspecies, which are known as Boreal or Paleo-Tropical species. These speciescame to India with the movement of people from Sino-Tibetan, North Africanand Indo-Malaysian regions. Respectively, these are mostly found on thesouthern slopes of Himalayas, northwestern Great Plain, northeastern statesand group of Nilgiri hills in the south. Many plants of the foreign species werebrought as ornamental plants for the gardens in the country. But due to hotand humid climatic conditions, their number increased so much along rivers,tanks, canals and choes that after some time it became very difficult to checktheir growth. These foreign species not only hampered the growth of localvegetation but also reduced the useful lands and they are also proving harmfulfor spreading diseases. Due to their harmful effects only water Hyacinth plantspreads into the water sources and is known as the “Terror of Bengal”. Similarly,Lentana plant has quickly covered and deeply influenced the green pasturesand natural forests of the country. Parthenium or congress grass has also spread

50
widely in the country and has increased the incidence of diseases like allergies,skin diseases and breathing problems. The wheat imported from the foreigncountries during periods of shortage has also brought many unwanted weedswhich are spreading fast and a lot of money is being spent on purchase ofchemicals needed to eliminate them.
In this way we could say that natural vegetation of our country has notremained natural. Rather factors like fast growing population, shiftingagriculture, overgrazing of pastures, indiscriminate felling of forests for fueland timber etc. have either destroyed a large part of the natural vegetation orhave transformed it. The natural vegetation growing according to local climateand soil, is restricted only to the north Himalayan region, western Thar desertand inaccessible hilly areas of Bastar-Koraput.
EXTENT OF NATURAL VEGETATION
For economic development and ecological balance it is essential for everycountry that at least 33% of its land is covered with forests. In the world,29.5% of the total land is covered with forests, whereas in India only 74.1million hectares or 22.7 % of the total area is under forests. This is much lowerthan the 33.3 percent which is fixed by “National Forest Policy” of 1951.Currently, the area under forests is a little more than the one-fifth of the totalarea of the country. As compared to the world as a whole, India has a percapita forest area of only 0.14 hectares, whereas in Canada it is 22.7 hectares,in erstwhile Soviet Union 3.75 hectares, in Australia 2.85 hectares, in Myanmar1.64 hectares and in USA 1.44 hectares. Not only the area under forests is lessin our country but also the annual production from them is very low as comparedto other countries of the world.
Also the regional distribution of the limited available forest area in thecountry is very uneven in peninsular plateau and its hills, as much as 57% ofthe country’s area under forests is found. After this come the Himalayas whereit is 18%. The western ghats and western coastal areas as well as the easternghats and eastern coastal areas each share 10 percent. Lowest percentage ofcountry’s forested area that is only 5% is found in the great northern plains ofIndia.
At state level also, high proportion of forest area is found in Tripura(59.6%), Himachal Pradesh (48.1%), Arunachal Pradesh (45.8%), Madhya Pradeshand Chhattisgarh (32.9%) and Assam (29.3%). Whereas less than 15% of landis under forests in states like Punjab (2.3%), Rajasthan (3.6%), Gujarat (8.8%),Haryana (12.1%), West Bengal (12.5%) and Uttar Pradesh (13.4%). Under UnionTerritories, highest area (94.6 per cent) under forests is found in Andaman andNicobar Islands and lowest (2.1%) in Delhi. The facts stated above clearlyindicate that mountain states have more forests and there is great scarcity ofthese in the plain areas. This has made the problems of soil erosion andunderground water level more serious. Therefore, there is an urgent need toincrease the area under forests in the northern plain states.

51
State Community PrivateForest Forest Forest
Reserved Protected UnclassifiedForests Forests Forests
Ty
pes
Of
Fo
rest
Model 4.1 : Classification of Vegetation and Types of Forests
Basis of Classification
Accessibility Leaves Administrative Forests Law Geographical
Authority elements
Inaccessible Accessible
Forest Forests
Broad leaved Coniferous
Forest
Tropical Evergreen Deciduous or Dry Vegetation Tidal Forests Mountain
Forests Monsoonal Vegetation
TYPES OF NATURAL VEGETATION
The natural vegetation found in India can be divided into many types onthe following different bases : i) accessibility ii) shape of leaves iii) administrativecontrol iii) forest law, and iv) geographical elements (see Model 4.1)
(i) On the basis of accessibility, 18% of the forest areas of India are suchwhich are situated on the high slopes of Himalayas, due to which they arebeyond the reach of human being or are inaccessible. We are able to utilizeonly 82% of the total forest area.
(ii) Similarly, valuable conifers with pointed leaves, extending over 5% of thetotal area under forests, are situated on the undulating slopes of the Himalayasand are inaccessible because of lack of transportation facilities, and thereforeremain almost unexploited. Only broad-leaved deciduous forests of Teak andSal are utilized by the people of the country, which account for 95% of theforest area.
(iii) Thirdly, on the basis of administrative control, forests are categorizedunder three heads, keeping in view the uncontrolled felling of forests and their

52
conservation. According to this, 95% (717 lakh hectares) of the forests are stateforests, on which the government has total control. Besides these, those forestswhich come under the jurisdiction of local municipal and district councils, andaccount for 3% (20 Lakh hectares) of the forest area and are known as thecommunity forests. Remaining 2% (9 lakh hectares) forest area belongs to thecommon people and is called Private Forests.
(iv) Forests are again divided into three parts on the basis of their properutilisation, control and legal protection. Firstly, in India, 52% (394 lakh hectares)of the forest area is reserved for controlling soil erosion, conservation ofenvironment and regular supply of timber. Cattle grazing and cutting of fuelwood are strictly restricted in these reserved forests. Secondly, 32% (233 lakhhectares) of the forests are protected forests, whose exploitation is completelyrestricted by the government, but are largely open to the people for gettinggrass, fuel wood and grazing of cattle etc. Third category includes, 16% of theunclassed forests, which have attracted little attention of the government. Variousfacilities are available for the people in these forests.
(v) Besides above given basis, the classification of forests is also indirectlyinfluenced by the geographical elements. No doubt India has tropical monsoonalclimate but due to variations in rainfall and relief the natural vegetation in thecountry varies from equatorial evergreen vegetation to Alpine vegetation ofcold regions. On the basis of elements of environment, this can be classifiedinto following divisions:
(I) Tropical evergreen vegetation
(II) Deciduous or Monsoonal vegetation
(III) Dry Vegetation
(IV) Tidal or Mangrove vegetation
(V) Mountainous vegetation
(I) Tropical Evergreen Vegetation: This type of vegetation is found in areasof high rainfall. Therefore, it is also known as the rain forests.
(a) Area: These forests extends over (i) the western parts of western ghats;(ii) Andaman, Nicobar and Lakshadweep Islands; (iii) southern and easternslopes of lesser Himalayas; (iv) hills of the Shillong plateau; and (v) Assam,and plain areas of Bengal and Orissa.
(b) Climate: In areas of this type of vegetation, the average annualtemperature is about 25oC. The annual rainfall exceeds 200 cm. and amountof humidity is in the air is more than 70% throughout the year.
(c) Height: This vegetation is found upto the height of about 1200 metresabove mean sea level. The trees are 30 to 60 metres high and their trunkis more than 5 metres thick.
(d) Important Trees: The important trees found in the rain forests are –

53
4.1

54
mahogany, bamboo, rubber, coconut, pine, rosewood, ironwood, cane,hopea, nagkesar, gurjan, chaplas, mango, chap, machilush and kadametc.
(e) Characteristics: This type of vegetation is lofty, very dense, multistoriedand full of mixed species of trees. The trees do not shed their leaves atone time and hence remain green throughout the year. Their trunks arestraight and long but branches are very short. After the tree height of 30metres, the branches spread all around and take the form of a canopy, sothat maximum sunlight can be absorbed. The ground is mostly marshyand dark without any sunlight. There is lot of undergrowth mainly ofentangled mass of vegetation like small shrubs, climbers, canes and ferns.Some times other plants grow on the stems of trees, which is known asxerophytic growth. Due to their dense canopy, they become the habitatof variety of birds and wild animals. Though this is hardwood type ofvegetation but being very dense, lack of pure stands and swampy groundconditions, it is not easy to exploit these forests and also due to the lackof transportation facilities, their full economic benefits have yet not beenrealised. But large exploitation of these forests by the Britishers duringthe two world wars; secondly now a days their deforestation to fulfil theneeds of increasing population and shifting type of agriculture etc. havecaused a great damage to these forests in the country.
(II) Deciduous or Monsoonal Vegetation: This vegetation usually shedsleaves before the beginning of summers in order to check the excessiveevaporation. Due to this the trees are saved from dry air and sunlight and areable to survive for long time on the available soil moisture. On the basis ofamount of rainfall received, this deciduous or monsoonal vegetation could besub-divided into humid and semi-arid types of vegetation.
(i) Humid Deciduous Forests:
(a) Area: This type of vegetation is found in those four large areas, whichreceive normal rainfall between 100 to 200 cm. during the year. Theseare: I) Terai region of Himalayas, II) Vindhyachal-Satpura mountain regionand adjoining Chhota Nagpur Plateau and northeastern hilly states, III)Eastern slopes of Western Ghats, and IV) Southeastern Ghat’s Tamilnaduregion. In all these areas, trees are less dense but their height reachesupto 30 metres.
(b) Species of Trees: Valuable woods like Shisham, Sal in the northern forestregion and Sagon, Teak, and Sandalwood in the south are usually found.Besides, Jamun, Amaltas, Haldu, Mahua, Sakhu, Ebony, Arjun, Dhak,Shahtut, Amla, etc. are also found here.
(c) Grass: Beside these trees, valuable grass ‘Sabai’ is also found in the Terairegion. This grass is used in the manufacturing of paper. However, largetracts of these forests have been cleared for agricultural purposes.
55
(ii) Semi-Arid Deciduous Vegetation : This type of vegetation is found inregions of low rainfall that varies between 50 and 100 cm.
(a) Area : A long strip of area under this vegetation extends from Punjabthrough Haryana, southwestern Uttar Pradesh, eastern Rajasthan,Kathiawar and Deccan Plateau alongwith neighbouring areas of centralIndia.
(b) Trees: Shisham or Tahli, Kikar or Babul, Banyan, Haldu etc. trees arefound in abundance in this long belt. Valuable trees like Sandalwood,Mahua, Siras and Teak are also found occassionally mixed with othertrees at some places. These trees often shed their leaves before the startof summers.
(c) Grass: Thorny bushes and variety of grasses could be seen in these areasfor long distances, which look like Savana grasslands. This grass is knownas Munj, Kans (reeds) and Sabai.
This vegetation has been excessively exploited due to increasing pressureof population. Trees are being cleared indiscriminately from the lands, whichare found suitable for agriculture. Therefore, there is a very strong need ofplantation of trees and their conservation in this vast area, so that man andanimals like sheep, goat, camels and other hibernating animals do not bringmore destruction to this vegetation.
(III) Desert or Dry Vegetation: This type of vegetation is found in desert orsemi-desert areas of the country where annual rainfall is less than 50 cm. Dueto the scarcity of moisture these trees possess much less foliage. Leaves areglazy, small, pointed and thorny but the roots of these trees are very long.
(a) Major Trees: Kikar, Babul, Jand, Tamarix are found in abundance in theseareas. Besides these, vegetation like Rambans, Khair, Pipal, Palm, Khejra,Ber, Aak, Neem, Cactus and grasses like Munj are also found. Due to thescarcity of water, the vegetation is totally absent towards western bordersof Rajasthan but with the tree plantation along the Indira Gandhi canaldrawn from the Sutlej river in Ferozepur district of Punjab, efforts arebeing made to make the area green again.
(b) Area: The main areas under this vegetation include parts of Rajasthanwest of the Arravali mountains; southern Punjab and Haryana and theinterior rainshadow areas of Deccan Plateau.
(IV) Tidal Vegetation: This vegetation is found in the deltaic areas of riverslike the Ganges, Brahmaputra, Krishna, Cauvery, Godavari and Mahanadi wheresea water at the time of tides keeps on entering the roots of trees. Due to thisthe roots of these trees get decomposed and soil becomes marshy. Poisonousinsects, pythons, snakes and crocodiles are found in the roots of these trees,which come out from the ground. Therefore this type of vegetation is alsocalled as mangroves, swamps, littorals or Sunderban vegetation.
56
Here ‘Sundari’ tree is found in abundance. Therefore, Ganga-Yamnuadelta is known as the Sunderbans delta. Besides this, other beautiful treeswith valuable wood like pine, canes, coconut etc. are also found in these areas.These trees have various species of climbers grown high on their trunks.
(V) Mountain Vegetation: In India, type of vegetation is found in theHimalayan mountainous region in the north and Nilgiri hills in the south.
(a) All type of vegetation, available in the whole world, is found in theHimalayan region. On the basis of amount of rainfall these are sub-divided into two parts - the eastern and the western.
Eastern Himalayan region receives more rainfall as compared to thewestern Himalayas. Therefore, about 4000 species of flowers and 250types of ferns are found here. The natural vegetation found on hill slopesis affected by the difference in temperature and rainfall with increasingheight. Upto the height of 1200 metres, mixed trees of deciduousvegetation are mostly found. Within 1200 to 2000 metres, dense evergreenforests are found which include the important trees of sal and magnolia.Trees like cinnamon, amura, chinauli and dilleniya are mostly foundalongwith them. With the growth of canes, climbers, bushes, ferns,bamboo, long savana grass etc. alongwith these trees, the vegetationbecomes denser. With the decrease in temperature within the height of2000 to 2500 metres, temperate type of vegetation is found. This includesbroad-leafed trees as oak, chestnut, laurel, maple and alder. Between theheight of 2500–3500 metres, pointed leafed coniferous and alpine typewild trees are present. Among these, trees with low height like silverfir, pine, spruce, deodar, rhododendrons, blue pine, etc. are included.Beyond 3500 metres height, in areas near the snow line, plants like smallnatural grasses and flowers etc. grow in abundance.
In the western Himalayan region due to the lower rainfall, upto the heightof 1800 metres, temperate trees like Chir (Pine), Sheesham, Saal, Semul,Jamun, Plum etc. are found. Deciduous vegetation is found in areas aboveShimla at the heights of 1800 to 3000 metres which includes trees likeDeodar, Pine, Blue pine, Oak, Elm, Poplar, Birch etc. Trees like yellowPine, Silver Fir are also seen. Alpine vegetation like Pine, Juniper, SilverFir etc. are mostly found above 3000 metres and grasslands are also foundwith short grasses. The local Gujjars and Gaddi tribes move to thesegrasslands to graze their cattle during summers.
(b) Mountain vegetation is also found in the hilly parts of the Deccan plateau.This includes the hilly areas of Bastar, Pachhmarhi, Mahabaleshwar,Nilgiri, Palni, Shivrai and Annaimalai. The combined effect of monsoonwinds coming from the Bay of Bengal and Arabian Sea brings rainfall ofmore than 200 cm. in these hill areas and in Nilgiri hills. Therefore, broadleafed evergreen forests are found upto a height of 1800 metres. Such

57
forests are known as Shola forests in South India. The important treesare Jamun, Machilus, Maliosoma, Saltis etc. But within 1800 to 3000 metresheight, temperate coniferous vegetation is found, which consists of treeslike silver fir, blue pine, birch and yellow champa. Mosses and fernsgrow on these trees. Above this height only small grasses occur. In allthese hillyregions vegetation cover is decreasing and land is increasinglybeing utilized for agriculture because of which underground water levelhas gone down. As a result, environmental balance has been disturbed.But now Eucalyptus and Teak plantation is being done in these areas.
IMPORTANCE AND CONSERVATION OF NATURALVEGETATION
Natural vegetation is invaluable property of the nation in which country’sancient scriptures were written. It has both direct and indirect benefits to thecountry.
(A) Direct Benefits:
(1) The country’s forests provide benefits of employment to nearly 40 lakhpeople. Workers are needed for cutting the trees, sawing, transportationof logs, loading of timber etc. Besides these, people working as rangers,forest officers, and forest scientists etc. for the protection, managementand conservation of forests also get there livelihood from the forests.
(2) Forests provide different types of wood to the country which is used formaking fixtures, furniture, fuel, paper pulp, paper and coal. Woods ofSal, Teak, Sheesham, Haldu, Palash, Arjun, Mahua from monsoonal forestsand wood from Pine, Deodar, Silver fir, and Blue pine etc. from Himalayanregion are mostly utilized.
(3) The government earns about Rs. 1 billion and 80 million of national incomeannually by giving part of forests on contract.
(4) Katha obtained from Khair tree is used to prepare medicines for diseasesof mouth and throat, Quinine is obtained from Cinchona; medicine isprepared from Sarpgandha shrub to control blood pressure; Bahera, Hararand Amla are used to prepare many ayurvedic medicines.
(5) Paper pulp is prepared from grasses like sabai, bhabar, and elephanta.Useful extracts are obtained from lemon grass and artificial perfumes areprepared from rosha grass.
(6) Tanning material is prepared after drying the leaves, barks and fruits ofmangrove, gambier, harar, bahera, Amla and kikar etc. Tar wood shrubfound in south India is also used for leather tanning.
(7) Lac (sealing wax) from palash and peepal, silk from mulberry, oil fromtung and sandalwood, dhoop and resins etc. from saal are prepared.Grasses like bamboo, canes, coconut grass and sarkanda are used in almost

58
every house in rural areas of the country for preparing ropes, strings,and for thatching the roofs. Besides these, a large variety of fruits,vegetables and leaves (tej patta) are procured from natural vegetation.
(8) About 25 million tribals live in the forests of the country.
(9) Forests are home to the rich and diverse wildlife of the country. Therefore,as many as 80 wild life sanctuaries have been developed on 15,000 squaremiles area of the country, where animals can live in there natural habitats.
(10) The green pastures facilitate the grazing of animals.
(B) Indirect Benefits: There is a long list of indirect benefits of forests.Their indirect benefit is that they provide pure and fresh oxygen for the humanhealth. The various indirect benefits if forests are as follows:
(1) For Controlling the Rainfall: In areas of dense vegetation, the amountof humidity is increased due to transpiration from the leaves. The windsblowing over such areas become cooler as result of which the watervapour starts falling on the surface in the form of rain.
(2) Climate: Dense forests check the increase in temperature during summerand bring increase in temperature during winters. That is why cold andmoderate climate is found in such areas, which is pleasant and good forhealth.
(3) Checking the Floods: Roots of dense vegetation are helpful in reducingthe speed of flowing water. As a result, damage through floods is reduced.Secondly, the water absorbed by the roots of plants, percolates into thesoil, and hence increases the water table. On the other hand the watereasily flows into the rivers with the reduction in the volume of waterflowing on the surface.
(4) Checking Soil Erosion: Rain water and fast blowing wind erode the topfertile soil from the land surface which is without any vegetation cover.But roots of trees hold the soil tightly and reduce the intensity of boththe elements and thus save the fertile soil from being eroded away.
(5) Fertility of Soil: The dried fallen leaves and twigs of trees form humusor green manure, as a result of which the soil becomes more fertile.
(6) Nature’s Gift: Variety of green vegetation presents a beautiful landscapewhich attracts the people to these dense forest areas for tourism, huntingand even for meditation in order to get mental peace. For example thegovernments of Punjab and Haryana respectively have developed theplaces like Chhatbir near Chandigarh and Pinjore near Morni Hills forthe people.
(7) Boon to Industries: Dense forests provide a strong base to many industries.These manufacture paper, lac, matchsticks, silk, sports goods, plywood,gum, resins etc. These goods become raw material for other modernmanufacturing industries. Besides, skins of birds and animals, meat, horns,

59
wool, bones, honey gums etc. are also obtained which provide a base toa large number of industries of decoration, textile and candle making etc.
In this way forests are very important for us. They absorb carbon-dioxideand release oxygen which is essential for the existence of both man and animalson the earth. But their uncontrolled felling during recent years has badlydisturbed the ecological balance. Due to the removal of vegetation cover fromthe hill slopes and plains, the problems of regular floods and soil erosion arebecoming more serious. The deforestation in the Shivalik hills passing throughthe northern parts of Punjab, has led to an increase in area under choes orseasonal streams, thereby resulting in increase in the wastelands. At the sametime, water level has gone down in the plain areas. As a consequence, problemshave started arising for irrigation of agricultural land. Rapidly increasingpopulation of the country, increasing urbanisation, industrialisation andpollution, expanding rail and road networks etc. are some of the major reasonsdue to which more than 13 lakh hectares of forest area is being cleared everyyear in the country. That is why serious attention is being paid for conservingthe environment. On the basis of National Forest Policy of 1952, to maintaintree cover in 60% of mountainous areas and 20% in the plain areas, VanaMahotsava is celebrated every year. New programmes are being launched underFive Year Plans for the development of social forestry. Protected forests arebeing raised along the canals, rivers, roads and railway tracks. In Rajasthan,the soil erosion and forward shift of sand dunes is being checked by growingseven grass on sand dunes.In hilly areas fast growing trees such as eucalyptusand poplar are being introduced to correct the ecological imbalance. Besides allthis, we should not only participate in the noble act of plantation of trees everyyear but also we should fully cooperate in the conservation of forests, keepingin view the magnitude of demage done to them.
B. WILD LIFE
Besides the huge variety of vegetation, the wild –life (fauna) is alsofound to be equally rich and varied in our country. Actually, there exists aclose relationship between the two. There are about 76000 species of wild lifefound in the country. The country has as many as 2500 species of fish in itsfresh and saline waters. Likewise, there are about 2000 species of birds and400 species of snakes. In addition, amphibians, reptiles, mammals and smallinsects and worms are also found. Among the mammals we have the statelyanimal, the elephant. It is typical of hot wet equatorial forests. In our country,it is found in the jungles of Assam, Kerala, and Karnataka where heavy rainfalloccurs, and the forests are very dense. In contrast, camels and wild asses areconfined only to the very hot and arid areas. Camel is generally the animal ofthe Thar while wild asses are found only in the Rann of Kuchchh. In the oppositedirection, is the habitat of the one–horned rhinoceros. It lives in swampy andmarshy lands of Assam and northern parts of west Bengal. Animals like Indian

60
Bison, the Indian Buffalo and the Nilgai are worth mentioning among the wildlife of India. Deer is the characteristic of Indian wild life. It is a very sensitiveand beautiful animal. Many species of deer are found in India and most commonof these are Chowsenha (four horned antelope), black buck (Indian antelope),Chinkara and deer. Someother important species of deer include Kashmir stag,spotted deer, musk deer and moushk deer.
Among the predators, the Indian lion holds a special place. BarringAfrica, it is found only in India. Its natural habitat is confined to the Gir forestsof Saurashtra in Gujarat. Besides being the most majestic of all the animals, it isone of the most strong animals in our jungles. The famous Bengal tiger has itsnatural habitat in the Sundarbans of the Ganga delta.. The other major animalsbelonging to the cat family are leopards, clouded leopards and snow leopards.Clouded Leopards and snow leopards are confined only to the higher reachesof the Himalayas.
The eastern ranges of Himalayan mountains are the home of severalfascinating animals, such as wild sheep, mountain goats, the ibex, the shrewand the tapir. Panda and snow leopard are confined only to the higher reaches.
Several species of monkeys are found in India. The Langur is the mostcommon among them. The lion tailed Macaque is a very strange animal. It hashair around the face, which appear like a halo.
In India several species of colourful birds are also found. If tiger is ournational animal, the peacock is our national bird. Pheasant, geese, ducks, mynahs,parakeets, pigeons, cranes, hornbills and sunbirds, mostly live near the wetlands in vegetated areas.
Wild life in the country has greatly reduced due to the practice ofuncontrolled hunting of wild animals for amusement and destruction of forestsfor a very long time. This has adversely affected the ecological balance of thecountry. Keeping in view the importance of bio–diversity, attention is beinggiven to the conservation of wild life in the country. In the conference of UNOheld at Stockholm in 1972, the matter was discussed at international level anda lot of awareness has been generated in this regard.In this programme ofnamely ‘Man and Biosphere’ the world community was appealed to protect theecological systems. In this context, the Wild Life Conservation Act wasformulated in 1972 in India.
A total area of 83835 square kilometre, which is 2.7% of the entire areaof the country and, 12% of total forest area is declared to be under nationalparks and wild life sanctuaries. Special attention is now being paid on the wildanimals which are near extinction. Periodic counting is undertaken at nationallevel to find out the exact number of total birds and animals. Currently thereare 16 reserve areas for tigers in various parts of the country. Similarly, aspecial project is being run in Assam for the conservation of Rhino. The GreatIndian Bustard of Rajasthan and Malwa plateau is yet another endangered

61
species. Even the number of lions had been dwindling for quite some time.This all is a matter of serious concern.
Efforts are being made for the protection and conservation of the greatbiological diversity of our country. Keeping in view the standard criterionformed by the United Nations, 13 Biosphere Reserves are being set up in thecountry (table 4.1). Under this scheme the first Biosphere Reserve wasestablished in the Nilgiri hills. Its area is 5.5 thousand square Kilometres, whichis spread over the border areas of Karnataka, Tamilnadu and Kerala. It wasestablished in 1986. Under this scheme, every plant and animal species wouldbe protected so that this precious natural heritage can be transferred to thefuture generations.
In each biosphere reserve, the forest land, the flora and the fauna willbe preserved in their natural forms. The neighbouring areas will be utilized forresearch and experimentation in developing forest and forest products, andthe periphery will be used for agricultural research.
TABLE 4.1
Biosphere Reserves in India
Name of Reserve States in which it is situated
1. Nilgiri Tamilnadu, Karnataka, Kerala
2. Namdhapa Arunachal Pradesh
3. Nanda Devi Uttrakhand
4. Uttrakhand (Valley of flowers) Uttar Pradesh
5. Northern Andaman Andaman and Nicobar
6. Gulf of Mannar Tamilnadu
7. Kaziranga Assam
8. Suderbans West Bengal
9. Thar Rajasthan
10. Manas parks Assam
11. Kanha Madhya Pradesh
12. Nokrek Meghalaya
13. Rann of Kachchh Gujarat
The country has 63 national parks, 358 wild life sanctuaries and 35zoological parks covering 1.3 crore square Kilometres of area.
C. SOILS
Fertile soils had remained the centre of attraction for human beingssince the ancient times. Like other countries, the ancient Indus civilization andAryan civilization too originated and developed on the fertile soils of the rivervalleys. The present Indian civilization also developed in areas of fertile soils

62
deposited by the rivers. Deposition of fresh alluvium every year by the riversand easy availability of water for irrigation have played a major role in theconcentration of population and development of agriculture in these river valleys.Because of being an agrarian, our country still depends on soil. Fertile soilfulfils the basic needs of food, clothing and shelter, to the large populationabuse of the country and hence has become a very valuable resource. Elementslike land, climate and vegetation play an important role in the development ofthis great resource. As we have discussed in earlier chapters, there exist widevariations in these elements, similarly the soils found in the country are notsame everywhere. At some places, ancient hard, stony, hilly and plateau soilsare present while newly deposited alluvial soils are present at some other places.Therefore, for a comprehensive study of soils of our country, knowledge aboutthe definition, process of formation, composition and structure, types, erosion,causes of erosion and conservation is essential.
(A) DEFINITION OF SOIL
Soil is defined as an unconsolidated layer of the earth’s crust formed ofthe weathered rock material and organic matter and can support plant life.
The thickness of this layer is found from 15–30 cm from the groundsurface to many metres deep down to the bedrock or parent material. Verticalsection through the upper crust of the earth is called soil profile. On the basisof colour, texture and size of particles, amount of humus, etc., soil scientistshave divided the soil profile into three major layers or horizons as A, B and Crespectively. A– horizon or topsoil contains humus due to which its colour isblack. But in this layer, most of the minerals dissolve and are washed downwardsby gravitational pull and get deposited in the layer beneath it. This is calledthe B horizon and is brown in colour. But amount of humus is less in thislayer. Then comes the C – horizon at the bottom. In this layer no majorchange is seen in the rock materials separated from the parent rocks and itjoins the parent rock. This layer is grey or light brown in colour.
(B) SOIL FORMING PROCESS
The process of soil formation is very slow and long. It takes thousandsof years for nature to form one inch of soil on the surface. Various whetheringagents keep on breaking the rocks of the earth. Many organic and biochemicalprocesses then modify this weathered material. The organic material consistsof both living and decayed plant and animal materials such as plant roots,fungi, bacteria, worms, insects and rodents. These get mixed with the inorganicmatter and help in the formation of soil.
(A) FACTORS AFFECTING SOIL FORMATION
The texture of soils of our country is not uniform. Besides the variousphysical, chemical and biological processes, there are five more elements thatinteract with each other to form a particular soil type. These are:
(i) Parent Rock : In the form of bed rocks, the sedimentary rocks of the
63
great northern plains of the country, provide the best type of soil largelybecause of accumulation of different types of minerals. These are followedby igneous rocks of the peninsular plateau region which give rise to zonalsoils and which are fertile due to the presence of minerals in them.
(ii) Climate: Colour, structure, texture, size of particles etc. of the soil formedfrom parent rocks depends on the fact that for how long these have beenaffected by a particular climate. In regions of wet climate like West Bengal,the soil develops faster due to the faster chemical action and the presenceof humus. But fertility of soil gets reduced due to the absence of vegetationin dry areas like Rajasthan. Similarly, in regions of heavy rainfall andfast winds, due to greater soil erosion the fertility is reduced.
(iii) Slope: Besides climate, slope of an area also contributes in the developmentof soil. In hilly areas with steep slope, the run-off is fast and soil keepson sliding under the influence of gravitational force. That is why soilsare less fertile in slopes in hilly regions than in the river valleys of Ganga,Indus and Brahmaputra. The southern slopes because of being sun-facinghave better soils than the north facing slopes in our country.
(iv) Natural Vegetation: This is a major soil forming element, which suppliesorganic matter to the parent material and helps in the development ofsoil. But due to the major part of land being utilized for agriculture, thesoils of our country lack in this element. The laterite soils, soils nearwater bodies, and soils of reserved forests have 5 to 10 percent organicmatter in our country. In remaining areas, the soils have only less than1% of organic matter in them.
(v) Time: Besides above mentioned four elements, time is of great importancein the development of soil. Every year humus and organic matter isadded to the soils and fertility of soil goes on increasing. The processcontinues for thousands and thousands of years before a good qualitysoil is formed.
Thus, five elements such as kind of parent rock, change in climate,diversity of vegetation, slope of the land and age of soil are responsiblefor the formation and development of soil.
(B) CLASSIFICATION OF INDIAN SOILS
In a vast country like India different types of soils are found due to thewide variety of rocks and climate in different parts of the country. They canbe classified on the basis of fertility, irrigation, origin and characteristics. Firstly,according to the traditional practice, soils were divided on the basis ofproduction of crops into two groups fertile soil, and (2) infertile soil. Infertilesoils were further sub-divided into two parts - the saline and the barren (sandy)soils. Secondly, in terms of irrigation, soils dependent on rainfall were knownas ‘brani’, whereas soil irrigated by wells were called ‘chahi’ and those irrigatedby canals, were known as ‘nahari’. And soils affected by seepage of river water
64
were termed as ‘sailabi’. Thirdly, on the basis of their origin, soils are classifiedinto two categories: (i) Zonal and (ii) Azonal. Zonal soil are also called as thelocal soil as they are formed on the deeply buried rocks. Azonal soils are alsoknown as the transported soils. These are formed due to the transportation ofmaterial from the parent rocks by winds, water, glaciers or sea waves.
But the eight fold classification of soils of India , given by the IndianCouncil of Agricultural Research, according to the report presented by all IndiaSoil Survey Committee in 1953 is very well recognised. These eight soil typesinclude: (1) alluvial soil; (2) black soil; (3) red soil; (4) laterite soil; (5) desertsoil; (6) saline and alkaline soils; (7) peaty and marshy soils; and (8) mountainsoils.
(1) Alluvial Soils :
(i) Area: These soils occupy extensive tracts of land of about 15 lakh squarekilometres covering 24% of total area of the country. These soils arefound in the form of stratified rocks with depth exceeding 500 metresbelow the ground surface.
(ii) Regional Extent: These soils are found in both the northern and southernparts of the country. In north India, alluvial soil is found in Punjab,Haryana, Uttar Pradesh, Delhi, Eastern Rajasthan, Bihar, West Bengaletc.plains of Ganga-Sutlej river valleys. Besides these areas, this soil isalso extended over the valleys of Brahmaputra, Surma valleys of Assam,Mahanadi valley of Orissa, Narmada and Tapti valleys of MadhyaPradesh and deltaic areas of Godavari, Krishna and Cauvery in theSouth.
(iii) Chemical Composition: These soils have large proportion of salts likepotash, phosphorus, lime and magnesium but they are deficient innitrogen and humus. Soils of north western parts are more porous, lightcoloured and with sandy –loam soil particles.
(iv) Soil Texture: These soils are formed by the deposition of soil broughtdown by the rivers originated from the mountain slopes of Himalayasand southern plateau, in layers . Area under alluvial soils is increasedby deposition of sediments by wind action in north western regionsand by tides on the sea coasts. There are four main regions of alluvialsoils in our country: (a) riverine, (b) terai, (c) deltaic and (d) coastal.
(a) Riverine Alluvial Soil: These soils are found in the river basins.Ganga, Sutlej, and their tributaries have extended these soils in theirhuge courses, and are divided into two sub –groups:
(i) Khadar Soil: This is light coloured acidic soil, which variesmostly from clayey to sandy loam in texture. Newer alluviumgets deposited due to the annual flooding. This soil is found inthe flood plains and deltaic areas.

65
(ii) Bangar Soil: It is found in plains which are more than 30 metres abovethe flood level and where river water does not reach the older deposits.These dark coloured soils have a mixture of sand, silt and clay, in equalproportion. In higher Bangar areas where these have lime nodules inlarge amounts below their layers, these are called alluvial kankar soils(for example Dadri in Haryana).
(b) Terai Alluvial Soils: These extend in areas along the Himalayanmountains, in Uttar Pradesh, Bihar and West Bengal. Here rivers flowwith great speed through bhabar soils, having big boulders and stones.When the slope breaks to become gentle, fine soil particles are depositeddue to which the amount of fine silt increases in the soils of these areas.
(c) Deltaic Alluvial Soils: This type of alluvial soils have large amount offine silt and therefore these are less porous, are wet, heavy and rich inhumus. These are found in the deltaic areas of all the rivers of India. TheSundarbans delta is the best example where soils are world famous forthe cultivation of rice and jute.
(d) Coastal Alluvial Soils: This type of soils are formed along the coast,with the deposition of disintegrated material by sea waters. These lightcoloured soils are less fertile due to high amount of sand in them. Theirexpanse is more on the eastern coast as compared to the western coast.
(e) Importance: Besides facilitating irrigation by canals and wells , thesealluvial soils have contributed greatly in the advancement of agricultureby providing the easily workable soft and fertile layer of soil andavailability of underground water in sufficient quantity. That is why, theareas of these soils are also termed as the ‘wheat and rice bowls’ of thecountry.
(2) Black Soils :
(a) Area: These soils cover an area of about 5.5 lakh square kilometres in thecountry. These are upto 8 metre deep below the surface.
(b) Regional Extent: These soils are found in a triangular area extendingfrom Mumbai (Maharashtra) in the west, Amarkantak plateau in the east,Guna (Madhya Pradesh) in the north to Belgaum (Karnataka) in the south.From this area many off-shoots extend into Andhra Pradesh. Besides,these soils are also found in Bundi and Kota districts of Rajasthan;Coimbatore, Salem, Tirunelivelli and Ramanathpuram districts of TamilNadu; and in Bundelkhand region of Uttar Pradesh.
(c) Chemical Composition: Black soils are generally rich in iron, potash,aluminum, lime and magnesium but are deficient in nitrogen, phosphorusand organic matter.
(d) Characteristics: These soils are formed due to the disintegration ofvolcanic rocks. Due to presence of iron and aluminum, these soils areblack in colour. Because of higher amount of basalt and clay particles,
66
they are also sometimes called Regur soils. These are formed with thecompaction of hard, impermeable and dark coloured fine particles. Withthe presence of limestone nodules in the lower layers of these soils, theycould retain water for long time. During rainy seasons these becomedifficult to work as the plough gets stuck in the mud. Similarly, in dryseason, cracks upto 15 –30 cm wide and upto 1 metre depth develop onthese soils in which, soil from surrounding areas gets collected whichincreases their fertility.
(e) Importance: Endowed with inexhaustible fertility this soil is helpful inthe cultivation of commercial crops. That is why, wheat, sugarcane,linseed, bajra, cotton and citrus fruits are grown successfully. Since theyare ideal for growing cotton, they are also called Black cotton soils.
(3) Red Soils:
(a) Area: They cover an area of about 2 lakh square kilometres, with depthto about 4 metres in the plain areas.
(b) Regional Extent: They practically encircle the entire black soil region ofDeccan plateau on all sides. These soils extendover whole of Tamilnadu,parts of Karnataka, north-east Andhra Pradesh, Orissa, South Bihar,eastern Madhya Pradesh and north eastern hilly states. Besides, thesesoils are also found in some districts of Uttar Pradesh and Aravallimountain regions of Rajasthan.
(c) Chemical Composition: The red colour of these soils is due to the presenceiron. These have developed on crystalline and metamorphic rocks whichare more sandy and less clayey. They are poor in nitrogen, humus, andphosphorus. But are rich in magnesium, iron and aluminum and so canproduce excellent crops like bajra, pulses, cotton, tobacco, jowar and fruits.Particles of granite, schist and gneiss are found in these soils.
These soils are found in areas with low rainfall. On the uplands, theseare gravelly, sandy or stony and porous. Under irrigation, these soilsprovide good production with application of ammonia, superphosphate,compost fertilizers. During rainy season, iron comes on the surface inthe form of iron oxides through capillary action, which increases amountof red colour in these soils. Their depth, fertility, colour etc. vary greatlywith change in height because of which they are also found in red –yellow and red –brown mixtures etc.
(4) Laterite Soils:
(a) Area: These soils covering 2.5 lakh square kilometres of area, are foundover 4% of the total soil area of the country. Their depth is only for fewcm and they are found in patches and continuously at some places.
(b) Regional Extent: These soils are well developed on the peaks of thebasaltic hills and plateaus of Vindhyachal, Satpura and neighbouring ranges

67
in Madhya Pradesh, eastern ghat region of Orissa, hills of western ghatsof Karnataka, south Maharashtra, Malabar in Kerala and north & easternparts of Shillong plateau in the north eastern states.
(c) Chemical Composition: These soils are generally poor in nitrogen, lime,potash, phosphorus, magnesium and organic matter. But due to beingrich in iron and aluminum oxides, these soils are acidic in nature and redin colour.
(d) Characteristics: These are soils of warm tropical regions, where due toheavy rain (more than 200 cm), lime, silica and salts are leached awayand so oxides of iron and aluminum are left behind. Its form in whichaluminum is more, is called bauxite. The word laterite means brick typeand it is used for making bricks. This soil is highly rocky and infertilewhich soaks the water very easily but due to high amount of silica inlower areas, this soil on mixing with loamy soil becomes fertile. Thelaterite soils are good for producing crops like topioca and cashewnuts.
(5) Desert Soils:
(a) Area: This soil spreads over ancient basaltic rocks over an area of nearly1.5 lakh square kilometres of the country.
(b) Region: These extend from Indus valley in the west to Aravalli mountainin the east in the states of Rajasthan, southern Punjab and southernHaryana.
(c) Chemical Composition: These soils are rich in soluble salts but containvarying percentage of calcium carbonate. This soil is very poor in nitrogenand humus.
(d) Characteristics: These soils contain 92% sand content and 8% clay content.The origin of these soils is mainly attributed to the continuous depositionof sand brought from the sea-coast (Kachchh) of Gujarat by the fastblowing summer monsoons. Under the influence of sand storms, theirvery fine particles reach southern districts of Punjab and Haryana in theform of ‘Bhur’ soils, and sand dunes of large sized particles are left behind.During long dry weather conditions, due to high evaporation and lack ofleaching, the salt dissolved in water dries on the upper layer of the soil.The colour of these sandy soils ranges from red to brown generally lightbrown. These soils are most porous, dry, having large sized particlesand less fertile. They are also called Sierozem soils.
(e) Crops: With irrigation facilities crops like bajra, jowar, cotton, wheat,sugarcane and some vegetables are grown in these sandy soils.
(6) Saline and Alkaline Soils:
(a) Area: The saline and alkaline soils cover an area of about 1.53 lakh squarekilometres in the interior and coastal parts of the country.

68
(b) Region: These are found in small patches in the states of Uttar Pradesh,Rajasthan, Haryana and southern parts of Punjab. Small pockets of thesesoils also occur in Rann of Kachchh on the sea coast; gulf of Cambay;near the mouths of Narmada, Tapti, Mahi, and Sabarmati; in the Dharwarand Bijapur districts of Karnataka; Goa and Tamilnadu and in coastalareas of Orissa.
(c) Chemical Composition: Saline soils are although rich in sodium content,but have large amount of calcium, magnesium and nitrogen in mixedform. Alkaline soils are deficient in calcium and nitrogen. They arehighly impervious and have a very low water holding capacity.
(d) Characteristics: In the interior areas saline soils originate due to poordrainage and higher sub-soil water table. The salts in solution percolatein the soil and go on accumulating. But during dry season, due to capillaryaction, these salts come to the surface and are deposited there as a whitelayer over the soil surface. This type of soils are known by differentlocal names such as Usar or Reh in Uttar Pradesh, Kallar or Thur in Punjaband Rakkar, Karl and Chopan in other parts of the country. The textureof these soils is sandy to loamy sand.
(e) Importance: By employing improved methods of irrigation and withapplication of lime and gypsum, wherever needed, these can be improvedby growing crops like berseem, rice and sugarcane can be cultivated.
(7) Peaty and Marshy Soils :
These soils are found in humid regions over an area of only 1500 squarekilometres. These are found in Sunderbans delta, coastal areas of Orissa, southeastern coastal parts of Tamilnadu, central Bihar and Almora district of UttarPradesh. As a result of accumulation and decomposition of large amount oforganic matter, these are black in colour and highly alkaline/acidic in nature.That is why peat (type of coal) soils are also known as ‘Kari’ soils in Kerala inwhich many salts are dissolved. Due to the presence of iron contents in organicmatter, these soils sometimes become blue coloured heavy soils. Duringmonsoons, these soils are generally submerged under water, and hence are putto paddy cultivation after the rains stop.
(8) Mountain Soils :
These soils cover on 7.2% of the total soil area of the country. Theseare shallow on the mountain slopes. But in valleys or gently sloping hill sides,their depth varies from few centimetres to 2 metres. These pervious soils havelarge proportion of sand, gravel ,pebbles and soluble organic materials. Theseare deficient in lime but rich in iron and hence are ideal for the cultivation oftea. That is why they are also known as ‘tea soils’. Due to growth of naturalforests on them on the mountain slopes, these are also called the ‘forest soils’.
The mountain soils are found in lower and middle ranges of theHimalayas especially in Assam, Ladakh, Lahaul –Spiti, Kinnaur, Darjeeling,Dehradun, Almora, Garhwal and in Nilgiri hills in the south.

69
Their colour and character changes with height. Upto an elevation ofabout 1800 metres in the hot sub-tropical belt of the Himalayan slopes, thebrown coloured, acidic forest soils are found, due to the decomposition ofdecidous vegetation. Between 1800 and 3000 metres of elevation, thetemperatures are low and poorly decomposed coniferous vegetation convertthese soils into grey-brown podzolic soils. In areas of higher elevation, alpinemeadow soils occur above the timber line. These are shallow, dark in colorand sandy-loam or sandy-silica in texture. The organic matter is not decomposedin these soils due to sharp fall in temperature.
(E) SOIL EROSION
The removal of top 15 to 30 cm thick layer of soil by natural agentssuch as water, wind, glaciers and by man is called soil erosion. Usually, it is ofthree types:-
(i) Sheet erosion: In this type of erosion, thin sheet (layer) of soil is erodeduniformally from a large area by wind or running water.
(ii) Mill erosion: During heavy rainfall, water flows forming narrowchannels along the slope of the land. Many finger shaped grooves areformed over the surface.
(iii) Badland or Gully Erosion: In some areas, deep ravines are formedafter the soil is blown out by wind or is eroded deep by water. Theseravines increase in size if the erosion continues.
Different parts of the country have been affected by these threetypes of soil erosion.
Areas of Soil Erosion:
Following parts of the country have been severely affected by this problem:-
(i) In outer Himalayas (Shiwaliks), the natural vegetation has been removedindiscriminately due to which huge amounts of soil has been removedto fill the river valleys. This has resulted into floods which have causedgreat damage to the fertile land by depositing sand and water in lowlying areas. At the same time, in hilly parts land slides increase.
(ii) In Hoshiarpur and Ropar districts of Punjab; Yamuna; Chambal;catchment areas of Mahi and Sabarmati rivers, the choes and streamshave made the land barren due to lack of vegetation.
(iii) In the arid regions of south Punjab, Haryana, and eastern Rajasthan;western Uttar Pradesh and north western Gujarat, the soil has beeneroded by fast blowing winds.
(iv) In the north eastern states including West Bengal, due to erosionthrough heavy rainfall, floods and side cutting of river banks, hundredsof tonnes of soil is dumped into Bay of Bengal.
(v) In the south and south eastern India, soil erosion takes place due tosteeper slopes, heavy rainfall and faulty methods of cultivation.

70
Causes of Soil Erosion
Soil erosion is caused due to physical factors such as high temperature,snow storms, thunderstorms, heavy rainfall, steep slopes, sandy soils etc.Cultural factors like uncontrolled deforestation and overgrazing of pastures byanimals; shifting cultivation; faulty methods of cultivation; rapid expansion oftransportation, communication and canal networks; mining etc. also lead toerosion of soil.
Soil Conservation
Soil is a precious resource, which is transported from one place toanother by action of winds and water. To protect it from this loss and toconserve the fertile soil is moral duty of all of us. Therefore, the governmenthas paid special attention to the problem of soil erosion by establishing CentralSoil Conservation Board in 1953 and the state governments established SoilTesting Laboratories. Besides these, targets are set for the conservation of soilin every Five Year Plan. Trees are planted in rows to create windbreaks andshelter belts to reduce velocity of winds in Punjab, Haryana, Rajasthan, Gujarat,Uttaranchal and Uttar Pradesh. Also the trees like Dhak, Kikar and Khejri arebeing planted and suitable grass is grown on the sand dunes to check theirexpansion. The Indian Army has made a significant contribution in this regard.Similarly, in hilly areas, contour ploughing and terrace cultivation is practisedand small water reservoirs are made. In plain areas, soil can be conserved bycovering it with vegetation, crop rotation, and by using manures. In the hillyareas, conservation of soil is being done by controlling the unrestricted grazingby sheep, goats and other animals and by afforestation. Jharkhand governmenthas made strict regulations for shifting cultivation in the Chhota Nagpur plateauregion.
In the end, besides the government, it is the moral and religious dutyof all of us to protect the soil resources around us.
Exercise
I. Answer each of the following question in brief :
A. Natural Vegetation:
1. What is meant by Natural vegetation?
2. Differentiate between forest and flora.
3. Give the names and quantity of foreign species of natural vegetation existingin our country.
4. Which vegetation type is known as “Terror of Bengal”?
5. In which places the local Natural vegetation is found in India?
6. What percentage of land in India is covered under forests as compared tothe whole world?
7. What is the regional division of forest area in India?

71
8. In which State and Union territories the areas of maximum and minimumforest land fall?
9. Why do coniferous forests are found more than the broad leave forests inour country?
10. Which are State forests?
11. What do you mean by Reserved Forests?
12. Name some trees of Tropical Evergreen vegetation.
13. Which factors destroy the semi-arid deciduous vegetation?
14. Give the names of trees and areas of arid vegetation.
15. What are the other names of Tidal vegetation?
16. Name the trees found at an elevation of above 2500 metres in EasternHimalayas.
17. In which areas does Mountainous vegetation grow in Deccan Plateau?
18. What are “Shola Forests”?
19. Which trees are used for making Health Medicines?
20. Which trees are used for leather tanning?
21. What is the place of India at International level in per capita forest area?
22. What is the Chief objective of National Forest Policy?
B. Animal Life:
1. How many different types of animals could be there?
2. What type of areas are liked by Elephant to live in?
3. Which species of deer are found in India?
4. Where are lions found in India?
5. Name the animals which are found in the Himalayas.
6. Name the National Animal and Bird of India.
7. Which species of animals are endangered?
C. Soils :
1. Due to which reasons man has been attracted towards fertile soils?
2. Define Soil.
3. How is Soil formed?
4. Which are the basic elements of Soil?
5. Why are the Red Soils found on the Deccan plateau?
6. Which chemical elements are found in the Black Soil?
7. Where are laterite soils found in India?
8. Where are ‘Bhur’ Soil found?
9. What are different names of saline soils in different parts of the country?
10. In which areas of India are the soils suitable for cultivation of Tea found?11. What is meant by Soil erosion?
12. What different measures are taken to check the forward extension of desert?
13. How is soil erosion controlled through countour bunding?
72
II. Answer each of the following questions in short :
A. Natural Vegetation:
1. Why has foreign vegetation become a problem for us? Elaborate withexamples.
2. How could foreign plants be harmful for us?
3. What are the main reasons for our natural vegetation not remaining actuallynatural?
4. Analyse the forest area in our country at the regional and State levels.
5. How are forest lands classified on the basis of accessibility.
6. Write a short note on Deciduous or Monsoonal Vegetation.
7. What type of vegetation is found in east Himalayan regions?
8. How does natural vegetation act as a boon for industries?
9. What have burn the implications of indiscriminate cutting of forests in thecountry?
B. Animal Life:
1. What steps are being taken for protection of Animal Life in India?
C. Soils
1. What is the contribution of Primary Rocks in the formation of soils?
2. What should be done to increase the fertility to Soil?
3. How are soils classified on different bases?
4. Write a short note on Peat and Marshy Soil.
5. What are different types of Soil erosion?
6. What are the agents of soil erosion?
III. Answer each of the following questions subjectively :
1. Explain the classification of natural vegetation of India on various bases.2. How is natural vegetation classified on the basis of geographical elements
in the country?
3. "There is found a sequence vegetation from Tropical Evergreen to AlpineVegetation in India”, explain this statement.
4. Describe the benefits of natural vegetation to the country.
5. Which elements determine the texture of soil?
6. Discuss the various types and characteristics of soils found in India.
7. What is Soil erosion? Why is it caused? What is its regional distribution?How can it be checked?
IV. Show the following map on the of India:
1. Areas of arid vegetation.
2. Mangrove Vegetation Area.
3. Areas of Black and Alluvial Soils.
4. Areas of Laterite, Red and Mountainous soils.
*****

73
CHAPTER 5
WATER RESOURCES AND
IRRIGATION PROJECTS
The water that falls on the surface of the earth from the atmospherebehaves in three ways, which is called hydrological cycle. Firstly, some of thewater flows into streams and rivers. Secondly, it penetrates into the groundand thirdly, some of the water evaporates and returns to the atmosphere inthe form of clouds to be returned to the ground in the form of rain or snow.
Although the effect of this water-cycle is different on in various partsof the earth but our country is rich in water resources. From Kashmir toArunachal Pradesh, 40,000 Sq. km. of area is covered with snow and thesnowline starts above an average elevation of 5,000 metres. Similarly, theaverage annual rainfall of 118 cm. over the country shows a total amount ofnearly 38 lakh million cubic metres of water. Of this amount 13 lakh millioncubic metres are lost due to evaporation and about 8 lakh million cubic metrespenetrates into the soil and mixes with the underground water and the restabout 17 lakh m. cubic metres flows into the rivers. Roughly 85 per cent of thisflows into the major rivers and the remaining 15% flows into medium andminor streams. The total catchment area of all the rivers of the country, isabout 3 million sq. km. This is also called the total water resources budget ofthe country.
Due to uneven distribution of rainfall, in some areas there are floodswhile in some others there are droughts. Therefore, developed means ofirrigation are badly needed in arid and semi –arid regions of the country andmultipurpose projects are planned for the proper management of river waterresources. Therefore, to study and analyse the entire water resources of thecountry, knowledge of the river system; problem of droughts and floods;irrigation and its sources; and multipurpose projects, is necessary.
(I) DRAINAGE SYSTEM
The drainage of water is essential on the surface of the earth, which isdetermined by the slope of land. Water flowing from higher to lower areasshapes its course in the form of perennial rivers, seasonal streams and choesetc. Water flowing in the rivers has been the centre of attraction for man sinceancient times. Rivers have been used by farmers, fishermen, traders, warriors,travellers, and regional planners. The erosion and deposition of soils by them;easy availability and drainage of water; external and internal transportation;availability of facilities like irrigation and power etc., provide strong links ineconomic and cultural life of the country. The river Indus or Sindh flowing innorthwestern part of the sub–continent has given name ‘Hindustan’ to the

74
country. The religious significance of Ganges has been increasing because itswater is considered sacred. Besides this, rivers like Yamuna and Saraswati arealso considered sacred.
Besides religious significance, the size, speed, amount of water, heightof the the ground, slope and climate hold an important place in the drainagesystem of rivers. The monsoon rains affects the rivers of both northern andsouthern parts of the country but to have complete knowledge about the shape,slope, direction, source, size and speed of the rivers, Indian drainage systemhas been divided into two main divisions:-
(I) Internal Drainage System
(II) External Drainage System
(I) Internal Drainage System:
Many rivers or streams of our country either dry up on their way inarid land or enter lake before reaching the oceans. This type of adjournment ordrainage of water within land areas is known as internal drainage system. Thistype of drainage system is studied on the bases of places of origin anddestination of rivers.
(1) Origin: This type of drainage system in the country originates on the slopesof Himalayas and Aravalli mountains.
(a) Himalayan region: This region includes the internal drainage system of theShiwaliks and Ladakh.
(i) From the Shiwalik hills, the Ghaggar river originates from almost 1500metres high Morni hills and enters the plains near Panchkula. Thenmoving towards south and southwest, it reaches the Hanumangarh cityof Rajasthan through Punjab –Haryana border, helped by varioustributaries during rainy season. But due to irrigation and heavyevaporation it finishes on its way. Its main tributaries are Sukhna, Tangri,Markanda, Saraswati.
(ii) Secondly, besides Ghaggar, small rivulets like Jainti Rao and PatialiRao flowing near Chandigarh, also form a part of this drainage systemof the Shiwalik hills.
Thirdly, some rivers are also found in the Terai region, which afteroriginating from the slopes of southern of Himalayas, disappear in thefoothill Bhabar region. And after a long distance they again appear onthe surface. Kosi river of this region has been this type of river sincethe ancient Pleistocene period.
(iii) Ladakh region: Besides, the Aksai –Chin river of the inter –montaneplateau region of Ladakh, many more small streams also form this typeof drainage system.

75
5.1

76
(b) Aravalli Region: Many rivers originate during rainy season in these lowmountainous regions. Rivers originating on the western slopes get dried beforereaching the Sambhar lake, and Jaipur lake or they disappear in the sanddunes due to excessive heat and fast evaporation. Luni stream, originates nearSambhar lake and after joining the tributaries like Sukri, Jabai, Bondi and Mitri,it flows for 100 kilometres towards south. And after taking a southwestdirection, it disappears in the saline and marshy areas of Rann of Kachchh.
(2) Destination: In this internal drainage system, many small rivers and streamsor seasonal streams (known as choes in Punjab), also drain their water in deeptrenches on the ground which are called lakes. These lakes are found in all thethree important natural divisions: the Himalayas, the Thar desert and thepeninsular plateau:-
(a) Lakes of Himalayas: Large lakes are formed, due to the internal movementsof the earth, drifting of land and the closure of river courses, in the mountainousareas of Kashmir and eastern mountain ranges of Kumaon.
(i) Lakes like Dal, Wular, Anantnag, Sheshnag, Vairinag etc. of Kashmirregion are world famous. Besides these, lakes like Pengong –Tasho,Spargur –Tasho, Lig-zi-Tang, Harnag, Dhudnag, Anchor, Tao-Murari,are also found. Gobindsagar of Himachal Pradesh and Logtak lake ofManipur are also important.
(ii) Important lakes of Kumaon Himalayas are Bhimtal, Chaderpal tal,Nainital, Punatal, Gugnatal, Sattal, Nakutchiatal, Khurpatal, Mlbatal, etc.
(b) Lakes of Thar Desert: These include Sambhar, Salt lake, Jivai, Chauparbarabandh, Saipad, and Jaisomand lakes. Besides these, water sources like Didwana,Panchbhadra, Lunkaransar, Kachor, Revasa, Rajasmand, Fatehsagar, Udaisagar,Pichola, are aso found.
(c) Lakes of Peninsular Plateau: Natural lakes like Lonar of Maharashtra, Chilkaof Orissa, Pulicat of Tamilnadu, Periyar of Kerala and Kolleru of AndhraPradesh, etc, are included under the lakes of peninsular plateau.
(II) External/Out –land Drainage System : In this type of drainage system,rivers after moving from high mountain regions, join the oceans. On the basisof origin, destination, character and direction of flow, these types of rivers canbe divided into different parts:
(i) On the basis of Origin: The uplands between the two river systemsare known as water-divides or watersheds. There are two water-divides inIndia- Himalayan mountain range and the Vindhyan-Satpura ranges inpeninsular plateau. A comparative study of rivers originating in both theseregions presents wide contrast:-

77
Peninsular Rivers
1. They are seasonal in nature.
2. They are smaller in length. Thelongest peninsular river,Godawariis only 1,465 km. long.
3. Their catchment area iscomparatively small as comparedto the Himalayan rivers. Thecatchment area of river Godawariis only 3 lakh sq. km.
4. They are less in number.
5. They depend only on themonsoonal rainfall.
6. These are consequent.
7. They have reached the old agebecause they flow on the simpleand gentle slopes. That is whyGodawari is named as Old Gangain the South.
8. Their surface being made of hardrocks, very less amount of soilsare eroded and deposited bythese rivers.
9. The amount of water flowing inthese rivers is very less.Maximum flow of Godawari atVallopram is 3,200 cusces andminimum is 50 cusecs.
10. They flow through the less deepand broad valleys. Narmada andTapti rivers flow through the riftvalleys.
11. Due to the hard surface base,these flow in straight and welldefined courses.
Himalayan Rivers
1. They are perennial in nature.
2, They are very long. Length ofGanga, Satluj and Brahmaputraexceeds 2,500 km.
3. Their catchment area is spreadover many lakhs sq.km. Thecatchment area of Ganga is 10lakh sq. km.
4. They are large in number.
5. Glaciers and rainfall are theirmain sources of water.
6. Most of these rivers areantecedent, e.g. Indus, Sutlej,Alaknanda and Brahmaputra.
7. These rivers are in their youthfulstage due to their flow on thesteeper slopes. Headwarderosion leads to the formation ofwaterfalls.
8. These rivers deposit lakhs of tonsof silt every year in the oceansafter eroding the sediments fromthe fold mountains. Indus riverdeposits 300 million tons of siltevery year in the Arabian sea.
9. In these rivers, water isthousands of cusecs. The flow ofGanga at Farakka is between13,000 to 55,000 cusecs.
10. Very deep gorges are formed bythese rivers. Gilgit of Indus,Dihang of Brahmaputra andBhakra of Sutlej are world famousnarrow gorges.
11. They often change their coursesand move by forming meanders,as for example Yamuna,Saraswati, Kosi and Tista etc. That

78
(ii) On the basis of characteristics: Besides the places of origin of rivers,rivers can be classified on the basis of their characteristics as perennial andseasonal rivers. Similarly, on the basis of direction of flow, they may benamed as north, south, east and west flowing rivers. But it seems from theabove divisions, that a river has been divided into too many parts.
(iii) On the basis of destination, therefore, Indian rivers can be dividedinto two main divisions, which also includes direction: (a) rivers falling intothe Bay of Bengal, and (b) rivers falling into the Arabian Sea. Table 5.1 presentsa brief description about the main features of rivers of Bay of Bengal and ofArabian Sea.
(II) FLOOD PROBLEM
India’s large drainage system indicates towards the huge water sourceswhich are possesed by rivers like Brahmaputra, Sutlej, Godavari, Krishna,Mahanadi, Narmada, Tapti, etc. In this drainage system especially during,southwestern monsoons, heavy rainfall in vast areas, results in the increase ofwater level, which destroys the banks of rivers and water flows in the form offlood which causes heavy damage to life and property. The problem of floodscan be understood in terms of location of flood prone areas, the causes offloods and remedies to control them.
(i) Major Flood Prone Areas: The great northern plains of the country arebadly affected by floods. These cover 90% of the total flood affected area ofthe country, which falls over eastern Uttar Pradesh, east Bihar, Bengal, Assamvalley, Haryana, Punjab, and northeastern Rajasthan. About 15% of the damageoccurs in the plain areas of Punjab and Haryana. Remaining 10% of the damageoccurs in the lower parts of Mahanadi, Krishna, Cauvery, Godavari, Narmadaand Tapti rivers.
(ii) Causes of Floods: Floods are mainly the result of heavy rainfall, largenumber of mighty cyclones, deforestation, internal movements and faultydrainage system, etc. When a daily rainfall of 15 cms or above, occurs on thehigher and steeper slopes, it generally results in the rise of waters in riversand streams flowing in the plain areas. Almost similarly, three to four severe
is why some times the rivercapture occurs.
12. Big rivers of this region oftenform the deltas. SunderbanDelta is famous example.
13. These rivers are economicallyimportant in terms of navigationand irrigation. In Brahmaputraships can move down fromDibrugarh.
12. Their deltas are small or nominal.Narmada and Tapti end inestuaries only.
13. Navigation is not possible in theserivers due to the severe lack ofwater.

79

80

81
Som
e fa
cts
abou
t the
Dra
inag
e Sy
stem
of A
rabi
an S
ea.

82

83
cyclones occur near the eastern coast of India and bring heavy rainfall, whichcauses heavy damage in the coastal and deltaic regions. Thirdly, due to theuncontrolled cutting of forests in areas like Shivaliks, Assam Himalayas, ChhotaNagpur and due to the prevalence of shifting cultivation in the lower slopesof Himalayas, water after eroding the soil reaches the lower parts along withthe silt. Fourthly, in parts of Punjab, Haryana, and Uttar Pradesh, due to flattopography and large number of developmental works (new roads, rail tracksand canals),drainage is poor. Similarly, in the deltaic areas of Bengal, Orissaand Andhra Pradesh, due to tidal action, mouths of rivers get filled with siltand as a result heavy damage takes place.
(iii) Flood Control Measures: The Government of India launched NationalFlood Control Programme in 1954 to control floods. This Board through itsnational flood control policy, suggested immediate, short term and long termmeasures for tackling the problem of floods. On the basis of these, steps likebrick lining of embankments, desilting, raising rural areas above the flood levelto protect them from floods, channel diversions, construction of dykes to beused during emergency, afforestation in mountainous areas, identifying floodareas, forecasting floods, remedial measure against floods and construction ofcheck dams on steep slopes, etc., were taken. But this is such a serious problemthat till now man has not been able to completely control the natural conditionsof drainage in regions of rainfall. But the effect of floods can be certainlyreduced by afforestation in high mountain areas, checking silting and soilerosion, by constructing series of water reservoirs in the hilly areas and bystopping illegal control on lands in the river basins. Recently, Ganga ActionPlan to clear its water and Shramdan or voluntary service/labour for desiltingof Sukhna lake in Chandigarh and private dams like Sukho Majri nearChandigarh are its unique examples.
In this way, it could be said that unprotected and unattendedrivers are big engines of destruction but their care proves exceedinglyuseful for man and conditions of drought can be easily faced.
(III) DROUGHT PROBLEM
According to the survey conducted by meteorological department, 16%of country’s total geographical area is drought –prone area and 11% of country’spopulation is affected by it. According to the Irrigation Commission Report of1972, those areas of the country which receive rainfall of less than 75 cm, couldbe affected by drought. On the basis of average annual rainfall received by aregion, three levels of drought can be identified: (1) Minor drought- less than75% of rainfall, (2) Average drought- less than 70% of rainfall, (3) Extremeand complete drought- less than 50% of rainfall.
(i) Drought Areas : These areas are mostly found in arid or semi –aridregions of the country:
(a) Malwa Region : It includes Gujarat, adjoining areas of Rajasthan,

84
Uttar Pradesh, Punjab, Haryana and parts of Madhya Pradesh.
(b) Central parts of Maharashtra and Karnataka, Rayalseema, southTelangana and some areas in Tamilnadu.
Out of these, the extreme drought occurs in western Rajasthan, andKachchh regions where the variability of monsoonal rainfall is 25% more thannormal (50 cm).
(ii) Suggestions for the drought affected areas: Although rainfall is uncertainin the northwestern parts of the country, but the conjunctive use of rain water,surface water and underground water, is possible in these areas. Secondly,the introduction of specific crop pattern and deep ploughing techniques, wouldprovide optimum protection from the drought and at the same time ensure areasonable and reliable income per hectare of cultivated area. Thirdly, throughother sources of irrigation like canals, tanks, and wells and by employing dripor sprinkle irrigation system like in Israel, we can develop the dry farming.Fourthly, by using High Yielding Variety of seeds (HYVs) developed by theAgricultural Universities, production is possible from the saline area also.Fifthly, expeditious completion of the on-going projects (extension of canals,dams, lift irrigation schemes) should be given priority in future planning. Manyattempts have been made in the past three Five Year Plans for defining anddeveloping drought areas.
(IV) IRRIGATION
The total average annual surface run –off of rivers in India is 1,67,750crore cubic metres and every year 42,400 crore cubic metres water seeps intothe ground. In this way almost 2 lakh crore cubic metres of the usable waterbecomes available. Due to the limitation of physiography and present state oftechnology only 55,517 crore cubic metres (28%) of the water flowing in riverscould be used. Out of the total geographical area (32.87 crore hectares) of thecountry, only 30 crore hectares is available for cultivation. And out of this wehave been able to provide irrigation to only 8 crore hectares (26.6%) of areaand only 40,000 crore cubic metres (73%) of water.
But the uneven distribution, seasonal concentration and untimely burstof rainfall, prove a gamble in an agricultural country like India, where populationis also increasing at a very fast rate. Therefore, there is a strong need forbringing more and more area under irrigation to fulfill the food needs of fastincreasing population, by making land suitable for cultivation and by gettinghigher yields.
Sources of Irrigation : To make use of both the surface and groundwater for irrigation in the country, mainly four sources are used : (a) Canals,(b) Wells and tubewells, (c) Tanks and (d) Others (springs, Kuhls, Bndhary,Ahar, Pine, Thingal, Doon etc.)
(a) Canals: Canal irrigation accounts for the 47% of the net irrigated areain India. In the great northern alluvial plains of Punjab, Haryana, Uttar

85
5.2
86
Pradesh and Bihar, canals are widely used. Besides these, deltaic areasof the important southern rivers like Mahanadi (Orissa), Godavari andKrishna (Andhra Pradesh) and Cauvery (Tamilnadu) etc., also comesunder their infuence.
Major Canals: In Punjab, Haryana and Rajasthan, major canals includethe Nangal Hydel Channel, Sirhind canal, Upper Bari Doab canal, BistDoab canal, Bikaner canal, Western Yamuna canal and Chambal canal.Eastern Yamuna canal, Upper Ganga (Uttaranchal), lower Ganga, Agra,Sharda, Betwa, etc, are important canals in Uttar Pradesh. In Bihar, anumber of grids have been developed on canals like Gandak, Kosi andSon.In the south, Tungbhadra and Upper Krishna of Karnataka; deltaiccanals like Nagarjuna, Penar, Krishna and Cauvery of Andhra; Mettur,lower Bhawani and Cauvery in Taminadu; Manglam and Malampujacanals of Kerala; Bhandardara, Gangapur and Bhatagar of Maharashtraand Kakrapara, Ukai and Mahi of Gujarat etc, are counted as importantcanals.
(b) Wells: There are more than 70 lakh wells (Kutcha and Pucca) in alluvialplain regions of the country. In place of bull or animal driven PersianWheel wells, the number of power driven tubewells, diesel operatedpump sets is continuously increasing. These are found in greaternumbers in Uttar Pradesh, Punjab, Haryana, Rajasthan, Gujarat andTamilnadu and irrigate 38% of the net irrigated area of the country.
(c) Tanks: These are mostly found in the Deccan plateau region and irrigate10% of the net irrigated area in the country. The hard and imperviousrocks do not allow the water to penetrate deep into the ground.Irrigation through tanks is mainly practised in the states of Karnataka,Tamilnadu, Andhra Pradesh, Orissa, Rajasthan and West Bengal.
(V) MULTIPURPOSE PROJECTS
For irrigating the extensive fertile areas and to solve the problems offlood and drought, efficient water management in the country is essential.Therefore, central government established a Flood Control Board, whose mainobjective or function was to store water surplus in high rainfall areas and thensupply this water to be used in the arid and drought affected areas. For this,about 600 multipurpose river valley projects were started after independence.Of these only 400 projects have been successfully completed. The main purposesof the river valley projects are following: (1) to store water by linking damsand releasing it for irrigation over a long period, (2) generation of electricity,(3) development of fishing activity in water reservoirs and dams, (4) reducingthe intensity of floods in the lower areas of the river, (5) checking soil erosion,(6) plantation of trees in the catchment area, (7) developing tourist places, (8)developing facilities of water transport, etc. Some important multipurposeprojects of the country are:-
(1) Bhakhra Nangal Project: Under this project, 518 metre long and 226 metres

87
high dam has been constructed across the Sutlej at Bhakhra (HimachalPradesh) ahead of Nangal. It is considered among the highest dams in theworld. Behind this dam, a huge reservoir, 80 Km. long and 8 km wide,called ‘Gobind Sagar lake’, with a water storage capacity of 2 lakh cubicmetres has been made. From this two 1100 km long canals and 3400 kmlong distributaries have ben taken out that irrigate about 30 lakh hectaresof land. Two power houses with a generating capacity of 1205 Megawattshave been constructed below the dam. At Ganguwal and Kotla ahead ofNangal dams have been built which generate 72 MW of electricity. Thisproject supplies electricity to Punjab, Haryana, Himachal Pradesh, Rajasthanand Delhi regions. The Ropar thermal plant also gets water from the NangalHydel Channel.
(2) Beas Project: Under this project, a dam has been constructed, with 6.9 lakhhectares of water storage capacity and 240 MW of power generating capacity,at Pong on river Beas in Himachal Pradesh. It provides irrigation water to17 lakh hectares area of Punjab, Haryana and Rajasthan.
(3) The Damodar Valley Project: This project consists of a series of damsconstructed on Damodar river and its tributaries in 1948 on the similarlines as the Tennessee Valley Project of the United States of America. In thefirst phase of this project, four dams at Tilaiya, Konar, Maithan, Panchetwere constructed. In the second phase, four hydro–electric stations atBelaphary, Bokaro, Aiyar and Bermo were constructed. Channels wereconstructed for irrigation cum navigation purposes upto 2500 km byconstructing an irrigation barrage at Durgapur. This entire project has madeDamodar river and its tributaries, a boon, as it has helped in controllingfloods due to which it was earlier called as the ‘Sorrow of Bengal’. Throughthis project, the mineral region of south Bihar (Jharkhand) and industrialbelt of Kolkata has been linked to hydro –electricity grid. The thermal plantsconstructed at Bokaro, Durgapur and Chandrapura provide 1100 MW ofelectricity. A total of 1300 MW of electricity is generated from this entireproject and 5 lakh hectares of land is irrigated.
(4) The Kosi Project: This is a joint project being constructed at the Bihar –Nepal border. Earlier devastating floods occurred when river Kosi used toenter the plains with water acquired from the great Himalayas andsurrounding mountain ranges and many a times the river used to changeits course. Therefore it was also known as the ‘Sorrow of Bihar’. But nowa barrage has been constructed near Hanumangarh in Nepal, on theChatrakandra gorge of Kosi., having an installed capacity of 2000 KW(Kilowatts). From here, Western and Eastern Kosi canals have beenconstructed which irrigate 4 lakh hectares of land in Nepal and 8 lakhhectares in Bihar (total 12 lakh hectares). A 270 km long embankment onthe western bank has been constructed to have protection from floods.
(5) The Hirakud Project: Parallel to the Damodar valley project this projectwas started after 1948 to regulate the Mahanadi in Orissa. On this river,

88
three dams at Hirakud, Tikarpara and Naraj, were constructed. These hada generating capacity of 250 MW of electricity and could irrigate 10 lakhhectares of land. The Hirakud dam (in Sambalpur district) is 4800 metreslong and 61 metres high.It is flanked on both sides by 21 km long concretedykes to impound 8100 million cubic metre of water. From here, three canalshave been taken out respectively from Sambalpur, Baragarh and Sasan.Navigation is possible for a distance of 117 km from Dholpur to Cuttakthrough small shallow draft power craft due to regulated flow in theMahanadi.
(6) The Tungabhadra Project: This is a joint venture of the governments ofAndhra Pradesh and Karnataka which was taken up in 1956 at Tungabhadra-a tributary of Krishna river, at Mallapuram in Bellary district of Karnataka.It comprises a 2441 metres long and 46.39 metres high dam and has a waterreservoir with a spread of 37,000 hectares. The total installed capacity forpower generation is 126 MW. A total of 5 lakh hectares of land is irrigatedin Anantpur, Kurnool (Andhra Pradesh) and Raichur , Bellary (Karnataka)districts by three canals namely the Left Bank canal, the low level and theupper level canals.
(7) The Nagarjunasagar Project: This project comprises the 1450 metres longand 125 metres high masonary dam on the Krishna river near Nandikondavillage in Andhra Pradesh. Its power generation capacity is 100 MW. Thewater reservoir has a capacity of 808 crore cubic metres of water, on awaterspread it can be stored on 24,000 hectares of land. Through this dam,9 lakh hectares of land is irrigated in the districts of Khammam, WestGodavari, Guntur, Kurnool and Nellore, with the help of 200 km long leftand right bank canals.
(8) The Rihand Project: The dam comprises of a 934 metre long and 91 metrehigh straight gravity concrete dam constructed across the river Rihand nearvillage Pipri in Mirzapur district of Uttar Pradesh having 300 MW of powergeneration capacity. The reservoir known as Govind Ballabh Pant Sagarbehind the dam spreading over 466 square kilometres of area can store1060 crore cubic metre of water. It irrigates south Mirzapur (Madya Pradesh)and Western Palamau districts and electricity is supplied to tubewells andelectrification of railways.
(9) The Ram Ganga Project: Under this project, 626 metre long and 126 metrehigh earth and rock fill dam has been built on Ramganga river at Kalagarhin Garhwal district with a power generation capacity of 198 MW and forirrigating 6 lakh hectares of land. Its purpose was also to check the floodintensity in central and western Uttar Pradesh. From this a feeder canalhas been linked to supply water to the Ganga canals. Also 200 cusecs ofwater is also supplied for Delhi Water Supply Scheme.
(10) The Chambal Project: This project was started in 1953 –54 as a joint ventureof Rajasthan and Madhya Pradesh governments. The project was planned

89
to be completed in three phases. By the year 1971 –72, three dams - theGandhi Sagar, Rana Sagar and Jawahar Sagar, were constructed. These hada total power generation capacity of 386 MW. These three dams alongwithKota dam and the Left and right Main Canals irrigate 6 lakh hectares ofland of the surrounding districts of both the states.
(11) Besides these, Kakrapara on Tapti; Mayurkashi of West Bengal; Krishnarjunon Cauvery; Gandak of Uttar Pradesh and Bihar; Sabrigiri and Idukki ofKerala and Koenka of Maharashtra etc. are other major multipurpose projectsof India.
Exercise
I. Answer each of the following questions in brief :
1. What is water-cycle?
2. What is amount of water flows in rivers of our country?
3. How can the country’s water resources be utilized rationally?
4. For which people had the rivers been centres of Attraction?
5. What facilities are provided by the rivers?
6. Which rivers of India have religions recognition?
7. What is Inland drainage system?
8. What is the course of river Ghaggar?
9. Name any five rivers of Inland Water-drainage Systems of the Country?
10. Which rivers flow to the west of Aravalli mountains?
11. Which lakes of the Kashmir region are world famous?
12. Name the lakes that are water reservoirs of Thar Desert?
13. Where are the lakes of Peninsular plateau found?
14. Which are the main water-divider in India?
15. Name the tributaries of river Indus.
16. Which are the Southern tributaries of river Ganga?
17. Describe the main flood prone in areas of the country.
18. Suggest the measures to reduce the effect of floods.
19. Which areas of our country are drought prone?
20. What proportion of water in India can be utilized for irrigation?
21. What are the main sources of irrigation?
22. Name the major canals of Punjab and Haryana.
23. Where is the highest number of wells found in India?
24. Where are the tanks found in large number in India?
25. What are the main functions of multi-purpose projects?
26. What is the significance of Gobind Sagar Lake?
27. What is the capacity of electricity generation of the Bhakra-Nangal Project?
28. What are the names of power houses and dams of the Damodar ValleyProject?

90
29. Which two rivers of India are the “Homes of Sorrows”?
30. Name the states utilizing the Tungbhadra and Chambal Projects.
31. What is the size of Hirakud Dam?
II. Answer each of the following questions in short :
1. Compare the rivers of Himalayas and Peninsular India.
2. Describe the Ganga river system.
3. Why is river Godawari known as the old Ganga of the South?
4. Describe the west flowing rivers of Peninsular Plateau.
5. What is the problem of floods? What are the causes of its Severity?
6. What steps have been taken by the government to control floods?
7. What steps should be taken to solve the problems of Droughts?
8. What is the contribution of canals as sources of irrigation.
9. What is Damodar river valley project?
10. What is the budget of water resources in the country?
11. Describe any two multipurpose projects of South India?
12. “Deltas are not formed by the western coastal rivers” Explain.
III. Answer the following questions in about 250 words:
1. Describe the Inland Drainage System of India.
2. Describe the drainage system flouring into the Bay of Bengal.
3. Explain the drainage systems flowing into the Arabian Sea.
4. What is meant by the drought problem in the country? Explain its causesand areas.
5. What are the causes of floods in India? Throw some light on flood affectedareas and give remedies also.
6. Give a brief description of the irrigation sources of India.
7. What is meant by multi-purpose projects? Give an account of river valleyprojects in India.
IV. Show the following on the outline map of India:
1. Three major river systems of the Himalayas.
2. Two major tributaries of river Ganga .
3. Any four major rivers of Peninsular Plateau.
4. Any four Deltaic regions.
5. Any three rivers of Rajasthan.
6. Gorges of rivers Brahmaputra, Indus and Sutlej
7. Narmada and Tapti rivers.
*****
CHAPTER 6
LAND UTILIZATION AND AGRICULTURE
The total area of the country is about 32.8 crore hectares. The landutilization statistics are available for nearly 92.7% of the total area. India isamong those few countries where agriculture is being practised for thousandsof years in the plains of rivers. Since ancient times, large part of the country issuitable for agriculture. According to (Statistical Abstract, 2001) the statisticsof 1998, the net sown area in the country was 14.20 crore hectares, while thiswas 11.88 crore hectares in 1950 –51. In this way, net sown area has increasedby 2.38 crore hectares in the last 42 years. In other words, 2.32 crore hectaresof additional land has been made fit for agriculture. Thus, more than half ofthe total area is now available for cultivation. No other big country of theworld is so fortunate as we are in this regard. (Table 6.1)
Table 6.1: Land Use in Major Countries of the World (in Percent)
Country Cultivated Pasture Forested Waste TotalArea Land Land Land
Canada 5.0 2.0 33.0 60 100
China 11.0 30.0 14.0 45 100
India 51.0 4.0 22.0 23 100
Japan 13.0 2.0 68.0 17 100
USA 20.0 26.0 28.0 26 100
Former USSR 10.0 17.0 42.0 31 100
Land Use Pattern of India
As already mentioned, by the year 1998, nearly 2.32 crore hectares havebeen added to the net sown area over past four decades in India. Net sownarea constitutes 47% of the total reported area. Only 1.2% of the area is undertrees and groves. The fallow land constitutes 7.9% of the total area. It is thatland which is not sown every year rather once in two or three years. It includesthat land also which is kept fallow for a season or two and such land is knownas the current fallow. The land left fallow for more than a year is called as theold fallow land. Thus nearly 51% of the total area is cultivated.
The area under culturable waste-land has remained between 5% to 6%in the past few decades. But the land under permanent pastures is decreasing.This is due to the increasing population. To fulfill the food requirements of
91

92
6.1
Can
ada
Chi
naIn
dia
Japa
nU
.S.A
.F
orm
er U
.S.S
.R
(Uni
ted
Sta
tes
of A
mer
ica)
Agr
icul
tura
ble
La
ndP
ast
ures
Fo
rest
sW
aste
land

93
this population land under pastures is being converted into agricultural land.On the other hand, urban and rural settlements are also expanding with theincreasing population. With the fast increase in the developmental activities, alarge area is being utilised for non-agricultural uses such as roads, railways,canals, industrial and irrigation projects. In 1998, nearly 7% of the total areawas under such non-agricultural uses, while it was less than 4% in 1950-51.Although, the demand of land for these uses can not be neglected but protectingagriculturally fertile land through planned efforts, is necessary.
Table 6.2: Comparison of Land Use in India and Punjab, 1998
Land Use Category India Punjab
Total area (according to theavailable statistics) 100 100
(i) Forests 22.58 5.76
(ii) Area put to non-agricultural uses 7.39 7.90
(iii) Barren Land 6.24 1.77
(iv) Pastures Land 3.58 0.12
(v) Land under trees and groves 1.17 0.24
(vi) Culturable Wasteland 4.55 0.48
(vii) Fallow Land 7.91 1.49
(viii) Net Sown Area 46.58 82.24
Source : Punjab Government: Statistical Abstract of Punjab, 2001, Economic Adviser of Punjab
Government, Chandigarh, pp. 162-165.
The country has 22.6% of its area under forests, which is much belowthe required of 33% norm. For a self-reliant economy and for maintainingproper ecological balance, at least one-third of the total area should be keptunder forests and natural vegetation. According to available data, forestedarea in the country has increased after independence. In 1950 –51, forestsaccounted for only 4 crore hectares or 14.2%, which increased to 6.9 crorehectares or 22.6% in 1997-98. Inspite of that, area under forests is less bynearly 11 percent or 2.9 crore hectares than the standard forested area.
There are many important advantages of increase in the forested area.A larger area under forests makes important contribution by maintaining theecological balance and absorption of carbon dioxide. The increase in the amountof carbon dioxide in atmosphere leads to the increase in the green house effect.This in turn would raise the atmospheric temperature at the global level. Theincrease in the temperature will result in the melting of ice caps leading to risein sea level endangering the low lying thickly populated coastal regions of the

94
6.2

95
world. Besides this, forests provide habitat to the wild life. They help inraising the amount of precipitation and minimising the incidence of droughts.Forests conserves not only water but also protect soil as well. In this way, theyhelp in reducing the destruction by floods of the rivers.
About 2 crore hectares of land in India is not being utilized at this time.This land is classified as barren land. This includes the arid, rocky and sandydeserts. The high mountainous and barren lands also belong to this category.At times human beings are also responsible in increasing waste lands by theirdestructive activities like deforestation and over grazing. There has been aremarkable decrease in area under wasteland in the country. However, it isnotable that the wasteland has declined to 6.2% (1997-98) from the earlier figureof 12.8% in the year 1950 –51. In this way, wasteland has decreased to half inthe last four and a half decades.
In our own state Punjab, the land utilization statistics are available tous for 50.3 lakh hectares, which is nearly 99.9% of the total surveyed area ofthe state. In a way, except for 3 thousand hectares of area, land utilizationstatistics are available for whole of Punjab. Total net sown area in Punjab is82.2% whereas it is only 47% for the country as whole (Table 6.2). However,the area under forests is only 5.7%, whereas this average for the whole countryis 22.6%. In this way, Punjab has very little area under forests and scientificallyit needs an additional 27% land to be brought under the forests. Severe lackof forests and high proportion of land under the net sown area has adverselyaffected the ecology of the state. In recent years, the state’s intensive commercialagriculture has faced ecological problems. Problems like fall in the undergroundwater level, increasing salinity of soils, water logging and reduction in fertilityare being faced in some parts of the state. Due to higher standard of livingand high economic development level, the use of land for non-agriculturalpurposes is 7.9% whereas this average for the entire country is 7.4%.
Contrary to it, percentage of wasteland is very less as compared to thenational average. The area under wasteland in Punjab is 1.8 % of the totalagricultural land, whereas this average for the entire country is 6.2%. Similarly,culturable wasteland in the state is half percent whereas in the country it is4.6%. Clearly, most of the available land in Punjab is being utilized foragricultural purposes. This proves the predominance of agriculture in the state.
In the end, we can say that the land available for agriculture in thecountry is limited, and it can neither be increased nor decreased. In view ofthe increasing pressure on land, it is essential to plan for the use of availableland. This is possible only by adopting suitable measures to check soil erosion,desertification, salinity and submergence of soils, etc. By doing this, some ofthe wasteland may be brought under alternative uses. Similarly, by usingmodern and scientific methods of farming, the productivity of the land can

96
also be increased. Above all, attempts should be made to strike the balancebetween various uses of land. This is necessary for the agricultural developmentof the country. In the following pages, we shall study the agriculturaldevelopment in the country.
AGRICULTURAL DEVELOPMENT
Contribution of Agriculture in the Indian Economy
Agriculture is the mainstay of Indian economy. About two –thirds ofthe workers gets employment from the agricultural sector. This sector provides29% of the national income. In foreign exports too, agricultural products havean important place. Many products from agriculture are being utilized in theform of raw material in our industries. With the development in the agriculturalsector, per capita availability of foodgrains, which was 395 gm in the year 1950has increased to 510 gm in 1991. In terms of use of chemical fertilizers also,India ranks fourth after USA, erstwhile USSR and China. The area under pulsesin our country is highest in the world. In the production of cotton also, Indiaranks first among the countries where attempts were made first of all forproducing good quality cotton. The country has attained importantachievements in preparing the seed of Zinga fish and in developing technologyfor pest culture.
The average rate of growth of agricultural production in the countryhas remained at 2.7% per annum between 1949 –50 to 1997 –98, whereaspopulation growth rate has been about 2% per annum. This growth rate ofagriculture disapproves the concept of Malthus and his disciples, who believedthat the foodgrains production increases in arithmetic progression (2+2+2+_ _)and population increases in geometric progression (2x2x2x_ _ _ _ _ _) in theworld. The production of foodgrains in the country has increased more thanthree times after independence, that is, it increased from 549.2 lakh tons in1949 –50 and reached to 1933 lakh tons in 1997 –98. Diversity has occurred inthe crop rotation. Area under commercial crops has rapidly grown for increasingthe exports and to fulfill the domestic demand. During post-green revolutionyears (1967-68 to 1997-98) the average growth rate of agriculture sector hasbeen 2.84% per annum.
During this period, production of foodgrains has increased from 950.5lakh tons to 1933 lakh tons, like Summer Moong, Soyabean, Sunflower, etc.,have increased in the cropping pattern. Production of edible oils has alsoincreased. Their production was 9.47 lakh tons in the year 1987. Someimportant statistics related to agriculture are given in the following table. (Table6.3)

97
Table 6.3 : India : Increase in Production of Foodgrains, 1950 to 1997-98
(Production in Lakh tons)
Crop v~zÆ-zv v~|Æ-|v v~~Æ-~v v~~y-~z v~~|-~}Rice wÆ{ yww |yx }v} }wvWheat {z wx} zzv {z} {{ÆOther cereals vzy xÆ{ xw| w~~ xv{Total cereals ywz ~{{ v,{wv v,||z v,|~|Total Pulses }y vv} vyx vyv vxxTotal Foodgrains zÆ~ v,Æ}y v,|{y v,~v{ v,~xx
Source— (i) India : A Reference Annual : Govt. of India, New Delhi, p. 388
(ii) Economic Survey : Govt. of India, New Delhi, PP. 5-16.
In the above table, only food crops have been mentioned. Butagricultural sector is not confined only to the cultivation of crops. Rather italso includes livestock raising, fishing orchard farming and forestry. Naturalresources has a very special role to play in the agricultural sector. With thefavourable climate and fertile soils developed agriculture can be done. In thisregard, nature has been very kind to India. In the world, only one-tenth ofthe total area is fit for agriculture, whereas, in India two crops in a year aregrown due to favourable climate. The area that can be brought under irrigationin India is almost equal to the total area available for cultivation in China.
However, inspite of the favourable physical conditions and thedevelopments that have been taken place during these years, Indian agricultureis suffering from certain basic problems.
Main Problems of Indian Agriculture
The biggest problem of Indian agriculture is perhaps the tremendouspopulation pressure on it. Following statistics would clearly reveal this fact.Nearly 65% of total workers and their families, in the country are dependenton agriculture for their living. This large section of the population shares only29% of the gross income of the country. Second example of the heavy populationpressure is that the density of population in the country is 264 persons persquare km which is very high in itself. But the agricultural density is almostdouble (432 persons per square km) of it. It is due to population pressure onlythat even the infertile land has been brought under cultivation. Terraced farmscan be seen in the higher hilly and mountainous areas. Forests and tree groveshave been removed for extending the cultivation. For example, in theUttarakhand region of the Uttaranchal, cultivation is done on lands having aslope of even more than 60%.

98
This has given rise to environmental problems such as soil erosion, floodand drought, etc. The per capita availability of cultivated land has come downto only one –fourth of a hectare. And when our population is stated to doublein the year 2026, this per capita availability of land would further slide downto one-eighth of a hectare.
Most of the landholdings in the country are small, and are highlyunevenly distributed. Due to this social tensions, violence and discontent haveincreased. It is important to note that nearly 58% of the landholdings in thecountry are less than one hectare in size. These cover only 2% of the cultivatedarea. On the other hand, landholdings of 10 hectares or above size categoryconstitute only 2% of the total holdings. But these occupy more than one-fourth of the total cultivated area.
Due to smaller and very small size of most of the landholdings, theseare not economically viable and efficient. Small farmers work very hard ontheir land to increase productivity, but their net profit is very less. It is so,because they have to hire tubewells for irrigation and other agriculturalequipment from the big farmers and have to buy expensive chemical fertilizersand pesticides from the market. As a result, the actual saving of the smallfarmers gets reduced. Due to these reasons, Indian agriculture has been givenregarded as subsistence agriculture.
Due to the decline in forests and pastures, soil erosion is enhanced andnatural fertility is adversely affected. Besides this, most of our farmers areilliterate and they are not able to adopt crop rotation scientifically. It alsoreduces the fertility of soil. The third important factor for reduction in fertilityis the practice of intensive agriculture in which one crop or the other standsalways in the fields. Due to this, the soil nutrients like zinc, manganese andiron get exhausted. The farmers have to use chemical fertilizers frequently inorder repeatedly to maintain the fertility of soil which in the long run affectsthe natural fertility of soil.
To develop agriculture in the country, it is important to check thecontinuous fragmentation of landholding; to give preference to landconsolidation; to practice agriculture on scientific lines; to stress on the use oforganic fertilizers; to get the soil tested after short periods; to encouragemultiple cropping and mixed agriculture; and to utilize the sources of irrigationrationally. By adopting these measures, income from the agricultural sectorcan be increased.
Another kind of problem relates to irrigation. Whereas, at the nationallevel only, 35.3% of the cultivated area is being irrigated in the states likePunjab, on the other hand, 92.3% of area receives irrigation. Thus, while thereis large scope of increasing irrigation facilities in states like Rajasthan,Maharashtra, Madhya Pradesh and Karnataka, at the same time in states likePunjab, the problems of water logging and salinity are increasing. In Ferozpur

99
district alone, more than one lakh hectares of land has been affected by waterlogging.
A new problem that has arisen in regard to agricultural productivity isthat after the green revolution the agricultural productivity has rapidly increasedin areas of green revolution like Punjab, Haryana and Uttaranchal, while it hasrecorded a decline in case of eastern rice producing states like Bengal, Orissa,Bihar, Jharkhand and Assam. As a result, regional imbalances in agriculturaldevelopment have increased. The government has started taking steps in thisdirection since from the 7th Five Year Plan (1985-90). Another fact is that duringthe past few years, agricultural production in areas of green revolution hasstarted showing signs of stagnation. The production could not increase at therate at which it started increasing in the beginning of the 1970’s and 1980’s forthis there is a strong need of another technical breakthrough in the agriculturalsector.
After green revolution, the farmers adopted those crop rotations, whichbecame more remunerative. Specialization in agriculture is being emphasized.Perhaps this is because the farmers of green revolution regions like Punjab andHaryana have adopted the crop rotation of wheat-rice and the farmers ofwestern Utter Pradesh have adopted the wheat-sugarcane rotation. This hasdamaged the diversity in cropping pattern and has led to considerable reductionin the production of pulses and oilseeds. The daily per capita consumption offood grains in the country has although increased from 334.2 gm in 1951 to468.5 gm in 1995 but during the same time period, the consumption of pulseshas decreased from 60.7 gm to 38.1 gm per capita per day.
Still another problem of agriculture in India is the decline in investmentin this sector. This investment has declined both in the private and the publicsector. Neither the farmers are making any new investments in the agriculturefor the past few years nor the government is paying any serious attentiontowards increasing the infrastructural facilities in this sector. Total public sectorinvestment in the agricultural sector has decreased from Rs. 1769 crore in 1980-81 to Rs. 1002 crore in 1991-92. This is a matter of great concern. Governmenthas however, taken some important steps to increase the investment in thepublic sector under 8th five year plan (1992-97).
Besides this, under the various Five Year Plans, the government hastaken initiatives to convert Indian agriculture from subsistence agriculture to aself-reliant and progressive industry. The zamindari system has been abolishedby executing various laws. With this, the intermediaries, between thegovernment and the landowners, have been removed. In many areas,fragmented holdings have been consolidated into larger landholdings byimplementing land consolidation laws so that the farmers are able to take propercare of their farms alongwith the establishment of facilities for irrigation. Thecooperative movement is being encouraged in order to enable the farmers to

100
solve their problems of credit and sale of agricultural produce. Lead Bankshave been opened at the district level to promote agricultural development.Cooperative Banks, Land Development Banks and Nationalized Banks are alsoproviding credit to the farmers on easy terms. Besides these, National Bank ofAgriculture and Rural Development (NABARD) has been established to takecare of the agricultural credit and to encourage rural and agriculturaldevelopment. The institutions like Food Corporation of India, Indian Councilof Agriculture Research (ICAR), Agricultural Universities on Demonstration offarms, Dairy Development Board etc. have been established. Agricultural Costsand Price Commission fixes the prices of various commodities by taking intoaccount the cost of production so that the farmers do not have to sell theirproduce at low prices. Irrigation has also experienced significant development.The State governments provide chemical fertilizers and electricity to the farmersat subsidized rates. Punjab government has been providing free water andelectricity to the farmers. In south India, Tamilnadu government is also followinga similar strategy.
Inspite of all this, due to some specific reasons, some farmers unionsthink that the government is not giving full attention and support to theagricultural sector. They object to the large differences found in the prices ofproduced in rural and urban sector. The security, which is provided to theagricultural society, is not at par with that which provided to the people workingin the industrial and service sectors. Not only that, the prices of agriculturalcommodities keep on changing. Two-third of the work force of India contributesless than one-third to the national income. This fact needs a serious thinking.India is still an agrarian nation and society too is an agricultural society. Thisalways involves a feeling of collective welfare. No solution can be expensivefor the improvement of this kind of agriculture and agricultural society.
CROP SEASONS
In India, there are three major agricultural seasons of crops. These arethe Rabi (winter), Kharif (summer), and the Zaid (intervening). The main reasonof three seasons of crops in a year is the availability of tropical climate whichfacilitates the cultivation of crops throughout the year in most parts of thecountry. Agricultural activities commence with the onset of monsoon showersin the country. The farmers start ploughing the fields and after sowing theseed beds of paddy, they start waiting for rains. With the onset of rains inJune and July, they sow their Kharif crops. In irrigated regions like Punjaband Haryana where the monsoons commence in July, the farmers plant paddywith the help of irrigation without waiting for rain. It ripens by the time themonsoon starts retreating. Rice, Jowar, Bajra, Maize, Groundnut, Jute andCotton are the major Kharif crops. Pulses are also grown in this season. Somepulses like Arhar takes long time to ripen.

101
6.3

102
After this, the Rabi season starts. The Rabi crops depend on the moistureavailable in the soils. The crops of this season are sown in November and areharvested in April –May. But in the irrigated regions of commercial agriculture,like Punjab, Haryana, and western Uttar Pradesh, irrigation is used to maintainthe soil moisture. The Indian agricultural scientists have also invented somevarieties of wheat which mature within 100 days. Therefore, the wheat cropsown in December and first half of January get ready for harvesting by themiddle of May. In addition to wheat, other major Rabi crops include Barley,Bengal gram, Mustard, Toria etc.
Besides these two major crop seasons, during the rainy season thefarmers also grow vegetables, musk melon, water melon, bitter gourd, cucumberetc. in the khadar regions of the rivers. These are called ‘zaid’ crops. Nowadaysa short cropping season is also seen in the irrigated areas, during which thefast growing crops such as Moong and Mash are grown. Such pulses are majorsources of protein in our food.
India is such a vast country in terms of size that wide variations arefound in weather from one part of the country to another. Due to this diversity,almost all the cereals, pulses, fruits, vegetables, fibrous crops, etc. grown in theworld can be cultivated here. In the following pages we will describe somemajor food crops, oilseeds, beverages, and fiber crops.
FOOD CROPSPaddy (Rice):
This is the most important food crop of the country. India ranks secondin the world in the production of paddy, after China. In 1997 –98, the foodcrops occupied a total area of 12.27 crore hectares out of which, 4.34 crorehectares or 34.7% of the total crop land was under rice. It is the staple food inmost states of the country. In all those areas where rainfall is above 100cm riceis the staple food. In this way, 100 cm of isohyte makes the limit of the riceregion of the country. This region includes the east and west coastal plains;deltaic regions; lower hills and plains of northeastern India; Himalayan foothillsof west Bengal, Bihar, Eastern Uttar Pradesh; eastern Madhya Pradesh;Chhattisgarh; northern Andhra Pradesh and Orissa.
In fact, paddy is a tropical monsoon plant. Therefore, it thrives well inthe hot and humid climate. Thus, it is especially produced in Kharif(summer)season. Rice needs more than 250 C of temperature and more than100 cm of rainfall. With the help of irrigation facilities, paddy (rice) is alsocultivated in low rainfall areas such as Uttaranchal, western Uttar Pradesh,Haryana, Punjab and some districts of Rajasthan adjoining Punjab –Haryana.
The areas under paddy has been continuously increasing in the country.In 1950 –51, paddy was sown on only 8 crore hectares of land and has increasedto cover 4.34 crore hectares in 1997 –98. This means that area, under paddy
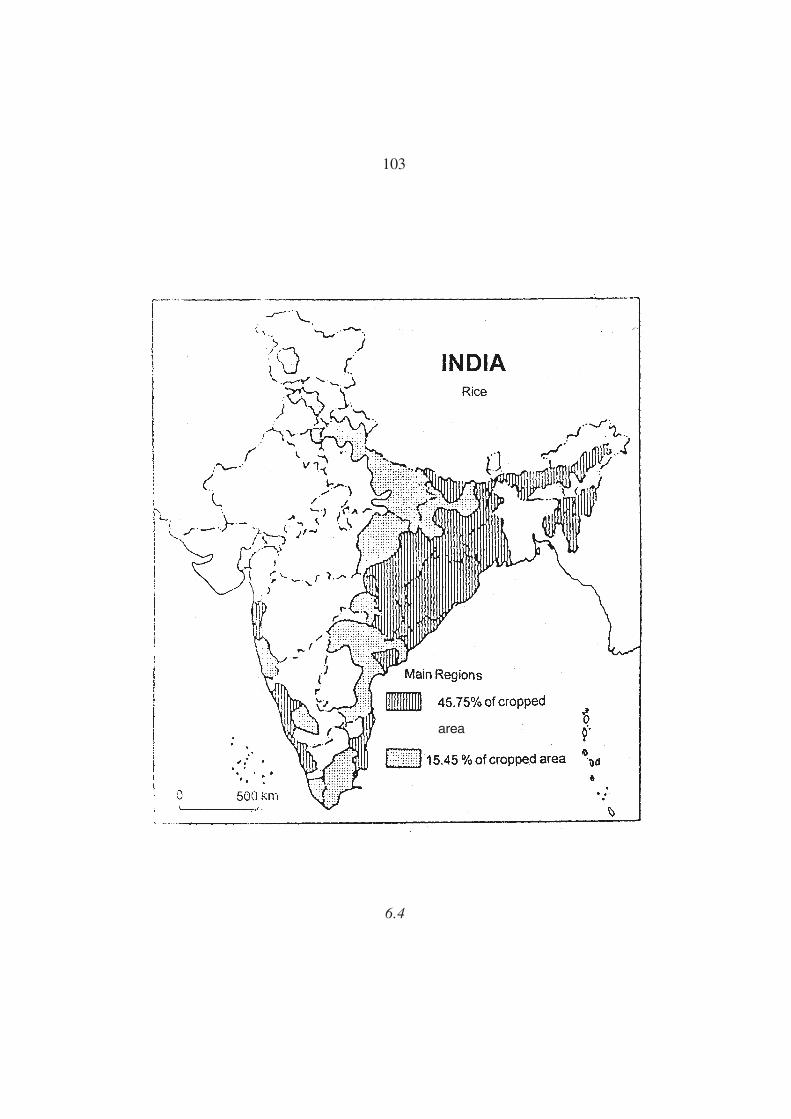
103
6.4
area

104
has increased to about 42% during the last 47 years. In other words, rice areahas grown at the rate of 1% per annum. Similarly, the production of paddy hasalso increased tremendously. During the same period, the production increasedfrom only 2.5 crore tons to 8.2 crore tons. The large increase has mainly beendue to the increase in the yield per hectare of paddy. The yield has increasedfrom 6.7 quintals per hectare in 1950 –51 to 18.9 quintals per hectare in 1997-98.In this way, the yield has increased about three times.
West Bengal is the largest producer of Paddy in India. The state produced1.21 crore tons of paddy in 1997 –98. The per hectare yield of paddy is 1998kg. West Bengal is followed by Uttar Pradesh, Andhra Pradesh, Tamilnadu,Bihar, Punjab and Orissa and each of these states produces more than 60 lakhtons of rice. In eastern Uttar Pradesh, the yield of paddy was 1867 kg. However,Punjab ranks first in terms of paddy yield which is 3132 kg per hectare. Besidesthese areas, large amount of paddy is produced in Madhya Pradesh, Assam,Karnataka, Maharashtra and Haryana. The production is also very high in thedeltas of Krishna, Cauvery, Godavari and Mahanadi rivers, due to good rainfalland irrigation facilities. In these areas two to three crops of paddy are takenin a year because of high temperatures and high rainfall conditions for mostpart of the year. In West Bengal, three crops of rice are grown and these areknown as Aman, Boro and Aus.
In Punjab and Haryana, the climate is dry but rice is cultivatedcommercially in these regions by using available irrigation facilities. In thesestates, rice is not the staple food of the people but good quality of ‘Basmati’rice is produced, which is even, exported to foreign countries, besides otherparts of the country. On the other hand, in states like West Bengal, UttarPradesh, Andhra Pradesh and Orissa, rice has to be imported from Punjab andHaryana inspite of large production but huge domestic consumption.Government agencies like Food Corporation of India buys most of the ricefrom states like Punjab and Haryana for the Public Distribution System. Forexample, 54.9 lakh tons of rice was bought for central pool from Punjab in1993–94 which was nearly 72% of the total rice produced in Punjab during thatyear and it was 40.2% of the central pool. In this way, Punjab contributes 4quintals in every 10 quintals of rice to the central pool. In Punjab, the yield perhectare of rice is very high. For example, in West Bengal which is the largestproducer of rice, the yield per hectare was 1998 kg in 1997 –98 while this was3132 kg in Punjab.
Rice is also cultivated in the northern hilly regions, from Kashmir toAssam, by making terraced fields. The production of rice in the country haslargely increased with the use of high yielding varieties, fertilizers and bettertechnology. The agricultural exports have increased with the implementationof new economic policy of the Indian government favouring increase in exportsof agricultural products. Indian paddy is rapidly becoming famous in the worldmarket. This is considered as a great opportunity for earning foreign currency.

105
By encouraging exports, new opportunities can arise in increasing the productionin the agricultural sector and employment sector.
Wheat
Wheat is the second major food crop of the country. India ranks 5th inthe production of wheat in the world. It produces 9% of the total productionof wheat in the world. In 1997 –98, the production of wheat in the countrywas 5.59 crore tons which was 74% of the total rice produced during that year.However, the difference in the area under these two crops is very large. Thearea of wheat was 2.67 crore hectares, and that of paddy was 4.34 crore hectares.This wheat area formed 59% of the total paddy area. That means, wheat wascultivated on 59% of the total area under paddy but from this area the wheatproduced constituted 74% of the total production of paddy. This clearly revealsthat the per hectare yield of wheat is very much higher than the yield of paddy.The per hectare yield of wheat was 24.70 quintals in 1997 –98 as compared toonly 18.93 quintals for paddy. In this way, the yield of paddy was 21% lessthan the yield of wheat.
Phenomenal change has taken place in wheat production during thepost-Green Revolution years. The green revolution in India was implementedin the year 1966 –67. In 1960-61, the production of wheat was 1.10 crore tonswhich increased to 2.38 crore tons in 1970 –71 and further increased to 6.94crore tons in 1996 –97. No other crop has recorded such a high increase inproduction after the green revolution. While wheat has experienced about fivetimes increase during 1960 –61 to 1996 –97, rice on the other hand could increaseby less than two and a half times in terms of total production. Perhaps it isbecause of the tremendous increase in the production of wheat that many peopleoften regard the ‘green revolution’ as the ‘wheat revolution’.
The wheat and rice producing areas are quite different. Whereas onone hand, the major production regions of paddy are, coastal plains of easternand western India, the major wheat growing region on the other hand arenorth and northwestern India. Here wheat is mainly grown in Punjab, Haryana,western Uttar Pradesh, districts of Rajasthan adjoining Punjab and Haryanaand Madhya Pradesh. Besides these, wheat is also produced in Bihar, Gujaratand Maharashtra.
Uttar Pradesh is the largest wheat producing state in the country. Itproduced more than 2.22 crore tons of wheat in 1996 –97. It is followed byPunjab and Haryana in the second and third place respectively. After thesecome the states of Madhya Pradesh, Rajasthan and Bihar. These six statestogether produce 94% of the total wheat of the country. The production ofUttar Pradesh, Punjab and Haryana is nearly 70%. In this way, wheat is highlyconcentrated in these three states of the country as compared to paddy whichis more wide spread.
However, in terms of production, Punjab is although ranked second in

106
the country but it occupies first place in yield per hectare of wheat andcontribution to the central pool. The yield per hectare of wheat in Punjab is38.77 quintals whereas the national average is 24.7 quintals. The cultivation ofwheat in Punjab is done on a large scale. Farmers here grow wheat as acommercial crop. In 1996 –97, Punjab contributed 64.9 lakh tons of wheat tothe central pool which is more than half (50.6%) of the total wheat procured inthe country. Therefore, more than half of the wheat sent to the central pool forPublic Distribution System is contributed by the Punjab farmers. This is a veryimportant contribution of the farmers of Punjab to the national service.
At the time of sowing, wheat requires cold and moist climate and atthe time of ripening, warm and dry climate is needed. Between 50 to 75 cm ofrainfall is favourable for this crop. Therefore, Rabi season is best for the wheatcrop.
Rain showers during winter season and availability of adequate irrigationfacilities are highly beneficial for growing wheat. Sometimes winter cyclonescoming from the Mediterranean sea bring very good rainfall in northwesternIndia. This rainfall proves very useful for the wheat crop. But sometimes,large damage also occurs due to hailstorm and heavy fog or ground frost. Thefarmers of Punjab, Haryana and Uttaranchal, western Uttar Pradesh haveassured irrigation through tubewells. As a result, good crop of wheat isgenerally obtained. In a way, farmers of these parts, have to a large extentremoved the large variations caused by Indian monsoons by acquiring highyields of wheat with the help of irrigation. However, the same is not true forthe paddy regions. Most of the paddy crop in the country, even today dependson the monsoons.
Millets
Jowar, Bajra, Goara, Maize, etc. are the millets which are sown in theKharif season. Jowar and Bajra are mainly produced in the arid parts. Bajra ismostly sown in the rain shadow regions of Maharashtra, Madhya Pradesh,Karnataka and Gujarat and in those dry regions of Rajasthan which receivelow rainfall. Besides these, it is also grown in Jhansi, Jaloun, Hamirpur andBanda districts of southwestern Uttar Pradesh. Jowar is mainly grown inKarnataka, Andhra Pradesh, Maharashtra and Madhya Pradesh.
In Punjab, millets like Jowar, Bajra and Goara were grown earlier. Butwith the development of irrigation facilities, farmers of Punjab have adoptedthe highly productive crops like wheat and rice in place of low productivecrops like millets. Therefore, a sharp decline is noticed in the cropped areaunder crops like Bajra, in last few decades. In 1960 –61, the cropped areaunder Bajra in Punjab was 1.23 lakh hectares which declined to only 9000hectares in 1994 –95. In this way, about 1400% decline has been recorded inthe area under Bajra. Similarly, the area under Jowar has also decreased from6000 hectares to 500 hectares during this period. The area under Bajra andJowar has also declined in the whole country. Jowar occupied 1.84 crore hectares

107
in 1960 –61 which declined to 1.15 crore hectares in 1994 –95. Area under Bajrahas also decreased from 1.15 crore hectares to 94 lakh hectares during thisperiod. The yield per hectare of Bajra and Jowar respectively was 700 and 779kg in 1994 –95.
Maize which is actually an American crop, was sown on an area of 61lakh hectares in 1994 –95. However, its area was only 44 lakh hectares in1960-61 Although area under maize has slightly increased during the last 34years, but its cultivation is limited to only few areas. For example in aprogressive state like Punjab, a large decline has been noted in maize area.Here in 1960-61, Maize was sown on 3.27 lakh hectares of land and declinedto 1.73 lakh hectares in 1994 –95. Due to decline in area under maize, in Punjab,the production has declined. However, the decline in production has been veryslow. This is due to the increase in the yield per hectare. The yield per hectareof maize in Punjab was 11.3 quintals in 1960 –61 which increased to 18.6 quintalsper hectare in 1994 –95. Similarly, the per hectare yield of maize increased inthe country as a whole to 15.7 quintals during the same period. Although theyield per hectare of maize has increased considerably but this increase hasbeen very low as compared to rice and wheat. Secondly, the yield per hectareof maize has increased in most other parts of the country except Punjab. Butthe situation gets totally reversed in case of yield of wheat and rice. The yieldper hectare of these two crops is very high in Punjab as compared to otherparts of the country.
Pulses
India is the largest producer and consumer of pulses. Pulses are themajor source of protein for a majority of people. Most of the people are poorand are vegetarians. Pulses are cheap as compared to meat and are majorsource of protein for the vegetarian people. Gram, Arhar, Moong, Mash, Massarand peas are considered as the major pulses. Except the heavy rainfall areas,pulses are grown in all parts of the country. Moong, Mash and Massar areproduced in the Kharif as well as in Rabi seasons. All pulses help in increasing thefertility of soil. Generally, pulses are mixed with other crops. The farmers ofwestern Uttar Pradesh grow early maturing varieties of Moong, Mash and Massar,mixed with sugarcane.
The area under pulses has decreased in the country. The main reason isthe area under pulses is being shifted to the more profitable crops like rice andwheat after the green revolution. The pulses were sown on 2.60 crore hectares ofarea in 1960 –61 which decreased to 2.30 crore hectares in 1994 –95. In this way,the area under pulses has recorded a decline of 30 lakh hectares in the last 34years. The production of pulses has increased slightly. During the same period,the yield per hectare of pulses has increased from 5.39 quintals to 6.10 quintals.However, the major cause of concern is that the per head consumption of pulseshas declined to about half. In the year 1955, the per capita consumption ofpulses was 71.1 gms which has decreased to 37.2 gm in 1994.

108
The situation in Punjab is still more serious. Here, the rotation of wheatand rice has eliminated nearly all other crops. In 1960 –61, pulses were cultivatedon 9.3 lakh hectares of land in Punjab. This declined to only 95000 hectares in1997 –98.With this, the per capita consumption of pulses has also recorded agreat decline, from 175 gm per day in 1960–61 to only 10 gm per day in1997–98. Such a sharp decline in the consumption of pulses is a serious matternot only in Punjab but in other parts of the country also. This has happenedbecause of the fact that the green revolution has brought a revolutionary increasein the production of rice and wheat. The pulses have not been able to help inincreasing the production of crops. In the post - green revolution years, a largepart of area under pulses has been diverted towards more productive cropslike wheat and rice. This has especially happened on a large scale in the stateslike Punjab where commercial agriculture is predominant.
Our government however, has certainly paid some attention in the pastfew years to increase production of pulses. But stringent measures are neededfor developing new, high yielding varieties of seeds of pulses. In the past fewyears, there has been some increase in the early maturing rabi crops of Moong,Mash and Moth. In the total production of pulses, the share of rabi pulses wasdouble as compared to the kharif crops in 1994 –95. At this time, the productionof rabi pulses was 94 lakh tons whereas it was 47 lakh tons in case of kharifpulses.
In the following table, the data regarding the production of food cropshave been given. Analyse these figures in your class. In which period theincrease in the production of food grains was the maximum? When was theincrease in production of wheat was maximum during this period? What doesthe comparative analysis of increase in the production of rice and wheat indicate?In which period the pulses recorded maximum increase? Try to find answersto these questions.
Table 6.4: Average Annual Increase in the India’s FoodgrainProduction (percentage)
Time Period Rice Wheat Pulses TotalFoodgrains
Average combinedgrowth rate
1967 –68 to 1995 –96 2.90 4.72 0.93 2.67
1980 –81 to 1995 –96 3.35 3.62 1.21 2.86
1990 –91 to 1996 –97 1.52 3.62 1.07 1.70
Note: To measure the growth rate the triennium ending 1981-82 has been taken as the base.

109
6.5

110
FOOD BUDGET OF INDIA
The food needs of any country are determined by the size of populationand its standard of living. If the population is growing rapidly, then largeramount of food is required. But with the rise in standard of living, the foodhabits of human beings also experience a change. With this, the use of foodgrainsstarts decreasing and that of eggs, milk, meat and fruits starts increasing. Also,the amount of cereals in food of villagers is more than the urban people.Therefore, if the proportion of urban population is higher then the consumptionof foodgrains will be less as compared to the consumption of other products.
As per 2001 census, the total population of India is 102.7 crores. Thispopulation is three times the total population of the country at the time ofindependence. The doubling period of the population in the country is 35 years.The growth rate has however experienced a slight decline during the last decade.Even then the population is expected to reach 150 crore by the middle of 21st
century. At the end of 21st century, the population of India will be between160 to 170 crores.
For such a large population, we require about 40 crore tons of foodgrains.Currently, the production is 9 crore tons. In this way, we need to increase theproduction by a large amount. At the same time, there is very little scope ofincrease in the net sown area, since the use of land for non –agricultural purposesis increasing. Therefore, we can increase production by increasing multiplecropping and by using more and more of modern technology. Between1990–91 to 1996-97, the production of foodgrains increased at the rate of 1.7per cent per annum while the population increased by 1.9%. This is a matter ofgreat concern. If the production of foodgrains declines slightly even between3 – 4%, we will have to import large amount of foodgrains. The second importantthing is that our requirement of foodgrains is demand based rather than needbased. In other words, a section of population of the country is such thatneeds foodgrains, but due to the lack of purchasing power, is not able to getthese. In this way, many people of the country do not get food to eat inspiteof availability of foodgrains. If we make an estimate of this hidden demandthen we would come to know that the country requires much more foodgrains.
There are some serious problems of agriculture of the country whichneed earnest attention. Among these, three are major problems. First, thedecreasing public-sector investment in agriculture and less utilization ofagricultural infrastructure in the present agriculture. The second problem isrelated to the production of new varieties of high yielding seeds. The progressin this sector is almost nil. For the past few years, research on developingnew seeds has been going on at snail’s pace. Development of such seeds forpulses, oil seeds, vegetables and fruits is very strongly needed. Third importantproblem is related with the very low growth rate in the agricultural sector andthe diversification of cropping pattern. We have to increase the reforms in the

111
agricultural sector similar to the industrial sector because reforms in these twosectors cannot be separated. All these things have to be kept in mind to fulfillthe increasing demand of foodgrains and for increasing the pace of developmentof agriculture.
COMMERCIAL CROPS
These are also called cash crops. These include mainly sugarcane,oilseeds, cotton, jute, rubber, wool and tobacco. Among these, jute, cottonand wool are also called the fibre crops. In the following pages, a detaileddescription of sugarcane, oilseeds and cotton is given.
Sugarcane
Sugar makes a chief component of our daily diet. In villages, peopleare very fond of eating rawsugar (Gur) and jaggery. Naturally, sugarcane isindigenous to India and in terms of production, India occupies fifth place inthe world. Although, sugarcane is grown in many parts of the country, themajor sugarcane producing states are Uttar Pradesh, Maharashtra, Punjab,Andhra Pradesh, Tamilnadu, Karnataka, Gujarat, Haryana and Bihar. Amongthese, Bihar produced the lowest 44 lakh tons while Uttar Pradesh was thelargest producer with 10.5 crore tons of sugarcane in 1993 –94. During thisperiod, a total of 22.7 crore tons of sugarcane was produced in the country.
In 1960 –61, sugarcane covered 24 lakh hectares of area in the country.This area increased to 40 lakh hectares in 1997 –98. During this period, theproduction also increased from 11 crore tons to 27.63 crore tons. Similarly, theyield per hectare also increased from 46 quintals to 70 quintals. Fast changeskeep on taking place in the sown area, production and yield per hectare ofsugarcane. This happens due to the fluctuations in the market price of sugar,damage to sugarcane crop because of diseases and effect of bad weather onyield per hectare.
In Punjab, the area under sugarcane was 1.50 lakh hectares (estimated)in 1995 –96. In the previous year 1994-95 this area was only 80 thousandhectares. The area under sugarcane has experienced considerable changes inthe state during the past 35 years. The crop occupied 1.33 lakh hectares of areain 1960 –61. It declined to only 71 thousand hectares in 1980 –81. After thisalso its area has been experiencing many changes. Similar changes have alsooccurred in the yield per hectare. The production of sugarcane was about 9.2lakh tons in 1995 –96 whereas this production previously was only 4.95 lakhtons in 1994 –95. In 1960 –61, total production was 4.86 lakh tons. Sugarcanehas suffered greatly both in terms of production and area due to the rapidchanges that have taken place in the crop pattern. In 1970s and 1980s, thefarmers adopted the wheat –rice crop rotation in place of other crops. ThePunjab government is now trying to break this crop rotation. It is encouragingthe farmers to grow sugarcane. The farmers are offered higher per quintalprice of sugarcane than in many northern states, so that they get attracted

112
towards its cultivation. The rapid increase in the area under its cultivation in1995 –96 as compared to the previous year is the result of these efforts. Thegovernment is also trying to find other solutions to expand the cultivation ofsugarcane in the state.
Sugarcane requires well-drained fertile soil. It also needs large amountof chemical fertilizers and organic manure. Hot and humid climate is favourablefor its higher yields. It grows well in areas with about 100 cm of rainfall.Infact, good crop of sugarcane is procured in the irrigated regions withadequate sunshine. As it is a tropical plant, the climate of the state of Tamilnaduis best suited for its cultivation. The yield per hectare of sugarcane in thisstate is 40 per cent higher than the national average.
Oilseeds
Edible oils are obtained from various oilseeds such as groundnut,mustard, toria, sunflower, cottonseed, coconut, etc. As you know, the edibleoils are essential part of our food. Almost all vegetables and other food productsare cooked in these edible oils. Groundnut is a major oil seed and is a kharifcrop which depends on the normal but timely rainfall. Sarson (mustard) andtoria are rabi oilseeds and are grown in both irrigated and unirrigated areas.Fluctuations in the yield per hectare, total production and the market priceshave a chief feature of these crops.
Mustard and toria are mainly grown in wheat growing regions of northand central India like Punjab, Haryana, Uttar Pradesh, Rajasthan and MadhyaPradesh. Groundnut is mainly cultivated in the western and southern Indiaespecially in Gujarat and Maharashtra.
The demand of edible oils is rapidly increasing in the country. Since itis not fulfilled through domestic production, therefore, large quantity of edibleoils is imported. The demand of edible oils is increasing by 5% per annum andthe growth rate of population is 2% per annum. Try to discuss the reasons ofthis difference in your class. Groundnut and mustard together constitute nearly60% of the total oil seed production of the country. Nowadays, the producingarea of soyabean and sunflower is increasing.
Different crops of oilseeds in the country occupied 2.63 crore hectaresof land in 1997 –98. Earlier, oilseeds were grown on total of 1.38 crore hectaresof land in 1960 –61. In 1980 –90 decade, the production area of oilseeds in thecountry has increased from 1.76 crore hectares to 41 lakh hectares. Anastounding increase in the production has been noticed during this decade (1980–90). The total production was 94 lakh tons in 1980 –81 which increased to 1.86crore tons in 1990 –91. Earlier in 1960 –61, the production was only 70 lakhtons which increased to 2.20 crore tons in 1997 –98.
In contrast to this, Punjab has experienced decline in the area underoilseeds. The area under oilseeds, which was the highest with 3.15 lakh hectaresin 1975 –76 reached the lowest mark with 1.4 lakh hectares in 1990 –91.
113
However, the area has increased marginally after that but on the whole thearea has remained almost static. In 1994 –95, total production area was 1.48lakh hectares. In 1995 –96, the area was 2.70 lakh hectares. Large changeshave occurred in the production also. The total oilseed production was 2.63lakh tons in 1975 –76. In 1990 –91, the production declined to the lowest levelwith 93 thousand tons. In the year 1994 –95, the production was 1.85 lakh tonswhile the production in 1995 –96 was 3.26 lakh tons.
Madhya Pradesh holds the top position in oil seed production in thecountry. In this state 45.77 lakh tons of oilseeds was produced in 1993-94.Maharashtra is ranked second with 23.46 lakh tons of oilseed production. Afterthis, comes Karnataka which produced 19.40 lakh tons followed by Gujaratwith 15.72 lakh tons. These four states together account for nearly half of thetotal oilseeds production in the country.
Cotton
Cotton plant is indigenous to India. Evidence exists of cotton beingcultivated even during the time of the Indus valley civilization. During thatperiod, people used to spin yarn and weave cloth and then it was exported tothe middle east Asian countries. In that period, this cotton was called as ‘Sindhu’by the Babylonians and ‘Sindo’ by the Greeks.
Cotton is mainly grown in the Deccan plateau black soil areas of thecountry. Gujarat and Maharashtra are the main cotton producing states. Besidesthese, other major states producing cotton are Andhra Pradesh, Punjab, Haryana,Rajasthan, Karnataka, Madhya Pradesh and Tamilnadu. All these states togethercontribute 99.5% to the total production of cotton in the country. Maharashtraproduces the highest, 26.25 lakh bales of cotton. Then comes, Gujarat in thesecond place producing 16.23 lakh and Punjab is ranked third producing 15.15lakh bales of cotton. Andhra Pradesh and Haryana are ranked fourth and fifthand produce13.40 lakh and 11.24 lakh bales of cotton respectively. All thesefigures are for the year 1993 –94, when these five states together producedabout 77% or more than three-fourths of the total cotton production of India.
In 1997 –98, cotton was cultivated on 89 lakh hectares of land. Duringthis year, 1.11 lakh bales of cotton were produced. Before this, in the year1985 –86, the area under cotton was 75 lakh hectares and the production was30 lakh bales. Previously in 1960 –61, the net sown area was 70 lakh hectaresand 56 lakh bales of cotton were produced. In 1960 –61, the yield per hectareof cotton had increased from 125 kg to 249 kg.
In Punjab, there has been a notable increase in both the area andproduction of cotton during the past few decades. Cotton covered 4.47 lakhhectares of area in 1960 –61 which increased to 7.2 lakh hectares in 1992 –93. In1993 –94 this area was 5.77 lakh hectares. Similar increase has also been noticedin the production. In 1960 –61 the production was only 7 lakh bales but in 1993–94 it became 15.16 lakh bales. It is clear from these figures that large changes

114
continue to take place in the production of cotton. Why is it so? Is it due tothe crop: diseases ? Or is it because of some natural reasons? Is it due to widefluctuations in market price of cotton or is there any other reason?
Potatoes
Potato was brought to India in the 16th century by the Portuguese. Todayit has become an important local vegetable. Uttar Pradesh, West Bengal, Biharand Punjab are its major producers. In 1993-94 it was cultivated on 10.80 lakhhectares of land and more than 1.80 crore tons of potatoes was produced. Outof this more than 85% or 1.52 crore tons was contributed by these four states.In our country, a very good quality of potato seed is produced in Lahaul andSpiti valley of Himachal Pradesh which is considered free of diseases.
The farmers of Punjab have also shown interest in the cultivation ofpotatoes. Since 1960 –61, the area under potatoes in Punjab has been increasingcontinuously. In 1960 –61 this area was only 9 thousand hectares whichincreased to 30 thousand hectares in 1994 –95. Similarly, the production hasalso increased from 1.29 lakh to 6.03 lakh tons. The farmers of Punjab are alsoproducing good quality and cheaper seed potatoes as compared to the farmersof Himachal. The demand for potatoes produced in Punjab has been increasingfor the last few years. Potatoes are mainly grown in Jalandhar, Hoshiarpur,Patiala and Ludhiana districts of Punjab.
ANIMAL HUSBANDRY
In India, the farms, farmer and his animals, combine together to makean agricultural system. Animals, are really the true friends of the farmers. Inthe last few years, animal husbandry has proved very beneficial for the smallfarmers and workers. Animals have become source of employment andsupplementary income for a large majority of the people of villages and smalltowns especially drought prone, hilly and other backward areas. According tothe National Sample Survey (NSS) of 1987 –88, the growth rate of employmentin the animal husbandry sector was 4.15% during 1972 and 1988 whereas thegrowth rate of employment in the agricultural sector as a whole was only 1.1%.
In the last few years, large increase in the number of milch cattle is anindicator of the development of dairy farming. Dairy farming has developedespecially in the Punjab, Haryana and Rajasthan. It is estimated that more thanone –fourth of the income from agricultural sector comes from the animalhusbandry sector. Besides providing milk and manure to the farmers, cowalso provides bullocks for the working in the fields. Because of this importantutility, cow is considered as a mother in India and is even worshipped by thepeople. In domestic animals about one –fourth or 24% are bullocks and three–fourth or 76% are cows.
In the country, Uttar Pradesh has the largest (611 crores) cattle wealth.Other states having large cattle wealth are West Bengal, Madhya Pradesh, Bihar,

115
Rajasthan, Maharashtra and Andhra Pradesh. These seven states togetheraccount for 68.3% or more than two–thirds of the cattle of the country. Punjaboccupying the 13th rank in the country, has a 96.7 lakh of cattle heads. Whilein terms of human population, it occupies the 14th place.
Large cattle wealth is found in India. The number of animals was about48 crores. It included about 20 crore cows and bullocks, about 8 crore buffaloes,nearly 5 crore sheep, 11 crore goats and remaining 4 core consisted of otheranimals. In this way, cows and bullocks constituted nearly 45% of the totalanimal wealth of the country.
Horticulture
India ranks second in the world in the production of fruits andvegetables. Brazil and China both are the largest producers of fruits andvegetables in the world. In our country, the production of fruits and vegetableshas reached about 3.9 crore tons and 6.5 crore tons respectively.
Our country has various types of agro-climatic conditions. Therefore,it is possible to grow a large variety of horticultural crops, which include fruits,vegetables, flowers, spices and orchard crops. Many types of horticulture cropsare grown in India. These range from tea and coffee in the high hilly parts tococonut in the coastal areas of India. Therefore, it is clear that there existimmense potentialities for growing different types of horticultural crops in thecountry.
India ranks first in the world in terms of production of banana, mango,coconut and cashewnut. Besides this, India is one of the ten largest producersof mosambi, apple, kinnow, pears, etc. It is also amongst the ten large producersof potato, tomato, onion and peas, while in the production of cauliflower, itagain occupies first place in the world. Horticultural products such as fruits,vegetables, flowers, cashewnuts, spices, etc. comprise nearly 25% of the totalagricultural exports.
The production of flowers has been encouraged in the country duringrecent years. This is mainly because of the growing demand of flowers inforeign countries. Flowers have a huge foreign demand. In 1994-95, Indiaexported flowers worth Rs.30 crores. To increase the export further, 200 export–oriented units have been recognised. In the eighth five year plan Rs. 250 croreswere allocated for the development of green houses, drip irrigation etc.
In apple production, Jammu & Kashmir and Himachal Pradesh top thelist. Maharashtra leads in production of oranges and bananas; Andhra Pradesh,Tamilnadu and Maharashtra lead in mango; whileTamilnadu, Karnataka andKerala are the major producers of cashewnut. In our own state, Punjab, theproduction of fruits has increased in recent years.
In the year 1995 –96, Punjab produced 7.6 lakh tons of fruits while in1985 –86, this production was only 4.3 lakh tons. Hoshiarpur, Ferozepur,
116
Amritsar and Faridkot are the chief fruits growing districts in Punjab. Fruitfarming is gaining importance. This can be seen from the fact that in 1981-82,fruits were cultivated on only 28.8 thousand hectares of land in the state. By1995 –96, this area reached 84.4 thousand hectares. Kinnow orchards occupythe maximum area i.e. 26.6 thousand hectares. Kinnow is followed by orangesand malta.
Forests
Forests play a very major role in maintaining the ecological balance. .Forests are an economic resource. These provide us timber and fuel wood.Theteak forests of the monsoon regions provide valuable timber for constructionpurposes. These deciduous forests extend from mountains of western ghats inthe south to the Himalayas in the north. Sal is the second most important anduseful tree found in these forests. The area of sal forests is comparativelymore than the area of teak forests. The malta (sweet orange) tree is however,found largely in eastern India.
In high rainfall regions of India Bamboo, Mahogany and Rosewoodtrees are found. These extend over the states of Kerala and Assam. In theSunderban region, Sundri trees of mangrove species are found and their woodis used for making boats and boxes.
Softwood obtained from coniferous forests of Himalayas is used formaking furniture, packing boxes and fixtures for buildings. Wood pulp is alsomade from soft wood which has a very high demand in the paper industry.
Besides timber, forests also provide lac, resins, gums, coal fuelwood,herbs, fodder and grasses. These days, social forestry is being promoted onplanned lines in the country. Its main objective is to bring barren lands underforests, to provide employment opportunities to the rural people and to solvethe problem of fuelwood in the villages.
Exercises
I. Answer the following questions objectively :
1. Name the crops which are sown in Kharif Season.
2. Which are the crops sown in Rabi Season.
3. What is difference between Green Manure and Fertilizer.
4. What is Agricultural Production?
5. What are milch cattle?
6. What is fallow land?
7. What is the percentage area of our country under forests?
8. How much area should be under the forests from the scientific point of view?
9. How much percentage area in Punjab is under forests?
10. What is the percentage of agricultural land in the world?
11. How much percent of land is under agriculture in India?
117
12. Which is the largest wheat producing state of our country?
13. Which state of our country contributes largest amount of wheat to central pool?
14. What is the net sown area of our country?
15. What are the causes of decreasing pasture lands?
16. How much more percentage area should be under forests?
17. What is agricultural density in India?
18. What is the average per capita culturable land?
19. Name the state that produces largest amount of Rice.
20. What is the rank of Punjab in terms of per hectare production of wheat?
21. What is the rank of India in terms of producing pulses in world?
22. After the green revolution, what type of change occurred in production of pulses inPunjab.
23. At the end of 21st century, how much foodgrain required for the Indian population.
24. Write down any three problems of nowadays of Indian agriculture.
25. What is the rank of India in world in production of sugarcane?
26. Name the crops of oil-seeds.
27. Name any two states those produce maximum amount of ground- nuts.
28. In which decade the area under oil seeds production has increased the most.
29. Which are the main cotton producing states of our country?
30. What is the per hectare production of cotton in our country?
31. Which are the main potato producing states of India?
32. Name the potato producing districts of Punjab.
33. What part of total income from Agriculture amounts to animal rearing?
34. What is the rank of Punjab in country in respect of cattle wealth?
35. Which part of the country amounts the highest cattle wealth?
36. What is the rank of India in world in respect of fruits and vegetables?
37. Name the apple producing states.
38. What is the importance of forestation?
II. Answer the following questions in short :
1. Why is agriculture known as basic main stay of economic system?
2. What are the main features of Green Revolution?
3. Which items are included in Agriculture side?
4. Explain the difference between Agricultural product and productivity.
5. What is the difference between Milch cattle and working load animals?
6. What is the difference between current Fallow Land and old Fallow Land?
7. What climatic conditions are required for the wheat cultivation?
8. Name the main paddy growing areas of our country.
9. Discuss the required condition for the production of Sugar Cane.
10. What are main uses of Forests?

118
11. Why a Indian agriculture is known as subsistence agriculture?
12. Why some people call green revolution as wheat revolution?
13. Explain the efforts made to the development of Animal wealth.
14. What are reasons that are responsible for the increase in land use under non-agricultural uses?
15. Write in brief about the importance of forests.
16. What effect incurred after independence on the requirement of foodgrains perhead?
17. What are the reasons of small land holdings in India, how these affect Indianagriculture?
18. Name the main paddy producing states.
19. What are the causes of high per acre yield of wheat in Punjab?
20. What are the causes of decrease in area under pulse cultivation?
21. Write down the benefits of Dairying Industry.
22. What expectation could we have in future keeping in view the present scenarioof Agriculture?
23. Why productions of pulses and oil seed is still low?
24. What are main problems of Indian Agriculture?
25. Explain the changes that have been occurred rapidly in the diversification of croprotation after Green Revolution.
26. Explain the effects that have been occurred in agriculture due to low public sectorinvestment in Indian Agriculture.
27. What are the indications that depict that Indian agriculture is advancing towardscommercial agriculture leaving behind the subsistence type of agriculture?
28. After comparing the land use pattern of Punjab with India, highlight the specialfeatures.
29. While describing the changes that have taken place in sugarcane producing areasduring the present time also investigate its causes.
30. What efforts have been made by Government of India for the development ofAgriculture?
31. Give an information regarding the problems arise due to regional imbalances inAgricultural production.
III. Answer the following questions subjectively :
1. Explain in detail the problems being faced by the Indian Agriculture.
2. Discuss in detail the Food Budget of India.
3. Write an explanatory essay on Green Revolution of India.
4. Explain in details about the cultivation of paddy in India.
5. Explain in detail about the cultivation of wheat in India.
6. Write about the cultivation of pulses in India.
7. While discussing the main problems that have been faced by cultivation of sugarcane, also discuss its present status.

119
8. Highlight the causes that lead the decrease in area under oil-seed after the GreenRevolution and what steps have been taken by the government to increase thecultivation of oil-seeds.
9. Write an comprehensive essay on the cotton production in our country,
10. Explain the main features of Horticulture in India.
IV. Show the following on the map of India.
1. Main wheat producing areas.
2. Main Jawar Bajara producing areas.
3. Main cotton producing areas.
4. Main Rice (paddy) producing areas.
5. Potato producing states.
6. Main oil seeds producing areas.
7. Sugar cane producing areas.
8. Main pulses producing states.
9. Maize producing areas.
10. Main Horticulture states.
*******
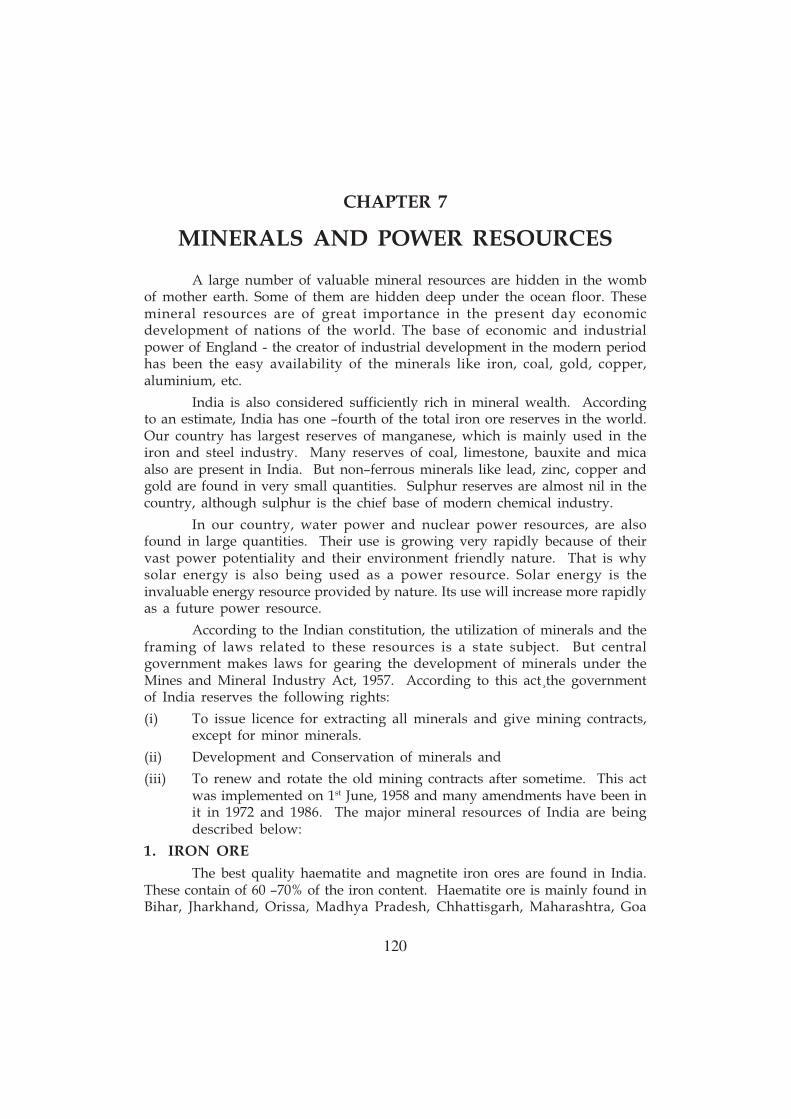
CHAPTER 7
MINERALS AND POWER RESOURCES
A large number of valuable mineral resources are hidden in the wombof mother earth. Some of them are hidden deep under the ocean floor. Thesemineral resources are of great importance in the present day economicdevelopment of nations of the world. The base of economic and industrialpower of England - the creator of industrial development in the modern periodhas been the easy availability of the minerals like iron, coal, gold, copper,aluminium, etc.
India is also considered sufficiently rich in mineral wealth. Accordingto an estimate, India has one –fourth of the total iron ore reserves in the world.Our country has largest reserves of manganese, which is mainly used in theiron and steel industry. Many reserves of coal, limestone, bauxite and micaalso are present in India. But non–ferrous minerals like lead, zinc, copper andgold are found in very small quantities. Sulphur reserves are almost nil in thecountry, although sulphur is the chief base of modern chemical industry.
In our country, water power and nuclear power resources, are alsofound in large quantities. Their use is growing very rapidly because of theirvast power potentiality and their environment friendly nature. That is whysolar energy is also being used as a power resource. Solar energy is theinvaluable energy resource provided by nature. Its use will increase more rapidlyas a future power resource.
According to the Indian constitution, the utilization of minerals and theframing of laws related to these resources is a state subject. But centralgovernment makes laws for gearing the development of minerals under theMines and Mineral Industry Act, 1957. According to this act¸the governmentof India reserves the following rights:
(i) To issue licence for extracting all minerals and give mining contracts,except for minor minerals.
(ii) Development and Conservation of minerals and
(iii) To renew and rotate the old mining contracts after sometime. This actwas implemented on 1st June, 1958 and many amendments have been init in 1972 and 1986. The major mineral resources of India are beingdescribed below:
1. IRON ORE
The best quality haematite and magnetite iron ores are found in India.These contain of 60 –70% of the iron content. Haematite ore is mainly found inBihar, Jharkhand, Orissa, Madhya Pradesh, Chhattisgarh, Maharashtra, Goa
120
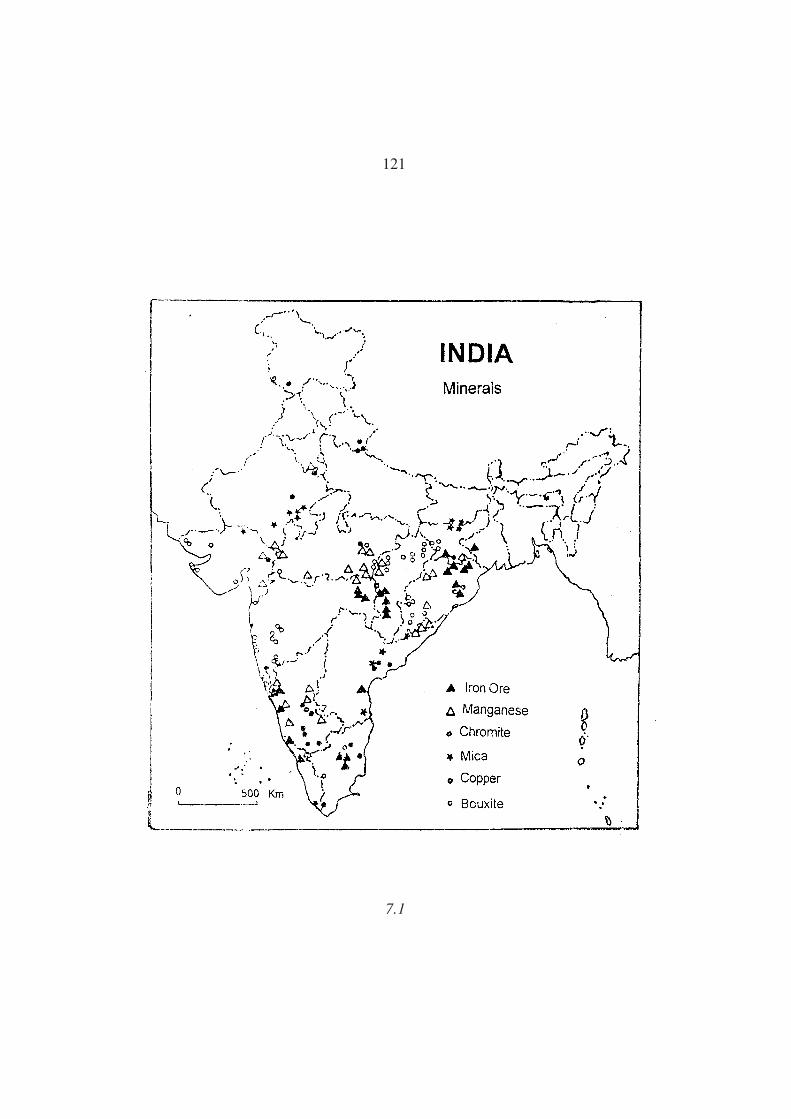
121
7.1

122
and Karnataka whereas magnetite ore is mainly found in Maharashtra andKarnataka along the western coast. Besides these, iron ore is also found inKerala, Tamilnadu and Andhra Pradesh.
According to an estimate, the total reserves of useful iron ore in thecountry are 12.74 billion tons. Of which haematite consists of 9.600 billion tonsand magnetite consists of 3.14 billion tons. More than 50% of iron ore in Indiais found in Bihar, Singhbhum district of Jharkhand and surrounding Keonjhar,Bonai and Mayurbhanj districts of Orissa. Besides these, iron ore is also foundin Hazaribagh, Palamau and Sahibganj districts of Orissa.
Iron ore is also present in Raipur, Durg, Rajnand Gaon, Bastar, Raigarh,Bilaspur districts of Chhattisgarh and Balaghat and Jabalpur districts of MadhyaPradesh. The iron ore found in the Bailadila region, is famous for highproduction and export. Bellary, Chitradurga and Chikmaglur districts ofKarnataka are also major centres of iron ore. Kudremukh mine of Karnataka isvery famous for export of iron ore.
The production of iron ore in the country is continuously increasing. In1951, the production was only 4 million tons which increased to 50 million tonsin 1987 and reached 71.5 million tons in 1997-98. As a result of the governmentpolicy of increasing the public and private sector investment in mining industry,the production of iron ore has recorded a rapid increase in the past few years.Japan is the major importer of the iron ore of our country. Besides this, Iranhad invested in the Kudremukh mines through which iron products were to beimported from India.
2. MANGANESE
It is used as a raw material in the manufacturing of steel. Its mixture isused for increasing the strength of steel. Our country has vast reserves ofmangenese. The total reserves are estimated to be around 176 million tons.Orissa state is the largest producer of this mineral. It is followed by MadhyaPradesh, Chhattisgarh, Maharashtra and Karnataka. States like AndhraPradesh, Goa, Gujarat and Bihar also produce manganese.
The main centres of mining of manganese are: Keonjhar, Kalahandi,Mayurbhanj (Orissa); Balaghat, Chindawara, Jabalpur, Jhabua (MadhyaPradesh); Nagpur, Bhandara and Ratnagiri (Maharashtra); Panchmahal (Gujarat);Chitradurga, Tumkur, Shimoga, Chikmaglur, Belgaum, North Kanara andDharwar (Karnataka). Besides these, some reserves are present in Singhbhum(Jharkhand); Vishakhapatnam, Nizamabad (Andhra Pradesh); Banaswara andUdaipur (Rajasthan).
India occupies fourth place in the world in the production of manganeseore, after Brazil, South Africa and former USSR. The total production of countrywas 1.8 million tons in 1996 –97. Before this, in 1991-92, total production was1.55 million tons.

123
3. MICA
India is the largest producer of mica in the world. India alone exports60% of the total world exports of mica. Among its main producing states areJharkhand, Bihar, Andhra Pradesh and Rajasthan. Half of total mica is foundin Bihar. Hazaribagh district in Jharkhand; Gaya and Monghyr (Bihar); Nellore(Andhra Pradesh); Ajmer, Tonk, Bhilwara and Jaipur (Rajasthan) are chiefdistricts that produce mica. In 1991-92, the country produced nearly 34000 tonsof mica. It is mostly used in the electrical industry. The country earns foreigncurrency worth about 28 crore rupees through its export.
4. BAUXITE (ALUMINIUM)
Bauxite is an ore of aluminium which is largely consumed by the electricityindustry. Aluminium being a lighter metal and good conductor of electricity, ismostly used in aircraft and electric goods. India occupies fifth position in theworld in the production of this ore. The total reserves of bauxite in India areestimated to be around 2.530 billion tons. The major states producing bauxiteore are Andhra Pradesh, Bihar, Jharkhand, Goa, Gujarat, Jammu & Kashmir,Karnataka, Kerala, Madhya Pradesh, Chhattisgarh, Maharashtra, Orissa,Tamilnadu and Uttar Pradesh.
Palamau (Jharkhand), Khera (Gujarat), Jabalpur (Madhya Pradesh) havemines of good quality bauxite. Besides these, good quality bauxite is also foundin Bilaspur and Bastar (Chhattisgarh), Balaghat (Madhya Pradesh), Salem(Tamilnadu), Chitradurga and Belgaum (Karnataka), Kolhapur (Maharashtra)and Jammu (Jammu & Kashmir).
In 1951, the total production of bauxite was 68 thousand tons whichincreased to 1.9 million tons in 1979 and 5.9 million tons in 1996 –97. Indiaexports bauxite to Japan and European countries.
5. COPPER
Copper is used for making utensils for domestic use. Being a goodconductor of electricity, it has proved very useful for the electrical industry.The main producing regions of Copper in India are: Singhbhum (Jharkhand),Balaghat (Madhya Pradesh), Jhunjhunu, Alwar (Rajasthan). Besides these,Copper is also extracted in small quantities from Khammam (Andhra Pradesh),Chitradurga, Hassan (Karnataka) and Sikkim. The total estimated productionof copper ore in India is 2.86 billion tons. From this about 2.85 million tons ofcopper metal is estimated to be obtained. In 1997 –98, 4.496 million tons ofcopper ore was produced in the country.
6. GOLD
This is very important and costly metal. It is used for the manufactureof jewellery, for keeping as reserves in banks and for meeting the deficit inbalance of payments in foreign trade whenever the need arises.

124
Our country has very small reserves of gold. Gold is mainly extractedfrom Kolar field mine (Kolar district) and Hutti mines (Raichur district) ofKarnataka. Besides this, gold is also extracted in small quantities from Ramgirigold region of Anantpur district in Andhra Pradesh. Kolar mines are one ofthe deepest mines in the world, because of which the extraction from thesemines is most costly in the world. Total gold ore reserves are estimated at 88lakh tons. The production of gold is decreasing in the country. In 1951, Indiaproduced 7000 kg of gold, which decreased sharply to 2636 kg in 1979 andfurther to 1931 kg in 1986. However, the production has slightly increased tobecome 2032 kg in 1991-92 and 2700 kg in 1996 –97.
7. LIMESTONE
Limestone is found in large quantities in our country. It is used incement industry and for white washing of the houses. Though it is producedin almost all states but major production regions fall over Madhya Pradesh,Chhattisgarh, Tamilnadu, Andhra Pradesh, Gujarat, Jharkhand, Orissa, Rajasthanand Karnataka. The total limestone reserves in India are estimated at 76.450million tons. In 1996 –97, 764 million tons of limestone was extracted.
From the distribution of above mentioned minerals it is very clearlynoted that the state of Punjab has no place in the production of any of theseminerals. This is because of the fact that most of the state is alluvial plain madeof soils brought and deposited by rivers, which is very fertile for agriculture.The mineral resources are mainly found in the regions with igneous andmetamorphic rocks.
SOURCES OF ENERGYNow we will briefly explain the distribution and usable reserves of
some major sources of energy. Coal, mineral oil and hydroelectric power arethe three major sources of energy. The fourth source of energy is nuclearpower.
1. COAL
It is the most important industrial fuel till present. Alongwith this, it isused as an important raw material in iron and steel and chemical industries.60% of the total carbonic demand in the country is fulfilled from coal andlignite.
Coal is the most extensive of all the mineral reserves. Our country isone of the three largest coal producing countries in the world. China and UnitedStates of America are the only countries that produce more coal than India.Almost all the coal reserves of the country are found in south Indian rocksbelonging to the Gondwana age. An examination of the distribution of coalreserves in India, reveals that, three –fourth of the total coal reserves are presentin Damodar valley region. The major coal areas here are Raniganj, Jharia, Giridih,Bokaro and Karanpura. All these areas fall in Bengal, Bihar and Jharkhand

125
7.2
126
states. Also, Singrauli, Umaria, Suhagpur, Solhat, Korba and Ramgarh districtsMadhya Pradesh; Deogarh and Talcher of Orissa; Chanda district of Maharashtraand; Singreni district of Andhra Pradesh are the major mining regions.
After independence, coal mining industry was nationalized. It was doneto avoid exploitation of mining workers, to manage mines in a planned mannerand to preserve environment in such regions. The main coal regions of thecountry now are: Raniganj, Jharia, eastern and western Bokaro region;Panchkanhan and Tawa valley; Singrauli; Chanda –Wardha region, Talcher andGodavari valley region etc.
The total coal reserves in the country are estimated to be 196 billion 20million (19602 crore) tons. Out of this, 16632 crore tons consists of non –cokingcoal and 2970 crore tons consists of coking coal. According to a news item, onJanuary1, 1997, the total coal reserves of India were 20465.3 crore tons. TheCoal India Limited (CIL) which is a government organization is responsible forthe management and administration of coal. This is the second largestorganization in the world which employs 6.64 lakh workers. Coal has provedvery useful in the generation of electricity and gas. Thermal plants of thecountry operated with the help of coal. This also helps in the decentralizationof industries and saves on transportation cost.
The production of coal has increased rapidly after independence. Theproduction has increased from 32.8 million tons in 1950 –51 to 113.9 milliontons in 1980 –81. In 1989 –90, it reached 200.01 million tons and it was 296million tons in 1997 –98. During this time, the consumption of coal has alsoincreased manifold. After 1991, the production has been increased by changingthe economic policy of the country and by encouraging foreign investment inmining industry.
Lignite, which is the poorest form of coal, is also called as brown coal.Its total reserves are comparatively less and are estimated to be around 27.5million tons. Its major part, about 90% is found in Tamilnadu in Neyvelli andits surrounding regions.The entire state has benefited from the large reservesof lignite as the state gets electricity from the thermal plants set up in Neyvelli.
Nearly 90% of coal produced in India is used in thermal power plants.Punjab has three thermal power units, two in Ropar and one in Bathinda town.With these, the problem of shortage of electricity has been solved to a largeextent. There is a great demand of coal in the iron and steel industry. One –fifth of the total production is used in this industry. Most of the remainingpart is used in brick kilns, rail engines and for providing energy to the cementand fertilizer industries.
2. MINERAL OIL AND NATURAL GAS
The consumption of mineral oil as a source of energy has increasedsignificantly in the world. Countries having its excessive reserves have entered

127
the category of rich countries through oil exports. These are mainly the MiddleEast countries like United Arab Emirates, Kuwait, Bahrain, Iran, Iraq, etc.
India has many areas with known reserves of mineral oil. But commercialproduction is carried out from a very little area. According to an estimate, oilreserves are spread over 10 lakh square km of area in the country which isequal to one –third of the total area of the country. These are found in theGanga and Brahmaputra plains; coastal belts; and continental shelves; Gujaratplains; Thar desert; and Andaman and Nicobar Islands.
At the time of independence, oil was extracted only in Assam state ofthe north eastern India from a very small field. It is the only field which isfunctioning for last 100 years. In the refineries located nearby at Digboi, oil isrefined before being exported by pipeline to other parts of the country.
Mineral oil and natural gas was discovered in the plains of Gujarat andcoastal regions after independence. Oil was being extracted from the reserveshere at Ankleshwar. After this, the discovery of extensive off-shore reserves,115 km away from the coast of Mumbai was a heartening incident for thecountry. This region is known as ‘Bombay High’. Here the ship ‘Sagar Samrat’specially manufactured in Japan was employed for discovering the oil. Thiswas a challenging task in which the country became ultimately successful. Inview of the huge demand for oil explorations are going on in the new areas.These are spread in the deep sea near the deltaic coasts of Godavari, Krishna,Cauvery and Mahanadi rivers. In Assam, new reserves have been struck.Recently, vast oil and natural gas reserves have been discovered by an Indianprivate company, Reliance industries, in the Krishna –Godavari basin.
In 1950-51, the production of crude oil in the country was about 3 lakhtons. It increased considerably to 68 lakh tons in 1970 –71 and 3.30 crore tonsin 1990 –91 and then reached 3.28 crore tons in 1996 –97. But in 1988 –89, thecrude oil production was 3.41 crore tons. During the same time, the consumptionof oil has also increased tremendously. Therefore, government is encouragingoil exploration in the country. In this direction, the government has approvedfive new oil development projects since 1990. These projects include thedevelopment of recently discovered oil fields of Neelam, Mukta and Panna inthe Bombay high basin and development of remaining reserves of L –II and L–III of Bombay High which is worth a total of rupees 8000 crore.
To increase the pace of oil exploration, government has invited bids foroil and natural gas exploration in 72 blocks of the country (39 off –shore and 33on –shore) from the foreign companies besides two present Indian companies,the Oil and Natural Gas commission (ONGC) and Oil India Limited (OIL).Only 24 bids were received from 31 companies. Of these, oil explorationcontracts have been given approval in 4 blocks. Simultaneously, the governmentis also willing to drill oil in the medium and small sized oil fields and tendersfor the same have been invited.
128
Huge amount of oil is imported from foreign countries to fulfill thedomestic demand. In 1990–91, the total production of crude oil and petroleumproducts was 2.94 crore tons for which country had to pay 107 billion rupees inthe form of foreign currency. The continuous growth of imports of petroproducts is a matter of great concern. In 1996–97 India had to import 5.41crore tons of petro products imported which has increased to double in lastfive years. Crude oil and petroleum products hold an important place in thedeficit of imports and exports.
There are 12 oil refineries in the country at present with a total refiningcapacity of 5.74 crore tons per annum at the end of 1999.
The increase can take place with the expansion of these refineries which mightenhance the capacity by 82 to 87 lakh tons. Besides these, 4 new refinerieswith a total capacity of 125 lakh tons have been approved. These are Cauverybasin (Tamilnadu), Numaligarh (Assam), Karnal (Haryana) and Mangalore(Karnataka). According to another decision of the government, 3 new oilrefineries will be established with a total refining capacity of 6 million tons.These will be set up in eastern, central and western India. At the same time,proposals for setting up of refineries in private sector will also be approved.
Natural gas plays very important role in our life. Its reserves are usuallyfound along with the oil fields. Therefore, where ever oil reserves are found,natural gas is also found at that place. However, natural gas may also occurseparately. Such separate regions have been found in Tripura and Rajasthan.Besides these, off-shore reserves of natural gas have been found in deep seaareas of Gujarat, Maharashtra, Tamilnadu, Andhra Pradesh and Orissa.
In 1980 –81, the total production of natural gas was 235.80 crore cubicmetres, which increased to 2231 crore cubic metres in 1995 –96. The productionof this gas is rapidly increasing. For example, during 1994–95 and 1995–96,15.1% growth rate was recorded in its production.
Natural gas is a clean and very good source of energy. It is used as araw material in petro–chemical industry. Establishment of powerhouses basedon natural gas takes less time as compared to other sources of energy. It alsohelps in increasing the agricultural production in the country. Nowadays, it isalso used in manufacture of fertilizers. Natural gas is easily transportable overlong distances, easily through pipelines from one place to another. At present,gas is being transported from regions of Mumbai and Gujarat to MadhyaPradesh, Rajasthan and Uttar Pradesh. The “Hajira–Bijaipur, Jagdishpur” gaspipeline which is 1730 km long runs from Hazira on the west coast throughBijaipur in Madhya Pradesh to Jagdishpur in Uttar Pradesh. Through this, gasis supplied to 6 fertilizers plants and 3 power plants. A government institutioncalled the ‘Gas Authority of India Ltd. (GAIL)’ was entrusted with this task in1984. This authority also plans and constructs pipelines for distribution of
129
natural gas. It has also taken up the responsibility of construction of manyother pipelines. These pipelines may be laid in the Tatipaka-Kakinada region(Andhra Pradesh) and in Maharashtra and areas around Delhi.
The gas used for cooking is called as the Liquefied Petroleum Gas (LPG).Its use is increasing for cooking purposes both in the villages and cities. This isa fast and clean fuel. Its demand as domestic fuel for other industries will helpin reducing the indiscriminating cutting of our forests. Since, there is a widegap between the demand for the cooking gas and its fulfillment through thedomestic sources, therefore, LPG has to be imported. In this area, alongwiththe Gas Authority of India Limited (GAIL), other organizations like Oil andNatural Gas Commission (ONGC), Indian Oil Corporation (IOC) and HindustanPetroleum Corporation (HP) are also working. Now, private investment isalso being welcomed in this sector. This policy is a diversion from the country’spolicy prior to 1991. Earlier this industry was fully under the governmentcontrol.
3. THERMAL AND NUCLEAR POWER:
Thermal power is generated by using coal, petroleum and natural gasin thermal power houses. These mineral resources which are used as a rawmaterial in the generation of thermal power are also called as the fossil fuels.They can not be used more than once or they are non–renewable resources.This is their major disadvantage or demerit. Large quantity of coal –ash is leftbehind near the thermal power houses after the use of coal which endangersthe surrounding environment. On the other hand, the use of coal and petroleumalso causes pollution in the atmosphere. Therefore, thermal power like thehydel power is free of pollution for the far off areas similar to the hydel power.
Electricity can also be generated from the atomic fuel or heavy waterbesides coal, petroleum and gas. You might be knowing well about the hydelpower. Electricity generated from water is called hydel power; from coal,petroleum and gas is called as thermal power and that produced from atomicfuel or heavy water is known as atomic power.
Electricity is widely used in our agriculture, industry, transportation,communication and domestic works. In a way today’s life seems impossiblewithout electricity.
In 1995–96, the total electricity generation from these three sources was351 billion. Nearly three–fourth (74.9%) of this was generated in the thermalpower houses. The remaining 23.5 per cent of the electricity was generated inhydel power houses and only 1.60 per cent by the atomic power. The share ofthermal power is increasing very fastly with the passage of time.
The installed capacity of electricity in the country was 8.18 thousandMW till 1994 –95. A further increase of 30858 MW units was to be achievedduring the 8th five –year plan (1992 –97) but increase of only 14799 MW of units

130
or 48% was attained in the first four years of the plan. Therefore, large gapsare found in the actual production and installed capacity in the country. Theelectricity is supplied to different parts of the country by the National GridSystem. Our Punjab is located in the northern region of this grid. The NationalThermal Power Corporation is responsible for the construction of thermal powerstations and generating electricity etc. in the country. In Punjab, thermal powerstations are located at Ropar and Bathinda. A new plant named SriHargobindpur Thermal Plant has been started on 29 December, 1997 at LehraMohabbat in Bathinda district. The production capacity of its first unit is 210MW. Its second unit is proposed to be opened on June of next year.
Besides these, there are many more hydel power projects out of whichBhakhra–Nangal project is the most important and has the largest capacity ofelectricity generation.
Immense progress has been made in the transmission and distributionof electricity in the country. In 1950, the length of the transmission lines was10,000 circuit km which increased to 2.18 lakh circuit km in March 1992. Inaddition, there are 400 KW high voltage transmission lines. Their length was26,000 circuit km in March 1992. Besides this, first 500 KW HVDC bipoleRihand–Dadri transmission line is also working with a length of 820 km. Aninter–regional link line is also working presently which links western andnorthern regions. The major objective of the introduction of National PowerGrid System is to encourage the centralized system in the electricity powersector and to transmit power from one system to another system so thatavailable resources of the country could be used optimally. Even today only60 –62% of the total installed capacity of the electricity power production centresof the country, is being utilized. Proper care and attention can only increasethe work efficiency.
In the five–year plans, more attention has been paid to the expansion ofelectric power in the rural areas. The schemes related to rural electrificationare executed both by the state governments and rural electrification boards.Till 1991–92 a total of 4.88 lakh villages have been electrified and 96 lakh electrictubewells have been installed in these villages. In this way, 84% of the villageshave been electrified. In Punjab, all villages have been electrified. The mainobjective under the rural electrification project is to give special attention toprovide electricity to the tribal regions and Harijan Mohallas in the villages.
ATOMIC POWER
Atomic power stations established in those regions where the othersources of energy are not available or sufficient are not fulfilling their need.India is considered a progressive country in the peaceful utilization of the atomicpower in the medical and agricultural areas.
Vast reserves of some atomic minerals are found in the country. Thereare mines of Uranium in some parts of Bihar and Rajasthan. Monazite sand

131
found in coastal areas of Kerala is a primary source of atomic energy fromwhich Thorium is extracted. Cherolite, Zirconium and Palesar are also atomicminerals. India has their vast reserves. Widespread reserves of graphite havealso been discovered in mountainous parts of eastern India.
The country has 4 centres of nuclear energy. These include Tarapur onthe Maharashtra –Gujarat border; Rawatbhata near Kota in Rajasthan;Kalapakkam in Tamilnadu, and Nowrang in the Bulandshahr district of westernUttar Pradesh. In the 1994–95, their total production was 5.6 billion KW whichwas a little less than 2% of the total electricity production of the country.Continuous exploration and development tasks are going on in the country sothat proper care of atomic power houses, their maintenance and manufactureof atomic fuel, could be accomplished in the country itself. Nuclear reactorsare needed for generating electricity from the atomic fuel. These are importedfrom foreign countries. Some countries which are very rich in nuclear powerdo not want that countries like India should use this power independently intheir country. Therefore, they are trying to bring Indian nuclear program underthe international inspection. Recently, they have again tried to get signed aninternational treaty from India. The Indian reaction to this suggestion is thatthis treaty is discriminatory and this will restrict the poor countries like Indiafrom using the atomic power for peaceful purposes. Due to such an internationalpolicy, the country is facing problems in the supply of related necessaryequipment. Therefore, the scientists of the country are investigating to findalternative methods. Recently, the Indian scientists achieved great success whenthey successfully repaired one of the units of Rawatbhata atomic reactor inRajasthan through indigenous techniques which was not operational for a longtime. This not only saved crores of rupees of foreign currency but also havebrought laurels to Indian nuclear program.
NON –CONVENTIONAL SOURCES OF ENERGY:
In these sources, the use of energy like solar energy, wind energy, tidalenergy, geo –thermal energy and energy derived from organic products, isvery old. To run the boats, the use of wind, flowing water and human powerdates back to the ancient times. Earlier, a large number of wind mills preparingflour. These wind mills were being used for were also used for irrigationpurposes.
In the present period, their importance is increasing day by day due totheir specific characteristics and some drawbacks of conventional sources. Oneof the main characteristics of these sources is that all these inexhaustibleresources are renewable or mostly are still unused. The biggest advantage ofthe non–conventional sources is that they are very cost effective. Besides this,they can be used in the coastal, hilly or desert like remoter and barren lands.On such lands, the laying of electricity lines and their management is verycostly. The utilization of such non–conventional sources of energy should be

132
encouraged in these kind of areas. It also strengthens the policy ofdecentralization.
The centralised system of electrification has some disadvantages also,besides having some advantages. It is very costly to construct large transmissionlines and big power distribution centres. Also many administrative problemscan also occur. Problems like lack of decentralization, and pollution etc. alsocome to the fore. Keeping all these things in view, stress is being laid ongreater use of non–conventional sources of energy. Government has given toppriority to increasing the use of non–conventional sources of energy. Besidesdecentralization, these have a special role to play in afforestation; conservationof environment, power saving; creation of employment opportunities;improvement in health and sanitation; social and women welfare; irrigationand production of organic fertilizers in agriculture, etc. In March 1981, thecentral government established a high powered authority board to locate moresources of energy. In 1982, the department of non–conventional sources ofenergy was set up by the centre in the form of power ministry. The stategovernments have also established separate agencies for the non–conventionalsources of energy. With the cooperation of general public, preference is beinggiven to works like provision of cooking gas at the local level, small irrigationprojects, drinking water and street lighting etc. These works are of greatimportance in the remote areas, hilly regions and for the poor people.
Wind mill energy is very helpful in providing irrigation facilities in therural areas. It is estimated that wind is used for producing 2000 MW ofelectricity. Gujarat, Tamilnadu, Maharashtra and Orissa are the most importantareas where windmill centres are working at many places and electricityproduced by these centres is added into the grid system.
Tidal energy is a cheap and inexhaustible source of energy. Runn ofKachchh and Cambay are the most suitable places for generating electricitythrough tidal energy because tidal water rise very fastly in these narrow inlets.
Geo –thermal energy has not yet been properly introduced in theelectricity generation of the country because it is available in very small amountin the country. Efforts are being made to produce electricity from hot watergeysers located in Manikaran in Himachal Pradesh.
Getting energy from trees is also being paid attention through plantingmore trees on barren and eroded regions. In these regions, fast growing treesare being planted so that they can be used as fuel wood. With this, solutioncan be found to problems of rural unemployment and fuelwood.
Electricity is also being generated from urban waste in the big cities.In our country most of the garbage is bio–degradable. In Delhi, a machine isalready functioning for generating electricity from urban waste. Such effortsare also being made in other cities. With this the problem of collecting anddumping of large heaps of city garbage is solved and also electricity is generatedfrom waste.
133
The ‘Power village scheme’ has been implemented by the governmentof India in remote rural areas having barren lands. This has been done withthe objective of fulfilling requirements of electricity in these remote villages.Under this scheme, ‘gobar gas plants’ have been established in the villages byusing organic matter, cow dung, human excreta etc. These have been establishedat individual, community and village levels. In the larger cities, biogas machinesare also being operated from the sewerage water. The Power Village Schemewas completed in 184 villages till March 1993. Besides this, this scheme was atdifferent stages of completion in other 222 villages. The survey related to thishas been completed in 1680 villages and it is going on in 344 villages.
A program for smokeless stoves is being planned at the national level.Its major objective is to save fuel and solve the problem of rural women forcollecting fuel wood. Maximum amount of energy is used in the kitchen, inwhich wood is used on a large scale. In the traditional domestic stoves, largequantity of wood is consumed and also lots of smoke is produced. The schemeof smokeless stoves was started in the country in December 1983. It is estimatedthat one smokeless stove can save about 700 kg of fuelwood in a year. The useof these stoves save 20 to 35% of fuelwood. Till March 1993, about 142 lakhdeveloped type of stoves had been installed in the country.
SOLAR ENERGY
Solar energy is an inexhaustible source of energy. It is omnipresentand also has large potentialities. Solar energy can be used very cheaply forwater-heaters, cooking, air-conditioning, refrigeration, removing water salinity,distillation etc. Till March 1993, an area of 2.80 lakh km2 had been establishedfor collecting solar energy in the country where it was used for the aboveworks. By the same time, 2.40 lakh solar cookers had been sold in the country.In a state like Rajasthan, where solar radiation is available for most of the yearwithout any climatic disturbance, the solar energy is going to will be helpful inproviding electricity to the widely scattered villages. It is a future source ofenergy because other sources of energy like coal and petroleum will be finishedin the near future.
Exercises
I. Write short note the following objectively :
1. Name the important minerals?
2. In which states is Haematite iron found in India?
3. What are the uses of Manganese?
4. How much manganese reserve is in India?
5. What is the position of India amongst the manganese ore producing countries ofthe world?
6. Name the position of India amongst the Mica producing countries in the world?
134
7. Name the states that produce more than half of the total production of Mica.
8. Name the industries in which Mica is used as raw material.
9. Which mineral is obtained from Bauxite ore?
10. What are the uses of Copper?
11. Name the place and state where maximum gold is produced.
12. In which industry is the lime stone used to the maximum?
13. What is the place of India in coal production in the world.
14. What is the percentage of coal reserves found in Damodar valley.
15. Which organisation controls the managements of coal production?
16. Name the four major atomic energy producing centres.
17. What is Wind Energy?
18. What do you understand by smokeless stove?
19. Which material is extracted from Bailadilamins?
20. Name the material extracted from kolar mines?
21. From which place in the country is lignite coal extracted?
22. What is the other name given to lignite?
23. For which work is the ship ‘Sagar Samrat’ used?
24. How many oil refineries are found in India?
25. Which energy in derived from Uranium?
II. Answer the following questions in short :
1. Describe the role of minerals in the national Economy.
2. Name the manganese producing states of India?
3. Name the major Bauxite producing centres.
4. Name the copper producing centres in India.
5. What are the causes of non availability of minerals in Punjab?
6. Name the coal producing centres in India.
7. Name the main coal producing centres in Orrisa.
8. What were the causes of nationalisation of coal production?
9. Name the non conventional sources of Energy?
10. Describe the importance of wind energy in India.
11. What is the role of Indian Govt. in mining industry?
12. From which districts in Madhya Pradesh is iron are extracted?
13. Name all the institutes associated with exploration, refinement and regionaldistribution of oil.
14. Why solar energy is said to be future energy reserve?
15. What is the importance of natural gas in manure industry?
16. What are the problems faced in the regional distribution of hydroelectric energy inIndia?

135
17. Describe in brief the importance of mineral reserves in India.
18. Describe about the main iron ore producing centres of India.
19. Describe the efforts made in the field of exploration and refinement of oil in Indiaafter independence.
20. Describe about development in the electrification process in villages afterindependence.
21. Write in detail about ‘Power village scheme’.
22. Write about a program for Smokless stoves is being planned at the national level.
23. Describe solar energy as an inexhausible source of energy. Which parts of thecountry can make maximum utilizations of solar energy?
24. Write a short note on the progress made in generation of hydro-electricity?
25. Describe about the peaceful utilization of atomic energy in India. Also Write aboutthe related international pressures due to this.
III. Answer the following questions subjectively :
1. Describe in detail the main problems which are being faced with the increase incoal production.
2. Describe in detail the process of mineral oil and gas production.
3. Describe about the progress made by India in development of atomic energy.
4. Write about the importance and development of non conventional sources of energy.
5. Describe the role and importance of energy in industrialization of India.
IV. Show/ Mark the following on the map of India.
1. Iron ore producing areas.
2. Manganese producing areas.
3. Coal producing areas.
4. Centres of atomic energy.
5. Iron producing areas of Damodar Valley.
6. Four major reserves of Bauxite.
7. Gold producing areas in Kolar.
8. Lignite coal producing areas.
9. Natural Gas producing areas.
10. Oil refineries
******
CHAPTER 8
MANUFACTURING INDUSTRY
Large scale production by using heavy machinery is known asmanufacturing industry or large-scale industry. Through this whole process ofindustrialisation, the form of goods is changed to enhance their value and use.The main elements of this process include the raw material, capital, machineryand labour. The industrial development of any country depends upon itseconomic progress.
In an agrarian country like India, it has become very essential toencourage the manufacturing industry for raising employment opportunities,increasing national income, earning foreign currency and for bringing fasteragricultural development. The development of agro –based industries isespecially useful for strengthening the economic system of the country. Besidesproviding more of employment opportunities, this leads to decentralization ofindustries and promotes cooperation between agriculture and industries. Whileindustries provide developed agricultural equipment, fertilizers, pesticides andinsecticides for increasing agricultural production, the agriculture providesvarious types of raw materials required for the industry and food products forindustrial labour. Therefore, agriculture and industry should not be seenseparate from each other rather they should be considered complementary toeach other.
At one time industrial self –sufficiency was the principle of the industrialpolicy of the government of India. But over time, there has been considerableshift in this thinking. Nowadays, the industrial policy is inclined towardsincreasing imports through which specialization, efficiency, working skill,competition, privatization etc. have been given more impetus. Through theNew Economic Policy of 1991, large changes have been made in policies relatedto various issues of the economic system such as finance, foreign trade, capital,foreign investments, development of agriculture, industry and human resource.This has resulted in increase in the economic growth rate, availability of foreigncapital, new employment opportunities, national income from the industrialsector and industrialization of the new regions etc. According to 1991 census,2.87 lakh persons (excluding Jammu and Kashmir) were employed in theindustrial sector which constituted of 3.5% of the total population and 12% ofthe total workers. According to figures of 1994 –95, about 28% of the totalnational income came from industry on the basis of 1980 –81 prices. The countryearned 20602 million U.S. dollars (Rs 64,688 crore ) of foreign currency fromthe industrial export during this year.
Regional Pattern of Industrialization
It is very important for a geography student to study regional pattern
136
137
of industrialization. Because regional imbalance of industrialization give riseto many serious problems. To solve the problem of imbalance, it is necessaryto understand regional pattern of industrialization.
To know the present regional pattern of industrialization in the country,one must understand the changes that took place in the Indian economic systemduring the British rule. Before the British rule there was a vast network ofhousehold and small scale industries in the country. Small scale units wereproducing a variety of goods required by agriculture and for household needs,very efficiently. Household industry and agriculture were very intimatelyrelated. At the same time, Indian made cotton and silk textiles were verypopular in the western countries. The Britishers who entered India by searoutes, started their trade from the ports of Kolkata, Mumbai, Chennai andKarachi (Now in Pakistan). From these ports, the manufactured goods fromEngland were sent to the Indian market and raw material from India wasexported to England. Indian industry suffered a lot due to the economic policiesof the Britishers. The household industry was shattered. The main centres ofhousehold industry such as Agra, Varanasi, Cuttack, Lahore (Now in Pakistan),Dhaka (Now in Bangaladesh), Hyderabad, Pune, Thanjavur and Maduraigradually became weak whereas places like Kolkata, Mumbai, Chennai andKarachi started developing into centres of power.
Gradually, a new kind of economic pattern has emerged in the country.The old economic centres have become the hinterland areas. Port cities likeMumbai, Kolkata, Chennai and Karachi have become the core areas. In thisway, the regional pattern of industrial and economic system has been completelyreversed. Now, port cities have become the centres of economic and industrialpower.
Besides these, the Britishers had developed some regions for supply ofthe raw material and for producing goods for their own needs. For example,they invested lot of money for agricultural development, especially the UpperGanga –Yamuna Doab for sugarcane; Bengal for jute; Assam valley for tea andwestern Punjab (Now in Pakistan) for cotton. However in contrast, the mineralrich undivided Bihar, Orissa and those parts of Madhya Pradesh which fallunder the Chota Nagpur Plateau remained completely ignored.
Therefore we inherited a pattern full of regional imbalances in economicand industrial growth from the Britishers at the time of independence. Toremove these regional imbalances, industries have been set up in the backwardregions of the country through five –year plans after independence. Forexample, Chota Nagpur Plateau, which has copious mineral resources, is anindustrially backward area and has been chosen for establishing very big unitsof iron and steel industry in the public sector. Besides this, new industrieshave been set up in the backward areas under the Backward Area DevelopmentProgramme.
138
But despite these attempts by the government, the regional pattern ofindustrialization in the country is still imbalanced. One of its main reasons isthat, most of the private investment has been in those regions where industrialactivities were already established. The very first objective of private sector isto earn profit. Therefore its investment in these backward areas is absent asthese areas also lack basic facilities. In this way, industrialization has beenlimited to a few major regions only. Most of the remaining areas of the countryare backward industrially backward. In a broader perspective, northeasternpart of the country (except Assam valley) industrially very backward. Thispart includes the states of Sikkim, Arunachal Pradesh, Manipur, Tripura,Meghalaya, Nagaland and Assam. Besides these, eastern Uttar Pradesh,northern Bihar, Orissa and most of the Andhra Pradesh, Vidarbha andMarathwara in Maharashtra, Chhattisgarh and eastern part of Madhya Pradesh,western Rajasthan and parts of Gujarat are industrially backward regions. Themajor industrial regions of the country are the following:
1. Kolkata –Hooghly Industrial Region
This region stretches along the Hooghly River, which is a tributary ofGanga, in about 80 Km of area. Kolkata is the most predominant centre of thisindustrial region. The other main industrial centres are Rawra, Kanchanpura,Bhatapura, Naihati, Barrackpore, Titagarh, Serampore, Dumdum and Alipur.Nearly, 7.50 lakh workers are engaged in the industries of this region. Juteindustry has the maximum concentration in this region and employs more than40% of the total industrial workers of the region. Other industries of thisregion are engineering, chemical, food –processing and paper industry.
This region was chosen in the 17th century by the Britishers and theother European rulers for setting up the industries. This was due to its closeproximity to the Bay of Bengal and strong association with the fertile plains ofnorth Bengal. Gradually, this region became the major centre of trade betweenIndia and Britain. But this region suffered a setback due to the shift of capitalfrom Kolkata to Delhi in 1912 and opening of Suez canal in 1969. During theBritish rule, Kolkata was linked to other states by rail and road and trade andindustrial relations of this region were strengthened.
The jute industry of this region suffered badly with the partition of thecountry in 1947. Most of the jute producing area went to east Pakistan (nowBangladesh) while the jute industries were left in India. The problem ofrefugees during partition also led to heavy economic loss to the industry. Theindustrial development of the region faced stagnation after sometime the decadeof 1950 –60 only due to the emergence of problems like inundation and siltationof Kolkata port, bad transportation, weak communication facilities and politicalinstability. Government however, has made attempts to improve the portfacilities in last few years. An oil refinery has been established near the Haldiaport. By making a barrage at Farakka, efforts have been made to solve theproblem of siltation and water shortage in summers. This region enjoys the

139
8.1

140
abundant supply of minerals from the Chota Nagpur plateau, power fromDamodar Valley Corporation and efficient water transportation facilities etc.The country earns huge amounts of foreign capital by exporting tea, jute, jutetextiles from this port. Due to all these reasons, it is considered the biggestindustrial region of the country.
2. Mumbai –Pune Industrial Region
This region engulfs the industrial centres of Mumbai, Pune, Ambernath,Pimpri, Trombay, Nasik and Tarapur etc. It has a major concentration of textileindustry, in which 41% of the total workers are engaged. The total number ofworkers working in this region is about 6.70 lakh. Other major industries ofthe region include the engineering, chemical, pharmaceutical and petro –chemicalindustry. Besides these, industries like ship –building, electrical, transport,film and food –processing industry are also important. In the beginning, Therewas a very difficulty in bringing coal to be used as a source of energy from theremotely placed mines in the states of Bengal, Bihar and Jharkhand. But thisproblem has been solved to a large extent with the production of hydel powerin the Western Ghats. Also, country’s first atomic power plant has beenestablished in Trombay for the generation of electricity, from where electricityis supplied to major industrial centres of this region.
Mumbai has a special importance as a port which is very beneficial forthe development of this region. The port of Mumbai is nearer to the Europeanmarket and to the oil regions of the Middle East. Besides this, the class ofhard –working and skilled Gujarati and Parsi communities have played specialrole in changing this region into an important industrial region of the country.
3. Ahmedabad –Vadodara Industrial Region
It is located north of the Mumbai –Pune industrial region. The mainindustry of this region is the cotton textile industry. Three –fourth of the totalindustrial labour is engaged in this industry. Ahmedabad, Jamnagar, Surat,Vadodara, Rajkot and Khera are the principal industrial centres. This regionfalls in the centre of the largest cotton producing areas of the country. Thishas facilitated the establishment of cotton textile in this region. Surat is theprincipal centre of silk industry. Besides textile industry, chemical and lightengineering goods are also manufactured in this region. Foreign trade of thisregion takes place through the Kandla port.
4. Chota-Nagpur –Damodar Valley Region
This region is situated in the major mineral resource region of thecountry. It receives coal from Jharia, Raniganj, Bokaro and Burnpur and ironore from Singhbhum, Keonjhar and Mayurbhanj etc. The iron and steel industryof the country is concentrated in Jamshedpur, Bokaro, Durgapur, Rourkela,Bhilai, Burnpur, Kulti and Asansol in this region. A chemical fertilizers industryis situated at Sindri. This region obtains electricity from the Damodar ValleyCorporation and minerals like iron ore, coal, manganese, copper, etc. from the

141
mineral resource regions of Chota Nagpur. This region is well –linked to otherparts of the country by rail and road transportation. The major problem ofthis region is the increase in demand for electricity, communication facilities,etc.
5. Madurai –Coimbatore Region
In this region, a large section of workers work in the cotton textileindustry. Bangalore is major centre for aircraft manufacturing industry,automobile, telephone and machine tools industry. In the last few years,Bangalore has emerged as an important centre of computer industry. It is alsocalled as the “Silicon Valley” of India. Cotton and silk textile industry has animportant place in Madurai and Coimbatore region. Foreign trade takes placethrough the Chennai (Madras) port.
6. Malabar Coast Industrial Region
The principal industrial centres of this region are Cochin, Trichur,Ernakulem, Alwaye, Kozikhode, Keolan and Kalamajari. Food –processing,rice mills, coconut and soap manufacturing industry are the major industries ofthis region. Oil refining and chemical manufacturing are the other majorindustries. Cochin is the principal port of this region, through which the foreigntrade takes place.
7. National Capital Region
Besides the national capital Delhi, the other major centres of this regionare Meerut, Bulandshahr, Aligarh, Mathura, Agra, Gaziabad, Muzaffarnagar,Saharanpur, Bagpet, Muradabad and Bareilly of Uttar Pradesh; Rewari, Panipat,Karnal, Gurgaon, Sonepat, Faridabad and Rohtak of Haryana. In addition,Jaipur and Alwar of Rajasthan are also located in this region. The principalindustries of this region are readymade garments, cotton textiles, electronics,motor engineering, oil refinery, agricultural equipment and chemical fertilizerindustry. Maruti Udyog is operating in Gurgaon in which India’s first smallcar of the country is manufactured. This car is manufactured in cooperationwith the Japanese company ‘Suzuki’. Presence of national capital Delhi,availability of market, transportation facilities, etc. have an important contributionin the industrialization of this region.
Besides the seven principal regions, some minor industrial centres andindustrial belts have emerged on the industrial map of the country. In Punjab,all the industrial cities of Rajpura, Ludhiana, Kapurthala, Phagwara, Jalandharupto Amritsar along the G.T. (Grand Trunk) road form one such industrialbelt. Similarly, Kanpur –Lucknow belt in Uttar Pradesh; Jaipur, Ajmer,Kishangarh, Jodhpur in Rajasthan are the other minor industrial centres. Besidesthese, some industrial centres have developed at major cities like Hyderabad,Nagpur, Bhopal, Vishakhapatnam etc.

142
CLASSIFICATION OF INDUSTRIES
Industries are classified in many ways. In the following table,classification has been done on different bases.
Table 8.1
Classification of Industries
The manufacturing industries classified on the basis of raw material asagro –based and mineral based industries have been described as follows :
(A) AGRO–BASED INDUSTRIES
Industries, which obtain raw material from the agricultural sector, arecalled agro –based industries. The major agro –based industries comprise thetextile industry, jute industry, sugar industry, vegetable oil industry and paperindustry. We will briefly describe these industries in the same sequence.
Textile Industry
The raw materials used in this industry like cotton, jute, silk or woolare obtained directly or indirectly from agriculture. Silk and wool are obtainedfrom silkworms and animals respectively whereas cotton and jute are obtaineddirectly, due to being grown in the soil.
In the textile industry, cotton textile industry becomes the principalindustry because of its importance and vast extent. Our country has an oldtradition of manufacturing and wearing cotton textiles. Cotton textiles of Indiawere very popular in Middle Eastern and European countries. It is because ofthe popularity of these textiles only that the Britishers imposed heavy taxesand restrictions on the export of Indian cotton textiles to Europe. This wasdone to harm the Indian cotton textile industry and to increase the demand ofcotton textiles manufactured in Britain. Extending in every village, this industry
On the basisof
ownership
On the basisof Primaryfunctions
On the basisof size
On the basis ofManufacturingindustries and
weight
On the basis ofraw material
(a) Public sector or Govt.
(b) Private
(c) Public as well as Private
(d) Co-operative
(a) Material
(b) consumer
(c) cottage industry
(a) Large scale Industries
(b) Small scale Industries
(a) Heavy Industries
(b) Light weight Industries
(a) Agro-based Industries
(b) Mineral-based Industries

143
was a rural and cottage industry in which a simple spinning wheel was used asa machine.
The establishment factories in this industry started during the Britishrule in the beginning of 19th century (1818 A.D.). With the setting up of thefirst textile mill in Fort Golster (in Howrah) near Kolkata. But the real beginningwas made in 1854 with the setting up of a cotton textile mill (Bombay Spinningand Weaving Company Limited) at Mumbai.
In 1996 –97, there were 8288 textile mills in the country, which employedabout 805,126 workers, who were involved in both the spinning and weavingof textiles. Nowadays, whole country is passing through the phase ofreorganisation of industry. It seems impossible for textile industry of theorganised sector to compete with the powerloom industry. Almost all themills are attempting to modernize their machines so that exports could beincreased. Some new mills are being set up with the objective of 100% export.This will lead to progressive increase in the production and exports in thecotton textile industry. Government has always made efforts for striking awise balance between the tradition and modernity; centralization anddecentralization; less labour intensive and more labour intensive, in order toprovide more employment opportunities in this industry. This was done becauselakhs of rural workers in all corners of the country depend on this industry fortheir living and it is the basic duty of the government to provide employmentto the people. However, on the other hand, it is also necessary to encouragethe modern fast mills with large investments, in order to earn foreign currencyby importing textiles in the competitive international market.
Between these two sectors of small scale (cottage) and large scaleindustries, there exists a third sector also which includes labour intensivehandlooms and powerlooms. The post weaving activities are performed withman –driven and power –driven machines. After agriculture, the handloomand powerloom industry is the second largest industry from employment pointof view. In 1997 –98, the handloom industry produced 7263 million metres ofcloth and provided employment to about 76 lakh workers. The powerloomindustry on the other hand produced 8830 million metres of cloth and providedemployment to 45 lakhs of workers. Inspite of the government assistance, thedevelopment of handloom industry is not encouraging. A large number ofrural weavers are dependent on this industry for their living. Therefore, thereis a need to find new methods to make it more active and viable.
Most of the cotton textile industry of the country is concentrated inMaharashtra and Gujarat. Mumbai in Maharashtra and Ahmedabad in Gujaratare the principal centres. Besides these, the centres like Coimbatore inTamilnadu; Nagpur and Sholapur in Maharashtra; Kolkata in West Bengal;Kanpur in Uttar Pradesh; Indore in Madhya Pradesh; and Delhi, are important.
In the last few years, readymade garment industry has developed very

144
rapidly. These are exported to foreign countries as per demand throughdifferent fashions and designs with strict market competition. However, Indiais facing lot of competition from China, Taiwan, Korea and Bangladesh in thisindustry. Therefore, a continuous care of developments in the industry andliking of the foreign consumers should be taken. Country can earn valuableforeign currency from the exports from this industry. Jaipur, Delhi, Mumbai,Coimbatore, Chennai and Ahmedabad are the principal centres of readymadegarment industry.
Woollen textile industry is also becoming important in the textileindustry. You must be aware that Punjab occupies a special place in the woollentextile industry. Amritsar, Dhariwal and Ludhiana in Punjab are its majorcentres. Other centres of woollen textiles are Mumbai, Bangalore, Jamnagar,Kanpur and Srinagar. This industry is largely in the unorganized sector andcomes in the category of small scale industries.
India is ranked fifth in the world in terms of number of wool producingsheep. The number of sheep in the country is about 5 crore and in 1997 theproduction of wool was 4150 tons. The main reason for the low production isthe inadequate supply of wool. In India, the per sheep production of wool isonly 900 gm as compared to 5320 gm in Australia and New Zealand. Therefore,the production of wool in India is nearly six times less than in Australia.
In our country, sheep rearing and wool production is mostly done bythe tribal people. Low productivity, poor quality of wool, lack of facilities,absolute technology, poor quality of sheep, lack of education among tribalsalongwith their shifting nature, come in the way of development of woollentextile industry.
Huge amount of wool is imported from the foreign countries due tothe low domestic production of wool. In 1997, the country produced 4.1 crorekg of wool. To fulfill the demand of this industry, 1.6 to 1.8 crore kg of woolwas imported from the foreign countries. Due to lack of technology,unorganized structure and very small size of units, the exports from this industryare very small but there is a large scope of increasing the exports from thisindustry.
The Indian made silk textiles are popular all over the world. Silkwormsare reared on the mulberry leaves. Nearly 90% of silk production belongs tothis type. It is also called sericulture. This agro –based industry is working onabout 3.32 lakh hectares of land in 52000 villages of the country. More than90% of the silk industry based on mulberry is concentrated in the states ofKarnataka, Andhra Pradesh, Tamilnadu and West Bengal. In 1997 –98, thetotal silk production from the mulberry was 14,110 tons. India is the secondlargest producer of natural silk after China. The production of silk in Chinawas 35800 tons. In our country, more than 70% of the silk is consumed in thehandloom industry. The production and productivity of raw silk are both
145
very low in the country. To fulfill the demand of this industry, raw silk isimported from the foreign countries. During the eighth five –year plan, thetarget was to produce 21400 tons of raw silk for which Central Silk Boardprepared a National Sericulture Plan for 12 states of the country. This planwas implemented in cooperation with the Sweden Development Corporation.
Varieties of silk produced from mulberry include tassar, mooga anderi. Mysore, Kanjivaram (near Chennai), Varanasi, Srinagar, Murshidabad andAmritsar are the major centres of silk production. The major problems, whichthe industry is facing, are the shortage of skilled labourers, lack of capital andmodern technology etc. Secondly, the major problem of silk textile industry inChhattisgarh, Uttar Pradesh, Bihar, Jharkhand, Assam and Orissa is that whilethe skilled weavers are available in these states but raw silk has to be importedfrom far located producing areas of Karnataka, Andhra Pradesh and Tamilnadu.To solve these types of problems, it is necessary to increase the production ofraw silk in new areas.
Synthetic textile industry depends on man –made synthetic fibres. InIndia, synthetic fibres like rayon, terene and dacarene are produced. Theseare produced by chemical processes from wood pulp, coal and petroleum. Goodquality textiles are produced after mixing these synthetic fibres with cotton,silk and woollen yarn. This gives very good results. These types of textilesare not only durable and attractive but are easy to handle also. These can bedried easily after washing and do not need to be ironed regularly. Thesetypes of textiles are very popular in the middle and lower class people. Butdue to higher use of artificial fibres in these clothes, they can be harmful to thehuman skin which can sometimes lead to various skin diseases. Therefore,now people especially educated and belonging to rich class have strongly starteddisliking these types of clothes. Factories producing synthetic fibres are locatedin Mumbai, Ahmedabad, Delhi, Surat, Kolkata, Amritsar and Gwalior.
Jute Textile Industry
Jute is used for manufacturing gunny bags, carpets etc. This industry isa legacy of the British rule to India. The first jute mill (powerloom) was set upin 1859 near Kolkata. Gunny bags made of jute are mostly exported. Due tothis, the industry has developed very rapidly. But this industry suffered heavilyafter independence in 1947. Almost all the jute mills remained in India whilethree –fourth of the jute area was transferred to the then eastern Pakistan (thepresent Bangladesh). In 1997 –98, the country produced 1.8 million bales ofjute. The number of jute mills in the country is 426 in which 1,86,929 lakh ofworkers are employed. This industry provides employment to a total of 40lakh jute producers. In 1990 –91, total production of jute goods was 14.30 lakhtons.
This industry brings huge amount of foreign currency to the country.But in 1986 –87 it had to face lot of problems. Its main reasons were the

146
decreasing demand for the jute goods; large gap between the production costand selling price; and tough competition from the synthetic materials. In 1986,the government of India announced a clear policy to remove the problems ofjute industry. Under this policy, some decisions were taken such as creation ofJute Mill Modernization Fund of rupees 150 crores; creating a Special Jute Fundof rupees 100 crore; exemption of duty on the import of modern machinery forthe jute mills, and making compulsory for some industries to use only the jutematerial for packing their products etc. But the pace of modernization is veryslow. The increasing use of goods made of synthetic materials has become abig challenge for the jute industry. Therefore, if jute industry is to be savedfrom this difficulty, then its inherent strength needs to be revived and it willhave to face the modern challenges.
Coconut –Jute Industry
The economic development in India has been influenced by themanufacturing of different kinds of goods from the materials obtained fromcoconut. Coconut producing areas of states of Kerala, Tamil Nadu, AndhraPradesh, Karnataka, Maharashtra, Orissa, Goa and Assam and union territorieslike Andaman & Nicobar Islands, Lakshadweep and Pondicherry, come underthis industry. About 5.5 lakh people are directly or indirectly involved in thisindustry in which number of women is large. The country earns about 70crore rupees of foreign currency through exports of this industry. The peeland husk of coconut are basic raw materials of this industry. In 1989 –90, theestimated production of coconut in India was 9283 million. Till now only 50%of total peel and husk of coconut is being used in the country and the productioncould be increased in future by encouraging this industry.
The two types of fibre produced in this industry are white and brown.In early 1990’s, the production of white fibre was more than one lakh tons andthat of brown fibre was about 70 thousand tons. The country earned nearlyrupees 70 crore through exports from this industry.
In the eighth five –year plan (1992 –97) of the country, emphasis waslaid on increasing the use of raw material, modernization of the machines,increasing the competition, making the labour more skilled through trainingetc. This was done to increase exports and employment opportunities.
Sugar Industry
India is largest producer of both sugar and sugarcane in the world.Sugar industry is the second largest agro –based industry of the country. In1950 –51, there were only 138 sugar mills in the country whose number hasnow increased to more than 400. Sugarcane is a weight losing raw material.Therefore, sugar mills are established in their raw materials producing regions.The production of sugar is increasing continuously in the country, but it keepson fluctuating from time to time. Sugar production has increased from 11.3lakh tons in 1950 –51 to 132 lakh tons in 1997 –98. The per capita availability ofsugar has also increased considerably during the same period.

147
Large part of sugarcane is consumed in the Gur and Khadsari industry.The rural people like gur, shakkar and khandsari more than sugar. In 1997 –98, the total production of sugarcane was 27.06 crore tons more than 40% ofwhich was used for making gur and khandsari. In the years when there isheavy demand for gur and khandsari, the farmers sell most of their produce tothe small jaggery making units instead of sugar mills and get higher prices fortheir crop. Due to this and also because of sugarcane diseases, the productionof sugar remains fluctuating from season to season. On the other hand, withthe increase in domestic consumption, the demand of year in the country isincreasing year after year. The sugar export of the country is also uncertain.Export was restarted in 1990 –91, after it discontinued for many years.
The sugar industry in the country first started in the private sector.But later, mills were also established in the cooperative sector. Most of thesugar mills in Maharashtra are in the cooperative sector, while in Uttar Pradeshthese are mostly in the private sector. More than half of the mills in the countryare in the cooperative sector. The industry in the beginning was concentratedin Uttar Pradesh and Bihar. But gradually it is extending to the southernstates of Maharashtra, Tamilnadu and Karnataka because the climate of southIndia is more suitable for sugarcane cultivation. In these southern states, thesugar content (sucrose) is 0.5% more as compared to other areas. Punjabgovernment has also been encouraging sugarcane cultivation in the state. Here,the procurement price of sugarcane is fixed higher than in the neighbouringstates of Uttar Pradesh and Haryana. Currently a total of 19 sugar mills areoperating in the state. In your class, try to know the location of these sugarmills. In 1995 –96, Punjab produced about 4 lakh tons of sugar out of a total of165 lakh tons of sugar produced in the country.
Sugar mills of the country are facing many difficulties. Obsoletemachinery, low production capacity, politicization in the fixing the price of rawmaterial (sugarcane), pressure from the Kissan Unions, etc are the majorobstacles. On one hand, the sugar mill owner take huge loans from thegovernment on low rates of interest, and on the other hand, they do not maketimely payment to the farmers. Besides these, there are many shortcomings inthe government policy regarding sugar industry. The by –products of sugarindustry like molasses and bagasse, can be further used in the form of rawmaterial in factories related to the sugar industry itself. For this, the ban onthe manufacture of molasses which the government does not allow for variousreasons. But to reap real benefits, sugar complexes can be established.
Vegetable Oil Industry
To extract oil from oilseeds has been an old tradition in the villages ofIndia. Workers engaged in this traditional work were known as Teli (oilmen).India is largest producer of oilseeds and its vegetable oil in the world. In ourcountry, use of vegetable oil for cooking purposes is liked very much. We

148
often cook all the vegetables in vegetable oil. As a result, the consumption ofoil is also maximum in our country. Inspite of producing nearly 1.5 crore tonsof Til (oilseed), we have to import edible oil from the foreign countries. Themajor oilseeds produced in our country are groundnut, mustard, toria, sunflowerseeds, soybean and coconut.
In 1950 –51, the total production of oilseeds was 5.2 million tons whichincreased to 22.2 million tons in 1997 –98. In this way, an increase of morethan 4 times has been recorded. But because of the fast increase in population,the per capita consumption of edible oil has increased only two times from 2.5Kg per capita in1955 –56 to 5.4 Kg in 1996 –97.
Therefore, large amount of edible oils are imported from foreigncountries. Nowadays, refined oil is becoming popular as an edible oil, whichis available in branded containers or packets. Refined oil ‘dhara’ manufacturedin the cooperative sector is a very popular brand of refined oils. Besides this,many other brands are also available in the market. In Rajpura city of Punjab,the Amrit Vanaspati Company manufactures a popular brand of ‘Bansri’ refinedoil. Its other major centres in north India include Ghaziabad, Agra and Delhi.Gujarat is largest producer of groundnut oil. In this state, a very large area isgiven to groundnut cultivation. This industry is spread in almost all areas ofthe country because one kind of oilseed or the other is grown in all the places,it has a demand in all areas. Keeping in view the increasing domestic demand,the Indian government is making efforts to encourage production of oilseeds,development of new seeds and their productivity etc. through ‘OilseedTechnology Mission’.
Paper Industry
The first modern paper mill in the country was established in 1870 at aplace called Ballygunj near Kolkata under the name of ‘Royal Paper Mills’.Before independence, there were only 15 paper mills in the country. The totalproduction was one lakh tons. The demand of paper is increasing day by daywith the increasing population and spread of education. As a result, it isbecoming very difficult to fulfill this growing demand. Another regarding thisproblem is that keeping in view the importance of forest resources andcontinuous deforestation, it is becoming difficult to provide wood pulp to thepaper industry. Therefore, use of raw materials like bamboo, sabai grass andsugarcane bagasse is being encouraged continuously as alternatives to woodpulp. Besides these, waste paper and rags after recycling are also being usedas a raw material. In 1995 –96, the production of paper and card board was 23lakh tons. To fulfill the continuously increasing demand, paper is imported inthe country.
You must be knowing that the paper used in your daily newspaper isdifferent from the paper used in your copies and books. The paper used in thenewspaper is called newsprint. Keeping in view its demand, the Indian

149
government had established a factory manufacturing newsprint at Nepanagarin Madhya Pradesh. Nowadays, its production capacity is 50,000 tons per yearwhich is far less than the required 3 lakh tons of newsprint. Most of the papermills of the country are located in the states of Maharashtra and West Bengal.But now they are also being established in other areas.
Some major paper mills of the country are: Balarpur, Kalyan and Sangli(Maharashtra); Mysore Paper Mills Limited, Bhadravati; Yamunanagar andFaridabad of Haryana; Modinagar, Saharanpur, Vasantnagar and Lucknow ofUttar Pradesh.
(B) MINERAL –BASED INDUSTRIES
Mineral resources of a country have an important place in moderncivilization and in the systematic functioning of its economic system and itsindustrial development. Many industries use mineral resources for their rawmaterial. Large reserves of minerals and their proper utilization is an indicatorof economic power of any country. The United States of America and Russiahave established themselves as major powers in the world only due to largereserves of minerals found in their country and their utilization in the economicdevelopment of the country. Due to the extensive reserves of mineral oil foundin Middle Eastern countries like United Arab Emirates, Kuwait, Iran and Iraq,a large number of petro –chemical industries could be established, in thesecountries. Iron and steel industry; engineering industry; automobile spare partsindustry; ship and aircraft industry; electrical industry; electronics industry;chemical industry; petro –chemical industry; fertilizer industry; and cementindustry etc., all depend on one mineral resource or the other. This fact can beeasily understood by any person that how much is the contribution of all theseindustries in the economic development of a country. We will briefly describethese industries in relation to India.
Iron and Steel Industry
The art of smelting of iron ore in the country is very old. The IronPillar located in Delhi testifies this, as it is more than 1600 years old. Butmanufacturing steel on modern lines is comparatively new. After manyunsuccessful attempts, pig iron was produced successfully for the first time in1874 in factory by the Bengal Iron Works located at Kulti (West Bengal).Afterwards in 1907, Sri Jamshedji Tata who was also awarded the highest civilianaward of India ‘Bharat Ratna’, later on established a factory in the public sectorin Jamshedpur in Bihar and this city was also given his name. This factory isknown as Tata Iron and Steel Company or TISCO. In 1919, the Indian Ironand Steel Company (IISCO) was established in Burnpur (West Bengal). Lateron, factory at Kulti was also taken over by IISCO. A new factory was set up in1923 at Bhadravati (Karnataka) known as Vishveshwaraya Iron and SteelCompany. In 1950, the country produced 15 lakh tons of pig iron and 10 lakhtons of steel. Whereas in 1997–98, nearly 2.34 crore tons of steel wasmanufactured.

150
The iron and steel industry of the country experienced rapid stridesafter independence. In the 2nd five –year plan (1956 –61), not only, theproduction capacity of steel plants was expanded at large scale but three newplants were established in the public sector with foreign collaboration. Thesethree new plants at Rourkela (Orissa), Bhilai (Chhattisgarh) and Durgapur (WestBengal) had a total capacity of 30 lakh tons. These were established by apublic sector company, the Hindustan Steel Limited. This company is the largestproducer of steel in the country. Its total capital is Rs 700 crores. In 1964, anew steel plant was set up in the public sector at Bokaro (Jharkhand). Productionof steel in this plant started in 1972. After this, Bhilai and Bokaro plants wereestablished in collaboration with the erstwhile USSR; while Durgapur andRourkela were set up in collaboration with Britain and Germany respectively.This is the largest organised sector of the country in which more than 3 lakhworkers are employed. The government has set up Steel Authority of IndiaLimited (SAIL) in 1973 to ensure coordinated development of industry in thepublic and private sectors. The public capital of SAIL in March 1993 was Rs5000 crore. Excluding TISCO, all other big steel plants are under this authority.Their production capacity is mentioned in table below:
Table 8.2
The Production capacity of some of the main steel plants of India
(thousands tons)
Name of the Industry Raw Steel Salable Steel
Bhilai y,ÆÆÆ x,vzxDurgapurU v,vzÆ ~x}Raurkela v,yz{ v,v|ÆBokaro y,ÆÆÆ x,vz{IISCO x}y yÆ{
* All these steel plants are under the steel authority of India.
This is the reason that this industry got concentrated in Chota Nagpurplateau region of Bihar, West Bengal, Jharkhand, Orissa and Madhya Pradesh.The Chota Nagpur plateau has huge reserves of iron ore, coal and limestone.The iron and steel industry based on these raw materials is the basic industryfor all the industries. This industry provides raw materials to the HeavyEngineering and Tools industry. Besides these, other light, medium, small andhousehold industries also depend on this industry. As a result, iron and steelindustry is considered as an indicator of the modernization and industrialdevelopment of a country. Heavy investment; modern and cheap transportationand communication facilities; power resources; development of high level oftechnology and modernization, are very essential components of this industry.
151
Our neighbouring country China has made a faster progress in thisindustry, as compared to us, inspite of the fact that we made a very goodbeginning. In the decades of 1950s and 1960s, the production of iron and steelin India was more than China. Later on, Chinese industry grew much fasterthan India. In 1988–89, China produced 5.9 crore tons of steel while India wasstruggling to achieve a target of just one crore tons of steel. The plants in ourcountry lack high degree modernization and specialization. The Governmentis paying special attention to their modernization. The production of varioussteel products is given below:
Table 8.3
INDIA: STEEL PRODUCTION, v~zv-v~~| Name of Products Total Production
(in Lakh Tons)
v~zÆ-zv v~~{-~|v. Salable Steel vÆ.y |x.vw. Steel Pind vy.| vy|.zx. Salable Pig iron v{.~ wÆ.{
Source— (i) Economic Survey 1996-97, Govt of India Page-128
(ii) India 1984, Govt of India page 384
Besides the big steel manufacturing plants in the country, the countryalso has more than 200 small factories. These are often called Mini Steel Plants.Till 1993, 177 units with a total capacity of 73 lakh tons had started producingsteel. The Mini Steel Plants Scheme has two main objectives. First, thedecentralization of steel industry, and second to shorten the distance betweenthe consuming area and the steel plants. Mini Steel Plants are generally beingset up in the consumption areas. These factories work through electric furnacesof steel and they use scrap iron and sponge iron as their raw material.
During 1971 general elections, the then Prime Minister announced theestablishment of 4 new steel plants in south India. The first of these integratedplants was established in Vishakhapatnam (Andhra Pradesh). Moderntechnology has been incorporated in this plant. Its first unit manufacturedabout 15 lakh tons of steel during the first phase from 1989 to 1991. The unitof second phase was started in 1992 with the objective of export. In 1992 –93,steel worth Rs 212.41 crore was exported from this plant. Second plant wasagain established in Andhra Pradesh at Kotagundam in which sponge iron ismanufactured. Its production capacity is 60,000 tons. Third plant was set upat Salem (Tamilnadu) with a production capacity of 65000 tons. It producesstainless steel. It started working in March 1992. Besides these, the opening

152
of steel plants at Vijaynagar (Karnataka) and Marmagao (Goa) are at differentphases of their completion.
India exports steel also to other countries. In 1995 –96, country exported20 lakh tons of steel worth Rs 1940 crores which is an encouraging feature ofthis industry. With this, not only our steel will be able to compete at theworld level but also production cost will have to be lowered comparatively.Besides all these, the country will earn foreign currency.
Engineering Industry
The engineering industry of the country has developed very rapidlyafter independence. It provides a strong base to different kinds of heavy andlight engineering industries by producing both capital goods and consumergoods. Most of the capital goods are required in the power, chemical fertilizer,cement, steel, mining, textile industry and petro –chemical industries and thisdemand is generally fulfilled through domestic production. Simultaneouslyequipment used for construction and irrigation projects, diesel engines, tractors,transport equipment etc. are also manufactured in the country, which is a matterof great pride. With this achievement, not only the self esteem of country hasarisen but self sufficiency, increase and diversity in industrial development;new employment opportunities; saving of foreign currency etc., have beenobtained. Besides this, with the opening of units of engineering industry atnew places, the area of industrial development has expanded in the country.This is an important step in the direction of the decentralization and removalof regional disparities.
Now the country has achieved so much success in this industry thatIndia is not only cooperating other countries in establishing such projects butalso earning foreign currency by exporting various engineering products.
Engineering industry is very vast and diverse industry which is classifiedinto many types. This industry is divided into two parts on the basis of size ofproducts and investment: (a) Heavy engineering industry and (b) Lightengineering industry. Besides this, the industry can also be divided into twoparts on the basis of nature of goods produced: (a) Capital goods industry and(b) consumer durable goods industry. On still another basis, the industry canbe classified into: (a) Mechanical engineering industry and (b) Electricalengineering industry. Mechanical engineering industry includes the machinetools, rail wagons, automobiles, sewing machines, motor cycle, power enginesand diesel engines etc. In the electrical engineering industry power transformer,electrical motors, fans, bulbs, radio receivers, electric cables and aluminum cablesetc. are the major consumer goods. Nowadays, electrical engineering industryhas reached to cover computer, telecommunication system, rocket and satellitetechnology.
The plants of the Heavy Engineering industry Limited, which is a publicsector enterprise, are operating well in different industrial regions. The Bharat
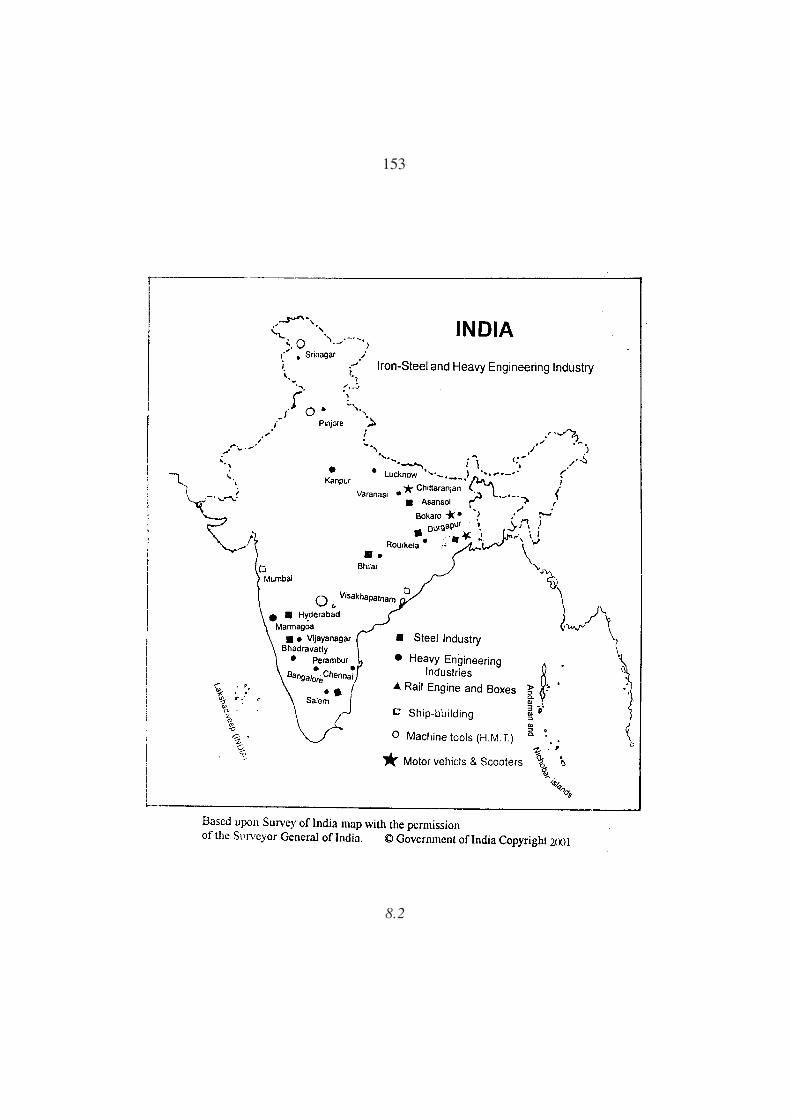
153
8.2

154
Heavy Electricals Limited (BHEL), Hyderabad; petrol mining machines usedin the coastal areas; BHEL Bhopal electricity generation equipment and BHELRanchi iron and steel industry, are located in different parts of the country. Inour neighboring state Haryana, a tractor manufacturing factory of HindustanMachine Tools (HMT) is located at Pinjore. In the factories of HMT, goodquality machines and tools are manufactured. Machine Tool industry producedgoods worth Rs 1104.6 crore in 1992 –93. Previously, in 1970 –71, the value ofits production was only Rs 43 crore. A brief description of major engineeringindustries is given below:
Automobile Industry (Transport Equipment Industry)
This industry can be divided into rail and road transport equipmentindustry. In rail equipment, locomotives, passenger coaches and goods railwaywagons are the major equipment. Being a public sector undertaking, the Indianrailways manufactures its own equipment.
Three types of locomotives are manufactured in the country. These areoperated with coal, diesel and electricity. Keeping in view the cost oftransportation of coal from one place to another and problems of pollution,efforts are now being made to stop the use of steam engines. These are beingreplaced by diesel and electric engines. These types of engines are morepowerful and consume less fuel.
The diesel locomotives are manufactured at Varanasi (Uttar Pradesh)by the Diesel Locomotives Works Limited. In Chittranjan (West Bengal), wherethe first steam locomotive was manufactured, now electric locomotives aremanufactured. Small engines of meter gauge are manufactured by the TELCOcompany at Jamshedpur.
The first plant for manufacturing passenger coaches was established atPerambur near Chennai in 1955. Second such plant was set up near Kapurthalain Punjab. It has a production capacity of 1000 passenger coaches per year.Coaches of goods trains are manufactured at many places in the country. In1992 –93, nearly 25000 wagons of goods trains were manufactured in the country.
Till the beginning of 1986, the Chittranjan factory had manufactured1082 electricity operated and 512 diesel locomotives. However by the sametime, the Varanasi unit manufactured 2089 diesel operated engines. Indianrailways is fully self –sufficient in manufacturing its equipment.
Road transportation has spread very fastly after independence. Withthis, the need for means of transport like buses, trucks, cars, etc., has alsoincreased manifold. Before independence, the production of transportequipment was very low in the country. In 1950 –51, the total production ofbuses, trucks and cars was only 8600. The production of total automobilesincreased upto 5.06 lakh in 1994 –95. Of these, the number of cars and jeepswas 3.11 lakh. Besides this, the production of motor- cycles, scooters, mopeds,etc. was 21.95 lakh in 1995 –96 while it was nil in 1950 –51.

155
With this, there has been an astonishing growth in tractor and cyclemanufacturing industry. Although India did not record any achievement intractor manufacturing till 1950 –51, but the country manufactured 1.58 lakhtractors in 1994 –95. In 1971, the country manufactured only 71000 tractors.The production of cycle industry is also encouraging. In 1950 –51, only 99000cycles were manufactured and the number reached upto 89.01 lakh in 1994 –95.The most popular ‘Hero’ cycle of north India and the ‘Hero’ moped aremanufactured in a factory located at Ludhiana in Punjab. Similarly, there is atractor manufacturing factory of ‘Swaraj’ tractors SAS Nagar (Mohali) in Punjab.
The tremendous progress of automobile industry is attributed to thepolicies of the government. The government first welcomed foreign policies(collaboration) in this industry. It granted permission to the Italian company‘Piazo’ to set up factories in the joint sector. Secondly, under the new industrialpolicy of 1991, the automobile industry was completely delicensed. Currently,there are 5 units of passenger cars, 2 units of jeeps, 24 units of two –wheelersand 19 units of tractor manufacturing, working in the country.
Electronics Industry
This is a new and fast growing industry of the country. At the time ofindependence, only radio sets were being manufactured in the country. But inrecent years and especially during the 8th five –year plan (1992 –97) this industryhas developed very quickly. During this plan, the production in the electronicsindustry has increased by 41%. In the year 1995 –96, the value of trade fromthis industry was Rs 21675 crores, out of which Rs 2550 crores were earnedfrom the exports of computer software. Besides this, Rs 5400 crore were earnedfrom the electronics consumer goods, Rs 2400 crore from the industrial consumergoods, Rs 2225 crore from computer systems, Rs 3600 crore from electronicspare parts and Rs 3110 crore were earned from the export of communicationand broadcasting equipment.
The government has started the Software Technology Park Project withthe objective of increasing exports from this industry. Under this project, 521units have been registered. Out of these 157 units got permission only in theyear 1995 –96. In addition, 153 units have been granted permission under theHardware Technology Park Project. Besides the government, several MultiNational Corporations (MNCs) are also investing in this industry in our country.Its main reason is the big market of the country and availability of cheap andtechnically skilled persons in the country. The Bangalore city (Karnataka) ofthe country has become a major centre of software technology. Besides this,Pune, Mumbai (Maharashtra), Chennai (Tamilnadu) and Delhi are the othermajor centres. In north India, SAS nagar (Mohali) in Punjab is called the electroniccity. The future of development of this industry in the country is very bright.
Chemicals Industry
Preparation of chemicals is also a major industry in the country. It is

156
ranked fourth after iron and steel, engineering and textile industries. Thisindustry has developed quickly in the last few years. It recorded 11.4% increasein the year 1995 –96 alone. The country earned Rs 1234 crores as foreigncurrency from the exports of carbonic, acarbonic and agricultural chemicals.This industry includes drugs, dyes, chemical pesticides, plastics, soaps and paintsetc.
India is one of the leading countries of the world in the pharmaceuticalindustry and different types of drugs are prepared in the country. The countryis self sufficient in the manufacturing of drugs. But some life saving drugs areimported from foreign countries. We also export some drugs to other countries.In 1995 –96, the cost of Bulk Drugs and Formulation, manufactured in thecountry, was Rs 10947 crores. Besides this, drugs worth Rs 2337 crores werealso exported in 1997 –98, half of which consisted of bulk drugs. Bulk drugsespecially include antibiotics, vitamins, penicillin. Recently, there are manyproposals of foreign investment for setting up many factories in this industryin the joint sector. Simultaneously, demand is being made for developing thealready existing industries and for research and Development. After theannouncement of ‘New Drug Policy’ of 1986, the licensing system in the industryhas been abolished. After that also, many proposals have been received forthe manufacture of bulk drugs. Now the MNCs, interested in production ofbulk drugs are free to set up all the ancillary industries. With the delicensingof this industry and large scale entry of the MNCs, many people fear that nowdrugs will become more costly which will create into many hardships to thepoor and middle class people. This fear is not baseless also. The new EconomicPolicy which was implemented in 1991 and after the signing of the ‘DunkelProposals’ by India, the prices of medicines have increased very sharply.
About 250 units of this industry are operating in the organised sector.Out of these, 5 units are in the public sector and 6 units are working in thejoint sector. The various public sector units are mentioned below:
(1) The Indian Drugs and Pharmaceuticals Limited (IDP Ltd.): This is thefirst unit under which there are five factories located at Rishikesh(Uttaranchal), Hyderabad (Andhra Pradesh), Chennai (Tamilnadu), Gurgaon(Haryana) and Muzaffarpur (Bihar). Besides these, their ancillary industriesare working at Jaipur, Lucknow nad Bhubaneshwar.
(2) The Hindustan Antibiotics Limited (HAL): This second unit was set up(at Pimpri, Pune) in March 1954 by incorporating units manufacturingpenicillin, streptomycin, ampicillin, gentamycin, hamycin, aureofungin. Threeancillary companies in the joint venture have been set up in the states ofMaharashtra, Karnataka and Manipur. The factories of these drugs arerespectively located at Nagpur, Bangalore and Imphal.
(3) The Smith Stanstreet Pharmaceutical Limited (SSPL): This is one of thethree nationalized drug companies whose management was took over bythe Indian government in October 1977 after the nationalization.

157
(4) The Bengal Chemicals and Pharmaceutical Limited (BCPL): This fourthlarge company is the second, which was nationalized in 1980. Two of itsfactories are located in West Bengal, one in Karnataka and one inMaharashtra (Mumbai).
(5) The Bengal Immunities Limited (BIL): This fifth large unit was nationalizedin 1984 and hence is operating in the public sector.
Besides these, nearly 5000 units are manufacturing drugs andpharmaceuticals in the small industrial sector. About 100 of these units aremanufacturing bulk drugs.
Petro –Chemical Industry
This industry which is a part of the chemical industry, is one of thoseindustries which have contributed very strongly to the development of Indianeconomy. The growth rate of this industry has been 12.5% per annum ascompared to only 8% for the entire industrial sector and 10% for the chemicalindustry as a whole. Petro –chemicals, due to qualities are fastly replacing thetraditional raw materials like wood, lead, glass, metal, etc. For example, theuse of plastics has brought revolutionary changes. Plastic industry alone employsmore than 2 lakh of people, and this number was likely to exceed 3 lakh peopleby the year 2000.
The public sector company ‘Indian Petro –Chemical Limited’ has greatlyhelped this industry in every sector due to this industry has grown very rapidly.The use of petro –chemical products is continuously increasing in the country.This was 7.5 lakh metric tons in 1979 –80 which increased to 29.73 lakh metrictons in 1990 –91. It was expected to be more than 70,00,000 metric tons by2000. Keeping in view the demand, the government has sanctioned aninvestment of Rs 25000 crores after linking together many petro –chemicalcomplexes. This will make the country self –sufficient in petro –chemicalproducts.
The goods produced by this industry were earlier considered a necessityfor the higher class people. But nowadays, these goods have become part ofdaily life of common man. The major products are machine oil, grease, menthol,synthetic fibres like nylon, polyester and synthetic sugar, etc.
Under the Petro Chemicals Department, three units of petrochemicalsare working in the public sector. The Indian Petrochemicals Corporation Limited(IPCL), is the leading public sector company, which is producing differentproducts like polymer, artificial carbonic chemicals. A very big industrial complexof IPCL was established at Vadodara (Gujarat) in 1973. Here only its Olefincomplex was set up in 1978. The second olefin complex was set up in Nagothane(Maharashtra). Recently, its third complex has been completed in 1996 atGandhar in Gujarat.
Petrofils Cooperative Limited (PCL) is a joint venture company of thegovernment and the weavers cooperative societies. Its two factories produce
158
polyester filament yarn and nylon filament yarn in Vadodara and Naldhari(Gujarat). This company transacted a business of worth Rs 295 crore in 1992–93.
The third centre of petrochemicals is a training institution. Thisinstitution is known as the Central Plastic Engineering and Technology Institute(CIPET) and is located at Chennai. Its main objective is the development ofskilled human resources and to provide technical services to the plastic industry.Besides this, the national laws, and best quality production, special advise andservices, etc. are also provided to the plastic industry. Eight new centres wereestablished to fulfill the increasing demand of training in the area of plasticindustry. These are located at Ahmedabad, Bhopal, Lucknow, Bubhneshwar,Imphal, Amritsar and Mysore.
This industry is growing fastly due to the fact that the petro –chemicalgoods are becoming an important part of daily life.
Fertilizer Industry
Application of fertilizers to the soil is very essential for intensiveagriculture. In a country like India where the base as well as growth rate ofpopulation is very large, the increase in production of fertilizers is all the moreessential. To maintain the fertility of soil there is a great demand of chemicalfertilizers in the country. This demand has increased especially after the GreenRevolution. Therefore, it was important to expand the fertilizer industry ofthe country.
Although the production of chemical fertilizers in the country had startedbefore independence but the actual development started with the establishmentof a factory by the Fertilizer Corporation of India (FCI) at Sindri (Jharkhand)in 1951. Before this, the country’s first factory had been established at Ranipet(Tamilnadu) in 1906. This industry developed rapidly after 1966. In the sixthfive year plan (1980 –85), Rs 2367 crores were allocated for the development ofthis industry. Today, India is ranked fourth in the production of nitrogenousfertilizers. At present, there are 59 major units nitrogenous, ammonia sulphateand super phosphate fertilizers. In 1950 –51, a total of 85 thousand tons ofnitrogenous fertilizers were produced. The production increased to 85.31 lakhtons by March 1993. During the same period, the production of phosphaticfertilizers also increased from 63 thousand tons to 28.22 lakh tons. But due tothe demand being much more than the domestic production, large amount offertilizers is imported from the foreign countries. The per hectare use of chemicalfertilizers in the country was only 0.55 Kg in 1950 –51, which has now reached71 Kg. In Punjab, the per hectare use of chemical fertilizers is more than doublethe national average. It is about 164 Kg per hectare. The demand of fertilizersin the country was estimated to be around 2 crore tons by the year 2000.
The public sector has a great contribution in the fertilizer industry ofthe country. The first plant in this sector was established at Sindri (Jharkhand)
159
in 1951 while the second was set up at Nangal in Punjab. The third plant wasestablished at Trombay. After this, the Fertilizer Corporation of India (FCI)was set up in 1961 to take over the management of chemical fertilizer factoriesat Sindri and Nangal under one managing unit. Later, the National FertilizersLimited (NFL) was instituted in 1974. But soon both (FCI and NFL) wereoragnised into four companies on the basis of geographical factors and feedbackin 1978. The NFL was given the responsibility of the manufacture, stocks anddistribution of fertilizers in north western India. It also operates in Punjab. Ofthe 5 NFL plants, 3 plants are operating in Punjab at Nangal and Bathinda. InNangal, there are 2 plants producing nitrate and urea while the factory atBathinda produces only urea. The other 2 plants are located at Vijaypur andPanipat. In the beginning, the chemical fertilizer plants were always locatednear the sources of raw material but now with the availability of natural gasvia pipelines to even in the remote areas, the decentralization of this industryhas become possible. For example, a chemical fertilizers plant has been set upat Jagdishpur (Uttar Pradesh) by transporting natural gas through 1730 kmlong pipeline from Hazira in Gujarat through Vijaypur (Madhya Pradesh). Butdespite such a large expansion of the fertilizers industry, fertilizers are to beimported from the foreign countries due to large demand in our country. In1997 –98, the country imported 1.05 crore tons of fertilizers, worth Rs 5628crores.
Cement Industry
The increasing demand of cement in any country is a symbol of itsindustrial development and high standard of living. Cement is greatly neededfor construction purposes. The first cement factory in our country wasestablished in 1904 at Chennai (Madras). After that, the industry is continuouslygrowing. During the decade of 1980’s, the average economic growth rate ofthis industry was more than 8%. But due to the demand exceeding production,the country had to import about 20 lakh tons of cement every year upto 1984 –85. This industry recorded a fast growth during the 7th five –year plan (1985 –90). At present, India is ranked fifth in the production of cement after China,erstwhile USSR, Japan and USA.
Till March 1993, there were 97 large and 250 small factories with a totalproduction capacity of 680 lakh tons. In 1992 –93, total production of cementwas 541.4 lakh tons. The units of the industry are found both in the privateand public sector. Limestone is the major raw material of this industry. Thedevelopment of this industry was brought under special focus during the 8th
five –year plan and as a result its expansion and modernization were taken up.
In brief, the manufacturing industry of the country is gradually towardsprogress and stability. But simultaneously several problems like industrialpollution, imbalances in the industrial development, industrial unemploymentetc., are also arising. Being the students of geography, our main concern iswith the increasing regional disparities in industrial development.

160
EXERCISES
(I ) Answer the following questions objectively :
1. What is manufacturing industry?
2. How does manufacturing industry depict the development of a country?
3. When the new Industrial policy of India was being implemented.
4. How many workers are engaged in a manufacturing industry?
5. How much share is added by manufacturing industry towards the NationalIncome?
6. Name the major industrial units established in Chota Nagpur Plateau.
7. Which is the largest Industrial Region? Where is it located?
8. When and why the Kolkata-Hooghly region has been established?
9. Name the Industrial Region to which the Jute industry belong?
10. Name the main centres of the Mumbai – Pune Industrial Region.
11. Name the main Industries of Mumbai – Pune Industrial Region.
12. Where the main centres of Ahemdabad-Vadodara Industrial Region situated?
13. Name the main centres of Ahemdabad-Vadodara Industrial Region.
14. Name the Industrial Region, which exports its products through the port of Kandla.
15. Which city of India is known as ‘Silicon Valley’ and in which state is it located?
16. Name the main centres those manufacture aeroplanes in India.
17. Which Industrial Region exports its products through the port of Kochi and namethe state of India where this port of Kochi is located?
18. Where is Maruti Industry located, name the product that is manufactured by thisIndustry?
19. On the basis of raw material how many kinds of industries are there in India?
20. Give a classification of Industries on the basis of the size of Industry.
21. What is the difference between Public sector & Private sector Industries?
22. Name the raw material used in cotton textile Industry.
23. Name the raw material, which we get from agricultural sectors.
24. When was the cotton textiles Industry established?
25. Name the main centres of cotton textiles Industry.
26. How much less is wool production per sheep in India as compare to Australia?
27. For which Industry is Kanjivaram famous.
28. Name the main centres of production of artificial fibre cloth.
29. When and where the 1st paper mill has been established?
30. Where is the factory that manufacture the paper for newspaper?
31. Name the main paper manufacturing States of India.
32. Which manufacturing factory is there in Jamshedpur?

161
33. Find out, whether the Iron and Steel Industry is of Private sector or Public sector inBhilai.
34. Name the three Public sector Iron and Steel Industries.
35. What do you understand by Mini Steel Plant?
36. Which major factory is there in Vishakhapatanam and what is its Importance.
37. Where are the Diesel Engine manufacturing centres in India?
38. Where is the Cycle manufacturing unit in Punjab?
39. Where is the Sawaraj tractor manufacturing located and name the state.
40. Which city of Punjab is known as ‘Electronic City’?
(II) Answer the following questions in short.
1. Name the areas, which are backward from the industrial point of view.
2. Name the major Industrial Region of India.
3. Which are the main Industries in Kolkata – Hooghly Industrial Region.
4. What factor played a special role in the Industrial development of Mumbai – PuneIndustrial Region?
5. State the main Industries of chota Nagpur. Enumerate Damodar valley IndustrialRegion.
6. Which are the main Industries of Madurai – Coimbatore Region?
7. Name the main Industrial centres of National Capital Industrial Region.
8. Which factors affects the Industrial development of National Capital Region.
9. What are the main problems of Jute Industry?
10. What are the main problems being faced by wool Industry of India?
11. Give an account of development of Sugar Industry in India.
12. What are the main problems being faced by Paper Industry?
13. What are the advantages of Mini Steel Plant Scheme?
14. What are the advantages of development of manufacturing Industries?
15. What are the main Characteristics of New Industrial Policy?
16. What was the structure of Industry of India before independence?
17. What changes are incurred in the Industrial set up during the British rule?
18. Explain the main problems, which are being faced by Kolkata – Hooghly IndustrialRegion?
19. Name the Public sector Pharmaceutical Industrial units in India.
20. What are the main characteristics of Chota Nagpur – Damodar – valley Region?
21. Write about the main Industries of National Capital Region.
22. What are the main problems being faced by textile Industry of India?
23. Explain the hand – loom Industry of India.
24. What are the main problems being faced by the sugar Industry ?
162
25. Explain the silk textile of the country.
26. Throw light on the importance of Mineral Based Industry.
(III) Answer the following questions subjectively :
1. Why an India like country should encourage the development of ManufacturingIndustry.
2. Explain the regional set up of Industrialization of India.
3. Explain the regional imbalance of a country.
4. Explain in detail about the National Capital Industrial Region.
5. Write in detail the textile Industry of India.
6. Give in detailed explanation of Jute Industry in India.
7. Give in detail about the sugar Industry of India.
8. Explain in detail Iron and Steel Industry of India.
9. Write an essay on Engineering Industry of the country.
10. Give a detailed explanation of fertilizer Industry of the country.
(IV) Show on the map of India.
1. Kolkata – Hooghly Industrial Region.
2. Ahmdabad – Vadodara Industrial Region.
3. National Capital Industrial Region.
4. Malabar coast Industrial Region.
5. Main centres of Cotton textile Industry.
6. Main centres of Jute Industry.
7. Main centres of artificial fibre textiles.
8. Main centres of Transport Equipment Industry.
9. Main centres of Chemical Industry.
10. Main centres of Fertilizer Industry.
*********

CHAPTER 9
MEANS OF TRANSPORT ANDCOMMUNICATION
INTRODUCTION
The carrying of goods and people from one place to another is knownas transport whereas sending of a message from one place to another is knownas communication. The means used to perform these tasks are respectivelyknown as means of transport and communication. For example aircraft, bullockcart, bus, train, helicopter etc. are means of transport whereas radio, television,post and telegraph, telephone, fax, wireless etc. are means of communication.
Due to rapid progress in the means of transport and communication itwould not be wrong to call today’s world as a global village. All the threespheres of the earth i.e. land, water and air have become the actual mediumsof means of transport. The roads and railways have formed a network of meansof transport on the surface of earth. The waterways are utilized for movementacross deep seas, shores and inland waters by means of ships and boats. Theatmosphere not only makes movement by an aircraft possible but also supportsthe communication system for sending and receiving of messages fastly.
Today, not only the entire country but the whole world has become amarket. The interdependence of one area or country on another area or countryis increasing. Hence the exchange of goods and services is increasing day byday. Due to this mutual exchange the importance of means of transport andcommunication on the economic and social life of the people is increasing dayby day. In this chapter you shall study that, how the means of transport andcommunication are contributing in the development of economic and socialsystem of our country. Actually, these means can be termed as the lifeline ofany country.
ROAD AND RAILWAYS
Roads instead of railways are the country’s oldest and most importantsystems. Secondly, roads are easy to construct as compared to others. Roadscan be constructed even on steep slopes. Therefore, you must have seen that inhilly areas roads are major means of transport. In your neighbouring stateHimachal, roads are the chief means of transportation. There is minimal use oftrains here. Roads can pass through dense forests and desert areas. These canbe brought to our doors. But can rail transport be brought upto the door ofour home?
Roads are mainly of two types : surfaced and unsurfaced. Besides these,in some areas transportation is also done by foot paths. The surfaced roads aremore durable and easy as compared to the unsurfaced roads. They are built of
163

164
~.v
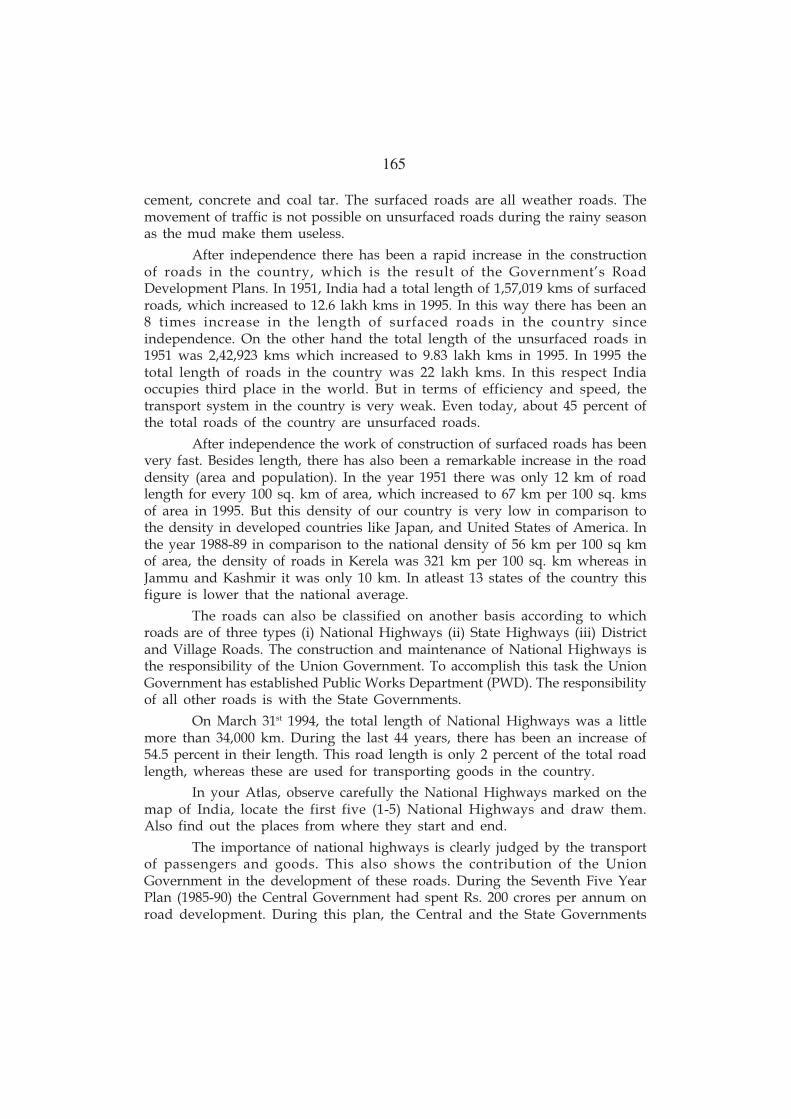
165
cement, concrete and coal tar. The surfaced roads are all weather roads. Themovement of traffic is not possible on unsurfaced roads during the rainy seasonas the mud make them useless.
After independence there has been a rapid increase in the constructionof roads in the country, which is the result of the Government’s RoadDevelopment Plans. In 1951, India had a total length of 1,57,019 kms of surfacedroads, which increased to 12.6 lakh kms in 1995. In this way there has been an8 times increase in the length of surfaced roads in the country sinceindependence. On the other hand the total length of the unsurfaced roads in1951 was 2,42,923 kms which increased to 9.83 lakh kms in 1995. In 1995 thetotal length of roads in the country was 22 lakh kms. In this respect Indiaoccupies third place in the world. But in terms of efficiency and speed, thetransport system in the country is very weak. Even today, about 45 percent ofthe total roads of the country are unsurfaced roads.
After independence the work of construction of surfaced roads has beenvery fast. Besides length, there has also been a remarkable increase in the roaddensity (area and population). In the year 1951 there was only 12 km of roadlength for every 100 sq. km of area, which increased to 67 km per 100 sq. kmsof area in 1995. But this density of our country is very low in comparison tothe density in developed countries like Japan, and United States of America. Inthe year 1988-89 in comparison to the national density of 56 km per 100 sq kmof area, the density of roads in Kerela was 321 km per 100 sq. km whereas inJammu and Kashmir it was only 10 km. In atleast 13 states of the country thisfigure is lower that the national average.
The roads can also be classified on another basis according to whichroads are of three types (i) National Highways (ii) State Highways (iii) Districtand Village Roads. The construction and maintenance of National Highways isthe responsibility of the Union Government. To accomplish this task the UnionGovernment has established Public Works Department (PWD). The responsibilityof all other roads is with the State Governments.
On March 31st 1994, the total length of National Highways was a littlemore than 34,000 km. During the last 44 years, there has been an increase of54.5 percent in their length. This road length is only 2 percent of the total roadlength, whereas these are used for transporting goods in the country.
In your Atlas, observe carefully the National Highways marked on themap of India, locate the first five (1-5) National Highways and draw them.Also find out the places from where they start and end.
The importance of national highways is clearly judged by the transportof passengers and goods. This also shows the contribution of the UnionGovernment in the development of these roads. During the Seventh Five YearPlan (1985-90) the Central Government had spent Rs. 200 crores per annum onroad development. During this plan, the Central and the State Governments

166
~.w
w
INDIARoad Network
Sri Nagar
Leh
Shimla
Nanital
Delhi Darjeeling
Kolkata
NagpurAhemdabad
Mumbai
Hydrabad
Bangalore Chennai
Coimbatoor
0 500 km

167
together spent Rs 6180 crores. The share of the State Government in thisexpenditure was 17%. In the Seventh Five Year Plan a total of Rs. 1481.7 croreswere spent on the State Highway. During the Eighth Five Year Plan (1992-97) atarget was made to increase this amount to Rs 2460 crores. The governmenthas taken a loan of 13.3 crore U.S. dollars from the World Bank for thedevelopment of National Highways in five states of the country namely Gujrat,Haryana, Punjab, Tamil Nadu and west Bengal. You must be aware that fromamongst the National Highways, the longest and the most important Highwayis known by the name of Grand Truck Road (G.T. Road). It is also known asthe Sher Shah Suri Marg and in Punjab it passes through important cities suchas Rajpura, Ludhiana, Jalandhar and Amritsar.
The Union Government also takes care of another category of roads.These are called the Border Roads. Try to find out the total length of theInternational Boundary along the states of Gujrat, Rajasthan, Punjab, Jammuand Kashmir, Himachal Pradesh, Uttar Pradesh, Sikkim, West Bengal, ArunachalPradesh, Nagaland, Manipur, Mizoram and Tripura. The physiography of allthese areas is extremely uneven and is made up of inaccessible, hard rocks.The atmosphere is also not good from health point of view. Hence you canjudge for yourself that the construction as well as maintenance of roads inthese areas is not only expensive but highly risky also. The construction ofthese roads is essential for guarding our boundaries and for connecting thepeople living in the border areas with the main land. Our soldiers protect ourboundaries by staying in these areas. It is very important to construct andmaintain these roads for continuous supply of food as well as arms to thesoldiers.
In this context, the Leh-Manali highway which has been constructed tofulfill the needs of border security is the world’s highest roadway. This roadnegotiates four passes of Laddakh region (Jammu & Kashmir). The height ofthese passes varies between 4875 to 5485 metre above sea level.
Road transport though is becoming very important these days but it isequally risky. The number of vehicles as well as speed on road are bothincreasing at a fast pace. For checking accidents and for maintaining the speedof transport issues such as maintenance of roads, road construction, roadtechnology, expansion of roads, road surveys and research etc. are becominghighly important. Therefore, the widening the roads, their strengthening, makingdouble or multi laned roads, making suitable parking arrangements, carefullyfollowing the rules and signs of road transport and research in road designhave become very important so that precious lives are not lost.
The management of transport in the states is State subject. The StateGovernments have established the Public Works Department for constructionand maintenance of roads. Whereas for effective commuting of passengers, theState Government’s have formed State Transport Corporations. In India thebuses are being run by both the private and the public sectors. The share of

168
public sector in buses is 40 percent while the remaining 60% buses are runningin the private sector. In the year 1994-95 the total number of buses in publicsector was 4.3 lakhs. However in 1950-51 this number was only 34,000. Nearly5 crore passengers travel daily in these buses. Around 7 lakh employees areemployed in these. The carriage of freight/goods by road is completely in theprivate sector. The total number of trucks registered in 1950-51 was only 81,888which has risen to around 18 lakhs in the year 1994-95. This is almost 6 percentof the total number of vehicles registered in the country.
RAILWAYS
Indian Railways is the country’s largest government department. Morethan 16 lakh regular employees are employed in the railways. Besides this,many people are employed temporarily. Railway Department is under theCentral Government whereas most of the buses ply under the supervision ofState Government and the private sector. Indian railway constitutes a veryimportant segment of the economy of the country. That is why the RailwayBudget is presented separately from the union Budget of the country.
In India, the first railway line was built in 1853. This was constructedduring the British rule for sending raw material outside India and for supplyingmanufactured goods for distribution in the Indian market. Hence it can be saidthat construction of railways during the British rule was done basically for theexploitation of the Indian economy. This is often called the colonial economy.Due to these reasons there was a fast expansion of railways in India during theBritish rule. The railway network in India is very vast. The initial role wasdefinitely for strengthening the colonial rule but railways have benefited thecountry too. The importance of railways in the Indian economy has increasedtremendously in comparison to the other means of transport. Besides this,railways have contributed significantly in the social and cultural integration ofthe country.
The recently completed 760 km long rail route for railway transportconnecting Mumbai to Mangalore has no parallels in the history of IndianRailways Known by the name of Konkan Rail project it is the world’s firstscheme of its kind. Since independence, this is the most challenging project.The work on this project began in the year 1991. At that time the totalexpenditure on it was estimated as Rs 1042 crores which has now increased toRs 3500 crores. Around 172 bridges and 92 tunnels have been built on this railline. The longest rail tunnel of the country i.e. 6.44 km lies on this railwayroute. The distance of Mangalore and Thiruvananthpuram (Trivandrum) fromMumbai would reduce considerably on this rail route and business opportunitieswould increase. It is hoped that this rail route would provide the IndianRailways with an income of Rs 300 crores annually.
The Indian Railways has 3 different gauges: (i) Broad gauge (1.69 metre)(ii) meter gauge (one metre), narrow gauge (0.77 metre). The narrow gauge is

169
confined to a few hilly areas where only light trains can run. The trains runningon the Kalka-Shimla rail route are a beautiful example of a narrow gauge. Thetrains moving on metre gauge are not required because in plain areas suchtrains have proved troublesome both in terms of capital and time when it comesto the carriage of cargo. These should have been replaced a long time back.The finances required must have been the main reason. The policy of the Indianrailways has always been of replacing these gauges as soon as possible. Butthese could not been replaced for a long time. However there has been someprogress in this direction during the past few years. For example the metregauge between Delhi - Jaipur has recently been converted into a broad gauge.On the other hand the metre gauge running from Bathinda in Punjab toGanganagar in Rajasthan and Ganganagar to Jodhpur has been converted intoa broad gauge. Now we can travel from Chandigarh to Jodhpur directly withoutchanging any train, which has been only possible because of the conversion ofmetre gauge into broad gauge.
In India more than 95% passengers travel in second class compartments.The main reason being that travelling by the first class and air conditionedcompartment for most of the people is expensive. That is why there is alwaysa heavy rush or crowd in the second class compartments. In such type ofcrowded compartments there is often shortage of public facilities. Thepassengers who have to travel over long distances have to face many problems.Provision of facilities in the second class, expansion of reservation and checkingcorruption in it etc. can bring some improvement in the present situation. Overthe past few years computerized reservations have been expanded on a largescale. Although a few steps have been taken in the direction of more publicfacilities but still a lot needs to be done.
The major income of railways is from freight charges. In the year 1994-95 the income of railways from freight charges was Rs 15.3 crores. In contrast,the income earned from second class passengers was only Rs 6.1 crores. Becauseof poor earnings, the lack of facilities is mainly there. Actually, due to politicalreasons, the government has kept the ticket fare of second class very low incomparison to others classes. On an average the first class ticket fare for longerdistance is 6 times greater than the second class fare. There is no logic for this.The government should make travelling by second class more comfortable withadditional facilities on logical basis.
On the other hand, railways have to be attuned in accordance with thedevelopments taking place in agriculture and industrial sector of the country.In agriculture, railways annually carry food products as well as fertilizers.Similarly coal, minerals and mineral oil are the main goods transported byrailways over long distances. Electrification of railway tracks, establishment ofthermal plants near coal mines and lignite mines, greater use of hydroelectricpower and natural gas in production of electricity etc. are some of the efforts

170
that have been made. The use of different pipelines for petroleum and naturalgas have been the right steps in this direction.
By introducing fast, long distance trains, the railways have tried tocover long distances in lesser time. The speed of these trains is more than 100kms per hour. The “Shatabdi Express Trains” are among the fastest runningtrains in the country. Their speed is 140 km per hour. The Shatabdi trains wereintroduced in the year 1985 on the birth centenary of our first Prime MinisterPandit Jawahar Lal Nehru. That is why these are known as “Shatabdi Trains”.On one hand, these trains connect the important cities like Chandigarh, Bhopal,Jaipur, Agra, Amritsar, Lucknow etc around the National Capital Region ofDelhi. On the other hand they reduce the pressure of passengers travellingdaily to Delhi from nearby cities. For example the distance between Chandigarhand Delhi has been reduced from earlier 5 to 6 hours to 3 hours by the ShatabdiExpress. Therefore, any person who wants to go to Delhi for his business orofficial work for a day can reach Delhi very comfortably by 10 a.m., completehis work by evening, start back for Chandigarh at 5 p.m. and reach his homeby 8 p.m. This was not possible before. Besides Shatabdi trains, the RajdhaniExpress trains have also been started by the government with the motive ofconnecting the state capitals with Delhi in the least possible time. Find out foryourself the names of a few Rajdhani Express trains. The number of long distancetrains is being increased in the country. The Guwahati – Trivandrum Expresstrain, covering a distance of 3974 km is the longest. There are 8 Express Trainswhich cover between 2000 to 3000 km of distance. Find out which all are thesetrains? Which two places do they connect? How much time do they take? Fromwhich states do these pass? Which all major stations fall on their way?
The Indian railways also carry out the task of quickly transportingessential goods at destined places. The high speed wagon trains are used forthis purpose. The railways are delivering goods to the houses of people throughcontainer services. Transportation and distribution takes less time throughcontainer services. Also with this the luggage remains safe, without any risk oftheft. From economic point of view also the container services have provedbeneficial for both the railways as well as the consumers.
Any discussion of Indian railways shall be incomplete till we do notmention cheap transport to the metropolitans. These services exist in Mumbai,Chennai, Kolkata and Delhi. In Kolkata Metro Railway runs under the ground.Recently Metro service has also been started in part of Delhi.
Many measures have been taken to make railways modern with allfacilities. On very busy rail routes a double rail track is being spread. Specialefforts are being made for the electrification of other main rail routes. By now,more than 1/10th of the total rail routes have been electrified. With this twoobjectives have been achieved simultaneously. One, the railways do not haveto carry coal from far off places for its own steam engine. Secondly, the increase

171
in the speed doubles the efficiency of railways due to which the journey becomeharmonious, clean and hence pollution free.
Similarly there has been an increase in the number of diesel engines.The diesel engine being more powerful, can pull greater number of wagon andpassenger compartments. The third main measure has been of making the signalsautomatic. Automatic signals have been installed on many big rail routes. Alongwith this, micro wave system has been started to make railway communicationfast and trustworthy. In the direction of modernization the latest and mostimportant step has been the provision of a mobile phone facility to the driverand the guard in Shatabdi and Rajdhani Express trains. This has been done toestablish immediate communication between both of them at the time of anyemergency. From security point of view it is a praiseworthy step.
PIPE LINE TRANSPORT
Transport through pipe-line is a new thing in India. The transport ofdiesel, petrol and natural gas from the producing areas to refining areas andagain delivering these to consumers through pipelines is a great facility. Thiskind of arrangement is known as pipeline transport. The oil and gas refineriesin Baraulia in North Bihar and in Mathura in west Uttar Pradesh are situatedvery far away from the producing areas. These refineries will face a number ofproblems in relation to transportation. Secondly, concentration of such industrywill take place in the producing areas. In both these situations the economy ofthe country might have to face serious consequences or it has already beenfacing. For example, if due to any reason, any strike takes place in states likeGujrat and Assam where crude oil and natural gas producing areas exist orthere is a strike in some other state that falls in between the producing andconsuming regions, then the all consuming areas of country might face thedifficulty. So, the de-centralization of industry and need to make arrangementfor provision of very essential goods like mineral oils and gas near to consumershas developed the dependence on pipeline mode of transport. Although it istrue that a lot of money is spent in spreading these pipe lines. But, because ofvaried advantages involved the money spent on the pipe line transport isthought to be rightly spent. In this, neither the time is wasted nor any otherkind of wastage is done.
Presently pipelines link Naharkatia oil fields to Guwahati and Barauni;from Guwahati to Siliguri; Koyali to Ahmedabad; Haldia to Barauni. Besidesthese, a network of pipeline has been spread in the oil fields in Gujrat to Koyali.In Gujrat, a 1220 km long pipeline has been spread from Salaya to Mathura viaViramgam. A pipeline has also been laid from Barauni to Kanpur uptill Delhi.Another pipeline also exists for carrying petroleum products from Mathura viaDelhi and Ambala to Jalandhar. A pipeline has been laid between Mumbai andPune, for supplying petroleum products to the consumers of Maharashtra,Karnataka and Andhra Pradesh. The Hajira-Vijaypur-Jagdishpur gas pipeline is

172
9.3
1730 km long. The natural gas from here is supplied to 6 fertilizer factories and2 thermal power plants . The initial capacity of this pipeline is 1.82 crore cubicmetre per day. With these facilities, the people of Delhi will also get electricitynatural gas(Fig 9.1).
WATER WAYS
India has a long history of travel and trade through water ways. In theancient times the Indian traders carried out trade through seas with south-eastAsia and the middle east. Even after independence efforts are being made forthe development of water transport. Our country has a long coastline and itsprotection is very important. Along with this the discovery of the ocean mediumsand utilizing them is very important from the point of view of economic

173
development of the country. Fishing industry is becoming a very importantindustry from economic point of view. The Indian fisherman with the help ofboats catch fishes from deep seas, export them and earn valuable foreignexchange for the country. Besides this you must be aware that India occupies12 nautical miles of area along the coast. A few of its important off-shore crudeoil producing areas exist in deep seas. You must have heard the name of BombayHigh Oil Zone. The economic zone of the country extends upto 200 km alongthe coast in deep seas. The area of this zone is nearly 20 lakh sq. km.
The estimate of the sea routes of country can be made from the figuresof it’s international trade. Both export and import are important for our economicprosperity and progress.
The trade value has increased 145 times in the last 44 years. During thesame period, the imports have increased nearly 155 times whereas the exportshave increased only 136 times. This has resulted in an increase in fiscal deficitof the country. The fiscal deficit which was Rs 100 crores in 1970-71, has risento Rs 7297 crores in 1994-95. The highest trade deficit amounting to Rs 10640crores was in 1990-91. There has been some fall in the fiscal deficit over the lastfew years but the decrease in international trade is really a source of worry.
Since independence our exports are mostly based upon agro industry.The chief items of export include (i) cotton yarn and textiles (ii) jute goods(iii) leather and skins (iv) tea (v) tobacco and tobacco products (vi) vegetableoils and its by products etc. But the face of our export is under going a changeslowly and gradually. This is an indication of the development which has takenplace in our economy. Now, the chief items of export are (i) diamond & jewellary(ii) cotton textiles and readymade garments (iii) tea (iv) machines and transportequipments (v) iron-ore (vi) leather, leather goods and footwear.
In this way we can see that the composition of export items has greatlychanged. In the early decades, only raw material or semi finished goods wereexported whereas in the 1980’s and 1990’s the number of those good increasedwhose value has been raised due to workmanship and expertise. Diamonds,gems and jewellery, readymade garments, leather goods and shoes etc aresome good examples of such articles. Now, the engineering goods are alsobeing exported. In the 1990’s the Indian government has brought about farreaching changes in its economic policy. The important ones among these changesare the removal of the licensing system for setting up industry, encouragingindustries in private sector and the investment, attracting foreign investmentand encouraging the exports. The issues such as privatization in Indian economy,competition, globalisation and liberalization etc have been encouraged withthis policy which is often called the New Economic Policy. The main objectiveof all these is to accelerate the rate of economic development in the country. Alot of emphasis has been placed on increasing the exports. According to thispolicy restrictions have been removed in the agriculture sector also due towhich the prospects of export from the agriculture sector have risen. The export

174
of vegetable oil floriculture and horticulture ; Hops (opium-poppy) ; Cashew –nuts, fish and fish products and other tinned foods has been encouraged.
During the last few years, attention has been paid for increasing theexport of light engineering goods and refined and expensive electronic goods.Bangalore in Kranataka, S.A.S. Nagar (Mohali) in Punjab and Parwanu inHimachal Pradesh have been established as the electronic townships of Indiato encourage the export of electronic goods.
Knowledge of ports through which goods are sent is also essential alongwith exports and imports. The trade relations through seas with other countriesare established via these ports.
MAIN PORTS
As you know India has a lengthy coastline. Along this coastline,favourable conditions are available for buildings ports. The government ofIndia has carried out the task of constructing ports in many of these areas.Port is a place where ships are provided with the facility of entry–exit, haltand loading-unloading of cargo. At present our country has 12 major portswith varying facilities.
Table 9.1
India Description of Main Ports
Name of Harbour State in which Type of Port Main trading item
they are establi-
shed
v w x yv. Mumbai Maharashtra U Natural Petroleum and petroleum
products, machines, dry
products
w. Nheva Shiva Maharashtra U Natural Petroleum and petroleumproducts, machines, dryproducts, cotton and
woollen cloth
x. Kandla Gujarat Tidal Minerals oil, Sugar,Petroleum ProductsManures, Foodgrains, Salt,
Cotton, Cement.
y. Marmagoa Goa Natural Iron ore, PetroleumManganese and dry
products
z.New Mangalore Karnatka Tidal Manures, Vegetable oil,Granite stone, Iron ore,

175
Rubber and its products,cashew nuts, coffee,medicines, coconut, items
made of coconut fibre
{. Kochin Kerala Natural Petroleum Products, Manure
raw material, other items.
|. Tuticorn Tamilnadu U Natural Coal, Salt, vegetable oil,
chemicals, tea, cotton etc.
}. Chennai Tamilnadu U Manmade Hides and leather, Tabacco,paper, cloth, Crude oils
Manures.
~. Vishakha Andhra Natural Mica, leather Hides, Iron ore, Patnam Pradesh Petroleum product,
Manures.
vÆ. Paradip Orissa Manmade Iron ore, coal
vv. Kolkata W.Bengal Tidal Jute and jute products, tea,Iron and steal, Mica, cottoncloth, salt, zinc, Manures,Mineral oil, paper and coal
vw. Haldia W.Bengal Natural Mineral oil, Petroleumproducts, Manures and dryproducts.
Among major parts, Mumbai handles the maximum traffic and is thebiggest port of the country. This natural harbour is very huge. It handles morethan 1/4th of India’s foreign trade. The second main port is the Marmagoasituated in Goa. Kandla (Gujrat) holds a principal position among the portsconstructed after independence. The coming up of this port has not only reducedthe load of import and export from the Mumbai port but has also provided abig facility to the northern and western states like Rajasthan, Haryana, Punjab,Himachal Pradesh & Jammu & Kashmir. Among the newly made ports theMangalore (Karnataka) holds the most important position. Nheva-Shiva orJawahar Lal Nehru Port is a new port equipped with modern facilities. Thishas been constructed to relieve load at other side of the Mumbai port. TheMumbai port is one of the busiest ports of the country.
Kochi (Kerela) on the west coast is one of the main ports of India. It issituated at the Vainbanad lake’s backwaters. It’s a natural harbour. Besidesthese 12 major ports, there are many minor ports in the country. Some of theseare used for fishing also besides the trade.
The major rivers of India such as Ganga, Brahamaputra, Godawari,Krishna, Mahanadi and Tapti are navigable for about 5200 km. This type ofwater transport is known as Inland Navigation. It is navigable even by motor

176
boats. But, presently only 1/3rd of the navigable waters are being utilized.Besides these, there are also a few navigable canals which are rarely beingutilized. Like Brahamaputra it is hoped that boats would begin to ply betweenFarakka and Patna in Ganga. Water transport is far more cheaper as comparedto road transport as the expenditure involved in travel and maintenance isvery low. Even if it takes more time to transport cargo from one place toanother by water the lesser transport costs result in lower price of consumergoods which is very helpful to the trade.
DEVELOPMENT OF AIR TRANSPORT AND FUTURE POSSIBILITIES
Air transport has started the era of revolution in the transport sector.There was a time when moving from one part of the country to another usedto take many months. But with the coming up of motorcars and rail cars anamazing change occurred in the situation and now with the introduction of airtransport the era of revolution has started. Super fast Rajdhani Express Trainscover the distance between Delhi and Kolkata or Mumbai in 17 hours. Thesame journey can be completed in less than 2 hours by an aeroplane. Thisjourney is not only the fastest but it’s also comfortable.
Another quality of this transport is that with this uneven, hilly, sandy,densely forested areas and huge oceans can be conveniently crossed. The areaswhich are inaccessible by land transport are easily accessible by aeroplanes. Doyou know that in areas such as Siachin Glacier (Kashmir) eatables and othercommodities for our soldiers who protect the National Boundaries, can onlybe delivered by airways. Besides all this, travelling by air saves times too.
Due to all these reasons and because of economic development, use ofaeroplane facility is increasing day by day. In 1947, Indian aeroplances providedthe facility of air transport to 3.10 lakh people. This figure rose to more than 1crore in 1985. Ten years later i.e. in 1995 this number increased to 2.56 crores.In 1953 the Indian Government set up two separate corporations – the IndianAirlines and the Air India, in the public sector. The Indian Airlines was giventhe responsibilities of operating domestic flights whereas Air India was forcatering to international air transport. After a few years it was felt that theinternational air services by “Indian Airlines” are not sufficient. Also therewere certain remote areas where these services were absent and should haveexisted. Therefore, in 1981, a third airline under the name ‘Vayudoot’ wasincorporated in the private sector to provide transport services to such areas.
The “Indian Air lines” have connected the capitals of all states. Besidesthis, the services are also available for most of the principal industrial andtourism centres. The four major cities of India namely Mumbai, Kolkata, Delhi,Chennai and Thiruvananthapuram have international airports. Rajasansi airportof Amritsar has been changed into an international airport. Besides these, thecountry has 81 civil airports and 150 air traffic control centres. The responsibilityof their operation lies with the Civil Aviation Ministry. In the year 1994-95,

177
“Indian Airlines” had nearly 62 aircrafts. The new aircraft of Indian Airlines is
named as “Air Bus-320”.
Air India in all has 26 air crafts. Boeing 747 Air Bus “A” 310 and Air
Bus “B” 310 are included in this. In almost 60 countries the Indian air service
companies operate. These are considered slightly cheaper than foreign air services
such as British Airways and Lufthansa. But from security point of view, it is
not that acceptable. This is the opinion of those travelling by foreign airways.
During the last few years, the government has privatized domestic air
transport services. These air services are known by the name of Air Taxis. Due
to the large developments and relaxation in the rules, some private air services
like Sahara India air services have entered the field. This would definitely bring
satisfaction to air travellers because this would result into competition among
private air services as well as with public sector services. With this it is hoped
that air travel would not only provide more facilities but would become cheap
too. Stage is being set to construct country’s first private sector International
Airport at Kochi in (Kerala). This would be a revolutionary step in the direction
of privatization of air services.
COMMUNICATION FACILITIES AND THEIR DEVELOPMENT
In today’s world fast and developed communication facilities are
considered as an indicator of modernisation and economic development. In a
developing country like India, to bring about a rapid change in the economy
and society, the development of communication facilities can be considered as
very important investment. Telecommunication and post and telegraph system
can be visualized as two major riders of any advanced communication facility.
Among the mediums of communication the cheapest, important and
closely related to the common man’s life is the medium of telegraph. India has
the largest postal network. In the year 1993-94 the century had 1.52 lakh post
offices where as the number of post offices in the United States of America
were 40000. China had 51000, France had 17000 while South Korea had slightly
more than 3000 post offices in the same year. In India, these post offices provide
services to five and half thousand people and in the area spread over 21.0 sq
km. In Saudi Arabia this ratio is 15 people to one thousand sq km area whereas
in Pakistan it’s 8000 people to 62 sq km area. Among the total 1.52 lakh post
offices of India, 16.0 thousand are in cities and the rest 1.32 lakh are spread
over villages.
After independence, in 1951, only 23.3 per cent of the villages had the
facility of daily post delivery system.

178
In order to make the postal delivery system fast, a Postal Index Number
(Pin code: consisting of 6 digits) and Speed Post have been started. Besides,
courier services have been started in major cities, in the private sectors. Do
you know the Postal Index Number (Pin Code) of your village or area? Do you
write the pin code on every letter that you send by the post? Do you know
that by using a pin code you add wings to your letter that reaches its destination
very quickly. The task of bringing and sending post can be done both by airways
and surface transport. The capitals of all states of our country are linked by air
postal services.
The second important mode of communication is the telegraph system.
With this our urgent messages reach from one place to another very quickly.
In the post offices you must have often seen people sending their personal
messages through a telegram. With a teleprinter these messages are delivered
very fast from one place to another. In the year 1947 the country had a total
number of 3324 telegraph offices. Their number has increased to 37000 in year
1996. However, Government of India discontinued department of Telepgraph
in 2014.
Telephone is another very important and fast mode of communication.
In the Eight Five Year Plan (1992-97) the government of India decided to spend
3.26% of the total plan outlay on tele-communication whereas in the Seventh
Plan, this expenditure was only 2.03%. Therefore, there has been a revolutionary
change in the telephone services. The Subscriber Trunk Dialing Services (STD)
has not only been expanded on large scale but it has been privatized also.
Small telephone booths can be seen even in small towns from where we can
make calls with in minutes to not only within the country but outside the country
as well. In 1947-48, there were only 321 telephone exchanges in the country
and the working telephone connections were 82000 in number. Their number
has increased amazingly. Presently there are 21000 exchanges and 1.26 crore
connections in the country. Do you know that the large scale expansion of the
tele-communication facilities have been possible only due to the tele-
communication satellites? Now the country has the many automatic exchanges.
In 1986 Mahanagar Telephone Corporation was setup for improving
and increasing the telephone services in Mumbai and Delhi. Telex services are
being developed in major cities of the country. The Indian Government had
installed Videsh Sanchar Corporation in 1986. The main objectives of this

179
corporation are to bring efficiency in the international communication services
and to expand it. In the Eighth Five Year Plan, around 800 crore rupees were
spent for this corporation.
The development and expansion of communication technology in today’s
world is becoming an important measure of the development of any country.
Alongwith this, in democratic setup the importance of information system has
increased further, as it is not possible to know peoples participation in democratic
system and in developmental works without complete information. Radio,
television and computers are the electronic means of communication. Besides
communication, they also provide entertainment. At the time of independence
the country had very few radio stations from where the radio broadcast was
possible to limited areas of the country. Today, people in every nook and corner
of the country are connected with the All India Radio. Radio broadcast is carried
out at three different levels - the national, state and local level. The channels of
national broadcast are in Nagpur whereas channels of foreign services are
situated in Aligarh and Bangalore. The All India Radio broadcasts its
programmes in 23 different languages. In the year 1969 Vividh Bharti Seva was
launched for providing business information. Today, almost everybody in the
country is aware of the type of advertisements and entertainment provided by
this service. There are 39 centres of Vividh Bharti in our country.
Television which is one step ahead of radio, is being liked very rapidly.
Today, about 80% population of the country is enjoying the information and
entertainment provided by the television. In rural areas, television sets have
been given to the panchayats on a large scale for showing doordarshan
programmes. By January 1990, nearly 50032 community television sets had been
presented in various parts of country. The government has also allowed the
foreign television channels to operate in India. Hence you can enjoy the foreign
channels through a dish antenna. These days, the star news, Aap Ki Adalat on
Zee T.V., knowledge of wild animals and sea life on Discovery channel,
Geographical Channel, sports reports on ESPN etc. are becoming popular among
the people. The government has setup the “Parsar Bharti Board” for giving full
autonomy to telecommunications. This Board started functioning in the month
of November, 1997. The renowned journalist Shri Nikhil Chakarabarty, was
appointed first Chairman of this Board. The objective of the Board is to make
the communications reliable, autonomous and economically more viable.

180
Out of the electronic modes, computer is becoming day by day popular
and fast mode of communication. The 21st century is going to be a computer
century. The computer is making an important contribution not only in storing
the vast information and data but also in processing the data. Besides this it
has also proved quiet helpful in the exchange of information and messages.
With a computer, through electronic mails and internet we can send and receive
information and messages from every corner of the world in a few minutes.
Today, through internet, we can get latest information of various papers and
journals quickly. By using a C.D. Rom and sound blaster card computer can be
used like television as an audio-visual medium for teaching the students many
different topics in the class room, in an excellent and entertaining manner. The
day is not far when computer would be used as a strong medium of education
at every scale.
EXERCISES
(I) Answer the following questions in brief :
1. Define the means of Transport.
2. Differentiate between Transport and Communication.
3. Give some examples of means of Transport.
4. Television related to means of Transport or Communication?
5. How many types of Roads are there in India?
6. Why the hilly areas are lack in Railways.
7. Which type of means of Transport are included in waterways?
8. How many times is there increase in construction of surfaced roads afterindependence?
9. What is the position of India in world from the point of view of length ofroads?
10. What is the road density in Kerala?
11. In which state of country the average road density is the lowest.
12. Who is responsible for the construction and maintenance of NationalHighways and which department has been established to accomplish thistask?
13. During the seventh five-year plan, how much average expenditure in incurredannually on the National Highways?
14. Name the world's highest roadways in our country and also tell its heightabove the sea level.
15. Which department has been established by the state governments for theconstruction and maintenance of road.

181
16. When and for what purpose the first Railway was made?
17. What is the length of Konkan Railway and name the two stations of therailway.
18. How many bridges and tunnels have been constructed on Konkan Railway ?
19. When was the Konkan Railway inaugurated.
20. How many types of gages of rail tracks are there in India?
21. Name the fastests trains of the country and tell their speed?
22. Why do the Shatabadi Rail name as?
23. Why does the Rajdhani Rail name as?
24. What is pipe line transport?
25. Up to how many nautical miles the India’s coast extends.
26. What is the length of Indian coastline?
27. Name the main poll ports of –our country.
28. What is inland Navigation?
29. Which Public sector agencies have been established to cater Domestic Airlineservices?
30. What is the name of Public sector department that provides InternationalAirline services?
31. Which areas are being catered by Vayudoot air services.
32. Which Airport of Punjab has been changed to the status of International – Airport.
33. Where is the first private sector airport going to be established in the country.
34. What is the number of Post Offices in our country. How much population on theaverage is served by one post office?
35. Which are the Electronic means of Public Communication.
36. What are advantages of Disc Antenna?
37. In how many languages does all India Radio broadcast its programmes?
38. For what purpose was the Parsar Bharati Board set up.
(II) Answer the following questions in short :
1. Why are the means of transport & communication known as the life lines?
2. Is it right to call the world ‘GLOBAL VILLAGE’.
3. Explain with example the of road development in context of Regionalimbalances.
4. To which states the world Bank has given loans for the construction ofNational highways.
5. Which International boundary states are connected through Border Roads andwhat is the objective behind constructing these roads?
6. What are the characteristic features of Leh-Manali Border Road?

182
7. “India’s Railways is the biggest department of the country” Explain this fact.
8. What was the objective behind the development of roads during British Rule?
9. In which part of country the narrow gage railways are running and why?
10. Name some of the Shatabdi and Rajdhani rails.
11. Write about the container services of Indian Rails.
12. Write about the Metro Services of Indian Rails.
13. What are the uses of water ways?
14. Discuss the short note on Internal Navigation of India.
15. Explain in short note on the changed policy in respect of privataion of Airlineservices.
16. How does the Postal Index Number affect the postal delivery?
17. What types of services is being conducted by Vivid Bharti Seva.
18. Compare and contrast the Roads and Railways.
19. Explain the national importance of National highways.
20. What are the main drawbacks of transport system?
21. Explain in detail the construction and maintenance of Border Roads.
22. What factors should be kept in mind while constructing of roads during themodern times?
23. Explain in detail the bus transport services in our country.
24. What is the contribution of Rails in economic and social development of acountry?
25. Give in details the future plans of Railways.
27. What is the objective behind the beginning of future plans of Shatabadi Rails?
28. What is the importance of sea routes from the economic and national securitypoint of view?
29. Explain the New Economic policy in context of Industries.
(III) Answer the following questions subjectively :
1. Explain in detail the speeding development in constructing the road afterIndependence.
2. Explain the merits and demerits of Roads ways in India.
3. “Konkan Railway Project is a challenging project” in the history of IndianRailways, explain this fact.
4. Discuss the modernization programme of Indian Railways in detail.
5. Explain in detail the pipe line transport facility.
6. “Airway has brought the beginning of revolutionary age in transportservices”Investigate this fact in detail.

183
7. Explain in detail revolutionary changes that has been occurred in the previousyears.
(IV) Show the following on the map of India.
1. Five National Highways, with these places starting and end.
2. Leh- Manali Roadways.
3. Railways from Roha to Mangalore.
4. Kalka – Shimla Railways with four stations.
5. Railways of Chandigarh-Jodhpur with five stations.
6. Railways of Delhi – Chandigarh and Delhi – Jaipur of Shatabdi Rails.
7. Guwahati – Thiruvananthapuram Railways with main stations.
8. Hajira-Vijaypur- Jagdishpur pipe line.
******

CHAPTER 10
POPULATION
Population : As a Resource
A physically and mentally strong citizen is most important and valuableresource of any country. Be it the matter of country’s security or its economicdevelopment, an intelligent and adept citizen can support the country in aplanned way.
In today’s knowledge and information-based world, the role of humanresources in country’s development is being realized more than before. Now,all the countries of the world, especially developing countries are paying moreattention towards the development of human resource. Students, can you think,why it is so? The credit for the ongoing fast development in countries knownas ‘Asian Tiger’ comprising South Korea, Taiwan, Hong Kong, Singapore andMalaysia, is given to the heavy investment done on human resource during thelast few decades. In the development of human resource, not only the indicatorslike education, technical skill, health, and way of upbringing, but also otherindicators like human character and way of thinking, culture and civilization,castes and national pride should also be included. Only then the human resourcedevelopment can become the complete approach.
In India too, more attention is now being paid to the development ofhuman resource. According to India – based economist, Prof. Amartya Sen, themost important and pathetic mistake of the Indian planning is of not payingfull attention to the development to human resources. He considers this as oneof the factors in our economic backwardness. According to him, the benefitsof economic development in independent India have not reached the poor,women and weaker and deprived sections of society due to the less attentionpaid to the issues of social justice. Therefore, great social, economic and politicalinequalities have emerged along with economic development. One main reasonrelating to caste, religion and regional agitations seen nowadays in differentparts of the country, is not paying full attention to the development of humanresources.
Keeping in view the important contribution of human resource in theentire development of a country, the present chapter is devoted to the studyof many characteristics of population of India like distribution, density, growth,age- structure, gender –ratio, rural –urban distribution, education, economiccomposition etc.
184
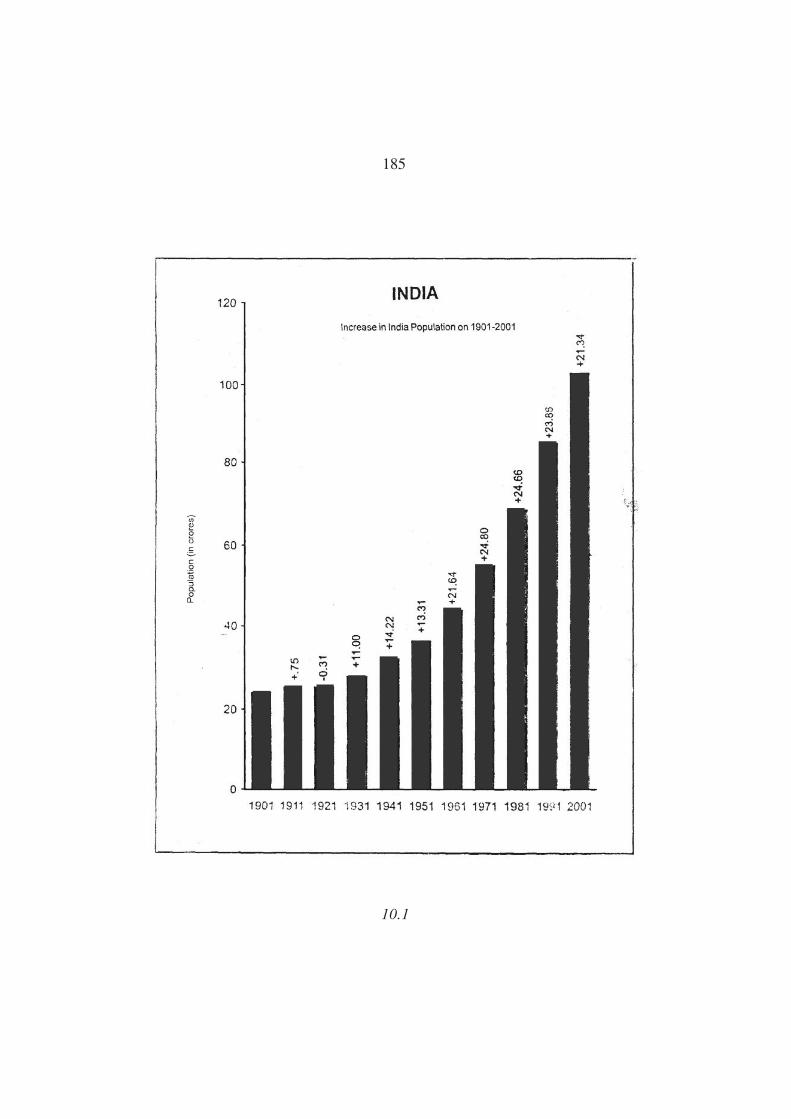
185
10.1

186
INDIA : POPULATION CENSUS
Growth and Distribution of Population in the past
Indian sub continent is one of the few regions of the world whereconcentration of population has been recorded since olden times. In Indiansub continent, the birth and development of one of the world’s oldestcivilizations has taken place. According to an estimate, at the time of Akbar’sdeath in 1605, the population of India was 10 crore. It is estimated that it was19 crore in 1750 and 23.3 crore in 1850. This population used to witness agenerally gradual increase but during wars, epidemics and drought/ floods itused to decline steeply. Nowadays fast changes have taken place theseproblems. The modern medical science and technology have overcome thedeaths due to epidemics and starvation. As a result, the population of India,which was 23.8 crore in 1901, became 35.9 crore in 1951 and increased to 102.7crore in 2001 and to 121 crores in 2011. In this way, the population of India hasincreased more than four times from the beginning of this century till presentand since independence, it has increased three times which is clear from thetable below:-
Table 10.1 India : Population, 1901 –2011
Year Population Decimal Mean Annual Increasing growthGrowth Rate Exponential Rate after 1901 (%) Growth Rate (%)
v~Æv wx,}x,~{,xw| ó ó óv~vv wz,wÆ,~x,x~Æ + Æ.|z Æ.z{ + z.|zv~wv wz,vx,wv,wvx -Æ.xv -Æ.Æx +z.ywv~xv w|,}~,||,wx} +vv.ÆÆ v.Æy +v|.Æwv~yv xv,}{,{Æ,z}Æ +vy.ww v.xx +xx.{|v~zv x{,vÆ,}},Æ~Æ +vx.xv v.wz +zv.y|v~{v yx,~w,xy,||v +wv.zv v.~{ +}y.wzv~|v zy,}v,z~,{zw wy.}Æ w.wÆ +vw~.~yv~}v {},xx,w~,Æ~| +wy.{{ w.ww +v}{.{yv~~v }y,{x,Æw,{}} +wx.}{ w.vy +wzz.ÆÆwÆÆv v,Æw,|Æ,vz,ywv +wv.xy v.~x +xxÆ.}ÆwÆvv v,wv,Æv,~x,yww +v|.{y v.|~ +x{{.|y
Source : Census of India, 2011, Final Population Totals
Draw some conclusions from this table. A look at this table reveals thatpopulation has steeply increased after the years 1921 and 1951. Due to this,

187
the years 1921 and 1951 have been considered as ‘population divides’. One ofthe main reasons of steep increase after these decades has been the sharp fallin the death rate.
Our country is considered as the second most populous country afterChina (100 crores). This population is more than the total population of theUnited States of America and the Soviet Union. More than seven times thepopulation of Pakistan lives in India.
Implications of Large Population :
The huge population of the country has many implications some of whichare positive and some negative. In the positive implications, first of all, it isthe large population due to which India has political recognition in the world.Along with this, a huge market becomes available for selling the Indian goodswithin the country itself and secondly, vast human power also becomes available.Large domestic market and human power together helps in the fast economicdevelopment. On the other hand, the negative implications of large populationinclude heavy pressure of population on the resources, low per capita incomeand lack of housing facilities, long queues, problems of management of largepopulation etc.
Inter-state variations in Population :
India consists of 28 states and 7 Union territories. The total populationof these is about 121 crores and 01 lakhs. Therefore, the average population ofeach state comes out to be 4 crores. Uttar Pradesh is the most populous stateof India which has about 16 crore of population. On the other hand, the leastpopulated state is Sikkim with 5.4 lakh of population. In India, there are nearly10 states which have more than 5 crore of population. These includes thestates of Uttar Pradesh, Bihar, Jharkhand, Maharashtra, West Bengal, AndhraPradesh, Madhya Pradesh, Rajasthan, Karnataka and Tamilnadu. Besides this,National Capital Region of Delhi, which is a Union Territory, also has morethan 5 crore of population. Similarly, in the second place, there are 8 states,where the total population is less than 50 lakhs. Except Sikkim, these includethe states of Mizoram, Arunachal Pradesh, Nagaland, Meghalaya, Manipur, Goaand Tripura. In our own state Punjab, the population is more than 2.75 crores.Population wise, Punjab is ranked 15th among the 29 states of India and it accounts2.5% of the total population of the country.
It is clear from Table 10.2 given on the next page that there exist wideinter state disparities in the distribution of population. For example, on thebasis of total population, the population of the largest state Uttar Pradesh isabout 374 times more than the population of smallest state of Sikkim. Can youthink about the implications of the variations in distribution of such largepopulation? Some implications may be such as large difference in the numberof members of Parliament from different states. For instance, 85 members areelected for the Lok Sabha from Uttar Pradesh whereas Sikkim is represented

188
Table 10.2 : Statistics of States and Union Territories of India
S.No. Name of state Area Total Density Literacy Gender Ratio
(Sq. Km.) Population (Persons rate Females Per
per (Percent) Thousands
Sq. Km.) Males)
INDIA xw,}|,w{x v,wv,Æv,~x,yww x}w |y.Æy ~yÆ(i) STATE
v. Andhra Pradesh v,{Æ,wÆz y,~x,v},{{} xÆ{ {|.}y --w. Arunachal Pradesh }x,|yx vx,}w,{vv v| {{.~z ~wÆx. Assam |},yx} x,vv,{~,w|w x~| |x.v} ~zyy. Bihar ~y,v}Æ vÆ,x}Æy,{x| vvÆw {x.}w ~v{z. Chhattisgarh vxz,Æx~ w,zz,yÆ,v~{ v}~ |v.Æy ~~v{. Goa x,|Æw vy,z|.|wx x~y }|.Æy ~{}|. Gujarat v~{,Æwy {,Æx,}x,{w} xÆ} |~.xv ~v}}. Haryana yy,wvw w,zx,z},Æ}v z|x |{.{y }||~. Himachal Pradesh zz,{|x {},z{,zÆ~ vwx }x.|} ~|yvÆ. Jammu and
Kashmir www,wx{ vwz,y},~w{ z{ {}.|y }}xvv. Jharkhand |~,{vy x,w~,{{,wx} yvy {|.{x ~y|vw. Karnataka v~v,|~v {,vv,xÆ,|Æy xv~ |z.{Æ ~{}vx. Kerala x},}{x x,xx,}|,{|| }z~ ~x.~v vÆ}yvy. Madhya Pradesh xÆ},Æ}| |,wz,~|,z{z wx{ |Æ.{x ~wxvz. Maharashtra xÆ|,|vx vv,wx,|w,~|w x{z }w.~v ~y{v{. Manipur ww,xw| w|.wv.|z{ vww |~.}z ~}|v|. Meghalaya ww,y~w w~,{y,ÆÆ| vxw |z.zÆ ~}{v}. Mizoram wv,Æ}v vÆ,~v,Ævy zw ~v.z} ~|zv~. Nagaland v{,z|~ v~,}Æ,{Æw vv~ }Æ.vv ~xvwÆ. Odisha v,zz,|Æ| y,v~,y|.xz} w{~ |x.yz ~|}wv. Punjab zÆ,x{w w,||,Æy,wx{ zzÆ |{.{} }yxww. Rajasthan xyw,wx~ {,}{,wv,Ævw wÆv {|.Æ{ ~w{wx. Sikkim |,Æ~{ {Æ.|{}} }{ }w.Æw }{~wy. Tamilnadu vxÆ,Æz} |,wv,x},~z} zzz }Æ.xx ~~zwz. Telangana v,vy,}yÆ x,zx,yy,}{z xvÆ {|.ww --w{. Tripura vÆ,y}{ x{,|v,Æxw xzÆ }|.|z ~{vw|. Uttrakhand zx,xxv v,Æv,v{,|zw v}~ |~.{x ~~vw}. Uttar Pradesh w,yÆ,~w} v~,~z,}v,y|| }w} {~.|w ~Æ}w~. West Bengal }},|zw ~,vx,y|,|x{ vvÆw ||.Æ} ~y|

189
by only one member. From our own state Punjab, 13 members are elected forthe parliament, while 67 are from Bihar. On the other hand, problems like thedistribution of financial aid to the states by the centre on the basis of theirpopulation, difficulty in administration of bigger states and the rise of voicefor the formation of smaller states out of the bigger states etc., are the result ofuneven distribution of population.
Population Distribution and Density :-
The study of regional distribution of population provides a basis forunderstanding the various aspects of population. Therefore, an understandingof regional distribution of population is very essential. Firstly, we should havea clear understanding of the difference between horizontal distribution ofpopulation and density of population.
The distribution of population is related to the place and density isassociated with a ratio. The distribution of population indicates whether theregional pattern of population is nucleated, agglomerated or linear etc. On theother hand, in density, emphasis is given on the ratio between the man andland and is related to the size of population and area.
The history of human settlements in India is very old. Therefore, thepopulation resides in regions suited to human settlement. But the distributionof population is very strongly affected by the fertility of land. Being an
S.No. Name of state Area Total Density Literacy Gender Ratio
(Sq. Km.) Population (Persons rate Females Per
per (Percent) Thousands
Sq. Km.) Males)
(ii) UNION TERRITORIES
v. Andaman and
Nicobar Islands },wy~ x,|~,~yy y{ }{.w| }|}w. Chandigarh vvy vÆ,zy.{}{ ~wzw }{.yx }v}x. Dadra and
Nagar Haweli y~v xy,w},Æzx {~} ||.{z ||zy. Daman and Diu vvw w,yw,~vv wv{~ }|.Æ| {v}z. Delhi v,y}x v,{|,zx,wxz ~xyÆ }{.xy }{{{. Lakshadweep xw {y,yw~ wÆvx ~w.w} ~y{|. Pudducherry y~w vw,yy,y{y wz~} }{.zz vÆx}
Source : Census of India (2011) : "Provisional Population Statistics", India Series-1, Paper of 2011, IndiaRegistrar General and Census commissioner, India, New Delhi.

190
agricultural country, the regional pattern of distribution of population in Indiadepends upon the agricultural productivity. That is why, large concentrationof population is found in areas where the agricultural productivity is high.Other than agricultural productivity, natural physical factors also play animportant role in the regional pattern of distribution of population.
Some important characteristics of the distribution of population in Indiaare as follows:-
1. The distribution of population is very uneven. The population is very densein river valleys and coastal plains while it is sparse in the hilly, desert anddrought affected areas. It is important to mention here that the northernmountainous areas have only 16% of the country’s area on which only 3%of population lives whereas 40% of population resides on only 18% of areain northern plains. Similarly in Rajasthan only 2 percent population lives on6 % area of the country. In other words, in more than half of the districts,more than average or below average population resides.
2. Most of population lives in rural areas. Out of the total population of thecountry, about three-fourths lives in villages whereas only one –fourthresides in urban areas. The rural population is widely distributed in 5 lakhrural settlements. Urban population is heavily concentrated in big cities.One –third of the total urban population is found in 302 cities with morethan 1 lakh population.
Many problems arise from this type of distribution of population. Itis not only expensive but difficult also to provide basic facilities andamenities like linking the widely spaced different sized villages by roads,and developing their interaction with the neighbouring cities; education,pure drinking water facility, security and health facilities. On the otherhand, problems like pollution, transportation difficulties, shortage of housesand lack of pure drinking water facility etc. are arising in the big cities.
3. Another important feature of this type of distribution of population is thesettlement of minority groups in the sensitive border areas of strategicsignificance. For example, in northwestern India on the strategic Indo-Pakborder there is large concentration of Sikh population in Punjab and Muslimpopulation in Jammu and Kashmir. Similarly, in the northeast, Christianpopulation is more concentrated in areas bordering China and Myanmar.This type of distribution results into many social, economic and politicalcomplexities.
4. The population is heavily concentrated in the coastal plains and river valleyswhile its distribution is sparse in the mountainous, plateau and desert areas.If we see the distribution of population on the map, it looks like ademographic divide.

191
Density of Population
The 12101 lakh or 121.01 crore of population of India resides on 32.8lakh square km of area. On this basis, if we assume that the population isevenly spread throughout the country then the density of population comesout to be 382 persons per square km. In other words, it can also be describedas average density of population. However, large variations are found in thedensity of population at regional level. The density of population is highest(1102 persons per square km) in Bihar and lowest (17 persons per sq km) inArunachal Pradesh. This difference is very sharp in the centrally administeredterritories, e.g. the density of population is 9340 persons per square km inNational Capital Region of Delhi, whereas it is only 46 persons per sq km inAndaman and Nicobar Islands.
A look at the population density map reveals that areas of high densityof population extend from Punjab in the northwest to the deltaic areas of Gangain West Bengal in the east. In addition to this, density of population is veryhigh in the eastern and western coastal plains. In contrast, the density ofpopulation is low in the central parts of the country like Madhya Pradesh andadjoining parts of the states of Chhattisgarh, Rajasthan, Andhra Pradesh,Maharashtra and Orissa. On the whole, the Himalayan region in the northtoo makes a low density area.
Spatially, high density (more than 400 persons per sq km) areas fallover the deltaic parts of Sutluj, Ganga, Brahmaputra, Mahanadi, Godavari,Krishna and Cauvery rivers where agriculture is well developed due to thefertile soils and adequate rainfall. Besides these, high density of population isalso found near large industrial and administrative centres like Ludhiana,Gurgaon, National Capital Region of Delhi, Kanpur, Patna, Kolkata, Mumbai,Chennai, Ahmedabad, Bangalore and Hyderabad. In this way, the density ofpopulation is high in the areas where due to adequate rainfall and irrigation,intensive agriculture could develop and where industrial cities have developed.Can you identify the densely populated areas on the map? After identification,can you find out the reasons as to why the density of population is high inthese areas? Can you find any relationship between physiography, rainfalldistribution, urban industrial development in the country and density ofpopulation?
In contrast, the areas of low density of population (below 200 personsper sq km) are the physically handicapped regions. These areas include, in theHimalayan ranges in the north the states of Jammu and Kashmir, HimachalPradesh, Uttaranchal, Arunachal Pradesh, Sikkim, Nagaland, Manipur, Mizoramand Meghalaya; in the west the desert areas of Rajasthan, and marshy areas ofGujarat; in central India and interior Peninsular plateau the states of MadhyaPradesh, Chhattisgarh, eastern Maharashtra, eastern Karnataka, western AndhraPradesh and few parts of Tamilnadu.
192
Besides these areas, the regions which lie outside the high density areasare known as moderately densely populated areas (200 to 300 persons per sqkm). Generally these areas are transitional to the low and high density areasand are less in number. From this it can easily be inferred that there exist widevariations in the regional distribution and density of population in India.
1. The traditional rice producing areas of the country are the most denselypopulated areas.
2. After this, the second position is of the wheat producing areas. During thelast few years, the difference in the density of population of wheat and riceproducing areas has gradually decreased. This is because large amount ofpopulation is migrating as workers from the rice producing eastern stateslike Uttar Pradesh, Bihar, Orissa and West Bengal to wheat producing states.That is why, labourers get employment in wheat growing regions of Punjab,Haryana and Western Uttar Pradesh.
3. The third place in the density of population comes of the bajra and Jowarproducing areas, where the density is low. In sum, the density of populationand production potential of different parts of the country are stronglycorrelated.
4. In the different parts of the country, there is a lack of strong inter-relationships between density of population and economic development.In other words, it would not be wrong to say that all areas of high pressureof population are either economically backward or are developed. Forexample, in Punjab - Haryana plains the density of population anddevelopment level are both very high. But on the other hand, in the middleGanga plain, the density of population is very high but the level of economicdevelopment is very low.
POPULATION COMPOSITION
First of all, it is very essential for us to know as to why should westudy the population composition of a country. For the socio-economic planning,data regarding different features of the population of a country such as agestructure, gender composition, occupational structure etc. are needed. Thedifferent elements of the population composition have a strong relationshipwith the economic development of the country. Whereas, on one hand theseelements of population composition are affected by the economic development,the growth and level of economic development on the other hand are affectedby them. For example if the percentage of children and old people is very highin the population of a country then the country has to allocate more financialresources on the basic amenities and facilities like health and education. Onthe other hand, in age structure, if the percentage of working age group ishigh then a good and large contribution in economic development can beexpected. We will discuss briefly the age, sex and occupational composition ofthe population of India in order.
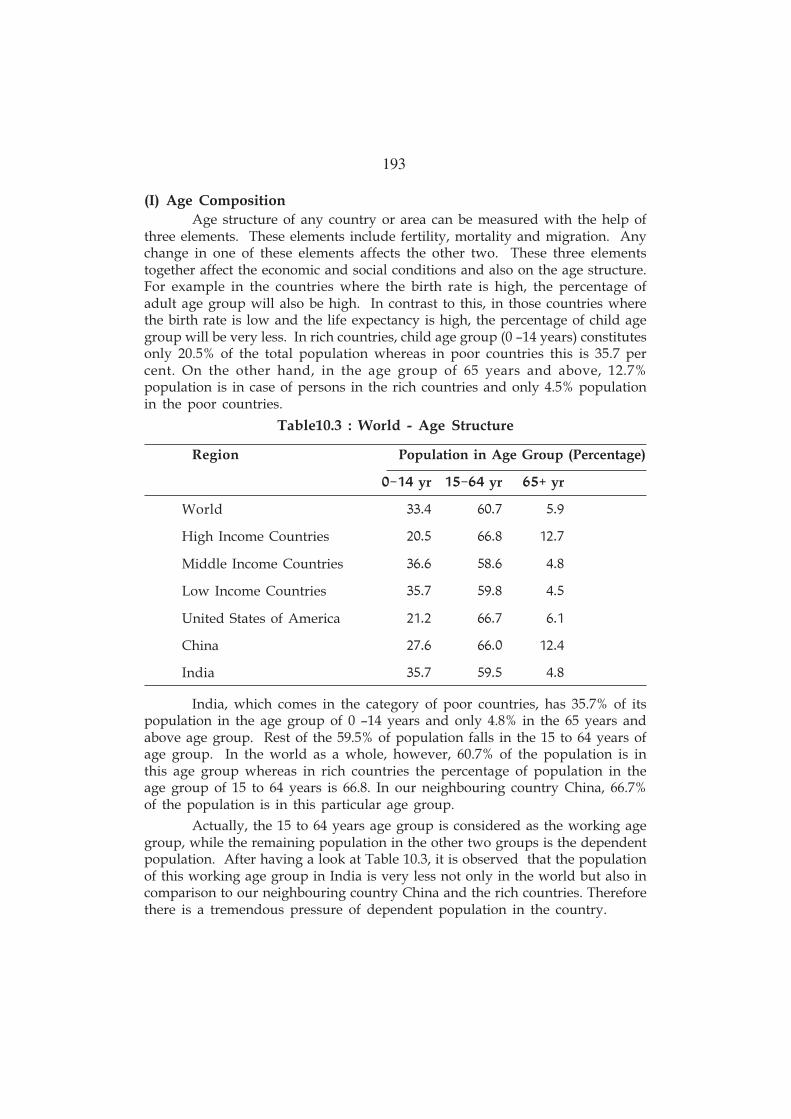
193
(I) Age Composition
Age structure of any country or area can be measured with the help ofthree elements. These elements include fertility, mortality and migration. Anychange in one of these elements affects the other two. These three elementstogether affect the economic and social conditions and also on the age structure.For example in the countries where the birth rate is high, the percentage ofadult age group will also be high. In contrast to this, in those countries wherethe birth rate is low and the life expectancy is high, the percentage of child agegroup will be very less. In rich countries, child age group (0 –14 years) constitutesonly 20.5% of the total population whereas in poor countries this is 35.7 percent. On the other hand, in the age group of 65 years and above, 12.7%population is in case of persons in the rich countries and only 4.5% populationin the poor countries.
Table10.3 : World - Age Structure
Region Population in Age Group (Percentage)
Æ-vy yr vz-{y yr {z+ yr
World xx.y {Æ.| z.~High Income Countries wÆ.z {{.} vw.|Middle Income Countries x{.{ z}.{ y.}Low Income Countries xz.| z~.} y.zUnited States of America wv.w {{.| {.vChina w|.{ {{.Æ vw.yIndia xz.| z~.z y.}
India, which comes in the category of poor countries, has 35.7% of itspopulation in the age group of 0 –14 years and only 4.8% in the 65 years andabove age group. Rest of the 59.5% of population falls in the 15 to 64 years ofage group. In the world as a whole, however, 60.7% of the population is inthis age group whereas in rich countries the percentage of population in theage group of 15 to 64 years is 66.8. In our neighbouring country China, 66.7%of the population is in this particular age group.
Actually, the 15 to 64 years age group is considered as the working agegroup, while the remaining population in the other two groups is the dependentpopulation. After having a look at Table 10.3, it is observed that the populationof this working age group in India is very less not only in the world but also incomparison to our neighbouring country China and the rich countries. Thereforethere is a tremendous pressure of dependent population in the country.

194
The analysis of age structure has many advantages. The knowledge ofthe total population in the child age group of 0 –14 years makes the governmentknow very clearly facilities required to be provided in education, health andsocial services sector. Accordingly, new schools, health centres, communitycentres, etc. can be constructed. Along with this, the knowledge of number ofpeople having voting rights is essential for the democracy. As per the statisticsof age structure, there should be 54% voters in the country, but their proportionis about 60%.
(II) Gender Composition
The population of a country can be used to know the social, cultural,economic and political conditions prevailing in that country. In India, sex ratiois understood in terms of number of females per thousand males. These dayswomen are treated at par with men. In most of the rich countries, the numberof females is more or higher than the number of males. In developed countries,the average gender ratio is 1050 females per 1000 males whereas it is 964 in thedeveloping countries. As per the 2011 census, the gender ratio in India is 940females per thousand males. This is one of the lowest averages in the world.However, this ratio is 910 females per thousand males in Pakistan but lowmale –female ratio in our country is a source of worry. The gradual decreasein this ratio is still a more serious concern.
In 1901, the gender ratio in India was 902. For rural areas, this ratiowas 980 and for urban areas it was 910. After independence, this ratio declinedto 946 in 1951. At that time, this ratio was 965 in rural areas and 859 in thecities. In 1991, when this average was 927 for the entire country, it was 939 forrural areas and 894 for the urban. The average increased to 933 in 2001 and to940 to 2011. In this way, the sex ratio has improved after independence in theurban areas but it has rapidly declined in rural areas, though the sex ratio isstill high in rural areas as compared to the urban areas.
The analysis of sex ratio on the basis of population categories givenbelow shows that the sex ratio is highest (1009/1000) among Christian population.On the other hand, the sex ratio is lowest (893/1000) in the Sikh population. Inthe Hindus and Muslims it is respectively 931 and 936. In Jains, this ratio is940 while in the Buddhists it is 953. In this way, however, it is considered thatthe Muslim population is responsible for the low sex ratio in India, where thefemales are given less rights, but in contrast to this view point, the number offemales is slightly high in the Muslim households than in the Hindu householdsin India.
It is very difficult to know the definite reasons for the low gender ratioin India. One of the main reasons however, is considered to be the low statusof women in the Indian society. In the family system too, they are given lowerstatus as compared to men. That is why in the child age-groups, less attentionis paid to the issues like health, nutrition and care of the girl child. Therefore,the death rate is high among the girls as compared to the boys in the agegroup of 0 –6 years.

195
10.2

196
In this age group, the gender ratio has declined from 976 in 1961 to 945in 1991. The other reasons include, the low counting of women as comparedto men during population census, or reporting the number of males deliberatelyhigh during census, low birth rate of females, female foeticide due to socialpressures etc.. In 2001, however, improvement can be seen in the age group ofmore than 7 years from 923 to 935 in the last ten years.
TABLE 10.4 : India - Gender Ratio
Religious Group Gender Ratio
(Census Years) (Females per thousand Males)
v~Æv ~|w (Rural = 980, Urban = 910)
v~vv ~{yv~wv ~zzv~xv ~zÆv~yv ~yzv~zv ~y{ (Rural = 965, Urban = 859)
v~{v ~yvv~|v ~xÆv~}v ~xyv~~v ~w| (Rural = 939, Urban = 894)
wÆÆv ~xxwÆvv ~yÆ
Religious Group
Christians vÆÆ~Budhists ~zxJains ~yÆMuslims ~x{Hindus ~xvSikhs }~x
At the state level, the sex ratio is highest (1084) in Kerala but it is lowest(866) in National Capital Region of Delhi. Except Delhi, the states with low sexratio are Haryana, Punjab and Jammu & Kashmir, where this ratio is less than900. Except Kerala, the states with sex ratio of more than 950 include thestates of Uttaranchal, Chhattisgarh, Goa, Himachal Pradesh, Manipur,Pondicherry, Andhra Pradesh, Karnataka, Orissa and Tamilnadu. The genderratio of our Punjab is 893, which is comparatively more than the neighbouring

197
states of Haryana, Delhi and Uttar Pradesh but is less than Himachal Pradeshand Rajasthan. In total, the gender ratio is comparatively more in South Indiathan the North India. The female –male ratio is relatively higher in the tribalareas of the Northeast and central India. In states of northern India especiallyHaryana, Punjab, western Uttar Pradesh, western Rajasthan, northwesternMadhya Pradesh, Union Territories and big cities, the sex ratio is relativelyless than the other states.
(III) Economic Composition:
The study of the economic composition of population is very significant.Such a clearly explains the economic, demographic and cultural attributes ofthe area, which provide a basis for formulating future plans for its social andeconomic development.
In India, the population is divided into two categories as workers andnon –workers. This category of workers is further divided into two groups asmain workers and marginal workers. The main workers are those workingpeople who have worked in any kind of economic activity for six months or(183 days) more. Marginal workers are those workers who were involved insome work for some time in the last year but have not took part in any kind ofeconomic work. This category includes the students and housewives who areinvolved in the educational and household duties etc. The main workers arefurther classified into nine sub categories which is more clear from the followingchart.
Total Population
Workers Non Workers
Main Workers Marginal Workers
Agricul-turist
Agricul-turalLabourer
AnimalRearingHorti-culture
Workersengaged inMining
Workersengaged inProductionandRepair work
WorkersengagedinManu-facturingIndustries
Workersengagedin tradeandcommerce
Workersengagedin transportand comm-unication
Otherservices
DomesticIndustries
OtherIndustries

198
In India the ideas behind the classification of population on the basis of
economic structure has been changing. It will not be wrong to say that this
idea has changed in all the censuses conducted since 1951. This concept of
classifying people as workers and non-workers, was introduced for the first
time in 1961 census. But the definition of a worker has been changing. Therefore
it is difficult to make any comparisons of the data on economic composition.
In India, the total percentage of main workers was 37.50% (except Assam
and Jammu & Kashmir) according to the 1991 census. In the rural areas, this
figure was 40% while in urban areas it was 30.2per cent. In this way, only one
–third of the total population is economically active. In other words, nearly
two –third of the population is economically dependent on one –third of working
population. The low proportion of labour force or high proportion of dependent
population is attributed to the high growth rate of population. The dependency
ratio of population increases due to many reasons such as large number of
children encouraging the women to work outside, because to social constraints
and lack of education and awareness.
The other main feature of economic structure, is that a large part of
the total workers is engaged in the primary sector. Due to the agrarian base
the Indian economy, about two –thirds of the total main workers earn their
livelihood from the agriculture and allied activities. Only 11.6% workers are
employed in the industries, which comprise only 10% of the total population.
The remaining 20.5% workers are engaged in the tertiary services like trade
and commerce, transportation and communication and other services. On the
one hand, there is large pressure of population on the agricultural sector due
to low manufacturing activities in the country, and on other hand, many new
tertiary services have become a burden on country’s economy. More than
adequate workers are there in government and foot loose industries which
puts extra burden on the Indian economy. To come out of this problem, we
need to develop our industry in such a way so that maximum number of people
get employed. Also there is a strong need of industrial development in areas
far from the big industrial cities. For this it is important to provide a basic
structure for indutrsies in the backward areas on priority basis.
It is very important for the country to pay attention to issues like fast
growth of national capital, eradication of regional and social inequalities increase
in employment opportunities, environmental security, etc. for its economic
development. It is almost impossible to know the capability of the nation in
achieving all these goals on the basis total population, its density and distribution.
199
Therefore, the knowledge of economic composition of population, gender ratio,
age structure, growth rate, health and education becomes very essential.
(IV) Residence (Rural-Urban Population):
India is still known as the country of villages. There are nearly 5 lakh
50 thousand villages in the country. In the beginning of the 20th century, 9 out
of every 10 were living in a village. At the same time in 1901, the total urban
population was only 2.6 crores (equal to the total population of Punjab at
present). By the census year 1991, the urban population increased to 21.50
crore. In this way, the urban population has increased eight times in the past
90 years. In contrast to this, the total population of India has increased about
three and a half time in the last 9 decades. Whereas, the rural –urban population
ratio was 1:9 in 1901, it has changed to 1:3 in 1991. The urban population has
rapidly increased after independence due to the increase in industrial
development and administrative services.
You can see from the table that although urban population in India is
only 25.6% but its base is very high (215 million) which is more than the total
population of United States of America. Besides the large base, the urban
population is increasing very fastly. Urban population is growing more than
two times faster than the rural population. Similarly the population of large
cities is increasing at a much faster rate than the population of medium and
small towns. This can be seen from the fact that about 65% of the total urban
population of the country in 1996 was living in Class I towns with a population
of one lakh or more. There are about 300 such cities in the country. In 1961
i.e. 30 years ago, the number of cities in this category was only 106. Heavy
concentration of population in the big cities has become a matter of great concern.
Out of these 300 Class I towns, 23 cities are included in the category of
metropolitan cities. A metropolitan city is a whose population is 10 lakh or
more. 7 crore people live in these 23 metropolitan cities which makes one half
of the total population (13.10 crore) of all such cities. There is heavy pressure
on the basic amenities and facilities in big cities mainly due to rapid increase in
their population. Sometimes people here do not get even the basic facilities.
According to an estimate more than one –fourth of the total urban population
of India lives in slums where there is lack of even basic public facilities. Problems
like child labour, nutritional deficiency, unemployment, crime, illegal works
etc. are related to slums.
On the other hand, in the villages, the problem of unemployment is
becoming more serious. Therefore, a large number of young people are migrating

200
to the cities in search of employment. The size of land holdings is declining
with the increase in population. Also the rural youths are getting fascinated
towards the cities and their diversion from agricultural activities is increasing.
Due to these reasons, large numbers of young people from rural areas of villages
are migrating towards the cities in search of employment. The number of
metropolitan cities in the country is increasing fastly. There were 12
metropolitan cities (or urban agglomeration) in the country in 1981, which
increased to 23 in 1991.
(V) Cultural Composition of Population :
India is a country of diversities. People belonging to many races and
castes reside here. The major races include Dravidians, Mongols and Aryans.
Besides these, some people belong to the Caucasian race also. Over time, these
races have blended in such a way that their original characters seem to be
disappointing and characteristics have started emerging. Even then the Indians
are quite diverse this in fact is the major characteristic of this country. Actually
the completeness and pride of a culture lies in its diversity. To give respect to
other’s religion, cultural exchange and interaction are distinct features of Indian
culture. The culture of India and blending of races are unique example in the
world.
People of in the same religion speak different languages. Languages,
races, religions, castes do not follow any boundaries. Despite the racial,
religious, linguistics and regional diversities we all are Indians. Our society is
a bouquet of mixed cultures. It can be compared with a garden where the
flowers of different colours and shades have blossomed, each flower having
its unique identity. But a colourful and picturesque scene is created after
intermixing of all these diversities.
India is a home to the followers of the Hindu, Islam, Sikh, Christian,
Buddhist, Jain and other religions. However, all these religions are equal before
the law and they have all kinds of freedom. Every one is given equal rights
and have to perform same duties.
Also many languages are spoken in India. Some are of these have
originated out of Sanskrit and some from Dravidian. The main languages of
India are Assamese, Oriya, Urdu, Kannada, Kashmiri, Gujarati, Tamil, Telugu,
Punjabi, Bengali, Malyalam, Sanskrit, Sindhi and Hindi. All these have been
accorded constitutional status. The four languages of south India –Tamil, Telugu,

201
10.3

202
Kannada and Malyalam are Dravidian languages. But its is not that all the
people who speak these four languages belong to Dravidian race or the people
speaking languages born out of Sanskrit belong to the Aryan race. Find out
which language is spoken in a particular different region of India.
Majority of people in India speak Hindi language. Also many people
can understand this language even though this is not their mother tongue.
Hindi is also the state language of the country. Many linguistic experts are of
the opinion the despite the many languages and some external differences in
their literature, they have many similarities. All the Indian languages have their
own dialect. Structurally, they are almost similar. An interesting feature is that
a common all India vocabulary has evolved over time due to the various unifying
forces. Many languages do not have much difference even in their scripts.
Inspite of this, some people differences use in language to divide the people on
the basis of language and race for their own vested interests.
We together have to construct a unified, powerful and rich India by
following democratic and socialist principles. Fifty –five years have passed
since our independence. Our achievements are not less in these 55 years but
the country has to find solutions for problems such as social and regional
inequalities, unemployment, population growth, etc. by having fast development.
Therefore, there is strong need to develop our human resources from all
respects as the mental, intellectual and physical in an integrated manner.
(VI) Growth of Population
It is generally said that the population of India is increasing at a very
fast rate. Why is it so? We have to think over it. Natural growth rate of
population depends upon the difference between the growth rate and the death
rate. Higher the birth rate, the higher will be the natural growth rate. Lesser
difference between the two will result in the low growth rate. The third
element, which affects the growth of population, is migration. The growth
rate can be high even if the natural growth is low due to migration. For
example both the birth and death rates of urban population are low in
comparison to the rural population. But growth rate of urban population is
two times more than the rural population. The main reason for this is the
large scale migration of people from rural areas to urban areas.

203
Table 10.5 : India - Growth of Population, 1901-2011
Decade Birth Rate Death Rate Natural Annual
(Per (Per (Decadal) Growththousand) thousand) Growth Rate
Rate (Percent)(Percent)
v~Æv-vv y~.w yw.{ {.{ Æ.{v~vv-wv y}.v y|.w Æ.~ Æ.Æ~v~wv-xv y{.y x{.x vÆ.v v.Ævv~xv-yv yz.w xv.w vy.Æ v.yÆv~yv-zv x~.~ w|.y vw.z v.wzv~zv-{v yv.| ww.} v}.~ v.}~v~{v-|v yv.w v~.Æ ww.w w.wwv~|v-}v x|.w vz.Æ ww.w w.wwv~}v-~v xw.| vv.| wv.Æ w.vyv~~v-wÆÆv N.A N.A N.A v.~xwÆÆv-wÆvv N.A N.A N.A v.|~
From the above table it is clear that highest birth rate was during 1901
–11 decades. Afterwards, it has been gradually decreasing, with some exceptions.
The birth rate was lowest (32.7 persons/1000) in 1981 –91. On the whole it has
recorded one –third decline during the last 90 years. In contrast, there has
been a steep decline in the death rate. The death rate has declined from 47.2
per 1000 to only 11.7 persons per 1000 during the last 9 decades. It is therefore
obvious that whereas the birth rate is declining slowly, the death rate has
recorded a sharp decline. Hence it seems that for arresting the growth rate of
population attention is required to be paid on bringing down the birth rate.
The main causes, why death rate has declined sharply is improvement
in overall environment along with the expansion in the health facilities. In
addition to these, the other main reasons have been: spread of education, changes
in the traditional rituals and increasing awareness among people. Now the
death rate is at its all time low. Further decline in death rate is expected to be
less and very slow. Therefore to check the growth of population we have to
lay emphasis on decreasing the birth rate. Greater stress is to be laid upon
decreasing the death rate among the poor sections of society where it is still at
a higher level. At the same time, we will have to make the people aware of
the problems by reducing poverty, unemployment and women illiteracy.

204
Government is now paying more attention to the programs like improvement
in mother –child health care services, women education, women rights and onawareness programs rather than sterilization programs. A family with twochildren is considered as an ideal family. Thus if we really want to increase thegrowth rate of the economy, improve the living standard of our people, controlthe problems of poverty and unemployment, we will have to check the growthof population.
(VII) Education and Health
Education is a key factor for the overall development of the humanbeing. In India, at the time of independence only 14% of the people wereliterate. The meaning of literacy is limited the activity of writing and readingof one own name. The percentage of literate population has increased 74.4% inthe country by 2011 census and it was 52.21 per cent in 1991. In absolute terms,earlier only 6 crore people were literate in our country but now this numberhas increased to 67.37 crores which means that the percentages of literates hasincreased by 11 times. But it is important to know that the number of illiteratepopulation has also increased during this period. There were 30 crore illiteratepersons in 1951 but after 50 years this number has increased to 35 crores in2001.
According to the Directive Principles in the constitution of our country,it is the responsibility of the government to provide free education to all ofchildren 14 years age. But even after 66 years of independence, this has becomea day light dream. There are many problems also in this regard. It is difficultto provide educational facilities in 5.5 lakh villages spread for and wide in thecountry. It is a very difficult task to open a school in every village and toconvince every parent to send his/her children to school. However, preferencehas been given to open a school in every village of the country. Now there aremore than 5 lakh primary schools in the country. In the year 1951, their numberwas only 2 lakh. The number of middle schools has also increased by tentimes during this period. Earlier, there was one middle school after every 15primary schools but now there is one middle school after every 4 primaryschools. Besides this, some state governments have made the provision ofmobile schools and night schools. To encourage education of girls, hostel facilitiesare being made available to them. But large drop outs in many states is amatter of great concern for the respective state governments. Examples of suchstates are Uttar Pradesh, Madhya Pradesh, Bihar, Jharkhand and Rajasthan.These states have low proportion of literate population, as compared to theother states. But in contrast, Kerala is a state where the percentage of literatepopulation is highest among all states of the country.
It needs to be added that even today 25 per cent children reach uptothe middle (8th) standard in the country. In this way, three –fourth of the
205
children are deprived from the real benefits of education. There is severeshortage of higher and technical education.
As regards the health services, there has been significant expansion inthese after independence. Life expectancy has also increased considerably. Healthservices have also improved due to the development of education and increasingawareness. The per capita consumption of food items has increased with theincrease in production of food materials. In 1951, the per capita dailyconsumption of food grains was 350 grams which has increased to 478 grams(in 1986-87). But due to poor purchasing power, many people in the country,are still not able to get two square meals.
Currently, there is only one hospital for every one lakh of populationand only one bed for every 1400 persons in the country. This is not at all anencouraging situation. People living in villages and urban slums are sufferingfrom water borne diseases due to the lack of drinking water. To provide forpure drinking water is a national problem. The government is trying to checkthis problem under the Rajiv Gandhi National Drinking Water Programme.Fortunately the deadly diseases like chicken pox, cholera, plague which werefrequent in earlier times, have been overcome, but the incidence of Malaria insome parts of the country has now become a subject of great worry. There islittle possibility of achieving the target of providing proper health facilities toall by the government even after having great improvement in health services.
The population in the country is not only large as compared to theavailable resources but it is also increasing at the very rapid rate. It is not onlyimportant to provide food to the people but also it is important to improvetheir standard of living. For this, greater stress is also to be laid on the issueslike health, education, social services, social security and technical education.Only then the importance of human resources can be enhanced. This valuablefeature can be found in an adept citizen, who is an invaluable resource of anycountry. A highly skilled and qualified citizen has a strong desire and naturalinstict to raise his standard of living. This reflects upon the efficient use of thelimited available resources. Therefore, so it is very important for us to conserveour environment and limited resources. Our approach towards the environmentand resources should be scientific.
EXERCISES
(I) Answer the following questions in brief :
1. What is the most important and valuable resource of a country?
2. What do you understand by development of human resource?
3. What is the most important and pathetic mistake of the Indian Planningaccording to Dr. Amertya Sen?

206
4. What problem is being faced by our country for not paying full attention to thedevelopment of Human resources?
5. What was estimated population of India at the time of Akbar' s death?
6. What were the causes of slow increase in population before Independence?
7. What was the population of India in the year 1901?
8. Why the 1921 and 1951 years have been considered as population divides?
9. What is the population of India in the year 2001?
10. What is rank of India in world from the point of view of population?
11. Write the name of the states with highest and lowest population.
12. Name the states which have population more than five crore.
13. What is the population of Punjab in the year 2001 and what is the rank of Punjabfrom the population point of view?
14. What percentage of population of India lives in Punjab?
15. How many times the population of Sikkim is less than that of Uttar Pradesh?
16. What percentage of population lives in Himalayan Mountainous region?
17. How many cities are there in India with a population less than one lakh?
18. How much percent of population of our country live in Plains.
19. How much percentage of population of our country live in villages?
20. What is the average density of population in our country?
21. Name the states having highest and lowest density of population.
22. What is density of population of India?
23. Which union territory has the highest density of population?
24. Name the elements that determine the age structure.
25. What is percentage of population that fall in the 0 – 14 years age group in ourcountry?
26. What is percentage of population fall in the 15 – 64 year’s age group in ourcountry?
27. What is the percentage of population that are voters?
28. What do you understand by sex ratio.
29. What is sex ratio of the population of the year 2001?
30. What are the rural & urban sex ratio?
31. What are the factors that are responsible for the decrease in rural and urbansex ration?
32. What is the sex ratio among the Sikh segment of our country?
33. In which two categories can we divide population of India on economic basis.
34. Which people are called main workers in India.
35. What is the percentage of main workers in our country.
36. In which state of India, the percentage of main worker is the highest.
207
37. When was the concept of classifying the people as workers and non-workersintroduced for the first time in India ceusus?
38. What percentage of labourer is there in rural areas?
39. What percentage of population is engaged in Primary Industry?
40. What is total urban population?
(II) Answer the following questions in short :
1. What problems arise due to uneven distribution of population in states?
2. What is the difference between regional distribution of population and densityof population?
3. What are the factors that affect the distribution of population?
4. What is the sex ratio of states of North India?
5. What is the importance of economic structure of population?
6. In how many catergories we can divide Main Worker Labourers, name them.
7. Why a percentage of male workers is less than female workers?
8. What negative effects are affecting Indian economy due to comparatively lessworkers engaged in manufacturing activities?
9. Why is India known as country of villages?
10. Name the languages spoken in our country.
11. What are characteristic features of regional distribution of population?
12. Which are the states those have high density of population.
13. What are the causes of high density of population in Plains?
14. What are the areas of low density of population?
15. Why is it necessary to study the structure of population?
16. Name the areas with small population.
17. Why are the Bajra Producing areas have low population?
18. What is the importance of study of age structure?
19. What are the causes of low sex ratio in India?
20. What are the causes of increase in urban population in India?
(III) Answer the following questions subjectively :
1. Explain the regional structure of density of population in India.
2. Explain in detail the state wise structure of sex ratio in India.
3. Explain the main characteristics of regional structure of distribution ofpopulation.
4. What problems are arising due to increase in urban population in metrocities?
5. Write a note on the cultural structure of population of India.
6. Write an essay on problem of population increas in India and also enlightenthe solution to this problem.

208
7. Study critically the efforts being made for the expansion of Education in India.
(IV) Show the following on the map of India.
1. Areas with high density of population.
2. Two state with high literacy.
3. States with more than five crore population.
4. Two states of highest and lowest population.
5. Areas with high growth rate of population.
*******

PART - B
ECONOMICS PORTION


211
CHAPTER 1
BASIC CONCEPTS
There are some words in Economics which have special meanings.These words are called basic concepts. Some of the basic concepts of Economicsare as given below:-
1. NATIONAL INCOME
National income is defined as the sum total of factor incomes viz. rent,wages, interest and profit accruing to the normal residents of a country fortheir productive services during a definite period of time. Income is a flow. Assuch it is related to a particular period of time. Normally this period is of oneyear duration. Thus, National Income is the earned income by the normalresidents of a country during one year.
National Product is another term synonymous to National Income. Thus,when we express the result of economic activities as the sum total of marketvalue of final goods and services produced in a country during one year, it isknown as National Product. On the other hand, when we express it by the sumtotal of the factor incomes i.e. wages, rent, interest and profit earned duringone year, then it is called National Income.
1.1 Definition
According to Durnberg, “National Income is the net factor incomeearned by normal residents of a country in the form of wages, rent, interestand profit in one year. This is the sum of domestic factor income and net factorincome.”
1.2 Example
At the time of calculation of National Income, goods and services aremultiplied by their prices. If the quantity of national product is multiplied bythe current prices we call it national income at current prices or Monetary Income.Conversely, if the quantity of national product is multiplied with the prices ofsome fixed period i.e. base year, the result obtained is called National Incomeat constant prices or Real National Income. Prices keep on changing. As a resultof it National income is subject to increase or decrease without any change inthe quantity of goods and services. In order to estimate the real economicprogress of a country, the national income of different years should be measuredat the prices of some particular period of a year. On account of constant prices,real income will only change with the change in quantity of goods and services.When depreciation is included in the national income of a country it is knownas gross national income. Conversely when depreciation is deducted, it is knownas net national income. When net factor income earned from abroad is deducted

212
from the national income then the remaining income will be called as the domesticincome. Therefore,
Net National Income = Gross National Income – Depreciation
2. PER CAPITA INCOME
Per Capita income is an important concept regarding the Country’seconomic welfare or standard of living of the people.
2.1 Definition
Per capita income is defined as the average income earned by the peopleof a country in a definite period of time.
2.2 Example :-
The per capita income is just an average income. It does not mean thatthe income of every individual in the country is equal to it. The income ofsome individuals may be more than it and the income of some may be less thanit. For example the per capita income of India in 1994-95 was Rs.8,237 and thatof Punjab it is Rs. 68998 in 2010-11.
Per capita income is calculated by dividing the national income bypopulation i.e.
Per capita Income = National I
Population
ncome
Per capita income at current prices is known as monetary per capitaincome or at constant prices it is known as real per capita income.
It is not necessary that an increase in the national income of a countrywill always lead to an increase in the standard of living of the people. Standardof living of the people depends on per capita income. For example, suppose thereal national income of a country increases by 4% per annum and there is also4% increase in population growth, then there will not be any increase in percapita income. It means there is no increase in the standard of living of thepeople or rate of economic development of the country. Therefore, the rate ofeconomic growth of a country will increase only when there is continuous growthof real per capita income.
3. CONSUMPTION
The word consumption is used in two senses. In the first sense as aprocess and in the second as an expenditure. In the sense of a noun it is theactivity which satisfies human wants directly like the use of water for quenchingthirst and use of food for the satisfaction of hunger etc. Thus consumption isthat process by which a person uses the utility of a good in order to satisfy hiswants. In the expenditure sense consumption means that total expenditure whichis incurred on the consumption goods.

213
Under national income whatever many people spend on the purchase ofgoods and services for the direct satisfaction of their wants is called consumptionor total consumption expenditure. Suppose, the total income of an economy isRs.2,000 crore, out of which Rs.1,500 crore is spent on the consumption of goodsand services, then it will be said that total consumption expenditure of aneconomy is Rs.1,500 crores and savings are of Rs.500 crores because
Income = Consumption + Saving.
or 2000 crores = Rs (1500 + 500) crores.
Here, we use the word consumption in the senses of total expenditure.
3.1 Definition
Consumption means expenditure made on consumption during one yearin an economy.
3.2 Example
Consumption depends on many factors like income, price of commodity,fashion etc. Thus it can be said that consumption is a function of many factors,means it depends on many factors. Income has the most effect on theconsumption. In the words of keynes, “total consumption expenditure of aneconomy mainly depends on income”. It can be said that consumption is afunction of income, which means it depends on income. Generally with the risein income consumption also increases but increase in consumption is less thanthat of income. There will be how much change in consumption in comparisonto the change in income it depends on the propensity to consume. Propensityto consume is of two types, like
(i) Average Propensity to consume (APC)
The ratio of total consumption to total income is called average propensityto consume. This implies that people will spend how much part of their incomeon consumption and how much part they save. This is obtained by dividing theconsumption by the income or
Average Propensity to Consume = Consumption
Income
For example when out of the income of Rs.100 crores, Rs.80 crores arespent on consumption then
Average Propensity to Consume = 80
100 =
8
10 = 0.8 or 80%
This implies that people spend 80% of their income on consumption andthey save 20%.

214
(ii) Marginal Propensity to Consume (MPC)
The ratio of change in consumption to change in income is calledmarginal propensity to consume i..e.
Marginal Propensity to Consume =Change in
Change in
Consumption
Income
For example if income increases from Rs.100 crores to Rs.200 crores
then change in income is Rs.100 crores (Δy = Rs.200 crores – Rs.100 crores =Rs.100 crores)
Let us suppose that on account of change in income consumption increasesfrom Rs.80 crores to Rs.120 crores, than change in consumption is
Rs.40 crores (ΔC = Rs.120 crores – Rs.80 crores = Rs. 40 crores)
Therefore Marginal Propensity to Consume = 40
100 = .4 or 40%
This shows that with the increase in income people will spend 40% of iton consumption and save 60% of it. Marginal propensity to consume is morethan zero (0) and less than one (1). Rise in income leads to increase inexpenditure but increase in expenditure is not as much as there is increase inincome. Thus, increase in consumption is less as compared to the increase inincome.
4. SAVING
After deducting consumption from income whatever amount remains itis called saving. The difference between income and consumption is called savinglike –
Saving = Income – Consumption
4.1 Definition :
According to keynes, “In fact saving is more than the consumptionexpenditure. If for example, an economy is generating income worth Rs.2000crores and its consumption expenditure is Rs.1,500 crores, then saving will beof Rs.500 crores (Rs.2,000 crores – Rs.1,500 crores = Rs.500 crores)
Like consumption saving is also a function of income.
Thus, Saving depends on level of income. Generally saving increaseswith the increase in income and decreases with the decrease in income. Therelationship between saving and income is expressed by propensity to save.Propensity to save of two types: (i) Average Propensity to Save (ii) MarginalPropensity to Save.
215
(i) Average Propensity to Save (APS)
Average propensity to save is the ratio between total saving and totalincome at a given level of income.
Average Propensity to Save (APS) = Saving
Income
For example, if income is Rs.100 crores and the saving is Rs.20 croresthen Average Propensity to Save i.e.
APS = 20
100 = 0.2 or 20%
(ii) Marginal Propensity to Save (MPS)
Ratio of change in saving caused by change in income is called MarginalPropensity to Save.
MPS = Change in
Change in
Saving
Income
If, for example, income increases from Rs.100 crores to Rs.200 crores, it
means there is change of Rs.100 crores in income i.e. (ΔY = Rs.200 crores –Rs.100 crores = Rs.100 crores). Consequently if saving rises from Rs.20 crores
to Rs.80 crores then there will be Rs.60 crores change in saving i.e., (ΔS = Rs.80crores – Rs.20 crores = Rs.60 crores). Therefore,
Marginal Propensity to Save (MPS) = 60
100 = 0.6 or 60%
It indicates that 60% of the income is saved.
5. INVESTMENT
In Economics, “Addition to capital is called Investment.” During a yearthat part of income which is not spent on consumption but is saved for the useof capital formation is called investment. When production is more thanconsumption during an accounting year, that is called Investment.
5.1. Example
Machines, tools and equipments, raw-materials, rails, roads, buildings,industries means of transport etc. are the examples of investments. Investmentis that part of production which is used for further production of goods andservices. Investment means, “Increase in real capital which leads to generationof income.”

216
5.2 Definition
According to Prof. J.R. Hichs, “An addition in capital stock is calledinvestment.”
5.3. Determinants of Investment
Investment mainly depends upon two factors; one is, rate of profit andthe other is, rate of interest. Rate of profit is also called as marginal efficiencyof capital.
Every producer compares the rate of profit viz marginal efficiency ofcapital and rate of interest at the time of investment. He will continue to makeinvestment, till MEC or rate of profit and rate of interest are equal. If theexpected profit is greater than the rate of interest, the entrepreneur will increasethe investment. On the contrary, if the rate of interest appears to be higherthan expected profit, then there will not be any inducement to invest.
5.4 Types of Investment
Investment is mainly of two types:
(i) Induced investment
(ii) Autonomous investment
(i) Induced Investment
Induced investment is that investment which depends upon the level ofincome and profit. It increases with the expectation of rise in income and profitand it decreases with the decrease in its expectation.
(ii) Autonomous Investment
Autonomous investment is that investment which is independent of thelevel of income. It is not influenced by the expected rate of profit. In fact, it isthat investment expenditure which is incurred by the government with a viewto promote the level of aggregate demand in an economy, when level ofaggregate demand falls short of aggregate supply (resulting in fall in the levelof prices and there is reduction in rate of profitability and increase inunemployment) the government intends to push up the level of aggregatedemand by way of its own investment – expenditure. Therefore autonomousinvestment becomes independent of the expectation of profitability and levelof income.
In addition to above, there are other types of investments like grossinvestment and net investment.
(iii) Gross Investment
Total production of capital goods in an economy during one year iscalled gross investment. This include two types of investments i.e. one is net

217
investment and other is replacement investment. Replacement investment is
that investment which is to be done on the modernisational or replacement
due to the depreciation of capital. It maintains the present level of investment.
Therefore;
Gross Investment = Net investment + Replacement Investment.
(iv) Net Investment
Net investment is that investment which results in an increase in captial
stock. Deduction of replacement investment or depreciation expenditure from
gross investment we can find net investment. Therefore;
Net Investment = Gross Investment – Cost of Depreciation
In fact net investment results in capital formation.
6. CAPITAL FORMATION
In Economics, that part of income by which more production is possible
than before, is called capital formation. The part of income which is not spent
on consumption is called saving. If we spend our savings to increase the quantity
of capital goods like machines, tools, industries, stock of raw-material or final
products etc. then it is called investment. As a result of investment capital
goods are produced. An addition to capital stock is called capital formation.
Meaning :– Nowadays, the meaning of word capital formation is taken in two
senses:-
(i) Limited Meaning of Capital Formation
According to the limited meaning of capital formation only an addition
in the physical stock of physical goods like machines, buildings, industries,
raw-material etc is called capital formation.
(ii) Broader Meaning of Capital Formation
According to the broader meaning of capital formation, an addition in
the physical stock of capital is not only called capital but it also includes social
overhead cost like roads, bridges, rails, canals or increases in human qualities.
In fact, the capital formation means addition in the stock of physical and human
capital.
6.1 Definition
According to Todaro “Capital formation takes place at a time when
part of current income is saved and the same is invested to increase in future
income and output. e.g. new industries, machines, tools and raw material etc,
promotes physical capital of any nation. Similarly investment in human factors
can increase their efficiency”.

218
6.2 Type of Capital Formation
Capital formation can be of two types:-
(i) Gross Capital formation and
(ii) Net Capital formation
(i) Gross Capital formation means total investment. This includesboth net investment and replacement investment or depreciation.
(ii) Conversely, net capital formation means an addition to netinvestment. In order to find out net investment, depriciationetc. is to be subtracted from gross investment. In fact, Capitalformation means an addition to net investment.
7. DISGUISED UNEMPLOYMENT
In many underdeveloped countries of the world the population growthis more but sources of employment are less. Thus large number of people remainunemployed in these countries. The main occupation of these countries isagriculture. This is the only occupation in which people get some whatemployment. Due to lack of employment opportunities in other occupations allthe members of a family engage themselves to work in agriculture. As a resultmore people are doing the same work which can be done by few people. Thusunemployment is disguised in this way.
7.1. Definition
When more number of labourers are engaged in a work than actuallyrequired for it, then excess workers unemployment is termed as disguisedunemployment. Under such a situation less number of workers for work areneeded as compared to the more number of workers actually engaged in thatwork. It means there are some extra or excess workers engaged in that work.
7.2 Example
In underdeveloped countries, due to the lack of employmentopportunities in industries and other fields people are doing work in their ownfamily farms. If some of the workers are withdrawn from the agricultural farms,even then total production will not change. Though such people seems to beemployed but actually they are disguised unemployed. This can be explainedwith the help of an example. Suppose any family has a farm of 4 acres. Fourmembers of that family can work efficiently in this farm with the existingmethods of cultivation. But if that family has 8 members and due to the shortageof employment opportunities in other fields, all of the 8 workers are employedin that farm, then it will be said that out of these 8 only 4 workers are actuallydisguised unemployed. But no one from this lot will consider himself asunemployed worker because all the members are doing some what work.Actually they are doing some part of others work. If four out of these workers

219
are withdrawn from work even then total production will not change. Thus,their unemployment is called disguised unemployed.
8. FULL EMPLOYMENT
Generally full employment is a situation in which no body is unemployed.In reality it is not an appropriate concept. In the full employment situationthere are so many kinds of unemployments. According to classical economiststhe full employment means a situation in which generally all the people getemployment who are willing to work at the prevailing rates of wages.
8.1 Definition
As per Prof Lerner, “Full employment is that situation in which all thepeople who are willing to work at current rates of wages and they get workwithout any difficulty.”
According to Prof Hansen, “Full employment means non-existence ofinvoluntary unemployment.”
Involuntary unemployment is a situation when workers are ready towork at current rates of wages but they do not find any work.
Classical economists agree that such a situation is not generally possiblebut they also agree if there is no involuntary unemployment and other types ofunemployments are found even then such a situation will be called fullemployment.
8.2 Different types of Unemployment Under Full EmploymentSituation
As per classical economists following types of unemployment are foundin the full employment situation.
(i) Voluntary Unemployment
When labourers are not ready to work at the existing rates of wages orare not willing to work on their own will and inspite of the availability of thework then such an unemployment will be called Voluntary Unemployment.
(ii) Frictional Unemployment
This unemployment arises due to the shortage of raw-materials,immobility of labourers, inadequancy of speical kinds of employmentopportunities or due to the wear and tear of machinery.
(iii) Seasonal Unemployment
This unemployment arises due to the changes in season, fashion andinterests. For examples, ice factories are closed during winter season.
(iv) Structural Unemployment
This unemployment rises due to the structural changes in the economy,like changes due to the exports etc.

220
(v) Technical Unemployment
This unemployment arises due to the changes in the techniques ofproduction, like when the labourers do not know how to operate new machinesetc.
Despite the existence of above mentioned unemployments, if there isno involuntary unemployment than such a situation will be called fullemployment.
9. INFLATION
According to Dictionary, the english word ‘inflation’ means ‘expansionor Increase’. When air is filled in the bladdar of the football, there it getsinflated. Similarly, in relation to price level ‘inflation’ means constant rise inprices. In Economics, the constant rise in prices is called inflation.
9.1 Definition
(i) According to Shapiro, “Inflation is a continuous and extreme rise ingeneral price level.”
(ii) According to Peterson, “The specific meanings of inflation is thepermanent and continous increase in the general price level”.
9.2 Example
In India, since the end of the First Five Year Plan (1956), the price levelis constantly rising. For example, in 1956 the petrol price was Rupee one perlitre which increased to Rs. 69/- per litre in 2012. In 1956, the Gold was Rs.100/-per 10 Gms, which increased to Rs. 33000/- per 10 gms in 2012. Inflation rate in2011 was 9 percent whereas it fell down to 6.6 percent in January 2012.
Inflation can be shown with the help of price index. Price index is thatnumber by which we know that in comparison to a particular year (which iscalled a base year) how much changes takes place on an average price levelduring the current year.
There can be many reasons for inflation but the main cause is thatdemand for goods is more than their supply. When the demand for goodsexceeds their supply then prices start increasing and the problem of inflationarises.
10. SUPPLY OF MONEY
Generally money supply means currency and deposits of banks availablewith the people of the country.
10.1 Definition
Few definitions of the supply of money are given as following:

221
(i) According to M.R. Edgemond, “Supply of money means currency anddemand deposits available with non-banking public.”
(ii) Following concepts of money supply are given by Reserve Bank of India:
M1 = Currency with Public + Demand Deposits + Other Deposits
of Banks with R.B.I.
M2 = Currency with + Demand Deposits + Other Deposits +Deposits of Post
Public of Banks of R.B.I. Office Saving Banks
M3 = Money with + Demand Deposits + Other deposit + Time deposits
Public of Banks of R.B.I. of Banks
M4 = Money with + Demand Deposits + Deposits + Time deposits
Public of Banks of R.B.I. of Banks
+ total deposits of Post Office Saving Banks.
10.2 Supply of Money in India
Following factors are included in the supply of money in India:-
(i) Currency Notes and Coins available with public (total amount of depositsin Government treasury, excluding the currency of banks and state co-operative banks).
(ii) Demand deposits of banks and State Co-operative banks (Excludinginter demand deposits of banks).
(iii) Amount of other saving accounts of R.B.I.
(Excluding the deposit amount of the accounts of International MonetaryFund).
10.3 Elements of Supply of Money
The elements of the supply of money are given as follows:
(1) Currency :
It includes those notes and coins which are in circulation. In India, coinsare issued by Govt. of India. Coins in the denomination of Rs.10, Rs.5, Rs.2,Rs.1, Paise 50, Paise 25, are in circulation in India. In our country note of Reone is issued by the Ministry of Finance of the Govt. of India and rest of thenotes are issued by Reserve Bank of India. Reserve Bank issue the currencynote of Rs.1000, Rs.500, Rs.100, Rs.50, Rs.20, Rs.10, and Rs.5 By keeping reserveof gold and foreign exchange worth Rs.200 crores, Reserve Bank can issue thecurrency notes of any denomination.
(2) Bank Deposit
Bank deposits are of two types i.e. Time deposit and Demand deposit.

222
Time deposit is for a fixed period of time. Such type of deposit can not bewithdrawn with cheque whereas the amount kept in the form of demand depositcan be withdrawn at any time by the will of depositor. Generally supply ofmoney includes demand deposits.
11. GOVERNMENT BUDGET
Every government prepares the detailed account of its estimated revenueand expenditure. It is called Government Budget. Indian Government generallypresent its budget in Lok Sabha on Feb 28th of every year.
11.1 Definition
Government Budget is an annual statement of estimated revenue andexpenditure of the government.
11.2 Types of Budget
The government budget can be of three types:-
(i) Balanced Budget
A balanced budget is that budget in which revenue and expenditure ofthe government are equal.
(ii) Surplus Budget
Surplus budget is the budget in which revenue of government exceedits expenditure. As a result of it, there is a deficiency in the aggregate demand.Such type of budget is suitable for a situation when there is increase in aggregatedemand.
(iii) Deficit Budget
The deficit budget is the budget in which expenditure of the governmentexceeds its revenue. As a result aggregate demand increase. Such type of budgetis suitable when there is a situation of deficiency of aggregate demand.
11.3 Example
Following are the main items of the Budget of Government of India:-
(a) Items of Revenue :- Corporation tax, income tax, import-export duty,excise duty, central sale tax, interest and income from governmententerprises.
(b) Main Items of Expendiutre :- Defence, police, Administration, education,health, social welfare, industry, agriculture, planning, rural developmentetc. As per proposed budget of 2011-12 govt. of India estimated therevenue of Rs. 7,89,892 crores and expenditure of Rs. 12,57,729 crores.
12. DEFICIT FINANCING
Deficit financing is the method by which government meets thebudgetary deficits by taking loans from the Central Bank. Central Bank meetsthis deficit by printing new currency notes. Consequently money supply increasesand prices are expected to rise. Deficit financing is one method to meet the

223
deficit of Govt. Budget. When aggregate expenditure exceeds aggregate revenuethen the government has to face deficit. When any of the following methods istaken in order to meet this deficit, then it is called deficit financing.
(i) Borrowing from Central Bank by government to meet the deficit. CentralBank gives this loan by printing new currency notes.
(ii) This deficit is met by taking out the cash balance from governmenttreasury.
(iii) To issue new currency notes by the govt. other than already issued bythe Reserve Bank of India.
By applying the above three methods there is an increase in the supplyof money in the country. In India the major portion of the Deficit financing ismet by taking loans from the Reserve Bank. Government gives governmentsecurities to Reserve Bank in return for taking loans. Reserve Bank prints newnotes by keeping government securities in reserve fund and gives loan to thegovernment. In this way, the supply of money increases which results in risein the price level.
12.1 Definition
According to Dr.V.K., R.V. Rao, “ When the Government delibratelykeeps the differences in public revenue and expenditure and creates deficit inthe Budget and meets this deficit by such method which increases the supplyof money, then it is called deficit financing.”
13. PUBLIC FINANCE
It is the combination of two words i.e. Public + Finance. Public meansgroup of people who are represented by the government and finance meansmonetary factor. Thus Public Finance means the financial sources of thegovernment i.e. revenue and expenditure. That portion of economics in whichthe problems of revenue and expenditure are discussed is called public finance.Thus, public finance is the study of the problems of government institutionsconcerning central, state and local governments. Public finance includes revenueof government i.e. tax, interest, profit etc. Public expenditure includes defence,Administration, education, health, industries, agriculture etc. Public debts arealso studied under Public Finance.
The economic activities of the government of the country have also increasedwith the passage of time. The area of public finance has also been widened. Itstudies not only the revenue and expenditure of the government but it alsostudies all economic activities of the Govt. concerning special economic objectiveslike full employment, economic development, income and equal distribution ofwealth, price stability etc.

224
13.1 Definition
According to Westuble, “ In Public Finance, alongwith the study ofincome and expenditure of the government administration, their inter-relationship, financial control and management are also studied.”
13.2 Sources of Income of Government
The main sources of income of government are taxes which are of twotypes:
(i) Direct tax (ii) Indirect tax
(i) Direct Tax
According to Prof. Dalton, “Direct tax is that which is paid by the sameperson on whom tax has been imposed legally.” For example income tax, gifttax, corporation tax, wealth tax, property tax etc. are the examples of directtaxes.
(ii) Indirect tax
Indirect tax is defined as that form of taxes which are imposed on goodsand services. These taxes are imposed indirectly on public.
According to Prof. Dalton, “ Indirect taxes are those which are imposedon an individual but are liable to be paid partly or fully by some otherindividual. For example Sale tax is an indirect tax. This tax is paid by shopkeepersbut whole liability of this tax is shifted on the customer because the shopkeepercharges the sales tax from the customer. The examples of indirect taxes are saletax, excise duty, entertainment tax, export-import duty etc.
14. PUBLIC DEBT
Every government takes many types of loans in order to meet itsexpenses. These loans are called public debts. Public debts means all types ofloans taken by the government. It include both types of loans taken from internalas well as external sources of a country.
14.1 Definition
As per Prof. Taylor, “Public debt is the loan taken by the governmentfrom commercial banks, trading institutions and individuals.”
14.2 Types with Examples – Public debt is mainly of two types:-
(i) Internal Debt :– Internal debts are those debts which can be taken fromthe public as well as financial institutions within the country. These areobtained in the monetary currency of the country. Its principal andinterest are also paid in the currency of the country. Indian governmentcollects internal debts by issuing different types of bonds like IndiraVikas Patra, National Saving Certificates, National Saving Scheme etc.
225
(ii) External Debt :– External debts are debts which are obtained fromforeign and international institutions, foreign banks etc. These are takenin the shape of foreign exchange. The principal and the interest of allthese debts are to be repaid in the form of foreign exchange.
15. POVERTY LINE
One method to measure the poverty of any country is the concept ofpoverty line. The number of people below the poverty line are considered tobe poor.
15.1 Definition
The concept of poverty line means that money which is necessary foran individual for the minimum level of consumption. The level of poverty lineconsidered to be equal to that amount which is essential for the survival of anindividual to fulfill the minimum monthly requirements. Minimum needs includeminimum human necessities of food, clothing, housing, education and healthetc. Non-fulfilment of these minimum needs cause lot of sufferings and distressto the human being and as a result there is a loss of their health and efficiency.Consequently, to increase production or to get rid of poverty in future becomesdifficult. Poverty and fall in productivity are thus inter-related.
15.2 Extent of Poverty Line in India
With the change in the level of prices the extent of poverty line alsochanges. Expert Committee appointed by the Planning Commission in 1962 hadadopted the minimum consumption level in order to fix the poverty line. Asper the committee, those people will be considered below the poverty linewhose monthly consumption is less than Rs.20 per month on the prices of 1960-61. In 1968-69, the people getting less than Rs.40 were considered to be belowpoverty line. According to the above given yardstick, the population belowpoverty was 17.67 crores and 21.6 in the year 1960-61 and 1968-69 respectively.On account of rise in the cost of living index in year 1976-77, the people wereconsidered to be below poverty line whose income was below Rs.62 in ruralareas and Rs.71 in urban areas. In 1977-78 the number of such people in ruraland urban areas was 23.9 crores and 5.5 crores respectively.
According to the approach of Sixth Five Year Plan those people will beconsidered to be below poverty line whose monthly consumption expenditurebased on the prices of 1979-80 was less than Rs.76 in rural areas and Rs.88 inurban areas. The number of such people was 26 crore in rural areas and 5.7crore in urban areas. So 31.7 crore population was living below the povertyline in the entire country. According to the organised group under Sixth FiveYear Plan, at 1984-85 prices, an expenditure of Rs.107 per person for rural areasand Rs.122 per person for urban areas was considered to be below povertyline.

226
According to Seventh Plan, at 1988-89 prices, per month consumption ofRs.152 in urban areas and of Rs.132 in rural areas was considered to be belowpoverty line. According to the National Sample Survey, at 1993-94 prices, peoplespending Rs.229 in rural areas and Rs.264 in urban areas will be considered tobe below poverty line. In 2009-10 those peope will be considered below thepoverty line whose daily consumption is Rs 28.65 in urban areas and Rs 22.42in rural areas.
According to National Income Survey, the number of persons livingbelow the poverty line was 20 crore in 1987-88. In 1993-94, 32 crore peoplewere living below poverty line in the country. This was 36% of the totalpopulation. In 1993-94, 35% people in rural areas and 41% people in urbanareas were living below the poverty line. So the number of people living belowthe poverty line is continuously increasing. In 1996-97, 30% of the total populationwas living below the poverty line. According to the economic survey- 2007-08
26 Crore people are poor in India. More then 1
5 of poor in world line in India.
In India the number of poor people is different in different states. It isestimated that maximum number of poor people are in U.P., Bihar, M.P. andOrissa. In the year 2009-10, In U.P. 37.7%, in Bihar 53.5%, in Orissa 37% and inTamil Nadu 17.1% of population is living below poverty line. In Punjab 15.9%population, which means minimum of all other states is living below the povertyline. In Haryana 20.1% and in H.P. 9.5% population is living below povertyline.
16. GROWTH RATE
The economic progress of every economy is explained by growth rate.Growth rate implies that in comparison to a particular year with any otheryear how much percentage change took place in any economic element e.g.national income, per capita income etc. Growth rate is always expressed inpercentages.
16.1 Definition
Growth rate is that percentage rate from which it is known that incomparison to one year how much percentage change has taken place in nationalincome or per capita income in any other year.
16.2 Example
The calculation of growth rate can be made clear with the help of anexample. Suppose in 1996 per capita income in India was Rs.8000. This increasedto Rs.10,000 in 1997. The growth rate of per capita income can be achieved withthe following method:-
Change in per capita income in 1997 as compared to 1996
= Rs.10,000 – Rs.8000 = Rs.2000
Original per capita income = Rs.8000
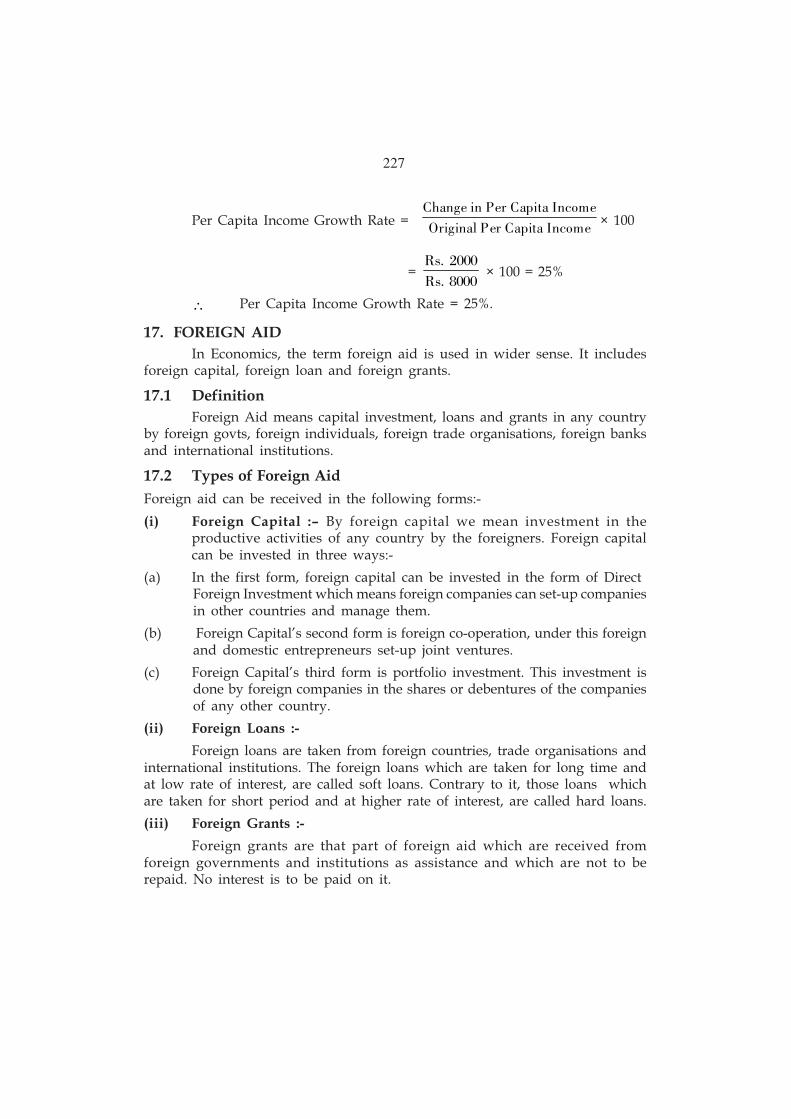
227
Per Capita Income Growth Rate = Change in
Original P
Per Capita Income
er Capita Income × 100
= Rs
Rs
.
. 8000
2000 × 100 = 25%
∴ Per Capita Income Growth Rate = 25%.
17. FOREIGN AID
In Economics, the term foreign aid is used in wider sense. It includesforeign capital, foreign loan and foreign grants.
17.1 Definition
Foreign Aid means capital investment, loans and grants in any countryby foreign govts, foreign individuals, foreign trade organisations, foreign banksand international institutions.
17.2 Types of Foreign Aid
Foreign aid can be received in the following forms:-
(i) Foreign Capital :– By foreign capital we mean investment in theproductive activities of any country by the foreigners. Foreign capitalcan be invested in three ways:-
(a) In the first form, foreign capital can be invested in the form of DirectForeign Investment which means foreign companies can set-up companiesin other countries and manage them.
(b) Foreign Capital’s second form is foreign co-operation, under this foreignand domestic entrepreneurs set-up joint ventures.
(c) Foreign Capital’s third form is portfolio investment. This investment isdone by foreign companies in the shares or debentures of the companiesof any other country.
(ii) Foreign Loans :-
Foreign loans are taken from foreign countries, trade organisations andinternational institutions. The foreign loans which are taken for long time andat low rate of interest, are called soft loans. Contrary to it, those loans whichare taken for short period and at higher rate of interest, are called hard loans.
(iii) Foreign Grants :-
Foreign grants are that part of foreign aid which are received fromforeign governments and institutions as assistance and which are not to berepaid. No interest is to be paid on it.

228
18. BALANCE OF PAYMENT
Different countries of the world trade with each other. They trade ingoods, services and capital. The goods and services received by a country fromother countries are called imports e.g. India imports petrol from Iran. On thecontrary, the goods and services sent by one country to other countries arecalled exports. For example, India exports tea to Iraq. One country has to makepayment to other countries for imports and other countries get money forexports. The account of receipts and payments of the govt of one country fromother countries during a period of one year is called Balance of Payments.
18.1 Definition
In the words of Kindal Burger, “A country’s balance of payment is thechronological record of economic transactions done by the residents of thatcountry with the foreigners.”
18.2 Items of Balance of Payment
Items of balance of payment can be divided into two parts”-
(1) Items of Current Account :– The main items of current account are asfollows :–
(i) Import and export of tangible goods e.g. cloth, machines, tea etc.which are clearly visible. The difference in import and export ofthese goods is called Balance of Trade.
(ii) Intengible or invisible goods e.g. the services given by Insurancecompanies, banks, doctors, engineers, shipping, foreign travels, govt.transactions, investment, income, charity, gift tax and advertisementetc. are included in the items of current account of imports andexports.
(2) Items of Capital Accounts :– The main items of capital account are privateloans, bank capital, govt. capital, import and export of gold etc.
If imports on current account are more than exports then balance ofpayment is of dificit or unfavourable nature as India’s balance of payment is ofdeficit or unfavourable nature. This deficit is corrected through capital account.This deficit is corrected either by sending gold or foreign currency or by takingloans from foreign countries. If exports are more than imports then balance ofpayment becomes favourable. As a result of it there is a flow of gold or foreigncurrency. If exports and imports are equal then balance of payment is favourable.Infact deficit or surplus on current account is balanced through capital account.Therefore, it is said that balance of payment is always balanced.
19. MONETARY POLICY
Monetary policy is that policy through which the govt. of any countryor the Central Bank in order to achieve certain objectives controls,

229
(i) the supply of money
(ii) the cost of money or rate of interest and
(iii) the availability of money
Main aims of monetary policy :– (I) Stability of price (II) Full employment(III) economic development (IV) Stability in Exchange Rate (V) Decreasein economic inequality.
19.1 Definition
According to D.C Austen, “ Monetary policy is related to affect the leveland structure of aggregate demand by controlling the rate of interest and theavailability of credit.”
19.2 Methods of Monetary Policy
Following are the main methods of monetary policy which are adoptedby Central bank i.e. Reserve Bank to control the credit:-
(i) Bank Rate :– Bank rate is an important method of credit control. Bankrate is that rate of interest at which the Central Bank of the countryprovides credit to other banks. With the increase in bank rate, the rateof interest increases and credit becomes costly. On the contrary, if bankrate declines, credit becomes cheaper. In order to overcome depressionthe bank rate is lowered. As a result of it, credit creation takes placeand there is increase in demand. In order to overcome inflation, bankrate is increased and as a result of it there is credit contraction andthere is decrease in demand.
(ii) Open Market Operations :– By open market operations we mean buyingand selling of securities in the open market by the Central Bank of thecountry. During depression central bank purchases securities. As a resultof it, there is increase in the direct and indirect cash reserved with thebanks. With the increase in cash reserves, there is multiple increase inthe accumulated cash balances. As a result of it, there is credit expansionand increase in demand. During inflation, central bank sells the securities.As a result of it, the cash reserve with the banks are reduced. With thereduction in cash reserves, there is multiple decrease in the accumulatedcash balances with the banks. Consequently, there is credit contractionand decrease in demand.
(iii) Change in Minimum Reserve Ratio :– All the banks are required tokeep a fixed percentage of cash reserves with the central bank. Forexample, if the minimum CRR is 10% and a bank has cash reserves ofworth Rs.100 crores, then it will have to deposit Rs.10 crores with theCentral Bank and with the balance of Rs.90 crores it will create morecredit. If the CRR is lowered then banks will be able to create morecredit which means they will be able to provide more credit. During
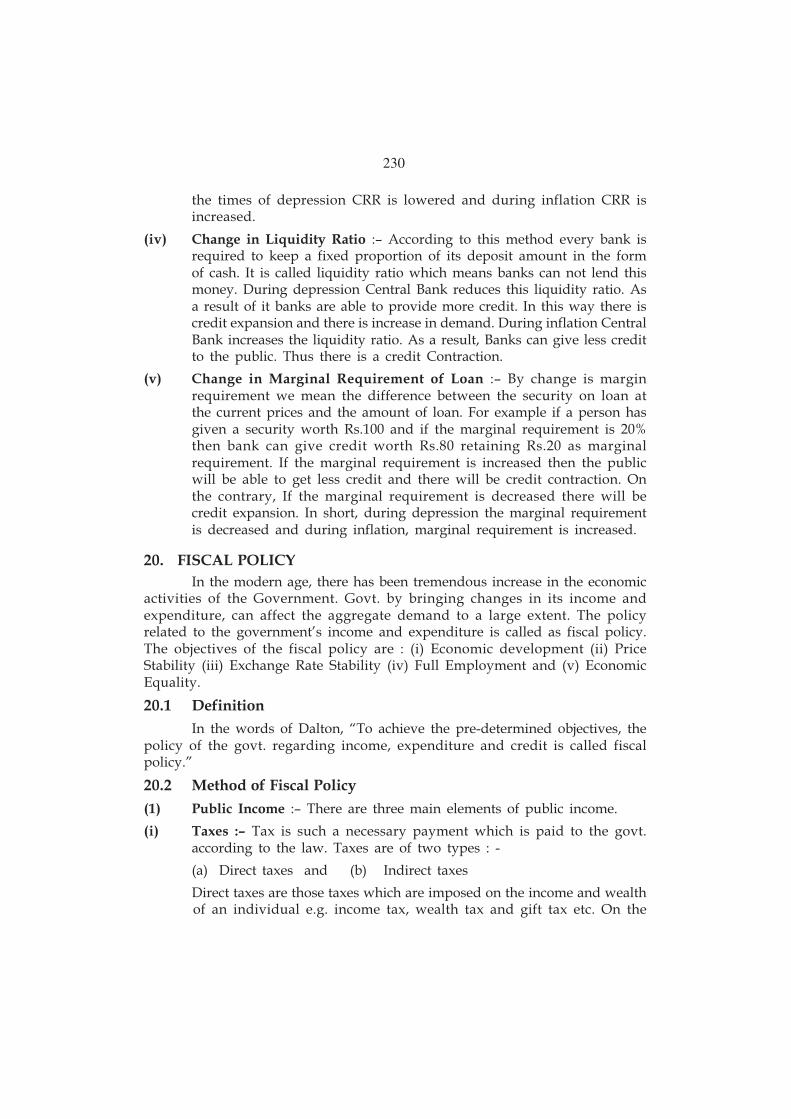
230
the times of depression CRR is lowered and during inflation CRR isincreased.
(iv) Change in Liquidity Ratio :– According to this method every bank isrequired to keep a fixed proportion of its deposit amount in the formof cash. It is called liquidity ratio which means banks can not lend thismoney. During depression Central Bank reduces this liquidity ratio. Asa result of it banks are able to provide more credit. In this way there iscredit expansion and there is increase in demand. During inflation CentralBank increases the liquidity ratio. As a result, Banks can give less creditto the public. Thus there is a credit Contraction.
(v) Change in Marginal Requirement of Loan :– By change is marginrequirement we mean the difference between the security on loan atthe current prices and the amount of loan. For example if a person hasgiven a security worth Rs.100 and if the marginal requirement is 20%then bank can give credit worth Rs.80 retaining Rs.20 as marginalrequirement. If the marginal requirement is increased then the publicwill be able to get less credit and there will be credit contraction. Onthe contrary, If the marginal requirement is decreased there will becredit expansion. In short, during depression the marginal requirementis decreased and during inflation, marginal requirement is increased.
20. FISCAL POLICY
In the modern age, there has been tremendous increase in the economicactivities of the Government. Govt. by bringing changes in its income andexpenditure, can affect the aggregate demand to a large extent. The policyrelated to the government’s income and expenditure is called as fiscal policy.The objectives of the fiscal policy are : (i) Economic development (ii) PriceStability (iii) Exchange Rate Stability (iv) Full Employment and (v) EconomicEquality.
20.1 Definition
In the words of Dalton, “To achieve the pre-determined objectives, thepolicy of the govt. regarding income, expenditure and credit is called fiscalpolicy.”
20.2 Method of Fiscal Policy
(1) Public Income :– There are three main elements of public income.
(i) Taxes :– Tax is such a necessary payment which is paid to the govt.according to the law. Taxes are of two types : -
(a) Direct taxes and (b) Indirect taxes
Direct taxes are those taxes which are imposed on the income and wealthof an individual e.g. income tax, wealth tax and gift tax etc. On the
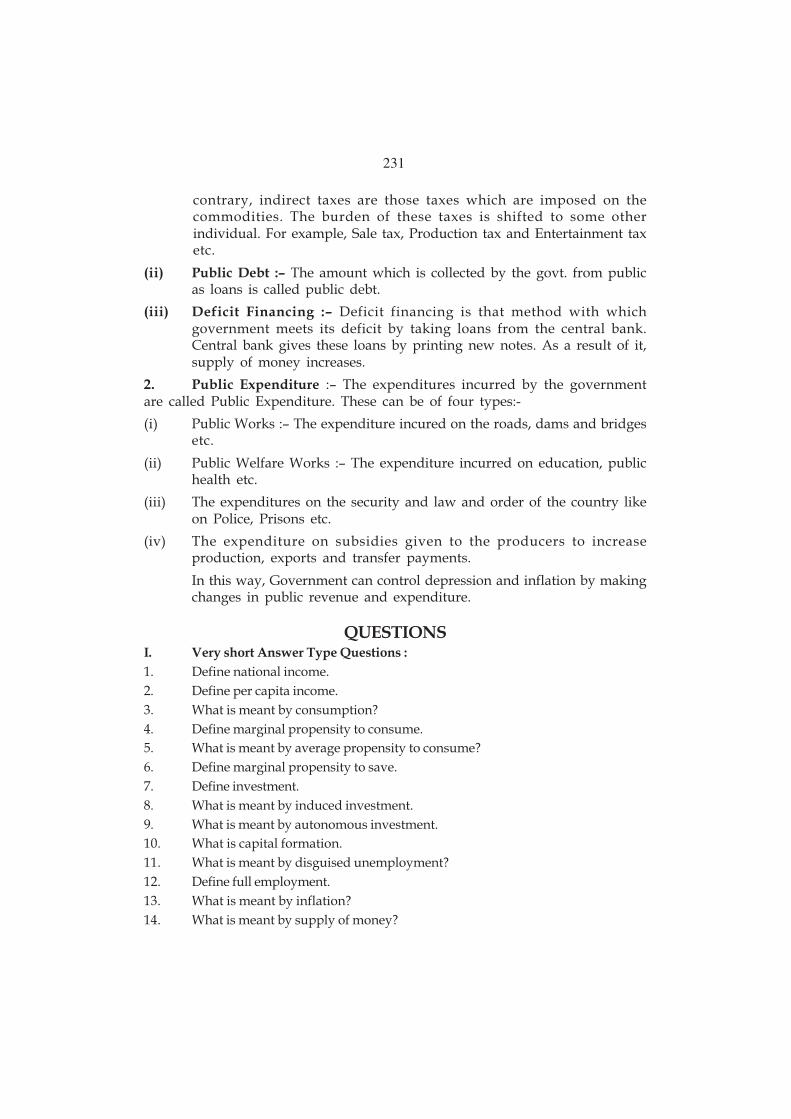
231
contrary, indirect taxes are those taxes which are imposed on thecommodities. The burden of these taxes is shifted to some otherindividual. For example, Sale tax, Production tax and Entertainment taxetc.
(ii) Public Debt :– The amount which is collected by the govt. from publicas loans is called public debt.
(iii) Deficit Financing :– Deficit financing is that method with whichgovernment meets its deficit by taking loans from the central bank.Central bank gives these loans by printing new notes. As a result of it,supply of money increases.
2. Public Expenditure :– The expenditures incurred by the governmentare called Public Expenditure. These can be of four types:-
(i) Public Works :– The expenditure incured on the roads, dams and bridgesetc.
(ii) Public Welfare Works :– The expenditure incurred on education, publichealth etc.
(iii) The expenditures on the security and law and order of the country likeon Police, Prisons etc.
(iv) The expenditure on subsidies given to the producers to increaseproduction, exports and transfer payments.
In this way, Government can control depression and inflation by makingchanges in public revenue and expenditure.
QUESTIONSI. Very short Answer Type Questions :
1. Define national income.
2. Define per capita income.
3. What is meant by consumption?
4. Define marginal propensity to consume.
5. What is meant by average propensity to consume?
6. Define marginal propensity to save.
7. Define investment.
8. What is meant by induced investment.
9. What is meant by autonomous investment.
10. What is capital formation.
11. What is meant by disguised unemployment?
12. Define full employment.
13. What is meant by inflation?
14. What is meant by supply of money?

232
15. Write a note on government budget.
16. What is meant by deficit financing?
17. How many people are considered to be below poverty line in India?
18. How growth rate is determined?
19. What is meant by foreign aid?
20. Define balance of payment.
21. What is meant by monetary policy?
22. What is meant by fiscal policy?
II. Short Answer Type Questions :
1. Define National Income. What is the difference between National Income andDomestic Income?
2. What is meant by Per Capita Income? How can you estimate Per Capita Income?
3. What do you mean by Consumption? Define Average Propensity to Consumeand Marginal Propensity to Consume.
4. What do you mean by Savings? Define Average Propensity to Save and MarginalPropensity to Save.
5. Define Investment. What are the elements of determining the Investment?
6. What is meant by Capital Formation? What is the difference between Gross CapitalFormation and Net Capital Formation?
7. Define Disguised unemployment. Explain it with the help of an example.
8. What is meant by full employment? What is the meaning of structuralunemployment and Technical Unemployment?
9. What is meant by inflation? Explain it.
10. What is the meaning of supply of money? Explain the concepts of supply ofmoney given by Reserve Bank of India.
11. What is Budget? What are the main components of income and expenditure inthe budget of Indian Govt?
12. Define deficit financing? What methods are included in it.
13. What is meant by Public Finance? Explain direct and indirect taxes, withexamples.
14. What is meant by Public Expenditure? How many types of public expenditureare possible?
15. Explain the concept of Poverty Line. What are the limits of poverty line in India?
16. Define growth rate. How it can be calculated?
17. What is meant by foreign aid? What are its main forms?
18. Define balance of payment. What are the main items of balance of payment?
19. Define monetary policy. What are its main methods?
20. Define fiscal policy. What are its main methods?
******

CHAPTER 2
INFRASTRUCTURE OF THE INDIAN ECONOMY
1. INTRODUCTION
Every man as a consumer and producer, for the satisfaction of his wantsdemands not only goods but services as well. For example, a consumer demandsnot only food, clothing and housing, radio or refrigerators etc but he demandsservices like health, education and transport etc. as well. Such services are calledconsumer services. In the similar way, a producer needs various kinds of servicessuch as transport services to transport raw-material to industries and finishedgoods from industries to the market, power for the operation of machines,irrigational facilities to irrigate the farms, for increasing the efficiency of laboureducational and health services are needed. Such services are called producersservices or inputs for the provisions of services both for producers andconsumers some facilities like construction of power houses, roads, buses,hospitals and schools have to be created. All such common facilities creatingproduction services are a part of capital stock like the stock of other capitalgoods such as machine tools, raw-material and goods manufacturing factories.
Thus capital stock is of two types, one which produces goods likefactories or machines and the others which provide services like roads, powerhouses, canals, hospitals and schools etc.
2. MEANING OF INFRASTRUCTURE
The part of the Capital stock of the economy which is necessary fromthe viewpoint of providing various kinds of services is called infrastructure. Inshort, infrastructure means those activities, facilities and services which arehelpful in the operation and development of other sectors. For example, Roads,Rails and buses offering transport services, canals and dams facilitating irrigationof land and hospitals providing health services are considered as infrastructure.
2.1 Importance of Infrastructure
For the development of every country infrastructure like electricity,transport and means of Communication are of vital importance. This is the firstphase of economic progress. Their sufficient quantity means a strong base andtheir insufficiency is the greatest hindrance in the path of economic development.
In every underdeveloped country there is a need of availability ofinfrastructure in a sufficient quantity. Lack of infrastructure facilities will createhurdles in the development of industries and agriculture sectors, as a result ofit their rate of growth will come down. For example, we daily feel that industrialand agriculture sectors suffer a lot on account of shortage of power. Similarly,if there is a lack of transport facilities then industries will not be able to getraw-material and their finished goods will also not reach the market in time.
233

234
Thus, insufficiency of economic infrastructure will bring down the rate of growthof production sectors like industries and agriculture etc. On the contrary, thesufficient availability of economic infrastructure will be helpful in accelerationof their development.
According to World Development Report, 1994, “The sufficientavailability of infrastructure will be helpful in determining the success of onecountry and failure of another, in the diversification of production, expansionof business, solution of the problem of growth of population, reduction ofpoverty and improving the environment.”
Solid base of infrastructure increases production and decreases cost.But its development should be fast and ahead of other sectors development.According to the World Bank, the development and infrastructure has a directand proportional relationship. This implies that one percent increase ininfrastructure will lead to one percent increase in productivity. Some economistslike Nurkse, Hirschman etc. call infrastructure as the social overhead cost.
3. ECONOMIC INFRASTRUCTURE
Economic infrastructure refers to that capital stock which offers varioustypes of productive services directly to the producers. For example, country’stransportation system like Railways, Roads, Airways provides services to theone part of production and distribution system only. Similarly. Banking System,money and capital market provide services to the other part of industries andagriculture.
Following are main components of economic infrastructure:-
(i) Transport and Communication
(ii) Electric Power
(iii) Irrigation
(iv) Banking and other Financial Institutions
Now we shall take up their detailed discussion as following :–
3.1 Transport and Communication
Transport system of any country means all the different modes oftransport which are used to early people and goods from one place to theother. These means includes railways, roadways, airways and water transport.Communication means includes post and telegraph as well as services oftelephone, radio and television network etc.
3.2 Means of Transport
Means of transport facilitate the movement of goods and people fromone place to another. In an economy, which mode to transport will be moreappropriate depends upon the nature of economic interdependence betweendifferent regions of the country. If different regions of the country are
235
economically interdependent as were village communities in India, there weneed those transport means which are the cheapest for short distance routes.That is why there is a more use of bullock carts, camels, mules and traditionalboats etc. as a means of transport in India. If on the other hand, differentregions of the country are highly interdependent then we need those means oftransport that will cover longer distance with heavy loads as a cheapest andfastest mode. The examples are Railways, Buses, Trucks, Ships and aeroplanes.In order to bring parity between economic development and industrialisationthere is a increased tendency of economic interdependence between differentregions of the country. Big industries in the country have to bring their raw-material from far-flung areas and to sell their finished products at distant places.Similarly, people have to travel long distances in connection with their businessand employment. Thus, modern modes of transport like railways, buses, trucks,ships and aeroplanes are of paramount importance in India. Some of theimportant means of transport are given as follows :—
1. Railways
Railway is the cheapest means of transport for bringing passengers andheavy materials from the longer distance. The first railway line in India wasmade in 1853 between Bombay and Thana. Indian Railways is the biggestorganisation in Asia and ranks 4th in the world. Total length of the railwaytrack in India is 115,000 kilometers. On an average, almost 20000 trains runevery day between 7500 stations transporting about 20 million passengers and2.8 million tons of goods.
2. Road Transport
Road transport is emerging as another important means of transport inIndia. There has been a significant growth of roads after independence. Thisincludes trucks, buses, cars, scooters, motor-cycles, cycles, bullock-carts etc.Road transport system in India includes various national highways, statehighways, district roads, rural roads and border roads. In different states ofIndia, State Road Transport Corporations have contributed a great deal to thegrowth of road transport. They have spent a huge expenditure on thedevelopment of good buses, Bus Depots, Bus Stands and tourist resorts inorder to make the road transport more facilitating and comfortable. Thesignificance of road transport in India is increasing day by day.
3. Water Transport
In India, the third important means of transport is water transport.Among the developed countries, Indian Shipping occupies first position, 2ndposition in Asia and 16th position in the world. Water transport is dividedinto three categories:
(i) Inland Water Transport
(ii) Coastal Water Transport

236
(iii) Sea Transport or International Water Transport
Water transport is facilitated through various harbours (ports) at Mumbai,Kolkata, Haldia, Chennai, Bangalore, Vishakhapattanam. ‘Indian ShippingCorporation’ and ‘Mughaldines’ are the two important water transportcompanies in the public sector in India. Besides, there are many shippingcompanies in the private sector.
4. Air Transport
It is the fastest but costliest means of transport in India. In India (i)Indian Airlines Corporation, (ii) Air India International and (iii) Vayudoot, arethree important public sector undertakings in the area of air transport. IndianAirlines officially merged into Air India on 27 Februry 2011. On 1st April, 1997.flight operations of vayadoot were transferred to Indian Airlines and itsemployees were absorbed into Indian Airlines and Air India. After 1992 variousprivate companies have also entered in air transport sector. In India there are17 International Airports which are controlled by International AirportsAuthority of India.
3.3 Means of CommunicationMeans of communication are to be considered as a part of botth social
as well as economic infrastructure. Post, Telegraph, Telephone, Radio, Television,Fax, Cinema, Newspaper and Magazines etc. are the important means ofcommunication in India. In the context of economic infrastructure, means ofcommunication give useful information on changes in the market demand andsupply situations. On the basis of this information producers, investors andconsumers take important economic decisions. It is difficult to take decisionsregarding production and distribution without the proper information aboutdemand and supply conditions.
In the context of social-infrastructure, Radio, Television, Newspaper andMagazines play an important role in the spread of education and the knowledgeof people. Thus, the means of communication are very vital for every economy.
4. ELECTRIC POWER
Electric power or Electricity occupies very significant place in theeconomic infrastructure of every country. The quantum of electricity consumedby a country is being considered as the index of its industrialisation andeconomic development. Prior to independence per capita power consumptionwas very low in India, but it has shown sustained rise after independence. Theincreasing consumption of electric power shows more establishment of modernindustries and developing nature of the economy.
There are three important sources of power in India :–
237
(i) Thermal Power
(ii) Hydel Power and
(iii) Nuclear Power
(i) Thermal Power :– Thermal power is generated by the use of coal atthermal power stations. This is the chief source of power generation inIndia. It constitutes 68% of total power generation in India.
(ii) Hydro-Electric Power :– Hydro-electric power is generated by buildinghigh dams on the fast flowing rivers and by moving machines with thiswater. Development of Multi-purpose River Valley Projects have helpedin increasing the generation of hydro-electric power in India.
(iii) Nuclear Power :– India is one of the few countries in the world whichhave the capacity to generate nuclear power. India has huge quantity ofminerals to generate nuclear power but still very less quantity of nuclearpower is being generated.
During Five Year Plans, rural electrification has increased manifold. Inmany states like Punjab, Haryana, Gujarat, Maharashatra, Himachal Pradesh,Andhra Pradesh etc, there is a complete rural electrification. However, still16% of the villages in India are without electricity. In rural areas, a huge quantityof power is being used to operate pumpsets for minor irrigation purposes.
4.1 Irrigation
Agricultural water requirements can be met in two ways – first by naturalmeans like – rainfall and second through permanent means of irrigation like –wells, tubewells, ponds, canals etc. Significance of these means of irrigation foragriculture purpose is evident from the following factors:-
(1) Uncertainity of Rainfall – In India, rainfall depends on monsoon andmonsoon is uncertain. In every four or five years there are draughts andsometimes there is heavy rainfall. Besides, the time of rainfall is uncertain.Sometimes monsoon starts very early and sometimes it starts very late. It is,therefore said that, “Indian agriculture is a gamble of monsoons.”
(2) Unequal Distribution of Rainfall – Distribution of rainfall is highlyunequal across different regions of the country. In some regions, there is veryhigh rainfall while in others it is very low. Therefore, is regions of deficientrainfall irrigation has become very significant.
(3) Timing or Duration of Rainfall – In India, duration of rainfall due tomonsoon is also very limited. Rains occur largely from July to September. Winterrainfall occur only in states like Punjab, Haryana and Tamil Naidu. Therefore,irrigation is very much essential in order to grow two crops in a year. In Indiairrigational projects are mainly of two types:-
(i) Large Irrigational Projects or Multipurpose River Projects
Multi-purpose projects are those projects which serve many objectives

238
simultaneously like irrigation, flood control and generation of electricity. Underthese projects dams are constructed to store up the flood water of rivers duringthe rainy season. Many purposes are served by the sources of stored waterlike:
(1) The stored water under this source is brought to the fields for irrigationthrough canals and water channels throughout the year. So it makesthe irrigation possible for whole of the year.
(2) The electricity is generated when the stored water is thrown from theheight of the dam. Electricity is used not only for industries, railways,commercial and domestic purposes but it is also used for operation ofpumpsets and tubewells to irrigate the fields.
(3) Floods can be controlled by making check dams on the rivers. Bhakra-Nangal Projects, Damodar Valley Projects are the notable examples ofmulti-purpose irrigational projects in India.
(ii) Minor Irrigation Projects
The main projects in minor Irrigation projects include tubewells, wells,power operated pumpsets as well as small catchment areas. These projects arevery much important for irrigating water deficient areas.
5. BANKING AND OTHER FINANCIAL INSTITUTIONS
Monetary economic infrastructure in Indian economy means bankingsystem, non-banking institutions, capital market and the controller of all thesei.e. RBI (Reserve Bank of India). These monetary institutions are explained inthe following ways :-
(i) Money-lender
In India, traditional bankers or money lenders are crediting or debtingmoney from good old times. They charge a very high rate of interest.
(ii) Reserve Bank of India
This is the Central bank of India. It was established in 1935. Its mainfunctions are: to issue currency notes, to acts as a banker of government banksand to regulate and control the monetary system of the country.
(iii) Commercial Banks
Commercial banks occupy an important place in the banking system ofIndia. These banks generally give short term loans. In 1969, 14 Banks and in1980, 7 more banks i.e., total 21 commercial banks have been nationalised.Nationalisation implies that government of the country has become the ownerof these banks. Now the banks are expanding their branches in urban as wellas in rural areas. Nationalised banks have given more importance to socialwelfare along with profitability. These banks offer loans to the poor andbackward sections of the society at the low rate of interest.

239
(iv) Specific Banking Institutions
After independence, many specific financial institutions were establishedto meet the long term credit requirements of agriculture, industry and foreigntrade. For example, Industrial Development Bank of India, Indian IndustrialFinance Corporation and small Industries Development Bank etc. wereestablished to meet the credit requirements of the industrial sector. Foragricultural sector, credits are offered by Co-operative societies, RuralAgriculture Banks, Land Development Banks and National Agriculture andRural Development Bank (NABARD). Import-Export Bank is established to givefinancial help to foreign trade.
(v) Non-Banking Financial Institutions
These are those financial institutions which raise money from the publicand other sources and offer loan of that money or make investment. However,these institutions do not deal in the routine banking functions such as withdrawalof money through cheque system, issuing the draft and discounting the bills ofexchange etc.Unit Trust of India and Life Insurance Corporation of India arethe two notable examples of non-banking financial institutions in India.
(vi) Stock-Exchange
These are those institutions which deal in the sale and purchase of sharesand debentures of companies. All these institutions are also called share markets.
In short, in the economic development of the Indian Economy, thefinancial infrastructure such as education, health and housing, and economicinfrastructure such as transport, irrigation, power, banking etc. play a verysignificant role.
6. CONSUMER EXPLOITATION AND PROTECTION
The modern era is an era of consumerism. A variety of new goods aresupplied in the market daily for the utility and comfortability of the consumers.New food products, new fashion garments, decorative items, household gadgets,new means of transport, modern means (equipments) of entertainment like –coloured television, video etc. are being invented and produced continuously.Advertisements and publicity are being used at large scale to introduce or tomake available these goods to the consumers. Now a days a consumer chooseshis consumption material on the basis of attractive advertisements and publicityof different producers. In this way, they are exploited in many ways. To protectthe consumers from such type of exploitation, Consumer Protection Measureshave been started.
6.1 Consumer Exploitation
In modern Indian Economy, consumer is the most confused andunorganised person. Trading classes are putting their all out efforts to exploitthe consumers. Adulteration, sub-standard packed goods, use of non-standard

240
weights or misleading and fabricated advertisements and unfair Monopolisticand Restricted Trade Practices (MRTP) are such activities which exploit theconsumers in a large extent. Guarantee and warranty of durable goods like –refrigerator, television, air-cooler, washing machines and means of transportseems to be an imagination. Traders do not care for their promises andguarantees but they try to get rid of their responsibilities. According to a Judgeof Madras High Court, “Consumers have to pay high rates of freight forunhygenic rail wagons and insanitary conditions of rail-toiletteries. They haveto foot the bills of telephones without getting any service from them. Theyhave to drive their vehicles on risky roads. Pedestrians do not find any footpaths.Postal services (Dak or letters) do not reach in time. They have to eat adulteratedfood. They have to drink polluted water and breathe in poisonous air. Inspiteof the monopoly of Government on goods and services, inadequate supply ofessential goods and public services like power, transportation, communicationand banking services are uncountable examples which explain the tragic storyof the consumers.
Producers and traders exploit the consumers in many ways such as:-
(i) Mis-information regarding quality of the product,
(ii) Adulteration,
(iii) Use of non-standard weights and measures,
(iv) Supply of sub-standard products,
(v) Non-fulfilment of the sales guarantees,
(vi) No timely supply of goods, even after taking the advance.
6.2 Meaning of Consumer Protection
Consumer protection means the protection of the buyers of consumersgoods from the exploitation of the unfair trade practices of the producers.
6.3 Methods of Consumer Protection
To protect the interests of the consumers and small producers from themonopolists and big producers, ‘Monopoly and Restrictive Trade Practices Act’was passed in 1969 in India. This led to the establishment of Monopoly andRestrictive Trade Practices Commission. This commission check the malpracticesof big producers such as to increase the price by creating scarcity of the goodin the market, to decrease the quality of the goods and to stop the competitionetc. In 1991, by making changes in this Act for checking unfair trade practices itwas made more effective than before. However, the main limitation of this actis that it does not protect the consumers from the exploitation by medium andsmall scale industries and traders.
For protecting consumers interests from all categories of producers,‘Consumers Protection Act, 1986’ was passed and this act came into force from1987. This act covers all goods and services other than those specifically exempted

241
by the central government. All public, private, joint and co-operative enterprisescome within the purview of this act. In accordance with this act, in order toredress the grievances of the consumers at very low expenses and for theirearly disposal, ‘Consumers Disputes Redressal Forums,’ have been establishedat the (i) district (ii) state and (iii) national levels. Along with this, ‘ConsumerProtection Councils’ have also been established to protect the interests ofconsumers at the central and state level.
6.4 Main Features of Consumer Protection Act, 1986 –
The main features of Consumer Protection Act, 1986 are as follows :–
(1) Scope – All sellers of private, public and co-operative sectors come withinthe purview of this act.
(2) Simple and Inexpensive Redresses – This act offers simple andinexpensive redressal to the consumers’ grievances. The complainantneed not engage any advocate. He has to lodge his complaint in writing,mentioning the name and address of the party against whom thecomplaint is being lodged.
(3) Three-Tier Grievances Redressal Machinery – Under this act in orderto solve the problems of consumers a three-tier machinery has been setup :–
(i) District Forum :– This forum decides the complaints the valueof which is less than Rs. 5 lacs.
(ii) State Forum :– These forums decides the complaints involvingan amount which is between 5 lacs and 20 lacs.
(iii) National Forum :– This forum decides complaints which are morethan 20 lacs in value.
(4) Complaint :– Consumer can lodge the following type of complaintswithin two years from the date of the purchase of the good in case:
(i) He has to suffer a loss because of the unfair trade practice ofthe trader.
(ii) There is any defect in the purchased goods or services.
(iii) The trader has charged more than the written price or the pricefixed by the government.
6.5 Consumer Education
To protect the interests of the consumers, it is very much essential toeducate them. It is with this view that the consumer’s week is celebratedthroughout the country between March 15 and March 21 every year. Duringthese days more stress is given on awareness among the consumers regardingtheir rights. The occasion is marked by various exhibitions, Seminars and streetplays. Consumers are apprised of the possible unfair trade malpractices of
242
short-weights and measures, adulteration and the like. To arouse awarenessamong the consumers publication of ‘Upbhokta Jagran’ (consumer awareness)was launched in 1991. Central Consumer Protection Council has been establishedby the Central government. Similarly at state level, State Consumers ProtectionCouncils have been set-up. In fact, the importance given to the consumersprotection is a significant sign towards economic progress.
6.6 Consumer Organisation
Today, there are about 500 consumer organisations. These organisationshave contributed a lot to protect the interests of the consumers some of theseorganisations are :
(1) Consumer Direction Society, Mumbai.
(2) Consumer Action Forum, Kolkata.
(3) Citizen’s Forum.
(4) The Voice, New Delhi.
(5) Mumbai Customer Panchayat System etc.
7. PUBLIC DISTRIBUTION SYSTEM
The Government of India tries to distribute the necessities of life likewheat, rice, sugar, kerosene oil, cloth etc. to the poor people of the country atlow prices. To meet this objective, Public Distribution System, has been set-up.
7.1 Definition :– Through Public Distribution System Governmentdistributes the necessities of life like foodgrains, sugar, kerosene, coarse clothetc. at concessional prices through Fair Price shops at fixed quantity to thegeneral public especially to the poor sections of the society.
7.2 Necessity :– The need of Public Distribution System was felt becausemarket forces of demand and supply could not distribute the necessities of lifelike foodgrains, sugar, kerosene, coarse cloth etc. from the social point of view.The effective forces of demand and supply are responsible for the followingcauses :–
(1) Inadequate Production:- In India the supply of essentialcommodities of life is less than demand because of threereasons:–
(a) Inadequate Production,
(b) Lack of warehouses and selling facilities,
(c) Hoarding which results like speculative and blackmarketing evils.
(2) Poverty :– Poverty ridden consumers are less expected topurchase essential goods at market price. As a result of it theproblems of starvation and mal-nutrition are expected to arise.

243
7.3 Constituents of Public Distribution System
There are three constituents of Public Distribution System in India:-
(i) Procurement at Minimum Prices :– Government of India procured thefoodgrains at the prices fixed on the recommendations of the commissionfor Agricultural costs and prices. If the market prices fall below theseprices, then the government itself purchases the produce of farmers atthese fixed prices. This process is called procurement of grains. Thisensures the farmers about the complete knowledge of the prices for hisproduce and he does not reduce his production for fear of fall in theprices. In 1988, the government procured 140 lakh tons of foodgrains atthe fixed prices. In 1996-97 this procurement increased to 167 lakh tonsand this increased to 555.08 lakh tons in 2009-10.
(ii) Buffer stock :– The second component of Public Distribution system isto keep the stock of necessary items like foodgrains and sugar etc. bythe government. This stock is called Buffer Stock. For the safe storageof these stocks enough arrangement of godown has been made. Whenthere is shortage of food grains, the government releases the supplyfrom the buffer stock and thus check the prices from rising.
(iii) Fair Price Shops :– The government has opened about 5 lakh Fair PriceShops to distribute the essential commodities at low prices throughRation Cards. On these shops, the quantity of the commodities availableto the people at the reasonably fixed prices has been fixed by thegovernment which means Rationing has been done. In 1988, 180 lakhtons and in 1996-97, 190 lakh tons of goodgrains were distributedthrough these fair price shops. Besides foodgrains, these fair price shopsalso distribute sugar, kerosene, coal and coarse cloth. Every Fair PriceShop serves population of about 2000.
For the distribution of goods like tea, soaps, cereals and Iodised salt tothe population living in hilly and draught areas, a new scheme has been started.It is called Improved Public Distribution System. Under this system, FoodCorporation of India supplies the foodgrains at special concessional prices todifferent states and Union Territories. Under this Public Distribution Systemthe fixed price is reduced by 50 paise per kilogram.
QUESTIONSI. Very Short Answer Type Questions :
1. What is meant by infrastructure?
2. What are the main components of economic infrastructure in India?
3. Name the various modes of transport in India?
4. What do you mean by irrigation?
244
5. What are the major sources of irrigation in India?
6. Write a short note on Reserve Bank of India?
7. Write a note on the Commercial Banks of India?
8. What are the specific banking institution of India?
9. What do you mean by consumer protection?
10. Write a short note on Public Distribution System.
II. Short Answer type Questions :
1. What do you mean by infrastructure? Why is it required?
2. What are the main kinds of infrastructure in India?
3. Write briefly on transport, electric-power and irrigation as components of economicinfrastructure.
4. What are the main monetary institutions of India?
5. What do you mean by consumer exploitation? What are the main methods ofconsumer protection?
6. What do you mean by Public Distribution System? Explain the present position ofPublic Distribution system in India.
*****

CHAPTER 3
AGRICULTURAL DEVELOPMENT IN INDIA
1. INTRODUCTION
India is considered to be an agrarian economy because 68 % of itspopulation is still dependent on agriculture for livelihood. After IndependenceIndians inherited a backward agricultural economy from the Britishers. MahatmaGandhi considered agriculture as “Soul of India”. In this context Nehru hadalso said, “Agriculture needs utmost priorities.” Emphasising the importanceof agriculture Dr. V.K.R.V. Rao said, “If the vast mountain of development isto be crossed under Five Year Plans, then the targets fixed for agriculture willhave to be achieved”. In the words of eminent Indian scholar Dantewale, “Forthe economic development of Indian economy, success in the field of agricultureleads the country to the path of economic progress”.
2. MEANING OF AGRICULTURE
The term “Agriculture" in English language is derived from two words,‘Agri’ means field and ‘Culture’ means cultivation. Webster Dictionary states,“Agriculture is the art or science of production of crops and livestock on afarm”.
3. IMPORTANCE OF AGRICULTURE IN INDIAN ECONOMY
Planning Commission has rightly said, “Development of agriculture ismost essential for the success of the plans. Growing population of India dependson agriculture for food. Industry, commerce, foreign trade and transport ofthe country depend entirely on Indian agriculture.” Importance of agricultureto the economy of the country is clear from the following factors :–
(1) Contribution in National Income
About 40% of national income of India comes from primary sectors likeagriculture and forestry etc. During the period of planning, share of agriculturein the national income has been ranging between 51% and 29%. As comparedto the other sectors like industry, trade etc. the share of agriculture in India’snational income is very large, although it is gradually diminishing. In thedeveloped or rich countries of the world, agriculture is fairly developed but itspercentage contribution to the national income is very small.
2. Source of Food Supply
Agriculture provides food to population and fodder to livestock in India.Therefore, agriculture is a source of subsistance for men and animals. With theprogress of agriculture, food problem of the country has been solved by andlarge. A healthy individual should get 750gms of food grains per day. In Indiaavailability of milk, eggs, fish etc. is very little. Hence the need of cereals is
245

246
much. Indians get small quantity of vegetables, pulses and edible oils. Theiraverage availability should be 25.5gms per person but it is only 14.6gms. In thisrespect Freeman has rightly observed, “Our progeny might say satirically thattheir ancestors in the 20th century reached the moon successfully but failed toprovide bread and butter to its children.”
3. Agriculture and Employment
In Indian Economy, the maximum employment opportunities areavailable in the agriculture sector. According to the 1951 census, the contributionof rural workers to working population was 80%, out of which almost 82%rural workers were getting employment from the agriculture sector. It can besaid that in accordance with 1901 census, the 60% of population was engagedin agriculture sector, whereas in 1996-97 only 64% population was gettingemployment from agriculture. India’s two-third of population is dependent onagriculture sector for employment. According to 1991 census, there were 22lakh people who were working as cultivators and 12 lakh people working aslandless agricultural labourers. Thus, inspite of backwardness in agriculturesector and poverty in rural areas, the main source of employment is agriculturein India. According to Economists, in India, industries specially large scaleindustries are not expected to create more employment oppurtunities in nearfuture. Thus agriculture will remain a source of employment not only in presentbut also in future in India.
4. Agriculture and Industry
In an underdeveloped country like India, in the early stage of economicdevelopment, agriculture plays an important role in the industrial developmentbecause of the following reasons:-
(i) Industries get raw materials like cotton, jute, sugarcane, oilseeds, rubber,foodgrains etc. from agricultural sector.
(ii) With the increase in productivity of agriculture, income of people goesup and they are in a position to demand more of industrial goods.
(iii) As a result of increase in the productivity of agriculture, demand forlabour in agriculture sector will fall, and that labour force will be ableto work in industries.
(iv) Because of Industrial development, income will rise and with the increasein the demand of foodgrains, agriculture will also develop.
(v) Many cottage industries like oil expellers, handlooms etc. depend uponagriculture for raw material.
5. Source of Livelihood
Agriculture is the main source of livelihood of Indian farmers. Agriculturein India is also a source of livelihood for non-agricultural rural families likeweavers, artisans, barbers, washermen etc. Large number of rural families also

247
depend on agriculture as their subsidiary occupation.
6. Agriculture and Foreign Trade
In the foreign trade of India, agriculture plays an important role. Thecontribution of agricultural products in India’s total exports is very large. Largequantities of Tea, jute, cashewnuts, tobacco, coffee, spices etc. are exportedfrom India.
7. Internal Trade
Large number of Indians spend more than 80% of their income onfoodgrains, tea, sugar, milk etc. Thus, agriculture is of great importance to theinternal trade of the country. Foodgrains trade provides employment to largenumber of people and revenue to the government by way of taxes.
8. Transport
Means of transport like railways, motors, bullock-carts etc. earn largepart of their income by carrying foodgrains and agricultural products from oneplace to the other.
9. Government Income
State Government earn large part of their revenue from agriculture.Many taxes are imposed on agriculture, e.g. land revenue, irrigation charges,agricultural income tax etc.
10. Capital Formation
Good deal of Country’s capital is invested in agriculture. From the pointof view of fixed capital investment, agriculture sector occupies the first place.Capital worth millions of rupees is being invested in the means of irrigation,livestocks and tools, tractors etc.
It is clear from the above account that “The prosperity of the farmers isthe prosperity of India.” Development of agriculture is also necessary for thesuccess of economic planning.
4. MAIN PROBLEMS OF INDIAN AGRICULTURE
Indian agriculture is quite backward. It has to face so many problems.The problems of Indian agriculture can be divided into three categories:-
1. Human Problems;
2. Institutional Problems; and
3. Technical Problems
Problems of Indian Agriculture
(1) Human Problems (2) Institutional Problems (3) Technical Problems

248
4.1 Human Problems
1. Pressure of Population on Land :– Heavy pressure of population onagriculture is one of the principal causes of backwardness of Indian agriculture.In 1901, the number of dependents on agriculture was 16 crores 30 lakhs. Nowit has increased to 38 crores and 30 lakhs. As a result of it the availability ofland per individual which was 0.43 hectares in 1901 has been reduced to 0.23hectares. Now the pressure of population on land has resulted in the problemof subdivision and fragmentation. With this problem, disguised unemployementhas increased.
2. Social Atmosphere :– In India the environment in rural area has been agreat obstacle in the development of agriculture. Indian farmers are illiterate,so they are unable to adopt the knowledge of latest modern techniques ofagriculture easily. Indian farmers are fatalist, superstitious and conservative.They are in the grip of casteism. On account of ignorance and casteism, Indianfarmers are used to fight on petty issues and engaged in litigations, by whichlot of time and money is wasted. This social environment of villages is provedto be a great hurdle in the development of agriculture.
4.2 Institutional Problems
(i) Small size of Holdings :– Most of the farms are very small in India.The average size of farms is 2.3 hectares. In Punjab the average holdings is of3.77 hectares. About 70% farms are even less than 2 hectares whereas in Americathe average holding is of 122 hectares. In India, the farms of a farmer are notonly small but also scattered due to fragmentation. Due to the small size offarms it is very difficult to adopt scientific methods of cultivation. This makesthe animals, tools and means of irrigation as useless.
(ii) Land Tenure System :– The major reason for backwardness ofagriculture is land tenure system. Although in post-independence era Zamindarisystem has legally been abolished, yet the condition of the cultivator is notsatisfactory. He has to pay high rent. Land owners deal with him in an arbitrarymanner. They evict the tenant at their discretion. Under such circumstancesincrease in agricultural productivity can not be expected from the cultivators.
4.3 Technical Problems
(i) Inadequate Irrigational Facilities :– Indian agriculture depends largelyon rainwater. Due to uncertainty of rainfall, agricultural production also becomesuncertain. That is why Indian agriculture is called a “Gamble in Monsoon”.Hardly 34% of cultivated land has been covered by permanent means of irrigationduring the period of planning. Owing to lack of irrigation facilities farmers areable to grow only one crop in a year.
(ii) Old Agricultural Implements :– Old type of implements are still usedin cultivation in India. In this scientific age, Indian farmers are using agriculturalimplements and tools such as wooden plough, sickle, hoe, spade, etc. There is

249
very nominal use of tractors and other modern machinery. Due to the use ofold tools and implements in cultivation the productivity of land does not increasewhich results in low agricultural production.
(iii) Traditional Technique of Cultivation :– In India the techniques ofcultivation are traditional. Crop-rotation is not practised properly. Consequentlydue to this and other reasons agricultural production decreases a lot.
(iv) Lack of improved seeds :– Indian farmers do not make judicious use ofbetter quality seeds. First reason is that, they do not understand theirimportance; secondly, their supply is not well-organised in the country; thirdly,good variety of seeds being costly, the poor farmers can ill-afford them. Hencedue to these reasons productivity per hectare is low.
(v) Lack of Manure :– Manure plays an important part in good cultivation.Indian farmers do not make use of it in proper quantity. About 60% of cowdung, which is very cheap and suitable as manure, is used as a fuel. Chemicalfertilizers are expensive and are imported from foreign countries. Its use,therefore, is restricted.
(vi) Defective Agricultural Marketing System :– The Marketing System ofagricultural production is far from satisfactory. As a result, the farmers do notget proper price for their produce. For want of efficient means of transport,the farmers are compelled to sell their produce to the village money-lenderswho pays a very low price. On account of inadequate storage facilities, farmershave to sell their produce immediately after harvest, when the price of produceis minimum. This has to be done because farmers do not have godowns forstorage of their produce.
(vii) Diseases of Crops and Attacks of Pests :– Crops are destroyed in largequantities by crop diseases, monkeys, rodents etc. Insects and locusts also playhavoc with standing crops. According to Sh. N. Singh, Soil Conservation advisorto Govt. of India, “Every Year Crops worth Rs.100 crores are destroyed by theinsects in India.”
(viii) Lack of Credit Facilities :– Poor farmers in India face lot of difficultiesin getting loans. They do not get sufficient credit at proper time from banksand co-operative societies. Even now they have to depend upon creditors andmoney-lenders especially for consumption loans. Farmers have to pay a largepart of their income to money-lender in the form of interest. The farmer iscompelled to sell his produce to money-lender at throw-away prices.
(ix) Weak Cattle :– Because of the lack of agricultural machinery cattle playan important role in Indian agriculture. But Indian cattle are weak and theirmortality rate is also very high. Farmers have to keep many heads of cattle.Due to this on the one hand, they have to spend more and on the other hand,expenses on their upkeeps rises. Hence, cost of agricultural production increases.
In short it can be said that three types of factors i.e., human, institutionaland technical are responsible for low agricultural productivity and backwardnessof agriculture in India.
250
5. ROLE OF GOVERNMENT IN AGRICULTURAL GROWTH
Government of India has played the following important role in thedevelopment of agriculture.
(1) Land Reforms :- After independence, Government has introducedseveral significant measures relating to land reforms like:
(i) Abolition of Zamindari System.
(ii) Acts have been passed in different states to improve land tenuresystem by providing ownership rights to the cultivators.
(iii) Maximum ceiling on land holdings has been fixed.
(iv) Till 1996, Consolidation of Holdings was completed on landmeasuring 619 lakh hectares in the whole country. “Consolidationof Holding is an activity by which farmers are asked to get landof the same size and kind at one or two places in lieu of theirsmall and fragmented Holdings-scattered at many places.”
(v) Co-operative farming has also been developed.
(vi) To improve the lot of landless Cultivators, Acharya Vinoba Bhavehad started the Bhoodhan Movement.
Thus, land reforms have contributed significantly in the developmentof agriculture production.
2. Increase in Area Under Cultivation
During Five Year Plans, efforts have been made for the development ofagricultural sector. During the period of planning, area under cultivation hasincreased by 38%. In 1950-51, total sown area was 13 crores hectares, now ithas gone up to about 18.5 crore hectares. In order to increase the net sownarea, baren and waste land has been made cultivable in Punjab. Lands rendereduncultivable for the whole year has been reduced. Efforts have been made tocultivate the land wasted due to soil erosion. In the area covering about 4.2crore hectares, more than one crops are being sown every year.
3. More Irrigational Facilities
In order to increase the productivity of agriculture, irrigational facilitieshave been expanded. Several major and minor irrigation projects were launchedin the country. In 1951, hardly 17% of total land was covered by irrigationalfacilities which has now extended upto 34% of land. In Punjab, facilities ofirrigation are available to 95% of area under agriculture. With coming up ofMulti-Purpose Projects and tubewells area under irrigation has increasedconsiderably. Areas where irrigational facilities are not possible, dry farmingtechniques have been introduced. In the year 1995-96, irrigation for 876 lakhhectares could be possible. In Punjab the facility of irrigation is available for 73lakh hectares of land. Total expenditure on irrigation in Seventh Plan amountedto Rs.16,590. In Eighth Plan, a sum of Rs.32,280 has been spent and now irrigatedarea has increased to 894 lakh hectares.

251
4. Reforms in Delivery system
Government has made many reforms in distribution and marketing ofagricultural inputs and output. Emphasis has been made on the establishmentof Co-operative societies in order to provide the essential agricultural inputslike – improved seeds, manure etc., to the farmers. In this regard, the requiredcredit was made available to the farmers through the organised sector like co-operative societies, Regional Rural Banks, commercial Banks etc. Its purpose isto protect the farmers from the exploitation of money-lenders. In order toenable the farmers to get fair price of their agricultural produce and to protectthem from the exploitation of traders and money-lenders and for bringingimprovement in the agricultural policy, Regulated Markets, Co-operativeMarketing Societies, other Government Organisations like Food Corporationof India, NAFED, MARKFED, HAFED have been set up. These institutions aremainly performing the work of agricultural marketing and processing ofagricultural produce keeping in view the welfare of the farmers.
5. Agricultural Research And Development
Indian Government has established many institutions, schools etc. foragricultural research and development. Indian Council of Agricultural Research(ICAR) is the most prominent institute among all agricultural research institutesof the country. This institute has branches all over the country. In India 27Agricultural Universities have been opened. These institutes have made researchfor improved seeds of wheat, Rice and many other crops. The farmers havebeen educated about the improved techniques of agriculture. Scientific methodshave been invented for farming in dry areas.
6. Development of Agricultural Land
During five year plans, many efforts have been made for the developmentof agricultural land. Arrangements have been made for levelling of land, slopingof land, contour bunding, terracing of land etc. in order to conserve the soil.
7. Improvement of Animal Husbandry
During five year plans, key village schemes were introduced with aview of improving the breed of the cattle. To treat the cattle diseases, veterinaryhospitals have been set up. To develop cattle wealth of the country, 86 IntensiveCattle Development Projects (ICDP) have been set-up. All the developmentmeasures for cattle are adopted in these projects.
8. Improvement in Agricultural Marketing
Main objective of improving marketing of agricultural produce is toensure reasonable price to the farmers for their produce. Measures have beentaken especially in two directions in this regard.
(i) Regulated markets are managed by the market committee appointedby the Government. Their objective is to protect the farmers from the

252
exploitation by the middlemen. In such markets, metric system ofweights and measures is used. By 1996, as many as 6969 mandis havebeen regulated. There are 144 regulated markets in Punjab.
(ii) Co-operative Marketing Societies have also been established forimproving agricultural marketing. These societies sell the produce oftheir members at reasonable prices. They make arrangements for cheapand quick means of transport and also for grading of the produce. Thesesocieties provide facilities of godowns and warehousing. In 1996-97,the co-operative marketing societies have marketed agricultural productsworth Rs.9503 crores.
9. Proper Agricultural Price Policy
Government has made significant contribution in agricultural develop-ment by introducing the Proper Agricultural Price Policy. Government hasopened many institutions. In order to provide the farmers the stable prices andprofitability of their produce and to implement the Guaranteed AgriculturePrice Policy, the Government has established many institutions like AgricultureCost and Price Commission. This commission advises the Government aboutthe agriculture price policy. The minimum support price and cost price ofagriculture goods are also decided by this commission. The second purpose ofthe Government’s price policy is to set-up the Food Corporation of India keepingin view the protection of the interests of the consumers. This corporation buysthe foodgrains at the minimum support price fixed by the Government andkeeps that in the buffer stocks. When the prices of foodgrains start rising, thenthe Government sells the foodgrains at a reasonable price in the market out ofthis buffer-stock. In this way, the rise in prices is regulated. Government alsofixes the maximum prices of many agricultural products. The Government sellsmany agricultural products like grains, sugar, oil etc. through the Fair PriceShops under Public Distribution system.
10. Agricultural Trade Policy
There are two main aspects of Indian Agricultural Trade policy :-
(i) Regarding foodgrains the agricultural trade policy is the policyof Import Substitution. It means that, Governments’ policy is toproduce the foodgrains within the country rather than to importit.
(ii) Regarding cash crop like – cotton, Jute, Tea, Coffee etc., theagriculture trade policy is the policy of Export Promotion.Government is very much encouraging the export of cash crops.Agricultural trade policy of the Government has a positive effecton agricultural development.

253
11. Credit Facilities
Co-operative credit societies have been developed to provide adequatecredit facilities to the farmers at low rate of interest. Number of LandDevelopment Banks has increased. At present, there are 82,000 PrimaryAgricultural Credit Societies and 1,440 Primary Land Development Banksfunctioning in the country. After nationalization, commercial Banks have beengiving liberal loans to agriculturists. Regional Rural Banks and Farmer’s ServiceSocieties have been established to provide credit facilities to the farmers. On12th July, 1982, National Bank for Agricultural and Rural Development(NABARD) was established to grant huge loans for agricultural development.In 1996-97, different institutions provided credit worth Rs.28,817 crores toagricultural sector. In Punjab, there are about 4205 Agricultural co-operativeSocieties which have been given loans worth Rs.852 crores.
12. Agriculture and Five Year Plans
In the Five Year Plans, about Rs.23,500 crores have been incurred onagricultural development. As a result of it the foodgrains production has doubledthan earlier. Progress achieved in the agricultural sector during different FiveYear Plans period is mentioned as follows:-
1. First Plan (1951-56) :– During this plan, Rs.290 crores were spent on thedevelopment of agriculture. Foodgrains production increased to 693 lakhtonnes.
2. Second Plan (1956-61) :– During the second plan, an expenditure ofRs.549 crores was incurred on the agricultural development.Consequently, foodgrains production went upto 823 lakh tonnes.
3. Third Plan (1961-65) :– Development of agriculture involved onexpenditure of Rs.1,089 crores during this plan. But due to several causesproduction of foodgrains fell to 723 lakh tonnes.
4. Fourth Plan (1969-74) :– In the fourth plan, expenditure on agriculturaldevelopment amounted to Rs.2,320 crores and production of foodgrainsincreased to 1,047 lakh tonnes.
5. Fifth Plan (1974-78) :– During Fifth Plan, Rs.4865 crore were spent onagricultural development. As a result, production of foodgrains increasedto 1320 lakh tonnes.
6. Sixth Plan (1980-85) :– In the Sixth plan, Rs.6,623 crore were spent onthe development of agriculture. The production of foodgrains increasedto 1,465 lakh tonnes.
7. Seventh Plan (1985-90) :– An outlay of Rs.12,792 crore was spent forthe development of agriculture in this plan. The foodgrains productionrose to 1,760 lakh tonnes.
8. Eighth Plan (1992-97) :– In the Eighth Plan, there was a proposal toincurr Rs.22,280 crore on development of agriculture, Rs.35,263 crores

254
on rural development, Rs.6837 crores on special regional programmesand Rs. 33,280 crore on irrigation and flood control. In this way, thetarget was to spent 22% of total expenditure on the development ofagriculture sector. The main objective of this plan was to increase theagricultural production through agricultural development anddiversification, in order to attain the goal of self sufficiency in foodproducts and export of agriculture products. In the Eighth Plan, thetarget was fixed to produce 2100 lakh tonnes of food grains, 2750 lakhtonnes of sugarcane, 140 lakh bales of cotton and 95 lakh bales of Jute.But actually the foodgrains production was 1924 lakh tonnes, sugarcaneproduction was 2830 lakh tonnes, cotton 131 lakh bales and Jute 89 lakhbales.
9. Ninth Plan (1997-2002) :– In the Ninth Plan, the expenditure onagriculture sector which include development of agriculture, irrigationand rural development was Rs.1,55,392 crores.
10. Tenth plan (2002-07) :- During this pln Rs 58,933 crore expendition anagriculture was proposed.
11. Eleventh plan (2007-12)— During this plan the aunnal average increasein agriculture was 3.5% whereas the target was at 4%.
6. GREEN REVOLUTION
The term Green Revolution is a combination of two words – “Green”and “Revolution”. Green stands for greenery. Revolution means so suddenand fast changes that the spectators were wonder – struck. This term has beenused for the progress of agricultural production. Because of the severalagricultural reforms initiated during the period of first three plans in India, in1967-68, the production of foodgrains increased by about 25% as compared tothe last year i.e., 1966-67. Such a tremendous increase in the production offoodgrains in any one year was nothing short of a revolution. That is why, theEconomists gave this spectacular increase in foodgrains production, the nameof Green Revolution.
6.1 Definition
“Green Revolution refers to an extra-ordinary increase in agriculturalproduction especially in Wheat and Rice, which was made possible due to theadoption of new techniques of High Yielding Varieties of seeds.”
In the words of J.G. Harrar, “The Green Revolution is the wordgenerally used to describe the spectangular increase in the production offoodgrains that took place during 1968 and it is still continuing.
6.2 Features of Green Revolution(i) The year 1968 was the initial year of Green Revolution.(ii) Pant Agricultural University, Pant nagar (U.P.) made an
appreciable contribution to it by evolving a new variety of seeds.

255
(iii) Indian Agricultural Research Institute (I.A.R.I.), New Delhi hasalso made lot of contribution in this regard in bringing the GreenRevolution.
(iv) Credit of bringing Green Revolution in India goes to Dr. NormanE. Borlaugh and Dr. M.N. Swaminathan.
6.3 Main Elements of the Success of Green Revolution
In India, many factors are responsible for bringing this revolution inAgriculture. Following factors are worth mentioning :-
(i) High Yielding Varieties of Seeds :– Use of High Yielding Variety (HYV)of seeds has played an important role in bringing the Green Revolution.First of all, these seeds were used in 1966. In India, Dr. Norman E.Borlaugh played an important role in the use of these seeds. The IndianAgricultural Research Institute (IARI) and Agricultural Universities haveplayed an important role for the use of these improved seeds. By the endof Eighth Plan, 750 lakh hectares of land had been covered by HYVseeds. In Punjab, about 55 lakh hectares of land is cultivated by HYVseeds.
(ii) More use of Chemical Fertilizers :– It is because of the increased use ofchemical fertilizers that the production of foodgrains has gone upsignificantly. In 1967-68, 11 lakh tonnes of chemical fertilizers were usedwhich increased to 139 lakh tonnes in 1996-97. By the end of Eighth Plan,consumption of chemical fertilizers was estimated to be 183 lakh tonnes.In Punjab, about 1285 thousand tonnes of chemical fertilizers were used.
(iii) More Irrigational Facilities :– Expansion of area under irrigation hascontributed a lot in bringing the Green Revolution. In 1965-66, irrigationalfacilities were available only to 320 lakh hectares of land whereas in 1995-about 1,082 Lakh hectares of land has been provided with irrigationalfacilities. In Punjab, in 2010-11, 7724 thousand hectares of land is underirrigation.
(iv) Use of Modern Agricultural Machinery :– Green Revolution has beenencouraged by the rapid increase in the agricultural implements in India.Farmers are making maximum use of tractors, tubewells, crushers, dieselengines etc.
(v) More Credit Facilities :– As farmers are getting more credit facilitieswhich enabled them to purchase and use HYV seeds, fertilizers andmachines. In 1967-68, credit amounting to Rs.400 crores was made availablethrough co-operative societies. In 1996-97, agriculture sector obtainedRs.28,817 crores worth of institutional credit. In Punjab, the Agriculturalco-operative societies has given credit amounting Rs.852 crores.
(vi) New Techniques of Agriculture :– Due to Intensive AgricultureDevelopment Programme (I.A.D.P.) and latest inventions of All India

256
Agricultural Research i.e., (I.A.R.I.), a great attention was given to newagricultural techniques like crop rotation, fertilizers, water and use ofimproved seeds.
(vii) Plant Protection Measures :– Earlier, there was no proper arrangementto protect the plants against diseases. Green Revolution has been madepossible by plant protection measures. Under these measures pesticidesare being used on the crops in the farms.
(viii) Price Incentives :– With the huge increase in agricultural production therewas a fear of fall in the prices of agricultural produce. For this purposethe government has established Agricultural costs and Prices Commissionto fix the minimum prices of foodgrains. The Government itself purchasescrops at these minimum prices, so that farmers could get reasonable pricesfor their produce.
(ix) Rural Electrification :– Rural electrification has played a great role forthe extension of green revolution. To improve the quality of rural lifeand to provide power to agricultural equipments, rural electrificationprogramme has been introduced.
(x) Soil Conservation :– Soil Conservation programme has been launched soas to extend Green Revolution. It has two objectives :- (i) to check thesoil erosion and (ii) for reclamation of land. As a result of it, the areaunder cultivation has increased.
(xi) Marketing Facilities :– In the past, the farmers were not getting fairprice of their produce. That is why they could not invest much capital onthe development of agriculture. But now there is a lot of improvement inthe marketing of agricultural produce. Now by giving more care andexpenditure than before by the farmers, the agricultural production hasincreased which ushered in an era of green revolution.
7. MAIN EFFECTS OF GREEN REVOLUTION
Green Revolution has brought many effects on the economy of India. Ithas provided a new base to the economy of the country. Its main effectsare as follows:-
(i) Solution of Food Problem :– As a result of Green Revolution, in 1967-68,and in the following years, production of crops increased rapidly. Theyear 1967-68 is called the year of Green Revolution. In this year, theproduction of foodgrains had increased to 950 lakh tonnes in India andin Punjab, the foodgrain production has increased to 119 lakh tonnes.Consequently, per capita availability of foodgrains has also increased.Import of foodgrains have decreased considerably. In this way, GreenRevolution has proved helpful in solving the food problem of the countryto a great extent.

257
(ii) Effect on Rural Employment :– As a result of green revolution,mechanization of agriculture has increased and on the other handagricultural activities have also increased. It was feared that unemploymentwill increase with the use of machines but due to the cultivation of morecrops in a year the demand for labour has increased. On account of this,rural population has got the employment.
(iii) Reduction in Import of Food grains :– In India, there has been aconsiderable fall in the imports of foodgrains due to Green Revolution.In the words of Prof. Dantewala, “Green Revolution has given breathingtime and planners will now attend to Indian Plans.”
(iv) Development of Industries :– Green Revolution has a favourable effecton the development of industries. There is a considerable increase in thesetting up of chemical fertilizers, tractor and diesel engine manufacturingindustries.
(v) Effect on Prices :– During the Third Five Year Plan, prices, especiallyprices of agricultural commodities, had a sharp rise. However, due toGreen Revolution, the pace of price-rise slowed down.
(vi) Prosperity of the Farmers :– The Green Revolution has very muchimproved the economic condition of the farmers. Their standard of livinghas gone up very much than before.
(vii) Plaughing Back of Profits :– The one good effect of the Green Revolutionis that now the farmers are also induced to invest large part of theirincome on the development of agriculture.
(viii) Change in Thinking :– Green Revolution has completely revolutionizedthe thinking of the Indian rural people. Now they are convinced thatwith the help of science they can change their misfortunes into fortunes.
(ix) Effect on Consumers :– Poor Indians spend about 80% of their income onagricultural commodities. Green Revolution has helped them to balancetheir budget and raise their standard of living.
In short, the main aim of the Green Revolution is to satisfy the hungerof hungry people and to accelerate the rate of economic growth. GreenRevolution is heading towards this objective.
QUESTIONS
I. Very Short Answer Type Questions :
1. What is the contribution of agriculture to National Income in India?
2. “Agriculture is the main source of employment in India.” Write a short note on it.
3. What are the main land reforms of India?
4. What do you mean by Green Revolution?
5. How has Green Revolution helped in solving the Indian food problem?

258
II. Short Answer Type Questions :
1. Describe the importance of agriculture in Indian economy.
2. Describe the main problems of Indian Agriculture.
3. Explain the contribution of government in the development of Indian agriculture.
4. What do you mean by Green Revolution? What are the main Effects of GreenRevolution?
5. Write the main elements of success of Green Revolution.
_________

CHAPTER 4
INDUSTRIAL DEVELOPMENT IN INDIA
1. INTRODUCTION
For economic progress of underdeveloped countries like India,industrialisation occupies an important place. Only through industrialdevelopment by increasing the rate of production and employment the rate ofgrowth of Indian economy can be increased. Prior to Independence, industrialdevelopment was very low in India, but after Independence, government laidgreat emphasis on the industrial development of the country. As a result of it,many new industries were established in the country and production capacityand the efficiency of the existing industries were also enhanced. Under theFive Year Plans, the industrial development has also been given muchimportance.
1.1 Need for Rapid Industrialisation
From economic point of view industrialisation is very much importantin India. The need for rapid and balanced growth of industrialisation is due tomany causes which are as follows :–
1. Help in Establishment of Balanced Economy
Indian Economy is an unbalanced economy because the bulk of workingpopulation and capital of the country is engaged in agriculture. Thereis uncertainty in agriculture. Industrialisation will make the economy abalanced one and it will reduce the dependence on agriculture.
2. Increase in Employment
Through industrialisation, new industries are established. As a result ofit, the millions of unemployed persons get work in these industries,and it will solve the unemployment problem of the country. In 2009-10the share of industries in the total employment of the country was 21.9%
3. Increase in National Income
In India, industrialisation will bring better and proper utilisation ofnatural resources. It will increase total production, employment nationalincome and per capita income of the country. The contribution ofindustries in the national income of India is about 28 percent.
4. Less Pressure of Population on land
About 70% of India’s population depends on agriculture, Which is themain cause of the backwardness of Indian agriculture. The developmentof industries will reduce the pressure of population on agriculture. As
259

260
a result of it the size of the agricultural holding increases and there willbe more agricultural development.
5. Essential for National Defence
Through industrialisation many industries like iron, steel, aeroplanes,defence, production etc. can be established which are very importantfor the security of the country, because these industries manufacturelarge quantity of war materials.
6. Self-dependence
Industrial development makes provision for the production of essentialgoods in the country. As a result there will be less dependence onother countries and our country will become self-sufficient in theproduction of large number of goods.
7. Production of Socially Usefull Goods
Through industrialisation the production of essential goods like cloth,cycles, electric goods, paper, oil etc. has become possible.
2. GROWTH OF INDUSTRIALISATION IN INDIA
Before independence there was a lopsided development of industriesin India. The basic big industries like – machines, iron and steel, electrical goods,and the industries relating to the means of transport were having very littleimpact in the country. There were only the consumer goods industries likecloth, jute, sugar, matches etc. in the country. Small scale and cottage industrieswere also not well developed. But after the independence, industrialization ofthe country has been done to a great extent. As a result of it, India ranks 10thin the industrialised countries of the world. The main features of the same areas follows:-
(i) Strong Industrial Base
With the economic planning the industrial base of India has becomestronger than before. The share of consumer goods industries was 70%in 1951. Whereas, now it is only 30%. In the planning period, with thedevelopment of basic industries like steel, machines, electric goods,engineering goods there has been more variety in production. Manynew and important goods are now being produced in the country. As aresult of it, the industrial development has become more balanced.
(ii) Modernisation
The production techniques of many industries have been improved bymodernisation of industries. The production techniques of new industrieshas been kept at the most modern level. Foreign technical assistance

261
has been obtained for this purpose. As a result of it, the quality of
industrial production has improved.
(iii) Development of Public Sector
In public sector many different industries have been set up through
heavy investment which were essential for rapid growth of economic
development and in which private sector was not interested. In 1951,
the public sector’s total investment was Rs.29 crores which increased to
Rs.20,2020 crores in 1998.
(iv) Building Up of Infrastructure
For industrial development, the infrastructure like – electricity, roads,
railways, means of communication, finance etc. are very much required.
Under five year plans, a lot of infrastructure has been built up like :
Many new industries have been set which are manufacturing electrical
goods, railway engines and wagons, telephone equipment etc. and many
industrial financial institutions have also been set up in India.
(v) Increasing Share of Industries in National Income and Exports
The percentage contribution of industries has been increasing in national
income of India. In the First Five Year Plan, only the 16% of total national
income was contributed by industries, but during the whole Five Year
Plans period, due to the impact of industrial development, about 28%
of national income was contributed by industrial sector. In India, about
45% of total exports is contributed by industries.
(vi) Increase in Foreign Collaborations
During the planning period a large number of industries have been
established with the help of foreign assistance. As a result of new
industrial policy, it is expected to rise more rapidly. Now Indian have
established different industries in foreign countries like – Malasia,
Indonesia, Nepal etc.
(vii) Increase in Industrial Production
Due to five year plans, industrial production of the country has increased
to a great extent. Many new goods are being produced in our country.
The estimate of the increase in industrial production during the planning
period can be made by the following table:-
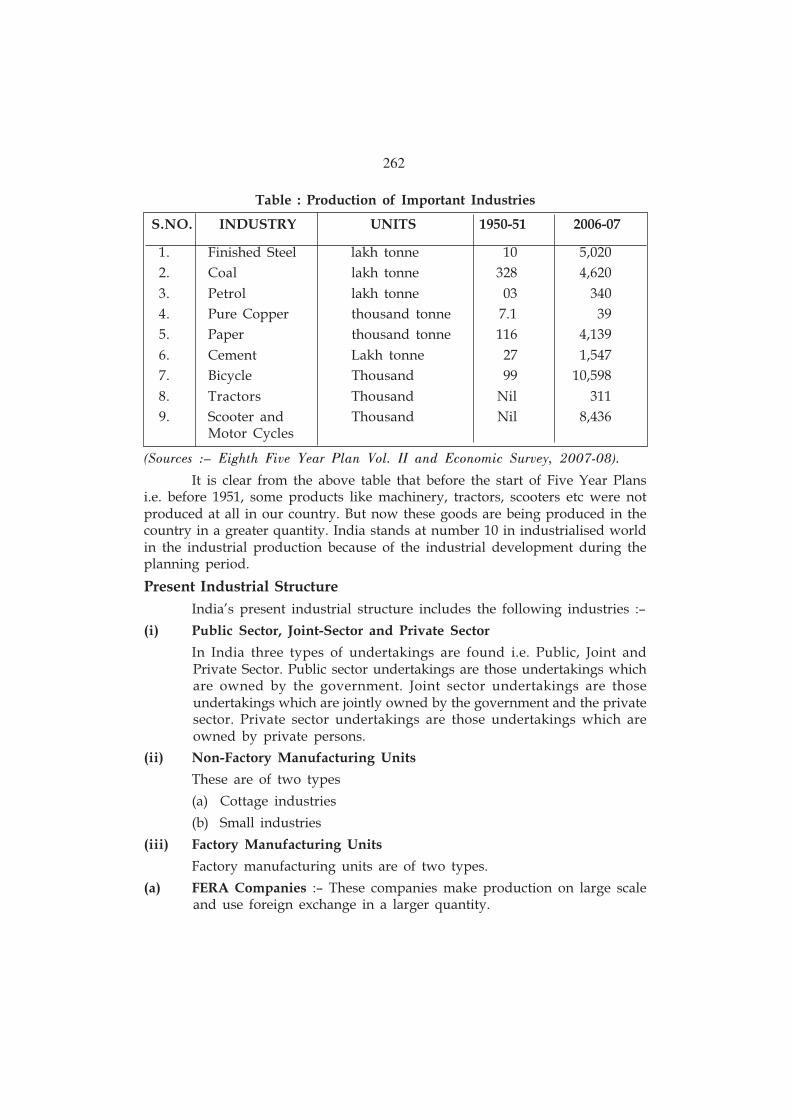
262
Table : Production of Important Industries
S.NO. INDUSTRY UNITS 1950-51 2006-07
1. Finished Steel lakh tonne 10 5,020
2. Coal lakh tonne 328 4,620
3. Petrol lakh tonne 03 340
4. Pure Copper thousand tonne 7.1 39
5. Paper thousand tonne 116 4,139
6. Cement Lakh tonne 27 1,547
7. Bicycle Thousand 99 10,598
8. Tractors Thousand Nil 311
9. Scooter and Thousand Nil 8,436Motor Cycles
(Sources :– Eighth Five Year Plan Vol. II and Economic Survey, 2007-08).
It is clear from the above table that before the start of Five Year Plansi.e. before 1951, some products like machinery, tractors, scooters etc were notproduced at all in our country. But now these goods are being produced in thecountry in a greater quantity. India stands at number 10 in industrialised worldin the industrial production because of the industrial development during theplanning period.
Present Industrial Structure
India’s present industrial structure includes the following industries :–
(i) Public Sector, Joint-Sector and Private Sector
In India three types of undertakings are found i.e. Public, Joint andPrivate Sector. Public sector undertakings are those undertakings whichare owned by the government. Joint sector undertakings are thoseundertakings which are jointly owned by the government and the privatesector. Private sector undertakings are those undertakings which areowned by private persons.
(ii) Non-Factory Manufacturing Units
These are of two types
(a) Cottage industries
(b) Small industries
(iii) Factory Manufacturing Units
Factory manufacturing units are of two types.
(a) FERA Companies :– These companies make production on large scaleand use foreign exchange in a larger quantity.

263
(b) MRTP Companies :– These companies work under Monopoly andRestrictive Trade Practices Act (MRTP-Act) and they produce on a verylarge scale.
In the industrial production of India the importance of cottage and smallscale industries is more in comparison to other industries except public sectorundertakings. About 40% of total production of the country is contributed bythese undertakings. The percentage share of “FERA Companies”, MRTPcompanies and other private companies in the total production is less than thecottage and small scale industries in our country.
4. COTTAGE INDUSTRIES
“Cottage industries are those industries which are completely or partiallyrun by the members of a family either as a whole time business or as a parttime business”. Mostly these type of industries are run by the artisans in theirhomes. Machines are rarely used. Usually these industries fulfil the localrequirements. These industries are run by the members of the family. Workerson labour basis are rarely used. They need very less capital. Since theseindustries are mainly situated in villages, so these are also known as “Villageor Rural Industries”.
(a) Importance
Following are the main advantages of these industries :–(i) Employment opportunities have increased in the Villages because of the
establishment of cottage industries.(ii) Artistic costly goods are also produced in these cottage industries.(iii) Tendency of shifting population from villages to cities is reduced by their
establishment in the villages.
(b) Causes of DeclineThe main causes of decline of cottage industries of India are as follows:-
(i) ‘Cottage industries’ production cannot compete with the cheapproduction made by modern industries.
(ii) They do not get cheap finances in an adequate quantity.
(iii) Village artisans do not have the knowledge of modern businessprogresses, researches, designs and techniques of selling andadvertising.
(c) Measures for Development
Various measures have been taken up for the development of cottageindustries like :-
(i) Khadi and Village Industries Commission has been set-up which looksafter the special needs of these industries.
(ii) Economic assistance is given to promote sales of these industries.

264
(iii) Many institutions have been set-up to give them advice regarding theimprovement in designs and to boost up their production and sales.
4.1 Small Scale Industries
Meaning
Small scale industries were defined on different basis but since June,1997 all those factories were included in small industries which have aninvestment of Rs.3 crore in fixed capital. In ancillary industries the limit oncapital is fixed as Rs.3 crore and in Small industries the limit on capital is fixedas Rs.25 lakh. In 1996-97, there were 27.24 lakh tiny industries in India whereasin Punjab there were 1.88 lakh tiny industries and 415 large and medium scaleindustries. In 2003-04 there were 115.22 lakh industries in India.
4.2 Difference Between Small Scale and Cottage Industries
Clarifying the difference between small scale and cottage industries,the Fiscal Commission has written that “Cottage industries are normally set-upin rural areas and these are related to agriculture and they provide full timeemployment to the people. Whereas small-scale industries are set-up in citiesand semi-urban areas and they provide full time employment to the workers.”
The main differences in these are as follows :
(i) Cottage industries are normally set up in villages and they arespread throughout the country, whereas small scale industriesare mostly set-up in cities.
(ii) In cottage industries, only family members work whereas insmall-scale industries, work is done through hired workers.
(iii) Cottage industries normally fulfil the local needs whereas small-scale industries produce goods for cities and semi-urban areas.So their production market is very large.
(iv) In cottage industries, production is done with the help of simpletools and very less capital is required. Whereas small scaleindustries are run with power and more working capital is alsorequired.
(v) In cottage industries, traditional goods like khadi mats and shoesetc. are produced whereas in small-scale industries modern goodslike Radio, Television, Electrical and Electronics goods etc. areproduced
4.3 Importance of Small-Scale and Cottage Industries
The importance of small-scale and cottage industries is clear from thefollowing factors:-
(i) More Employment :– In cottage and small-scale industries, moreemployment can be given by investing less of capital. These industriesare labour-intensive. Therefore, there is more possibility of increase in

265
employment opportunities with the development of these industries.
(ii) Equal Distribution of Wealth :– Income and wealth are equallydistributed because of these industries. Its reason is that in theseindustries capital is not centralised in the hands of a few people ratherit is divided in a smaller quantity. Therefore, whatever income isgenerated from these industries, its benefit goes to the maximumnumber of people.
(iii) Decentralisation :– Mostly big industries have the tendency of beingcentralised at one place in cities. As a result of it the economicdevelopment of the country becomes unbalanced and there is always afear of these industries being destroyed by the enemy during the daysof war, whereas small-scale industries are spread over the entire countryand there is no fear of these being destroyed during the days of war.As a result of it, the demerits of urbanisation in cities, like, shortage ofhouses, increase in prices, exploitation of women and children etc. areavoided.
(iv) Increase in Production :– There is a keen possibility of increase inproduction of the country by these industries. Out of the total industrialproduction 60% is obtained from big industries and 40% from cottageand small scale industries.
(v) Exports :– There is a lot of importance of these industries in the exportsof the country. In 1996-97, in the total exports of the country the smallscale sector’s contribution was 34%. In the export of non-traditionalgoods like electrical goods, electronic equipment etc. small scale sector’sshare was 38%.
(vi) Use of Local Resources :– Small scale industries use those resourceswhich they get locally. These resources are not required by big industries.
(vii) Less Pressure of Population on Agriculture :– Land has been dividedinto smaller pieces because more population is dependent on agriculture.Every year 30 lakh more people are added to become dependant onagriculture. To reduce the burden on land, establishment of cottageindustries is very much essential.
(viii) Suitable for under-developed country like India :– In India capital isscarce and workers are in abundance. Such type of industries are labour-intensive. Therefore in an underdeveloped country like India, theseindustries are even more important.
(ix) Artistic Goods :– The production of artistic goods is possible only throughthese industries. In India such type of goods are manufactured by theseindustries like Banarsi Sarees, Ornaments and Ivory goods etc.
(x) Individual Taste :– These industries can produce according to the tasteof every customer. Thus these industries have special importance tofulfil the individual tastes of the people.

266
(xi) Complementary of Large Industries :– These industries arecomplementary to big industries. These industries can produce thosegoods which are also used in big industries like small parts of cycles,motors, machines etc. can be manufactured in a cheaper way in smallscale industries.
(xii) Experience from Foreign Countries :– These industries played animportant role in the development of the countries like Japan, Americaand England. In Japan 83% of population work in these industries. InAmerica these industries give employment to 65% of labourers and inEngland 30 lakh people work in these industries.
4.4 Problems of Cottage and Small Scale Industries
The main problems of cottage and small scale industries are as follows:–
(i) Problem of Raw Material and Power :– These industries do not getraw material in sufficient quantity and whatever material they get it isof poor quality and for it they have to pay higher prices. As a result ofit production cost increases. These industries have also to face theproblem of the shortage of electricity and coal.
(ii) Problem of Finance :– In India credit is not available to these industriesin sufficient quantity. They have to depend on money-lenders for financewho charge very high rate of interest.
(iii) Old Methods of Production :– In these industries mostly old methodsof production are used. Old tools like oil press for oil expelling orhandlooms for weaving clothes are used. As a result of it the quantityof production decreases and poor qualities of products aremanufactured. Their demand in the market goes down.
(iv) Problems of Marketing :– The entrepreneurs of these industries facemany problems in selling their products at fair price and quantity becausethe outward look of the products produced by these industries is notgood.
(v) Competition with Large Scale Industries :– The main problem of theseindustries is that they have to compete with the goods produced in bigindustries. Goods produced by big industries are comparatively cheaperand of good quality. Thus, the small scale industries cannot competewith big industries.
4.5 Measures For Improvement
(i) Restricted Production Programme :– According to this programme, theproduction of some goods has been reserved for small scale industriesand expansion of big industries is prohibited. Thus 836 goods havebeen reserved to be produced by small scale industries.
(ii) Purchase by Government :– Government also purchases a lot of goodsmanufactured by small scale industries. National Small Industries
267
Development Corporation helps a lot to the small scale industries inselling their goods to the Government.
(iii) Financial Help :– Government banks and state financial corporationsprovide sufficient finance at lower rate of interest to the small scaleindustries. For this purpose Small Industries Development Bank hasbeen set-up.
(iv) Marketing Facilities :– Special efforts have been made for selling goodsmanufactured by these industries. In different parts of the country, storesand shops are opened to sell the goods produced by these industries.In foreign countries, publicity is done through advertisement, exhibitionsand fairs in order to sell their products.
(v) Technical Assistance :– To provide technical assistance, Small IndustriesService Institutions (SISI) have been set-up in all the states by SmallIndustries Development Organisation.
(vi) District Industries Centres :– To fulfil all the requirements of cottageand small industries a District Industries Centre has been set-up in eachdistrict of the country.
(vii) Industrial Estates :– For the development of these industries,Government has set-up industrial estates. In these industrial estates,government acquires the land and then develops it. Buildings areconstructed for industries. Arrangements are made for water, electricity,gas, rail and safety purposes. After that the government sells thesesheds at low price or on rental basis to the industrialists.
(viii) Other Concessions :– Small scale industries are given different types oftax incentives and other financial incentives which are not available tobig industries.
5. LARGE SCALE INDUSTRIES
The role of large scale industries is very important for the economicdevelopment of India. The major share of fixed capital invested in industrieshas been invested in big industries. A large portion of the total industrialproduction is received from these industries.
5.1 Classification of Large Scale Industries :- In India large scale industrieshave been classified into four categories:-
(i) Basic Industries :- Basic industries are those industries which providenecessary inputs to agriculture and industries. The examples are : steel,iron, coal, chemical fertilizers, aluminium and electricity.
(ii) Capital Goods Industries :- Capital goods industries are those industrieswhich produce machinery and instruments for agriculture and industries.These include machines, mechnical instruments, tractors, truck etc.
(iii) Intermediate Goods Industries :- Intermediate goods industries are thoseindustries which produce those goods which are used for the production
268
of other goods. The examples of these are tyres, mobile oil etc.
(iv) Consumer Goods Industries :- Consumer goods industries are thoseindustries which produce consumer goods. These include – Sugar, cloth,paper industries etc.
5.2 Importance of Large Scale Industries
The importance of large scale industries in industrialisation of India is clearfrom the following factors:-
(i) Production of Capitalistic and Basic Goods :- For the industrialisationof a country, capital goods like machines, instruments and basic goodslike steel, iron, chemicals are of great importance. The production ofthese capital and basic goods is possible only by large scale industries.For the production of these goods, large quantity of capital and latesttechniques are required. Its arrangement is possible only by large scaleindustries. In Punjab large scale industries produced goods worthRs.13,500 crore in 1994-95.
(ii) Economic Infrastructure :- Economic infrastructure like means oftransport, electricity, communication facilities etc. are very much requiredfor industrialisation. Only big industries can produce means of transportlike railway engines and wagons, trucks, motors, planes etc. Theproduction of big electrical equipments, transformers, means ofcommunication like telephone, radio, transistor etc. is possible only bylarge industries. Thus large scale industries, by providing the means ofeconomic infrastructure can speed up the pace of industrialisation.
(iii) Research And High Technique :- For industrialisation of any country,research and high techniques are of very much important. A lot of moneyand able researchers are required for this purpose. Only large scaleindustries can arrange required money for research and able researchers.
(iv) Increase in Productivity :- Because of large investment in big industries,per unit capital is more. Per unit productivity increases a lot because ofit. Prices decrease because of increase in productivity and as a resultdemand increases. By the increase in quantity of industrial production,the chances of setting up of new industries increase which results in thedevelopment of cottage and small scale industries. As a result of it thetendency towards industrialisation increases in the country.
(v) Availability of Economies :- Because of the establishment of large scaleindustries goods are produced on large scale and at low cost. As aresult of it industries start enjoying many types of economies whichresults in the reduction of their costs. Their competitiveness increasesin the internal and external market. As a result of it the setting up ofmany new and export-oriented industries becomes possible.
(vi) Establishment of Ancillary Industries :- The large scale production ofsome goods like aluminium, steel, cars etc. is possible only in large

269
scale industries. The setting up of some ancillary units is encouragedbecause of these industries. For example with the setting up of MarutiUdyog Ltd. the establishment of many ancillary industries like rubber,plastic, electricity etc has become possible. These Industries produceraw material for Maruti Udyog. In this way the development ofindustrialisation has taken place in the country.
6. Causes For Slow Progress of Industrial Development of the Country :-Though India’s place in the industrialised countries of the world is 10th
yet india’s industrial development is very slow and it is at a very lower rate.The industrial history of India tells that whereas very less attention was givento the setting up of industries before Independence, but special measures havebeen taken for the setting up of industries after Independence especially duringFive Year Plans period since 1951. That is why there has been some improvementin economic conditions. Causes of the slow progress of India’s industrialdevelopment are as follows:-
(i) Foreign Rule :- The English rule remained in India for about 150 years.During this period they destroyed the cottage and small scale industriesof India and made it raw-material exporting market. Even those fewindustries which were set-up in the country, were the results of theefforts of private individuals. The English Government followed theDiscriminating Protection Policy for the industries. Only a few industriesgot the benefit of this policy.
(ii) Scarcity of Capital :- For the development of industries, capital is verymuch needed. In India majority of the people are poor and they can notaccumulate capital. Those people who have capital, they prefer to investthe same in more safer activities like purchase of property, Govt. bonds,business, Gold or construction of houses etc. and they do not take therisk by investing the money in industries.
(iii) Shortage of Skilled Workers :- Skilled hard working and honest workersare very much required to run the modern industries in a proper way.There is shortage of skilled and honest workers in India. Most of theworkers here are the farmers doing agriculture. They come to cities forjobs for some time. They do not try to take the necessary training towork in industries. Thus the work done by them is of poor quality andis very costly.
(iv) Shortage of Cheap Energy Resources : Cheap energy is required to runthe industries. There are three main energy resources in India – coal,oil and electricity. The coal which is available in India is of poor qualityand the coal mines are situated only in specific areas, like Bihar andWest Bengal. A lot of money is being spent in sending the coal todifferent parts of the country. Abundance of electricity can be generatedin India but even this has not been fully developed. India has to depend

270
on other countries for oil. Oil prices have increased many folds since1973.
(v) Shortage of Efficient Managers :- In India there is a shortage of ableand efficient managers and industrialists. India has always been aagriculture dominating country because of the prevalence of socialatmophere, orthodex thinking of the people and lack of educationalfacilities. Even educated people want to do clerical or government servicerather than running an industry.
(vi) Shortage of Raw Material :- In India raw-material for industries isavailable in very less quantity and of poor quality. After the partitionof the country there was a shortage of jute and cotton-etc. A lot ofmoney was to be spent in importing these goods from foreign countrieswhich resulted in the increase of production costs. Poor quality goodswere produced because of the poor quality of raw-material. The shortageof a few minerals like tin, glass, sulpher, zinc etc. has proved greathindrance in the industrialisation of our country.
(vii) Poverty :- India is a poor country. The demand for costly industrialgoods remains limited because of poor people. The rate of industrialprogress is very slow due to the lack of demand. Due to poverty, savingsare less and as a result investment is also less.
(viii) Shortage of Financial Organisation :- Every industry needs financefrom time to time. If that finance is available at low rate of interest andin sufficient quantity then industries can progress a lot. There is ashortage of financial organisation like industrial banks providing longterm loans to industries at low rate of interest. Before Independencethere was no industrial bank. Now some financial organisations havebeen set up but these are also not able to fulfil the whole needs ofindustries.
(ix) Unplanned Development :- In India, Industries have not been set-upin any planned way. In few cities like Mumbai, Kolkata, Ahmedabad,Chennai, Delhi, Bangalore etc., most of the industries have been set-up,whereas other areas of the country have remained industrially backward.This unplanned setting-up of industries is harmful from the economicpoint of view, improper from war point of view and unwanted fromsocial point of view.
(x) Less Development of Transport and Communication :- For thedevelopment of industries it is essential that transport and communicationmeans are fully developed so that raw-materials to the factories andfinished goods to the market are easily sent. But in India these meansare less developed. Even telephone, telegram, postage etc. were notdeveloped upto the satisfaction level. For foreign trade we have todepend mainly on foreign ships.

271
(xi) Government Interference :- Before 1991, there were many Governmentrestrictions on industries. Some industries were not allowed to be set-up in private sector. There were different types of restrictions on theexpansion of large industries. A lot of time was wasted in getting theapproval from the government for setting-up of the industries. Therewas slow development of industries due to the government interference.But now with new liberal industrial policy, this problem has been solvedto a great extent.
7. ROLE OF GOVERNMENT FOR ENCOURAGEMENT OFINDUSTRIAL DEVELOPMENT IN INDIA
To speed up the pace of Indian economy, to achieve the target of selfreliance and to increase the means of employment and income the governmentof India has given great importance to the development of industries underFive Year Plans. As a result of it, the development of industries has been veryfast which is clear from the following facts :–
(i) Public Sector Outlay During Five Year Plans and Increase inIndustrial Production Growth :– In India the process of Five YearPlans was started in 1951. A very huge amount of money has beeninvested for the development of industries in public sector from the IstFive Year Plan upto the Eighth Five Year Plan. As a result of it the roleof industrial development has increased.
Expenditure on industries in public sector is increasing right from theFirst Plan As a result of it, Industrial Production Growth rate has alsobeen continously increasing.
(ii) More Credit Facilities :– To speed up the industrial developmentGovernment has set-up many financial institutions in the country forproviding loans to industries like-Industrial Finance Corporation in 1948,National Industrial Development Corporation in 1954, RefinanceCorporation in 1958, Industrial Credit and Investment Corporation ofIndia (ICICI) in 1955, Industrial Development Bank of India (IDBI) in1964, Unit Trust of India and Small Industries and DevelopmentCorporation of India (SIDCO). Through these financial institutions,financial requirements of the industries are met.
(iii) Establishment of Basic Industries :– The Government of India hasgiven more emphasis on the establishment of basic industries in orderto increase the pace of economic development in the country. Therewere only 5 units in public sector in 1951 which have increased to 264 in1996. Similarly capital investment has increased from Rs.29 crores, toRs.118492 crores. The private sector is also developing side by side. Inthis way India has become self-sufficient in case of Industrial consumergoods.

272
(iv) Development of Means of Transport :– The means of transport arevery much important for the industrial development. Thus means oftransport have been developed tremendously in the country so thatindustries can be decentralised and their goods can be sent to far awayplaces with ease.
(v) Development of Power Sector :– Cheap electric power is very muchessential for the development of industries. For this purpose, multi-purpose project plans and thermal power houses were set-up underFive Year Plans to increase the production of electricity. Electricityproduction has increased from 5.1 billion Kilowatts in 1951 to 296.7billion kilowatts in 1996. With the increase in electricity production andfulfillment of power requirements of the industries, the production ofindustries has increased many-fold.
(vi) Invention Promotion and Import Substitution :– For the promotionof inventions in the country, Inventions Promotion Board’ was set-upin 1960. Its’ main objective is to give financial and technical assistancefor inventions. Similarly in order to achieve self-sufficiency in case ofthe raw material and new techniques which were earlier being importedfrom foreign countries, the import Substitution Board was set-up in1966. It’s main purpose is to encourage import substitution.
(vii) Industrialisation of Backward Areas :– For the development ofbackward areas main stress is being given on the industrialisation ofthese areas. In order to encourage the setting up of industries in theindustrially backward areas of the country after identifying industriallybackward areas, many facilities like subsidy, credit at cheap rates, supplyof electricity and of raw material etc. are given. For the development ofbackward areas a target of 100 development centres and Rs.3000 croresof investment were earmarked in the Eighth Five Year Plan.
(viii) Renewal of Sick Industrial Units :– For the renewal of sick industrialunits in the country, Board of Industrial Finance and Reconstructionand National Renewal Fund were set-up. For example government hastaken control over 125 sick cotton textile units and National TextilesCorporation has been set-up for the management of these units. Similarlyefforts are being initiated for the renewal of 58 industrial units of publicsector which were running in losses. In 1992-93 a loan of Rs.500 crorewas given on concessional rates to the National Renewal Fund byInternational Development Agency.
(ix) Establishment of Technical Development Board :– TechnicalDevelopment Board was set-up in 1976. Its main objective was themodernisation of industrial units and upgradation of technology inindustrial capital goods, technical knowledge, Drawing and design andconsultancy services from foreign countries to make them capable of

273
adopting latest technology. Now a limit of Rs.2 crore per annum hasbeen fixed to import essential goods regarding upgradation oftechnology. Keeping in view the requirements of units permission canbe granted to import capital goods exceeding this limit.
(x) New Industrial Policy and Industrial Development :– In July 1991,revolutionary changes were made in industrial policy. Now except for18 industries there is no need of obtaining a licence for setting-up otherindustries. In 1999 only 6 industries had to obtain liscence. Throughthis liberal policy efforts have been made to encourage foreigninvestment. By this policy efforts are being made to encourage privationand pushing the economy towards Free Market Economy. Every possibleeffort is also being made to improve the public sector.
In this way by taking up the above mentioned steps by thegovernment, industrial development has been encouraged a lot in India.As a result of it the country has become almost self-sufficient in industrialgoods.
QUESTIONSI. Very Short Answer Type Questions :
1. Explain any one important factor needed for rapid industrialisation in India.
2. Give any two examples of basic industries.
3. What is meant by Cottage industries?
4. What is meant by small scale industries ?
5. State one problem of small scale industries ?
II. Short Answer Type Questions (Answer in about 50-60 words) :
1. Explain the reasons behind the need for rapid and balanced industrialisation inIndia.
2. Explain the present situation of industrial development of India.
3. What do you mean by small scale and cottage industries in India? What are theirproblems?
4. What is the importance of small scale and cottage industries in India?
5. Distinguish between small scale and cottage industries in India and suggestremedies to solve their problems.
6. Explain the role of large scale industries in industrialisation of India.
7. Discuss the importance of large scale industries.
8. What are the reasons responsible for slow progress of industrialisation in India?
9. Write a short note on the role of government to encourage the development ofindustrialization in India.
__________

CHAPTER 5
INDIA’S FOREIGN TRADE
1. INTRODUCTIONForeign trade is the trade between one country and the other countries.
Goods sent from one country to the others are called Exports. For example,India exports tea and jute products to England. Goods that a country gets fromother countries are called Imports. The difference between the value of exportsand imports of a country during one year is called Balance of Trade. On theother hand, the difference between the value of exports and imports of alltypes of goods, services and capital from a country during one year period iscalled Balance of Payments. As a matter of fact, balance of trade is also a partof balance of payments. If the value of exports of a country is more than thevalue of its imports, then its balance of trade will be favourable. On the contrary,if the value of exports is less than the value of imports then balance of tradewill be unfavourable.
Because of unfavourable balance of trade the foreign exchange reservesof the country fall short, and because of favourable balance of trade, the foreignexchange reserves of the country rise. When foreign liability of a countryincreases on account of unfavourable balance of trade, the same is dischargedeither by getting foreign loans or out of the gold reserves of the country orthrough already saved foreign currency of the country.
2. IMPORTANCE OF FOREIGN TRADEForeign trade has an important place in the economy of every country.
In the words of Robertson, “ Foreign trade is an engine of growth”. Itsimportance to Indian economy is as under :-(i) Full Utilization of Natural Resources :– A Country establishes and
runs those industries from which it gets maximum comparativeadvantage. It sells its products in those countries from where it getshighest price. Consequently, it makes the maximum utilization of itsnatural resources.
(ii) Encouragement of Industrialisation :– Through the medium of foreigntrade a country can easily obtain necessary equipments, raw-materialsand technical know-how for developing its industries. Thus industrialdevelopment is encouraged in the country.
(iii) Improvement in International Co-operation and Harmony :– As a resultof foreign trade, citizens of different countries come into close contactwith one another and they know their ideas and viewpoints. Thispromotes cultural co-operation and mutual confidence.
(iv) Availability of Cheap Goods :– As a result of foreign trade we getcheap and quality goods from other countries. Consumption of suchgoods add to the economic welfare of the people and their standard ofliving improves.
274

275
(v) Geographical Development :– Due to balance of foreign trade eachcountry specializes itself in the production of those goods in which itenjoys maximum natural advantage or minimum cost of production. Thus,foreign trade activities make possible the geographical development inthe country.
(vi) Improvement in Production Capacity :– Due to foreign trade,industrialists of the country live under the constant fear of foreigncompetition. They are aware of the fact that if they failed to producehigh quality goods at low prices, demand for their goods will fall. Theyare, therefore, always engaged in improving their efficiency andtechnique of production.
(vii) Check on Monopoly Power :– Because of foreign competition,monopolistic tendencies in the field of foreign trade are kept undercontrol. In this way, industrialisation of the country is encouraged.
(viii) Availability of Raw-Materials :– Foreign trade makes essential raw-materials easily available to different countries. This encourages theindustrialisation of the country.
(ix) Equality in Price Level :– Due to foreign trade there is a tendency forthe prices of goods and services to become equal in almost all countriesof the world.
(x) Availability of Foreign Exchange :– Foreign trade is the most importantsource of earning foreign exchange.
(xi) Revenue to the Government :– By imposing export and import duties,the government earns a great amount of revenue.
Importance of Imports and Exports for Indian Economy
2.1 Importance of Imports :-The following is the main importance of imports for Indian economy.
(i) To Meet the Shortage of Essential Consumer Goods :– Indian economycan meet the shortage of essential consumer goods like foodgrains, edibleoils, sugar etc. through imports. For example, in 1994 due to lessproduction of sugarcane in the country, there was shortage of sugar.To meet this shortage of sugar, it was imported in huge quantity fromforeign countries.
(ii) To meet the Need of Capital Goods :– India needs many capital goodslike machinery, equipments etc., for its industrial development. Out ofthese some capital goods can not be produced at all in India. In thisway, the need of capital goods like machinery can be met throughimports.
(iii) To obtain Important Inputs :– For industrial and agriculturaldevelopment of India, many important inputs like petrol, chemicalfertilizers, minerals etc. are needed. These cannot be produced insufficient quantity in the country. Thus, their shortage can be metthrough imports.

276
2.2 Importance of Exports
The importance of exports in Indian economy is as follows:-
(i) Export of Surplus Production :– In India the production of someproducts like tea, jute etc. is more than its domestic needs. Theadvantageous and large scale production of these products is possibledue to the exports of these to the foreign countries.
(ii) To obtain Foreign Exchange :– India requires foreign exchange for itsimports. This foreign exchange can be obtained by exporting its products.
3. VOLUME OF FOREIGN TRADE
Before independence, foreign trade was not much. In 1934, India’s totalforeign trade was of Rs.186 crores. But since independence, volume of India’sforeign trade has increased many fold. In 1951, the value of India’s foreigntrade was Rs.1250 crore which rose to Rs.28,26,116 crore in 2010-11 out of theseexports are of Rs 11,42,649, crore and import are of Rs 16,83,467 crore.
3.1 Volume of Foreign Trade During Plans
Now India has trade relations with almost all the countries of the world,and the list of import and export goods include thousands of commodities. Thefollowing table shows the volume of foreign trade of India during Five YearPlans period after independence :–
TABLE 1
Volume of Foreign Trade (Rs. In crores)
YEAR IMPORT EXPORT TOTAL
1950-51 650 600 1,250
1960–61 1,122 642 1,764
1970–71 1,634 1,535 3,169
1980–81 12,549 6,711 19,260
1990–91 43,193 32,558 75,751
2000–01 2,30,873 2,03,571 4,34,444
2009–10 1,363,736 8,45,534 2,209,270
2010–11 1,683,467 1,142,649 2,826,116
(Source : Economic Survey, 2011-12)
It is clear from the table 1 that :-
(i) In 1950-51 the imports of India stood at Rs.650 crore and these went upto Rs.1,683,467 crore in 2010-11.
(ii) The exports of India which were Rs.600 crore in 1950-51, went up toRs.1,142,649 crores in 2010-11. Dispite various export pro motion schemesin India, exports are less than imports.

277
4. MAIN EXPORTS AND IMPORTS OF INDIAIndia exports and imports about 7500 goods. The imports and exports
are increasing continously. The main imports and exports of India are asfollows :–
4.1 Chief Items of Import :– Mostly India imports the following itemsfrom foreign countries :–
(i) Machinery :– In order to meet the needs of industrialization, India’smaximum imports are of machinery. These machines are imported fromAmerica, England, Germany, Japan, Russia and Europe. In 2011 themachinery worth Rs.1,23,233 crores was imported.
(ii) Iron and Steel :– India is still not self-sufficient in the production ofiron and steel. It imports large quantity of steel from abroad everyyear. It is mostly imported from Germany, America, England, Italy andFrance. In 2011 iron and steel worth Rs.2,5192 crores was imported.
(iii) Non-Ferrous Metals and Metal Products :– India also imports non-ferrous metals like Zinc, Copper, tin and their products from abroad.These are imported from Malaya, Brazil and America. In 2011 theimported value of these metals was worth Rs.1,535,87 crores.
(iv) Petroleum and Petroleum Products :– India imports 35% of its demandfor petroleum and petroleum products from foreign countries. This petrolcomes from Iran, Iraq, Kuwait, and Saudi Arabia. In 1997-98 Indiaimported Rs.3,32,594 crore worth of petrol and petroleum products.
(v) Transport Equipments :– Means of transport are most important forthe economic development of the country. India imports motors, ships,Aeroplanes and other transport equipments from foreign countries. Themeans of transport are imported mainly from Germany, Italy, Japan,America, and Britain. In 2011 the value of these imports was worthRs.1,91,47 crore.
(vi) Chemical Fertilizers :– In India the use of fertilizers is very essentialfor increasing agricultural production. India has been importing fertilizerson a large scale especially from America, Russia and countries of Eu. In2011 the value of imported fertilizers was worth Rs.1,75,68 crores.
(vii) Foodgrains :– After 1947, India suffered serious shortage in theproduction of foodgrains. This shortage was met by imports. Thefoodgrains are imported from America, Australia, Canada, Burma(Mayanmar) and Argentina. In 1975, foodgrains worth Rs.1,058 croreswere imported. However, after Green Revolution imports of foodgrainsdeclined sharply. In the year 2011 only Rs.159 crores worth of foodgrainswere imported from foreign countries.
(viii) Cashewnuts :– India imports unprocessed cashewnuts from abroad andit is re-exported after processing. In 1970-71, cashewnuts worth Rs. 29
278
crores were imported. In 2011 the value of their import rose toRs.3476crores.
(ix) Paper :– India imports paper from many countries like Sweden,Czechoslovakia etc. In 2011 India imported paper and paper board worthRs.5800 crores.
(x) Chemical and Medicines :– India imports from abroad many kinds ofchemicals, machines, dyeing materials etc. In 2011 it importedRs.6161crores worth of chemicals and Rs.1,301 crores worth of medicines.
(xi) Edible Oils :– Imports of edible oils and oilseeds has risen very muchin the last few years. In 2011 India imported oils worth Rs.21826 crores.India imports these oils from America and Canada etc.
(xii) Precious Stones :– Imports of precious stones has also increasedtremendously in India. These are polished and then re-exported. In 2011India imported precious stones worth Rs.63,515 crores.
4.2 Main Items of Exports
Special efforts have been made to promote exports from India sinceindependence. Main items of exports of India are as follows:-
(i) Jute Products :– India occupied the first place in the export of Juteproducts, but in 1994-95 it fell down to 25th. It was the main source ofdollar earning for India. Jute manufactured products are mostly exportedto America, Argentina, Australia, Russia, Britain and Canada. In 2011-12- jute products worth Rs.1025 crores were exported.
(ii) Tea :– India is the largest exporter of tea in the world. In 1997-98 teaworth Rs.1662 crores was exported. Britain, U.S.A., Canada, Egypt, Iraq,Germany and Japan are the main buyers of tea. Large quantity of tea isalso exported to Russia these days. Britain is the largest importer ofIndian tea.
(iii) Cloth and Apparels :– India exports cotton fabrics and garments. In2011 India exported cotton fabrics worth Rs.14648 crores and readymadegarments worth Rs.29758 crores.
(iv) Metallic Ores :– India exports manganese, mica, iron ores etc. to Americaand Japan. In 1997-98 India exported iron worth Rs.1,763 crores andmica worth Rs.101 crores
(v) Spices :– Different kinds of spices like black pepper etc. are exportedfrom India. These spices are exported England, Germany, Italy, France,Iran, Saudi-Arabia, America etc. In 2011 the export value of these spiceswas worth Rs.5967 crores.
(vi) Leather and Leather Products :– India exports leather, footwear andleather products to foreign countries. The main buyers of these are :

279
England, U.S.A., France, Germany and Russia. In 2011 the leather,leather products and footwear worth Rs.10552 crores were exported.
(vii) Oil Cakes :– India exports oil cakes in large quantity. Its main buyersare Japan, Holland and Britain etc. In 2011-12 the export value of oilcakes was worth Rs.4450 crores.
(viii) Tobacco :– India also exports tobacco in large quantity. It is exportedmainly to England, Japan, Russia and Nepal. In 2011-12 value of tobaccoexported was worth Rs.1621 crores.
(ix) Coffee :– Export of coffee from India has been rising. Coffee is exportedfrom India to U.S.A., Italy and Hungary etc. The coffee worth Rs.2297crores was exported in 2011-12.
(x) Gems and Jewellery :– These has been maximum rise in the export ofGems and Jewellery from India. Various types of jewellery are exportedto Hong-Kong, America and Belgium from India. In 2011-12 jewelleryworth Rs.107744 crores was exported.
(xi) Cashew Kernels :– India earns a good revenue from the export of cashewkernels. India exports cashew kernels to Russia, America and Japan etc.In 2011-12 cashew kernels worth Rs.2016 crores were exported.
(xii) Engineering Goods :– India exports engineering goods to Sri Lanka,Saudi Arabia, Egypt, Burma (Mayanmar), Malasia, Indonesia. In theyear 1970-71 only the goods worth Rs.130 crores were exported, but in2011-12 the engineering goods worth Rs.4,40,634 crores were exported.
(xiii) Handicrafts :– Handicraft goods manufactured by cottage industrieslike ivory goods etc. are exported to America, Germany, Saudi Arabiaand Middle East countries. In 2011-12 the value of these exports wasRs.2044 crores. In 1994-95, from Punjab Hosiery goods worth Rs.348crores, Rubber goods worth Rs.182 crore, sports goods worth Rs.102crores and machinery tools worth Rs.181 crore were exported.
5. DIRECTION OF TRADE
Direction of Trade means, the countries from where India importsand the countries to which India exports her goods. Before in dependence,most of India foneign trade was write england and common wealthcountries. But at present, the share of Asia and ASEAN (Association ofsouth east Asian Nations) in total trade increased from 33.3 percent in 200-01 to 57.3 percent in the first half of 2011-12. Share of Europe and Americafell from 42.5 percent to 30.8 percent respectively. During the period of2008-09 to 2010-11, UAE (United Arab Emirates) became India's largesttrading partner followed by China and USA.

280
5.1 Change in the Direction of Exports:
In India's exports, the shave of Asia and ASEAN increased from38.7 percent in 2000–01 to 56.2 percent in 2010-11 The share of Europe andUSA fell from 46.9 percent to 30.8 percent during the same period. UAEhas the largest share in India's exports with a share of 11.9 percent in 2011-12.
5.2. Change in the Direction of Imports:
Asia and ASEAN continued to be the major source of India's imports.The share of Asia and ASEAN has rised from 28.6 percent in 2000–01 to61.5 percent in 2011-12 the share of Europe and U.S.A fell considerably.China has the largest share in India's total import with a share of 11.7percent China is followed by UAE (7.6 perent) Switzerland (6.6 percent)Saudi Arabia (6 perent) and USA (4.7 percent) in 2011-12
TABLE 2
Share in India's Trade
Sl. Country Share in total Trade2011-12 (April-Sept)
1. UAE 9.25
2. China 9.27
3. USA 7.23
4. Saudi Arabia 4.44
5. Switzerland 4.28
6. Hong kong 3.15
7. Germany 3.04
8. Singapore 3.62
9. Indonesia 2.79
10. Belgium 2.09
11. Korea 2.14
12. Japan 2.15
13. Iran 1.68
14. Nigeria 2.39
15. U.K 2.06
Total of Top 15 Countries 59.55

281
Source : Economic survey 2011-12
It is clear from Table–2 that in 2011–12 top 15 countries share in India's foreigntrade is 60% whereas in 2000–01 it was 55.5 percent. In 2007-08, USA was in thetop position whereas in 2011.12 it is in third position. UAE is in the top positionfollowed by china.
QUESTIONSI. Very Short Answer Type Questions :
1. What do you mean by the directions of foreign trade of India?
2. What are the main two exports of India?
3. What are the main two imports of India?
4. What is the importance of exports for Indian Economy ? Write any one.
5. What is the importance of imports in Indian Economy? Write any one.
II. Short Answer Type Questions (Answer about 50-60 words) :
1. Explain the importance of India’s foreign trade.
2. Explain the importance of imports and exports in Indian economy.
3. Explain the volume of foreign trade of India.
4. Describe the main Exports and imports of India.
5. Write a short note on change in volume and direction of India’s foreign trade afterindependence.
6. Describe the direction of foreign trade of India.
*****

CHAPTER 6
ECONOMIC PLANNING IN INDIA
1. INTRODUCTION
After independence, the Govt. of India had started the series of Five
Year Plans for the removal of poverty and to achieve the goal of economic
growth with social justice. Since 1951, a continous process of Five Year Plans
has been in operation in the country. By this time, we have completed Eleven
Five Year Plans and Five One Year Plans. Eleventh five year plans commenced
from April 2007 and completed on 31st March 2012. Twelth five year plan
commenced from April 2012 and will complete on 31st march 2017.
1.1 Definition :– Economic planning is a process under which set objectives
of economic development are sought to be achieved in a delermined period of
time. Keeping in view the available resources of the country. The rapid rate of
economic progress achieved, first of all, by Socialist Government of Russia by
adopting proper technique of economic planning, served as a great source of
inspiration to other countries of the world and they started taking keen interest
in economic planning. Economic planning refers to that process wherein (i) a
central planning authority, (ii) keeping in view the resources of the country,
(iii) in a given period of time (iv) seeks to achieve pre-determined objectives
and (v) makes an effort to control economic factors. To formulate the plans in
India, the Planning Commission was set up in 1950.
2. NEED OF PLANNING
The foremost objective of the Directive principle of the Indian
Constitution is to make available the required resources and to secure subsistence
level for all people and raising their standard of living rapidly. To achieve both
of these objectives, it is essential, that there should be sustained economic
development of the country. Rapid rate of economic development requires that
the resources of the country are properly utilized. This objective cannot be
achieved by the market forces of demand and supply based on profit motive.
It can be achieved by planned development of the economy. Thus for the rapid
economic development of the country, there is a need for economic planing.
Nature of economic planning for underdeveloped countries like India,
has been developmental planning. Economic planning is an important instrument
for rapid economic development of India. It is because of the following reasons
that India has adopted the path of economic development.
(i) Vicious Circle of Poverty :– India has been caught in the vicious circle
of poverty. Thus, there is shortage of both demand and supply. This
282

283
shortage cannot be made up by the private sector. Adoption of economicplanning objective by the government can alone break this vicious circleof poverty.
(ii) Efficient use of Resources :– In an underdeveloped country like India,
private entrepreneurs are misusing the country’s resources. As a result
of it, economic development of the country is adversely affected. The
main objective of economic planning is to make the most efficient use of
country’s resources keeping in view its national and social interests.
This scarcity can be over-come only by planning.
(iii) Balanced Structure of Production :– Production structure of the country
is unbalanced. Agriculture plays an important role. Industry and trade
are less developed. Thus economic planning is essential for their
development.
(iv) Development of Infrastructure :– Means of transport, electricity,
irrigation etc. are very much crucial for the economic development of
the country. There is scarcity of these means in India. Economic planning
is very much essential for the development of these means of
infrastructure.
(v) Problem of Human Resources :– India has large population and its
qualitative aspect is deplorable. Economic planning is needed to bring
down the growth of population and improve its quality.
(vi) Balanced Development :– Private sector does not have enough capacity
to develop all sectors of the economy. It is through economic planning
alone that risky industries requiring huge capital investment and delayed
prospects of profit, can be established.
(vii) Capital formation :– Savings of the people can be collected and invested
through economic planning. Capital can also be obtained from abroad.
Thus economic planning is necessary to increase the rate of capital
formation.
3. OBJECTIVES OF PLANS
The main objectives of economic planning in India are :–
(1) Economic development and
(2) Social Justice
1. Economic Development :– The foremost objective of Indian economic
planning is economic development of the country. The main indicators
of economic development are :-
(i) Increase in the rate of growth of real national income,

284
(ii) Increase in the rate of growth of real per capita income. This
can be possible only when the rate of growth of population is
less than the rate of growth of national income.
(iii) Increase in the standard of living of the people and
(iv) Increase in the level of employment.
2. Social Justice :– The Directive Principles of Indian Constitution haveconsidered the social and economic justice as a basic goal of politics. Accordingly,the main objective of planning is to determine the social and economic justice.There are several aspects of social justice like : (i) To reduce the inequalities inthe distribution of income and concentration of economic power, (ii) Balanceddevelopment of agriculture, (iii) Economic development of the weaker andbackward sections of the society.
4. Progress under Plans or Achievements Under Planning
The achievements of the Indian Planning under Public Sector are asfollows:–
Table 1 : Expenditure of Public Sector under Five Years Plans
Plans Time Period Total expenditure Rate of
of Public Sectors Increase
(Rs. crore) (%)
1. First Five Year Plan v~zv-z{ w,Æ{~ x.{w. Second Five Year Plan v~z{-{v y,{|w y.vx. Third Five Year Plan v~{v-{{ },z|| w.zy. Three One Year Plans v~{{-{~ {,{wz x.~z. Fourth Five Year Plan v~{~-|y vz,||~ x.x{. Fifth Five Year Plan v~|y-|~ x~,yw{ z.Æ|. Sixth Five Year Plan v~}Æ-}z v,vÆ,y{| z.y}. Seventh Five Year Plan v~}z-~Æ w,wv,yx{ z.}9. Two one year plan v~~Æ-~w v,wx,vwÆ x.xvÆ. Eighth Five Year Plan v~~w-~| y,}z,yz| {.|vv. Ninth Five Year Plan v~~|-wÆÆw },z~,ÆÆÆ z.xzvw. Tenth five year plan wÆÆw-wÆÆ| vz,wz,{x~ |.|vx. Eleventh five year plan wÆÆ|-wÆvw x{,yy,|v} }.vvy. Twelfth five year plan wÆvw-v| N.A 9.0(target)
(Source: Economic Survey, 1999, Ninth Plan)

285
Table II : Public Sector Expenditure on Punjab's Five Year Plans
Plan Total Plan Total
Expenditure Expenditure
(Rs. Crore) (Rs. Crore)
1. First Plan (1951-56) 163 7. Seventh Plan (1985-90) 3,5472. Second Plan (1956-61) 151.43 8. Eighth Plan (1992-97) 8,577
3. Third Plan (1961-65) 256.23 9. Ninth plan (1997-2002) 9.76
4. Fourth Plan (1969-74) 425.47 10. Tenth plan (2002–07) 14,823
5. Fifth Plan (1974-79) 940.57 11. Eleventh plan (2007-12) 32,626
6. Sixth Plan (1980-85) 1957 12. Twelth plan (2012–17) N.A
(Economic survey 2011-12)The progress in different sectors of Indian economy during the period
of planning is as follows :—
1. Economic Development or Increase in National Income :- Increase in
national income is an index of economic development. During planning
period in India, national income has remained on an average at the rate
of 3.7 percent per annum. Though, the real rate of growth of national
income has been very low than the targeted rate of growth. As a result
of it, the planning has successfully broken the cycle of stagnation in the
economy. During the Eleventh plan growth rate of 9.1 percent was
achived.
2. Increase in Per Capita Income :- Before independence, increase in per
capita income in India was almost zero but during the planning period
it has increased to 1.7 percent. Per capita income has risen during all
the plans, except the Third Plan.
3. Increase in the Rate of Capital Formation :- Capital formation is very
much essential for the economic development of a country. Rate of capital
formation during the plans has increased. The rate of capital formation
depends on the rate of savings and investments. During Five Year Plans,
the rate of savings and investments has increased. In 1950-51, the rate
of savings was 5.5 percent of national income but it rose to 32.4 percent
in 2010-11.
4. Institutional Reforms in Agriculture and Green Revolution :—
Contribution of Plans to the development of agriculture has been two-
fold – on the one hand, there have been land reforms in the country.
On the other, since 1966, emphasis has been laid on the technological

286
development of agriculture. It resulted into Green Revolution. During
the period of planning, production of foodgrains has increased threefold.
During the period of planning there has been much development in the
agriculture sector. In 1950-51 the production of foodgrains was 550 lakh
tonnes, whereas in 2010-11 the production of foodgrains was 250.4
Million tonnes.
5. Development of Industries :— There has been considerable achievement
in the field of industry due to plans. Growth of basic industries and
capital goods industries such as iron, steel, machinery, fertilizers,
chemical industries etc. has been tremendous. Public sector has been
expanded. India has become self-sufficient in the field of consumer goods
industries. Due to modernisation of the industries, the productive
capacity of industries has tremendously increased. The rate of growth
of industrial production has risen about by 8 percent.
6. Development of Infrastructure :— Infrastructure facilities comprise of
mainly means of transport, and communication, irrigation facilities and
production capacity of power etc.
7. Social Services :— During the plans, social services like education,
medical care, health, family planning etc. have also improved
considerably, which is clear from the following points :–
(i) Death rate reduced from 27 per thousand in 1951 to just 7.2 per
thousand in 1998.
(ii) Average expectancy of Life improved from just 32 years in 1960
to 65.4 years in 2011.
(iii) Epidemics like malaria have been fully eradicated.
(iv) In education sector, number of school going children has risen
by three times as compared to 1951 and the number of college
students has risen by five times.
(v) In health sector, the number of beds and doctors, nurses and
medicines in hospitals and medical facilities like family planning
clinics have considerably increased in the hospitals. The number
of hospitals and dispensaries has increased to 43,000. Now one
doctor is available for every 1900 persons.
8. Employment :— During the plans, considerable efforts have been made
to increase the level of employment. First Plan offered employment to
70 lakh persons, In Fourth Plan 180 lakh people got the employment.

287
Eighth Plan targetted at offering employment to 80-90 lakh persons
every year.
9. Removal of Poverty :— During the planning period, the percentage of
population living below poverty line has been reduced. In 1972-73, the
51 percent of total population was living below the poverty line. Out of
which 54% were from rural areas and 46% from urban areas. In 1996-97
the percentage of population below poverty line has been reduced to
30%.
5. FAILURES OF PLANS
The main failures of Indian plans are as follows :–
(1) No substantial increase in the Standard of Living :– All the Five Year
Plans of India aimed at raising the standard of living of the people. In
fact, what to say to improving the living standard, even the basic
necessaries of life have not yet been provided to the people. On an
average, a normal healthy person needs 2508 calories of food per day,
but in India per capita availability of food is 2400 calories. An individual
gets 16 meters of cloth per annum. Regarding housing, the condition is
deplorable. In 1950-51, per capita income at 1980-81 prices was Rs.1127.
In 2006-07, it increased to Rs.22,533 at 1999–200 prices. In India, 30
percent of population still lives below the poverty line. Despite 62 years
of planning, poverty alleviation programme has not met with much
success. The aspirations that poor and middle-class people had on the
plans had met with poor success.
(2) Rise in Prices :– Price stability was another objective set for each plan.
But almost all the plans witnessed considerable rise in price-level. First
Plan is the only exception when price level came down, but the price
level rose to 6.3% on an average in the Second Plan, in Third Plan it
rose to 5.8%, in Sixth Plan there was 9.7% increase in the prices and in
Seventh Plan increase in price level was 6.7%. Eighth Plan witnessed an
increase of 8.7% in the price level Till March 2007 increase in price level
was more than 6 percent. At present increase in price level is upto 7.4%.
(3) Increase in Unemployment :– During the period of five year plans the
rate of unemployment has been rising. At the end of First Five Year
Plan, 53 lakhs persons were unemployed and 206 lakhs at the end of
Fifth Plan. Even after Sixth Plan 92 lakh persons were unemployed. In
1997-98 the number of unemployed persons was 4 crore. In last 20 years,
employment opportunities have increased by 2.2 percent while the

288
supply of labour has increased by 2.5 percent resulting in an increase in
unemployment In 2009, number of unemployed persons rose to 3.82
crore.
(4) Less Growth in Productive Sectors :– In the Five Year Plans, growth
rate of production was slow in every sector. Priority should have been
given to the development of agriculture in all the plans, but it was not
done. Capital intensive industries were given precedence over agriculture
and village industries. Green Revolution was actually reduced to wheat
and rice revolution.
(5) Inequality in the Distribution of Income and Wealth :– The main
objective of Five Year Plans was the equal distribution of income and
wealth. But the plans witnessed further accentuation of inequality. Rich
class became richer and poor class became poorer. This inequality is
found not only in industrial sector but in agriculture sector also.
According to an estimate, 3% of households own roughly 50 percent of
cultivable land. Slogan of socialism given to the nation during the period
of planning remained a mere slogan.
(6) Inefficient Administration :– An export team of U.N.O. observed that
the main shortcoming of Indian planning was with reference to its
implementation. Plans are formulated after good deal of discussions
and deliberations but their objectives are not achieved due to inefficient
administration, dishonesty, vested interests and red-tapism etc.
(7) Lack of Strong Foundation :– Even after the completion of Nine Plans,
still the economic base is far from being strong. We are still dependant
mainly on nature for the development of agriculture. In 1965-66, 1966-
67, 1979-80 and 1982-83, the entire economy was out of gear due to the
failure of monsoons. Import of foodgrains have to be increased. A little
shortfall in agricultural production in 1982-83 affected the entire
economy adversely. Again, Gulf war in 1991 and Iraq war in 2003 badly
disrupted our economy.
(8) More Ambitious Plans :– Indian Plans are criticised on the ground that
their aims are very much ambitious. Two factors may account for it :
firstly there is shortage of resources and secondly, faulty implementation
of the Plans. There was a wide gap between the targets of growth rate
and their achievements during the period of planning. The average
growth rate of Indian economy has been 4.1 percent as against the targets

289
of 5 percent. This gap between targets and their achievements is a
testimony of failure of planning in our country.
(9) Paradox of Saving and Investment :– Although during the planning
period, there has been appreciable increase in the rate of saving and
investment, yet the growth rate of economy has been very slow. Several
factors account for this paradox :–
(i) Capital output ratio is very high in India. It is around 6:1 and
has been rising constantly. Due its increase the increase in
investment is followed by relatively less increase in production.
(ii) Considerable part of investment is in the form of foodgrains
and not in the form of permanent capital formation. As a result
of it, despite the increase in the investment there is no
corresponding increase in production.
(iii) Large portion of investment is made in traditional sectors instead
of modern one.
10. Foreign Exchange Crisis :– In 1991, Indian economy had to face an
acute foreign exchange crisis. It is because of large amount of foreign
borrowings, payments of interest on these loans and low rate of increase
in exports for the implementation of the plans. Thus, plans have failed
to meet the deficits in balance of payments of the country.
11. Eighth Five year plan (1992–97) :– The Eighth Five year plan in India
Started in April 1992 and completed on 31st March 1997. During the
plan there was a target to spend Rs 4,34,100 crore in Public sector
whereas the real expenditure was Rs, 4, 74, 121, crore.
6.1 MAIN OBJECTIVES OF EIGHTH FIVE YEAR PLAN
I. Objectives :–
1. To achieve the growth rate of 5.6 percent per annum.
2. To achieve the goal of full employment by the end of 20th century.
3. To reduce the growth rate of population.
4. To eliminate illiteracy among the people in the age group of 15 to 35
years.
5. Growth of agriculture in such a way as to achieve the self-sufficiency
in food and generation of surplus output for exports.
6. Provision of safe drinking water and primary health services to all
villages in the country.
290
7. Strengthening of social overhead costs, in other words means of
energy, transport and communication etc. will be developed.
6.3 MAIN ACHIEVEMENTS OF EIGHTH FIVE YEAR PLAN
Eighth Plan which started on Ist April, 1992 was completed on
31st March, 1997. It has the following achievements:-
1. Growth Rate :– The target of Eighth Plan was to achieve the growth
rate of 5.6 percent per annum, but actually the growth rate was 6 percent.
2. Progress in Agriculture Sector :– The growth rate for agriculture sector
was proposed to be 3.1% but it has actually increased to 3.5%. Production
of foodgrains has increased from 1684 lakh tonnes to 1934 lakh tonnes.
3. Increase in Industrial Production :– The period of Eighth Plan was a
period of liberal Industrial policy. The target of industrial production
was fixed as 7.6% per annum which had actually increased to 11.7
percent.
4. Increase in Foreign Trade :– The growth rate of exports for eighth plan
was proposed to be 13.6% which had actually increased to 21.9%.
5. Check on Inflation :– During Eighth Plan rate of inflation has decreased
which was proposed to be 12% but actually it was 7%.
6. Increase in Rate of Saving :– For this Plan, the target of saving rate
was 21.6% but actually the saving rate was 23.9%.
Lastly, it can be said that Eighth Plan has been successful to a great
extent to fulfil the hopes of the people and the government.
7. Ninth Five Year Plan (1997-2002)
According to the Approach Paper, Ninth Plan was started on Ist April
1997 and it was completed on 31st March 2002. Total investment on
public sector was proposed to be Rs.8,59,000 crores.
7.1 MAIN OBJECTIVES OF NINTH FIVE YEAR PLAN
Following were the main objectives of the Ninth Five Year Plan :–
1. To achieve the rate of growth at 7% per annum.
2. To increase the rate of saving from 26.2 percent to that of 28.6 percent.
3. To increase the opportunities for employment and to give priority to
agriculture and rural development.
4. To increase the growth rate in order to keep price stability.
5. To ensure food and nutritional products to the poor.
291
6. To make provision of minimum basic social services such as safe drinking
water, primary education, health care facilities etc.
7. To reduce the growth rate of population.
8. To enable the backward section of society to participate in the socio-
economic changes and developmental plannings.
9. To develop the Panchayati Raj and Co-operative institutions.
10. To achieve the objective of self-reliance in the country.
11. Try to combat the poverty in the country.
12. Lastly, the Ninth Plan aims at achieving the goal of growth with Equity.
Tenth Five year plan (2002–07)
In India, Tenth Five year plan Started on 1st April 2002 and completed on 31st
March 2007. The average growth rate during The plan was 7.8% per year.
8.1 MAIN OBJECTIVES OF THE TENTH FIVE YEAR PLANS
1. To achieve the growth rate of 8 percent.
2. To double the growth rate of per capita income in next ten years.
3. To reduce poverty ratio by 5 percent till 2007 and by 15 % till 2012.
4. Promoting employment
5. To provide elementary education to all till 2007.
6. To reduce sex discrimination by almost 50 percent.
7. To reduce the rate of growth of population by 16.2 percent during the period of
2001 to 2011.
8. To in crease the literary rate by 75 percent during the planning period.
9. To reduce infant mortality rate to 28 per thousand
10. To reduce maternal mortality rate to 1 per thousand.
11. To provide drinking water in almost all the villages.
12. To ensure equal growth in all the states.
8.2 MAIN ACHIEVEMENTS OF TENTH FIVE YEAR PLAN
1. Economic Development— A growth rate of 7.8 percent per year has been achieved
during this period.
2. Progress in Agriculture sector— In 2006–07 the production of food grains in-
creased to 2,173 lakh tonnes and the area under irrigation increased to 551 lakh
hectares.

292
3. Development of Infrastructure—During the planning period there was a great
development of Infrastructure including transportation irrigation, Roadways,
electricity etc.
4. Self-Sufficiently—Self sufficiency has been achieved during the tenth plan. The
percent of import in the natural income has been reduced. The percent of Exports
increased from 20.9% during ninth plan to 24.8% in 2006–07.
9. Eleventh Five year plan (2007–12)
Eleventh plan Commenced from 1st April 2007 and completed on 31st march,
2012. The targeted average growth rate during the plan was 9 percent per year.
9.1 OBJECTIVES OF THE ELEVENTH FIVE YEAR PLAN
1. To achieve development in various fields including reduction in poverty.
2. To develop quality of education and health facilities.
3. To make policy for the second Green Revolution
4. Promoting employment opportunities.
5. To protev environment.
QUESTIONS
I. Very Short Answer Type Questions
1. When and why Economic Planning has started in India?
2. How many plans have so far been executed in India?
3. Describe main objective of Indian planning.
4. Write any main achievement of planning period.
5. What are the main two failures of plannings.
6. Describe one main objective of Tenth Plan.
II. Short Answer Type Questions (Answer in about 50–60 words)
1. What is the meaning of Economic Planning?
2. What is the need of planning for economic development of India?
3. Describe the main objectives of Planning in India.
4. Explain the successes of planning.
5. In which year Planning Commission was established? What are two primary
objectives of planning in India?

293
6. Explain the failures of economic development of India.
7. Write a short note on the objectives and targets of Eighth Five Year Plan.
8. Write main achievements of Tenth plan ?
9. Describe the main objectives of Eleventh Five Year Plan.
*****


![[XLS]jkrevenue.nic.injkrevenue.nic.in/pdf/Flood_2014/Reasi-Paid.xls · Web viewPrem Singh So Naseeb Singh Chassote 0611040860005212 PREM SINGH SO SH NASIB SINGH 55 Pritam Singh So](https://static.fdocuments.us/doc/165x107/5aee45f57f8b9a903190eeec/xls-viewprem-singh-so-naseeb-singh-chassote-0611040860005212-prem-singh-so-sh.jpg)


![[XLS] OF BANK MITRAS 30.04.2016.xls · Web viewDILBAG SINGH BALJINDER SINGH AMRINDER SINGH PARDEEP SINGH LAKHWINDER SINGH JASVIR SINGH MANJIT SINGH CHAMAN SHAM SUNDER SINGH PARVINDER](https://static.fdocuments.us/doc/165x107/5afca7ae7f8b9a994d8c6403/xls-of-bank-mitras-30042016xlsweb-viewdilbag-singh-baljinder-singh-amrinder.jpg)