Raising global eCommerce forecasts on fast growing countries & categories · Raising global...
30
September 6, 2017 Global Internet Raising global eCommerce forecasts on fast growing countries & categories Equity Research eCommerce’s virtuous cycle continues as store closures push more online Raising growth estimates on share gains We are raising our global eCommerce forecasts to reflect the increasing weight of faster growing earlier-stage markets (China, Brazil, India) and categories (Apparel, Grocery) in the mix, as well as the impact of retail store closures (Exhibit 14), better logistics, and new buying models in more mature markets and categories driving continued share gains. Our estimated CAGR over the next three years goes from 17% to 21%, compared to 22% over the last three years, as growth rates in large markets like the US, Europe, and China slow gradually as they mature. Regional snapshots eCommerce globally grew 21% yoy in 2016 (USD basis) primarily on reacceleration in the US and strength in B2C across China/Japan. We highlight key themes across regions within our report, focusing on region-specific trends like Japan’s focus on loyalty and infrastructure, Brazil’s slow but steady macro and GMV concentration, in addition to China’s runway for adoption in lower- tier cities due to weaker offline options. Store closures & voice major themes The growing impact of retail store closures, particularly in the US, and the impact of emerging technologies like AI-driven voice commerce join more mature themes like mobile commerce, and fulfillment and logistics in being the primary drivers of category growth and competitive positioning in eCommerce share gains globally. Across individual regions, shipping programs, promotional/loyalty activity, and improving international economies play crucial roles in determining the pace of eCommerce adoption. GS global top picks Across global coverage we believe the best opportunities in eCommerce span scaled players leveraging network effects and emerging tech to capture share, while we favor traditional retailers best positioned to defend their category and navigate the evolving in-store landscape. Buy: Amazon*, Wal-Mart*, Nike, PayPal*, Ulta*, CarMax, Canada Goose, Just Eat*, Ocado*, Schibsted, Yandex, Alibaba*, JD.com, Yahoo Japan, GLP J- REIT, MonotaRO, Netshoes. * denotes CL Heath P. Terry, CFA (212) 357-1849 [email protected] Goldman Sachs & Co. LLC Matthew J. Fassler (212) 902-6740 [email protected] Goldman Sachs & Co. LLC Lindsay Drucker Mann, CFA (212) 357-4993 [email protected] Goldman Sachs & Co. LLC Piyush Mubayi +852-2978-1677 [email protected] Goldman Sachs (Asia) L.L.C. Irma Sgarz +55(11)3371-0728 [email protected] Goldman Sachs do Brasil CTVM S.A. Goldman Sachs does and seeks to do business with companies covered in its research reports. As a result, investors should be aware that the firm may have a conflict of interest that could affect the objectivity of this report. Investors should consider this report as only a single factor in making their investment decision. For Reg AC certification and other important disclosures, see the Disclosure Appendix, or go to www.gs.com/research/hedge.html. Analysts employed by non-US affiliates are not registered/qualified as research analysts with FINRA in the U.S. The Goldman Sachs Group, Inc. Global Investment Research
Transcript of Raising global eCommerce forecasts on fast growing countries & categories · Raising global...
September 6, 2017
Global Internet
Raising global eCommerce forecasts
on fast growing countries & categories Equity Research
eCommerce’s virtuous cycle continues as store closures push more online
Raising growth estimates on share gains
We are raising our global eCommerce forecasts to
reflect the increasing weight of faster growing
earlier-stage markets (China, Brazil, India) and
categories (Apparel, Grocery) in the mix, as well
as the impact of retail store closures (Exhibit 14),
better logistics, and new buying models in more
mature markets and categories driving continued
share gains. Our estimated CAGR over the next
three years goes from 17% to 21%, compared to
22% over the last three years, as growth rates in
large markets like the US, Europe, and China slow
gradually as they mature.
Regional snapshots
eCommerce globally grew 21% yoy in 2016 (USD
basis) primarily on reacceleration in the US and
strength in B2C across China/Japan. We highlight
key themes across regions within our report,
focusing on region-specific trends like Japan’s
focus on loyalty and infrastructure, Brazil’s slow
but steady macro and GMV concentration, in
addition to China’s runway for adoption in lower-
tier cities due to weaker offline options.
Store closures & voice major themes
The growing impact of retail store closures,
particularly in the US, and the impact of emerging
technologies like AI-driven voice commerce join
more mature themes like mobile commerce, and
fulfillment and logistics in being the primary
drivers of category growth and competitive
positioning in eCommerce share gains globally.
Across individual regions, shipping programs,
promotional/loyalty activity, and improving
international economies play crucial roles in
determining the pace of eCommerce adoption.
GS global top picks
Across global coverage we believe the best
opportunities in eCommerce span scaled players
leveraging network effects and emerging tech to
capture share, while we favor traditional retailers
best positioned to defend their category and
navigate the evolving in-store landscape. Buy:
Amazon*, Wal-Mart*, Nike, PayPal*, Ulta*, CarMax,
Canada Goose, Just Eat*, Ocado*, Schibsted,
Yandex, Alibaba*, JD.com, Yahoo Japan, GLP J-
REIT, MonotaRO, Netshoes. * denotes CL
Heath P. Terry, CFA
(212) 357-1849 [email protected] Goldman Sachs & Co. LLC
Matthew J. Fassler
(212) 902-6740 [email protected] Goldman Sachs & Co. LLC
Lindsay Drucker Mann, CFA
(212) 357-4993 [email protected] Goldman Sachs & Co. LLC
Piyush Mubayi
+852-2978-1677 [email protected] Goldman Sachs (Asia) L.L.C.
Irma Sgarz
+55(11)3371-0728 [email protected] Goldman Sachs do Brasil CTVM S.A.
Goldman Sachs does and seeks to do business with companies covered in its research reports. As a result, investors should be aware that the firm may have a conflict of interest that could affect the objectivity of this report. Investors should consider this report as only a single factor in making their investment decision.For Reg AC certification and other important disclosures, see the Disclosure Appendix, or go to www.gs.com/research/hedge.html. Analysts employed by non-US affiliates are not registered/qualified as research analysts with FINRA in the U.S.
The Goldman Sachs Group, Inc. Global Investment Research
September 6, 2017 Americas: Technology: Internet
Goldman Sachs Global Investment Research 2
Contents
PM summary: Expect eCommerce’s virtuous cycle to continue 3
Updating the GS Global model 5
Global perspectives 6
Recent US eCommerce trends 8
Analysis of past and future category growth 10
Key themes 13
The virtuous eCommerce cycle 13
V-commerce 15
VCH: Venture Capital insights 18
Regional Snapshots 19
Disclosure Appendix 27
The authors would like to thank Patrik Johansson, Ph.D., for his extensive contributions to this report. Patrik is an intern with the US Internet team.

September 6, 2017 Americas: Technology: Internet
Goldman Sachs Global Investment Research 3
PM summary: Expect eCommerce’s virtuous cycle to continue
We forecast a 21% three-year global eCommerce CAGR on strength across China as B2C remains robust, India sees continued rapid
growth, and Russia and Brazil reaccelerate. Our new 2017-2020 eCommerce estimates (Exhibit 5) are driven by continued advances
across the eCommerce ecosystem (mobile, fulfillment, voice, etc.), particularly within earlier stage online markets, improving the
eCommerce value proposition and driving the shift of consumer spending online. We forecast the strongest growth from India
(+44%) and China (B2C +36%) while Japan (+10%) and Western Europe (+11%) show more mature growth rates. It’s worth
acknowledging, that while our best estimates are for relatively linear growth deceleration as markets mature, we’re likely to be
surprised by periods of acceleration and faster deceleration as individual markets continue to go through both macro, retail sector,
and internet-specific inflection points.
We expect global eCommerce penetration to increase 161bps yoy in 2017. We forecast the largest increases in eCommerce as a
percent of total retail across China, South Korea, and India at 345bps, 261bps, and 174bps, respectively. We expect mobile internet
access across China and India along with fulfillment improvements across both developing and emerging markets to be continued
drivers of penetration. We also see the growing importance of fast growing, earlier stage categories like Apparel and Grocery as
being meaningful drivers of online share gains.
Exhibit 1: Global eCommerce growth
$ millions
Exhibit 2: Global eCommerce penetration
Percent
Source: Company data, US Census Bureau, Euromonitor, IBGE, IPCA, AKIT, Japan METI, iResearch, NBS China, Goldman Sachs Global Investment Research
Source: Euromonitor, Goldman Sachs Global Investment Research
24.0%
29.5%
25.9%
19.4%21.1%
23.6%
20.0% 19.1%17.8%
0.0%
5.0%
10.0%
15.0%
20.0%
25.0%
30.0%
35.0%
$0
$500,000
$1,000,000
$1,500,000
$2,000,000
$2,500,000
$3,000,000
$3,500,000
$4,000,000
2012 2013 2014 2015 2016 2017E 2018E 2019E 2020E
Worldwide ecommerce yoy (%) Penetration
22.1%21.0%
13.8%
8.6%
5.9% 5.8% 5.5% 5.1% 5.1%3.8% 3.3%
1.0%
0.0%
5.0%
10.0%
15.0%
20.0%
25.0%
2017E Overall
September 6, 2017 Americas: Technology: Internet
Goldman Sachs Global Investment Research 4
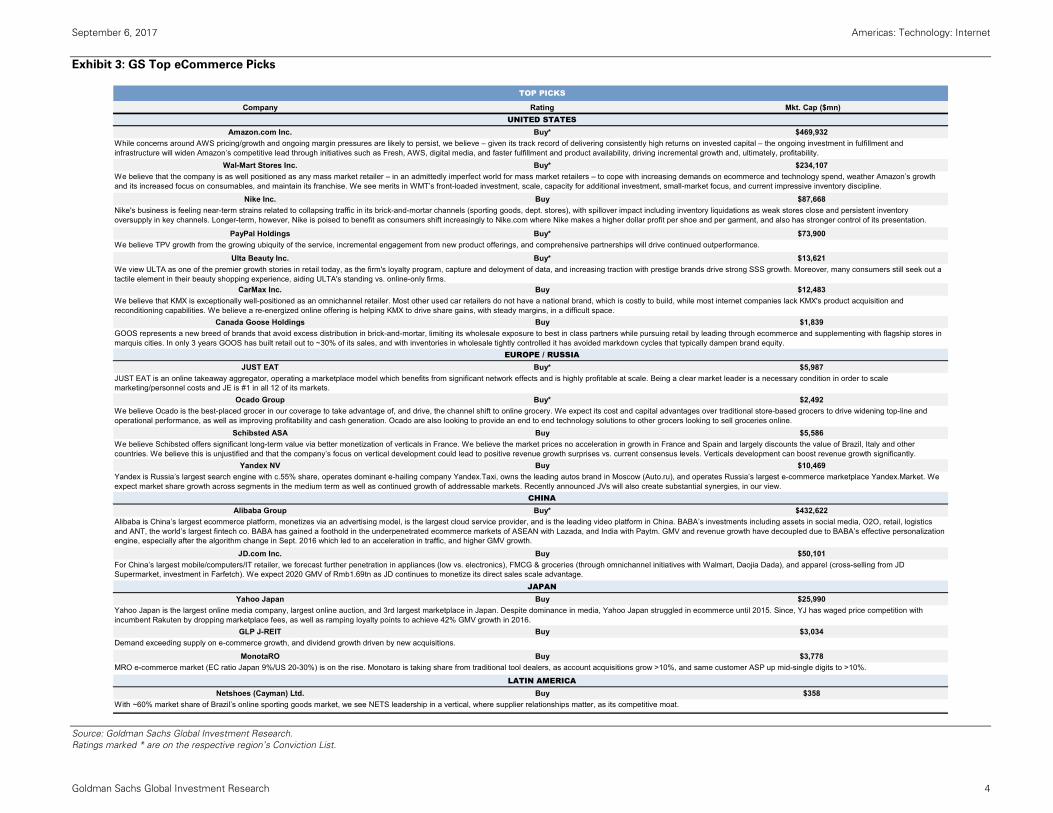
Exhibit 3: GS Top eCommerce Picks
Source: Goldman Sachs Global Investment Research. Ratings marked * are on the respective region’s Conviction List.
TOP PICKS
Company Rating Mkt. Cap ($mn)UNITED STATES
Amazon.com Inc. Buy* $469,932
Wal-Mart Stores Inc. Buy* $234,107
Nike Inc. Buy $87,668
PayPal Holdings Buy* $73,900
Ulta Beauty Inc. Buy* $13,621
CarMax Inc. Buy $12,483
Canada Goose Holdings Buy $1,839
EUROPE / RUSSIAJUST EAT Buy* $5,987
Ocado Group Buy* $2,492
Schibsted ASA Buy $5,586
Yandex NV Buy $10,469
CHINAAlibaba Group Buy* $432,622
JD.com Inc. Buy $50,101
JAPANYahoo Japan Buy $25,990
GLP J-REIT Buy $3,034
MonotaRO Buy $3,778
LATIN AMERICANetshoes (Cayman) Ltd. Buy $358
While concerns around AWS pricing/growth and ongoing margin pressures are likely to persist, we believe – given its track record of delivering consistently high returns on invested capital – the ongoing investment in fulfillment and infrastructure will widen Amazon’s competitive lead through initiatives such as Fresh, AWS, digital media, and faster fulfillment and product availability, driving incremental growth and, ultimately, profitability.
We believe TPV growth from the growing ubiquity of the service, incremental engagement from new product offerings, and comprehensive partnerships will drive continued outperformance.
JUST EAT is an online takeaway aggregator, operating a marketplace model which benefits from significant network effects and is highly profitable at scale. Being a clear market leader is a necessary condition in order to scale marketing/personnel costs and JE is #1 in all 12 of its markets.
Yandex is Russia’s largest search engine with c.55% share, operates dominant e-hailing company Yandex.Taxi, owns the leading autos brand in Moscow (Auto.ru), and operates Russia’s largest e-commerce marketplace Yandex.Market. We expect market share growth across segments in the medium term as well as continued growth of addressable markets. Recently announced JVs will also create substantial synergies, in our view.
We believe that the company is as well positioned as any mass market retailer – in an admittedly imperfect world for mass market retailers – to cope with increasing demands on ecommerce and technology spend, weather Amazon’s growth and its increased focus on consumables, and maintain its franchise. We see merits in WMT’s front-loaded investment, scale, capacity for additional investment, small-market focus, and current impressive inventory discipline.
We believe that KMX is exceptionally well-positioned as an omnichannel retailer. Most other used car retailers do not have a national brand, which is costly to build, while most internet companies lack KMX's product acquisition and reconditioning capabilities. We believe a re-energized online offering is helping KMX to drive share gains, with steady margins, in a difficult space.
We view ULTA as one of the premier growth stories in retail today, as the firm's loyalty program, capture and deloyment of data, and increasing traction with prestige brands drive strong SSS growth. Moreover, many consumers still seek out a tactile element in their beauty shopping experience, aiding ULTA's standing vs. online-only firms.
Nike's business is feeling near-term strains related to collapsing traffic in its brick-and-mortar channels (sporting goods, dept. stores), with spillover impact including inventory liquidations as weak stores close and persistent inventory oversupply in key channels. Longer-term, however, Nike is poised to benefit as consumers shift increasingly to Nike.com where Nike makes a higher dollar profit per shoe and per garment, and also has stronger control of its presentation.
We believe Schibsted offers significant long-term value via better monetization of verticals in France. We believe the market prices no acceleration in growth in France and Spain and largely discounts the value of Brazil, Italy and other countries. We believe this is unjustified and that the company’s focus on vertical development could lead to positive revenue growth surprises vs. current consensus levels. Verticals development can boost revenue growth significantly.
GOOS represents a new breed of brands that avoid excess distribution in brick-and-mortar, limiting its wholesale exposure to best in class partners while pursuing retail by leading through ecommerce and supplementing with flagship stores in marquis cities. In only 3 years GOOS has built retail out to ~30% of its sales, and with inventories in wholesale tightly controlled it has avoided markdown cycles that typically dampen brand equity.
We believe Ocado is the best-placed grocer in our coverage to take advantage of, and drive, the channel shift to online grocery. We expect its cost and capital advantages over traditional store-based grocers to drive widening top-line and operational performance, as well as improving profitability and cash generation. Ocado are also looking to provide an end to end technology solutions to other grocers looking to sell groceries online.
MRO e-commerce market (EC ratio Japan 9%/US 20-30%) is on the rise. Monotaro is taking share from traditional tool dealers, as account acquisitions grow >10%, and same customer ASP up mid-single digits to >10%.
Yahoo Japan is the largest online media company, largest online auction, and 3rd largest marketplace in Japan. Despite dominance in media, Yahoo Japan struggled in ecommerce until 2015. Since, YJ has waged price competition with incumbent Rakuten by dropping marketplace fees, as well as ramping loyalty points to achieve 42% GMV growth in 2016.
Alibaba is China’s largest ecommerce platform, monetizes via an advertising model, is the largest cloud service provider, and is the leading video platform in China. BABA’s investments including assets in social media, O2O, retail, logistics and ANT, the world’s largest fintech co. BABA has gained a foothold in the underpenetrated ecommerce markets of ASEAN with Lazada, and India with Paytm. GMV and revenue growth have decoupled due to BABA’s effective personalization engine, especially after the algorithm change in Sept. 2016 which led to an acceleration in traffic, and higher GMV growth.
For China’s largest mobile/computers/IT retailer, we forecast further penetration in appliances (low vs. electronics), FMCG & groceries (through omnichannel initiatives with Walmart, Daojia Dada), and apparel (cross-selling from JD Supermarket, investment in Farfetch). We expect 2020 GMV of Rmb1.69tn as JD continues to monetize its direct sales scale advantage.
With ~60% market share of Brazil’s online sporting goods market, we see NETS leadership in a vertical, where supplier relationships matter, as its competitive moat.
Demand exceeding supply on e-commerce growth, and dividend growth driven by new acquisitions.

September 6, 2017 Americas: Technology: Internet
Goldman Sachs Global Investment Research 5
Updating the GS Global model
We update our global eCommerce model for FX, incorporate regional updates from our global analysts, and update actuals for 2016
and 2017 as available. In addition, we have changed the source of our historical US figures from Euromonitor to the US Census
Bureau. This change was made primarily to better align our global eCommerce forecast with the more regularly released
government data.
We expect eCommerce share gains to accelerate in the US (penetration +134bps vs. 125bps in 2016) as historically under-penetrated
but high frequency offline categories shift online (CPG, Apparel, Sports & Fitness), retail store closures (Exhibit 14) impact consumer
behavior, mobile and voice experiences improve, and fulfillment capabilities improve. Internationally, we expect mobile and
fulfillment to remain key drivers of eCommerce penetration as large swaths of emerging markets lean on mobile devices for
internet access and shorter, simpler fulfillment experiences encourage purchasing behavior to shift.
Exhibit 4: New vs. old estimates $ millions, fixed 2016 FX rates
Source: Company data, US Census Bureau, Euromonitor, IBGE, IPCA, Japan METI, iResearch, NBS China, Goldman Sachs Global Investment Research.
Ecommerce growth forecast 2016 2017E 2018E 2019E 2020E'16-'19 CAGR
Global $1,608,633 $1,988,229 $2,386,417 $2,843,262 $3,348,380 20.9%New 21.1% 23.6% 20.0% 19.1% 17.8%Old 22.5% 20.0% 17.3% 14.5% 12.6% 17.3%Delta bps -134 357 269 464 516 364
China $729,458 $967,445 $1,209,350 $1,491,022 $1,805,694 26.9%New 27.1% 32.6% 25.0% 23.3% 21.1%Old 31.0% 26.0% 21.0% 16.0% 13.0% 20.9%Delta bps -394 663 400 729 810 598
United States $389,672 $448,123 $514,445 $589,039 $671,505 14.8%New 14.9% 15.0% 14.8% 14.5% 14.0%Old 13.8% 13.7% 13.6% 13.5% 13.3% 13.6%Delta bps 106 130 120 100 70 117
Western Europe $230,162 $257,782 $286,138 $317,041 $348,745 11.3%New 12.4% 12.0% 11.0% 10.8% 10.0%Old 12.2% 11.5% 10.8% 10.2% 9.2% 10.8%Delta bps 17 50 20 60 80 43
Japan $73,602 $80,432 $88,661 $97,912 $107,053 10.0%New 23.1% 9.3% 10.2% 10.4% 9.3%Old 13.0% 11.2% 10.7% 10.4% 10.1% 10.8%Delta bps 1007 -194 -45 0 -79 -80
Latin America $27,634 $33,845 $40,305 $47,588 $55,810 19.9%New 10.3% 22.5% 19.1% 18.1% 17.3%Old 20% 23% 21% 19% 17% 21.2%Delta bps -1012 -63 -226 -100 77 -130

September 6, 2017 Americas: Technology: Internet
Goldman Sachs Global Investment Research 6
Global perspectives
In China, GS analysts expect there remains significant runway for penetration across lower-tier cities, with the potential to catch-up
and even surpass top-tier cities across more mature categories like apparel, footwear, and electronics and appliances (30%-40%
online currently) due to weaker offline retail offerings. That said, GS analysts expect fast-moving consumer goods (FMCG) and
grocery to represent the largest opportunity given the size of the category and advances in inventory management and fulfillment
that remove some of the historical points of friction (e.g., inventory, delivery speed).
Recently, the sequential pick-up in China's online retail sales and parcel volume growth supports positive comments from
eCommerce giants on reacceleration and higher conversion rate driven by technology/personalization. For further discussion of the
evolving online retail landscape in China see the 2/28/2017 report China E+Commerce: Shopping Re-Imagined.
In Europe, expectations for an improving macro backdrop (GDP expected to accelerate in 2017) are expected to support continued
ecommerce adoption as trends across mobile and a consolidating retail environment propel online growth. With mobile accounting
for more than 50% of volume for many key players (75% of JUST EAT’s orders (1H17) and >55% FY16 at Ocado), GS analysts expect
the continued shift to mobile app ordering to not only support growth but also provide more attractive economics across many
aggregators given the reduced friction and stickier customer dynamics mobile apps afford. On the retail side, there has been an
elevated level of consolidation activity/proposed consolidation occurring in the UK within grocery/convenience/wholesale. GS
analysts see further consolidation as indicative of the highly competitive and challenged UK retail market where discounters (Aldi
and Lidl) are still growing strongly amid ecommerce growth.
In Japan, companies have utilized substantial promotional activity to help drive growth in gross merchandise value (GMV) though
this level of expenditure pressures marginal profits. Since 2014, spending on advertising and sales promotions by Yahoo Japan and
Rakuten has increased by more than ¥24bn and ¥37bn, respectively, which for both companies represents 6%-7% of the increase in
e-commerce GMV in Japan. Amazon has shown strong growth in everyday items, while sales in this category are lagging at
Rakuten and Yahoo Japan, which operate marketplace business models. In the food and drink, general merchandise, and healthcare
/ supplements categories, growth is much stronger at Amazon than Rakuten, driven by Amazon’s ability to leverage its Prime service
and access to its own inventory and distribution facilities, GS Japan Internet analyst Masaru Sugiyama describes in Japan Internet:
Competitive landscape in e-commerce in 2016; marketplace models still struggle (2/28/2017).
In LatAm the continued online shift of retail remains a key theme in 2017, with increased focus on fulfillment, particularly in Brazil.
Mexico still lags Brazil in terms of eCommerce penetration (2.1% in 2015 vs. 2017E of 3.3%), but potential exists for an acceleration
driven by a combination of favorable conditions (i.e., a young population, a relatively high penetration of smartphones and
gradually more competitive pricing for data plans) and the impact of Amazon’s presence since mid-2015, according to GS LatAm
Retail analyst Irma Sgarz. In Brazil, GS analysts believe the end of the eSedex, an express shipping option offered by Brazil’s public
post office to eCommerce companies at preferential rates, should create opportunities for differentiation through fulfillment
solutions in 2017, with more discussion of key themes in the 1/17/2017 report Outlook 2017: Stuck in the slow lane; 5 themes to
watch.

September 6, 2017 Americas: Technology: Internet
Goldman Sachs Global Investment Research 7
Exhibit 5: Global eCommerce (ex-travel) forecast
Source: Company data, US Census Bureau, Euromonitor, IBGE, IPCA, AKIT, Japan METI, iResearch, NBS China, Goldman Sachs Global Investment Research
September 6, 2017 Americas: Technology: Internet
Goldman Sachs Global Investment Research 8
Recent US eCommerce trends
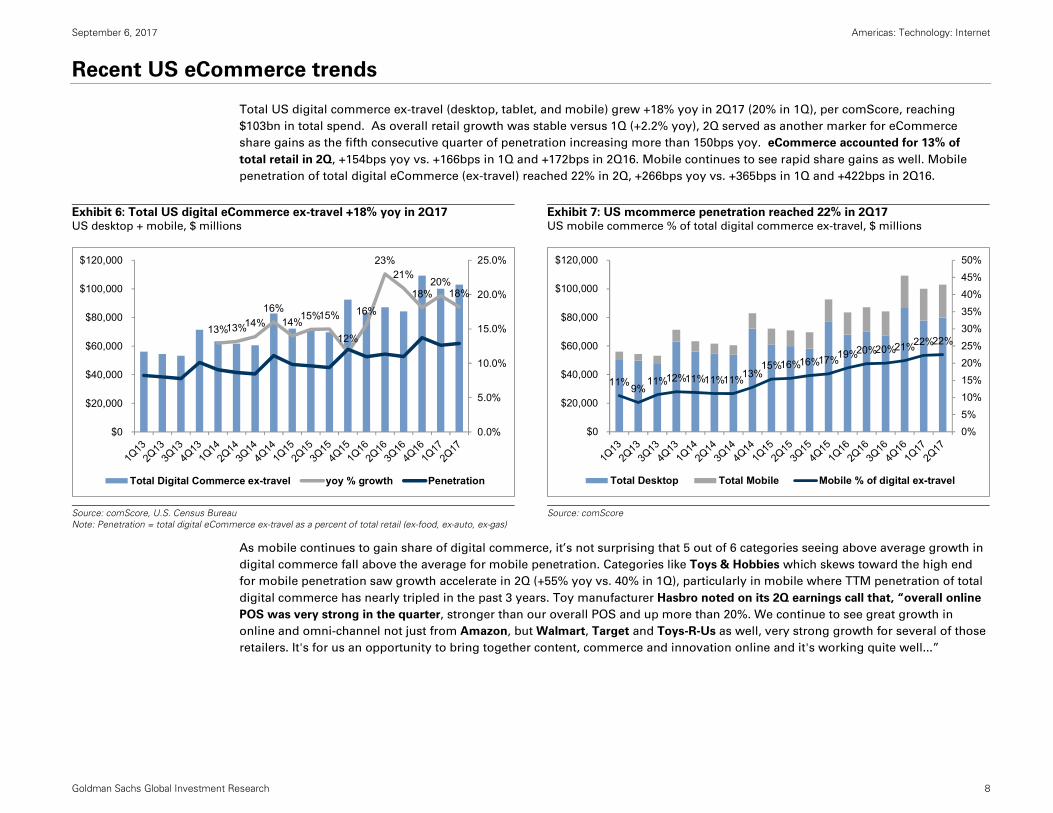
Total US digital commerce ex-travel (desktop, tablet, and mobile) grew +18% yoy in 2Q17 (20% in 1Q), per comScore, reaching
$103bn in total spend. As overall retail growth was stable versus 1Q (+2.2% yoy), 2Q served as another marker for eCommerce
share gains as the fifth consecutive quarter of penetration increasing more than 150bps yoy. eCommerce accounted for 13% of
total retail in 2Q, +154bps yoy vs. +166bps in 1Q and +172bps in 2Q16. Mobile continues to see rapid share gains as well. Mobile
penetration of total digital eCommerce (ex-travel) reached 22% in 2Q, +266bps yoy vs. +365bps in 1Q and +422bps in 2Q16.
Exhibit 6: Total US digital eCommerce ex-travel +18% yoy in 2Q17 US desktop + mobile, $ millions
Exhibit 7: US mcommerce penetration reached 22% in 2Q17 US mobile commerce % of total digital commerce ex-travel, $ millions
Source: comScore, U.S. Census Bureau Note: Penetration = total digital eCommerce ex-travel as a percent of total retail (ex-food, ex-auto, ex-gas)
Source: comScore
As mobile continues to gain share of digital commerce, it’s not surprising that 5 out of 6 categories seeing above average growth in
digital commerce fall above the average for mobile penetration. Categories like Toys & Hobbies which skews toward the high end
for mobile penetration saw growth accelerate in 2Q (+55% yoy vs. 40% in 1Q), particularly in mobile where TTM penetration of total
digital commerce has nearly tripled in the past 3 years. Toy manufacturer Hasbro noted on its 2Q earnings call that, “overall online
POS was very strong in the quarter, stronger than our overall POS and up more than 20%. We continue to see great growth in
online and omni-channel not just from Amazon, but Walmart, Target and Toys-R-Us as well, very strong growth for several of those
retailers. It's for us an opportunity to bring together content, commerce and innovation online and it's working quite well...”
13%13%14%16%
14%15%15%
12%
16%
23%21%
18%20%
18%
0.0%
5.0%
10.0%
15.0%
20.0%
25.0%
$0
$20,000
$40,000
$60,000
$80,000
$100,000
$120,000
Total Digital Commerce ex-travel yoy % growth Penetration
11%9%11%12%11%11%11%13%
15%16%16%17%19%20%20%21%22%22%
0%5%
10%15%
20%25%
30%35%
40%45%
50%
$0
$20,000
$40,000
$60,000
$80,000
$100,000
$120,000
Total Desktop Total Mobile Mobile % of digital ex-travel

September 6, 2017 Americas: Technology: Internet
Goldman Sachs Global Investment Research 9
Exhibit 8: US digital commerce growth vs. mobile penetration in 2Q yoy growth
Source: comScore
Average, 32%
Average, 22% Video Games
Toys & Hobbies
Jewelry & Watches
Music & Movies
Flowers & Misc. Gifts
Sports & FitnessHome & Garden
Computer Software
Event Tickets
Books & Magazines
Furniture, Appliances
Apparel & Access.
CPGOffice Supplies
Computer Hardware
Consumer Electronics
0%
10%
20%
30%
40%
50%
60%
70%
0% 10% 20% 30% 40% 50% 60% 70%
Dig
ital c
omm
erce
yoy
% g
row
th
Mobile % of digital commerce
September 6, 2017 Americas: Technology: Internet
Goldman Sachs Global Investment Research 10
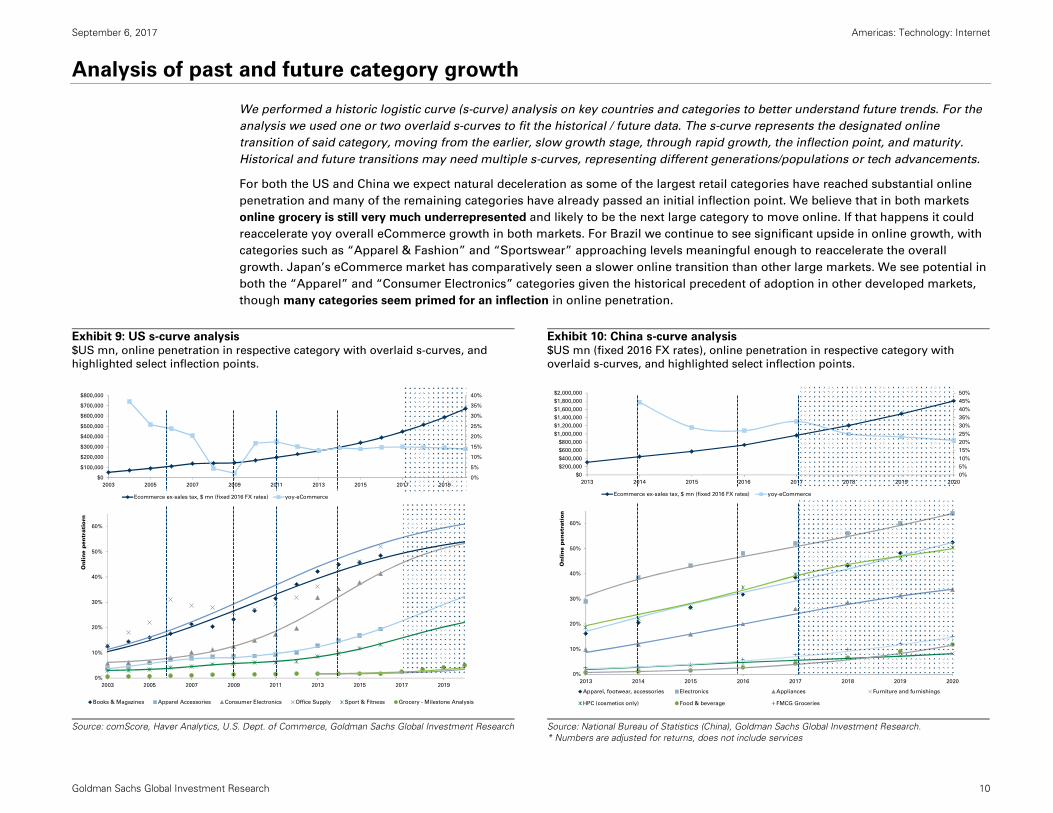
Analysis of past and future category growth
We performed a historic logistic curve (s-curve) analysis on key countries and categories to better understand future trends. For the
analysis we used one or two overlaid s-curves to fit the historical / future data. The s-curve represents the designated online
transition of said category, moving from the earlier, slow growth stage, through rapid growth, the inflection point, and maturity.
Historical and future transitions may need multiple s-curves, representing different generations/populations or tech advancements.
For both the US and China we expect natural deceleration as some of the largest retail categories have reached substantial online
penetration and many of the remaining categories have already passed an initial inflection point. We believe that in both markets
online grocery is still very much underrepresented and likely to be the next large category to move online. If that happens it could
reaccelerate yoy overall eCommerce growth in both markets. For Brazil we continue to see significant upside in online growth, with
categories such as “Apparel & Fashion” and “Sportswear” approaching levels meaningful enough to reaccelerate the overall
growth. Japan’s eCommerce market has comparatively seen a slower online transition than other large markets. We see potential in
both the “Apparel” and “Consumer Electronics” categories given the historical precedent of adoption in other developed markets,
though many categories seem primed for an inflection in online penetration.
Exhibit 9: US s-curve analysis $US mn, online penetration in respective category with overlaid s-curves, and
highlighted select inflection points.
Exhibit 10: China s-curve analysis $US mn (fixed 2016 FX rates), online penetration in respective category with
overlaid s-curves, and highlighted select inflection points.
Source: comScore, Haver Analytics, U.S. Dept. of Commerce, Goldman Sachs Global Investment Research
Source: National Bureau of Statistics (China), Goldman Sachs Global Investment Research. * Numbers are adjusted for returns, does not include services
0%
5%
10%
15%
20%
25%
30%
35%
40%
$0
$100,000
$200,000
$300,000
$400,000
$500,000
$600,000
$700,000
$800,000
2003 2005 2007 2009 2011 2013 2015 2017 2019
Ecommerce ex-sales tax, $ mn (fixed 2016 FX rates) yoy-eCommerce
0%
10%
20%
30%
40%
50%
60%
2003 2005 2007 2009 2011 2013 2015 2017 2019
Onli
ne p
entr
atio
rn
Books & Magazines Apparel Accessories Consumer Electronics Office Supply Sport & Fitness Grocery - Milestone Analysis
0%
5%
10%
15%
20%
25%
30%
35%
40%
45%
50%
$0
$200,000
$400,000
$600,000
$800,000
$1,000,000
$1,200,000
$1,400,000
$1,600,000
$1,800,000
$2,000,000
2013 2014 2015 2016 2017 2018 2019 2020
Ecommerce ex-sales tax, $ mn (fixed 2016 FX rates) yoy-eCommerce
0%
10%
20%
30%
40%
50%
60%
2013 2014 2015 2016 2017 2018 2019 2020
Onli
ne
penet
rati
on
Apparel, footwear, accessories Electronics Appliances Furniture and furnishings
HPC (cosmetics only) Food & beverage FMCG Groceries
September 6, 2017 Americas: Technology: Internet
Goldman Sachs Global Investment Research 11
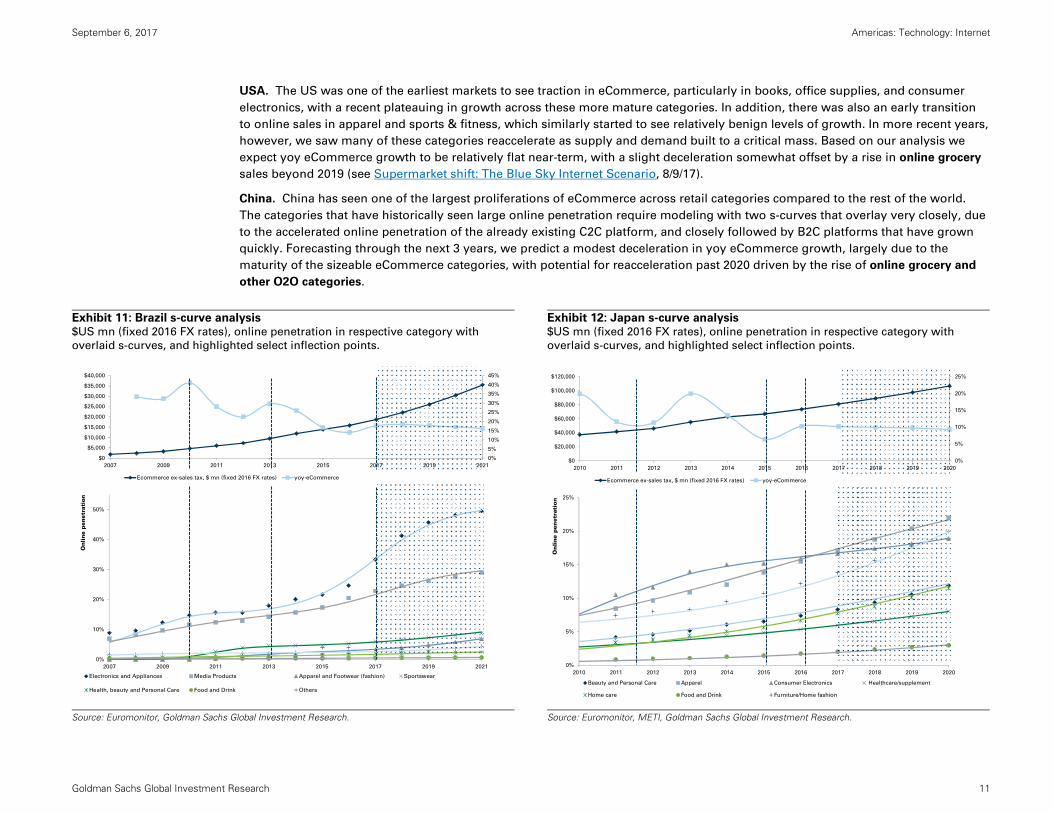
USA. The US was one of the earliest markets to see traction in eCommerce, particularly in books, office supplies, and consumer
electronics, with a recent plateauing in growth across these more mature categories. In addition, there was also an early transition
to online sales in apparel and sports & fitness, which similarly started to see relatively benign levels of growth. In more recent years,
however, we saw many of these categories reaccelerate as supply and demand built to a critical mass. Based on our analysis we
expect yoy eCommerce growth to be relatively flat near-term, with a slight deceleration somewhat offset by a rise in online grocery
sales beyond 2019 (see Supermarket shift: The Blue Sky Internet Scenario, 8/9/17).
China. China has seen one of the largest proliferations of eCommerce across retail categories compared to the rest of the world.
The categories that have historically seen large online penetration require modeling with two s-curves that overlay very closely, due
to the accelerated online penetration of the already existing C2C platform, and closely followed by B2C platforms that have grown
quickly. Forecasting through the next 3 years, we predict a modest deceleration in yoy eCommerce growth, largely due to the
maturity of the sizeable eCommerce categories, with potential for reacceleration past 2020 driven by the rise of online grocery and
other O2O categories.
Exhibit 11: Brazil s-curve analysis $US mn (fixed 2016 FX rates), online penetration in respective category with
overlaid s-curves, and highlighted select inflection points.
Exhibit 12: Japan s-curve analysis $US mn (fixed 2016 FX rates), online penetration in respective category with
overlaid s-curves, and highlighted select inflection points.
Source: Euromonitor, Goldman Sachs Global Investment Research.
Source: Euromonitor, METI, Goldman Sachs Global Investment Research.
0%
5%
10%
15%
20%
25%
30%
35%
40%
45%
$0
$5,000
$10,000
$15,000
$20,000
$25,000
$30,000
$35,000
$40,000
2007 2009 2011 2013 2015 2017 2019 2021
Ecommerce ex-sales tax, $ mn (fixed 2016 FX rates) yoy-eCommerce
0%
10%
20%
30%
40%
50%
2007 2009 2011 2013 2015 2017 2019 2021
Onli
ne
pen
etra
tion
Electronics and Appliances Media Products Apparel and Footwear (fashion) Sportswear
Health, beauty and Personal Care Food and Drink Others
0%
5%
10%
15%
20%
25%
$0
$20,000
$40,000
$60,000
$80,000
$100,000
$120,000
2010 2011 2012 2013 2014 2015 2016 2017 2018 2019 2020
Ecommerce ex-sales tax, $ mn (fixed 2016 FX rates) yoy-eCommerce
0%
5%
10%
15%
20%
25%
2010 2011 2012 2013 2014 2015 2016 2017 2018 2019 2020
On
line p
en
etr
atio
n
Beauty and Personal Care Apparel Consumer Electronics Healthcare/supplement
Home care Food and Drink Furniture/Home fashion

September 6, 2017 Americas: Technology: Internet
Goldman Sachs Global Investment Research 12
Brazil. Brazil is expected to see eCommerce growth reaccelerate after ~ 4 consecutive years of deceleration driven by macro
softness. We expect the reacceleration to be driven by increased online penetration in Electronics & Appliances and Media products.
We believe these two categories will continue to drive growth through 2020, with a potential increase in online sales coming from
Apparel & Fashion which has seen modest penetration growth in recent years. Based on our logic curve analysis we believe that we
have entered into a second lower asymptote of a larger population and could see a reacceleration in this category as well as
Sportswear post-2020.
Japan. Japan has historically seen steady growth in online penetration driven by Apparel and Consumer Electronics, but after
meaningful yoy growth in 2013, overall eCommerce has seen an almost uninterrupted deceleration in yoy growth. Forecasting
through the next 3 years, we expect relatively stable eCommerce growth of 9-10% annually. Contrary to other markets discussed, we
believe that this is not due to relative maturity in major categories, but related to the historically slower transition across the board
from traditional retail to online and logistics strain. In our model, the transition is slower than in any of the other markets we
analyzed. As such we predict that yoy will remain fairly steady, but if there was an inflection in the market (a second s-curve), the
online transition could see a significant reacceleration given the size of its economy.
September 6, 2017 Americas: Technology: Internet
Goldman Sachs Global Investment Research 13
Key themes
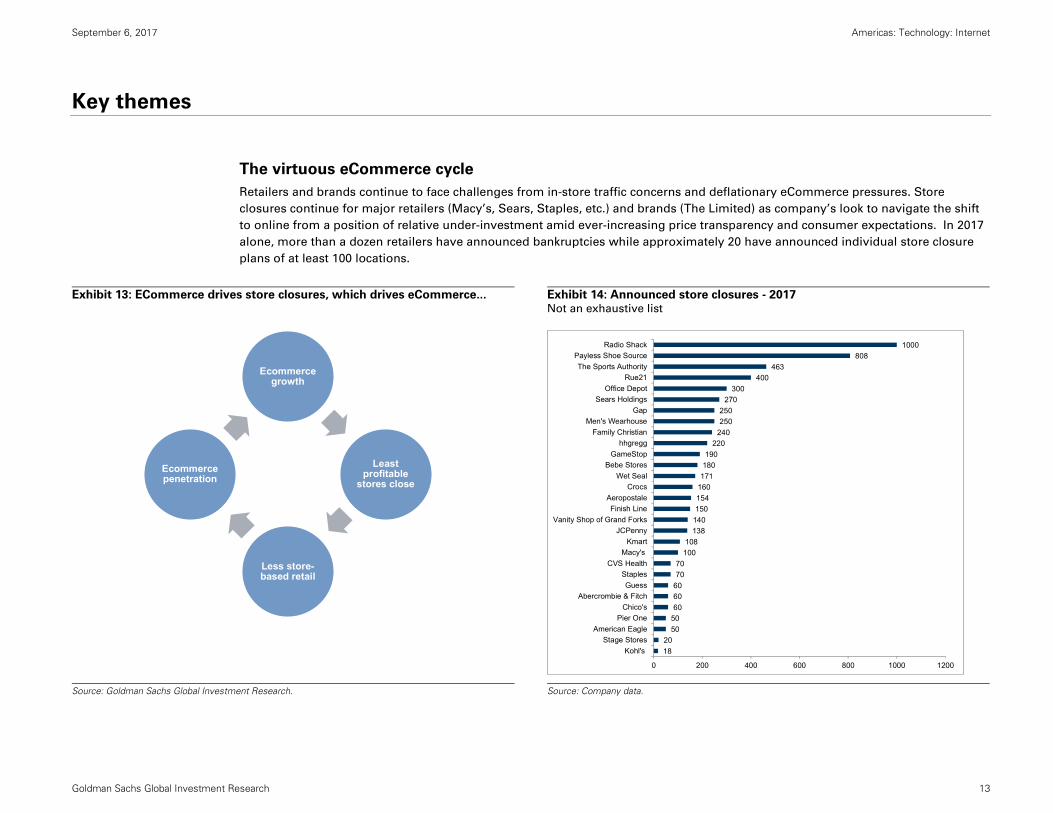
The virtuous eCommerce cycle
Retailers and brands continue to face challenges from in-store traffic concerns and deflationary eCommerce pressures. Store
closures continue for major retailers (Macy’s, Sears, Staples, etc.) and brands (The Limited) as company’s look to navigate the shift
to online from a position of relative under-investment amid ever-increasing price transparency and consumer expectations. In 2017
alone, more than a dozen retailers have announced bankruptcies while approximately 20 have announced individual store closure
plans of at least 100 locations.
Exhibit 13: ECommerce drives store closures, which drives eCommerce...
Exhibit 14: Announced store closures - 2017 Not an exhaustive list
Source: Goldman Sachs Global Investment Research.
Source: Company data.
Ecommercegrowth
Least profitable
stores close
Less store-based retail
Ecommerce penetration
1820
50506060607070
100108
138140150154160171180190
220240250250
270300
400463
8081000
0 200 400 600 800 1000 1200
Kohl'sStage Stores
American EaglePier One
Chico'sAbercrombie & Fitch
GuessStaples
CVS HealthMacy's
KmartJCPenny
Vanity Shop of Grand ForksFinish Line
AeropostaleCrocs
Wet SealBebe Stores
GameStophhgregg
Family ChristianMen's Wearhouse
GapSears Holdings
Office DepotRue21
The Sports AuthorityPayless Shoe Source
Radio Shack

September 6, 2017 Americas: Technology: Internet
Goldman Sachs Global Investment Research 14
Retail sales as a percentage of GDP for the US have been relatively stable since 2008 at nearly 6%. As the share of eCommerce has
increased steadily, it has eroded both store traffic and sales at brick-and-mortar stores gradually. Since total retail sales as a
percentage of GDP is relatively fixed, eCommerce almost entirely impacts brick-and-mortar sales. As a result, retailers have looked
to reduce operating expenses and increase efficiency as revenue is pressured (both price and volume), and thus, shut down stores
that are least profitable and/or unprofitable. The impact of this step is that overall store-based retail declines. In addition, many
brick-and-mortar retailers have also initiated eCommerce efforts in order to sustain or grow revenue. Ultimately, these store
closures fuel additional eCommerce share gains, feeding the flywheel of eCommerce adoption and further pressuring traditional
brick-and-mortar retail.
Exhibit 15: Bankruptcies - 2017 Store closures due to bankruptcy
Exhibit 16: Announced closures by category Apparel and electronics most impacted
Source: Company data. Not an exhaustive list.
Source: Company data.
In 2017 alone, more than a dozen retailers have announced bankruptcies while approximately 20 have announced individual store
closure plans of at least 100 locations. While the pace of store closures has been well documented the US remains situated well
above other significant economies in terms of retail square foot per capita. Combined with SSS trends across department stores,
apparel retailers, and discounters, the data would suggest that further closings and footprint reductions are likely, particularly for
retailers/brands over-exposed to malls where eCommerce pressures on foot traffic are likely to persist.
552
400
250
220
171
140
126
120
110
106
68
48
5
0 100 200 300 400 500 600
Radio Shack
Payless ShoeSource
The Limited
hhgregg
Wet Seal
Vanity Shop of Grand Forks Inc.
Gander Mountain
BCBG Max Azria
American Apparel
Gordmans Stores
MC Sports
Eastern Outfitters
Luke's Locker
55%
4%
12%
15%
9%
1%2% 3%
Apparel
Sports
Dept. stores
Electronics
Pharma
Furniture, home décor
Books, CDs
Office supplies

September 6, 2017 Americas: Technology: Internet
Goldman Sachs Global Investment Research 15
Exhibit 17: Retailers SSS growth yoy % change
Source: Company data, Goldman Sachs Global Investment Research.
V-commerce
Voice activated technology is an increasingly important factor in consumer behavior online, as it allows for faster, more convenient,
access to information compared to traditional channels in many circumstances. Amazon’s position as one of the leaders in this
development with the Alexa platform makes it particularly relevant for the growth of eCommerce. This growth is partially driven by
the continuing improvement in speech recognition, and both Microsoft and Google have now declared speech error rates of only
~5% -- on par with humans. In fact, 51% of China’s and 57% of Japan’s regular voice users use voice precisely because it means
they don’t have to type, according to a survey by Digital Market Asia. Furthermore, 10% of all search traffic is now voice searches,
up from negligible in 2014, and Kantar estimates nearly 1.8 billion consumers will be using AI voice assistants by 2021. Based on
current global voice usage we believe that initially the biggest impact from Voice will come in the global search market, projected to
reach $150bn by 2020 (see The ‘Outsiders’ - Emerging Ecosystems – 7/12/2017 for more).
-6.0
-4.0
-2.0
0.0
2.0
4.0
6.0
8.0
1Q11
2Q11
3Q11
4Q11
1Q12
2Q12
3Q12
4Q12
1Q13
2Q13
3Q13
4Q13
1Q14
2Q14
3Q14
4Q14
1Q15
2Q15
3Q15
4Q15
1Q16
2Q16
3Q16
4Q16
1Q17
2Q17
3Q17
E
4Q17
E
Apparel Dept. Stores Discounters

September 6, 2017 Americas: Technology: Internet
Goldman Sachs Global Investment Research 16
Exhibit 18: US Purchasing habits
Exhibit 19: US Purchasing habits
Online shopping conducted using voice controlled devices
Source: Walker Sands Communications
Source: Walker Sands Communications
Comparing the current usage levels, the benefits of voice purchasing, and the current growth of mobile purchasing we believe that
voice purchases could reach 5% of all online sales in the next 3-5 years. We see eCommerce as the logical next beneficiary of voice-
enabled assistants, through a combination of growth in voice-enabled speakers and mobile voice assistants. On mobile platforms
there are a number of voice assistants: Assistant (Google), Siri (Apple), Cortana (Microsoft), Duer (Baidu), and Bixby (Samsung). The
current, and soon to arrive, platforms in voice speakers are; Google Home, Amazon Echo (Dot, Show and Look), Cortana (Invoke),
Tmall Genie (Alibaba) and HomePod (Siri). According to NPD, Amazon Echo owners spent around 10% more on Amazon after
purchasing the Echo than prior. We believe that voice purchasing will make it easier to create lists, replenish frequently used items,
and order new items as needed without interrupting higher value activities. It can also improve the on-screen / mobile purchasing
experience by enhancing the interaction.
Usage and expectations for voice assistants are increasing globally:
31% of consumers globally use voice assistants on a weekly basis (eMarketer 7/29/17) vs. 49% in the US.
In Japan 63% of voice technology is used for search vs. 55% for finding information on products (Digital Market Asia -
6/29/17).
32% of smartphone users are excited about a future where their voice assistant will anticipate and take actions to resolve
their needs, according to a survey from JWT Intelligence.
Samsung and Gartner are predicting that the AI speaker market will grow 6x from US$360 mn (2015) to US $2.1bn in 2020.
Physical Store54%Desktop
33%
Mobile8%
App4%
Voice1%
0%
10%
20%
30%
40%
50%
60%
70%
80%
90%
100%
Always Often Sometimes Rarely Never18‐25 26‐35 36‐45 46‐60 60<

September 6, 2017 Americas: Technology: Internet
Goldman Sachs Global Investment Research 17
What’s next in voice assistant functionality? Beyond mobile and voice speakers we are also seeing an increase in manufacturers
looking to integrate voice assistant capabilities into appliances, toys, vehicles and other consumer products. Amazon for example
now offers Alexa development kits that can easily be integrated with device manufacturers’ products, and home appliances are
coming with voice speakers pre-installed. Recently, Google and Wal-Mart partnered to begin offering Wal-Mart’s products via
Google Assistant.
Exhibit 20: US Home assistants current and future usage
Exhibit 21: US voice enabled speakers by company share
As of 4/2017
Source: Walker Sands Communications
Source: eMarketer
Don’t plan to buy55%Plan to buy
within year20%
Amzon Echo16%
Google Home6%
More than one2%
Other1%
Amzon Echo70%
Google Home24%
Other6%
September 6, 2017 Americas: Technology: Internet
Goldman Sachs Global Investment Research 18
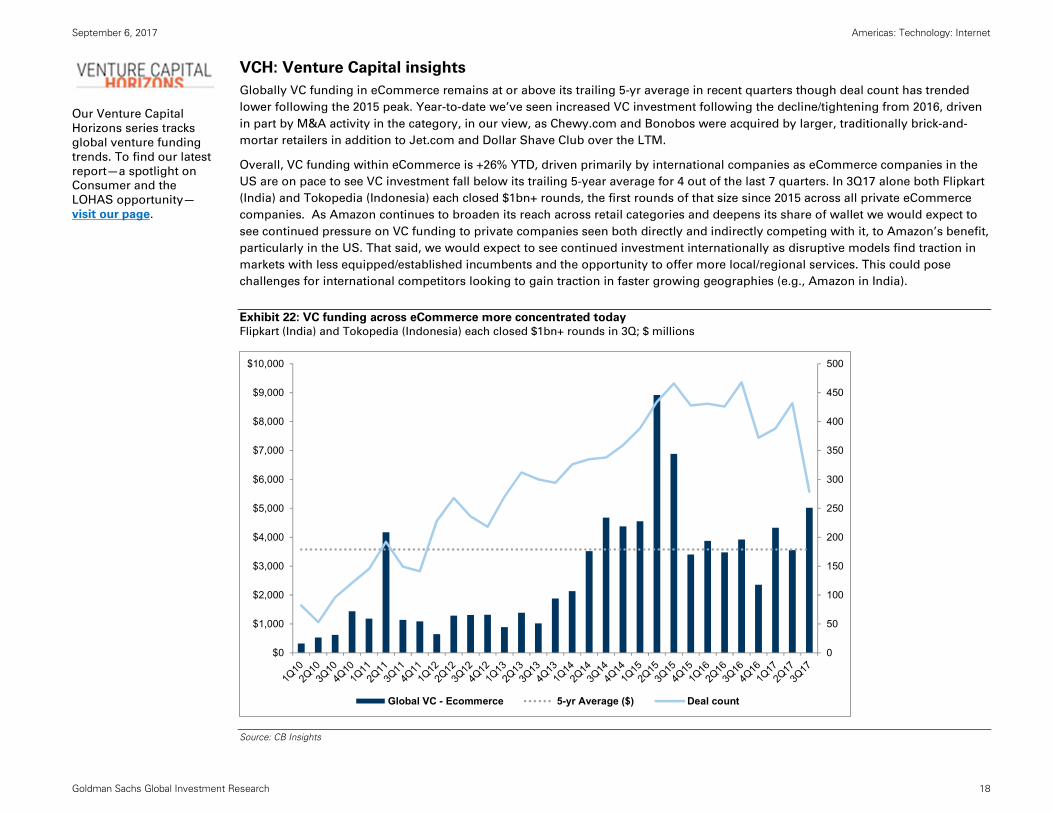
VCH: Venture Capital insights
Globally VC funding in eCommerce remains at or above its trailing 5-yr average in recent quarters though deal count has trended
lower following the 2015 peak. Year-to-date we’ve seen increased VC investment following the decline/tightening from 2016, driven
in part by M&A activity in the category, in our view, as Chewy.com and Bonobos were acquired by larger, traditionally brick-and-
mortar retailers in addition to Jet.com and Dollar Shave Club over the LTM.
Overall, VC funding within eCommerce is +26% YTD, driven primarily by international companies as eCommerce companies in the
US are on pace to see VC investment fall below its trailing 5-year average for 4 out of the last 7 quarters. In 3Q17 alone both Flipkart
(India) and Tokopedia (Indonesia) each closed $1bn+ rounds, the first rounds of that size since 2015 across all private eCommerce
companies. As Amazon continues to broaden its reach across retail categories and deepens its share of wallet we would expect to
see continued pressure on VC funding to private companies seen both directly and indirectly competing with it, to Amazon’s benefit,
particularly in the US. That said, we would expect to see continued investment internationally as disruptive models find traction in
markets with less equipped/established incumbents and the opportunity to offer more local/regional services. This could pose
challenges for international competitors looking to gain traction in faster growing geographies (e.g., Amazon in India).
Exhibit 22: VC funding across eCommerce more concentrated today
Flipkart (India) and Tokopedia (Indonesia) each closed $1bn+ rounds in 3Q; $ millions
Source: CB Insights
0
50
100
150
200
250
300
350
400
450
500
$0
$1,000
$2,000
$3,000
$4,000
$5,000
$6,000
$7,000
$8,000
$9,000
$10,000
Global VC - Ecommerce 5-yr Average ($) Deal count
Our Venture Capital
Horizons series tracks
global venture funding
trends. To find our latest
report—a spotlight on
Consumer and the
LOHAS opportunity—
visit our page.

September 6, 2017 Americas: Technology: Internet
Goldman Sachs Global Investment Research 19
Regional Snapshots
UNITED STATES
KEY THEMES
• Mobile. Categories most exposed to mobile commerce are seeing outsized growth in total digital commerce in the US as both hardware, software, and mobile user experiences have improved. As mcommerce share of total digital ecommerce has steadily moved north of 20% in the US in recent quarters, traditionally insulated categories like Home & Garden, Furniture & Appliance, and Flowers & Gifts have all seen mobile share of digital spend roughly double over the course of the last two years. We expect mobile share of digital commerce to increase unabated and potentially accelerate as consumer behavior, individual company capabilities, and the aging of mobile-first generations drive an inflection.
• VC funding. Following the peak in ecommerce deal count and funding dollars seen in 2014 and 2015, respectively, ecommerce funding in the US has come in below its trailing 5-yr average 3 out of the last 6 quarters and looks to be on pace to fall below the average again in 3Q17, according to CB Insights data. In our view this has been driven in part by a general tightening across the VC environment as investors that had piled in in search of growth (many traditionally public) started to place greater scrutiny on profitability and cash burn, but also by the strength of incumbents like Amazon specifically within ecommerce. We would expect that the scale advantages of larger incumbents (i.e., Amazon, eBay) to continue to pressure VC funding for ecommerce startups as well as other closely competitive verticals. Ultimately, we would expect this to benefit the share of wallet accruing to scaled players and support Amazon’s continued capture of the majority of ecommerce growth.
• Retail store closures. With the pace of store closures seen over the course of the TTM, with more than a dozen retailer bankruptcies announced in 2017 alone, we expect the virtuous ecommerce cycle to continue pressuring store traffic, driving fulfillment investment from brick-and-mortar, weighing on pricing, and ultimately growing ecommerce penetration. While SSS estimates across GS covered apparel companies are expected to improve through year-end, SSS comps are expected to remain negative across department stores and soften across discounters broadly (in part due to tougher yoy compares) which we would expect to continue to fuel conversations around footprint reductions, store closures, and ecommerce/technology spend among retail management teams.
TOP PICKS
Amazon (AMZN). While concerns around Amazon Web Services (AWS) pricing and ongoing margin pressures are likely to persist, we believe – given its track record of delivering consistently high returns on invested capital – the ongoing investment in fulfillment and infrastructure will widen Amazon’s competitive lead through initiatives such as Fresh, AWS, digital media, and faster fulfillment and product availability, driving incremental growth and, ultimately, profitability. Our $1,275 price target (12-mo) for AMZN (CL-Buy) is based on SOTP, implying 27x 2018E EV/EBITDA. Key risks: (-) Competition, margin pressures from investment, and valuation.
PayPal (PYPL). We believe TPV growth from the growing ubiquity of PayPal, incremental engagement from new product offerings like One Touch, increasing friction in traditional payment systems, and strategic partnerships should drive continued outperformance. Our $72 (12-mo) price target is based on an 85%/15% blend of 20X 2018E EV/EBITDA and 24X 2018E EV/EBITDA M&A valuation. Key risks: (-) Competition, transaction/operating margin pressure, security threats
4.0%
6.0%
8.0%
10.0%
12.0%
14.0%
16.0%
$0
$100,000
$200,000
$300,000
$400,000
$500,000
$600,000
$700,000
$800,000
2014 2015 2016 2017E 2018E 2019E 2020E
US ecommerce ($mn) yoy growth (%)
Source: US Census Bureau, Goldman Sachs Global Investment Research

September 6, 2017 Americas: Technology: Internet
Goldman Sachs Global Investment Research 20
CHINA
KEY THEMES
• B2C appliances +33% in 1H. Online B2C appliance sales grew 33% yoy to Rmb111.5bn in 1H17, where online penetration surpassed 20% for the first time and reached
25% of sales in 1H17 (vs. 20% in FY2016) according the Ministry of Industry and Information Technology (MIIT). Compared with the electronics segment’s current online
penetration of >50%, we see favorable tailwinds for online appliance sales to sustain high-growth over the next few years.
• BABA to turn up to 6mn convenience stores into smart service centers. BABA announced plans to create a network of 10k physical outlets across China where
users can place orders online, apply for small loans and pick-up packages. This would be the first stage in BABA’s strategy to create a larger network of smart service
centers, turning up to 6mn convenience stores into smart service centers. This network would have BABA’s e-commerce infrastructure and capabilities in financial
technology and logistics. The ground-based campaign promises to disrupt traditional retail models in China, and likely worldwide, and dramatically expand Alibaba’s
business by leveraging its online presence of 529mn MAU.
TOP PICKS
Alibaba (BABA). Alibaba is China’s largest ecommerce platform, monetizes via an advertising model, is the largest cloud service provider, and is the leading video platform in China. BABA’s investments including assets in social media, O2O, retail, logistics and ANT, the world’s largest fintech co. (on market cap). BABA has gained a foothold in the underpenetrated ecommerce markets of ASEAN with Lazada, and India with Paytm. GMV and revenue growth have decoupled due to BABA’s effective personalization engine, especially after the algorithm change in Sept. 2016 which led to an acceleration in traffic, and higher GMV growth. We forecast GMV of US$1.16T, and monetization rate of 4.2% by FY21. Valuation: Our 12-mo SOTP-based target price is US$208. Risks: GMV growth, monetization rates and higher content spend.
JD.com (JD). For China’s largest mobile/computers/IT retailer, we forecast further penetration in appliances (low vs. electronics), FMCG & groceries (through omnichannel initiatives with Walmart, Daojia Dada), and apparel (cross-selling from JD Supermarket, investment in Farfetch). We expect 2020 GMV ofRmb1.69tn as JD continues to monetize its direct sales scale advantage. Valuation: Our 12-month SOTP-based target price is US$56. Risks: GMV slowdown, capital allocation, regulatory risks, and competition.
Sources: Company data, NBS, iResearch, Analysys, Goldman Sachs Global Investment Research
0.0%
20.0%
40.0%
60.0%
80.0%
100.0%
120.0%
$0
$200,000
$400,000
$600,000
$800,000
$1,000,000
$1,200,000
$1,400,000
$1,600,000
$1,800,000
$2,000,000
2012 2013 2014 2015 2016 2017E 2018E 2019E 2020E
China B2C China C2C China B2C yoy (%) China C2C yoy (%)
September 6, 2017 Americas: Technology: Internet
Goldman Sachs Global Investment Research 21
WESTERN EUROPE
KEY THEMES
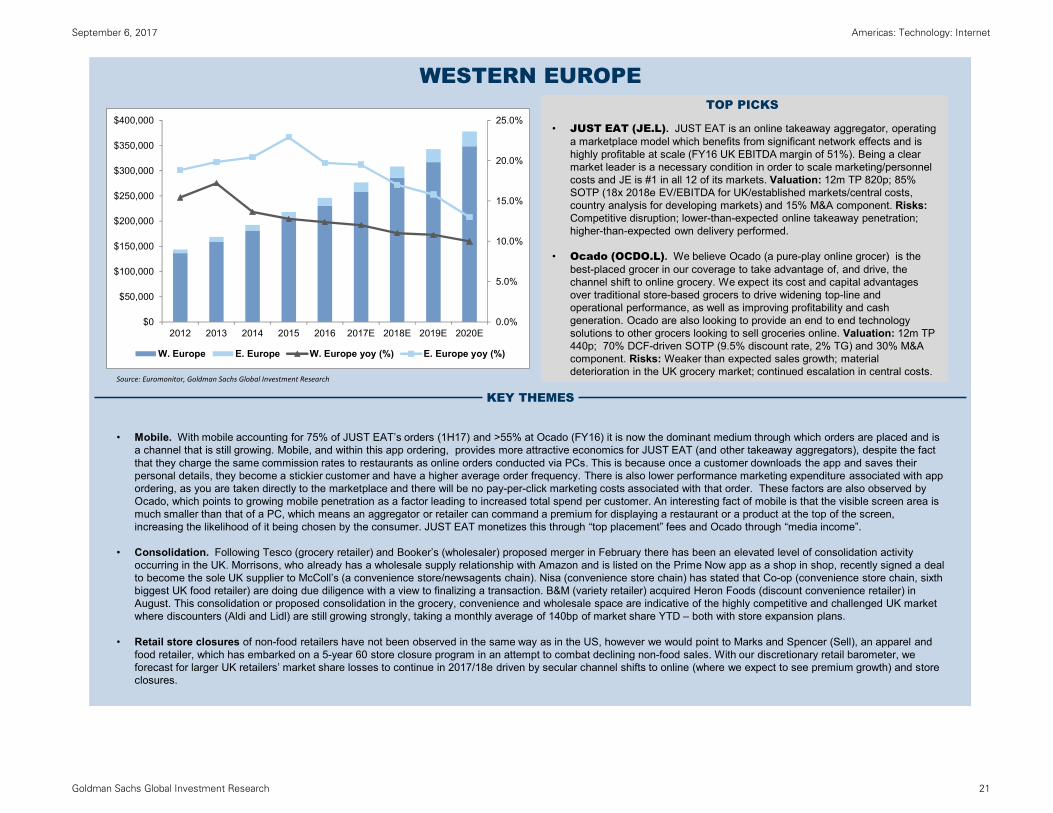
• Mobile. With mobile accounting for 75% of JUST EAT’s orders (1H17) and >55% at Ocado (FY16) it is now the dominant medium through which orders are placed and is a channel that is still growing. Mobile, and within this app ordering, provides more attractive economics for JUST EAT (and other takeaway aggregators), despite the fact that they charge the same commission rates to restaurants as online orders conducted via PCs. This is because once a customer downloads the app and saves their personal details, they become a stickier customer and have a higher average order frequency. There is also lower performance marketing expenditure associated with app ordering, as you are taken directly to the marketplace and there will be no pay-per-click marketing costs associated with that order. These factors are also observed by Ocado, which points to growing mobile penetration as a factor leading to increased total spend per customer. An interesting fact of mobile is that the visible screen area is much smaller than that of a PC, which means an aggregator or retailer can command a premium for displaying a restaurant or a product at the top of the screen, increasing the likelihood of it being chosen by the consumer. JUST EAT monetizes this through “top placement” fees and Ocado through “media income”.
• Consolidation. Following Tesco (grocery retailer) and Booker’s (wholesaler) proposed merger in February there has been an elevated level of consolidation activity occurring in the UK. Morrisons, who already has a wholesale supply relationship with Amazon and is listed on the Prime Now app as a shop in shop, recently signed a deal to become the sole UK supplier to McColl’s (a convenience store/newsagents chain). Nisa (convenience store chain) has stated that Co-op (convenience store chain, sixth biggest UK food retailer) are doing due diligence with a view to finalizing a transaction. B&M (variety retailer) acquired Heron Foods (discount convenience retailer) in August. This consolidation or proposed consolidation in the grocery, convenience and wholesale space are indicative of the highly competitive and challenged UK market where discounters (Aldi and Lidl) are still growing strongly, taking a monthly average of 140bp of market share YTD – both with store expansion plans.
• Retail store closures of non-food retailers have not been observed in the same way as in the US, however we would point to Marks and Spencer (Sell), an apparel and food retailer, which has embarked on a 5-year 60 store closure program in an attempt to combat declining non-food sales. With our discretionary retail barometer, we forecast for larger UK retailers’ market share losses to continue in 2017/18e driven by secular channel shifts to online (where we expect to see premium growth) and store closures.
TOP PICKS
• JUST EAT (JE.L). JUST EAT is an online takeaway aggregator, operating a marketplace model which benefits from significant network effects and is highly profitable at scale (FY16 UK EBITDA margin of 51%). Being a clear market leader is a necessary condition in order to scale marketing/personnel costs and JE is #1 in all 12 of its markets. Valuation: 12m TP 820p; 85% SOTP (18x 2018e EV/EBITDA for UK/established markets/central costs, country analysis for developing markets) and 15% M&A component. Risks:Competitive disruption; lower-than-expected online takeaway penetration; higher-than-expected own delivery performed.
• Ocado (OCDO.L). We believe Ocado (a pure-play online grocer) is the best-placed grocer in our coverage to take advantage of, and drive, the channel shift to online grocery. We expect its cost and capital advantages over traditional store-based grocers to drive widening top-line and operational performance, as well as improving profitability and cash generation. Ocado are also looking to provide an end to end technology solutions to other grocers looking to sell groceries online. Valuation: 12m TP 440p; 70% DCF-driven SOTP (9.5% discount rate, 2% TG) and 30% M&A component. Risks: Weaker than expected sales growth; material deterioration in the UK grocery market; continued escalation in central costs.
0.0%
5.0%
10.0%
15.0%
20.0%
25.0%
$0
$50,000
$100,000
$150,000
$200,000
$250,000
$300,000
$350,000
$400,000
2012 2013 2014 2015 2016 2017E 2018E 2019E 2020E
W. Europe E. Europe W. Europe yoy (%) E. Europe yoy (%)
Source: Euromonitor, Goldman Sachs Global Investment Research

September 6, 2017 Americas: Technology: Internet
Goldman Sachs Global Investment Research 22
JAPAN
KEY THEMES• Every day consumption drives growth. Japan’s EC market grew 10.6% in 2016, accelerating from +6.4% in 2015, according to METI. By category, we saw faster
growth in cosmetics /drugs, office supplies, furniture, and apparel. Growth underperformed in consumer electronics, auto, and food/beverages. We believe EC growth is shifting more towards everyday consumption. To cope with this, marketplace leader Rakuten created Rakuten Direct for 1P consumer products EC by combining Kenko.com and Sokai Drug. Yahoo Japan and Askul continue to invest into 1P consumer products service (Lohaco).
• Loyalty points here to stay. In 2015, Yahoo Japan surprised the market by introducing lucrative loyalty points for customers, followed by Rakuten’s SPU7 (Super Point Up x7 campaign). 2 years on, Yahoo Japan continues to offer 12% of purchases back in points for premium members with YJ’s credit card, and Rakuten as much as 7%. Each EC market is trying to create their own loyal customer segment (e.g. Yahoo Japan is trying to capture Softbank smartphone users as premium members), so competition between Rakuten and YJ to lock-in customers is likely to be prolonged, and semi-permanent in nature. Their strategies are more akin to extending the monetization from take rates on transactions to commission fees on payment services, rather than expanding customer segments.
• Transport Crisis. Logistics infrastructure in Japan is straining under the pressure from growth in EC. EC logistics is primarily B2C, with packages distributed by small-lot transportation services (“takuhaibin”, or parcel delivery services). However, these services were originally set up to cater to C2C, and therefore have been unable to handle the sharp rise in volume. Parcel delivery operators are now asking EC operators to choose between higher prices or volume controls. For instance, Yamato Transport, Japan’s largest door-to-door parcel delivery company, plans in FY3/18 to hike prices by 4.7%, while also reducing volume by 2.0%. Japan’s logistics industry is also considering redefining what constitutes sufficient social infrastructure and an appropriate level of logistics costs. We expect the tension between EC operators and the logistics industry to continue.
• Retail-EC Alliance. Currently, alliances between EC and offline retail are expanding. In July 2017, Askul (Yahoo Japan subsidiary) and Seven&i Holdings (Japan’s largest convenience store chain) announced a partnership to cooperate across EC and delivery. Although we have not seen large M&A/capital alliances, such as that between Amazon and Whole Foods, a quiet transformation in the retail and EC realms is taking place in Japan, in our view. In addition, Yahoo Japan and Rakuten are continuing with promotions with high point payout rates, which can be used in many offline stores like restaurants, convenience stores, book stores, hotels, and sporting goods shops, enabling EC users to use points earned for offline purchases. While retail-EC alliances are not being formed in Japan at the same pace as overseas, we expect this will happen eventually.
TOP PICKSYahoo Japan (4689.T). Yahoo Japan is the largest online media company, largest online auction, and 3rd largest marketplace in Japan. Despite dominance in media, Yahoo Japan struggled in ecommerce until 2015. Since, YJ has waged price competition with incumbent Rakuten by dropping marketplace fees, as well as ramping loyalty points to achieve 42% GMV growth in 2016. We expect more ad and payment monetization of EC traffic going forward. Valuation: 12-mo target price of ¥670 is based on FY3/21E EV/NOPAT of 14X. Risk: Cost overruns and deterioration in ad environment.
GLP JREIT (3281.T). Demand exceeding supply on e-commerce growth, and dividend growth driven by acquisitions. Valuation: 12-mo target of ¥150,000 is based on FP2/20E NAV (¥124,063) and a NAV premium derived from 10-yr JGB yields, interest-bearing debt spreads, and the TOPIX dividend yield. Risks: logistics facility demand due to economic fluctuations, interest/cap rates.
MonotaRO (3064.T). MRO e-commerce market (EC ratio Japan 9%/US 20-30%) is on the rise. MonotaRO is taking share from traditional tool dealers, as account acquisitions grow >10%, and same customer ASP up mid-single digits to >10%. Valuation: 12-mo target of ¥3,900 based on a 10-year DCF model. Risks: growth stagnating and smaller-than-expected productivity gains.
-10.0%
-5.0%
0.0%
5.0%
10.0%
15.0%
20.0%
25.0%
$0
$20,000
$40,000
$60,000
$80,000
$100,000
$120,000
2012 2013 2014 2015 2016 2017E 2018E 2019E 2020E
Japan ecommerce yoy (%)
Source: Company data, METI, Euromonitor, Goldman Sachs Global Investment Research

September 6, 2017 Americas: Technology: Internet
Goldman Sachs Global Investment Research 23
LATIN AMERICA
KEY THEMES
• LatAm e-commerce: Structural growth story in place. The structural online shift of retailing continues to play out in LatAm, as penetration continues to increase: we estimate 4.3% of retail sales in 2017, up from 3.7% in 2015. This remains below global levels (10%/17% in the US/China), leaving substantial room for growth. In 2016, ecommerce GMV in LatAm reached US$28bn, with growth remaining robust at +24% (weighted average in local currency). We see solid growth prospects for years to come (+21% 2016-20E GMV CAGR), supported by rising, albeit still relatively low access to broadband or mobile internet, financial inclusion and improvements in logistics solutions. Brazil is the largest market, responsible for 60% of total LatAm GMV, with a 4.4% penetration of retail sales (2016).
• Brazil: Improving consumers’ purchasing power supports GMV growth, but macro remains sluggish. In Brazil, we continue to see signs of gradual improvement in the consumer backdrop, with a recovery in purchasing power, which we expect to support a pick-up in overall real retail sales (broadly flat yoy in 2017E vs. -6.2% yoy in 2016). However, the overall macro backdrop remains sluggish (GS estimates real GDP growth of +0.7% in 2017), with unemployment still at record highs. Within this context, we expect GMV to grow at +18% in nominal local currency terms in 2017E, accelerating from +14% yoy in 2016, with penetration reaching 5.1% of total retail sales (vs. 4.4% in 2016). This should also be supported by increasing mobile commerce (32% of total 2017E online retail sales vs. 22% in 2016) and lower prices in the online channel (-5.4% yoy as of June 2017, according to Ebit association).
• For Neutral-rated MercadoLibre (25% estimated share of the market in 2017E), we forecast +49% yoy GMV growth in 2017E, mainly driven by an increase in items sold (+58% yoy), boosted in turn by its recently launched free-shipping campaign.
• For the rest of the industry, we forecast +10% yoy GMV growth, in-line with the guidance provided by industry association Ebit. In 1H17, the group’s (ecommerce market ex-MELI) GMV grew +7.5% yoy, partly driven by growth in orders (+3.9%) and in average tickets (+3.5% yoy), primarily due to a better mix.
TOP PICK
Netshoes (NETS, Buy). +107% upside to our US$23 12-mo PT
• Solid growth prospects. With c. 60% market share of Brazil’s online sporting goods market, we see NETS leadership in a vertical, where supplier relationships matter, as its competitive moat. We forecast +27% 2017-19E GMV CAGR (90% derived from Brazil).
• Operating leverage to drive positive EBITDA in 2018E. We forecast 1% consolidated EBITDA margin in 2018E (from -2.5% in 2016), primarily driven by operating leverage.
• Compelling valuation. With the stock trading at 0.6X 2018E EV/Sales (60% below global peers), we see valuation as undemanding, even considering the company’s below-average profitability and FCF profile.
• Risks to the downside include: (1) increasing competition, from new online competitors or brands’ DTC operation, (2) lower-than-expected operating leverage, (3) higher-than-expected working capital and capex.
0.0%
5.0%
10.0%
15.0%
20.0%
25.0%
30.0%
35.0%
$0
$10,000
$20,000
$30,000
$40,000
$50,000
$60,000
2012 2013 2014 2015 2016 2017E 2018E 2019E 2020E
Rest of Latin America Brazil
Rest of LatAm yoy (%) Brazil yoy (%)
Source: Company data, IBGE, IPCA, Euromonitor, Goldman Sachs Global Investment Research

September 6, 2017 Americas: Technology: Internet
Goldman Sachs Global Investment Research 24
LATIN AMERICA
• Brazil: Amazon - the elephant in the room. A question of when, not whether. Investors have been concerned about a potential increase in competition in Brazil, given repeated press coverage on Amazon potentially expanding its ecommerce operation in the country (currently exclusively focused on the sale of books). However, while we recognize that the impact in the local competitive environment could be material medium-term, the near-term impact may be somewhat more gradual than what we have seen in Mexico. Some articles have suggested AMZN would initially rely exclusively on 3P sellers and focus on (smaller) electronics in Brazil, unlike the approach it took in Mexico, where it used a hybrid (1P/3P) strategy to enter 15 different categories at launch. Regardless, we believe that room for complacency is limited. We believe MELI’s recent roll out of its free-shipping campaign to Brazil, as well as effort to build out its fulfillment capabilities through sortation centers, shows that incumbents are battening down the hatches
• LatAm Ex-Brazil: Is Mexico a playbook for the rest of LatAm? Mexico accounts for c.17% of LatAm’s GMV and the market’s competitive dynamic has fueled investor concerns that this could be a playbook for other markets like Brazil and Argentina. Since Amazon’s entry to Mexico in June 2015, the fight for market share has intensified significantly, with companies prioritizing growth over margins and making sizeable investments in marketing (120% of MELI’s net sales in 2Q17) and free shipping (AMZN offers free shipping for orders above US$30 since June 2015 and MELI followed with a matching offer in September 2016). That said, although we acknowledge the risk of a potentially similar outcome in other countries, we believe this may play out differently in markets like Brazil, where the leading five players consolidate 63% of market share (in 2016; compared to only 23% in 2014 in Mexico, ahead of AMZN’s entry). Moreover unlike in Mexico, where AMZN benefits from the proximity to the US and NAFTA trade rules, allowing the company to leverage inventories and marketplace vendors in its home market at competitive costs, Brazil is relatively protected market, with high import tariffs.
KEY THEMES

September 6, 2017 Americas: Technology: Internet
Goldman Sachs Global Investment Research 25
RUSSIA
KEY THEMES
• Penetration growth. Russian e-commerce market penetration is just 4%, significantly below worldwide average of c.9%, despite higher internet penetration. Key obstacles of e-commerce market growth are 1) Logistics (natural issue of low population density, large distances); Poor status of Russian Post (long delivery time); 2) Fulfillment (ability to quickly and cheaply fulfil the order, including multiple-goods within one order); 3) Regulation. Lack of government support / disadvantage vs international peers (no customs duty / VAT for international parcels; Drugs and alcohol not allowed for e-commerce); 4) Cash on delivery (low level of trust, high return ratio, working capital problems). Gradual resolution to each of the problems will drive online penetration growth, in our view.
• Market consolidation. Russian e-commerce market is very fragmented. We estimate Aliexpress market share at >20%; Yandex market share at c.12% and the rest of the market participants having less than 10% market share. Cross-boarder transactions represent a third of the overall market, and its share keeps growing.
Yandex and Sberbank announced US$1 bn e-commerce JV in August 2017. The deal could be transformational to the Russian e-commerce market, in our view. Cooperation unlocks substantial synergies: In our view, the deal should allow Yandex.Market to consolidate a substantial part of the Russian e-commerce market and drive e-commerce penetration growth in Russia. The proposed joint venture will have significant big-data capability (from client credit scoring to merchant credit quality assessment). In our view, synergy effects should also include the ability to create smooth payment and lending methods (providing solutions to the cash on delivery issue faced by Russian e-commerce), accelerate the build-up of logistics infrastructure; attract and retain high-quality merchants on the platform (including international); and improve bargaining power.
• Retail store closures. Is not yet observed in Russia as a major trend. E-commerce penetration remains to be low in Russia. Online food retail penetration is just 0.4%. Still, we have observed lower pace of DIY-store openings in 1H17, despite accelerating economic growth. This is in part explained by shift to online, in our view. According to Infoline, 62%of the largest DIY-retailers in Russia develop e-commerce. Mobile operators announced plans to cut retail distribution network, partly driven by continued shift of handset sales to online, we believe.
TOP PICK
Yandex (YNDX)
Yandex is our top-pick in the Russian Internet space. Yandex is Russia’s largest search engine with c.55% share, operates dominant e-hailing company Yandex.Taxi, owns the leading autos brand in Moscow (Auto.ru), and operates Russia’s largest e-commerce marketplace Yandex.Market. We view Yandex as uniquely exposed to Russian Internet markets as its platform combines ecosystems similar to that of Google, Amazon and Uber. We expect market share growth across segments in the medium term as well as continued growth of addressable markets. Recently announced JVs with Uber (e-hailing) and Sberbank (e-commerce) also create substantial synergies, in our view.
We are Buy-rated on Yandex. Our 12-month price target of US$37.2 is based on a SOTP (21x 2018E P/E for the core search business and a DCF (RUB166 bnEV) for the taxi segment). Key risks to our view and price target include a macro weakening, tougher competition in mobile/taxis, inflated distribution or marketing costs, weaker execution and adverse internet regulation in Russia.
0.0%
5.0%
10.0%
15.0%
20.0%
25.0%
30.0%
35.0%
40.0%
$0
$5,000
$10,000
$15,000
$20,000
$25,000
$30,000
$35,000
2012 2013 2014 2015 2016 2017E 2018E 2019E 2020E
Russia yoy growth (%)
Sources: AKIT, Euromonitor, Goldman Sachs Global Investment Research
September 6, 2017 Americas: Technology: Internet
Goldman Sachs Global Investment Research 26
Rating and pricing information
Alibaba Group (B/N, $171.04), Amazon.com Inc. (B/A, $978.25), Canada Goose Holdings (B/N, $18.17), CarMax Inc. (B/N, $68.12), GLP
J-REIT (B/N, ¥116,800), JD.com Inc. (B/N, $41.40), JUST EAT (B/N, 679.00p), Marks & Spencer (S/N, 320.80p), MonotaRO (B/N, ¥3,200),
Netshoes (Cayman) Ltd. (B/N, $11.56), Nike Inc. (B/N, $53.36), Ocado Group (B/N, 301.40p), PayPal Holdings (B/A, $61.46), Schibsted
ASA (B/A, Nkr190.30), Ulta Beauty Inc. (B/N, $221.73), Wal-Mart Stores Inc. (B/N, $78.37), Yahoo Japan (B/N, ¥498) and Yandex NV
(B/N, $32.21)
Financial Advisory Disclosure
Goldman Sachs and/or one of its affiliates is acting as a financial advisor in connection with an announced strategic matter involving
the following company or one of its affiliates: Just Eat Plc

September 6, 2017 Americas: Technology: Internet
Goldman Sachs Global Investment Research 27
Disclosure Appendix
Reg AC
I, Heath P. Terry, CFA, hereby certify that all of the views expressed in this report accurately reflect my personal views about the subject company or companies and its or their securities. I also certify
that no part of my compensation was, is or will be, directly or indirectly, related to the specific recommendations or views expressed in this report.
Unless otherwise stated, the individuals listed on the cover page of this report are analysts in Goldman Sachs' Global Investment Research division.
GS Factor Profile
The Goldman Sachs Factor Profile provides investment context for a stock by comparing key attributes to the market (i.e. our coverage universe) and its sector peers. The four key attributes depicted
are: Growth, Financial Returns, Multiple (e.g. valuation) and Integrated (a composite of Growth, Financial Returns and Multiple). Growth, Financial Returns and Multiple are calculated by using
normalized ranks for specific metrics for each stock. The normalized ranks for the metrics are then averaged and converted into percentiles for the relevant attribute. The precise calculation of each
metric may vary depending on the fiscal year, industry and region, but the standard approach is as follows:
Growth is based on a stock's forward-looking sales growth, EBITDA growth and EPS growth (for financial stocks, only EPS and sales growth), with a higher percentile indicating a higher growth
company. Financial Returns is based on a stock's forward-looking ROE, ROCE and CROCI (for financial stocks, only ROE), with a higher percentile indicating a company with higher financial returns.
Multiple is based on a stock's forward-looking P/E, P/B, price/dividend (P/D), EV/EBITDA, EV/FCF and EV/Debt Adjusted Cash Flow (DACF) (for financial stocks, only P/E, P/B and P/D), with a higher
percentile indicating a stock trading at a higher multiple. The Integrated percentile is calculated as the average of the Growth percentile, Financial Returns percentile and (100% - Multiple percentile).
Financial Returns and Multiple use the Goldman Sachs analyst forecasts at the fiscal year-end at least three quarters in the future. Growth uses inputs for the fiscal year at least seven quarters in the
future compared with the year at least three quarters in the future (on a per-share basis for all metrics).
For a more detailed description of how we calculate the GS Factor Profile, please contact your GS representative.
Quantum
Quantum is Goldman Sachs' proprietary database providing access to detailed financial statement histories, forecasts and ratios. It can be used for in-depth analysis of a single company, or to make
comparisons between companies in different sectors and markets.
GS SUSTAIN
GS SUSTAIN is a global investment strategy aimed at long-term, long-only performance with a low turnover of ideas. The GS SUSTAIN focus list includes leaders our analysis shows to be well
positioned to deliver long term outperformance through sustained competitive advantage and superior returns on capital relative to their global industry peers. Leaders are identified based on
quantifiable analysis of three aspects of corporate performance: cash return on cash invested, industry positioning and management quality (the effectiveness of companies' management of the
environmental, social and governance issues facing their industry).
Disclosures
Coverage group(s) of stocks by primary analyst(s)
Heath P. Terry, CFA: America-Internet. Matthew J. Fassler: America-Retail: Specialty Hardlines. Lindsay Drucker Mann, CFA: America-Accessories: Handbags and Jewelry, America-Brands: Athletic and
Other Wholesale Brands, America-Retail: Department Stores & Specialty, America-Retail: Off-Price. Piyush Mubayi: China Internet. Irma Sgarz: Latin America-Retail & Consumer Goods. Masaru
Sugiyama: Japan Internet and Games, Japan-Consumer Electronics, Japan-Media. Rob Joyce: Europe-Food Retail, Europe-General Retail. Ronald Keung, CFA: China Internet, China Logistics. Lisa
Yang: EMEA New Markets-Media, Europe-General Retail, Europe-Media. Sho Kawano: Japan-Retail/Restaurants. Vyacheslav Degtyarev: EMEA New Markets-Media, EMEA New Markets-Telecoms.
America-Accessories: Handbags and Jewelry: Coach Inc., Michael Kors Holdings, Signet Jewelers Ltd., Tiffany & Co..
America-Brands: Athletic and Other Wholesale Brands: Canada Goose Holdings, Canada Goose Holdings, Carter's Inc., Columbia Sportswear Co., Hanesbrands Inc., Nike Inc., PVH Corp., Ralph Lauren
Corp., Under Armour Inc., VF Corp..
America-Internet: Amazon.com Inc., Bankrate Inc., Blue Apron Holdings, Criteo SA, eBay Inc., Endurance International Group, Etsy Inc., Expedia Inc., Groupon Inc., GrubHub Inc., IAC/InterActiveCorp,
LendingClub Corp., Match Group, Netflix Inc., Pandora Media Inc., PayPal Holdings, Priceline.com Inc., Redfin Corp., Shutterfly Inc., Snap Inc., TripAdvisor Inc., Trivago N.V., TrueCar, Twitter Inc.,
WebMD Health Corp., Yelp Inc., Zillow Group, Zynga Inc..
America-Retail: Department Stores & Specialty: American Eagle Outfitters Inc., Gap Inc., Kohl's Corp., L Brands Inc., lululemon athletica inc., Macy's Inc., Nordstrom Inc., Urban Outfitters Inc..
America-Retail: Off-Price: Burlington Stores Inc., Ross Stores Inc., TJX Cos..
America-Retail: Specialty Hardlines: Advance Auto Parts Inc., At Home Group, AutoZone Inc., Bed Bath & Beyond Inc., Best Buy Co., CarMax Inc., Container Store Group, Costco Wholesale, Floor &
Decor Holdings, Genuine Parts Co., Home Depot Inc., KAR Auction Services Inc., Lowe's Cos., Lumber Liquidators Holdings, Michaels Cos., Monro Muffler Brake Inc., O'Reilly Automotive Inc., Office
Depot, RH, Staples Inc., Target Corp., Ulta Beauty Inc., Wal-Mart Stores Inc., Wayfair Inc., Williams-Sonoma Inc..
China Internet: 58.com Inc., Alibaba Group, Baidu.com Inc., Ctrip.com International, Gridsum, JD.com Inc., Momo Inc., NetEase Inc., New Oriental Education & Technology, SINA Corp., TAL Education
Group, Tarena International Inc., Tencent Holdings, Vipshop Holdings, Weibo Corp., YY Inc..

September 6, 2017 Americas: Technology: Internet
Goldman Sachs Global Investment Research 28
China Logistics: Kerry Logistics Network Ltd., Sinotrans Air Transportation Dev, Sinotrans Ltd., ZTO Express (Cayman) Inc..
EMEA New Markets-Media: Mail.ru Group, Naspers Ltd., Yandex NV.
EMEA New Markets-Telecoms: Cyfrowy Polsat, Magyar Telekom, MegaFon, Mobile Telesystems, MTN Group, Orange Polska SA, OTE, Rostelecom, Sistema JSFC, Telkom SA, Turk Telekom, Turkcell
Iletisim Hizmetleri AS, Veon Ltd., Vodacom.
Europe-Food Retail: Ahold Delhaize NV, Booker Group, Carrefour, Casino, Colruyt, J Sainsbury, Jeronimo Martins, Morrison (Wm), Ocado Group, Tesco.
Europe-General Retail: adidas, ASOS Plc, Associated British Foods, B&M European Value Retail SA, Brunello Cucinelli SpA, Burberry, Debenhams, Delivery Hero, Dixons Carphone Plc, Europris ASA,
Hennes & Mauritz, Hugo Boss AG, Inditex, JUST EAT, Kering, Kingfisher, Luxottica (Italy), LVMH Moet-Hennessy Louis Vuitton, Maisons du Monde SAS, Marks & Spencer, Moncler SpA, Next, OVS
SpA, Pandora, Pets at Home Group, Prada SpA, Puma, Richemont, Rocket Internet SE, Salvatore Ferragamo SpA, Showroomprivé, Steinhoff International Holdings, Swatch Group, Takeaway.com,
Technogym SpA, Ted Baker, Thule Group, Tod's, Tokmanni Group, XXL ASA, YOOX Net-A-Porter Group, Zalando SE.
Europe-Media: Ascential Plc, Atresmedia, Auto Trader Group, Axel Springer AG, Daily Mail and General Trust, Emerald Expositions Events Inc., Havas, Informa, ITV Plc, JCDecaux, Lagardere, M6 -
Metropole Television, Mediaset, Mediaset Espana, Modern Times Group, Pearson, ProSiebenSat.1, Publicis, RELX NV, RELX Plc, Rightmove Plc, RTL Group, Schibsted ASA, Scout24 AG, Sky Plc, TF1,
UBM Plc, Vivendi, Wolters Kluwer, WPP Plc, ZPG Plc.
Japan Internet and Games: Bandai Namco Holdings, Capcom, CyberAgent, DeNA Co., Kakaku.com, Konami, LINE Corp., Nexon, Nintendo, Rakuten, Recruit Holdings, Sega Sammy Holdings, Square
Enix Holdings, Yahoo Japan.
Japan-Consumer Electronics: Panasonic Corp., Sony.
Japan-Media: Dentsu, Hakuhodo DY Holdings.
Japan-Retail/Restaurants: ABC-Mart, Adastria, Aeon, Ain Holdings, Askul, Cosmos Pharmaceutical, Don Quijote Co., FamilyMart UNY Holdings, Fast Retailing, H2O Retailing, Isetan Mitsukoshi
Holdings, J. Front Retailing Co., K's Holdings, Komeri, Lawson, Marui Group, MonotaRO, Nitori, Onward Holdings, Ryohin Keikaku, Saizeriya, Seven & i Holdings, Shimamura, Skylark Co., Sugi
Holdings Co., Tsuruha Holdings, Welcia Holdings, Yamada Denki.
Latin America-Retail & Consumer Goods: Arezzo & Co., B2W, CBD (Pão de Açúcar), Cencosud, Cia Hering, El Puerto De Liverpool, Falabella, Grupo Carrefour Brasil, Hypermarcas, Laureate Education
Inc., Lojas Americanas, Lojas Renner, MercadoLibre Inc., Natura, Netshoes (Cayman) Ltd., Raia Drogasil, Soriana, Via Varejo SA, Wal-Mart de Mexico, Wal-Mart de Mexico.
Company-specific regulatory disclosures
Compendium report: please see disclosures at http://www.gs.com/research/hedge.html. Disclosures applicable to the companies included in this compendium can be found in the latest relevant
published research
Distribution of ratings/investment banking relationships
Goldman Sachs Investment Research global Equity coverage universe
Rating Distribution Investment Banking Relationships
Buy Hold Sell Buy Hold Sell
Global 32% 54% 14% 65% 56% 49%
As of July 1, 2017, Goldman Sachs Global Investment Research had investment ratings on 2,753 equity securities. Goldman Sachs assigns stocks as Buys and Sells on various regional Investment
Lists; stocks not so assigned are deemed Neutral. Such assignments equate to Buy, Hold and Sell for the purposes of the above disclosure required by the FINRA Rules. See 'Ratings, Coverage groups
and views and related definitions' below. The Investment Banking Relationships chart reflects the percentage of subject companies within each rating category for whom Goldman Sachs has provided
investment banking services within the previous twelve months.
Price target and rating history chart(s)
Compendium report: please see disclosures at http://www.gs.com/research/hedge.html. Disclosures applicable to the companies included in this compendium can be found in the latest relevant
published research
Regulatory disclosures
Disclosures required by United States laws and regulations
See company-specific regulatory disclosures above for any of the following disclosures required as to companies referred to in this report: manager or co-manager in a pending transaction; 1% or
other ownership; compensation for certain services; types of client relationships; managed/co-managed public offerings in prior periods; directorships; for equity securities, market making and/or
specialist role. Goldman Sachs trades or may trade as a principal in debt securities (or in related derivatives) of issuers discussed in this report.
The following are additional required disclosures: Ownership and material conflicts of interest: Goldman Sachs policy prohibits its analysts, professionals reporting to analysts and members of their
households from owning securities of any company in the analyst's area of coverage. Analyst compensation: Analysts are paid in part based on the profitability of Goldman Sachs, which includes
investment banking revenues. Analyst as officer or director: Goldman Sachs policy generally prohibits its analysts, persons reporting to analysts or members of their households from serving as an
officer, director or advisor of any company in the analyst's area of coverage. Non-U.S. Analysts: Non-U.S. analysts may not be associated persons of Goldman, Sachs & Co. and therefore may not be
subject to FINRA Rule 2241 or FINRA Rule 2242 restrictions on communications with subject company, public appearances and trading securities held by the analysts.

September 6, 2017 Americas: Technology: Internet
Goldman Sachs Global Investment Research 29
Distribution of ratings: See the distribution of ratings disclosure above. Price chart: See the price chart, with changes of ratings and price targets in prior periods, above, or, if electronic format or if
with respect to multiple companies which are the subject of this report, on the Goldman Sachs website at http://www.gs.com/research/hedge.html.
Additional disclosures required under the laws and regulations of jurisdictions other than the United States
The following disclosures are those required by the jurisdiction indicated, except to the extent already made above pursuant to United States laws and regulations. Australia: Goldman Sachs Australia
Pty Ltd and its affiliates are not authorised deposit-taking institutions (as that term is defined in the Banking Act 1959 (Cth)) in Australia and do not provide banking services, nor carry on a banking
business, in Australia. This research, and any access to it, is intended only for "wholesale clients" within the meaning of the Australian Corporations Act, unless otherwise agreed by Goldman Sachs. In
producing research reports, members of the Global Investment Research Division of Goldman Sachs Australia may attend site visits and other meetings hosted by the issuers the subject of its research
reports. In some instances the costs of such site visits or meetings may be met in part or in whole by the issuers concerned if Goldman Sachs Australia considers it is appropriate and reasonable in the
specific circumstances relating to the site visit or meeting. Brazil: Disclosure information in relation to CVM Instruction 483 is available at http://www.gs.com/worldwide/brazil/area/gir/index.html.
Where applicable, the Brazil-registered analyst primarily responsible for the content of this research report, as defined in Article 16 of CVM Instruction 483, is the first author named at the beginning of
this report, unless indicated otherwise at the end of the text. Canada: Goldman Sachs Canada Inc. is an affiliate of The Goldman Sachs Group Inc. and therefore is included in the company specific
disclosures relating to Goldman Sachs (as defined above). Goldman Sachs Canada Inc. has approved of, and agreed to take responsibility for, this research report in Canada if and to the extent that
Goldman Sachs Canada Inc. disseminates this research report to its clients. Hong Kong: Further information on the securities of covered companies referred to in this research may be obtained on
request from Goldman Sachs (Asia) L.L.C. India: Further information on the subject company or companies referred to in this research may be obtained from Goldman Sachs (India) Securities Private
Limited, Research Analyst - SEBI Registration Number INH000001493, 951-A, Rational House, Appasaheb Marathe Marg, Prabhadevi, Mumbai 400 025, India, Corporate Identity Number
U74140MH2006FTC160634, Phone +91 22 6616 9000, Fax +91 22 6616 9001. Goldman Sachs may beneficially own 1% or more of the securities (as such term is defined in clause 2 (h) the Indian
Securities Contracts (Regulation) Act, 1956) of the subject company or companies referred to in this research report. Japan: See below. Korea: Further information on the subject company or
companies referred to in this research may be obtained from Goldman Sachs (Asia) L.L.C., Seoul Branch. New Zealand: Goldman Sachs New Zealand Limited and its affiliates are neither "registered
banks" nor "deposit takers" (as defined in the Reserve Bank of New Zealand Act 1989) in New Zealand. This research, and any access to it, is intended for "wholesale clients" (as defined in the Financial
Advisers Act 2008) unless otherwise agreed by Goldman Sachs. Russia: Research reports distributed in the Russian Federation are not advertising as defined in the Russian legislation, but are
information and analysis not having product promotion as their main purpose and do not provide appraisal within the meaning of the Russian legislation on appraisal activity. Singapore: Further
information on the covered companies referred to in this research may be obtained from Goldman Sachs (Singapore) Pte. (Company Number: 198602165W). Taiwan: This material is for reference
only and must not be reprinted without permission. Investors should carefully consider their own investment risk. Investment results are the responsibility of the individual investor. United Kingdom: Persons who would be categorized as retail clients in the United Kingdom, as such term is defined in the rules of the Financial Conduct Authority, should read this research in conjunction
with prior Goldman Sachs research on the covered companies referred to herein and should refer to the risk warnings that have been sent to them by Goldman Sachs International. A copy of these
risks warnings, and a glossary of certain financial terms used in this report, are available from Goldman Sachs International on request.
European Union: Disclosure information in relation to Article 4 (1) (d) and Article 6 (2) of the European Commission Directive 2003/125/EC is available at
http://www.gs.com/disclosures/europeanpolicy.html which states the European Policy for Managing Conflicts of Interest in Connection with Investment Research.
Japan: Goldman Sachs Japan Co., Ltd. is a Financial Instrument Dealer registered with the Kanto Financial Bureau under registration number Kinsho 69, and a member of Japan Securities Dealers
Association, Financial Futures Association of Japan and Type II Financial Instruments Firms Association. Sales and purchase of equities are subject to commission pre-determined with clients plus
consumption tax. See company-specific disclosures as to any applicable disclosures required by Japanese stock exchanges, the Japanese Securities Dealers Association or the Japanese Securities
Finance Company.
Ratings, coverage groups and views and related definitions
Buy (B), Neutral (N), Sell (S) -Analysts recommend stocks as Buys or Sells for inclusion on various regional Investment Lists. Being assigned a Buy or Sell on an Investment List is determined by a
stock's total return potential relative to its coverage. Any stock not assigned as a Buy or a Sell on an Investment List with an active rating (i.e., a stock that is not Rating Suspended, Not Rated,
Coverage Suspended or Not Covered), is deemed Neutral. Each regional Investment Review Committee manages various regional Investment Lists to a global guideline of 25%-35% of stocks as Buy
and 10%-15% of stocks as Sell; however, the distribution of Buys and Sells in any particular analyst’s coverage group may vary as determined by the regional Investment Review Committee.
Additionally, each Investment Review Committee manages Regional Conviction lists, which represent investment recommendations focused on the size of the total return potential and/or the
likelihood of the realization of the return across their respective areas of coverage. The addition or removal of stocks from such Conviction lists do not represent a change in the analysts’ investment
rating for such stocks.
Total return potential represents the upside or downside differential between the current share price and the price target, including all paid or anticipated dividends, expected during the time horizon
associated with the price target. Price targets are required for all covered stocks. The total return potential, price target and associated time horizon are stated in each report adding or reiterating an
Investment List membership.
Coverage groups and views: A list of all stocks in each coverage group is available by primary analyst, stock and coverage group at http://www.gs.com/research/hedge.html. The analyst assigns one
of the following coverage views which represents the analyst's investment outlook on the coverage group relative to the group's historical fundamentals and/or valuation. Attractive (A). The
investment outlook over the following 12 months is favorable relative to the coverage group's historical fundamentals and/or valuation. Neutral (N). The investment outlook over the following 12
months is neutral relative to the coverage group's historical fundamentals and/or valuation. Cautious (C). The investment outlook over the following 12 months is unfavorable relative to the coverage
group's historical fundamentals and/or valuation.
Not Rated (NR). The investment rating and target price have been removed pursuant to Goldman Sachs policy when Goldman Sachs is acting in an advisory capacity in a merger or strategic
transaction involving this company and in certain other circumstances. Rating Suspended (RS). Goldman Sachs Research has suspended the investment rating and price target for this stock, because
there is not a sufficient fundamental basis for determining, or there are legal, regulatory or policy constraints around publishing, an investment rating or target. The previous investment rating and
price target, if any, are no longer in effect for this stock and should not be relied upon. Coverage Suspended (CS). Goldman Sachs has suspended coverage of this company. Not Covered (NC). Goldman Sachs does not cover this company. Not Available or Not Applicable (NA). The information is not available for display or is not applicable. Not Meaningful (NM). The
information is not meaningful and is therefore excluded.

September 6, 2017 Americas: Technology: Internet
Goldman Sachs Global Investment Research 30
Global product; distributing entities
The Global Investment Research Division of Goldman Sachs produces and distributes research products for clients of Goldman Sachs on a global basis. Analysts based in Goldman Sachs offices
around the world produce equity research on industries and companies, and research on macroeconomics, currencies, commodities and portfolio strategy. This research is disseminated in Australia
by Goldman Sachs Australia Pty Ltd (ABN 21 006 797 897); in Brazil by Goldman Sachs do Brasil Corretora de Títulos e Valores Mobiliários S.A.; in Canada by either Goldman Sachs Canada Inc. or
Goldman, Sachs & Co.; in Hong Kong by Goldman Sachs (Asia) L.L.C.; in India by Goldman Sachs (India) Securities Private Ltd.; in Japan by Goldman Sachs Japan Co., Ltd.; in the Republic of Korea by
Goldman Sachs (Asia) L.L.C., Seoul Branch; in New Zealand by Goldman Sachs New Zealand Limited; in Russia by OOO Goldman Sachs; in Singapore by Goldman Sachs (Singapore) Pte. (Company
Number: 198602165W); and in the United States of America by Goldman, Sachs & Co. Goldman Sachs International has approved this research in connection with its distribution in the United
Kingdom and European Union.
European Union: Goldman Sachs International authorised by the Prudential Regulation Authority and regulated by the Financial Conduct Authority and the Prudential Regulation Authority, has
approved this research in connection with its distribution in the European Union and United Kingdom; Goldman Sachs AG and Goldman Sachs International Zweigniederlassung Frankfurt, regulated
by the Bundesanstalt für Finanzdienstleistungsaufsicht, may also distribute research in Germany.
General disclosures
This research is for our clients only. Other than disclosures relating to Goldman Sachs, this research is based on current public information that we consider reliable, but we do not represent it is
accurate or complete, and it should not be relied on as such. The information, opinions, estimates and forecasts contained herein are as of the date hereof and are subject to change without prior
notification. We seek to update our research as appropriate, but various regulations may prevent us from doing so. Other than certain industry reports published on a periodic basis, the large majority
of reports are published at irregular intervals as appropriate in the analyst's judgment.
Goldman Sachs conducts a global full-service, integrated investment banking, investment management, and brokerage business. We have investment banking and other business relationships with a
substantial percentage of the companies covered by our Global Investment Research Division. Goldman, Sachs & Co., the United States broker dealer, is a member of SIPC (http://www.sipc.org).
Our salespeople, traders, and other professionals may provide oral or written market commentary or trading strategies to our clients and principal trading desks that reflect opinions that are contrary
to the opinions expressed in this research. Our asset management area, principal trading desks and investing businesses may make investment decisions that are inconsistent with the
recommendations or views expressed in this research.
The analysts named in this report may have from time to time discussed with our clients, including Goldman Sachs salespersons and traders, or may discuss in this report, trading strategies that
reference catalysts or events that may have a near-term impact on the market price of the equity securities discussed in this report, which impact may be directionally counter to the analyst's published
price target expectations for such stocks. Any such trading strategies are distinct from and do not affect the analyst's fundamental equity rating for such stocks, which rating reflects a stock's return
potential relative to its coverage group as described herein.
We and our affiliates, officers, directors, and employees, excluding equity and credit analysts, will from time to time have long or short positions in, act as principal in, and buy or sell, the securities or
derivatives, if any, referred to in this research.
The views attributed to third party presenters at Goldman Sachs arranged conferences, including individuals from other parts of Goldman Sachs, do not necessarily reflect those of Global Investment
Research and are not an official view of Goldman Sachs.
Any third party referenced herein, including any salespeople, traders and other professionals or members of their household, may have positions in the products mentioned that are inconsistent with
the views expressed by analysts named in this report.
This research is not an offer to sell or the solicitation of an offer to buy any security in any jurisdiction where such an offer or solicitation would be illegal. It does not constitute a personal
recommendation or take into account the particular investment objectives, financial situations, or needs of individual clients. Clients should consider whether any advice or recommendation in this
research is suitable for their particular circumstances and, if appropriate, seek professional advice, including tax advice. The price and value of investments referred to in this research and the income
from them may fluctuate. Past performance is not a guide to future performance, future returns are not guaranteed, and a loss of original capital may occur. Fluctuations in exchange rates could have
adverse effects on the value or price of, or income derived from, certain investments.
Certain transactions, including those involving futures, options, and other derivatives, give rise to substantial risk and are not suitable for all investors. Investors should review current options
disclosure documents which are available from Goldman Sachs sales representatives or at http://www.theocc.com/about/publications/character-risks.jsp. Transaction costs may be significant in option
strategies calling for multiple purchase and sales of options such as spreads. Supporting documentation will be supplied upon request.
All research reports are disseminated and available to all clients simultaneously through electronic publication to our internal client websites. Not all research content is redistributed to our clients or
available to third-party aggregators, nor is Goldman Sachs responsible for the redistribution of our research by third party aggregators. For research, models or other data available on a particular
security, please contact your sales representative or go to http://360.gs.com.
Disclosure information is also available at http://www.gs.com/research/hedge.html or from Research Compliance, 200 West Street, New York, NY 10282.
© 2017 Goldman Sachs.
No part of this material may be (i) copied, photocopied or duplicated in any form by any means or (ii) redistributed without the prior written consent of The Goldman Sachs Group, Inc.