RAISING COMFORT - Stabilusir.stabilus.com/download/companies/stabilus/Annual Reports... · me when...
152
RAISING COMFORT RAISING COMFORT ANNUAL REPORT 2015
Transcript of RAISING COMFORT - Stabilusir.stabilus.com/download/companies/stabilus/Annual Reports... · me when...
R A I S I N G C O M F O RTR A I S I N G C O M F O RTA N N UA L R E P O RT 2 0 1 5

POWERISE
GAS SPRING
EUROPE
SWIVEL CHAIR
ASIA
NAFTA
INDUSTRIAL
2 3 % 3 8 %
4 8 %
5 0 %
5 %1 2 %
2 4 %
K E Y F I G U R E S
Revenue by marketsRevenue by region ( locat ion of Stabi lus company)
IN € MILLIONS
Year ended Sept 30,
CHANGE % CHANGE2015 2014
Revenue 611.3 507.3 104.0 20.5%
EBITDA 99.5 71.3 28.2 39.6%
Adjusted EBITDA 107.3 92.5 14.8 16.0%
EBIT 55.7 31.2 24.5 78.5%
Adjusted EBIT 76.2 65.1 11.1 17.1%
Capital expenditure (51.5) (35.6) (15.9) 44.7%
Free cash flow (FCF) 2.6 22.1 (19.5) (88.2)%
EBITDA as % of revenue 16.3% 14.1%
Adjusted EBITDA as % of revenue 17.6% 18.2%
EBIT as % of revenue 9.1% 6.2%
Adjusted EBIT as % of revenue 12.5% 12.8%
Capital expenditure as % of revenue 8.4% 7.0%
FCF as % of adjusted EBITDA 2.4% 23.9%
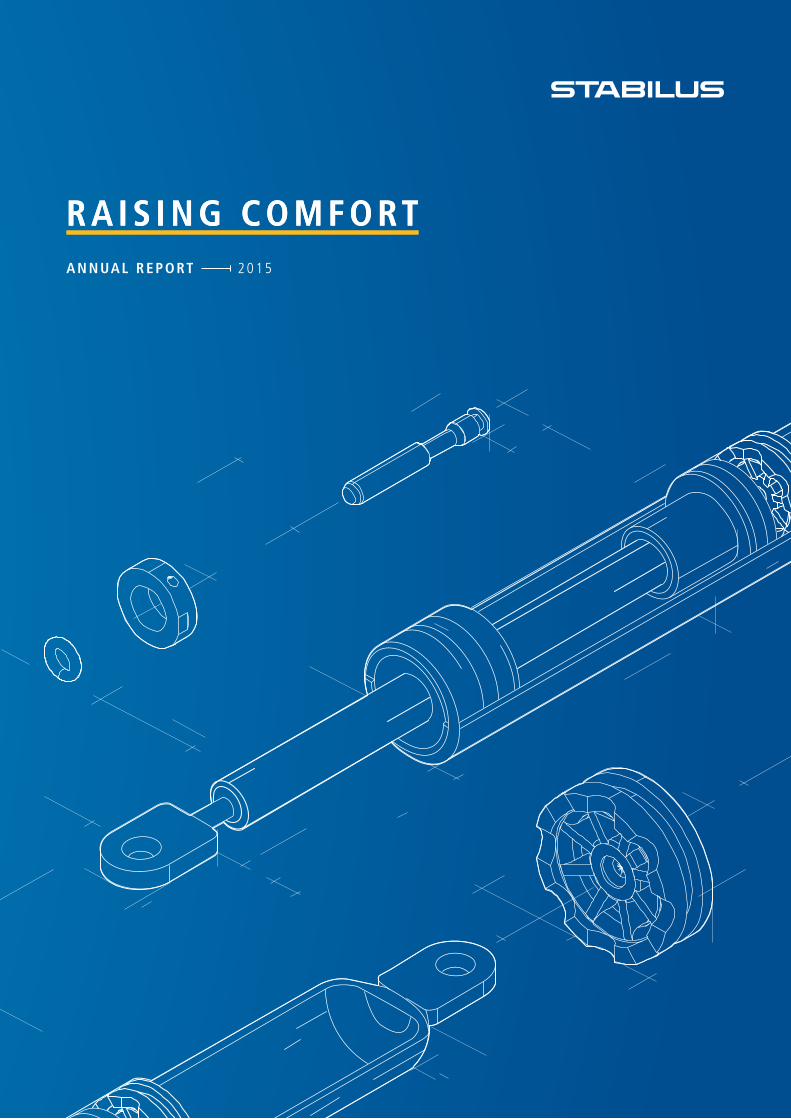
A s w o r l d m a r ke t l e a d e r f o r g a s s p r i n g s a n d d a m p e r s ,
w e h a v e d e m o n s t r a t e d o u r e x p e r t i s e f o r e i g h t d e c a d e s :
I n t h e a u t o m o t i v e i n d u s t r y , i n t h e f u r n i t u r e s e c t o r, i n
h o u s e a n d b u i l d i n g t e c h n o l o g y a s w e l l a s a va r i e t y
o f o t h e r s e c t o r s s u c h a s m e d i c a l p r o d u c t s a n d
r e h a b i l i t a t i o n t e c h n o l o g y .
O u r g a s s p r i n g s , d a m p e r s a n d e l e c t r o m e c h a n i c a l
d r i v e s a l l o w u s e r s t o o p t i m i z e o p e n i n g , c l o s i n g , l i f t i n g ,
l o w e r i n g , d a m p i n g a n d a d j u s t i n g a c t i o n s .
01A N N U A L R E P O R T 2 0 1 5
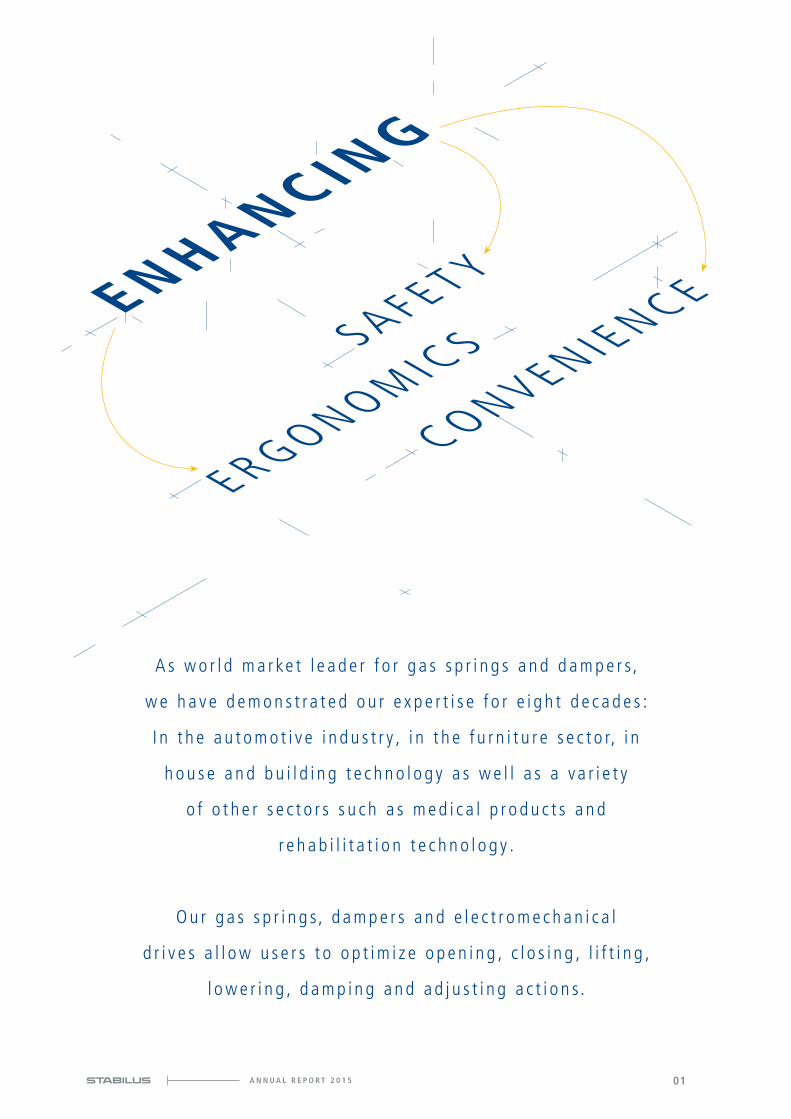
Itajubá
B R A Z I L
O U R U N I T S
U S A
Gastonia, NC
Sterling Heights, MI
Schaumburg, IL
Ramos Arizpe
M E X I C O
E U R O P E
Luxembourg, Luxembourg
Koblenz, Germany
Derio, Spain
Poissy, France
Banbury, Great Britain
Torino, Italy
Brasov, Romania
L E G E N D
Production Powerise
Production Gas Spring
Sales Office
Stabilus S.A.
O U R U N I T S

Yokohama
J A PA N
Busan
Suwon
Changzhou City
Shanghai
C H I N A
Dingley
A U S T R A L I A
Auckland
Moscow
R U S S I A
S O U T H KO R E A
Singapore
S I N G A P O R E
N E W Z E A L A N D

PA G E 1 8 T H E M E G A T R E N D O F
D E M O G R A P H I C C H A N G E
We h e l p y o u t o s t a y a c t i v e
PA G E 2 2 T H E M E G A T R E N D O F C O M F O R T
We m a ke e v e r y d a y m a n u a l t a s k s e a s i e r
PA G E 2 6 T H E M E G A T R E N D O F O C C U PA T I O N A L
H E A LT H A N D S A F E T Y
We m a ke l o a d s m a n a g e a b l e
04 A N N U A L R E P O R T 2 0 1 5

A
B
C
D
E
C O N T E N T
T O O U R S H A R E H O L D E R S
08 Letter from the Chief Executive Officer
11 Report of the Supervisory Board
14 International Management Team
16 Three Megatrends as Growth Drivers
30 Stabilus Share
C O M B I N E D M A N A G E M E N T R E P O R T
35 General
35 Strategy
37 Research and Development
38 Business and General Environment
39 Results of Operations
43 Development of Operating Segments
44 Financial Position
45 Liquidity
47 Results of Operations and
Financial Position of Stabilus S.A.
47 Risk and Opportunities
53 Corporate Governance
55 Subsequent Events
55 Outlook
C O N S O L I D A T E D F I N A N C I A L S TA T E M E N T S
59 Consolidated Statement of Comprehensive Income
60 Consolidated Statement of Financial Position
62 Consolidated Statement of Changes in Equity
63 Consolidated Statement of Cash Flows
64 Notes to Consolidated Financial Statements
123 Responsibility Statement
124 Management Board of Stabilus S.A.
125 Supervisory Board of Stabilius S.A.
126 Independent Auditor's Report
A N N U A L A C C O U N T S
130 Balance Sheet
132 Profit and Loss Account
133 Notes to the Annual Accounts
141 Independent Auditor's Report
A D D I T I O N A L I N F O R M A T I O N
146 Financial Calendar
146 Disclaimer
147 Table Directory
149 Information Resources
05A N N U A L R E P O R T 2 0 1 5


A TO O U R S H A R E H O L D E R S
A
TO
OU
R S
HA
RE
HO
LD
ER
S
O I L
C O M P E N S AT I N G C H A M B E R
P I S TO N R O D
P R E S S U R E T U B E
B OT TO M VA LV E
M E M B R A N E
P R OT E C T I O N T U B E
S E A L A N D G U I D E PAC K AG E
P I S TO N PAC K AG E
N A M E
0 5 1 8 – 0 5 5 8 4 2 – 0 6 5 6 P R – 1 8 0NT
STAB-O-SHOC ® TA20
The TA20 damper is a high-performance, non-pressure, hydraulic vibration damper. Specific areas of application in utility vehicles are steering dampers in trailing axles or medical technology, e.g. backrest adjustments in hospital and nursing beds.

Ko p f ze i l e :
CE O L e t t e r
Dear Shareholders, Customers, Business Partners, Employees, Ladies and Gentlemen,
A successful fiscal year 2015 lies behind us, with continued profitable growth and record revenues of more than
€600 million. We enjoyed significant growth across all segments and sales markets and, at the same time, kept our
operating profitability at the strong level recorded in previous years. Our growth continues to be driven by consist-
ent execution of our long-term strategy STAR which is supported by three megatrends that you will read more
about in the course of this report: demographic developments, the growing need for comfort, and rising occupa-
tional health and safety standards.
We plan to continue our successful development and have therefore systematically invested an increasing amount
of capital into expanding our capacities – in line with rising demand from our customers worldwide and to address
the considerable market potential for our gas springs, dampers and electrical drives. To increase our gas springs
and dampers production footprint, we started construction of new, fully automated production lines in Germany
and the US, expanded our plant in Romania with a new building and new machinery, completed a new semiauto-
matic production line in Mexico and began setting up two new production lines for automotive and industrial
LETTER FROM THE CHIEF EXECUTIVE OFFICER
D i e t m a r S i e m s s e nC h i e f E x e c u t i v e O f f i c e r
LETTER FROM THE CHIEF EXECUTIVE OFFICER
08 A N N U A L R E P O R T 2 0 1 5
T O O U R S H A R E H O L D E R SCEO Letter

products as well as commissioning new machinery in China. We also strengthened our sales organization in the
high-growth Asian market and expanded our capacity to include a new powder coating line in South Korea in
order to reflect the sustained high level of potential offered by the market. In the Powerise segment, we expanded
our plant in Romania with a new building and a new production line, established an additional Powerise produc-
tion line in Mexico, and expanded our Chinese plant by adding a new building and a new production line that will
start production in summer 2016.
We are also continuously developing new applications for our products as part of our innovation process. An
example for this are the innovative wing doors of Tesla Model X which are actuated by our Powerise technology
the first time Powerise utilization has been expanded into more than tailgate applications. Even for our more tradi-
tional products we continue to find new applications. In solar parks, for example, they are increasingly being used
in solar modules that follow the course of the sun – our dampers absorb forces applied by sometimes severe
weather conditions protecting the expensive modules against breakages and other damage.
In terms of financing, too, we made extensive progress in the past fiscal year in order to prepare our company for
further growth. In December 2014, we took advantage of the attractive interest rate environment to complete a
long-term refinancing, which we used to redeem our high-yield bond in June 2015. This will improve our future
cash flow reducing the interest burden by about €13 million p.a. compared with the previous structure.
Looking at our operational performance figures, in fiscal year 2015 we increased our revenue by 20.5 percent year-
on-year, from €507.3 million to €611.3 million. We produced a total of 144 million gas springs and dampers (pre-
vious year: 138 million) and 3.2 million Powerise systems (previous year: 2.2 million).
Automotive business accounted for total revenue of €434.2 million, while €149.3 million was attributable to
industrial business. The main growth driver in automotive business remained the electromechanical Powerise drive,
whose revenue increased from €85.8 million in the previous year to €139.8 million in fiscal year 2015. In geo-
graphical terms, our strongest growth was achieved in the NAFTA region, but we also increased our revenue in
Asia and Europe. Despite extensive investment and the refinancing of our high-yield bond, our growth was profita-
ble: our adjusted EBIT improved by 17.1 percent, from €65.1 million in the previous year to €76.2 million.
In addition to the positive performance of our automotive business, I would also like to highlight the development
of our Swivel Chair unit, which recorded profitable revenue growth of 14.5 percent to a total of €27.7 million in
fiscal year 2015. I am personally very happy with this turnaround, which has been achieved by dedicated manage-
ment after many years of loss making.
We continue to see an unabated trend towards the increased use of gas springs, dampers, and electromechanical
drives across a wide range of industries. Consequently, we are planning to systematically press ahead with the
implementation of our successful strategy, expand our share of existing markets and develop new sales markets
09
CEO Letter
A N N U A L R E P O R T 2 0 1 5
T O O U R S H A R E H O L D E R S
thanks to innovative new solutions and our strong product pipeline. For fiscal year 2016, we are targeting reve-
nues of approximately €660 million – equating to organic growth of 8 percent – and plan for our adjusted EBIT
margin to remain at a level of 12 – 13 percent.
I would like to take this opportunity to thank all shareholders for your confidence in Stabilus. I believe you will join
me when I express my gratitude on your behalf to our customers for their loyalty and quality awareness and to our
business partners for the close and – in many cases – long-standing working relationships we enjoy. Last but not
least I would like to especially thank our more than 4,000 employees around the world for their extraordinary
commitment and their valuable contribution to the success of our company.
We all together look forward to the new fiscal year 2016.
Yours sincerely,
D i e t m a r S i e m s s e nC h i e f E x e c u t i v e O f f i c e r
10 A N N U A L R E P O R T 2 0 1 5
T O O U R S H A R E H O L D E R SCEO Letter
Dear Shareholders,
During the reporting period, i.e. the period since October 1, 2014, to September 30, 2015, two changes occurred
within the Supervisory Board: Mr. Andi Klein left the Board on May 12, 2015 and was succeeded by Dr. Joachim
Rauhut; Mr. Nizar Ghoussaini left the Board as per September 30, 2015 and was succeeded by Dr. Ralf-Michael
Fuchs. Dr. Joachim Rauhut was also elected as Chairman of the Audit Committee of Stabilus, effective May 12, 2015.
The Supervisory Board is very grateful to Messrs. Klein and Ghoussaini for their valuable contributions to the develop-
ment of our Group. The Supervisory Board of Stabilus S.A. performed its tasks and monitored the management activi-
ties of the Board of Management in accordance with legal requirements and the Articles of Association of Stabilus S.A.
The Board of Management and the Supervisory Board maintained close and regular contacts. The Supervisory Board
advised the Board of Management in regard to strategic and operational decisions as well as governance topics
and decided on matters requiring supervisory approval.
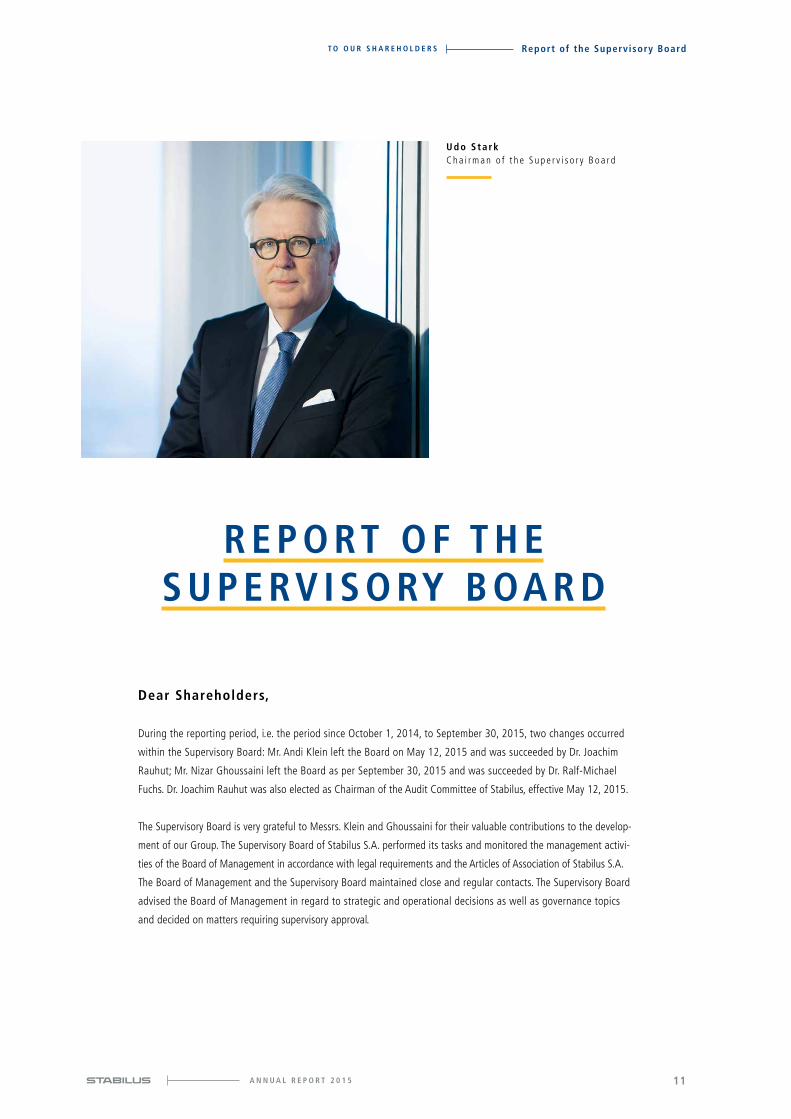
R E P O RT O F T H E S U P E RV I S O RY B OA R D
U d o S t a r kC h a i r m a n o f t h e S u p e r v i s o r y B o a r d
11
Report of the Supervisory Board
A N N U A L R E P O R T 2 0 1 5
T O O U R S H A R E H O L D E R S

C O O P E R AT I O N W I T H T H E B OA R D O F M A N AG E M E N T
The Board of Management reported regularly, promptly and extensively in verbal and written form to the Supervi-
sory Board regarding the position and performance of the Company and the Stabilus Group. Furthermore, the
Board of Management informed the Supervisory Board on a regular basis concerning the future business policy,
including the strategic and organizational direction of the Group. Between Supervisory Board meetings, Stabilus’
management kept the Chairman of the Supervisory Board informed about new developments.
In each of the Supervisory Board meetings, of which there were six in total during the last fiscal year and so far
one in the current fiscal year, the Board of Management reported on the commercial position of the Company as
well as key financial data.
The Board of Management also regularly provided reports about Stabilus’ business performance in the various
geographic markets (operating segments) and about the development of Stabilus’ four business units, namely
Automotive, Powerise, Industrial and Swivel Chair. Major investments of the Group companies, in particular invest-
ments for capacity extensions in key markets, were presented to and approved by the Supervisory Board.
The Board of Management reported about cost and quality matters as well as other operational topics related to
Stabilus’ products. The Supervisory Board and the Audit Committee examined the risk position of the Stabilus
Group and the development of systems and procedures for internal controls and risk management. The Supervisory
Board and the Audit Committee also reviewed the Group’s compliance organization.
The Supervisory Board was closely involved in Stabilus’ refinancing in fiscal year 2015. This refinancing resulted in
a significant reduction of interest to be paid by Stabilus for its credits.
D R AW I N G U P O F T H E F I N A N C I A L S TAT E M E N T S
The Supervisory Board examined the Company’s stand-alone annual accounts, the consolidated financial statements
and the management report for the financial year ending on September 30, 2015. Representatives of the auditor
KPMG Luxembourg Société coopérative attended the meeting of the Audit Committee on December 18, 2015 at
which the financial statements were examined. The representatives of the auditor reported extensively on their
findings, provided a written presentation and were available to give additional explanations and opinions.
12 A N N U A L R E P O R T 2 0 1 5
T O O U R S H A R E H O L D E R SReport of the Supervisory Board

The Supervisory Board did not raise objections to the Company’s stand-alone annual accounts or to the consoli-
dated financial statements drawn up by the Board of Management for the financial year ending on September 30,
2015 and to the auditors’ presentation. According to the recommendation of the Audit Committee, the Supervisory
Board agreed to the proposal of the Board of Management to approve both the Company’s stand-alone annual
accounts and the consolidated financial statements for fiscal year 2015. The auditor issued unqualified audit opin-
ions on December 18, 2015.
On behalf of the Supervisory Board, I want to thank the Board of Management for the open and effective collabo-
ration during the year, the Stabilus employees for their excellent contributions to the Company’s success as well as
our shareholders for the trust they place in Stabilus.
Luxembourg, December 18, 2015
On behalf of the Supervisory Board of Stabilus S.A
U d o S t a r kC h a i r m a n o f t h e S u p e r v i s o r y B o a r d
13
Report of the Supervisory Board
A N N U A L R E P O R T 2 0 1 5
T O O U R S H A R E H O L D E R S

0 1
0 4 0 6
0 7
0 2
0 3 0 5
I N T E R N AT I O N A L M A N AG E M E N T T E A M
0 1 H Ä R I N G, F R E D
V i c e P r e s i d e n t
B u s i n e s s U n i t S w i v e l C h a i r
0 2 H U B E R , R A L P H
V i c e P r e s i d e n t
B u s i n e s s U n i t I n d u s t r i a l
0 3 S A N D E R , K A R S T E N
V i c e P r e s i d e n t
B u s i n e s s U n i t A u t o m o t i v e
0 4 W I D M E R , M A RT I N A
V i c e P r e s i d e n t
G l o b a l H R
0 5 K A D E N BAC H , E K K E H A R D
V i c e P r e s i d e n t
G l o b a l P u r c h a s i n g
0 6 BA L M E RT, J OAC H I M
V i c e P r e s i d e n t
Q u a l i t y M a n a g e m e n t
0 7 L E E , J O O N G - H O ( JA M E S )
C o u n t r y H e a d Ko r e a
14 A N N U A L R E P O R T 2 0 1 5
T O O U R S H A R E H O L D E R SInternational Management Team
0 80 9
1 2
1 3
1 41 0 1 1
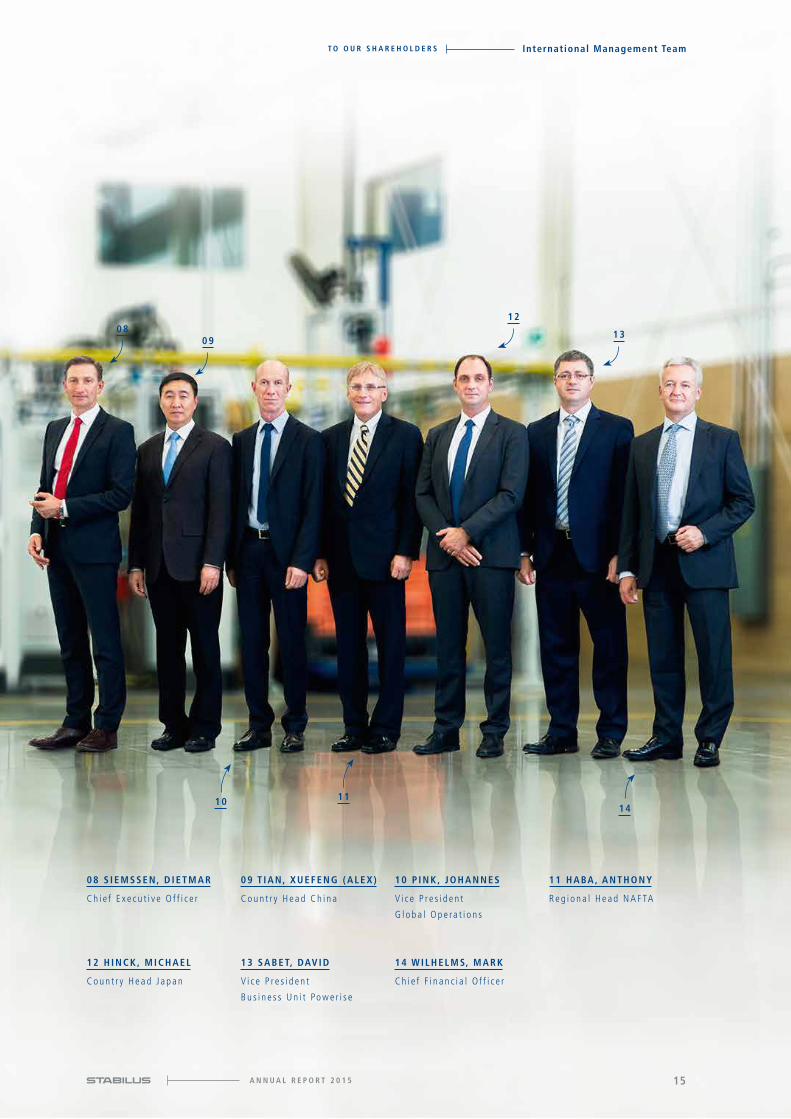
0 8 S I E M S S E N, D I E T M A R
C h i e f E x e c u t i v e O f f i c e r
0 9 T I A N, X U E F E N G ( A L E X )
C o u n t r y H e a d C h i n a
1 0 P I N K , J O H A N N E S
V i c e P r e s i d e n t
G l o b a l O p e ra t i o n s
1 1 H A BA , A N T H O N Y
R e g i o n a l H e a d N A F TA
1 2 H I N C K , M I C H A E L
C o u n t r y H e a d J a p a n
1 3 S A B E T, DAV I D
V i c e P r e s i d e n t
B u s i n e s s U n i t Po w e r i s e
1 4 W I L H E L M S, M A R K
C h i e f F i n a n c i a l O f f i c e r
15A N N U A L R E P O R T 2 0 1 5
T O O U R S H A R E H O L D E R S International Management Team

A g row ing , comfo r t - l ov ing m idd le c l a s s i n deve loped coun t r i e s and
emerg ing na t ions, a g loba l popu la t i on tha t i s bo th g row ing and ag ing ,
and g loba l p rog res s i n occupa t iona l hea l th and sa fe t y s tanda rds :
These th ree mega t rends r ep resen t impor tan t deve lopment s and
thus a l so se t the d i r e c t i on fo r the fu tu re o f the g loba l e conomy .
T H R E E M E G AT R E N D SA S G R OW T H D R I V E R S
E R G O N O M I C S O L U T I O N S F O R
E V E R Y D AY M A N U A L TA S K S
As global market leader for gas springs and dampers,
and with its electromechanical Powerise drives, Stabilus
benefits directly from these three global megatrends
because the Company’s products provide ergonomic
solutions for virtually all the challenges involved in
opening, closing, lifting, lowering, damping and adjust-
ing actions.

M
M
144gas springs and dampers produced by Stabilus in fiscal year 2015 (previous year: 138 million).
3.2Powerise systems produced by Stabilus in fiscal year 2015 (previous year: 2.2 million).
A L E A D E R I N M O T I O N C O N T R O L
People are living to an ever older age and want to stay active
longer. One of the requirements for achieving this aim is to improve
the ergonomics of recurring motion sequences on a long-term
basis. Consequently, Stabilus products are an integral part of daily
life in many commercial applications and private households, where
they help to make everyday manual tasks easier and more enjoya-
ble to perform. Even today, the possibilities extend way beyond the
automotive business and cover a wide range of uses in industry, in
air and rail transport, in nursing professions and in private house-
holds – and the trend is continuing upward.
The following pages illustrate the role that the megatrends play for
the global business of Stabilus in the automotive and industrial
sectors. But above all, they highlight the opportunities for signifi-
cant global growth that these megatrends continue to offer the
Company. The automotive business, for example, is expected to
grow significantly faster than the automotive market as a whole.

» W H AT H E L P S P E O P L ES TAY F I T L O N G E R ? «
T h e m e g a t r e n d o f d e m o g r a p h i c c h a n g e : H a l f a c e n t u r y a g o , 5 0 - y e a r- o l d s w e r e c o n s i d e r e d
t o b e o l d e v e n i n Eu r o p e a n d N o r t h A m e r i c a , w h e r e a s n o w a d a y s , m o r e a n d m o r e p e o p l e m a ke a f r e s h
s t a r t a t t h i s a g e .
2015: around 0.9 billion people2030: around 1.4 billion people2050: around 2.1 billion people
Forecasted rise in world population over the
age of 60
A N N U A L R E P O R T 2 0 1 518
Three Megatrends as Growth Drivers T O O U R S H A R E H O L D E R S

A N N U A L R E P O R T 2 0 1 5 19
Three Megatrends as Growth DriversT O O U R S H A R E H O L D E R S

W E H E L P TO S TAY AC T I V E !
G a s s p r i n g s , d a m p e r s a n d e l e c t r o m e c h a n i c a l d r i v e s
f r o m S t a b i l u s s e r v e a s r e l i a b l e h e l p e r s .
While the world population was 5.3 billion in 1990, it had already
increased to almost 7 billion by 2010. The United Nations expects
a further increase in the world population to some 8.4 billion by 2030
and further unstoppable growth even after that. Besides the indus-
trialization of agriculture and progress in the medical sector, a key
factor for this development is the decrease in poverty.
Life expectancy and the percentage of older people in the overall
population are increasing around the globe, almost in line with the
world population. According to the United Nations, almost 901 mil-
lion people around the world are over 60, and this number is expected
to rise to 1.4 billion by 2030 and to roughly 2.1 billion by 2050.
Progress in the medical sector will enable people to remain both
active and fit for work longer in the future.
S TA B I L U S P R O D U C T S H E L P TO H A N D L E
D E M O G R A P H I C C H A N G E
Solutions that relieve the human musculoskeletal system from chal-
lenging tasks and make everyday motion sequences more ergo-
nomic help to maintain people’s abilities to move and work. With
a large number of possible applications, gas springs, dampers and
electromechanical drives from Stabilus offer a broad spectrum of
use in industrial and private contexts. In its role as a component
and system supplier to leading providers in the automotive, furni-
ture and kitchen industries, in aircraft construction, mechanical
engineering and medical and commercial vehicle technology, Stabilus
guarantees ergonomically optimized applications.
Swivel chairs with STAB-O-MAT gas springs make working comfortable. Pleasantly dampened, they feature variable height adjustment and gently absorb the weight of the occupant.
20
Three Megatrends as Growth Drivers
A N N U A L R E P O R T 2 0 1 5
T O O U R S H A R E H O L D E R S

One of the important trends of the future is the creation of com-
bined standing / sitting workstations with height-adjustable office
desks. This type of desk is already in use in many companies. These
desks are designed to actively prevent back problems during work-
ing hours and thus to ensure the employees’ ability to work. Useful
side effects of switching between a sitting and standing position at
work include an improved ability to concentrate and react quickly
as well as a lower likelihood of getting tired.
At the moment, Scandinavia and Switzerland are the trend-setters
when it comes to standing / sitting workstations, but more and more
companies in other countries as well are deciding to introduce this
future-oriented workstation design. The height is usually adjusted by
means of an electric motor with power assistance provided by a gas
spring. Stabilus supplies gas springs to the market leaders among
the furniture manufacturers in this growing market segment.
N U M E R O U S P O S S I B I L I T I E S F O R U S E O N T H E
G R OW T H M A R K E T O F M E D I C A L T E C H N O L O G Y
The implications of aging societies are not only that longer active
participation in professional life must be ensured through improved
ergonomics, but also that more and more people will require more
intensive medical care including the need for nursing care in their
later stages of life. The use of gas springs, dampers and electrome-
chanical drives in medical products is increasing as a result of this
development. For example, Stabilus products support the adjustment
mechanism of sickbeds, help to make it easier to operate height-
adjustable side tables, and lift treatment chairs or operating tables
to the optimum height for the attending physician.
Sick or injured people often have to stay in bed for a long time. Our locking gas springs have proven themselves for smooth and safe adjustment of the various hospital bed segments for many years. Oil-hydraulic dampers from Stabilus ensure safe lowering of the side rails.
21
Three Megatrends as Growth Drivers
A N N U A L R E P O R T 2 0 1 5
T O O U R S H A R E H O L D E R S

Three Megatrends as Growth Drivers T O O U R S H A R E H O L D E R S
» H OW C A N W E M A K E E V E RY DAY L I F E M O R E
C O M F O RTA B L E ? «
T h e m e g a t r e n d o f c o m f o r t : A n i n c r e a s i n g n u m b e r o f p e o p l e c a n a f f o r d a m e n i t i e s t h a t
m a ke l i f e n o t i c e a b l y e a s i e r ; s o o n , w e w i l l n o t b e a b l e t o i m a g i n e l i f e w i t h o u t m a n y o f t h e s e c o m f o r t - e n h a n c i n g
f u n c t i o n s i n o u r c a r s a n d h o u s e h o l d s .
Growth in middle class by 2020
In 2009, around 1.8 billion people belonged to the middle class. In 2020,
it will be around 3.2 billion people.
Disposable income of global middle class in US dollar
purchasing power parity 2005
Worldwide: approx. $21.3 trillion in 2009 approx. $35.0 trillion in 2020
A N N U A L R E P O R T 2 0 1 522

Three Megatrends as Growth DriversT O O U R S H A R E H O L D E R S
A N N U A L R E P O R T 2 0 1 5 23

The demand for comfort-enhancing solutions that make life easier
is increasing all over the world. While features such as electric
window winders or air-conditioning systems were largely reserved
for top-of-the-range and luxury class vehicles three decades ago,
hardly any passenger car or truck rolls off the line without this
equipment nowadays. At the same time, the number of customers
who choose optional equipment such as heated seats, parking
assist systems or electromechanical lid drives like the Powerise
systems offered by Stabilus is increasing these days.
Demographically, this trend is supported by the growth of the global
middle class: In 2009, roughly 1.8 billion people or well over 25%
of the world population belonged to the global middle class as defined
by the OECD; this number will increase to 3.2 billion or more than
40% by 2020. This means that more and more people are able to
afford that extra bit of comfort here and there, for example when
ordering a new vehicle or a new kitchen. In this context, Stabilus
gas springs, dampers and electromechanical drives are the product
of choice whenever the aim is to increase comfort by significantly
improving ergonomics.
P OW E R I S E G R OW T H B E N E F I T S F R O M
“ D E M O C R AT I Z AT I O N ” O F C O M F O RT
Market penetration of comfort features usually takes place from
the top down: New features are first introduced in top-of-the-range
and luxury class models and then gradually offered in the lower
vehicle classes as they become better known and more popular.
With this step-by-step democratization of equipment features that
are initially reserved for the top vehicle categories, the number of
installed units increases accordingly over time.
S t a b i l u s p r o d u c t s i n c r e a s e t h e c o m f o r t
i n h a n d l i n g i t e m s .
W E M A K E E V E RY DAY M A N UA L TA S K S E A S I E R !
24
Three Megatrends as Growth Drivers
A N N U A L R E P O R T 2 0 1 5
T O O U R S H A R E H O L D E R S

Stabilus is achieving particularly high growth rates with the electro-
mechanical lid drive Powerise, which allows car tailgates to be
opened and closed by pressing a button or even by means of ges-
ture control. This way, your hands stay clean even if the car is very
dirty, and you can save yourself the effort needed to open or close
conventional tailgates. In the years following the market introduc-
tion of the Powerise systems, they were fitted predominantly in
luxury class vehicles, all-terrain vehicles and SUVs. Now, an increasing
number of vehicle manufacturers are offering their customers this
option in mid-range and even compact models as well. Sales of
Powerise systems are increasing accordingly: While Stabilus pro-
duced 1.2 million Powerise units in fiscal year 2013, in fiscal year
2015 it already produced approx. 3.2 million units. This currently
applies to the European market in particular, because mid-range
and compact vehicles traditionally account for an especially large
market share here.
E A S I E R O P E R AT I O N I S A C R O S S - S E C TO R
G R OW T H TO P I C
The trend toward easier operation is unbroken across sectors and
all over the world. Stabilus products are therefore also used out-
side of the automotive sector when it comes to increasing the ease
of use or ergonomics of products. For example, customers of the
Stabilus “Industrial” business use gas springs in the adjustment
mechanism of high-quality ironing tables or use them to help
adjust the height of hotel beds, which makes it easier for the ser-
vice personnel to attend to the beds. What is more, the advancing
electrification of many items enables Powerise applications to be
used outside of the automobile sector and thus opens up new pos-
sibilities for use. On the whole, these are excellent growth pros-
pects and Stabilus is working intensively on making use of them.
With the Powerise systems from Stabilus, the trunk will open and close by remote control within seconds. Integrated in the Powerise drives is a sensor system that reliably eliminates safety risks due to improper operation or use.
25
Three Megatrends as Growth Drivers
A N N U A L R E P O R T 2 0 1 5
T O O U R S H A R E H O L D E R S
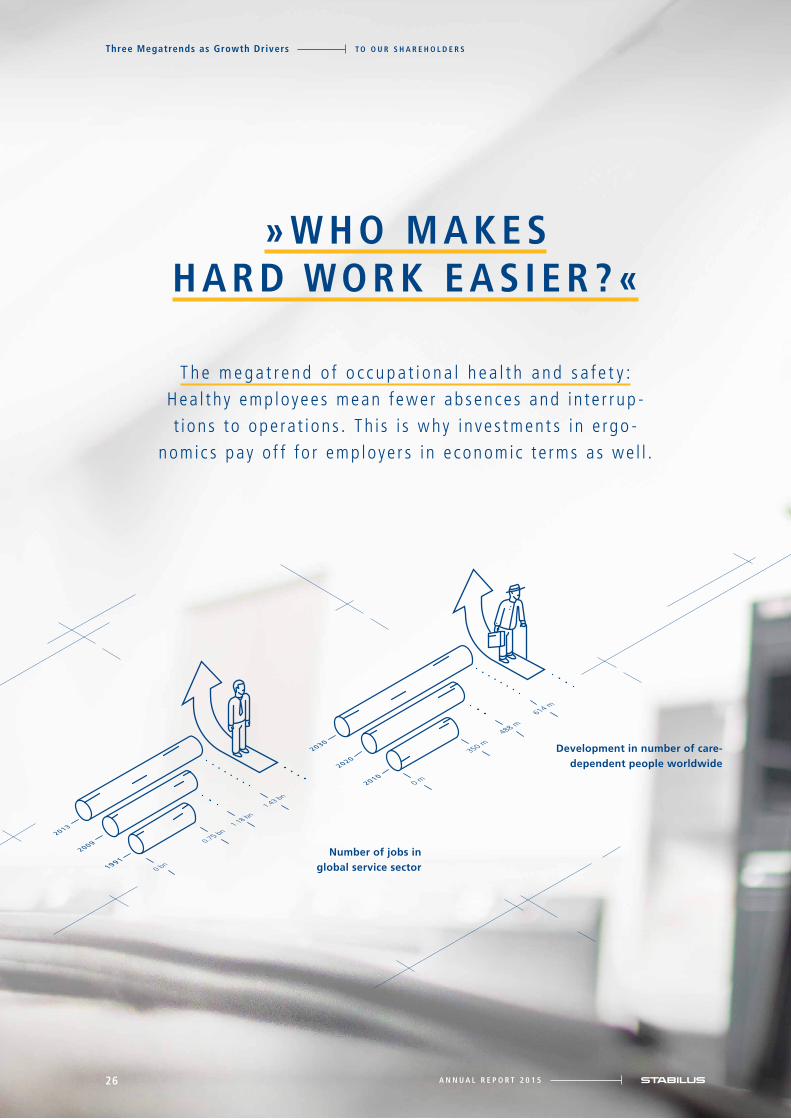
» W H O M A K E SH A R D WO R K E A S I E R ? «
T h e m e g a t r e n d o f o c c u p a t i o n a l h e a l t h a n d s a f e t y :Hea l t hy emp loyee s mean fewer ab sence s and in te r r up -t i ons to ope ra t ions . T h i s i s w hy inve s tment s i n e rgo -
nomic s pay o f f f o r emp loye r s i n e conomic te rms a s we l l .
Development in number of care- dependent people worldwide
Number of jobs in global service sector
A N N U A L R E P O R T 2 0 1 526
Three Megatrends as Growth Drivers T O O U R S H A R E H O L D E R S

A N N U A L R E P O R T 2 0 1 5 27
Three Megatrends as Growth DriversT O O U R S H A R E H O L D E R S

S t a b i l u s p r o d u c t s i m p r o v e e r g o n o m i c s a n d
t h e r e b y i n c r e a s e p e r f o r m a n c e .
When employees are absent from work, companies are left with
high costs. In highly competitive industries as well as small and
medium-sized companies, the absence of employees can lead to
serious interruptions to operations and have considerable economic
consequences. This is why today the prevention of industrial acci-
dents and health risks in the workplace is a top priority in most
countries around the globe.
Product solutions for improving working conditions, reducing
work-related health risks and optimizing the working equipment
for its respective task are a global growth market and occupy an
important position in the strategy of the “Industrial” business at
Stabilus. More than 2,500 customers from a wide range of indus-
tries are already convinced that investments in ergonomics pay off
economically and rely on the expertise of Stabilus when it comes to
designing and manufacturing their products all over the world.
S TA B I L U S P R O D U C T S P R OT E C T T H E W E L L - B E I N G
O F L O G I S T I C S A N D H OT E L E M P L OY E E S
Let us take the example of back protection: The industrial division
of labor, which often extends across continents, is changing the
working world. In industrial production, system suppliers or suppli-
ers of individual components are delivering more and more parts
“straight to the line,” where they are usually installed promptly. In
order to ensure that the components reach the next production sta-
tion undamaged and on time, large numbers of what are known as
load carriers are used throughout the world. For example, airbags or
headlamps are placed in these reusable containers so that they can
be transported safely to a car manufacturer’s production facility.
Inside the load carriers, there are folding intermediate layers where
the parts to be shipped are held in place. Whenever the parts are
removed from the load carriers, the stable and therefore rather heavy
intermediate layers must be folded up repeatedly. This is why Stabilus
gas springs are increasingly being installed in load carriers – they
enable the intermediate layers to be moved with ease. Up to 30
gas springs are installed in a single load carrier.
Every day, several million bed linens are changed in the hotel industry
all over the world. The room staff have to bend over to perform this
task, so back problems and absence of staff are bound to occur. With
the help of two Stabilus gas springs, the mattress can be raised to
chest height with a simple hand movement, allowing the sheet to be
changed without straining the back. This solution is being used
increasingly by hotel groups all over the world.
W E M A K E L OA D S M A N AG E A B L E !
28
Three Megatrends as Growth Drivers
A N N U A L R E P O R T 2 0 1 5
T O O U R S H A R E H O L D E R S

H E A LT H I E R BAC K S F O R P E O P L E WO R K I N G
I N A S I T T I N G P O S I T I O N
Many people whose profession requires them to sit all day com-
plain about back problems due to lack of movement and uncom-
fortable office chairs. Stabilus is a leading manufacturer of mainte-
nance-free gas springs for swivel chairs that allow the height of
the chair to be adjusted continuously and easily, and thus to be
better adapted to the height of the user. A further area in which
Stabilus products can be applied in the growth market of occupa-
tional health and safety is that of protecting the backs of truck and
construction vehicle drivers: Gas springs not only make it easier to
adjust the drivers’ seats, they also improve the spring characteris-
tics of the seats. In this way, they help to prevent the drivers’ backs
from being put under too much strain from long periods of sitting
and the many uneven and bumpy roads they drive on during a
working day. Stabilus now even offers adjustable dampers for
installation in drivers’ seats that enable the hardness to be varied
and thus allow the seat to be even better adapted to the driver’s
weight. In order to supply customers all over the world with a wide
range of gas springs and to benefit from the megatrend of occupa-
tional health and safety, Stabilus is continuously investing in the
expansion of its production capacities in Europe, the USA and Asia.
Stabilus offers specific gas springs for load carriers in order to ensure that products can be transported safely without taking any damage. During the trans-portation route the products are always held in place.
29
Three Megatrends as Growth Drivers
A N N U A L R E P O R T 2 0 1 5
T O O U R S H A R E H O L D E R S

MONDRIAN INVESTMENTPARTNERSLIMITED
OTHER INSTITUTIONAL AND PRIVATE INVESTORS
MANAGEMENT
5%
94%
1%
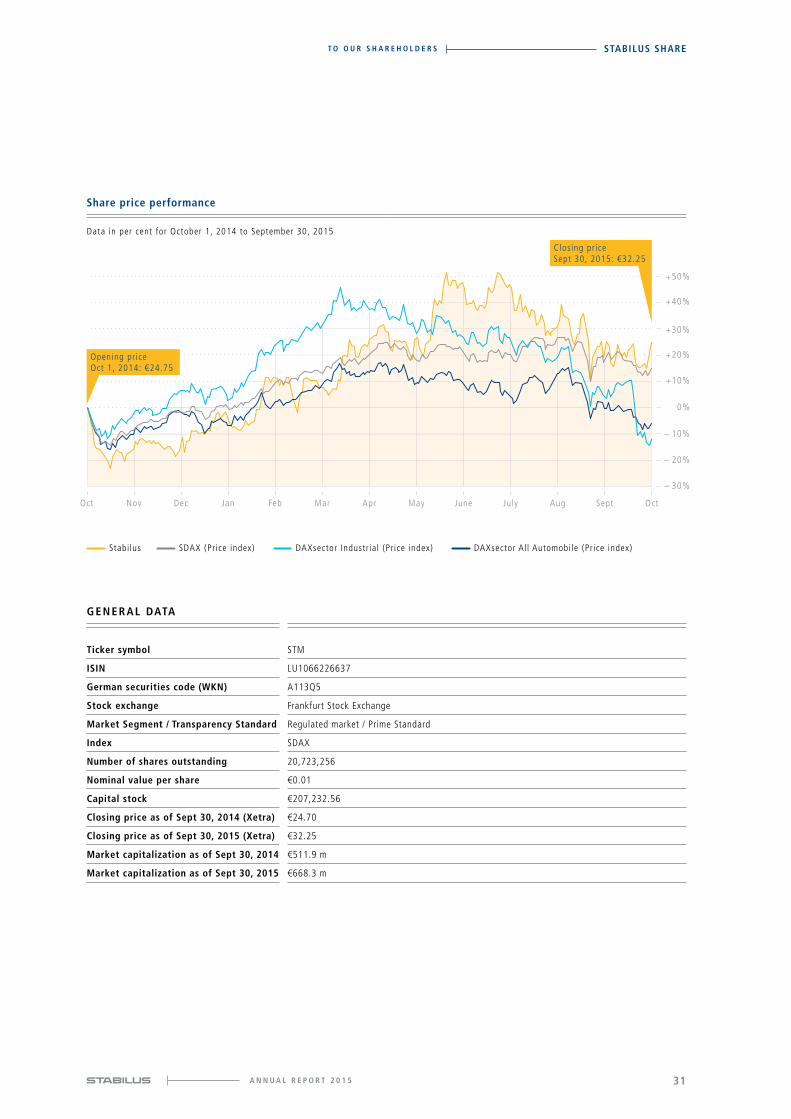
S TO C K M A R K E T S R E M A I N E D VO L AT I L E
I N F I S C A L Y E A R 2 0 1 5
The stock markets remained volatile in fiscal year 2015. On the one
hand they benefited among others from the continued availability
of liquidity from the major central banks and from low interest
rates which supported the new all-time high of the DAX which
climbed to 12,000 points in April 2015. On the other hand the slow-
down of China’s economic growth and the devaluation of the yuan
in mid- August 2015 led to significant turbulences in the Chinese
stock market which, together with other external shocks such as
the crisis in Ukraine, the war in Syria and the VW emission scandal,
considerably weakened the European stock markets as well. In this
environment the SDAX, the index on which Stabilus shares are
listed, performed considerably well and closed at 8,310 points on
September 30, 2015 (6,853 points on September 30, 2014) and
thus increased by 21% in the last twelve months.
T H E S TA B I L U S S H A R E
Stabilus S.A. has a share capital of €207,232.56 represented by
20,723,256 bearer shares with a nominal value of €0.01. The share
of Stabilus S.A. has been listed in the Prime Standard (regulated
market) of the Frankfurt Stock Exchange since May 23, 2014. In
September 2014 the Stabilus share gained further visibility with
its inclusion in the SDAX index.
S TA B I L U S S H A R E O U T P E R F O R M E D T H E M A R K E T
From October 1, 2014 to September 30, 2015, the Stabilus share
price increased by 30% from €24.75 to €32.25. Consequently and
as in the previous fiscal year, the Stabilus shares were able to sub-
stantially outperform its sector indices: SDAX, DAXsector All Auto-
mobile and DAXsector Industrial.
S H A R E H O L D E R S T RU C T U R E : F R E E F L OAT AT
A P P R OX I M AT E LY 9 9 %
On December 5, 2014 and on March 17, 2015 funds advised by
Triton successfully placed 4.4 million and 4.2 million shares of
Stabilus with institutional investors respectively. As a result of
these placements the free float increased to approximately 99%.
The remaining 1% of the Stabilus shares which are not included in
the free float are held by the members of the Management and
the Supervisory Board. According to the voting rights notifications
received until September 30, 2015, Mondrian Investment Partners
Limited holds 5.01% of the Stabilus shares.
A N N UA L G E N E R A L M E E T I N G
The ordinary Annual General Meeting 2015 of Stabilus S.A. was
held on February 18, 2015 at 10:00 a.m. at the Chambre de Com-
merce, 7, rue Alcide de Gasperi, L-2981 Luxembourg. Overall 61%
of the voting rights were represented at the meeting and all motions
presented were approved by the shareholders. All documents and
information regarding the Annual Shareholders’ Meeting can be found
on our investor relations website at www.ir.stabilus.com.
S TA B I L U S S H A R E
Stabilus share rose by 30% in f iscal year 2015 and outper formed peer indices
Free f loat of 99% af ter Tr i ton’s last placement in March 2015
Shareholder Structure
in % as of September 30, 2015
30
STABILUS SHARE T O O U R S H A R E H O L D E R S
A N N U A L R E P O R T 2 0 1 5
Stabi lus SDAX (Price index) DAXsector Industr ial (Pr ice index) DAXsector Al l Automobile (Pr ice index)
+50%
+30%
0%
+40%
+10%
+20%
– 10%
– 20%
– 30%
G E N E R A L DATA
Ticker symbol STM
ISIN LU1066226637
German securities code (WKN) A113Q5
Stock exchange Frankfurt Stock Exchange
Market Segment / Transparency Standard Regulated market / Prime Standard
Index SDAX
Number of shares outstanding 20,723,256
Nominal value per share €0.01
Capital stock €207,232.56
Closing price as of Sept 30, 2014 (Xetra) €24.70
Closing price as of Sept 30, 2015 (Xetra) €32.25
Market capitalization as of Sept 30, 2014 €511.9 m
Market capitalization as of Sept 30, 2015 €668.3 m
Opening price Oct 1, 2014: €24.75
Closing price Sept 30, 2015: €32.25
Share price performance
Data in per cent for October 1, 2014 to September 30, 2015
NovOct Dec Jan Feb Mar Apr May June July Aug Sept Oct
31
STABILUS SHARET O O U R S H A R E H O L D E R S
A N N U A L R E P O R T 2 0 1 5


B C O M B I N E D M A N AG E M E N T R E P O RT
B
MA
NA
GE
ME
NT
RE
PO
RT
N A M E
1 5 8 3 – 1 8 7 2 8 4 – 4 6 7 9 P R – 1 1 0NT
The BLOC-O-LIFT gas springs are so-called locking gas springs. They can have spring or rigid locking. The rigid locking version is available as orientation-specific or non-orientation specific. Depending on the application, BLOC-O-LIFT can be equipped with a patented, corrosion- free actuation tappet. Primarily application areas for BLOC-O-LIFT gas springs are furniture manufacture, medical technology, building technology, aviation and aeronautics, automotive design, and many industrial applications.
O I L
P I S TO N R O D
S E A L A N D G U I D E PAC K AG E
P R E S S U R E T U B E E N D F I T T I N G
N I T R O G E N
P I S TO N PAC K AG E
P I S TO N R O D E N D F I T T I N G
P R E S S U R E T U B E
BLOC-O-LIFT®

34 A N N U A L R E P O R T 2 0 1 5
C O M B I N E D M A N A G E M E N T R E P O R TContents
C O M B I N E D M A N AG E M E N T R E P O RTas of and for the fiscal year ended September 30, 2015
3 5 G E N E R A L
3 5 S T R A T E G Y
3 7 R E S E A R C H A N D D E V E L O P M E N T
3 8 B U S I N E S S A N D G E N E R A L E N V I R O N M E N T
3 9 R E S U LT S O F O P E R A T I O N S
4 3 D E V E L O P M E N T O F O P E R A T I N G S E G M E N T S
4 4 F I N A N C I A L P O S I T I O N
4 5 L I Q U I D I T Y
4 7 R E S U LT S O F O P E R A T I O N S A N D F I N A N C I A L
P O S I T I O N S O F S TA B I L U S S . A .
4 7 R I S K S A N D O P P O R T U N I T I E S
5 3 C O R P O R A T E G O V E R N A N C E
5 5 S U B S E Q U E N T E V E N T S
5 5 O U T L O O K

A N N U A L R E P O R T 2 0 1 5 35
C O M B I N E D M A N A G E M E N T R E P O R T G e n e ra l S t ra t e g y
G E N E R A L
Stabilus S.A., Luxembourg, hereafter also referred to as “Stabilus”
or the “Company” is a public limited liability company (société
anonyme) incorporated in Luxembourg and governed by Luxem-
bourg law. The registered office is 2 rue Albert Borschette, L-1246
Luxembourg, Grand Duchy of Luxembourg.
Stabilus S.A. is the parent company of the Stabilus Group.
Stabilus Group’s operating entities typically use the brand name
“Stabilus” in their registered name. The Group operates in three
regions with its subsidiaries. These regions are Europe (Luxem-
bourg, Germany, Romania, France, Italy, Spain, Switzerland and
United Kingdom), NAFTA (United States and Mexico) and Asia /
Pacific and Rest of World (RoW) (China, South Korea, Japan, Aus-
tralia, Brazil, New Zealand).
The Stabilus Group is a leading manufacturer of gas springs and
dampers as well as electromechanical tailgate opening systems.
The products are used in a wide range of applications in the auto-
motive and the industrial sector, including furniture applications.
Typically the products are used to aid the lifting and lowering or
dampening of movements. As world market leader for gas springs,
the Group ships to all key vehicle producers. Various Tier 1 suppli-
ers of the global vehicle industry diversify the Group’s customer
base. A broad spectrum of industrial customers diversify the Groups
customer base.
S T R AT E G Y
The Stabilus Group is the leading supplier of gas springs and
hydraulic dampers for the automotive and industrial sectors world-
wide. In addition, the Company has successfully expanded into the
production and sale of automatic opening and closing systems.
Stabilus’ strategic aim is to further extend its leadership positions
in these industries. The key focus areas of its strategy STAR are to:
(i) drive profitable and cash generating growth, (ii) benefit from
megatrends, such as increased standard of living, increasing com-
fort requirements and aging population, (iii) focus on innovative
gas spring solutions, especially in the industrial business through
new applications and selected add-on acquisitions and (iv) main-
tain and strengthen the Company’s cost and quality leadership.
D R I V E P R O F I TA B L E A N D C A S H G E N E R AT I N G
G R OW T H I N A L L R E G I O N A L S E G M E N T S A N D
AC R O S S E N D M A R K E T S
The Stabilus Management aims to continue to increase revenue,
profits and cash flows across all businesses by further focusing on
regions and sectors where the Stabilus Group currently has lower
market shares, entering new markets and by strengthening our
position with selected add-on acquisitions.
Automotive & Powerise: focus on rapidly growing
regions and increased comfort
Stabilus intends to continue to further expand its international
presence in rapidly growing markets, in particular in Asia, which
has become a significant growth driver for the automotive sector
and where the Company’s market share still lags behind the market
share in other regions. Management seeks to increase revenue
from South Korean and Japanese OEMs in the automotive business,
supported by new targeted investments in additional production
capacity in Asia. To take advantage of the rapidly growing Chinese
automotive manufacturing sector, the Company plans to increase
revenue from Chinese OEMs. To achieve this goal, management has
implemented a targeted sales strategy and is further strengthening
engineering capabilities in China, which has already secured orders
from several local Chinese OEMs.
Stabilus plans to further take advantage of the strong growth rates
of automatic opening and closing systems driven by comfort require-
ments across all regions. The strong consumer demand for SUVs,
crossovers and hatchback cars provides a reliable base for a business
growth. The Company is in the process of adding further capabilities
for Powerise production in all the markets Stabilus is active.
Industrial: increase regional coverage
While Stabilus has a large industrial market share in certain Euro-
pean countries in which the Company has a strong commercial
presence, the Group believes that there is still potential to increase
market share in other European countries, as well as in Asia and
North America, where the Company’s market coverage is compara-
tively less strong. Management has identified regions and countries
in which the Company is in the process of repeating the successful
strategies from markets where Stabilus has a high share, by

A N N U A L R E P O R T 2 0 1 536
C O M B I N E D M A N A G E M E N T R E P O R TS t ra t e g y
improving market coverage with the objective of strengthening the
local sales footprint. In addition, Stabilus intends to transfer our
production, application engineering and sales know-how from
Europe and NAFTA to the Asia / Pacific region, where the Group’s
footprint is comparatively less strong. The Company is increasing its
presence in China. Stabilus has extended its Chinese production
capabilities and set up local application engineering, sales and pro-
ject management teams. In China, the Company is in the process of
ramping up the first production line for Industrial products, which
will help gain additional local market shares. The Stabilus manage-
ment believes that a strong local presence in China will further
strengthen the Group’s position in the Asia / Pacific region.
Swivel Chair: supplying high quality products
As the only non-Asian producer of gas springs for high quality swivel
chairs, Stabilus is in an excellent position to gain further market
shares in Europe and NAFTA. Management has successfully turned
around the Swivel Chair business and today, the business is grow-
ing profitably again. Stabilus expects this positive trend to continue.
B E N E F I T F R O M M E G AT R E N D S, S U C H A S
I N C R E A S I N G C O M F O RT R E Q U I R E M E N T S A N D
AG I N G P O P U L AT I O N
Stabilus continues to adapt its product offerings towards mega-
trends, such as comfort requirements. The Powerise solution, for
example, enhances comfort through automatically opening and
closing car tailgates and trunk lids. In addition, the Company’s gas
springs offer more comfortable opening and closing solutions as
well as increased comfort in swivel chairs and industrial applica-
tions, such as airplane seats.
The global population of older persons is growing considerably
faster than the population as a whole. Stabilus focuses on capitaliz-
ing on this megatrend. It is inevitable that an aging consumer base
requests more automated systems in their vehicles and in other
aspects of their daily lives. The Group intends to benefit from this
megatrend as it has a leading position as a system provider in
automatic opening and closing systems that will continue to expe-
rience an increasing demand in applications for its solutions.
F O C U S O N I N N OVAT I V E C O M P O N E N T S A N D
S YS T E M S TO TA K E A DVA N TAG E O F G L O BA L
I N D U S T RY T R E N D S
The products of Stabilus are at the forefront of innovation in
motion control. The Company employs 256 people in R&D across its
three regional segments as of September 30, 2015. Stabilus is
focused on designing and manufacturing highly-engineered com-
ponents, modules and system solutions that address key global
trends in the automotive and industrial sectors. The Company aims
to adapt to these trends by continuously improving its existing
technology, in particular the requirement for ergonomic solutions
as well as automated opening and closing systems. Management
believes that actively addressing these key trends reinforces the
Company’s ability to maintain its market share and profitability.
In the industrial sector, the Company continues to develop products
for enhanced safety and comfort. For example, it has developed an
application based on the Bloc-O-Lift system for use in airplane seats.
In addition, the dampers manufactured by Stabilus are increasingly
used in solar modules for solar parks that automatically follow the
sunlight in their setup, thus being subject to sometimes severe
weather conditions such as strong winds – the dampers from Stabi-
lus help protect the modules from damage.
Management expects that recent and continued wins with key cli-
ents for Powerise solutions due to the superior technology features
of the Company’s products will be a key growth driver for Stabilus.
While Powerise systems were in the past being deployed only in
the luxury and SUV car segments, Powerise has recently success-
fully gained market shares with midsize vehicles such as the VW
Passat and Ford Mondeo. The Company is working on and investing
in improving and further developing its current spindle drive tech-
nology to further reduce noise, weight and cost. In addition, Stabi-
lus is exploring new industrial applications for its Powerise systems.

A N N U A L R E P O R T 2 0 1 5 37
C O M B I N E D M A N A G E M E N T R E P O R T R e s e a rc h a n d D e v e l o p m e n t
M A I N TA I N A N D S T R E N G T H E N C O S T A N D
Q UA L I T Y L E A D E R S H I P
Build on the Group’s global footprint and proximity to
customers
Based on Stabilus’ guiding strategy “in the region, for the region”,
it has established its facilities in close proximity to the Group’s cus-
tomers and has done so continuously over the past years e.g. in
China, South Korea, the US, Mexico and Romania. It is the Compa-
ny’s goal to continue to provide a comprehensive product and ser-
vice offering to current and new customers globally. The Group
seeks to fully globalize its product portfolio and to provide an even
broader range of components and systems to each customer.
Continue to optimize cost base
Stabilus continuously implements operational improvements relat-
ing to plant and overhead, which includes productivity improve-
R E S E A R C H A N D
D E V E L O P M E N T
Research and development is a key function for Stabilus to develop
products that anticipate customer needs and desires. Already
today, the products of Stabilus are used in a considerable number
of applications in a large variety of industries.
Stabilus research and development aim is to ensure a long-time
future viability and enhancing technological competitiveness. The
optimization of the research and development resource allocation
is a future goal.
ments, overhead reduction, consolidation of manufacturing sites
and the rollout/implementation of local sourcing, to improve the
Company’s operating cost.
For the coming years, management expects to continue on this path
with productivity improvements, a range of initiatives to profitability
backed by a high level of business which has already been locked in.
Due to the Company’s production know-how and long-standing
client relationships backed by Stabilus’ quality leadership, man-
agement is confident that it can protect the Group’s market shares
in gas springs in Europe and NAFTA and gain further market shares
for gas springs in the Asia / Pacific region, especially with local cus-
tomers. An increasing market share in Powerise supports the positive
outlook.
The global research and development department with an average
of 241 employees comprises several locations with its major loca-
tion in Koblenz (Germany). The Romanian and US entities have
been strengthened to provide R&D services to the Group as well as
local customers. Research and development activities are not per-
formed directly by Stabilus S.A.
Research and development T _ 001
2015 2014 2013 2012
R&D expenditures (incl. capitalized R&D) 37,693 33,190 31,387 26,785
% of revenue 6.2% 6.5% 6.8% 6.0%
Thereof capitalized 13,475 12,899 13,814 12,834
Employees (average) 241 224 209 163

A N N U A L R E P O R T 2 0 1 538
Business and general environment C O M B I N E D M A N A G E M E N T R E P O R T
BUSINESS AND GENERAL
E N V I R O N M E N T
Macroeconomic development
In its latest October 2015 World Economic Outlook, the Interna-
tional Monetary Fund (IMF) reduced the growth forecast for the
global economy from 3.3% to 3.1% for the current calendar year
2015. This reduced forecast reflects the slowdown in emerging
markets and a weaker recovery in advanced economies. While the
forecast for 2016 still expects a significant growth of global GDP
compared to 2015, the forecast for 2016 was reduced by 0.2 per-
centage points down to a growth of 3.6%.
The IMF sees risks in the high debt levels of many so called
“advanced” economies, the weakness of commodity prices and
the prospect of tighter global financial conditions. Structural
reforms in many countries continue to be needed to effectively
counter the risks.
Development of regional markets
The development of the regional markets in which the Company
operates shows a divergent development. As the growth rate of
the Eurozone is projected on a stable base of about 1.6%, the
projections for the NAFTA countries show a growth rate of 2.3%
to 2.8%. The growth rate for ASEAN region is projected to rise
from 4.6% in 2014 to 4.8% in 2016. The projected growth rate
for China is still on a high level but decreasing from 7.3% in
2013 to 6.3% in 2016.
Development of vehicle markets
An important driver for Group revenue in the automotive and
industrial market is the global production volume of light vehicles
which comprise passenger cars, SUVs, crossovers, station wagons,
vans and light commercial vehicles weighing less than six tons.
The global demand for vehicles developed positively in the last
twelve months. Following the global increase in demand for pas-
senger cars, SUVs, crossovers, station wagons, vans and light com-
mercial vehicles, the number of vehicles produced in calendar year
2015 is expected to increase to around 89 million units, up by
approximately 6% from the 82 million units in calendar year 2012.
About 80% of this increase relates to China, but also the develop-
ment of production volumes in NAFTA continues to be positive. The
number of light vehicles produced in Europe slightly improved.
The total worldwide production of light vehicles in 2015 is
expected to reach 89 million units. The total increase by approxi-
mately 2% compared to 2014 is driven by the positive develop-
ments in NAFTA (around +5%), Asia (around +2%) and Europe
(around +3%), while the production volumes in Rest of World are
expected to shrink by around (5)%.
Development of industrial markets
In our industrial business, the Company sells its products to customers
in a large number of industries, including, among others, agricultural
machines, railway, aircraft applications, commercial vehicles, marine
applications, furniture, health care and production equipment. These
sales depend on the industrial production level in general, therefore,
its performance in the industrial segment is influenced by the general
state and the performance of the global economy.

A N N U A L R E P O R T 2 0 1 5 39
Results of operat ionsC O M B I N E D M A N A G E M E N T R E P O R T
R E S U LT S O F O P E R AT I O N S
The table below sets out Stabilus Group’s consolidated income statement for the fiscal year
2015 in comparison to the fiscal year 2014:
Revenue
Group’s total revenue developed as follows:
Income statement T _ 002
Year ended Sept 30,
I N € M I L L I O N S 2015 2014 Change % change
Revenue 611.3 507.3 104.0 20.5%
Cost of sales (463.6) (387.7) (75.9) 19.6%
Gross profit 147.7 119.6 28.1 23.5%
Research and development expenses (24.2) (20.3) (3.9) 19.2%
Selling expenses (44.1) (38.7) (5.4) 14.0%
Administrative expenses (27.3) (32.6) 5.3 (16.3)%
Other income 11.2 6.0 5.2 86.7%
Other expenses (7.6) (2.9) (4.7) >100.0%
Profit from operating activities (EBIT) 55.7 31.2 24.5 78.5%
Finance income 17.9 17.5 0.4 2.3%
Finance costs (42.4) (38.8) (3.6) 9.3%
Profit / (loss) before income tax 31.1 9.9 21.2 >100.0%
Income tax income/ (expense) (14.1) 0.1 (14.2) <(100.0)%
Profit / (loss) for the period 17.0 10.0 7.0 70.0%
Revenue by region (location of Stabilus company) T _ 003
Year ended Sept 30,
I N € M I L L I O N S 2015 2014 Change % change
Europe 308.5 267.3 41.2 15.4%
NAFTA 229.3 176.8 52.5 29.7%
Asia / Pacific and RoW 73.5 63.2 10.3 16.3%
Revenue 611.3 507.3 104.0 20.5%

A N N U A L R E P O R T 2 0 1 540
Results of operat ions C O M B I N E D M A N A G E M E N T R E P O R T
Total revenue in the fiscal 2015 increased by 20.5% compared to
the previous fiscal year supported a stronger US Dollar (+€33.0 mil-
lion). All Stabilus regions have shown an increase in revenue. At
29.7% NAFTA was up the most, compared with Europe at 15.4% and
Asia / Pacific and RoW at 16.3%. The increase is mainly due to our
growing Powerise business. Its revenue increased from €85.8 mil-
lion in the fiscal year 2014 to €139.8 million in the fiscal year 2015
by 62.9% or €54.0 million. The ongoing increase in the Powerise
business is the result of new OEM platform wins, supported by the
launch of various Powerise variants and by increased take rates. The
increase in the Automotive Gas Spring by 15.5% or €39.4 million
is mainly driven by the improved economic environment and recov-
ering vehicle sales in NAFTA and Europe. Sales in the Industrial
business increased by 4.9% from €142.3 million in the fiscal year
ended September 30, 2014 to €149.3 million in the fiscal year
ended September 30, 2015. Our revenue in the Swivel Chair busi-
ness increased year-on-year by 14.5% to €27.7 million after a
slight decrease in the prior year.
Cost of sales and overhead expenses
C O S T O F S A L E S
Cost of sales in the fiscal year 2015 increased by 19.6%, compared
to the previous fiscal year, and thus increased lower than the
increase in revenue. The cost of sales as a percentage of revenue
decreased to 75.8% compared to 76.4% in the prior year.
R & D E X P E N S E S
R&D expenses (net of R&D capitalization) in the fiscal year 2015
increased by 19.2% compared to the prior fiscal year 2014. As a
percentage of revenue, R&D expenses remained at 4.0% in fiscal
year 2015 compared to 4.0% in fiscal year 2014. The Group
invests in the development of new applications and products and
in the continuous optimization and improvement of existing prod-
ucts and product lines. The focus in the fiscal year 2015 were the
R&D projects for the Powerise products.
S E L L I N G E X P E N S E S
Selling expenses increased to €(44.1) million in the fiscal year
ended September 30, 2015 from €(38.7) million in the fiscal year
ended September 30, 2014. As a percent of revenue, these
expenses decreased from 7.6% to 7.2%.
A D M I N I S T R AT I V E E X P E N S E S
Administrative expenses decreased significantly from €(32.6) mil-
lion in fiscal year 2014 to €(27.3) million in fiscal year 2015. As a
percentage of revenue, administrative expenses decreased as well,
from 6.4% to 4.5%. The decrease is mainly due to the expenses in
regards to the 2014 IPO. The expenses returned to historical aver-
age levels.
OT H E R I N C O M E A N D E X P E N S E
Other income increased from €6.0 million in fiscal year 2014 by
€5.2 million to €11.2 million in fiscal year 2015. This increase is
primarily the result of exchange rate-related valuation at the bal-
ance sheet day.
Other expense increased from €(2.9) million in fiscal year 2014 to
€(7.6) million in fiscal year 2015 mainly as the result of exchange
rate related valuation at the balance sheet day.
Revenue by markets T _ 004
Year ended Sept 30,
I N € M I L L I O N S 2015 2014 Change % change
Automotive 434.2 340.8 93.4 27.4%
Gas Spring 294.4 255.0 39.4 15.5%
Powerise 139.8 85.8 54.0 62.9%
Industrial 149.3 142.3 7.0 4.9%
Swivel Chair 27.7 24.2 3.5 14.5%
Revenue 611.3 507.3 104.0 20.5%

A N N U A L R E P O R T 2 0 1 5 41
Results of operat ionsC O M B I N E D M A N A G E M E N T R E P O R T
F I N A N C E I N C O M E A N D C O S T S
Finance income increased slightly from €17.5 million in fiscal year
2014 to €17.9 million in fiscal year 2015 primarily due to the
increased net foreign exchange gains on financial assets and liabil-
ities compensating the effect of the gains in the fair value in deriv-
ative instruments and carrying amount of financial assets in the
prior year.
Finance costs increased from €(38.8) million to €(42.4) million in
fiscal year 2015. The increase was essentially caused by a loss from
changes in the carrying amount of derivative instruments by €15.4 mil-
lion that incurred in course of the early redemption of Stabilus’ senior
secured notes in June 2015 in comparison to a loss from changes in
the carrying amount of EUSIs (equity upside sharing instruments)
by € 6.7 million in the prior year. The interest expense decreased by
€ 5.1 million resulting from the new re-financing in the fiscal year
2015 as well as lower debt levels than in fiscal year 2014.
I N C O M E TA X E X P E N S E
After income tax income of €0.1 million in the previous fiscal year,
the Group recorded a tax expense of €(14.1) million in the fiscal
year 2015. This was mainly driven by the generation of taxable profits
in most of the jurisdictions in which the Group operates. Certain
expenses in fiscal year 2015 are deemed to be not tax deductable.
In the prior fiscal year 2014 the tax expenses were compensated by
the deferred tax income driven by the usage of the interest carry-
forwards in the German tax group. See notes to Consolidated
Financial Statements below, note 10, for further details.
E B I T DA A N D A D J U S T E D E B I T DA
The table below sets out a reconciliation of EBIT to EBITDA and
adjusted EBITDA for the fiscal years 2015 and 2014:
Adjusted EBITDA represents EBITDA, as adjusted by management
primarily in relation to severance, consulting, restructuring and other
non-recurring costs (e.g. IPO), expenses for one-time legal disputes
as well as interest on pension changes. Adjusted EBITDA is pre-
sented because we believe it is a relevant measure for assessing
performance as it is adjusted for certain one-time or non- recurring
items that are not expected to impact our Group going forward,
and thus aids in an understanding of EBITDA in a given period.
Reconciliation of EBIT to adjusted EBITDA T _ 005
Year ended Sept 30,
I N € M I L L I O N S 2015 2014 Change % change
Profit from operating activities (EBIT) 55.7 31.2 24.5 78.5%
Depreciation 22.6 20.2 2.4 11.9%
Amortization 21.2 19.9 1.3 6.5%
EBITDA 99.5 71.3 28.2 39.6%
Advisory* 1.4 17.6 (16.2) (92.0)%
Restructuring / ramp-up 5.3 2.1 3.2 >100.0%
Pension interest add back 1.1 1.5 (0.4) (26.7)%
Total adjustments 7.8 21.2 (13.4) (63.2)%
Adjusted EBITDA 107.3 92.5 14.8 16.0%
* IPO, legal, bond issuance, tax audit and reorganization related advisory expenses.

A N N U A L R E P O R T 2 0 1 542
Results of operat ions C O M B I N E D M A N A G E M E N T R E P O R T
E B I T A N D A D J U S T E D E B I T
The table below shows reconciliations of profit from operating
activities (EBIT) to adjusted EBIT for the fiscal years 2015 and 2014:
Adjusted EBIT represents EBIT, as adjusted by management primarily
in relation to severance, consulting, restructuring and other non-
recurring costs, expenses for one-time legal disputes, IPO- related
expenses, launch costs for new products as well as interest on
pension changes and the depreciation and amortization of adjust-
ments of Group’s assets to fair value resulting from the April 2010
purchase price allocation.
Reconciliation of EBIT to adjusted EBIT T _ 006
Year ended Sept 30,
I N € M I L L I O N S 2015 2014 Change % change
Profit from operating activities (EBIT) 55.7 31.2 24.5 78.5%
Advisory* 1.4 17.6 (16.2) (92.0%)
Restructuring / ramp-up 5.3 2.1 3.2 >100.0%
Pension interest add back 1.1 1.5 (0.4) (26.7%)
PPA adjustments - depreciation and amortization 12.7 12.7 – 0.0%
Total adjustments 20.5 33.9 (13.4) (39.5%)
Adjusted EBIT 76.2 65.1 11.1 17.1%
* IPO, legal, bond issuance, tax audit and reorganization related advisory expenses.

A N N U A L R E P O R T 2 0 1 5 43
Development of operat ing segmentsC O M B I N E D M A N A G E M E N T R E P O R T
D E V E L O P M E N T O F
O P E R AT I N G S E G M E N T S
Stabilus Group is organized and managed primarily on a regional
level. The three reportable operating segments of the Group are
Europe, NAFTA, Asia / Pacific and RoW.
The table below sets out the development of our operating seg-
ments for the fiscal years 2015 and 2014.
Operating segments T _ 007
Year ended Sept 30,
I N € M I L L I O N S 2015 2014 Change % change
Europe
External revenue1) 308.5 267.3 41.2 15.4%
Intersegment revenue1) 28.3 23.5 4.8 20.4%
Total revenue1) 336.8 290.8 46.0 15.8%
Adjusted EBITDA 62.5 57.5 5.0 8.7%
as % of total revenue 18.6% 19.8%
Adjusted EBIT 41.1 38.0 3.1 8.2%
as % of total revenue 12.2% 13.1%
as % of external revenue 13.3% 14.2%
NAFTA
External revenue1) 229.3 176.8 52.5 29.7%
Intersegment revenue1) 4.6 2.5 2.1 84.0%
Total revenue1) 233.9 179.3 54.6 30.5%
Adjusted EBITDA 31.6 22.8 8.8 38.6%
as % of total revenue 13.5% 12.7%
Adjusted EBIT 25.1 16.6 8.5 51.2%
as % of total revenue 10.7% 9.3%
as % of external revenue 10.9% 9.4%
Asia/ Pacific and RoW
External revenue1) 73.5 63.2 10.3 16.3%
Intersegment revenue1) 0.4 0.1 0.3 >100.0%
Total revenue1) 73.9 63.3 10.6 16.7%
Adjusted EBITDA 13.2 12.2 1.0 8.2%
as % of total revenue 17.9% 19.3%
Adjusted EBIT 10.0 10.2 (0.2) (2.0)%
as % of total revenue 13.5% 16.1%
as % of external revenue 13.6% 16.1%
1) Revenue breakdown by location of Stabilus company (i. e. “billed-from view”).

A N N U A L R E P O R T 2 0 1 544
Financial posit ion C O M B I N E D M A N A G E M E N T R E P O R T
The external revenue generated by our European companies (in
terms of revenue the strongest region of the Group) increased by
15.4% from €267.3 million in the fiscal year 2014 to €308.5 mil-
lion in the fiscal year 2015. Adjusted EBITDA of this operating seg-
ment increased in this period by 8.7% to €62.5 million with an
adjusted EBITDA margin of 18.6%. Adjusted EBIT of the segment
Europe increased by 8.2% or €3.1 million from €38.0 million as of
September 30, 2014 to €41.1 million as of September 30, 2015.
The external revenue of our companies located in the NAFTA
region, our most dynamically growing region, increased by 29.7%
from €176.8 million in the fiscal year 2014 to €229.3 million in the
fiscal year 2015 primarily due to the strong growth in Powerise
business and a strong US Dollar. NAFTA’s adjusted EBITDA margin
increased from 12.7% in the fiscal year 2014 to 13.5% in the fis-
cal year 2015. Adjusted EBIT of the segment NAFTA increased by
51.2% or €8.5 million from €16.6 million as of September 30,
2014 to €25.1 million as of September 30, 2015.
In the fiscal year 2015, the external revenue of our companies in the
Asia / Pacific and RoW segment increased by €10.3 million or 16.3%
to €73.5 million compared to the corresponding fiscal year 2014.
This segment’s result, measured as adjusted EBITDA, increased by
€1.0 million to €13.2 million. Within this segment China remains
strong, while Brazil recorded lower revenue and margin than in fiscal
year 2014. In China we are clearly benefiting from the trend towards
more SUVs, a body style that offers many gas spring application
opportunities. Adjusted EBIT of the segment Asia / Pacific and RoW
slightly decreased by €0.2 million from €10.2 million as of Septem-
ber 30, 2014 to €10.0 million as of September 30, 2015.
F I N A N C I A L P O S I T I O N
TOTA L A S S E T S
The Group’s balance sheet total increased from €520.3 million as
of September 30, 2014 by 4.2% to €542.2 million as of September
30, 2015 mainly due to higher current assets (+€14.4 million) and –
on the equity and liabilities side of the balance sheet – due to
higher current liabilities (+€25.7 million).
N O N - C U R R E N T A S S E T S
Our non-current assets increased by €7.6 million or 2.2% mainly due
to higher assets under construction which result from the capacity
expansion of our Chinese plant, the powder paint equipment at our
Korean production facility, gas spring capacity expansion projects at
the German and US facilities, a finance lease production facility in
Romania as well as from expansion of Powerise production.
Balance sheet T _ 008
I N € M I L L I O N S Sept 30, 2015 Sept 30, 2014 Change % change
Assets
Total non-current assets 358.7 351.1 7.6 2.2%
Total current assets 183.6 169.2 14.4 8.5%
Total assets 542.2 520.3 21.9 4.2%
Equity and liabilities
Total equity 76.7 76.1 0.6 0.8%
Non-current liabilities 349.4 353.7 (4.3) (1.2)%
Current liabilities 116.2 90.5 25.7 28.4%
Total liabilities 465.5 444.2 21.3 4.8%
Total equity and liabilities 542.2 520.3 21.9 4.2%

A N N U A L R E P O R T 2 0 1 5 45
L iquidityC O M B I N E D M A N A G E M E N T R E P O R T
C U R R E N T A S S E T S
Current assets increased by 8.5% or €14.4 million. This is essen-
tially the consequence of a higher cash balance and higher trade
accounts receivable, compared to September 30, 2014.
E Q U I T Y
The Group’s equity as of September 30, 2015 increased, as com-
pared to September 30, 2014, from €76.1 million to €76.7 million.
The profit generated in the fiscal year 2015 amounts to 17.0 mil-
lion and other comprehensive income amounts to €(16.4) million.
Other comprehensive income comprises unrealized actuarial gains
of € 0.1 million on our German pension plan and losses from foreign
currency translations of €(16.4) million. The equity ratio slightly
decreased from 14.6% as of September 30, 2014 to 14.1% as of
September 30, 2015.
N O N - C U R R E N T L I A B I L I T I E S
Non-current liabilities decreased slightly from €353.7 million as
of September 30, 2015 by €(4.3) million to €349.4 million as of
September 30, 2015. The senior secured notes with the remaining
principal amount of €256.1 million (and an interest rate of 7.75%
p.a.) were replaced with a new €270.0 million facility A commit-
ment (with an interest rate of currently 2% over Euribor p.a.) in
June 2015. A redemption of €2.5 million was made as of Septem-
ber 30, 2015.
C U R R E N T L I A B I L I T I E S
Current liabilities increased by €25.7 million from €90.5 million as
of September 30, 2014 to €116.2 million as of September 30,
2015. The increase of the trade account payables and current pro-
visions was partly offset by a decrease in current tax liabilities.
L I Q U I D I T Y
Our primary sources of liquidity are cash flows from operating
activities. Going forward we expect that our capital expenditure
and debt service will be covered by operating cash flow in the next
twelve months.
C A S H F L OW F R O M O P E R AT I N G AC T I V I T I E S
Cash flow from operating activities decreased by €(1.8) million
from €87.8 million in fiscal year 2014 to €86.0 million in fiscal
year 2015 mainly due to higher working capital, inspite of
launching a €6.7 million factoring program in Romania.
Cash flows T _ 009
Year ended Sept 30,
I N € M I L L I O N S 2015 2014 Change % change
Cash flows from operating activities 86.0 87.8 (1.8) (2.1%)
Cash flows from investing activities (51.2) (35.6) (15.6) 43.8%
Cash flows from financing activities (incl. interest) (28.4) (41.2) 12.8 (31.1)%
Net increase / (decrease) in cash 6.4 11.0 (4.6) (41.8)%
Effect of movements in exchange rates on cash held (0.4) 0.7 (1.1) <(100.0)%
Cash as of beginning of the period 33.5 21.8 11.7 53.7%
Cash as of end of the period 39.5 33.5 6.0 17.9%

A N N U A L R E P O R T 2 0 1 546
Liquidity C O M B I N E D M A N A G E M E N T R E P O R T
C A S H F L OW F R O M I N V E S T I N G AC T I V I T I E S
Cash outflow from investing activities increased by €(15.6) million
from €(35.6) million in fiscal year 2014 to €(51.2) million in fiscal year
2015, mainly due to the investments in the Powerise production and
the Chinese expansion.
C A S H F L OW F R O M F I N A N C I N G AC T I V I T I E S
Cash flow from financing activities amounted to €(28.4) million in
fiscal year 2015 and to €(41.2) million in fiscal year 2014. This
is mainly driven by the Group’s refinancing in June 2015, i.e. pay-
ments for redemption of senior secured notes (€(256.1) million)
and receipts under the new facility A commitment (€270 million).
The cash flow from financing activities also comprises payments for
finance interest of €(32.2) million (PY: €(30.1) million). The interest
in fiscal year 2015 includes a €(9.9) million early redemption pay-
ment to the holder of the senior secured notes.
F R E E C A S H F L OW ( F C F )
Free cash flow (FCF) decreased from €22.1 million in fiscal year
2014 to €2.6 million. The following table sets out the composition
of the non-IFRS figure free cash flow.
Free cash flow (FCF) comprises IFRS cash flow statement items
“cash flow from operating activities”, “cash flow from investing
activities” and “payments for interest” (net interest payments).
Free cash flow T _ 010
Year ended Sept 30,
I N € M I L L I O N S 2015 2014 Change % change
Cash flow from operating activities 86.0 87.8 (1.8) (2.1%)
Cash flow from investing activities (51.2) (35.6) (15.6) 43.8%
Payments for interest (32.2) (30.1) (2.1) 7.0%
Free cash flow 2.6 22.1 (19.5) (88.2%)

A N N U A L R E P O R T 2 0 1 5 47
Statutory results of operat ions and f inancial posit ions of STABILUS S.A.
Risks and Opportunit ies
C O M B I N E D M A N A G E M E N T R E P O R T
S TAT U TO RY R E S U LT S
O F O P E R AT I O N S A N D
F I N A N C I A L P O S I T I O N S
O F S TA B I L U S S. A .
Income
The Company’s income results from services to Stabilus Group entities.
Charges
The charges in the fiscal year 2015 are mainly driven by expenses
with regard to the 2015 refinancing. The refinancing expenses
amount to €5.8 million.
Equity
The Company holds a strong position with its 96.3% equity ratio.
Assets
The fixed assets mainly consist of the shares in affiliated undertakings.
Current assets are driven by amounts owed by affiliated undertak-
ings triggered by the service level agreements.
Liabilities
Current liabilities increased by €1.5 million, mainly driven by the
amounts owed to affiliated companies.
R I S K S A N D
O P P O RT U N I T I E S
Risk management and control over financial reporting in the Stabilus Group
The Company considers Risk Management (RM) to be a key part of
effective management and internal control. The Company strives
for effective RM and financial navigation to safeguard the assets of
the Company and to proactively support the Company’s strategic
and compliance initiatives. The goal of RM is to help the Company
to operate more effectively in a dynamic environment by providing
a framework for a systematic approach to risks management and
exploring opportunities with an acceptable level of risk. The Super-
visory Board and the Management Board regularly discuss the oper-
ational and financial results as well as the related risks.
Risk Management covers financial, strategic, compliance as well
operational aspects. Operational risk is the risk of direct or indirect
loss arising from a wide variety of causes associated with the
Group’s processes, personnel, technology and infrastructure, and
from external factors other than credit, market and liquidity risks
such as those arising from legal and regulatory requirements and
generally accepted standards of corporate behavior. These opera-
tional risks arise from all of the Group’s operations. The Group’s
objective is to manage operational risk in a way to balance the
avoidance of financial losses and damage to the Group’s reputa-
tion with overall cost effectiveness, as well as avoiding control pro-
cedures that restrict initiative and creativity. The Company’s policy
on managing financial risks seeks to ensure effective liquidity and
cash flow management and protection of group equity capital
against financial risks. As part of its evolution, the Company imple-
ments continuous improvements in its risk management and inter-
nal control system.

A N N U A L R E P O R T 2 0 1 548
Risks and opportunit ies C O M B I N E D M A N A G E M E N T R E P O R T
Our accounting control system is designed to ensure all business
transactions are correctly and promptly accounted for and that reli-
able data on the Company’s financial situation is available. It
ensures compliance with legal stipulations, accounting standards
and accounting rules. A Group-wide calendar of deadlines helps
ensure the complete and timely processing of financial statements.
By separating financial functions and through ongoing review, we
ensure that potential errors are identified on a timely basis and
accounting standards are complied with.
Our internal control system is an integral component of the risk
management. The purpose of our internal control system for
accounting and reporting is to ensure its compliance with legal
stipulations, with the principles of proper accounting, with the
rules on the International Financial Reporting Standards as
adopted by the EU and with Group standards. In addition, we per-
form assessments to help identify and minimize any risk with a
direct influence on our financial reporting. We monitor changes in
accounting standards and enlist the advice of external experts to
reduce the risk of accounting misstatements in complex issues.
The Company and individual entity financial statements are subject
to external audits which act as an independent check and monitor-
ing mechanism of the accounting system and its output. The princi-
pal risks that could have a material impact on the Group are set
out in the Note 32 of the consolidated financial statements and are
summarized below:
Risks and opportunities related to the markets in which we operate
We are exposed to risks and opportunities associated with the per-
formance of the global economy and the performance of the econ-
omy in the jurisdictions in which we operate.
Due to our global presence, we are exposed to substantial risks
and opportunities associated with the performance of the global
economy. In general, demand for our products is dependent on the
demand for automotive products as well as for commercial vehi-
cles, agricultural machinery, medical equipment, aerospace, marine
and furniture components, which in turn is directly related to the
strength of the global economy. Therefore, our financial perfor-
mance has been influenced, and will continue to be influenced, to
a significant extent, by the general state and the performance of
the global economy.
Although the global economy has recovered a lot from the severe
downturn in 2008 and 2009, the recent volatility of the financial
markets and also the slower than expected economic growth in
Asia show that there can be no assurance that any recovery is sus-
tainable or that there will be no recurrence of the global financial
and economic crisis or similar adverse market conditions.
Stabilus manages these opportunities and risks by operating in dif-
ferent regions and markets for local and global customers.
W E O P E R AT E I N C Y C L I C A L I N D U S T R I E S
Our business is characterized by high fixed costs. Should our facili-
ties be underutilized, this could result in idle capacity costs, write-
offs of inventories and losses on products due to falling average
sale prices. Furthermore, falling production volumes cause declines
in revenue and earnings. On the other hand, our facilities might
have insufficient capacity to meet customer demand if the markets
in which we are active grow faster than we have anticipated.
Our automotive business, from which we generated 71% of our
revenue in the fiscal year ended September 30, 2015, sells its prod-
ucts primarily to automotive original equipment manufacturers
(“OEMs”) in the automotive industry. These sales are cyclical and
depend, among other things, on general economic conditions as
well as on consumer spending and preferences, which can be
affected by a number of factors, including employment, consumer
confidence and income, energy costs, interest rate levels and the
availability of consumer financing. Given the variety of such eco-
nomic parameters influencing the global automotive demand, the
volume of automotive production has historically been, and will
continue to be, characterized by a high level of fluctuation, making
it difficult for us to accurately predict demand levels for our prod-
ucts aimed at automotive OEMs.
We generated, in the aggregate, 29% of our revenue in the fiscal
year ended September 30, 2015 from sales to our industrial and
swivel chair customers. We sell our products to customers in
diverse industries, including, among others, agricultural machines,
railway, aircraft applications, commercial vehicles, marine applica-
tions, furniture, health care and production equipment. These sales
depend on the industrial production level in general as well as on

A N N U A L R E P O R T 2 0 1 5 49
Risks and opportunit ies C O M B I N E D M A N A G E M E N T R E P O R T
the development of new products and technologies by our custom-
ers, which include our products as component parts. Stabilus man-
ages these opportunities and risks by operating in different regions
and markets for the local and global customers.
The business environment in which we operate is characterized by
intense competition, which affects some of our products and mar-
kets, which could reduce our revenue or put continued pressure on
our sales prices.
The markets in which we operate are competitive and have been
characterized by changes in market penetration, increased price
competition, the development and introduction of new products,
product designs and technologies by significant existing and new
competitors. The majority of gas springs and electromechanical lift-
ing and closing systems manufactured globally are used for either
automotive, industrial or swivel chair applications, which are core
markets for us. Our competitors are typically regional companies
and our competition with them is generally on a regional scale. We
compete primarily on the basis of price, quality, timeliness of deliv-
ery and design as well as the ability to provide engineering support
and service on a global basis. Should we fail to secure the quality
of our products and the reliability of our supply in the future, then
more and more of our customers could decide to procure products
from our competitors.
Our efforts to expand in certain markets are subject to a variety of
business, economic, legal and political risks.
We manufacture our products in several countries and we market
and sell our products worldwide. We are actively operating and
expanding our operations in various markets, with a focus on the
rapidly growing and emerging markets in the Asia / Pacific region,
where we have production plants in China and South Korea, oper-
ate a wide network of representative sales offices and employ our
own sales force and distribution network. We plan to expand our
Asian production capacities to meet growth expectations and sup-
plement demand with our other regional productions as needed.
Potential social, political, legal, and economic instability may pose
significant risks to our ability to conduct our business and expand
our activities in certain markets. Inherent in our international oper-
ations is the risk that any number of the following circumstances
could affect our operations: underdeveloped infrastructure; lack of
qualified management or adequately trained personnel; currency
exchange controls, exchange rate fluctuations and devaluations;
changes in local economic conditions; governmental restrictions on
foreign investment, transfer or repatriation of funds; protectionist
trade measures, such as anti-dumping measures, duties, tariffs or
embargoes; prohibitions or restrictions on acquisitions or joint ven-
tures; changes in laws or regulations and unpredictable or unlawful
government actions; the difficulty of enforcing agreements and col-
lecting receivables through foreign legal systems; variations in pro-
tection of intellectual property and other legal rights; potential
nationalization of enterprises or other expropriations; and political
or social unrest or acts of sabotage or terrorism. As personnel costs
have a significant effect on our business, we are also exposed to
the risks of labor cost inflation and limited employment contract
flexibility in the countries in which our production facilities are
located and where we have sales personnel. Any of these risks
could have a material adverse effect on our business, financial con-
dition and results of operations.
W E A R E E X P O S E D TO O P P O RT U N I T I E S A N D R I S K S
A S S O C I AT E D W I T H M A R K E T T R E N D S A N D D E V E L -
O P M E N T S
There can be no assurance that (i) we will be successful in develop-
ing new products or systems or in bringing them to market in a
timely manner, or at all; (ii) products or technologies developed by
others will not render our offerings obsolete or non-competitive;
(iii) our customers will not substitute our products with competing
products or alternate technologies (such as third arm systems,
hydraulic drives or hinge/direct drives); (iv) the market will accept
our innovations; (v) our competitors will not be able to produce our
non-patented products at lower costs than we can; and (vi) we will
be able to fully adjust our cost structure in the event of contraction
of demand.
The Company develops appropriate strategies as a response to
these or similar market trends and to enhance existing products,
develop new products or keep pace with developing technology, to
counter loss of growth opportunities, pressure margins or the loss
of existing customers. We devote resources to the pursuit of new
technologies and products. In addition, technological advances and
wider market acceptance of our Powerise automatic lid drive sys-
tems (or the development and wider market acceptance of similar
automatic lid drive systems by our competitors) could result in can-
nibalization of our gas spring applications.

A N N U A L R E P O R T 2 0 1 550
Risks and opportunit ies C O M B I N E D M A N A G E M E N T R E P O R T
Risks and opportunities related to our business
We are exposed to fluctuations in prices of prefabricated materials
and components.
We procure large quantities of prefabricated materials and compo-
nents from third-party suppliers. The prices of prefabricated materi-
als, components and manufacturing services we purchase from our
suppliers depend on a number of factors, including to a limited
extent the development of prices of raw materials used in these
products, such as steel, copper, rubber and water, as well as energy,
which have been volatile in the past.
So far, this has not resulted in a general increase in the cost of pre-
fabricated materials and components we procure for the manufac-
ture of our products. However, it cannot be excluded that this vola-
tility may result in a cost increase in the future. If we are not able
to compensate for or pass on our cost increases to customers, such
price increases could have a material adverse impact on our finan-
cial results. Even to the extent that we are successful in compen-
sating for or passing on our increased costs to our customers by
increasing prices on new products, the positive effects of such price
increases may not occur in the periods in which the additional
expenses have been incurred, but in later periods. If costs of raw
materials and energy rise, and if we are not able to undertake cost
saving measures elsewhere in our operations or increase to an ade-
quate level the selling prices of our products, we will not be able to
compensate such cost increases, which could have a material
adverse effect on our business, financial condition and results of
operations. The long-term increase of our costs (and resultant
increase in the price of our products) may also negatively impact
demand for our products.
Our future business success depends on our ability to maintain the
high quality of our products and processes.
For customers, one of the determining factors in purchasing our
components and systems is the high quality of our products and
manufacturing processes. A decrease in the actual and perceived
quality of these products and processes could damage our image
and reputation as well as those of our products. Any errors or
delays caused by mistakes or miscalculations in our project man-
agement could negatively affect our customers’ own production
processes, resulting in reputational damage to us as supplier as
well as to the affected customer as manufacturer. In addition,
defective products could result in loss of sales, loss of customers
and loss of market acceptance.
L E G A L , TA X AT I O N A N D E N V I R O N M E N TA L R I S K S
A N D O P P O RT U N I T I E S
We are exposed to warranty and product liability claims.
As a manufacturer, we are subject to product liability lawsuits and
other proceedings alleging violations of due care, violation of war-
ranty obligations, treatment errors, safety provisions and claims
arising from breaches of contract (like delivery delays), recall
actions or fines imposed by government or regulatory authorities in
relation to our products. Any such lawsuits, proceedings and other
claims could result in increased costs for us. Additionally, authori-
ties could prohibit the future sale of our products, particularly in
cases of safety concerns. The aforementioned scenarios could result
in loss of market acceptance, loss of revenue and loss of customers,
in particular against the background that many of our products are
components which often have a major impact on the overall safety,
durability and performance of our customers’ end-product.
The risks arising from such warranty and product liability lawsuits,
proceedings and other claims are insured as we consider economi-
cally reasonable, but the insurance coverage could prove insuffi-
cient in individual cases. Additionally, any major defect in one of
our products could also have a material adverse effect on our repu-
tation and market perception, which in turn could have a signifi-
cant adverse effect on our revenue and results of operations.
In addition, vehicle manufacturers are increasingly requiring a con-
tribution from, or indemnity by, their suppliers for potential product
liability, warranty and recall claims and we have been subject to
continuing efforts by our customers to change contract terms and
conditions concerning warranty and recall participation.
Furthermore, we manufacture many products pursuant to OEM cus-
tomer specifications and quality requirements. If the products man-
ufactured and delivered by us are deemed not to be fit for use by
our OEM customers at the agreed date of delivery, production of
the relevant products is generally discontinued until the cause of
the product defect has been identified and remedied. Furthermore,
our OEM customers could potentially bring claims for damages on
the basis of breach of contract, even if the cause of the defect is

A N N U A L R E P O R T 2 0 1 5 51
Risks and opportunit ies C O M B I N E D M A N A G E M E N T R E P O R T
remedied at a later point in time. In addition, failure to perform
with respect to quality requirements could negatively affect the
market acceptance of our other products and our market reputa-
tion in various market segments.
We are and may become party to certain disadvantageous con-
tracts pursuant to which we are required to sell certain products at
a loss or to agree to broad indemnities. For example, we may enter
into a contract at an agreed price and production costs may end up
exceeding what was assumed in the development phase. If the
assumptions on which we rely in contract negotiations turn out to
be inaccurate, this could have an adverse effect on our revenue
and results of operations.
We are exposed to certain risks and opportunities with regards to
our intellectual property, its validity and the intellectual property of
third parties.
Our products and services are highly dependent upon our techno-
logical know-how and the scope and limitations of our proprietary
rights therein. We have obtained or have applied for a number of
intellectual property rights, which can be difficult, lengthy and
expensive to procure. Furthermore, patents may not provide us with
meaningful protection or a commercial advantage. In addition,
where we incorporate an individual customer’s input to create a
product that responds to a particular need, we face the risk that
such customer will claim ownership rights in the associated intel-
lectual property.
Our competitors, suppliers, customers and other third parties also
submit a large number of intellectual property protection applica-
tions. Such other parties could hold effective and enforceable intel-
lectual property rights to certain processes, methods or applica-
tions and consequently could assert infringement claims (including
illegitimate ones) against us.
A major part of our know-how and industrial secrets is not pat-
ented and cannot be protected through intellectual property rights.
Consequently, there is a risk that third parties, in particular com-
petitors, will copy our know-how without incurring any expenses of
their own. Our intellectual property is oftentimes discovered by and
during the course of our employees’ employment. As a result, there
is a risk that we have failed or will fail to properly utilize inventions
of our employees. Present or former employees who made or make
employee inventions might continue to be the owners of the valua-
ble rights to inventions if we fail to claim the invention in a timely
manner.
The realization of any of these risks could give rise to intellectual
property claims against us. Such claims, if successful, could require
us to cease manufacturing, using or marketing the relevant technol-
ogies or products in certain countries or be forced to make changes to
manufacturing processes or products. In addition, we could be lia-
ble to pay compensation or damages for infringements or could be
forced to purchase licenses to make use of technology from third
parties. This could have a material adverse effect on our business,
financial condition and results of operations.
We are subject to risks from legal, administrative and arbitration
proceedings.
We are involved in a number of legal and administrative proceed-
ings related to products, patents and other matters incidental to
our business and could become involved in additional legal, admin-
istrative and arbitration proceedings in the future. These proceed-
ings or potential proceedings could involve, in particular in the
United States, substantial claims for damages or other payments.
Based on a judgment or a settlement agreement, we could be
obligated to pay substantial damages. Our litigation costs and
those of third parties could also be significant.
Due to our high market share, we may be exposed to legal risks
regarding anti-competition fines and related damage claims.
Our market share in most of the markets in which we operate is
high, which may induce competition authorities to initiate proceed-
ings or third parties to file claims against us alleging violation of
competition laws. A successful anti-competition challenge could
adversely affect us in a variety of ways. For example, it could result
in the imposition of fines by one or more authorities and/or in third
parties (such as competitors or customers) initiating civil litigation
claiming damages caused by anti-competitive practices. In addition,
anti-competitive behavior may give rise to reputational risk to us.
The realization of this risk could have a material effect on our busi-
ness, financial condition and results of operations.
Interest carry-forwards may be forfeited in part or in full as a result
of subsequent share sales.
A N N U A L R E P O R T 2 0 1 552
Risks and opportunit ies C O M B I N E D M A N A G E M E N T R E P O R T
Some Stabilus subsidiaries have significant interest carry-forwards as
a result of the application of the statutory interest ceiling rules that
limit the deduction of net interest expenses for tax purposes. The
interest carry-forward may be deducted to the extent that in subse-
quent assessment periods the then current interest expenses do not
reach the interest ceiling applicable to the relevant assessment
period, and, thus, reduce the tax payable by the relevant subsidiary.
However, the interest carry-forward will be forfeited on a pro rata
base or in full if more than defined percentage of the shares in
entities are directly or indirectly transferred to a new shareholder,
persons related to such shareholder or a group of shareholders act-
ing in the same interest, or in case of similar transactions (such as
a capital increase) that result in a change of the shareholder struc-
ture. Such forfeiture would increase the tax payable by the relevant
subsidiary if without the forfeiture the interest carry-forward could
have been used in part or in full.
We could be held liable for soil, water or groundwater contamina-
tion or for risks related to hazardous materials.
Many of the sites at which we operate have been used for indus-
trial purposes for many years, leading to risks of contamination and
the resulting site restoration obligations. In addition, we could be
held responsible for the remediation of areas adjacent to our sites
if these areas were potentially contaminated due to our activities.
Groundwater contamination was discovered at a site in Colmar,
Pennsylvania operated by us from 1979 to 1998. In June 2012, the
U.S. Environmental Protection Agency (“EPA”) issued an adminis-
trative order against our U.S. subsidiary and determined require-
ments in respect of the remedy and the remedy cost. Our subsidi-
ary, together with the other responsible parties, is requested to
reimburse the EPA for past and current expenses and to bear the
remediation costs. If additional contamination is discovered in the
future, the competent authorities could assert further claims against
us, as the owner or tenant of the affected plots, for the examina-
tion or remediation of such soil or groundwater contamination, or
order us to dispose of or treat contaminated soil excavated in the
course of construction. We could also be required to indemnify the
owners of plots leased by us or of other properties, if the authori-
ties were to pursue claims against the relevant owner of the prop-
erty and if we caused the contamination. Costs typically incurred in
connection with such claims are generally difficult to predict. Also,
if any contamination were to become the subject of a more intense
public discussion, there is a risk that our reputation or relations
with our customers could be harmed.
Furthermore, at some of the sites at which we operate, or at which
we operated in the past, small quantities of hazardous materials
were used in the past, such as asbestos-containing building mate-
rials used for heat insulation. While we consider it unlikely, it can-
not be ruled out that the health and safety of third parties (such as
former employees) may have been affected due to the use of such
hazardous materials or that other claims may be asserted and we
could therefore be exposed to related damage claims in the future.
Even if we have contractually excluded or limited our liability in con-
nection with the sale of such properties, we could be held responsi-
ble for currently unknown contamination on properties which we
previously owned or used.
The in-house legal department monitors these risks continuously and
reports regularly to Group management and the Supervisory Board.
Risks and opportunities related to our capital structure
Due to our high level of debt we face potential liquidity risks.
Our cash from operating activities, current cash resources and
existing sources of external financing could be insufficient to meet
our further capital needs, especially if our sales decrease signifi-
cantly. Disruptions in the financial markets, including the bank-
ruptcy, insolvency or restructuring of a number of financial institu-
tions, and restricted availability of liquidity could adversely impact
the availability and cost of additional financing for us and could
adversely affect the availability of financing already arranged or
committed. Our liquidity could also be adversely impacted if our
suppliers tighten terms of payment as the result of any decline in
our financial condition or if our customers were to extend their
normal payment terms.
Stabilus has set an appropriate liquidity risk management frame-
work for the management of the Group’s short, medium and long-
term funding and liquidity requirements. The Group manages
liquidity risk by regular reviews, maintaining certain cash reserves,
as well as open credit lines.

A N N U A L R E P O R T 2 0 1 5 53
Corporate GovernanceC O M B I N E D M A N A G E M E N T R E P O R T
We are exposed to risks and opportunities associated with changes
in currency exchange rates.
We operate worldwide and are therefore exposed to financial risks
that arise from changes in exchange rates. Currency exchange fluc-
tuations could cause losses if assets denominated in currencies
with a falling exchange rate lose value, while at the same time lia-
bilities denominated in currencies with a rising exchange rate
appreciate. In addition, fluctuations in foreign exchange rates could
enhance or minimize fluctuations in the prices of materials, since
we purchase a considerable part of the prefabricated materials
which we source from foreign currencies. As a result of these fac-
tors, fluctuations in exchange rates could affect our results of oper-
ations. External and internal transactions involving the delivery of
products and services to and/or by third parties result in cash
inflows and outflows which are denominated in currencies other
than the functional currency of our respective group member.
Among other factors, we are particularly exposed to fluctuations of
net inflows in U.S. dollar (surplus) and net outflows in Romanian
Leu (demand). To the extent that cash outflows are not offset by
cash inflows resulting from operational business in such currency,
the remaining net foreign currency exposure is not hedged as of
September 30, 2015.
Although we may enter into certain hedging arrangements in the
future, there can be no assurance that hedging will be available or
continue to be available on commercially reasonable terms. In
addition, if we were to use any hedging transactions in the future
in the form of derivative financial instruments, such transactions
may result in mark-to-market losses. In addition, we are exposed to
foreign exchange risks arising from internal loan agreements,
which result from cash inflows and outflows in currencies other
than the functional currency of our respective Group member. As of
the September 30, 2015, these foreign exchange risks are not
hedged against by using derivative financial instruments. Our net
foreign investments are generally not hedged against exchange
rate fluctuations. In addition, a number of our consolidated compa-
nies report their results in currencies other than the Euro, which
requires us to convert the relevant items into Euro when preparing
our consolidated financial statements. Translation risks are gener-
ally not hedged.
The Management Board does not see any individual or aggregate
risk that could endanger Stabilus future in any material way.
C O R P O R AT E
G OV E R N A N C E
As a Luxembourg société anonyme, the Company is subject to the
corporate governance regime as set forth in particular in the law of
August 10, 1915 on commercial companies. As a company whose
shares are listed on a regulated market, the Company is further sub-
ject to the law of May 24, 2011 on the exercise of certain share-
holder rights in listed companies.
As a Luxembourg société anonyme whose shares are exclusively
listed on a regulated market in Germany, the Company is not
required to adhere to the Luxembourg corporate governance regime
applicable to companies that are traded in Luxembourg or to the
German corporate governance regime applicable to stock corpora-
tions organized in Germany. The Company has decided to set up
own corporate governance rules as described in the following para-
graphs rather than to confirm such corporate governance regimes
in order to build up a corporate governance structure which meets
the specific needs and interests of the Company.
The internal control systems and risk management for the establish-
ment of financial information is described in the section “Risk man-
agement and control over financial reporting in the Stabilus Group”.
According to the Articles of Incorporation of the Company, the
Management Board must be composed of at least two Management
Board members, and the Supervisory Board must be composed of
at least three Supervisory Board members. The Supervisory Board
has set up the following committees in accordance with the Arti-
cles of Incorporation: Audit Committee and Remuneration Commit-
tee. The Audit Committee is responsible for the consideration and
evaluation of the auditing and accounting policies and its financial
controls and systems. The Remuneration Committee is responsible
for making recommendations to the Supervisory Board and the
Management Board on the terms of appointment and the benefits
of the managers of the Company as well as for making recommen-
dations on bonus payments to be made to all Stabilus employees.
Further details on the composition and purpose of these commit-
tees and of the Management Board and the Supervisory Board
is described in the section “Management and Supervisory Board
of Stabilus S.A.”.

A N N U A L R E P O R T 2 0 1 554
CorporateGovernance C O M B I N E D M A N A G E M E N T R E P O R T
The Annual General Meeting shall be held on the third Wednesday
of the month of February at 10 a.m. Luxembourg time. If such day
is not a business day in Luxembourg, the meeting shall be held on
the next following business day, at the same hour. The Management
Board and Supervisory Board may convene extraordinary general
meetings as often as the Company’s interests so require. An extraor-
dinary general shareholders’ meeting must be convened upon the
request of one or more shareholders who together represent at
least one tenth of the Company’s share capital.
Each share entitles the holder to one vote. The right of a share-
holder to participate in a General Meeting and to exercise the vot-
ing rights attached to his shares are determined with respect to
the shares held by such shareholder the 14th day before the General
Meeting. Each shareholder can exercise his voting rights in person,
through a proxyholder or in writing (if provided for in the relevant
convening notice).
The information required by Article 10.1 of Directive 2004 / 25 / EC
on takeover bids which has been implemented by Article 11 of
the law of May 19, 2006 on takeovers (the “Law on Takeovers”) is
set forth here below under “Disclosure Regarding Article 11 of the
Law on Takeovers of May 19, 2006”.
D I S C L O S U R E R E G A R D I N G A RT I C L E 1 1 O F T H E
L AW O N TA K E OV E R S O F M AY 1 9 , 2 0 0 6
A) For information regarding the structure of capital, reference is
made to Note 21 of the consolidated financial statements.
B) The Articles of Incorporation of the Company do not contain
any restrictions on the transfer of shares of the Company.
C) Information regarding section c) of the law (significant direct
and indirect shareholdings) can be found in Note 38 of the con-
solidated financial statement.
D) The Company has not issued any securities granting special
control rights to their holders.
E) The control rights of any shares issued in connection with
employee share schemes are exercised directly by the respective
employees.
F) The Articles of Incorporation of the Company do not contain
any restrictions on voting rights.
G) There are no agreements with shareholders which are known to
the Company and may result in restrictions on the transfer of
securities or voting rights within the meaning of Directive
2004 / 109 / EC (Transparency Directive).
H) Rules governing the appointment and replacement of Manage-
ment Board members and the amendment of the Articles of
Incorporation:
– The Management Board members are appointed by the
Supervisory Board by the majority of the votes of the mem-
bers present or represented (abstention or non-participation
being taken into account as a vote against the appoint-
ment), or in the case of a vacancy, by way of a decision of
the remaining Management Board members for the period
until the next Supervisory Board Meeting.
– Management Board members serve for the following terms:
Chief Executive Officer four years, Chief Financial Officer
three years and other Board members one year. Manage-
ment Board members are eligible for re-appointment.
– Management Board members may be removed at any time
with or without cause by the Supervisory Board by a simple
majority of the votes.
– Resolutions to amend the Articles of Incorporation may be
adopted by a majority of two thirds of the votes validly
cast, without counting the abstentions, if the quorum of half
of the share capital is met. If the quorum requirement of
half of the share capital of the Company is not met at the
Annual General Meeting, then the shareholders may be
re- convened to a second General Meeting. No quorum is
required in respect of such second General Meeting and the
resolutions are adopted by a supermajority of two-thirds of
the votes validly cast, without counting the abstentions.
I) Powers of the Management Board:
– The Company is managed by a Management Board under
the supervision of the Supervisory Board.
– The Management Board is vested with the broadest powers
to perform or cause to be performed any actions necessary
or useful in connection with the purpose of the Company.
– All powers not expressly reserved by the Companies Act or
by the Articles of Incorporation to the General Meeting or
the Supervisory Board fall within the authority of the Man-
agement Board.
– Certain transactions and measures are subject to the prior
approval of the Supervisory Board on the terms set out in
the Articles of Incorporation.
– The Management Board may appoint one or more persons,
who may be a shareholder or not, or who may be a member
of the Management Board or not, to the exclusion of any
member of the Supervisory Board, who shall have full author-

A N N U A L R E P O R T 2 0 1 5 55
C O M B I N E D M A N A G E M E N T R E P O R T Subsequent eventsOutlook
ity to act on behalf of the Company in all matters pertaining
to the daily management and affairs of the Company.
– The Management Board is also authorized to appoint a per-
son, either a director or not, to the exclusion of any member
of the Supervisory Board, for the purposes of performing
specific functions at every level within the Company.
– The Management Board may also appoint committees and
sub-committees in order to deal with specific tasks, to
advise the Management Board or to make recommendations
to the Management Board and / or, as the case may be, the
General Meeting, the members of which may be selected either
from among the members of the Management Board or not,
to the exclusion of any member of the Supervisory Board.
– The Management Board does not have currently any author-
ity to issue shares in the Company under the Articles of
Incorporation.
– The Management Board does not have currently any author-
ity to buy back shares under the Articles of Incorporation or
a buy-back program.
J) There are no significant agreements to which the Company is
party and which take effect, alter or terminate upon a change
of control of the Company following a takeover bid.
K) There are no agreements between the Company and its Man-
agement Board members or employees providing for compensa-
tion if they resign or are made redundant without valid reason
or if their employment ceases because of a takeover bid.
S U B S E Q U E N T E V E N T S
As of December 18, 2015, there were no further events or develop-
ments that could have materially affected the measurement and pre-
sentation of Group’s assets and liabilities as of September 30, 2015.
O U T L O O K
Key forecast institutions see an annual production growth for the
global light vehicle production of between 3% and 4% over the
next three years. The growth rate in China is expected to slow
down to around 4% in 2018. The NAFTA region is expected to
grow on a constant level of 2% where as the production in Europe
is expected to increase by 2016 and 2017 with an annual growth
rate of around 4%.
Based on the afore described light vehicle production growth as
well as overall market trends for our industrial products we envis-
age a sales growth in Europe of about 6% for fiscal year 2016.
Within this a major increase will come from Powerise based on a
number of platforms launched in 2015 and coming to a volume
production in fiscal year 2016. Industrial, which includes swivel
chair, is expected to provide modest growth. In the NAFTA region
we estimate an 8% year-on-year growth for fiscal year 2016. This
rests on a strong US light vehicle industry and continuing consumer
interest in SUVs allowing us to increase the Powerise sales further.
The industrial segment is envisaged to provide a growth rate
around the regional average 8%. This is supported by new swivel
chair orders obtained in the fiscal year 2015. In Asia / Pacific and
Row the continued trend to SUVs in China will open further gas
spring opportunities for Stabilus. The local Powerise production in
China starting in May 2016 should show first local delivery in the
fiscal year 2016. Contract wins with Asian car manu factures will
allow us to strength our gas spring position in this region. Within
the industrial segment the 2015 sales initiatives in China will allow
Stabilus to load the new industrial gas spring production line with
orders. In the Asia / Pacific and Row region we foresee a double
digit increase for industrial revenue.
For fiscal year 2016, we expect revenue of approximately €660 million
and an adjusted EBIT margin at the historical level of 12% to 13%.

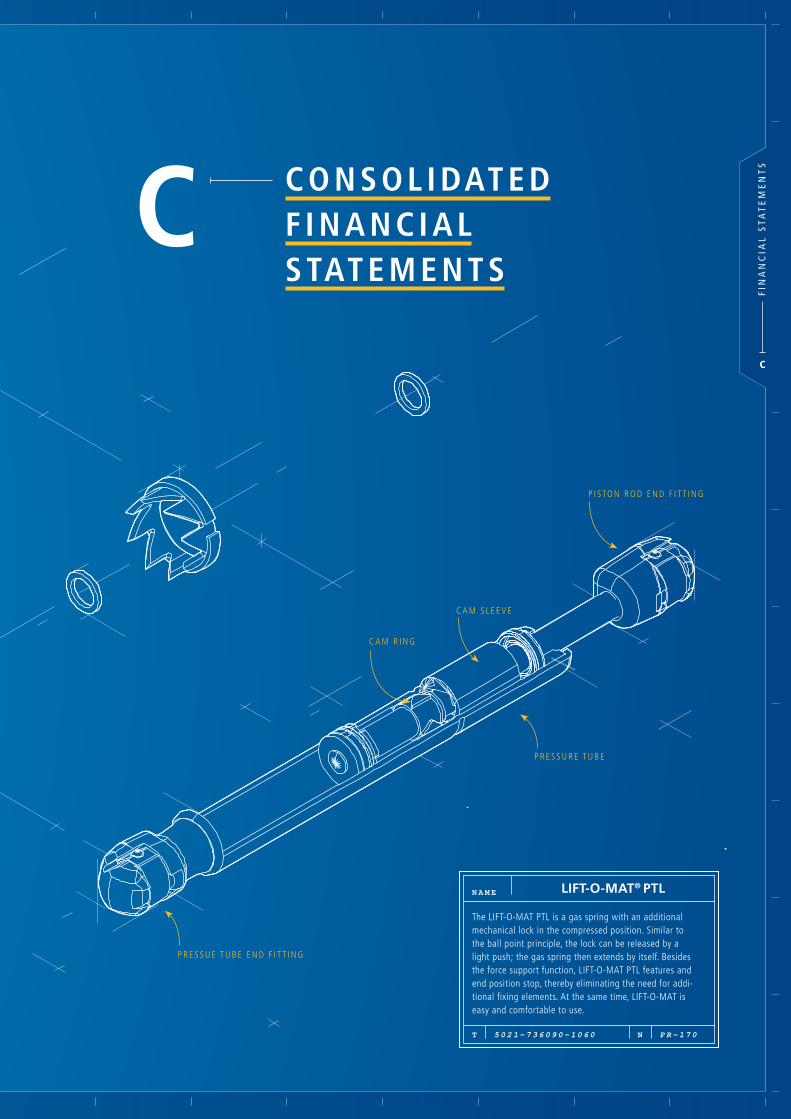
C
C C O N S O L I DAT E DF I N A N C I A L S TAT E M E N T S
P I S TO N R O D E N D F I T T I N G
C A M S L E E V E
C A M R I N G
P R E S S U E T U B E E N D F I T T I N G
P R E S S U R E T U B EF
INA
NC
IAL
ST
AT
EM
EN
TS
C
N A M E
5 0 2 1 – 7 3 6 0 9 0 – 1 0 6 0 P R – 1 7 0NT
The LIFT-O-MAT PTL is a gas spring with an additional mechanical lock in the compressed position. Similar to the ball point principle, the lock can be released by a light push; the gas spring then extends by itself. Besides the force support function, LIFT-O-MAT PTL features and end position stop, thereby eliminating the need for addi-tional fixing elements. At the same time, LIFT-O-MAT is easy and comfortable to use.
LIFT-O-MAT® PTL

Contents C O N S O L I D A T E D F I N A N C I A L S TA T E M E N T S
A N N U A L R E P O R T 2 0 1 558
C O N S O L I DAT E D F I N A N C I A L S TAT E M E N T Sfor the fiscal year ended September 30, 2015
5 9 C O N S O L I D A T E D S TA T E M E N T
O F C O M P R E H E N S I V E I N C O M E
6 0 C O N S O L I D A T E D S TA T E M E N T
O F F I N A N C I A L P O S I T I O N
6 2 C O N S O L I D A T E D S TA T E M E N T
O F C H A N G E S I N E Q U I T Y
6 3 C O N S O L I D A T E D S TA T E M E N T
O F C A S H F L O W S
6 4 N O T E S T O C O N S O L I D A T E D
F I N A N C I A L S TA T E M E N T S
64 1 General Information
65 2 Basis for presentation
71 3 Accounting policies
80 4 Revenue
81 5 Cost of sales, research and development,
selling and administrative expenses
82 6 Other income
82 7 Other expenses
83 8 Finance income
83 9 Finance costs
83 10 Income tax expense
87 11 Earnings per share
88 12 Property, plant and equipment
90 13 Goodwill
91 14 Other intangible assets
92 15 Other financial assets
93 16 Other assets
93 17 Inventories
94 18 Trade accounts receivable
95 19 Current tax assets
95 20 Cash and cash equivalents
95 21 Equity
96 22 Financial liabilities
97 23 Other financial liabilities
98 24 Provisions
100 25 Pension plans and similar obligations
103 26 Trade accounts payable
103 27 Current tax liabilities
104 28 Other liabilities
104 29 Leasing
106 30 Contingent liabilities and other financial commitments
108 31 Financial instruments
110 32 Risk reporting
113 33 Capital management
114 34 Notes to the consolidated statement of cash flows
114 35 Segment reporting
118 36 Share-based payment
120 37 Auditor’s fees
121 38 Related party relationships
122 39 Remuneration of key management personnel
122 40 Subsequent events
1 2 3 R E S P O N S I B I L I T Y S TA T E M E N T
1 2 4 M A N A G E M E N T B O A R D O F S TA B I L U S S . A .
1 2 5 S U P E R V I S O R Y B O A R D O F S TA B I L U S S . A .
1 2 6 I N D E P E N D E N T A U D I T O R ’ S R E P O R T

A N N U A L R E P O R T 2 0 1 5 59
Comprehensive IncomeC O N S O L I D A T E D F I N A N C I A L S TA T E M E N T S
C O N S O L I DAT E D S TAT E M E N T O F
C O M P R E H E N S I V E I N C O M E
for the fiscal year ended September 30, 2015
Consolidated statement of comprehensive income T _ 011
Year ended Sept 30,
I N € T H O U S A N D S N OT E 2015 2014
Revenue 4 611,271 507,333
Cost of sales 5 (463,594) (387,737)
Gross profit 147,677 119,596
Research and development expenses 5 (24,218) (20,291)
Selling expenses 5 (44,095) (38,703)
Administrative expenses 5 (27,329) (32,563)
Other income 6 11,238 6,012
Other expenses 7 (7,602) (2,855)
Profit from operating activities 55,671 31,196
Finance income 8 17,851 17,451
Finance costs 9 (42,405) (38,775)
Profit / (loss) before income tax 31,117 9,872
Income tax income / (expense) 10 (14,120) 78
Profit / (loss) for the period 16,997 9,950
thereof attributable to non-controlling interests 47 (136)
thereof attributable to shareholders of Stabilus 11 16,950 10,086
Other comprehensive income / (expense)
Foreign curreny translation difference 1) 21 (16,390) (422)
Unrealized actuarial gains and losses 2) 21 34 (6,444)
Other comprehensive income / (expense), net of taxes (16,356) (6,866)
Total comprehensive income / (expense) for the period 641 3,084
thereof attributable to non-controlling interests 47 (136)
thereof attributable to shareholders of Stabilus 594 3,220
Earnings per share (in €):
basic 11 0.82 0.54
diluted 11 0.82 0.54
1) Item that may be reclassified (‘recycled’) to profit and loss at a future point in time when specific conditions are met.2) Item that will not be reclassified to profit and loss.The accompanying Notes form an integral part of these Consolidated Financial Statements.

A N N U A L R E P O R T 2 0 1 560
Financial Posit ion C O N S O L I D A T E D F I N A N C I A L S TA T E M E N T S
C O N S O L I DAT E D S TAT E M E N T O F
F I N A N C I A L P O S I T I O N
as of September 30, 2015
Consolidated statement of financial position T _ 012
I N € T H O U S A N D S N OT E Sept 30, 2015 Sept 30, 2014
Assets
Property, plant and equipment 12 133,952 119,642
Goodwill 13 51,458 51,458
Other intangible assets 14 166,475 170,971
Other assets 16 1,864 1,102
Deferred tax assets 10 4,929 7,919
Total non-current assets 358,678 351,092
Inventories 17 59,783 49,540
Trade accounts receivable 18 62,848 56,497
Current tax assets 19 3,465 2,403
Other financial assets 15 7,899 18,304
Other assets 16 10,093 8,972
Cash and cash equivalents 20 39,473 33,494
Total current assets 183,561 169,210
Total assets 542,239 520,302

A N N U A L R E P O R T 2 0 1 5 61
F inancial Posit ionC O N S O L I D A T E D F I N A N C I A L S TA T E M E N T S
Consolidated statement of financial position T _ 012
I N € T H O U S A N D S N OT E Sept 30, 2015 Sept 30, 2014
Equity and liabilities
Issued capital 21 207 207
Capital reserves 21 73,091 73,091
Retained earnings 21 24,871 7,920
Other reserves 21 (21,484) (5,128)
Equity attributable to shareholders of Stabilus 76,685 76,090
Non-controlling interests 24 33
Total equity 76,709 76,123
Financial liabilities 22 258,644 256,556
Other financial liabilities 23 2,139 960
Provisions 24 1,032 4,060
Pension plans and similar obligations 25 47,989 48,353
Deferred tax liabilities 10 38,976 43,765
Other liabilities 28 576 –
Total non-current liabilities 349,356 353,694
Trade accounts payable 26 68,929 53,724
Financial liabilities 22 5,000 5,789
Other financial liabilities 23 7,978 6,360
Current tax liabilities 27 3,040 5,082
Provisions 24 20,128 8,551
Other liabilities 28 11,099 10,979
Total current liabilities 116,174 90,485
Total liabilities 465,530 444,179
Total equity and liabilities 542,239 520,302
The accompanying Notes form an integral part of these Consolidated Financial Statements.

A N N U A L R E P O R T 2 0 1 562
Changes in Equity C O N S O L I D A T E D F I N A N C I A L S TA T E M E N T S
C O N S O L I DAT E D S TAT E M E N T O F
C H A N G E S I N E Q U I T Y
for the fiscal year ended September 30, 2015
Consolidated statement of changes in equity T _ 013
I N € T H O U S A N D S N OT E
Issued capital
Capital reserves
Retained earnings
Other reserves
Equity attributable to
shareholders of Stabilus
Non- controlling
interests Total equity
Balance as of Sept 30, 2013 adjusted 5,013 74,403 (991) 1,737 80,162 169 80,331
Profit / (loss) for the period – – 10,086 – 10,086 (136) 9,950
Other comprehensive income / (expense) 21 – – – (6,866) (6,866) – (6,866)
Total comprehensive income for the period – – 10,086 (6,866) 3,220 (136) 3,084
Reduction of issued capital (4,836) 4,836 – – – – –
Proceeds from capital increase 30 64,970 – – 65,000 – 65,000
Contributions by owners – 10,020 – – 10,020 – 10,020
IPO costs directly recognized in equity, net of tax – – (1,175) – (1,175) – (1,175)
Dividends – (81,137) – – (81,137) – (81,137)
Balance as of Sept 30, 2014 207 73,091 7,920 (5,128) 76,090 33 76,123
Profit / (loss) for the period – – 16,950 – 16,950 47 16,997
Other comprehensive income / (expense) 21 – – – (16,356) (16,356) – (16,356)
Total comprehensive income for the period – – 16,950 (16,356) 594 47 641
Dividends 21 – – – – – (56) (56)
Balance as of Sept 30, 2015 207 73,091 24,871 (21,484) 76,685 24 76,709
The accompanying Notes form an integral part of these Consolidated Financial Statements.

A N N U A L R E P O R T 2 0 1 5 63
Cash FlowsC O N S O L I D A T E D F I N A N C I A L S TA T E M E N T S
C O N S O L I DAT E D S TAT E M E N T O F C A S H F L OW S
for the fiscal year ended September 30, 2015
Consolidated statement of cash flows T _ 014
Year ended Sept 30,
I N € T H O U S A N D S N OT E 2015 2014
Profit / (loss) for the period 16,997 9,950
Current income tax expense 10 16,920 10,522
Deferred income tax expense 10 (2,800) (10,600)
Net finance result 8/9 24,554 21,325
Depreciation and amortization (incl. impairment losses) 5 43,813 40,110
Other non-cash income and expenses (3,142) (10,222)
Changes in inventories (10,243) (3,477)
Changes in trade accounts receivable (6,351) 11,279
Changes in trade accounts payable 15,205 8,747
Changes in other assets and liabilities (2,718) 5,705
Changes in provisions 8,235 896
Changes in deferred tax assets and liabilities 2,800 10,600
Income tax payments 34 (17,274) (7,065)
Cash flow from operating activities 85,996 87,770
Proceeds from disposal of property, plant and equipment 267 48
Purchase of intangible assets 14 (15,365) (14,394)
Purchase of property, plant and equipment 12 (36,068) (21,246)
Cash flow from investing activities (51,166) (35,592)
Receipts from contributions of equity – 65,000
Receipts under senior facility 22 270,000 –
Receipts under revolving credit facility – 8,000
Payments under revolving credit facility – (8,000)
Payments for redemption of senior secured notes 22 (256,123) (58,877)
Repayments of senior facility 22 (2,500) –
Payments for redemption of other financial liabilities – (1,661)
Payments for finance leases 29 (1,841) (1,191)
Payments of transaction costs (5,650) (14,362)
Dividends paid to non-controlling interests 21 (56) –
Payments for interest 34 (32,237) (30,113)
Cash flow from financing activities (28,407) (41,204)
Net increase / (decrease) in cash and cash equivalents 6,423 10,974
Effect of movements in exchange rates on cash held (444) 701
Cash and cash equivalents as of beginning of the period 33,494 21,819
Cash and cash equivalents as of end of the period 39,473 33,494
The accompanying Notes form an integral part of these Consolidated Financial Statements.

A N N U A L R E P O R T 2 0 1 564
N o t e s C O N S O L I D A T E D F I N A N C I A L S TA T E M E N T S
1 General Information
Stabilus S.A., Luxembourg, hereinafter also referred to as “Stabilus” or the “Company” is a public lim-
ited liability company (société anonyme) incorporated in Luxembourg and governed by Luxembourg
law. The Company is registered with the Luxembourg Trade and Companies Register (Registre de
Commerce et des Sociétés Luxembourg) under No. B0151589 and its registered office is located at 2,
rue Albert Borschette, L-1246 Luxembourg, Grand Duchy of Luxembourg. The Company was founded
under the name Servus HoldCo S.à r.l. on February 26, 2010.
The Company´s fiscal year is from October 1 to September 30 of the following year (twelve-month
period). The consolidated financial statements of Stabilus S.A. include Stabilus and its subsidiaries
(hereafter also referred to as “Stabilus Group” or the “Group”).
The Stabilus Group is a leading manufacturer of gas springs and dampers, as well as electric tailgate
opening and closing equipment. The products are used in a wide range in automotive and industrial
applications, as well as in the furniture industry. Typically the products are used to support the lifting
and lowering or dampening of movements. As world market leader for gas springs, the Group ships to
all key vehicle manufacturers. Various Tier 1 suppliers of the global car industry as well as large techni-
cal focused distributors further diversify the Group’s customer base.
The consolidated financial statements are prepared in euro (€) rounded to the nearest thousand. Due
to rounding, numbers presented may not add up precisely to totals provided.
The consolidated financial statements of Stabilus and its subsidiaries have been prepared in accor-
dance with International Financial Reporting Standards (IFRS), as adopted by the EU.
The consolidated financial statements were authorized for issue by the Management Board on Decem-
ber 18, 2015.
N OT E S TO C O N S O L I DAT E D F I N A N C I A L
S TAT E M E N T S
as of and for the fiscal year ended September 30, 2015

A N N U A L R E P O R T 2 0 1 5 65
N o t e sC O N S O L I D A T E D F I N A N C I A L S TA T E M E N T S
2 Basis for presentation
P R E PA R AT I O N
Applying IAS 1, items of the statement of financial position are differentiated between non-current and
current assets and liabilities. Assets and liabilities are classified as current if they have a remaining
term of less than one year. Accordingly, assets and liabilities are classified as non-current if they remain
in the Group for more than one year. Deferred tax assets and deferred tax liabilities, as well as assets
and provisions from defined benefit pension plans and similar obligations are reported as non-current
items. The consolidated statement of comprehensive income is presented using the cost of sales method.
M E A S U R E M E N T
The consolidated financial statements have been prepared on the historical cost basis, with the excep-
tion of certain items, such as derivative financial instruments or hedged transactions and pensions and
similar obligations. The measurement methods applied to these exceptions are described below.
U S E O F E S T I M AT E S A N D J U D G M E N T S
Certain of the accounting policies require critical accounting estimates that involve complex and sub-
jective judgments and the use of assumptions, some of which may be for matters that are inherently
uncertain and susceptible to change. Such critical accounting estimates could change from period to
period and have a material impact on the financial position or results of operations. Critical accounting
estimates could also involve estimates where management could reasonably have used a different esti-
mate in the current accounting period. Management wishes to point out that future events often vary
from forecasts and that estimates routinely require adjustment.
Impairment of non-financial assets:
Stabilus assesses at every reporting date whether there are indications that its non-financial assets
may be impaired. Goodwill and development cost under construction are tested annually for impair-
ment. Further tests are carried out if there are indications for impairment. Other non-financial assets
are tested for impairment if there are indications that the carrying amount may not be recoverable. If
the fair value less costs of disposal is calculated, management must estimate the expected future cash
flows from the asset or the cash-generating unit and select an appropriate discount rate in order to
determine the present value of this cash flow.
Trade and other receivables:
The allowance for doubtful accounts involves significant management judgment and review of individ-
ual receivables based on individual customer creditworthiness, current economic trends and analysis of
historical allowances. We refer also to Note 18.
A N N U A L R E P O R T 2 0 1 566
N o t e s C O N S O L I D A T E D F I N A N C I A L S TA T E M E N T S
Deferred tax assets:
The valuation of deferred tax assets is based on mid-term business plans of the respective entities which
recorded deferred tax assets. These mid-term business plans range from three to five years and include
several underlying assumptions and estimates in respect of the business development, strategic
changes, cost optimization and business improvement and also general market and economic develop-
ment. Deferred tax assets are recognized to the extent that sufficient taxable profit at the level of the
relevant tax authority will be available for the utilization of the deductible temporary differences. Stabi-
lus recognizes a valuation allowance for deferred tax assets when it is unlikely that sufficient future
taxable profit will be available. We refer also to Note 10.
Provisions:
Significant estimates are involved in the determination of provisions related to pensions and other
obligations, contract losses, warranty costs and legal proceedings. We refer also to Note 24 and 25.
R I S K S A N D U N C E RTA I N T I E S
The Group’s net assets, financial position and results of operations are subject to risks and uncertainties.
Factors that could affect the future net assets, financial position and results of operations and there-
fore cause actual results to vary from the expectations include sales volume changes due to changes
in the overall economy, evolvement of price-aggressive competitors, significant price changes for raw
materials and overall purchase costs. Quality issues may result in significant costs for the Group, in
spite of a benchmarked insurance cover. The Group financing with its variable interest rates face future
risks and uncertaincies depending on the development of the underlying Euribor and the net leverage
level of the Company. The variable interest rates are committed until June 2020.
G O I N G C O N C E R N
These consolidated financial statements are prepared based on the going concern assumption.
S C O P E O F C O N S O L I DAT I O N
The consolidated financial statements include the financial statements of Stabilus S.A. and the finan-
cial statements of all subsidiaries, including structured entities which are directly or indirectly con-
trolled by Stabilus S.A. Control exists if the parent company has the power of decision over a subsidi-
ary based on voting rights or other rights, if it participates in positive and negative variable returns
from a subsidiary, and if it can affect these returns by its power of decision.
Non-controlling interests represent the portion of profit and loss and net assets not held by the Group
and are presented separately in the consolidated statement of comprehensive income and the consoli-
dated statement of financial position.
The results of subsidiaries acquired or disposed of during the period are included in the consolidated
statement of comprehensive income from the effective date of acquisition or up to the effective date of
disposal, as appropriate. Inclusion in the consolidated financial statements ends as soon as the Com-
pany no longer has control.

A N N U A L R E P O R T 2 0 1 5 67
N o t e sC O N S O L I D A T E D F I N A N C I A L S TA T E M E N T S
In addition to Stabilus, altogether 27 subsidiaries (see following list), are included in the consolidated
financial statements as of September 30, 2015.
Subsidiaries T _ 015
N A M E O F T H E C O M PA N Y
Registered office of the entity Interest and control held by Holding in %
Consolidation method
Servus Sub S.à r.l. Luxembourg Stabilus S.A. 100.00% Full
Servus Luxembourg S.à r.l. Luxembourg Stabilus S.A. 100.00% Full
Servus III (Gibraltar) Limited Gibraltar Stabilus S.A. 100.00% Full
Servus Luxembourg Holding S.C.A. Luxembourg Servus Sub S.à r.l. 99.9968% Full
Servus Luxembourg S.à r.l. 0.0032%
Blitz F10-neun GmbH Frankfurt, Germany Stabilus S.A. 100.00% Full
Blitz F10-acht-drei-drei GmbH & Co KG Frankfurt, Germany Servus III (Gibraltar) Limited 94.90% Full
Stable II S.à r.l. Luxembourg Servus Luxembourg Holding S.C.A. 94.90% Full
Blitz F10-acht-drei-drei GmbH & Co KG 5.10%
Stable Beteiligungs GmbH Koblenz, Germany Stable II S.à r.l. 100.00% Full
Stable HoldCo Inc. Wilmington, USA Stable Beteiligungs GmbH 100.00% Full
Stable HoldCo Australia Pty. Ltd. Dingley, Australia Stable II S.à r.l. 100.00% Full
Stable UK HoldCo Ltd. Banbury, United Kingdom Stabilus UK Ltd. 100.00% Full
LinRot Holding AG Zurich, Switzerland Stable II S.à r.l. 100.00% Full
Stabilus UK Ltd. Banbury, United Kingdom Stable Beteiligungs GmbH 100.00% Full
Stabilus GmbH Koblenz, Germany Stable Beteiligungs GmbH 100.00% Full
Stabilus Powerise GmbH Melle, Germany LinRot Holding AG 100.00% Full
Stabilus Pty. Ltd. Dingley, Australia Stable HoldCo Australia Pty. Ltd. 100.00% Full
Stabilus Ltda. Itajubá, Brazil Stabilus GmbH 99.99% Full
Stabilus Espana S.L. Lezama, Spain Stabilus GmbH 100.00% Full
Stabilus Co. Ltd. Busan, South Korea Stabilus GmbH 100.00% Full
Stabilus S.A. de C.V. Ramos Arizpe, Mexico Stabilus GmbH 99.9998% Full
Stabilus UK Ltd. 0.0002%
Stabilus Inc. Gastonia, USA Stable HoldCo Inc. 100.00% Full
Stabilus Limited Auckland, New Zealand Stabilus GmbH 80.00% Full
Stabilus Japan Corp. Yokohama, Japan Stable Beteiligungs GmbH 100.00% Full
Stabilus France S.à r.l. Poissy, France Stabilus GmbH 100.00% Full
Stabilus Romania S.R.L. Brasov, Romania Stable Beteiligungs GmbH 3.01% Full
Stabilus GmbH 96.99%
Stabilus (Jiangsu) Ltd. Wujin, China Stabilus GmbH 100.00% Full
Orion Rent Imobiliare S.R.L. Brasov, Romania Stable Beteiligungs GmbH 98.00% Full
Stabilus UK Ltd. 2.00%

A N N U A L R E P O R T 2 0 1 568
N o t e s C O N S O L I D A T E D F I N A N C I A L S TA T E M E N T S
In the fourth quarter of the fiscal year 2015, “Stabilus Ltd.” was renamed to “Stable UK Holdco Ltd.”
and “Stabilus UK Holdco Ltd.” changed its name to “Stabilus UK Ltd.”.
P R I N C I P L E S O F C O N S O L I DAT I O N
The assets and liabilities of the domestic and foreign entities included in consolidation are recognized
in accordance with the uniform accounting policies of the Stabilus Group. Receivables and liabilities or
provisions between the consolidated companies are offset. Intragroup revenue and other intragroup
income and the corresponding cost and expenses are eliminated. Intercompany gains and losses on
intragroup delivery and service transactions are eliminated through profit or loss, unless they are
immaterial. Deferred taxes, which reflect the average income tax charge on the recipient group entity,
are recognized on consolidation adjustments affecting profit or loss.
BU S I N E S S C O M B I N AT I O N
Business combinations are accounted for using the acquisition method as of the acquisition date, which
is the date on which control is transferred to the Group. Goodwill is measured at the acquisition date as:
• the fair value of the consideration transferred, plus
• the recognized amount of any non-controlling interests in the acquiree, less
• the net recognized amount (generally the fair value) of the identifiable assets acquired and liabili-
ties assumed.
The consideration transferred does not include amounts related to the settlement of pre-existing rela-
tionships. Such amounts are generally recognized in profit or loss. Costs related to the acquisition,
other than those associated with the issue of debt or equity securities that the Group incurs in connec-
tion with the business combination are expensed as incurred.
Non-controlling interests in the net assets (excluding goodwill) of consolidated subsidiaries consist of
the amount of those interests at the date of the original business combination and the minority’s share
of changes in equity since the date of the combination.
F O R E I G N C U R R E N C Y T R A N S L AT I O N
The consolidated financial statements are presented in euro (€), as the Group’s functional and presenta-
tion currency. Each entity in the Group determines its own functional currency, which is the currency of
its primary economic environment in which the entity operates. Items included in the financial state-
ments of each entity are measured using that functional currency. Transactions in foreign currencies
are initially recorded at the functional currency rate at the date of the transaction. Monetary assets
and liabilities denominated in foreign currencies are translated at the functional currency rate of
exchange at the balance sheet date. All differences are taken to profit or loss. Non-monetary items that
are measured in terms of historical cost in a foreign currency are translated using the exchange rates as
of the date of the initial transactions. Non-monetary items measured at fair value in a foreign currency
are translated using the exchange rates at the date when the fair value is determined. Any goodwill
arising on the acquisition of a foreign operation and any fair value adjustments to the carrying

A N N U A L R E P O R T 2 0 1 5 69
N o t e sC O N S O L I D A T E D F I N A N C I A L S TA T E M E N T S
amounts of assets and liabilities arising on the acquisition are treated as assets and liabilities of the
foreign operation and translated at the historic rate.
Assets and liabilities of foreign subsidiaries where the functional currency is other than euro (€) are
translated using the financial period-end exchange rates, while their income and expenses are trans-
lated using the average exchange rates during the period.
Foreign currency transaction gains and losses on operating activities are included in other operating
income and expenses. Foreign currency gains and losses on financial receivables and debts are
included in interest income and expenses.
Translation adjustments arising from exchange rate differences are included in a separate component
of shareholder’s equity in amounts recognized directly in equity. On disposal of a foreign entity, the
deferred cumulative amount recognized in equity relating to that particular foreign operation is recog-
nized in profit or loss.
The exchange rates of the significant currencies of non-euro countries used in the preparation of the
consolidated financial statements were as follows:
Exchange rates T _ 016
Closing rate Sept 30, Average rate for the year ended Sept 30,
C O U N T RY I S O C O D E 2015 2014 2015 2014
Australia AUD 1.6118 1.4539 1.4596 1.4753
Brazil BRL 4.6145 3.0926 3.4048 3.1070
China CNY 7.1672 7.8098 7.1614 8.3414
South Korea KRW 1,346.6700 1,338.6700 1,286.5100 1,424.7400
Mexico MXP 19.2032 17.0692 17.3371 17.7724
Romania ROL 4.4167 4.4114 4.4410 4.4525
USA USD 1.1245 1.2687 1.1602 1.3575
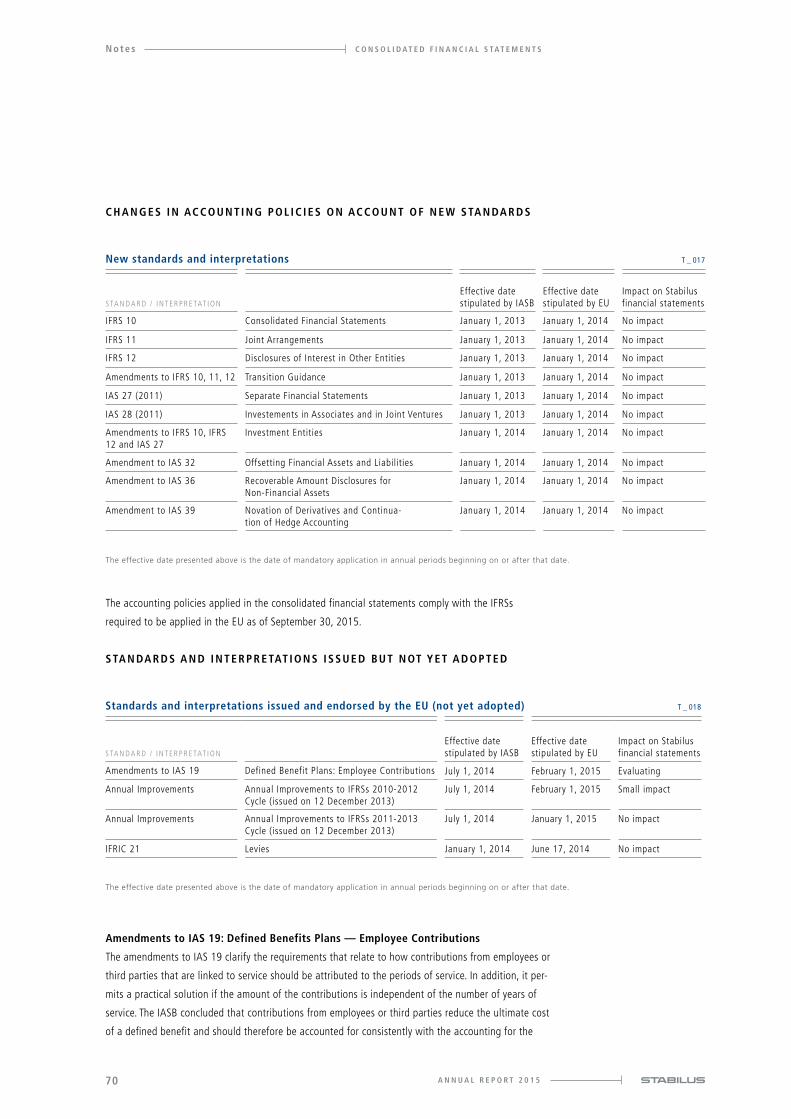
A N N U A L R E P O R T 2 0 1 570
N o t e s C O N S O L I D A T E D F I N A N C I A L S TA T E M E N T S
Amendments to IAS 19: Defined Benefits Plans — Employee Contributions
The amendments to IAS 19 clarify the requirements that relate to how contributions from employees or
third parties that are linked to service should be attributed to the periods of service. In addition, it per-
mits a practical solution if the amount of the contributions is independent of the number of years of
service. The IASB concluded that contributions from employees or third parties reduce the ultimate cost
of a defined benefit and should therefore be accounted for consistently with the accounting for the
C H A N G E S I N AC C O U N T I N G P O L I C I E S O N AC C O U N T O F N E W S TA N DA R D S
The accounting policies applied in the consolidated financial statements comply with the IFRSs
required to be applied in the EU as of September 30, 2015.
S TA N DA R D S A N D I N T E R P R E TAT I O N S I S S U E D BU T N OT Y E T A D O P T E D
New standards and interpretations T _ 017
S TA N D A R D / I N T E R P R E TAT I O N
Effective date stipulated by IASB
Effective date stipulated by EU
Impact on Stabilus financial statements
IFRS 10 Consolidated Financial Statements January 1, 2013 January 1, 2014 No impact
IFRS 11 Joint Arrangements January 1, 2013 January 1, 2014 No impact
IFRS 12 Disclosures of Interest in Other Entities January 1, 2013 January 1, 2014 No impact
Amendments to IFRS 10, 11, 12 Transition Guidance January 1, 2013 January 1, 2014 No impact
IAS 27 (2011) Separate Financial Statements January 1, 2013 January 1, 2014 No impact
IAS 28 (2011) Investements in Associates and in Joint Ventures January 1, 2013 January 1, 2014 No impact
Amendments to IFRS 10, IFRS 12 and IAS 27
Investment Entities January 1, 2014 January 1, 2014 No impact
Amendment to IAS 32 Offsetting Financial Assets and Liabilities January 1, 2014 January 1, 2014 No impact
Amendment to IAS 36 Recoverable Amount Disclosures for Non-Financial Assets
January 1, 2014 January 1, 2014 No impact
Amendment to IAS 39 Novation of Derivatives and Continua-tion of Hedge Accounting
January 1, 2014 January 1, 2014 No impact
The effective date presented above is the date of mandatory application in annual periods beginning on or after that date.
Standards and interpretations issued and endorsed by the EU (not yet adopted) T _ 018
Effective date stipulated by IASB
Effective date stipulated by EU
Impact on Stabilus financial statementsS TA N D A R D / I N T E R P R E TAT I O N
Amendments to IAS 19 Defined Benefit Plans: Employee Contributions July 1, 2014 February 1, 2015 Evaluating
Annual Improvements Annual Improvements to IFRSs 2010-2012 Cycle (issued on 12 December 2013)
July 1, 2014 February 1, 2015 Small impact
Annual Improvements Annual Improvements to IFRSs 2011-2013 Cycle (issued on 12 December 2013)
July 1, 2014 January 1, 2015 No impact
IFRIC 21 Levies January 1, 2014 June 17, 2014 No impact
The effective date presented above is the date of mandatory application in annual periods beginning on or after that date.
A N N U A L R E P O R T 2 0 1 5 71
N o t e sC O N S O L I D A T E D F I N A N C I A L S TA T E M E N T S
defined benefit itself. The investigation of the effects on the consolidated financial statements resulting
from the amendments to IAS 19 has not yet been completed.
Annual improvements — 2010–2012 cycle
The annual improvements to IFRSs 2010-2012 cycle (issued on December 12, 2013) targeted to enhance
the quality of the following standards for which the amendments were considered necessary but also
non-urgent and sufficiently narrow in scope: IFRS 2, IFRS 3, IFRS 8, IFRS 13, IAS 16, IAS 24, IAS 38. These
amendments will result in slightly enhanced disclosures and are not expected to have a significant impact
on the consolidated financial statements of the Group.
Annual improvements — 2011–2013 cycle
The annual improvements to IFRSs 2011-2013 cycle (issued on December 12, 2013) targeted to enhance
the quality of the following standards for which the amendments were considered necessary but also
non-urgent and sufficiently narrow in scope: IFRS 1, IFRS 3, IFRS 13, IAS 40. These amendments are not
expected to have an impact on the consolidated financial statements of the Group.
The investigation of the effects on the consolidated financial statements resulting from IFRS 9 and IFRS 15
has not yet been completed.
3 Accounting policies
R E V E N U E
Revenue is recognized to the extent that it is probable that the economic benefits will flow to the Group and
the revenue can be measured reliably. Revenue is measured at the fair value of the consideration received,
excluding discounts, rebates, and other sales taxes or duty. Revenue from the sale of goods is recognized
when the significant risks and rewards of ownership of goods have passed to the customer, a price is agreed
upon or can be determined and when the payment is probable. Revenue from a contract to provide services is
recognized according to the stage of completion, if the amount of the revenue can be measured reliably and
it is probable that the economic benefits from the business will flow to the Group.
Standards and interpretations issued but not yet endorsed by the EU T_019
I F R S S I S S U E D B U T N OT Y E T A D O P T E D : S TA N D A R D / I N T E R P R E TAT I O N
Effective date stipulated by IASB
Effective date stipulated by EU
Amendment to IFRS 10, IAS 28 Sale or Contribution of Assets between an Investor and its Associate or Joint Venture
January 1, 2016 January 1, 2016
Amendment to IFRS 10, 12, IAS 28 Investment Entities: Applying the Consolidation Exception January 1, 2016 January 1, 2016
IFRS 14 Regulatory Deferral Accounts January 1, 2016 January 1, 2016
IFRS 15 Revenue from Contracts with Customers January 1, 2018 January 1, 2018
IFRS 9 Financial Statements January 1, 2018 January 1, 2018
The effective date presented above is the date of mandatory application in annual periods beginning on or after that date.

A N N U A L R E P O R T 2 0 1 572
N o t e s C O N S O L I D A T E D F I N A N C I A L S TA T E M E N T S
C O S T O F S A L E S
Cost of sales comprises the cost of the conversion of products sold as well as the purchase costs of
sold merchandise. In addition to the directly attributable material and production costs, it also includes
indirect production-related overheads like production and purchase management, warranty expenses,
depreciation on production plants and amortization of intangible assets. Cost of sales also includes
write-downs on inventories to the lower net realizable value.
R E S E A R C H E X P E N S E S A N D N O N - C A P I TA L I Z E D D E V E L O P M E N T E X P E N S E S
Research expenses and non-capitalized development expenses are recognized in profit or loss when
incurred.
S E L L I N G E X P E N S E S
Selling expenses include sales personnel costs and operating sales costs such as for marketing. Ship-
ping and handling costs are expensed within selling expenses when incurred. Fees charged to custom-
ers are shown as sales. Advertising costs (expenses for advertising, sales promotion and other sales-
related activities) are expensed within selling expenses when incurred.
B O R R OW I N G C O S T S
Borrowing costs are expensed as incurred, unless they are directly attributable to the acquisition, con-
struction or production of a qualifying asset and therefore form part of the cost of that asset.
I N T E R E S T I N C O M E A N D E X P E N S E
The interest income and expense include the interest expenses from liabilities and the interest income
from the investment of cash. The interest components from defined benefit pension plans and similar
obligations are reported under the personnel expenses.
OT H E R F I N A N C I A L I N C O M E A N D E X P E N S E
The other financial result includes all remaining expenses and income from financial transactions that
are not included in the interest result.
I N C O M E TA X E S
Current income tax assets and liabilities for the current and prior periods are measured at the amount
expected to be recovered from or paid to the taxation authorities. Income tax expenses represent the
sum of taxes currently payable and deferred taxes. The tax currently payable is based on taxable profit
for the period. Taxable profit differs from profit as reported in the consolidated statement of compre-
hensive income because it excludes items of income or expense that are taxable or deductible in other
years and it further excludes items that are never taxable or deductible. The Group’s liability for current
tax is calculated using tax rates that have been enacted by the balance sheet date.

A N N U A L R E P O R T 2 0 1 5 73
N o t e sC O N S O L I D A T E D F I N A N C I A L S TA T E M E N T S
In accordance with IAS 12 deferred taxes are recognized on temporary differences between the carry-
ing amounts and the corresponding tax base of assets and liabilities used in the computation of taxable
income. Deferred tax assets are generally recognized for all deductible temporary differences to the
extent that it is probable that taxable profits will be available against which those deductible tempo-
rary differences can be utilized. Deferred tax assets and deferred tax liabilities are not recognized if the
temporary difference arises from goodwill or from the initial recognition (other than in a business com-
bination) of other assets and liabilities in a transaction that affects neither the taxable profit nor the
accounting profit. Deferred tax assets on tax loss carry-forwards are only recognized if there is sufficient
probability that the tax reductions resulting from them will actually occur. The carrying amount of
deferred tax assets is reviewed at each balance sheet date and reduced to the extent that it is no longer
probable that sufficient taxable profits will be available to allow all or part of the asset to be recov-
ered. Deferred tax assets and liabilities are measured at the tax rates that are expected to apply in the
period in which the liability is settled or the asset realized, based on tax rates (and tax laws) that have
been enacted or substantively enacted by the balance sheet date. The measurement of deferred tax
liabilities and assets reflects the tax consequences that would follow from the manner in which the
Group expects, at the reporting date, to recover or settle the carrying amount of its assets and liabili-
ties. Deferred tax assets and liabilities are offset when there is a legally enforceable right to set off current
tax assets against current tax liabilities and when they relate to income taxes levied by the same taxation
authority and the Group intends to settle its current tax assets and liabilities on a net basis.
G O O DW I L L
Goodwill is determined to have an indefinite useful life. After initial recognition, goodwill is measured
at cost less any accumulated impairment losses. In accordance with IAS 36, the Group tests the
goodwill for impairment by comparing its recoverable amount with its carrying amount annually,
and whenever there is an indication that goodwill may be impaired. For the purpose of impairment
testing goodwill acquired in a business combination is allocated at the acqusition date to the
cash-generating units (CGU) that are expected to benefit from the synergies of the combination,
irrespective of whether other assets or liabilities of the acquiree are assigned to those units. An
impairment of goodwill is recognized if the recoverable amount of the cash-generating unit is below its
carrying amount. Impairment losses are recognized in profit or loss. According to IAS 36, impairment
losses recognized for goodwill are not reversed.
Goodwill impairment is tested at the lowest level within the Group at which goodwill is being managed.
OT H E R I N TA N G I B L E A S S E T S
Purchased or internally generated intangible assets are capitalized according to IAS 38, if a future eco-
nomic benefit can be expected from the use of the asset and the costs of the asset can be determined
reliably. Intangible assets acquired separately are measured on initial recognition at cost. The cost of
intangible assets acquired in a business combination is the fair value as of the date of acquisition. Fol-
lowing initial recognition, intangible assets are carried at cost less any accumulated amortization and
any accumulated impairment losses. Internally generated intangible assets, excluding capitalized devel-
opment costs, are not capitalized and expenditure is reflected in profit or loss in the year in which the
expenditure is incurred.

A N N U A L R E P O R T 2 0 1 574
N o t e s C O N S O L I D A T E D F I N A N C I A L S TA T E M E N T S
Intangible assets with finite useful lives are amortized on a straight-line basis over the useful eco-
nomic life and assessed for impairment whenever there is an indication that the intangible asset
may be impaired. The estimated useful life and amortization method are reviewed at the end of each
annual reporting period, with the effect of any changes in estimate being accounted for on a pro-
spective basis.
Gains or losses arising from derecognition of an intangible asset are measured as the difference
between the net disposal proceeds and the carrying amount of the asset and are recognized in profit
or loss when the asset is derecognized.
An internally-generated intangible asset arising from development (or from the development phase of
an internal project) is recognized if all of the following have been demonstrated: (1) the technical fea-
sibility of completing the intangible asset so that it will be available for use or sale; (2) the intention
to complete the intangible asset and use or sell it; (3) the ability to use or sell the intangible asset;
(4) how the intangible asset will generate probable future economic benefits; (5) the availability of
adequate technical, financial and other resources to complete the development and to use or sell the
intangible asset; and (6) the ability to measure reliably the expenditure attributable to the intangible
asset during its development. The amount initially recognized for internally-generated intangible assets
is the sum of the expenditures incurred from the date when the intangible asset first meets the recog-
nition criteria listed above. Where no internally-generated intangible asset can be recognized, develop-
ment cost is charged to profit or loss in the period in which it is incurred. Subsequent to initial recogni-
tion, internally-generated intangible assets are reported at cost less accumulated amortization and
accumulated impairment losses on the same basis as intangible assets acquired separately. Internal-
ly-generated intangible assets are disposed when the life time cycle of the underlying product has
ended.
The following useful lives are used in the calculation of amortization: Software (3 to 5 years), patented
technology (16 years), customer relationships (24 years), unpatented technology (6 to 10 years) and
trade names (18 years).
R E S E A R C H A N D D E V E L O P M E N T E X P E N S E S
Expenditure on research activities is recognized as an expense in the period in which it is incurred. Devel-
opment costs are capitalized at cost if the relevant recognition criteria according to IAS 38 are met.
Capitalized development costs comprise all costs directly attributable to the development process. Capi-
talized development costs are amortized systematically from the start of production over the expected
product cycle of three to fifteen years depending on the lifetime of the product.
P R O P E RT Y, P L A N T A N D E Q U I P M E N T
Property, plant and equipment is used for business purposes and is measured at cost less accumulated
depreciation and accumulated impairment losses. Such cost includes the cost of replacing part of the plant
and equipment when that cost is incurred, if the recognition criteria are met. The Group develops and
assembles various production equipment internally; the related costs are also capitalized. Depreciation
on property, plant and equipment is recorded on a straight-line basis in accordance with its utilization
A N N U A L R E P O R T 2 0 1 5 75
N o t e sC O N S O L I D A T E D F I N A N C I A L S TA T E M E N T S
and based on the useful lives of the assets. The residual values, depreciation methods and useful lives
are reviewed annually and adjusted, if necessary. Property in the course of construction for production,
rental or administrative purposes is carried at cost, less any recognized impairment loss. Depreciation
of these assets, on the same basis as other property assets, commences when the assets are ready for
their intended use. Fixtures and equipment are stated at cost less accumulated depreciation and any
accumulated impairment losses. The gain or loss arising on the disposal or retirement of an item of prop-
erty, plant and equipment is determined as the difference between the sales proceeds and the carrying
amount of the asset and is recognized in profit or loss.
The Stabilus Group recognizes government grants when there is reasonable assurance that the condi-
tions attached to the grants are complied with and the grants will be received. Government grants
awarded for the purchase or the production of fixed assets are generally offset against the acquisition
or production costs of the respective assets so that the grant is recognized in profit or loss over the life
of the asset through a reduced depreciation expense.
Systematic depreciation is primarily based on the following useful lives: Buildings (40 years), machinery
and equipment (5 to 10 years) and other equipment (5 to 8 years).
L E A S I N G
Leases comprise all arrangements that transfer the right to use a specified asset for a stated period of
time in return for a payment, even if the right to use that asset is not explicitly described in an arrange-
ment. Leases are classified as either finance or operating. In accordance with the regulations under IAS 17
on accounting for leases, economic ownership is attributed to the lessee if it bears substantially all of the
risks and rewards associated with ownership (finance lease). If the criteria for a finance lease are fulfilled,
assets and liabilities are recognized at the commencement of a lease term at fair value or the lower present
value of the minimum lease payments. Assets are depreciated on a straight-line basis over the estimated
useful life of the asset or shorter term of the lease. The discounted payment obligations resulting from the
future leasing instalments are recognized under other current and non-current liabilities.
Lease payments resulting from finance leases are divided into principal payments and interest pay-
ments. Lease and rent payments resulting from operating leases are recognized as an expense in the
consolidated statement of comprehensive income. Future burdens under operating lease relation-
ships are disclosed under other financial obligations. Operating lease payments are recognized as an
expense in profit or loss on a straight-line basis over the lease term. Operating leases refer to the
leasing of office equipment.
I M PA I R M E N T O F N O N - F I N A N C I A L A S S E T S
Stabilus assesses at each reporting date whether there are indications that an asset may be impaired.
If such indications exist or if annual impairment testing is required (for instance, for goodwill and
development cost unter construction), Stabilus estimates the recoverable amount of the asset. The recov-
erable amount is determined for each individual asset, unless an asset generates cash inflows that are
not largely independent of those from other assets or groups of assets (cash-generating units). The
recoverable amount is the higher of its fair value less cost of disposal and its value in use. Stabilus

A N N U A L R E P O R T 2 0 1 576
N o t e s C O N S O L I D A T E D F I N A N C I A L S TA T E M E N T S
determines the recoverable amount as fair value less cost of disposal and compares this with the carry-
ing amounts (including goodwill). The fair value is measured by discounting future cash flows using a
risk-adjusted interest rate. The future cash flows are estimated on the basis of the operative planning
(five-year-window). Periods not included in the business plans are taken into account by applying a
residual value which considers a growth rate of 1.0%. If the fair value less cost of disposal cannot be
determined or is lower than the carrying amount, the value in use is calculated. If the carrying amount
exceeds the recoverable amount, an impairment loss is recognized in the amount of the difference.
The calculation of the fair value less cost of disposal and the value in use is most sensitive to the fol-
lowing assumptions: (1) Gross margins are based on average values achieved in the last two years
adopted over the budget period for anticipated efficiency improvements. (2) Discount rates reflect the
current market assessments of the risks of the cash-generating unit. The rate was estimated based on
the average percentage of a weighted average cost of capital for the industry. (3) Estimates regarding
the raw materials price developments are obtained by published indices from countries in which the
resources are mainly bought. Forecast figures (mainly in Europe and the US) and past price develop-
ments have been used as an indicator for future developments. (4) Management notices that the
Group’s position continues to strengthen, as customers shift their purchases to larger and more stable
companies. Therefore there is no need for any doubt regarding the assumption of market share.
(5) Revenue growth rates are estimated based on published industry research.
An assessment for assets other than goodwill is made at each reporting date to determine whether
there is any indication that impairment losses recognized in earlier periods no longer exist or may have
decreased. In this case, Stabilus would record a partial or entire reversal of the impairment loss.
I N V E N TO R I E S
Inventories are valued at the lower of cost and net realizable value using the average cost method.
Production costs include all direct costs of material and labor and an appropriate portion of fixed and
variable overhead expenses. Net realizable value is the estimated selling price for inventories less all
estimated costs of completion and costs necessary to make the sale. Borrowing costs for the produc-
tion period are not included. Provisions are set up on the basis of the analysis of stock moving and/or
obsolete stock.
F I N A N C I A L I N S T RU M E N T S
A financial instrument is any contract that gives rise to a financial asset of one entity and a financial
liability or an equity instrument of another entity. Financial instruments recorded as financial assets or
financial liabilities are generally reported separately. Financial instruments are recognized as soon as
the Stabilus Group becomes a party to the contractual provisions of the financial instrument. Financial
instruments comprise financial receivables or liabilities, trade accounts receivable or liabilities, cash
and cash equivalents and other financial assets or liabilities.
Financial instruments are initially measured at fair value. For the purpose of subsequent measurement,
financial instruments are allocated to one of the categories defined in IAS 39 “Financial Instruments:
Recognition and Measurement.” The measurement categories within the meaning of IAS 39 relevant
A N N U A L R E P O R T 2 0 1 5 77
N o t e sC O N S O L I D A T E D F I N A N C I A L S TA T E M E N T S
for Stabilus Group are loans and receivables, financial assets at fair value through profit or loss and
financial liabilities measured at amortized costs.
Loans and receivables
Loans and receivables are non-derivative financial assets with fixed or determinable payments that are
not quoted in an active market. Examples include trade accounts receivable and loans originated by
the Group. After initial recognition, loans and receivables are subsequently carried at amortized cost
using the effective interest method less impairment losses. Gains and losses are recognized in the con-
solidated earnings when the loans and receivables are derecognized or impaired. Interest effects from
using the effective interest method are similarly recognized in profit or loss. For the accounting of pur-
chase or sale of financial assets, Stabilus uses the settlement date. Loans and receivables bearing no or
lower interest rates compared to market rates with a maturity of more than one year are discounted.
F I N A N C I A L A S S E T S
In addition to financial instruments assigned to a measurement category, financial assets also include
cash and cash equivalents. Cash and cash equivalents consist primarily of cash on hand, cheques and
deposits at banks. The Group considers all highly liquid investments purchased with an original matu-
rity of three months or less to be cash equivalents. Cash and cash equivalents correspond with the
classification in the consolidated statement of cash flows. Interest received on these financial assets is
generally recognized in profit or loss applying the effective interest method. Dividends are recognized
in profit or loss when legal entitlement to the payment arises.
In the third quarter of fiscal year 2015 the Group started a second sale of receivables programm (for-
faiting). Trade accounts receivable amounting to €25.6 million (PY: €20.2 million) were sold to factors
as of September 30, 2015.
As of September 30, 2015 the Group does not measure any financial assets at fair value through profit
or loss (PY: €15.4 million).
I M PA I R M E N T O F F I N A N C I A L A S S E T S
At each reporting date the carrying amounts of the financial assets, except those measured at fair
value through profit or loss, are investigated to assess whether objective evidence of impairment (such
as the debtor’s inability to meet its current obligations or significant changes in the technological,
economic, legal or the market environment of the debtor) exists. For equity instruments a significant or
prolonged decline in fair value is considered to be objective evidence for impairment. Stabilus has
defined criteria for the significance and duration of a decline in fair value.
Loans and receivables
If there is objective evidence that an impairment loss on assets carried at amortized cost has been
incurred, the amount of the loss is measured as the difference between the asset’s carrying amount
and the present value of estimated future cash flows (excluding future expected credit losses that have
not been incurred) discounted at the financial asset’s original effective interest rate (i.e. the effective
interest rate computed at initial recognition). The carrying amount of the asset is reduced through use

A N N U A L R E P O R T 2 0 1 578
N o t e s C O N S O L I D A T E D F I N A N C I A L S TA T E M E N T S
of an allowance account. The amount of the loss is recognized in profit or loss. If, in a subsequent
period, the amount of the impairment loss decreases and the decrease can be related objectively to
an event occurring after the impairment was recognized, the previously recognized impairment loss is
reversed, to the extent that the carrying value of the asset does not exceed its amortized cost at the
reversal date. Any subsequent reversal of an impairment loss is recognized in profit or loss. In relation
to trade accounts receivable, a provision for impairment is made when there is objective evidence (such
as the probability of insolvency or significant financial difficulties of the debtor) that the Group will be
unable to collect all of the amounts due under the original terms of the invoice. The carrying amount of
the receivable is reduced through use of an allowance account. Impaired debts are derecognized when
they are assessed as uncollectible.
D E R I VAT I V E F I N A N C I A L I N S T RU M E N T S
The Group does not have any derivative financial instruments apart from the derivatives which were
embedded in the bond indenture and were derecognized following the full redemption of the senior
secured notes in June 2015. Embedded derivatives are separated from the host contract, which is not
measured at fair value through profit and loss, if the economic characteristics and risks of the embedded
derivative are not closely related to the economic characteristics and risks of the host contract. Separa-
ble embedded derivatives are measured at fair value at initial recognition and at each subsequent
reporting date. The fair value of embedded derivatives is calculated using a standard option pricing
model. For the valuation, the credit spread used is calibrated such that the model reproduces the current
market price quoted on the Luxembourg Stock Exchange (Bourse de Luxembourg) at the respective valu-
ation date. Derivatives are presented as assets if their fair value is positive and as liabilities if the fair
value is negative. Following initial recognition, changes in the fair value of derivative financial instru-
ments are recognized in profit and loss.
F I N A N C I A L L I A B I L I T I E S A N D E Q U I T Y I N S T RU M E N T S
Debt and equity instruments are classified as either financial liabilities or as equity in accordance with
the substance of the contractual arrangement.
E Q U I T Y I N S T RU M E N T S
An equity instrument is any contract that evidences a residual interest in the assets of an entity after
deducting all of its liabilities. Equity instruments are recorded at the proceeds received, net of direct
issue costs.
F I N A N C I A L L I A B I L I T I E S
Financial liabilities primarily include a senior facility (prior year: notes), trade accounts payable and
other financial liabilities.
Financial liabilities measured at amortized cost
Financial liabilities measured at amortized cost include senior facilities.

A N N U A L R E P O R T 2 0 1 5 79
N o t e sC O N S O L I D A T E D F I N A N C I A L S TA T E M E N T S
After initial recognition the financial liabilities are subsequently measured at amortized cost applying
the effective interest method. Gains and losses are recognized in profit or loss when the liabilities are
derecognized as well as through the amortization process.
Financial liabilities at fair value through profit or loss
As of September 30, 2015 and 2014 the Group does not measure any financial liabilities at fair value
through profit or loss.
P E N S I O N S A N D S I M I L A R O B L I G AT I O N S
The contributions to our pension plans are recognized as an expense when the entity consumes the
economic benefits arising from the services provided by the employees in exchange for employee bene-
fits. For defined benefit pension plans the projected unit credit method is used to determine the present
value of a defined benefit obligation, the current service cost and any past service cost.
For the valuation of defined benefit plans, differences between actuarial assumptions used and actual
developments as well as changes in actuarial assumptions result in actuarial gains and losses, which have
a direct impact on the consolidated statement of financial position and on other comprehensive income.
OT H E R P R OV I S I O N S
Provisions are recognized when the Group has a present obligation (legal or constructive) as a result of
a past event, it is probable that the Group will be required to settle the obligation, and a reliable esti-
mate can be made of the amount of the obligation. All cost elements that are relevant flow into the
measurement of other provisions - in particular those for warranties and potential losses on pending
transactions. Non-current provisions with a residual term of more than one year are recognized at bal-
ance sheet date with their discounted settlement amount. The amount recognized as a provision is the
best estimate of the consideration required to settle the present obligation at the balance sheet date,
taking into account the risks and uncertainties surrounding the obligation. Where a provision is measured
using the cash flows estimated to settle the obligation, its carrying amount is the present value of
those cash flows. When some or all of the economic benefits required to settle a provision are expected
to be recovered from a third party, the receivable is recognized as an asset if it is virtually certain that
reimbursement will be received and the amount of the receivable can be measured reliably.
A restructuring provision is recognized when the Group has developed a detailed formal plan for the
restructuring and has raised a valid expectation in those affected that it will carry out the restructuring
by starting to implement the plan or announcing its main features to those affected by it. The measure-
ment of a restructuring provision includes only the direct expenditures arising from the restructuring,
which are those amounts that are both necessarily entailed by the restructuring and not associated
with the ongoing activities of the entity.
Termination benefits are granted if an employee is terminated before the normal retirement age or if
an employee leaves the company voluntarily in return for the payment of a termination benefit. The
Group records termination benefits if it is demonstrably committed, without realistic possibility of with-

A N N U A L R E P O R T 2 0 1 580
N o t e s C O N S O L I D A T E D F I N A N C I A L S TA T E M E N T S
drawal, to a formal detailed plan to terminate the employment of current employees or if it is demon-
strably committed to pay termination benefits if employees leave the company voluntarily.
Provisions for warranties are recognized at the date of sale of the relevant products, at the manage-
ment’s best estimate of the expenditure required to settle the Group’s obligation.
4 Revenue
The Group’s revenue developed as follows:
Group revenue results from sales of goods.
Revenue by region (location of Stabilus company) T _ 020
Year ended Sept 30,
I N € T H O U S A N D S 2015 2014
Europe 308,474 267,271
NAFTA 229,285 176,817
Asia / Pacific and Rest of World 73,512 63,245
Revenue 611,271 507,333
Revenue by markets T _ 021
Year ended Sept 30,
I N € T H O U S A N D S 2015 2014
Automotive 434,212 340,804
Gas Spring 294,400 255,023
Powerise 139,812 85,781
Industrial 149,321 142,279
Swivel Chair 27,738 24,250
Revenue 611,271 507,333

A N N U A L R E P O R T 2 0 1 5 81
N o t e sC O N S O L I D A T E D F I N A N C I A L S TA T E M E N T S
5 Cost of sales, research and development, sell ing and administrative expenses
Selling expenses include shipping and handling cost amounting to €20,991 thousand (PY: €18,122
thousand). Other expenses exclude recharges to other functions. Administrative personnel expenses
include all Koblenz second level managers, as well as all functional heads globally.
The expense items in the statement of comprehensive income include following personnel expenses.
Expenses by function T _ 022
Year ended Sept 30, 2015
I N € T H O U S A N D S Cost of sales
Research & development
expenses Selling expensesAdministrative
expenses Total
Capitalized development cost – 13,475 – – 13,475
Personnel expenses (119,966) (14,278) (14,869) (29,288) (178,401)
Material expenses (299,844) (4,384) (9,199) (2,479) (315,906)
Depreciation and amortization (incl. impairment losses) (27,084) (11,280) (3,820) (1,629) (43,813)
Other (16,700) (7,751) (16,207) 6,067 (34,591)
Total (463,594) (24,218) (44,095) (27,329) (559,236)
Year ended Sept 30, 2014
I N € T H O U S A N D S Cost of sales
Research & development
expenses Selling expensesAdministrative
expenses Total
Capitalized development cost – 12,899 – – 12,899
Personnel expenses (107,093) (12,374) (12,745) (18,908) (151,120)
Material expenses (239,206) (4,769) (7,663) (2,255) (253,893)
Depreciation and amortization (incl. impairment losses) (25,012) (9,750) (3,826) (1,522) (40,110)
Other (16,426) (6,297) (14,469) (9,878) (47,070)
Total (387,737) (20,291) (38,703) (32,563) (479,294)
Personnel expenses T _ 023
Year ended Sept 30,
I N € T H O U S A N D S 2015 2014
Wages and salaries (123,993) (105,683)
Compulsory social security contributions (32,637) (28,360)
Pension cost (15,183) (13,423)
Other social benefits (6,588) (3,654)
Personnel expenses (178,401) (151,120)
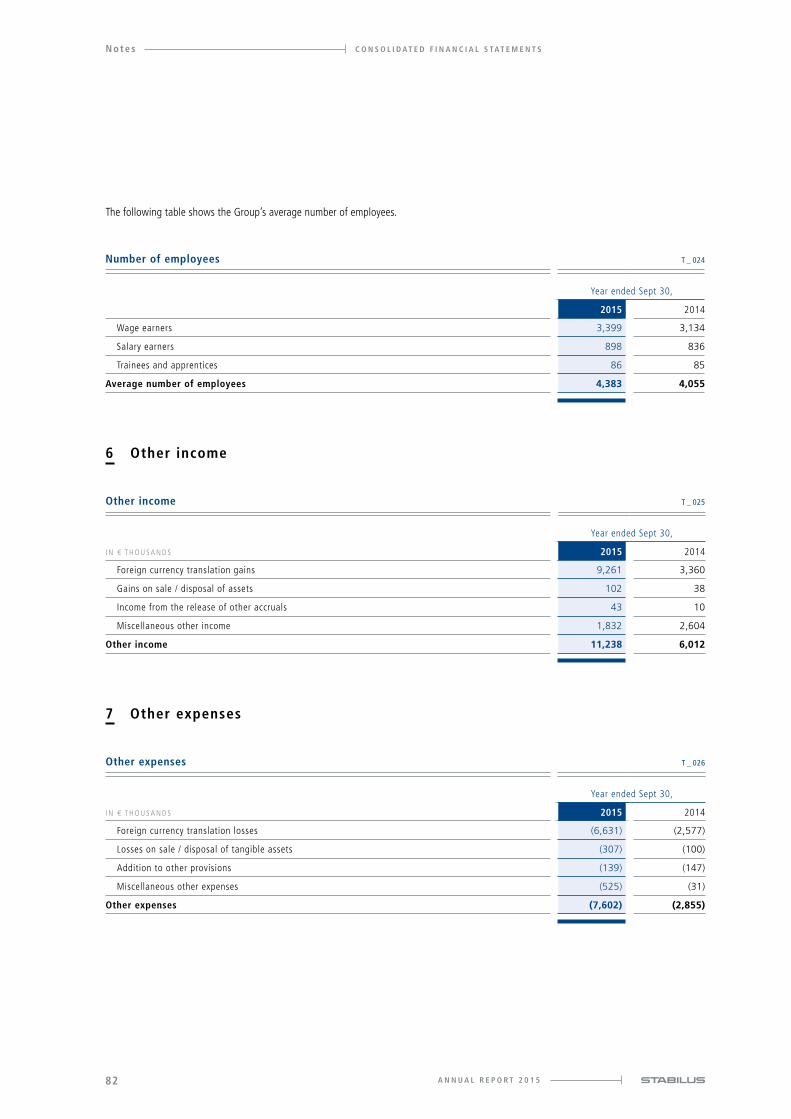
A N N U A L R E P O R T 2 0 1 582
N o t e s C O N S O L I D A T E D F I N A N C I A L S TA T E M E N T S
6 Other income
The following table shows the Group’s average number of employees.
7 Other expenses
Number of employees T _ 024
Year ended Sept 30,
2015 2014
Wage earners 3,399 3,134
Salary earners 898 836
Trainees and apprentices 86 85
Average number of employees 4,383 4,055
Other income T _ 025
Year ended Sept 30,
I N € T H O U S A N D S 2015 2014
Foreign currency translation gains 9,261 3,360
Gains on sale / disposal of assets 102 38
Income from the release of other accruals 43 10
Miscellaneous other income 1,832 2,604
Other income 11,238 6,012
Other expenses T _ 026
Year ended Sept 30,
I N € T H O U S A N D S 2015 2014
Foreign currency translation losses (6,631) (2,577)
Losses on sale / disposal of tangible assets (307) (100)
Addition to other provisions (139) (147)
Miscellaneous other expenses (525) (31)
Other expenses (7,602) (2,855)
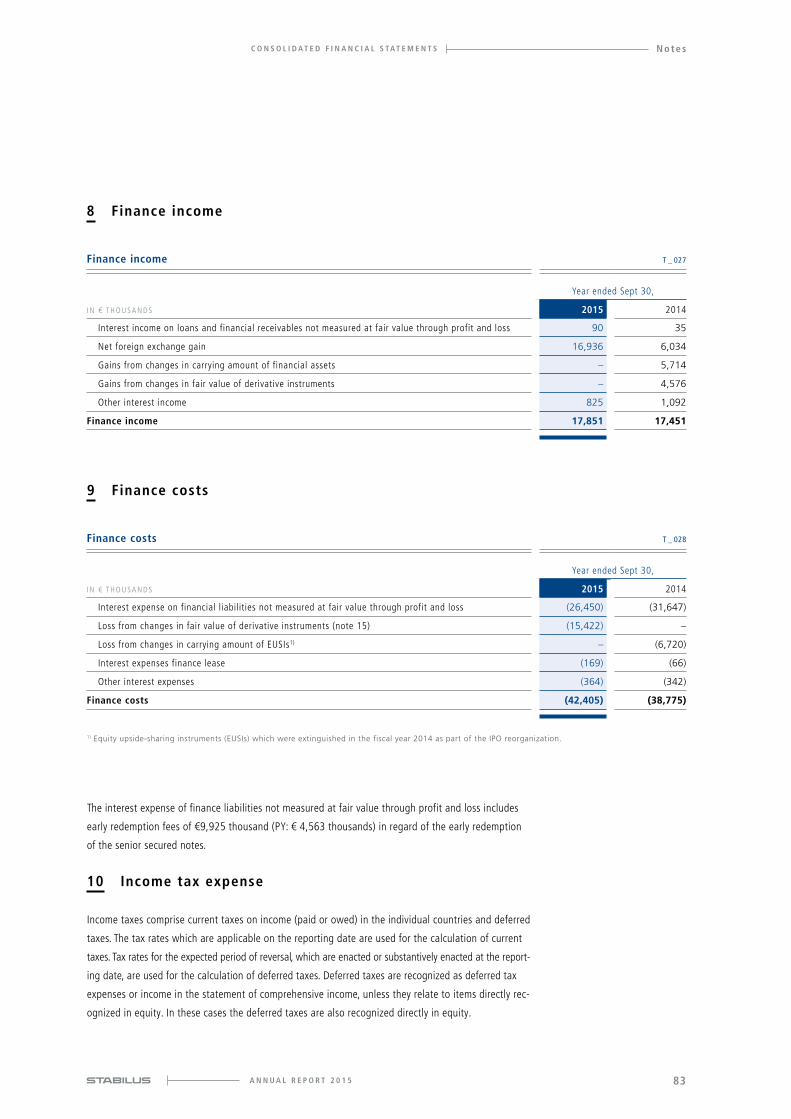
A N N U A L R E P O R T 2 0 1 5 83
N o t e sC O N S O L I D A T E D F I N A N C I A L S TA T E M E N T S
8 Finance income
9 Finance costs
The interest expense of finance liabilities not measured at fair value through profit and loss includes
early redemption fees of €9,925 thousand (PY: € 4,563 thousands) in regard of the early redemption
of the senior secured notes.
10 Income tax expense
Income taxes comprise current taxes on income (paid or owed) in the individual countries and deferred
taxes. The tax rates which are applicable on the reporting date are used for the calculation of current
taxes. Tax rates for the expected period of reversal, which are enacted or substantively enacted at the report-
ing date, are used for the calculation of deferred taxes. Deferred taxes are recognized as deferred tax
expenses or income in the statement of comprehensive income, unless they relate to items directly rec-
ognized in equity. In these cases the deferred taxes are also recognized directly in equity.
Finance income T _ 027
Year ended Sept 30,
I N € T H O U S A N D S 2015 2014
Interest income on loans and financial receivables not measured at fair value through profit and loss 90 35
Net foreign exchange gain 16,936 6,034
Gains from changes in carrying amount of financial assets – 5,714
Gains from changes in fair value of derivative instruments – 4,576
Other interest income 825 1,092
Finance income 17,851 17,451
Finance costs T _ 028
Year ended Sept 30,
I N € T H O U S A N D S 2015 2014
Interest expense on financial liabilities not measured at fair value through profit and loss (26,450) (31,647)
Loss from changes in fair value of derivative instruments (note 15) (15,422) –
Loss from changes in carrying amount of EUSIs1) – (6,720)
Interest expenses finance lease (169) (66)
Other interest expenses (364) (342)
Finance costs (42,405) (38,775)
1) Equity upside-sharing instruments (EUSIs) which were extinguished in the fiscal year 2014 as part of the IPO reorganization.

A N N U A L R E P O R T 2 0 1 584
N o t e s C O N S O L I D A T E D F I N A N C I A L S TA T E M E N T S
The respective local rates have been used to calculate the deferred taxes. A tax rate of 30% has been
used for group purposes. The current income taxes comprise prior year taxes amounting to €1,589
thousand (PY: €495 thousand).
The actual income tax expense of €(14,120) thousand deviates in the amount of €(4,785) thousand
from the expected tax expense of €(9,335) thousand that results from applying the group income tax
rate of 30% to the annual earnings of the Group before income taxes. The €(4,785) thousand are
driven by non-tax deductible effects related to this years Group refinancing as well as a number of tax
related positions detailed in the table below.
Income tax expense T _ 029
Year ended Sept 30,
I N € T H O U S A N D S 2015 2014
Current income taxes (16,920) (10,522)
Deferred taxes 2,800 10,600
Income tax expense (14,120) 78
Tax expense reconciliation (expected to actual) T _ 030
Year ended Sept 30,
I N € T H O U S A N D S 2015 2014
Income / (loss) before income tax 31,117 9,872
Expected tax income / (expense): 30% (9,335) (2,962)
Prior year taxes 1,589 495
Tax effect of non-deductible expenses (10,231) (2,317)
Change of the valuation allowance on deferred tax assets 6,447 6,449
Tax-free income (489) –
Tax audit reserve – (460)
Non-capitalized deferred taxes on domestic losses – 44
Additions / deductions due to trade tax (703) (663)
Effect of divergent tax rates 1,919 (833)
Deductible withholding tax (1,588) –
Tax rate changes (58) –
Other tax effects (1,671) 325
Tax related deviations (4,785) 3,040
Actual income tax income / (expense) (14,120) 78
Tax charge in % 45.4% (0.8)%

A N N U A L R E P O R T 2 0 1 5 85
N o t e sC O N S O L I D A T E D F I N A N C I A L S TA T E M E N T S
The tax effect of non-deductible expenses mostly includes the effect of German and US non-deducti-
ble expenses as well some 2015 refinancing expenses. The tax effect due to non-recognition of
deferred tax assets includes the valuation allowance for the current tax loss carry-forwards. The tax
effect of non-capitalized deferred taxes on domestic losses is calculated with the local tax rates on
the basis of the negative earnings before taxes (EBTs) of the respective companies.
The deferred tax assets (DTA) and deferred tax liabilities (DTL) in respect of each type of the temporary
difference and each type of unused tax losses are as follows:
Deferred tax assets and deferred tax liabilities have been offset if they relate to income taxes levied by
the same tax authorities and if there is a right to offset current tax assets against current tax liabilities.
As of September 30, 2015, the Group has unused tax loss carry-forwards (including German interest
loss carry fowards) of €96,045 thousand (PY: €34,545 thousand excluding German interest loss
carry fowards).
Deferred tax assets and liabilities T _ 031
Sept 30, 2015 Sept 30, 2014
I N € T H O U S A N D S DTA DTL Total DTA DTL Total
Intangible assets 111 (49,874) (49,763) 188 (50,925) (50,737)
Property, plant & equipment 2,625 (7,257) (4,632) 3,166 (8,786) (5,620)
Inventories 1,109 (45) 1,064 329 (999) (670)
Receivables 471 (3,197) (2,726) 236 (808) (572)
Other assets 31 (300) (269) 39 (134) (95)
Provisions and liabilities 11,010 (5,881) 5,129 10,130 (4,458) 5,672
Tax and interest losses 17,150 – 17,150 16,176 – 16,176
Subtotal 32,507 (66,554) (34,047) 30,264 (66,110) (35,846)
Netting (27,578) 27,578 – (22,345) 22,345 –
Total 4,929 (38,976) (34,047) 7,919 (43,765) (35,846)

A N N U A L R E P O R T 2 0 1 586
N o t e s C O N S O L I D A T E D F I N A N C I A L S TA T E M E N T S
The following table provides a detailed overview of the tax loss and interest carry-forwards and the
expiration dates.
The prior year information in table T_032 was adjusted by the information for the German interst carry-
forward (*), which was not included in the prior year report in this table. The interest carry-forward
amounts to €83,405 thousand with a gross deferred tax asset of €25,171 thousand of which a deferred
tax assets of €11,638 thousand was shown in the balance sheet.
The unused tax loss carry-forward comprises €12,952 thousand relating to corporate tax and trade tax.
The interest carry forward amounts to €83,093 thousand. The amount recognized as a deferred tax
asset is calculated under consideration of the actual corporate planning and its utilization within the
planning period.
Interest carry-forwards in USA and Luxembourg are not considered, as it is not likely that these carry-
forwards will be utilized.
Tax loss and interest carry-forwards T _ 032
Year ended Sept 30, 2015
I N € T H O U S A N D S
Tax loss and interest
carry-forward Tax rateDeferred tax asset (gross)
Valuation allowance
Deferred tax asset (net) Expiration date
Germany 74,393 27.0% – 30.0% 20,149 (5,566) 14,583 Indefinite
Spain 5,611 28.0% 1,571 (1,571) – Indefinite
Romania 16,041 16.0% 2,567 – 2,567 Within 5 years
Total 96,045 24,287 (7,137) 17,150
Year ended Sept 30, 2014
I N € T H O U S A N D S
Tax loss and interest
carry-forward Tax rateDeferred tax asset (gross)
Valuation allowance
Deferred tax asset (net) Expiration date
Germany* 85,364 30.2% 25,763 (14,125) 11,638 Indefinite
Spain 4,226 28.0% 1,183 (1,183) – Indefinite
Romania 28,360 16.0% 4,538 – 4,538 Within 5 years
Total 117,950 31,484 (15,308) 16,176

A N N U A L R E P O R T 2 0 1 5 87
N o t e sC O N S O L I D A T E D F I N A N C I A L S TA T E M E N T S
11 Earnings per share
The weighted average number of shares used for the calculation of earnings per share in the fiscal
years ended September 30, 2015 and 2014 is set out in the following table.
The earnings per share for the fiscal years ended September 30, 2015 and 2014 were as follows:
Basic and diluted earnings per share are calculated by dividing the profit attributable to the shareholders
of the Company by the weighted average number of shares outstanding.
Weighted average number of shares T _ 033
D AT E Number of days Transaction Change Total sharesTotal shares
(time-weighted)
September 30, 2013 17,700,000 17,700,000
October 1, 2013 238 17,700,000 11,541,370
May 27, 2014 127 Capital increase 3,023,256 20,723,256 7,210,558
September 30, 2014 20,723,256 18,751,927
October 1, 2014 365 20,723,256 20,723,256
September 30, 2015 20,723,256 20,723,256
Earnings per share T _ 034
Year ended Sept 30,
2015 2014
Profit / (loss) attributable to shareholders of the parent (in € thousands) 16,950 10,086
Weighted average number of shares 20,723,256 18,751,927
Earnings per share (in €) 0.82 0.54
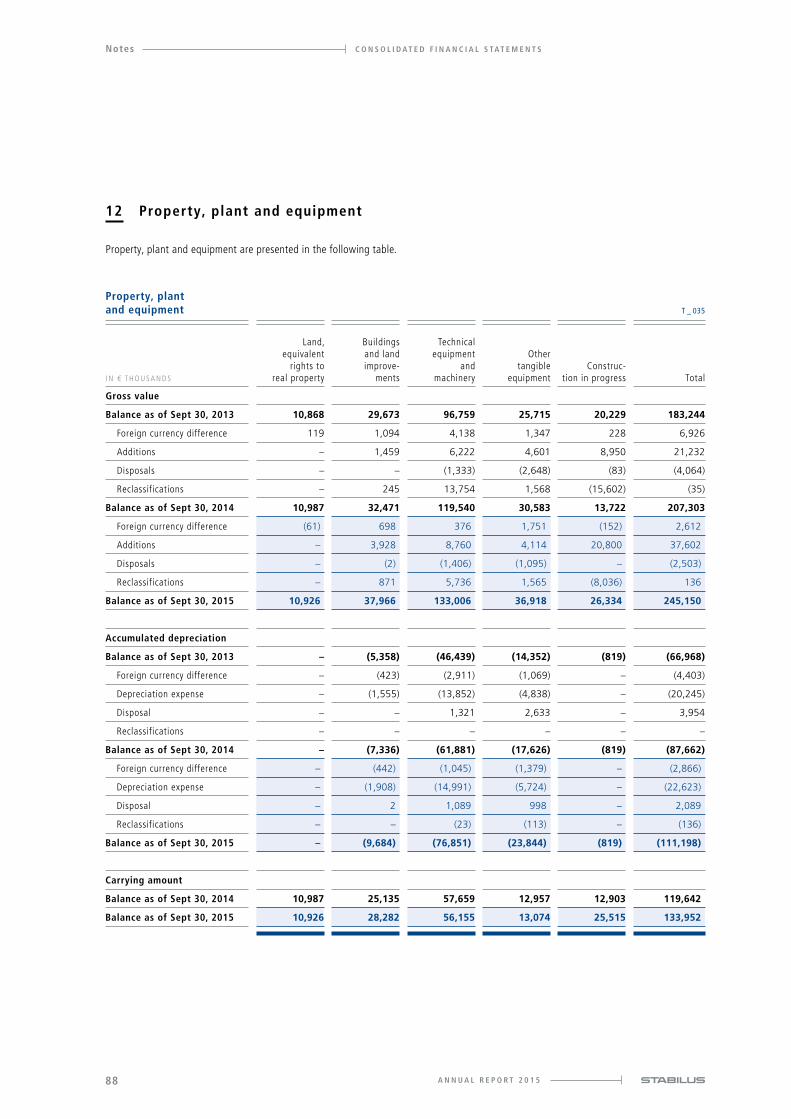
A N N U A L R E P O R T 2 0 1 588
Notes C O N S O L I D A T E D F I N A N C I A L S TA T E M E N T S
NOTES
12 Property, plant and equipment
Property, plant and equipment are presented in the following table.
Property, plant and equipment T _ 035
I N € T H O U S A N D S
Land, equivalent
rights to real property
Buildings and land improve-
ments
Technical equipment
and machinery
Other tangible
equipmentConstruc-
tion in progress Total
Gross value
Balance as of Sept 30, 2013 10,868 29,673 96,759 25,715 20,229 183,244
Foreign currency difference 119 1,094 4,138 1,347 228 6,926
Additions – 1,459 6,222 4,601 8,950 21,232
Disposals – – (1,333) (2,648) (83) (4,064)
Reclassifications – 245 13,754 1,568 (15,602) (35)
Balance as of Sept 30, 2014 10,987 32,471 119,540 30,583 13,722 207,303
Foreign currency difference (61) 698 376 1,751 (152) 2,612
Additions – 3,928 8,760 4,114 20,800 37,602
Disposals – (2) (1,406) (1,095) – (2,503)
Reclassifications – 871 5,736 1,565 (8,036) 136
Balance as of Sept 30, 2015 10,926 37,966 133,006 36,918 26,334 245,150
Accumulated depreciation
Balance as of Sept 30, 2013 – (5,358) (46,439) (14,352) (819) (66,968)
Foreign currency difference – (423) (2,911) (1,069) – (4,403)
Depreciation expense – (1,555) (13,852) (4,838) – (20,245)
Disposal – – 1,321 2,633 – 3,954
Reclassifications – – – – – –
Balance as of Sept 30, 2014 – (7,336) (61,881) (17,626) (819) (87,662)
Foreign currency difference – (442) (1,045) (1,379) – (2,866)
Depreciation expense – (1,908) (14,991) (5,724) – (22,623)
Disposal – 2 1,089 998 – 2,089
Reclassifications – – (23) (113) – (136)
Balance as of Sept 30, 2015 – (9,684) (76,851) (23,844) (819) (111,198)
Carrying amount
Balance as of Sept 30, 2014 10,987 25,135 57,659 12,957 12,903 119,642
Balance as of Sept 30, 2015 10,926 28,282 56,155 13,074 25,515 133,952

A N N U A L R E P O R T 2 0 1 5 89
NotesC O N S O L I D A T E D F I N A N C I A L S TA T E M E N T S
Property, plant and equipment includes assets resulting from two finance lease contracts with a carry-
ing amount of €3,312 thousand (PY: €3,197 thousand). One finance lease agreement was signed in
December 2010 by Orion Rent Imobiliare S.R.L., Bucharest, prior to the Stabilus Group taking the majority
of the company and relates to a real estate lease agreement. The second finance lease agreement
was signed in March 2015 by Stabilus Romania S.R.L. In prior year property, plant and equipment also
included a machinery lease agreement with a carrying amount of €2,059 thousand which ended
December 2014.
The property, plant and equipment include the land and building of Stabilus in Spain, where the activity
was shut down in 2011. The Company is preparing the sale of the land and building. We are currently in
the process of clarifying the local administrative requirements for the sale of the land and building, e.g.
necessary payment confirmations regarding local dues and environmental clearance. For this reason we
do not yet consider the sale as highly probable in this phase of the process. Therefore the assets are not
yet classified as assets held for sale according to IFRS 5.
In fiscal year 2015, Stabilus Group has received government grants amounting to € 805 thousand (PY: € –)
which are linked to the installation of our third powerise production line in Romania. For the entitlement
to this grant Stabilus Romania S.R.L. has to meet certain thresholds over a five year period. If such thresh-
olds were not met, the grant would have to be paid back.
Contractual commitments for the acquisition of property, plant and equipment amount to €10,576
thousand (PY: €3,755 thousand).
The total depreciation expense for tangible assets is included in the consolidated statement of compre-
hensive income in the following line items:
Prepayments by the Stabilus Group for property, plant and equipment and intangible assets of
€1,080 thousand (PY: €158 thousand) are included in other non-current assets. Larger prepayments
are typically secured by a bank guarantee or an in-depth check of the relevant supplier.
Depreciation expense for property, plant and equipment T _ 036
Year ended Sept 30,
I N € T H O U S A N D S 2015 2014
Cost of sales (20,568) (18,517)
Research and development expenses (775) (714)
Selling expenses (311) (294)
Administrative expenses (969) (720)
Depreciation expense (22,623) (20,245)

A N N U A L R E P O R T 2 0 1 590
Notes C O N S O L I D A T E D F I N A N C I A L S TA T E M E N T S
13 Goodwill
The first-time consolidation of Stable II S.à r. l., Luxembourg as of April 8, 2010, resulted in goodwill
of €51 million and the first-time consolidation of Orion Rent Imobiliare S.R.L, Bucharest, Romania
resulted in goodwill of €396 thousand. These acquisitions resulted in a total goodwill of €51,458 thou-
sand (PY: €51,458 thousand). Goodwill is allocated to the operating segments (CGUs) based on their
relative fair values. As such €27,787 thousand have been allocated to Europe, €13,379 thousand to
NAFTA and €10,292 thousand to Asia / Pacific and Rest of World (RoW).
The value in use for each cash-generating unit as the smallest identifiable group of assets that gener-
ates cash inflows that are largely independent of the cash inflows from other assets or other groups of
assets is measured by discounting the future cash flows generated from the continuing use of the unit
and was based on the following key assumptions: The underlying cash flow forecasts are based on the
five-year medium term plan (“MTP”) approved by the Management Board. The cash flow planning takes
into account price agreements based on experience and anticipated efficiency enhancements (e.g. relo-
cation from high cost to low cost countries, higher automation etc.) as well as average sales growth of
approximately 2.8% (PY: 7.8%) for Europe, 5.3% (PY: 5.3%) for NAFTA and 20.0% (PY: 20.8%) for
Asia / Pacific and RoW on compound average based on the strategic outlook leading to an average
higher growth rate for the free cash flow. The higher free cash flow growth rate is also effected by the
product mix effects and the assumed stable gross margins and improved fix costs absorption. While the
overall economic outlook is very volatile, the Group believes that its market-orientated approach and
leading edge products and services allow for some revenue growth. Cash flows after the five-year
period were extrapolated by applying a 1% (PY: 1%) growth rate. This growth rate was based on the
expected consumer price inflation for the countries included in the respective cash generating units,
adjusted for expected technological progress and efficiency gains in the overall economy. The discount
rate applied to cash flow projections is 9.1% (PY: 8.8%) for Europe, 9.1% (PY: 9.3%) for NAFTA and
8.9% (PY: 9.2%) for Asia / Pacific and RoW. The pre-tax discount rates are 12.0% (PY: 11.5%) for
Europe, 13.3% (PY: 13.6%) for NAFTA and 13.2% (PY: 12.0%) for Asia / Pacific and RoW.
The following table shows the input data to selected key figures required for the respective recoverable
amounts to equal the carrying amount. In management’s view this change is not reasonably possible.
Goodwill sensitivity analysis T _ 037
Sept 30, 2015
I N P E R C E N T
Input data required for carrying amount to equal recoverable amount
Europe NAFTAAsia / Pacific and
RoW
Base interest rate 15.0 15.5 9.2
Budgeted gross margin reduction to plan 9.4 7.5 6.9
Sustainable growth rate after 5-year period (31.7) (32.4) (9.6)

A N N U A L R E P O R T 2 0 1 5 91
NotesC O N S O L I D A T E D F I N A N C I A L S TA T E M E N T S
14 Other intangible assets
Other intangible assets are presented in the following table.
During the fiscal year, costs of €14,257 thousand (PY: €13,961 thousand) were capitalized for develop-
ment projects that were incurred in the product and material development areas. Systematic amortization of
capitalized internal development projects amounted to €9,648 thousand (PY: €8,280 thousand). The bor-
Intangible assets T _ 038
I N € T H O U S A N D S
Develop- ment cost
Develop- ment cost
under construction Software Patents
Customer relation-
shipTech-
nologyTrade name Total
Gross value
Balance as of Sept 30, 2013 52,926 22,856 3,922 1,268 83,683 58,132 13,246 236,033
Foreign currency difference 454 400 94 20 – – – 968
Additions 3,934 10,027 433 – – – – 14,394
Disposals – – (26) – – – – (26)
Reclassifications 11,583 (12,054) 479 27 – – – 35
Balance as of Sept 30, 2014 68,897 21,229 4,902 1,315 83,683 58,132 13,246 251,404
Foreign currency difference 937 874 (197) 8 – – – 1,622
Additions 3,675 10,582 1,105 3 – – – 15,365
Disposals (11,134) – (132) (8) – – – (11,274)
Reclassifications 5,453 (6,745) 1,372 (80) – – – –
Balance as of Sept 30, 2015 67,828 25,940 7,050 1,238 83,683 58,132 13,246 257,117
Accumulated amortization
Balance as of Sept 30, 2013 (22,620) – (2,703) (994) (12,204) (19,173) (2,576) (60,270)
Foreign currency difference (218) – (87) (19) – – – (324)
Amortization expense (8,280) – (1,051) (57) (3,487) (5,479) (735) (19,089)
Impairment loss (776) – – – – – – (776)
Disposals – – 26 – – – – 26
Balance as of Sept 30, 2014 (31,894) – (3,815) (1,070) (15,691) (24,652) (3,311) (80,433)
Foreign currency difference (437) – 130 71 1 – – (235)
Amortization expense (9,648) – (964) (83) (3,487) (5,478) (736) (20,396)
Impairment loss (794) – – – – – – (794)
Disposals 11,080 – 132 4 – – – 11,216
Balance as of Sept 30, 2015 (31,693) – (4,517) (1,078) (19,177) (30,130) (4,047) (90,642)
Carrying amount
Balance as of Sept 30, 2014 37,003 21,229 1,087 245 67,992 33,480 9,935 170,971
Balance as of Sept 30, 2015 36,135 25,940 2,533 160 64,506 28,002 9,199 166,475

A N N U A L R E P O R T 2 0 1 592
Notes C O N S O L I D A T E D F I N A N C I A L S TA T E M E N T S
rowing costs capitalized during the period amounted to €782 thousand (PY: €1,062 thousand). A capi-
talization rate of 11.53% (PY: 7.75%) was used to determine the amount of borrowing costs.
The total amortization expense and impairment loss for intangible assets is included in the consoli-
dated statements of comprehensive income in the following line items:
Amortization expenses on development costs include impairment losses of €794 thousand (PY: €776
thousand) due to the withdrawal of customers from the respective projects. The impairment loss is
included in the research and development expenses.
Contractual commitments for the acquisition of intangible assets amount to €873 thousand
(PY: €1,388 thousand).
15 Other financial assets
Amortization expense for intangible assets T _ 039
Year ended Sept 30,
I N € T H O U S A N D S 2015 2014
Cost of sales (6,515) (6,495)
Research and development expenses (10,506) (9,036)
Selling expenses (3,509) (3,532)
Administrative expenses (660) (802)
Amortization expense (incl. impairment loss) (21,190) (19,865)
Other financial assets T _ 040
Sept 30, 2015 Sept 30, 2014
I N € T H O U S A N D S Current Non-current Total Current Non-current Total
Derivative instruments – – – 15,422 – 15,422
Other miscellaneous 7,899 – 7,899 2,882 – 2,882
Other financial assets 7,899 – 7,899 18,304 – 18,304

A N N U A L R E P O R T 2 0 1 5 93
NotesC O N S O L I D A T E D F I N A N C I A L S TA T E M E N T S
Non-current prepayments comprise prepayments on property, plant and equipment.
17 Inventories
D E R I VAT I V E I N S T RU M E N T S
Derivative financial instruments as of September 30, 2014 comprised fair values of early redemption
options embedded in the indenture which was concluded on June 7, 2013. Due to the premature and
full redemption of senior secured notes on June 16, 2015, the embedded derivatives were derecog-
nized. The decrease in fair value of these embedded derivatives in fiscal 2015 amounting to €(15,422)
thousand is included in the Group’s income statement as finance cost. See also Note 9.
OT H E R M I S C E L L A N E O U S
Other miscellaneous financial assets as of September 30, 2015 mainly comprise assets related to the
sale of receivables program initially started in March 2014 amounting to €3,404 thousand (Sept 30,
2014: €2,882 thousand) and receivables from a warranty insurance company amounting to €3,766
thousand (Sept 30, 2014: – ).
16 Other assets
Inventories T _ 042
I N € T H O U S A N D S Sept 30, 2015 Sept 30, 2014
Raw materials and supplies 30,969 24,519
Finished products 12,151 10,455
Work in progress 10,121 8,639
Merchandise 6,542 5,927
Inventories 59,783 49,540
Other assets T _ 041
Sept 30, 2015 Sept 30, 2014
I N € T H O U S A N D S Current Non-current Total Current Non-current Total
VAT 4,239 – 4,239 2,643 – 2,643
Prepayments 1,005 1,080 2,085 1,175 158 1,333
Deferred charges 2,881 – 2,881 2,679 – 2,679
Other miscellaneous 1,968 784 2,752 2,475 944 3,419
Other assets 10,093 1,864 11,957 8,972 1,102 10,074

A N N U A L R E P O R T 2 0 1 594
Notes C O N S O L I D A T E D F I N A N C I A L S TA T E M E N T S
Inventories that are expected to be turned over within twelve months amounted to €59,783 thousand
(PY: €49,540 thousand). Write-downs on inventories to net realizable value amounted to €5,376 thou-
sand (PY: €5,705 thousand). In the reporting period raw materials, consumables and changes in
finished goods and work in progress recognized as cost of sales amounted to €299,844 thousand
(PY: €239,206 thousand).
The Stabilus Group’s prepayments for inventories amounting to €873 thousand (PY: €1,063 thousand)
are included in prepayments in other current assets.
18 Trade accounts receivable
Trade accounts receivable include the following items:
Trade accounts receivable increased in the fiscal year ended September 30, 2015 mainly due the higher
sales partly compensated by the additional sale of receivables to factors.
The Group provides credit in the normal course of business and performs ongoing credit evaluations on
certain customers’ financial condition, but generally does not require collateral to support such
receivables. The Group established an allowance for doubtful accounts based upon factors such as the
credit risk of specific customers, historical trends and other information.
The allowances for doubtful accounts developed as follows:
Allowance for doubtful accounts T _ 044
I N € T H O U S A N D S Sept 30, 2015 Sept 30, 2014
Allowance for doubtful accounts as of beginning of fiscal year (1,571) (1,586)
Foreign currency differences (24) (38)
Increase in the allowance (606) (232)
Decrease in the allowance 5 285
Allowance for doubtful accounts as of fiscal year-end (2,196) (1,571)
Trade accounts receivable T _ 043
I N € T H O U S A N D S Sept 30, 2015 Sept 30, 2014
Trade accounts receivable 65,044 58,068
Allowance for doubtful accounts (2,196) (1,571)
Trade accounts receivable 62,848 56,497
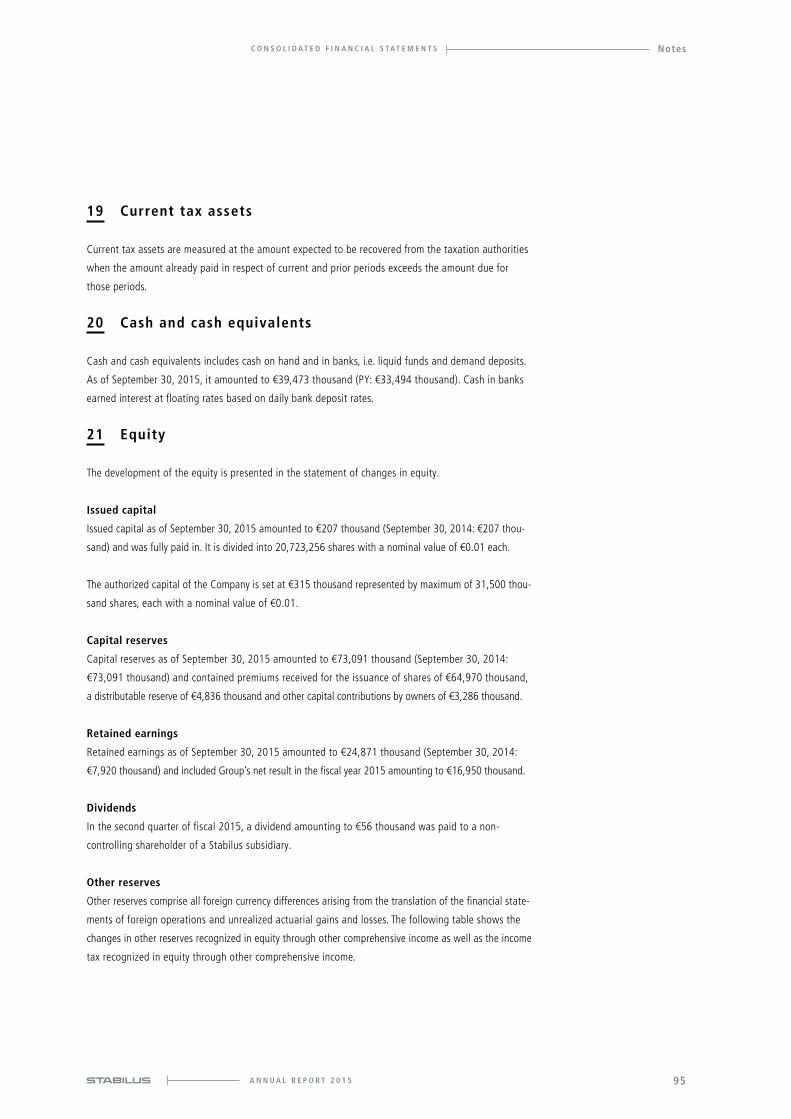
A N N U A L R E P O R T 2 0 1 5 95
NotesC O N S O L I D A T E D F I N A N C I A L S TA T E M E N T S
19 Current tax assets
Current tax assets are measured at the amount expected to be recovered from the taxation authorities
when the amount already paid in respect of current and prior periods exceeds the amount due for
those periods.
20 Cash and cash equivalents
Cash and cash equivalents includes cash on hand and in banks, i.e. liquid funds and demand deposits.
As of September 30, 2015, it amounted to €39,473 thousand (PY: €33,494 thousand). Cash in banks
earned interest at floating rates based on daily bank deposit rates.
21 Equity
The development of the equity is presented in the statement of changes in equity.
Issued capital
Issued capital as of September 30, 2015 amounted to €207 thousand (September 30, 2014: €207 thou-
sand) and was fully paid in. It is divided into 20,723,256 shares with a nominal value of €0.01 each.
The authorized capital of the Company is set at €315 thousand represented by maximum of 31,500 thou-
sand shares, each with a nominal value of €0.01.
Capital reserves
Capital reserves as of September 30, 2015 amounted to €73,091 thousand (September 30, 2014:
€73,091 thousand) and contained premiums received for the issuance of shares of €64,970 thousand,
a distributable reserve of €4,836 thousand and other capital contributions by owners of €3,286 thousand.
Retained earnings
Retained earnings as of September 30, 2015 amounted to €24,871 thousand (September 30, 2014:
€7,920 thousand) and included Group’s net result in the fiscal year 2015 amounting to €16,950 thousand.
Dividends
In the second quarter of fiscal 2015, a dividend amounting to €56 thousand was paid to a non-
controlling shareholder of a Stabilus subsidiary.
Other reserves
Other reserves comprise all foreign currency differences arising from the translation of the financial state-
ments of foreign operations and unrealized actuarial gains and losses. The following table shows the
changes in other reserves recognized in equity through other comprehensive income as well as the income
tax recognized in equity through other comprehensive income.

A N N U A L R E P O R T 2 0 1 596
Notes C O N S O L I D A T E D F I N A N C I A L S TA T E M E N T S
22 Financial l iabilities
The financial liabilities comprise following items:
On June 16, 2015, the Group refinanced the senior secured notes due in 2018 and the €25.0 million
revolving credit facility dated June 7, 2013. The senior secured notes with the outstanding principal
amount of €256,123 thousand were fully and prematurely redeemed on June 16, 2015. In accordance
to the terms of the notes issued, the nominal redemption price per redeemed note amounted to
€103,875, equaling 103.875% of the principal amount of each €100,000 note redeemed leading to an
early redemption fee of €9,925 thousands. The fair value of embedded derivatives was derecognized
accordingly. See also Note 9 and 15 above.
S E N I O R FAC I L I T I E S
On December 19, 2014, Stabilus entered into a €320 million senior facilities agreement with, among
others, Commerzbank Aktiengesellschaft, Unicredit Bank AG and Helaba Landesbank Hessen-Thüringen
Girozentrale as mandated lead arrangers, Unicredit Luxembourg S.A. as facility and security agent. The
Other comprehensive income / (expense) T_045
I N € T H O U S A N D S
Unrealized actuarial gains / (losses)
Unrealized gains / (losses)
from foreign currency translation Total
Balance as of Sept 30, 2013 (2,307) 4,044 1,737
Before tax (9,207) (422) (9,629)
Tax (expense) benefit 2,763 – 2,763
Net of tax (6,444) (422) (6,866)
Non-controlling interest – – –
Balance as of Sept 30, 2014 (8,751) 3,623 (5,128)
Before tax 50 (16,390) (16,340)
Tax (expense) benefit (16) – (16)
Net of tax 34 (16,390) (16,356)
Non-controlling interest – – –
Balance as of Sept 30, 2015 (8,717) (12,767) (21,484)
Financial liabilities T _ 046
Sept 30, 2015 Sept 30, 2014
I N € T H O U S A N D S Current Non-current Total Current Non-current Total
Notes – – – 5,789 256,556 262,345
Senior facility 5,000 258,644 263,644 – – –
Financial liabilities 5,000 258,644 263,644 5,789 256,556 262,345

A N N U A L R E P O R T 2 0 1 5 97
NotesC O N S O L I D A T E D F I N A N C I A L S TA T E M E N T S
agreement comprises a term loan facility of €270 million and a revolving credit facility of €50 million,
both maturing on June 16, 2020. The duration of the senior facilities can be extended by an additional
year, upon Company’s request until June 16, 2016 and lenders’ agreement to that request. The senior
facilities were available to the Company from June 15, 2015.
The loans carry variable interest rates depending on the net leverage ratio-related margin grid with a
margin over Euribor range between 0.85% and 3.50% per annum. Based on the company’s current
leverage level, the interest rate is 2.0% above Euribor.
The term loan facility is to be repaid in semi-annual installments (payable on March 31 and September
30) equal to €2.5 million per installment date in the first two years, €7.5 million thereafter and until
the termination date (June 16, 2020) on which the facility has to be repaid in full.
During the availability period of the revolving facility, a commitment fee of 35% of the applicable mar-
gin is payable on the last day of each successive three month period.
An ancillary facility can be made available under this senior facilities agreement, containing e.g. over-
draft facilities, guarantees, bonding, documentary or stand-by letter of credit facilities, short-term loan
facilities, derivative or foreign exchange facilities subject to the satisfaction of certain conditions.
A lender can provide all or part of its revolving facility commitment as an ancillary facility.
The senior facilities are guaranteed by Stabilus and other subsidiary guarantors defined in the agree-
ment. The agreement contains certain financial covenants, including a requirement of a maximum net
leverage ratio.
The Group’s liability under the senior term loan facility with a principal amount of €270 million was
measured at amortized cost under consideration of transaction costs.
As of September 30, 2015, the Group had no liability under the committed €50 million revolving credit
facility.
23 Other financial l iabilities
Other financial liabilities T _ 047
Sept 30, 2015 Sept 30, 2014
I N € T H O U S A N D S Current Non-current Total Current Non-current Total
Liabilities to employees 5,787 – 5,787 4,120 – 4,120
Social security contribution 1,844 – 1,844 1,701 – 1,701
Finance lease obligation 347 2,139 2,486 536 960 1,496
Liabilities to related parties – – – 3 – 3
Other financial liabilities 7,978 2,139 10,117 6,360 960 7,320

A N N U A L R E P O R T 2 0 1 598
Notes C O N S O L I D A T E D F I N A N C I A L S TA T E M E N T S
Finance lease obligation, measured as present value of future minimum lease payments, relates to a
lease contract for a real estate lease contract for a production facility in Romania.
24 Provisions
The non-current provisions developed as follows:
Provisions T _ 048
Sept 30, 2015 Sept 30, 2014
I N € T H O U S A N D S Current Non-current Total Current Non-current Total
Anniversary benefits 13 – 13 – 295 295
Early retirement contracts 659 860 1,519 – 3,372 3,372
Employee-related costs 9,082 – 9,082 3,575 – 3,575
Environmental protection 376 – 376 730 – 730
Other risks 1,035 – 1,035 578 – 578
Legal and litigation costs 90 – 90 135 – 135
Warranties 7,938 – 7,938 2,338 – 2,338
Other miscellaneous 935 172 1,107 1,195 393 1,588
Provisions 20,128 1,032 21,160 8,551 4,060 12,611
Changes of non-current provisions T _ 049
I N € T H O U S A N D S
Anniversary benefits
Early retirement
Other miscellaneous Total
Balance as of Sept 30, 2013 551 5,913 573 7,037
Foreign currency differences 1 (3) 27 25
Costs paid (237) (2,377) – (2,614)
Release to income (20) (161) (242) (423)
Additions – – 35 35
Balance as of Sept 30, 2014 295 3,372 393 4,060
Reclassifications (13) (659) (262) (934)
Foreign currency differences – – 18 18
Costs paid (208) (1,711) – (1,919)
Release to income (74) (142) – (216)
Additions – – 23 23
Balance as of Sept 30, 2015 – 860 172 1,032

A N N U A L R E P O R T 2 0 1 5 99
NotesC O N S O L I D A T E D F I N A N C I A L S TA T E M E N T S
The discount rate used for the calculation of non-current provisions as of September 30, 2015 was
0.9% (PY: range from 0.75% to 1.25%).
The development of current provisions is set out in the table below:
The provision for employee-related expenses comprises employee bonuses and termination benefits.
The provision for environmental protections measures relate to the 1985 vacated former Stabilus Inc
US site in Colmar, PE, USA at the North Penn Area 5. In the meantime this North Penn Area 5 has
been identified by the United States Environmental Protection Agency (EPA) as an area requiring envi-
ronmental remediation. In 2011 the EPA contacted seven companies in the North Penn Area 5 as
potential responsible parties for cost sharing, Stabilus being one of them. The Group is currently unable
to develop a reasonable estimate of its share of the ultimate obligation as cost apportionment method
of the EPA and Stabilus insurance reimbursement are unclear at this point in time. As such, no liability
for an EPA reimbursement has been reflected in the balance sheet as of September 30, 2015. An esti-
mated liability for long-term bioremediation has been recorded by the Group in the balance sheet as of
September 30, 2015.
The provision for other risks from purchase and sales commitments represents expected sales
discounts, expected losses from pending deliveries of goods and other sales-related liabilities.
The provision for legal and litigation costs represents costs of legal advice and notary charges as well
as the costs of litigation.
Changes of current provisions
T _ 050
I N € T H O U S A N D S
Employee- related
costs
Environ-mental
protection measures
Other risks
Legal and litigation
costs
Anniver-sary
benefitsEarly
retirement Warranties
Other miscella-
neous Total
Balance as of Sept 30, 2013 4,160 915 565 138 – – 6,057 2,073 13,908
Foreign currency differences (70) 43 30 (3) – – (103) (35) (138)
Costs paid (3,514) (228) – – – – (2,241) (2,026) (8,009)
Release to income – – (17) – – – (1,485) (14) (1,516)
Additions 2,999 – – – – – 110 1,197 4,306
Balance as of Sept 30, 2014 3,575 730 578 135 – – 2,338 1,195 8,551
Reclassifications – – – – 13 659 262 – 934
Foreign currency differences (467) 308 – (45) – – (311) (551) (1,066)
Costs paid (2,668) (662) (75) – – – (1,395) 95 (4,705)
Release to income (128) – (349) – – – (99) (98) (674)
Additions 8,770 – 881 – – – 7,143 294 17,088
Balance as of Sept 30, 2015 9,082 376 1,035 90 13 659 7,938 935 20,128

A N N U A L R E P O R T 2 0 1 5100
Notes C O N S O L I D A T E D F I N A N C I A L S TA T E M E N T S
The provision for warranties represents the accrued liability for pending risks from warranties offered
by the Group for their products. The Group issues various types of contractual warranties under which
it generally guarantees the performance of products delivered and services rendered. The Group
accrues for costs associated with product warranties at the date products are sold. This line also com-
prises accruals that are calculated for individual cases. Insurance reimbursements related to individual
cases are presented in other financial assets.
25 Pension plans and similar obligations
Liabilities for the Group’s pension benefit plans and other post-employment plans comprise the following:
D E F I N E D B E N E F I T P L A N S A N D D E F E R R E D C O M P E N S AT I O N
Defined benefit plan
The Group granted post-employment pension benefits to all employees in Germany who joined the
company prior to January 1, 2006. The level of post-employment benefits is generally based on eligible
compensation levels and / or ranking within the Group hierarchy and years of service. Liabilities for
principal pension plans amounting to €47,505 thousand (PY: €47,877 thousand) result from unfunded
accumulated benefit obligations.
As of December 21, 2010, in order to free the Group of future liquidity risks, the Group’s pension poli-
cies for Germany were amended, in which the title earned in the former defined benefit plan was fro-
zen. Going forward no additional defined benefit titles can be earned except for certain older employ-
ees. At the same time, the Company introduced a defined contribution plan in which direct payments
to an external insurer are made.
The weighted average duration of the defined benefit obligations in the fiscal year 2015 is 16.4 years
(PY: 16.8 years).
Deferred compensation
Deferred compensation included in accrued pension liabilities relates to employees of the former Atecs
Mannesmann companies. Deferred compensation is a form of retirement pay which is financed by the
employees, where, based on an agreement between the Group and the employees, part of their income
is retained by the Group and paid to the respective employees after retirement. The total deferred com-
pensation as of September 30, 2015 amounts to €484 thousand (PY: €476 thousand), the increase is
due to reduced discounting time frame.
Pension plans and similar obligations T _ 051
I N € T H O U S A N D S Sept 30, 2015 Sept 30, 2014
Principal pension plan 47,505 47,877
Deferred compensation 484 476
Pension plans and similar obligations 47,989 48,353

A N N U A L R E P O R T 2 0 1 5 101
NotesC O N S O L I D A T E D F I N A N C I A L S TA T E M E N T S
The unfunded status is as follows:
The present value of the defined benefit obligation developed as follows:
The pension cost in the consolidated statement of comprehensive income includes the following
expenses for defined benefit plans:
Unfunded status T _ 052
I N € T H O U S A N D S Sept 30, 2015 Sept 30, 2014
Present value of unfunded defined benefit obligations 47,989 48,353
Less: Fair value of plan assets – –
Unfunded status 47,989 48,353
Present value of defined benefit obligations T _ 053
Year ended Sept 30,
I N € T H O U S A N D S 2015 2014
Present value of defined benefit obligations as of beginning of fiscal year 48,353 39,123
Service cost 42 48
Interest cost 1,141 1,382
Financial assumptions 155 8,292
Experience assumptions (205) 914
Actuarial (gains) / losses (50) 9,206
Pension benefits paid (1,497) (1,406)
Present value of defined benefit obligations as of fiscal year-end 47,989 48,353
Pension cost for defined benefit plans T _ 054
Year ended Sept 30,
I N € T H O U S A N D S 2015 2014
Service cost 42 48
Interest cost 1,141 1,382
Pension cost for defined benefit plans 1,183 1,430

A N N U A L R E P O R T 2 0 1 5102
Notes C O N S O L I D A T E D F I N A N C I A L S TA T E M E N T S
The present value of the defined benefit obligation and the experience adjustments arising on the plan
liabilities are as follows:
Generally, the measurement date for Group’s pension obligations is September 30. The measurement date
for Group’s net periodic pension cost generally is the beginning of the period. Assumed discount rates,
salary increases and long-term return on plan assets vary according to the economic conditions in the
country in which the pension plan is situated.
Following assumptions (measurement factors) were used to determine the pension obligations:
The discount rates for the pension plans are determined annually as of September 30 on the basis
of first-rate, fixed-interest industrial bonds with maturities and values matching those of the pension
payments.
S E N S I T I V I T Y A N A LYS I S
If the discount rate were to differ by + 0.5% / – 0.5% from the interest rate used at the balance sheet
date, the defined benefit obligation for pension benefits would be an estimated €3,644 thousand lower
or €4,141 thousand higher. If the future pension increase used were to differ by + 0.2% / – 0.2% from
management’s estimates, the defined benefit obligation for pension benefits would be an estimated
€1,173 thousand higher or €1,131 thousand lower. The reduction / increase of the mortality rates by
2 years results in an increase / deduction of life expectancy depending on the individual age of each
Present value of the defined benefit obligation and the experience adjustments on the plan liabilities T _ 055
I N € T H O U S A N D S
Defined benefit obligation
Experience adjustments
Sept 30, 2011 33,081 (357)
Sept 30, 2012 38,066 (308)
Sept 30, 2013 39,123 (213)
Sept 30, 2014 48,353 914
Sept 30, 2015 47,989 (205)
Significant factors for the calculation of pension obligations T _ 056
I N % P. A . Sept 30, 2015 Sept 30, 2014
Discount rate 2.38% 2.40%
Inflation 1.50% 1.50%
Salary increases 0.00% 0.00%
Pension increases 1.50% 1.50%
Turnover rate 4.00% 4.00%

A N N U A L R E P O R T 2 0 1 5 103
NotesC O N S O L I D A T E D F I N A N C I A L S TA T E M E N T S
beneficiary. The effects on the defined benefit obligation (the "DBO") as of September 30, 2015 due to
a 2 year reduction / increase of the life expectancy would result in a decrease of €2,044 thousand or an
increase of €2,124 thousand.
When calculating the sensitivity of the DBO to significant actuarial assumptions, the same method
(present value of the DBO calculated with the projected unit credit method) has been applied as when
calculating the post-employment benefit obligation recognized in the Consolidated Statement of
Financial Position. Increases and decreases in the discount rate or the rate of pension progression
which are used in determining the DBO do not have a symmetrical effect on the DBO due to the com-
pound interest effect created when determining the net present value of the future benefit. If more
than one of the assumptions are changed simultaneously, the combined impact due to the changes
would not necessarily be the same as the sum of the individual effects due to the changes. If the
assumptions change at a different level, the effect on the DBO is not necessarily in a linear relation.
Expected pension benefit payments for the fiscal year 2016 will amount to €1,858 thousand
(PY: €1,764 thousand).
D E F I N E D C O N T R I BU T I O N P L A N S
The expenses incurred under defined contribution plans are primarily related to government-run
pension plans. Expenses for these plans in the reporting period amounted to €12,504 thousand
(PY: €11,856 thousand).
26 Trade accounts payable
Trade accounts payable amount to €68,929 thousand (PY: €53,724 thousand) as of the end of the
fiscal year. The full amount is due within one year. The liabilities are measured at amortized cost. For
information on liquidity and exchange rate risks for trade accounts payable, please see Note 32.
27 Current tax l iabilities
The current tax liabilities relate to income and trade taxes.

A N N U A L R E P O R T 2 0 1 5104
Notes C O N S O L I D A T E D F I N A N C I A L S TA T E M E N T S
28 Other l iabilities
The following table sets out the breakdown of Group’s other current and non-current liabilities:
29 Leasing
O P E R AT I N G L E A S E
The Group entered into non-cancellable operating leases for IT hardware, cars and other machinery
and equipment with lease terms of 2 to 6 years. The future minimum lease payments relating to leas-
ing agreements during the basic rental period when they cannot be terminated are as follows:
The increase in total minimum lease payments in the next five years is primarily due to the expansion
of the rented production facilities in China. Current period expense for operating leases amounts to
€6,159 thousand (PY: €5,205 thousand).
Other liabilities T _ 057
Sept 30, 2015 Sept 30, 2014
I N € T H O U S A N D S Current Non-current Total Current Non-current Total
Advanced payments received 1,267 576 1,843 456 – 456
Vacation expenses 2,269 – 2,269 2,169 – 2,169
Other personnel-related expenses 5,515 – 5,515 5,463 – 5,463
Outstanding costs 1,891 – 1,891 2,764 – 2,764
Miscellaneous 157 – 157 127 – 127
Other liabilities 11,099 576 11,675 10,979 – 10,979
Operating lease T _ 058
Minimum lease payments in year ended Sept 30,
I N € T H O U S A N D S 2015 2014
within one year 5,050 4,429
after one year but not more than five years 16,782 11,193
more than five years 814 205
Total 22,646 15,827

A N N U A L R E P O R T 2 0 1 5 105
NotesC O N S O L I D A T E D F I N A N C I A L S TA T E M E N T S
F I N A N C E L E A S E
As of September 30, 2015 there are two real estate lease contracts regarding a production facility in
Romania recorded as finance lease. Prior year figures also included an additional lease contract for a
production line in Germany.
Production facility:
Orion Rent Imobiliare S.R.L, Brasov, entered into a non-cancellable real estate finance lease agreement
on December 31, 2010 (prior to Stabilus Group taking over a controlling interest in this company) with
a term of 144 months prior to the Stabilus Group becoming a controlling shareholder of Orion Rent
Imobiliare S.R.L. The agreement contains a purchase option starting at the end of the third year of the
contract, for a purchase price amounting to the capital that remains to be paid up to the expiry of the
contract less early payment fee (between 2.75% and 4.75% of the remaining capital to be paid). The
net carrying amount at the balance sheet date is €1,037 thousand (PY: €1,138 thousand). The lease
term started on January 1, 2011. The leasing fees are settled in euro, but payable in new Romanian lei.
They include a variable component of the total funding cost with 3-month Euribor as the reference basis.
Stabilus Romania S.R.L. entered into a real estate lease agreement which was classified as finance
lease as of March 1, 2015. The contract has a duration of 91 months and can be extended. The con-
tract includes the extension of the existing production facility for the production of gas springs and
dampers. The underlying interest rate amounts to 2%. The net carrying amount at the balance sheet
date was €2,275 thousand.
The payments for finance leases in the fiscal year ended September 30, 2015 amounted to €1,841
thousand (PY: €1,191 thousand). No contingent rents have been recognized as an expense during
the period.
Finance lease T _ 059
Sept 30, 2015 Sept 30, 2014
I N € T H O U S A N D S
Minimum lease payments (MLP)
Present value of MLP
Minimum lease payments (MLP)
Present value of MLP
within one year 542 519 541 504
after one year but not later than five years 1,214 1,000 759 613
more than five years 1,147 909 623 404
Total 2,903 2,428 1,923 1,521

A N N U A L R E P O R T 2 0 1 5106
Notes C O N S O L I D A T E D F I N A N C I A L S TA T E M E N T S
30 Contingent l iabilities and other financial commitments
C O N T I N G E N T L I A B I L I T I E S
Contingent liabilities are uncertainties for which the outcome has not been determined. If the outcome
is probable and estimable, the liability is shown in the statement of financial position.
In regards to a potential contingent obligation in the EPA Colmar please see Note 24.
G UA R A N T E E S
On October 11, 2005, Stabilus Romania S.R.L., Brasov, (“STRO”) entered into a rental agreement with
ICCO SRL (ICCO) for a production facility used for production of gas springs and dampers with an
area of 8.400 square meters for STRO in Brasov, Romania. The initial rental agreement has a contract
period of seven years which has been extended to support production space, requirements for the trans-
fer of certain productions steps to Romania. STAB Dritte Holding GmbH, Koblenz, merged into Stable
Beteiligungs GmbH, Koblenz, a wholly owned subsidiary of the Company, issued a bank guarantee for
€600 thousand (PY: €600 thousand), in the event that STRO will be unable to pay. Stabilus GmbH,
Koblenz, issued a letter of support for the event that STRO will be unable to pay.
On September 22, 2005, Stabilus S. A. de C. V. (“STMX”) entered into a lease agreement with Deutsche
Bank Mexico, S. A., and Kimex Industrial BEN, LLC, for a production facility with an area of 28,952 square
meters of land and 5,881 square meters of construction in Ramos Arizpe, State of Coahuila, Mexico.
The lease agreement has a contract period of ten years and will be extended. Stabilus GmbH, Koblenz,
issued a letter of support for the event that STMX will be unable to pay.
The Group entered into a senior facilities agreement. The credit guarantees provided in this agreement
are full down-stream, up-stream and cross-stream given by the guarantors as defined in this agree-
ment – comprising certain material subsidiaries of the Group – in favor of the finance parties. The
guarantees are subject to limitations, including being limited to the extent that otherwise the guaran-
tee would amount to unlawful financial assistance and other jurisdiction-specific tests (e.g. net assets).
Given a normal course of the economic development as well as a normal course of business, manage-
ment believes these guaranties should not result in a material adverse effect for the Group.

A N N U A L R E P O R T 2 0 1 5 107
NotesC O N S O L I D A T E D F I N A N C I A L S TA T E M E N T S
OT H E R F I N A N C I A L C O M M I T M E N T S
The nominal value of the other financial commitments as of September 30, 2015 amounted to €34,095
thousand (PY: €20,970 thousand).
Nominal values of other financial commitments are as follows:
Financial commitments T _ 060
Sept 30, 2015
I N € T H O U S A N D S
Less than 1 year 1 to 5 years
More than 5 years Total
Capital commitments for fixed and other intangible assets 11,449 – – 11,449
Obligations under rental and leasing agreements 5,050 16,782 814 22,646
Total 16,499 16,782 814 34,095
Sept 30, 2014
I N € T H O U S A N D S
Less than 1 year 1 to 5 years
More than 5 years Total
Capital commitments for fixed and other intangible assets 5,143 – – 5,143
Obligations under rental and leasing agreements 4,429 11,193 205 15,827
Total 9,572 11,193 205 20,970

A N N U A L R E P O R T 2 0 1 5108
Notes C O N S O L I D A T E D F I N A N C I A L S TA T E M E N T S
31 Financial instruments
The following table shows the carrying amounts and fair values of the Group’s financial instruments. The fair value is the price that would
be received to sell an asset or paid to transfer a liability in an orderly transaction between market participants at the measurement date.
Financial instruments T _ 061
Sept 30, 2015 Sept 30, 2014
I N € T H O U S A N D S
Measurement category
acc. to IAS 39 Carrying amount Fair value Carrying amount Fair value
Trade accounts receivables LaR 62,848 62,848 56,497 56,497
Cash LaR 39,473 39,473 33,494 33,494
Derivative instruments FAFV – – 15,422 15,422
Other miscellaneous LaR 7,899 7,899 2,882 2,882
Other financial assets LaR / FAFV 7,899 7,899 18,304 18,304
Total financial assets 110,220 110,220 108,295 108,295
Financial liabilities FLAC 263,644 261,277 262,345 273,437
Trade accounts payable FLAC 68,929 68,929 53,724 53,724
Finance lease liabilities – 2,486 2,428 1,496 1,521
Liabilities to related parties FLAC – – 3 3
Other financial liabilities FLAC / – 2,486 2,428 1,499 1,524
Total financial liabilities 335,059 332,634 317,568 328,685
Aggregated according to categories in IAS 39:
Loans and receivables (LaR) 110,220 110,220 92,873 92,873
Financial assets at fair value through profit and loss (FAFV)
– – 15,422 15,422
Financial liabilities measured at amortized cost (FLAC)
332,573 330,206 316,072 327,164
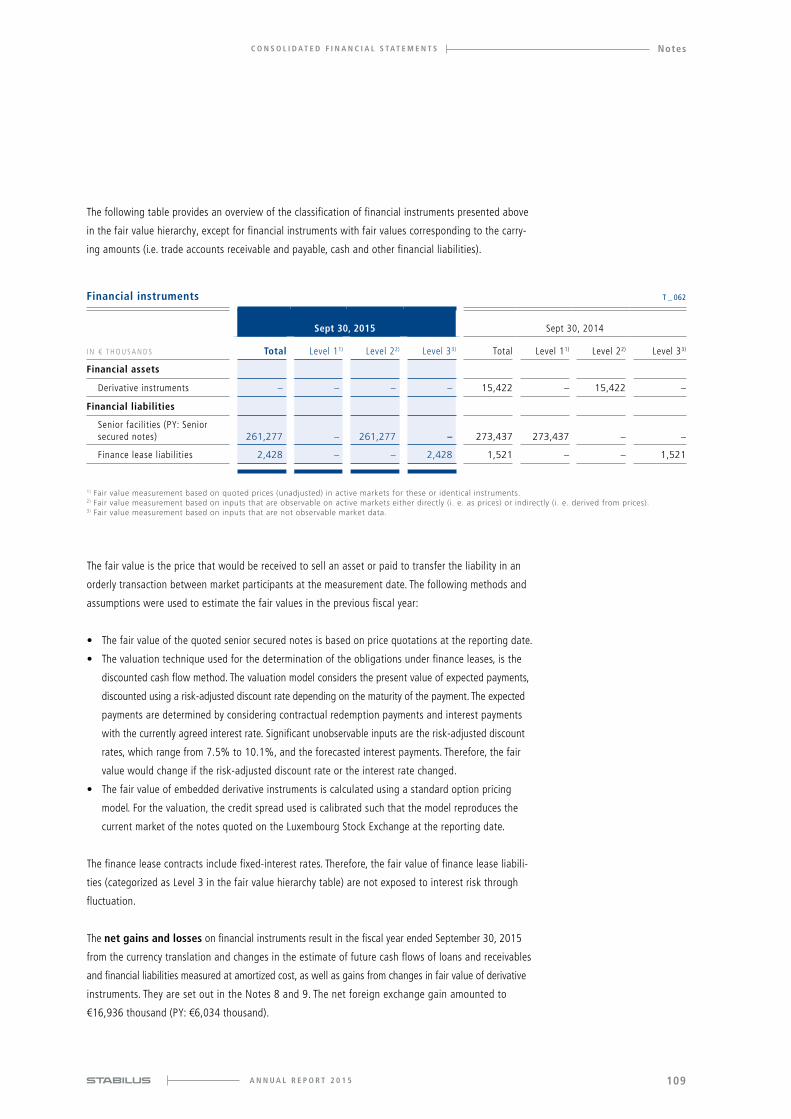
A N N U A L R E P O R T 2 0 1 5 109
NotesC O N S O L I D A T E D F I N A N C I A L S TA T E M E N T S
The following table provides an overview of the classification of financial instruments presented above
in the fair value hierarchy, except for financial instruments with fair values corresponding to the carry-
ing amounts (i.e. trade accounts receivable and payable, cash and other financial liabilities).
The fair value is the price that would be received to sell an asset or paid to transfer the liability in an
orderly transaction between market participants at the measurement date. The following methods and
assumptions were used to estimate the fair values in the previous fiscal year:
• The fair value of the quoted senior secured notes is based on price quotations at the reporting date.
• The valuation technique used for the determination of the obligations under finance leases, is the
discounted cash flow method. The valuation model considers the present value of expected payments,
discounted using a risk-adjusted discount rate depending on the maturity of the payment. The expected
payments are determined by considering contractual redemption payments and interest payments
with the currently agreed interest rate. Significant unobservable inputs are the risk-adjusted discount
rates, which range from 7.5% to 10.1%, and the forecasted interest payments. Therefore, the fair
value would change if the risk-adjusted discount rate or the interest rate changed.
• The fair value of embedded derivative instruments is calculated using a standard option pricing
model. For the valuation, the credit spread used is calibrated such that the model reproduces the
current market of the notes quoted on the Luxembourg Stock Exchange at the reporting date.
The finance lease contracts include fixed-interest rates. Therefore, the fair value of finance lease liabili-
ties (categorized as Level 3 in the fair value hierarchy table) are not exposed to interest risk through
fluctuation.
The net gains and losses on financial instruments result in the fiscal year ended September 30, 2015
from the currency translation and changes in the estimate of future cash flows of loans and receivables
and financial liabilities measured at amortized cost, as well as gains from changes in fair value of derivative
instruments. They are set out in the Notes 8 and 9. The net foreign exchange gain amounted to
€16,936 thousand (PY: €6,034 thousand).
Financial instruments T _ 062
Sept 30, 2015 Sept 30, 2014
I N € T H O U S A N D S Total Level 11) Level 22) Level 33) Total Level 11) Level 22) Level 33)
Financial assets
Derivative instruments – – – – 15,422 – 15,422 –
Financial liabilities
Senior facilities (PY: Senior secured notes) 261,277 – 261,277 – 273,437 273,437 – –
Finance lease liabilities 2,428 – – 2,428 1,521 – – 1,521
1) Fair value measurement based on quoted prices (unadjusted) in active markets for these or identical instruments.2) Fair value measurement based on inputs that are observable on active markets either directly (i. e. as prices) or indirectly (i. e. derived from prices).3) Fair value measurement based on inputs that are not observable market data.

A N N U A L R E P O R T 2 0 1 5110
Notes C O N S O L I D A T E D F I N A N C I A L S TA T E M E N T S
Total interest income and expense from financial instruments is reported in the Notes 8 and 9.
The value of the embedded derivatives was effected by the interest of the comparable market instru-
ment on each potential exercise date and will rise if the relevant interest rate declines and vice versa.
32 Risk reporting
I N T E R N A L R I S K M A N AG E M E N T
The Group employs within the budgeting process an integrated system for the early identification and
monitoring of risks specific to the Group, in order to identify changes in the business environment and
deviations from targets at an early stage and to initiate countermeasures in advance. This includes
monthly short and medium-term analysis of the order intake and the sales invoicing behavior. Control
impulses for the individual companies are derived from this. Customer behavior is ascertained and ana-
lyzed continuously and the information obtained from this serves as an early warning indicator for pos-
sible changes in demand patterns.
In addition, significant KPIs (order intake, sales and EBITDA, staffing level, quality indicators) are
reported monthly by all Group companies and are assessed by Group management.
F I N A N C I A L R I S K S
The Group’s Corporate Treasury function provides services to the business, co-ordinates access to
domestic and international financial markets, and monitors and manages the financial risks relating to
the operations of the Group. These risks include credit risk, liquidity risk and market risk (including cur-
rency risk and fair value interest rate risk).
The Group seeks to minimize the effects of financial risks by using derivative financial instruments to
hedge these exposures wherever useful. The use of financial derivatives is governed by the Group’s pol-
icies approved by the Management Board, which provide principles on foreign currency risk, interest
rate risk, credit risk, the use of financial derivatives and non-derivative financial instruments, and the
investment of excess liquidity. The Group does not enter into or trade financial instruments, including
derivative financial instruments, for speculative purposes. The Group does not have any derivative
financial instruments apart from the derivatives which were embedded in the bond indenture and were
derecognized following the full redemption of the senior secured notes in June 2015.
C R E D I T R I S K S
Credit risk refers to the risk that counterparty will default on its contractual obligations resulting in
financial loss to the Group. The Group has adopted a policy of dealing only with creditworthy counter-
parties and obtaining sufficient collateral where appropriate, as a means of mitigating the risk of
financial loss from defaults. The Group’s exposure and the credit ratings of its counterparties are moni-
tored and the aggregate value of transactions concluded is spread amongst approved counterparties.

A N N U A L R E P O R T 2 0 1 5 111
NotesC O N S O L I D A T E D F I N A N C I A L S TA T E M E N T S
Credit risk of other financial assets of the Group, which comprise cash and cash equivalents, and mis-
cellaneous financial assets, arises from default of the counterparty, with a maximum exposure equal to
the carrying amount of these instruments.
The Group does not have any critical credit risk exposure to any single counterparty or any group of
counterparties having similar characteristics. The credit risk on liquid funds is limited because the coun-
terparties are banks with high credit ratings assigned by international credit rating agencies and are
also typically lenders to the Group. Therefore, credit quality of financial assets which are neither past
due nor impaired is assessed to be good.
L I Q U I D I T Y R I S K S
The Management Board has established an appropriate liquidity risk management framework for the
management of the Group’s short, medium and long-term funding and liquidity management require-
ments. The Group manages liquidity risk by maintaining adequate reserves, banking facilities and
reserve borrowing facilities and by monitoring forecast cash flows at regular intervals.
Trade accounts receivable consist of a large number of customers, spread across diverse industries and
geographical areas. Credit evaluation is performed on the financial condition of accounts receivable
and, where viewed appropriate, credit guarantee insurance cover is purchased. Besides this, commer-
cial considerations impact the credit lines per customer.
The maximum exposure to credit risk of financial assets is the carrying amount as follows:
Credit risk included in financial assets T _ 063
Sept 30, 2015
I N € T H O U S A N D S
Neither past due nor
impaired < 30 days 30 – 60 days 60 – 90 days 90 – 360 days > 360 days Total
Financial assets
Trade accounts receivable 53,872 6,075 1,002 414 1,280 206 62,848
Other miscellaneous 7,899 – – – – – 7,899
Total 61,771 6,075 1,002 414 1,280 206 70,747
Sept 30, 2014
I N € T H O U S A N D S
Neither past due nor
impaired < 30 days 30 – 60 days 60 – 90 days 90 – 360 days > 360 days Total
Financial assets
Trade accounts receivable 48,263 5,930 729 – 1,274 301 56,497
Derivative instruments 15,422 – – – – – 15,422
Other miscellaneous 2,882 – – – – – 2,882
Total 66,567 5,930 729 – 1,274 301 74,801

A N N U A L R E P O R T 2 0 1 5112
Notes C O N S O L I D A T E D F I N A N C I A L S TA T E M E N T S
The following maturities summary shows how cash flows from the Group’s liabilities as of Septem-
ber 30, 2015 will influence its liquidity situation. The summary describes the course of the undis-
counted principal and interest outflows of the financing liabilities and the undiscounted cash outflows
of the trade accounts payable. The undiscounted cash outflows are subject to the following conditions:
If the counterparty can request payment at different dates, the liability is included on the basis of the
earliest payment date. The underlying terms and conditions are described in the Note 22.
The senior facility gives planning stability over the next years. At the balance sheet date, the Group has
undrawn committed facilities of €50.0 million (PY: €25.0 million) to reduce liquidity risks.
F I N A N C E M A R K E T R I S K S
The Group’s activities expose it primarily to the financial risks of changes in foreign currency exchange
rates (see below) and interest rates (see below). As of September 30, 2015, the Group has not entered
into any derivative financial instruments. The Group monitors closely its exposure to interest rate risk
and foreign currency risk and regularly checks the opportunities of entering into a variety of derivative
financial instruments.
Exchange rate risk
Due to its subsidiaries, the Group has significant assets and liabilities outside the Eurozone. These
assets and liabilities are denominated in local currencies. When the net asset values are converted into
euro, currency fluctuations result in period to period changes in those net asset values. The Group’s
equity position reflects these changes in net asset values. The Group does not hedge against these
structural currency risks.
The Group also has transactional currency exposures which arise from sales or purchases in currencies
other than the functional currency and loans in foreign currencies. In order to mitigate the impact of
currency exchange rate fluctuations for the operating business, the Group continually assesses its expo-
sure and attempts to balance sales revenue and costs in a currency to thus reduce the currency risk.
Besides the balance sheet the Group’s revenue and costs are also impacted by currency fluctuations.
Liquidity outflows for liabilities T _ 064
I N € T H O U S A N D S Senior facility Finance leaseTrade accounts
payable Total
2016 10,329 542 68,929 79,800
2017 15,233 320 – 15,553
2018 19,988 299 – 20,287
2019 19,688 298 – 19,986
2020 225,806 297 – 226,103
after 2020 – 1,147 – 1,147
Total 291,044 2,903 68,929 362,876
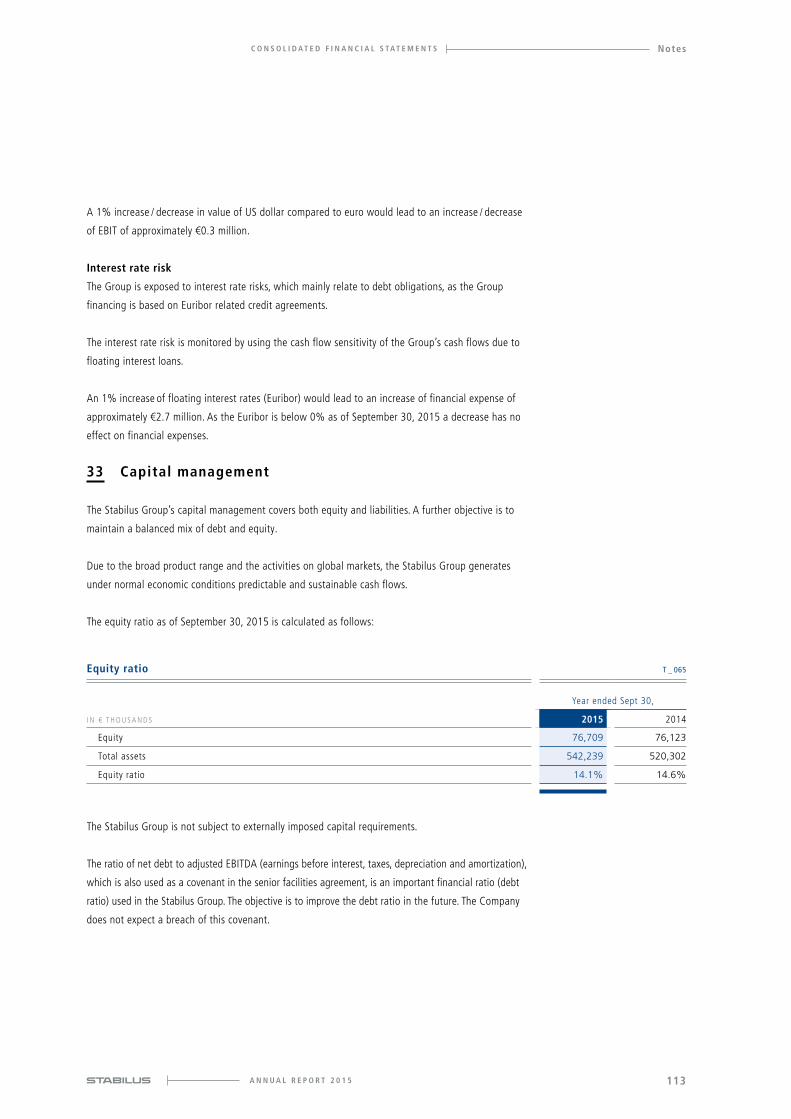
A N N U A L R E P O R T 2 0 1 5 113
NotesC O N S O L I D A T E D F I N A N C I A L S TA T E M E N T S
A 1% increase / decrease in value of US dollar compared to euro would lead to an increase / decrease
of EBIT of approximately €0.3 million.
Interest rate risk
The Group is exposed to interest rate risks, which mainly relate to debt obligations, as the Group
financing is based on Euribor related credit agreements.
The interest rate risk is monitored by using the cash flow sensitivity of the Group’s cash flows due to
floating interest loans.
An 1% increase of floating interest rates (Euribor) would lead to an increase of financial expense of
approximately €2.7 million. As the Euribor is below 0% as of September 30, 2015 a decrease has no
effect on financial expenses.
33 Capital management
The Stabilus Group’s capital management covers both equity and liabilities. A further objective is to
maintain a balanced mix of debt and equity.
Due to the broad product range and the activities on global markets, the Stabilus Group generates
under normal economic conditions predictable and sustainable cash flows.
The equity ratio as of September 30, 2015 is calculated as follows:
The Stabilus Group is not subject to externally imposed capital requirements.
The ratio of net debt to adjusted EBITDA (earnings before interest, taxes, depreciation and amortization),
which is also used as a covenant in the senior facilities agreement, is an important financial ratio (debt
ratio) used in the Stabilus Group. The objective is to improve the debt ratio in the future. The Company
does not expect a breach of this covenant.
Equity ratio T _ 065
Year ended Sept 30,
I N € T H O U S A N D S 2015 2014
Equity 76,709 76,123
Total assets 542,239 520,302
Equity ratio 14.1% 14.6%

A N N U A L R E P O R T 2 0 1 5114
Notes C O N S O L I D A T E D F I N A N C I A L S TA T E M E N T S
34 Notes to the consolidated statement of cash flows
The statement of cash flows is prepared in compliance with IAS 7. The statement of cash flows of the
Stabilus Group shows the development of the cash flows from operating, investing and financing activ-
ities. Inflows and outflows from operating activities are presented in accordance with the indirect
method and those from investing and financing activities by the direct method.
The cash funds reported in the statement of cash flows comprise all liquid funds, cash balances and
cash at banks reported in the statement of financial position.
Interest payments of €32,237 thousand (PY: €30,113 thousand) are taken into account in the cash
outflows from financing activities. Income tax payments of €17,274 thousand (PY: €7,065 thousand)
are allocated in full to the operating activities area, since allocation to individual business areas is
impracticable.
35 Segment reporting
The Stabilus Group is organized and managed primarily on a regional level. The three reportable oper-
ating segments of the Group are Europe, NAFTA and Asia / Pacific including RoW. The product portfolio
is largely similar in these three regional segments.
The Group measures the performance of its operating segments through a measure of segment profit or
loss (key performance indicator) which is referred to as “adjusted EBIT” and in the previous periods
“adjusted EBITDA”. Adjusted EBIT represents EBIT (i.e. earnings before interest and taxes), as adjusted by
management primarily in relation to severance, consulting, restructuring and other non-recurring costs,
expenses for one-time legal disputes, interest on pension changes as well as depreciation and amortiza-
tion of Group’s assets to fair value resulting from the April 2010 purchase price allocation (PPA).

A N N U A L R E P O R T 2 0 1 5 115
NotesC O N S O L I D A T E D F I N A N C I A L S TA T E M E N T S
Segment information for the fiscal years ended September 30, 2015 and 2014 is as follows:
The EBIT of operating segment Europe in the fiscal year ended September 30, 2015 includes an impair-
ment loss of €794 thousand (PY: €776 thousand). The amounts presented in the column “Other / Con-
solidation” above include the elimination of transactions between the segments and certain other cor-
porate items which are related to the Stabilus Group as a whole and are not allocated to the segments,
e.g. depreciation from purchase price allocations.
Segment reporting T _ 066
Europe NAFTA Asia / Pacific and RoW
Year ended Sept 30, Year ended Sept 30, Year ended Sept 30,
I N € T H O U S A N D S 2015 2014 2015 2014 2015 2014
External revenue1) 308,474 267,271 229,285 176,817 73,512 63,245
Intersegment revenue1) 28,293 23,480 4,649 2,519 393 123
Total revenue1) 336,767 290,751 233,934 179,336 73,905 63,368
EBITDA 55,396 39,591 31,128 20,045 12,960 11,669
Depreciation and amortization (incl. impairment losses) (21,409) (19,512) (6,509) (6,175) (3,217) (1,971)
EBIT 33,987 20,079 24,619 13,871 9,743 9,698
Adjusted EBITDA 62,484 57,542 31,608 22,813 13,235 12,130
Adjusted EBIT 41,075 38,030 25,099 16,638 10,018 10,159
Total segments Other / Consolidation Stabilus Group
Year ended Sept 30, Year ended Sept 30, Year ended Sept 30,
I N € T H O U S A N D S 2015 2014 2015 2014 2015 2014
External revenue1) 611,271 507,333 – – 611,271 507,333
Intersegment revenue1) 33,335 26,122 (33,335) (26,122) – –
Total revenue1) 644,606 533,455 (33,335) (26,122) 611,271 507,333
EBITDA 99,484 71,305 – – 99,484 71,305
Depreciation and amortization (incl. impairment losses) (31,135) (27,658) (12,678) (12,452) (43,813) (40,110)
EBIT 68,349 43,648 (12,678) (12,452) 55,671 31,196
Adjusted EBITDA 107,327 92,485 – – 107,327 92,485
Adjusted EBIT 76,192 64,827 – 227 76,192 65,054
1) Revenue breakdown by location of Stabilus company (i.e. “billed-from view”).
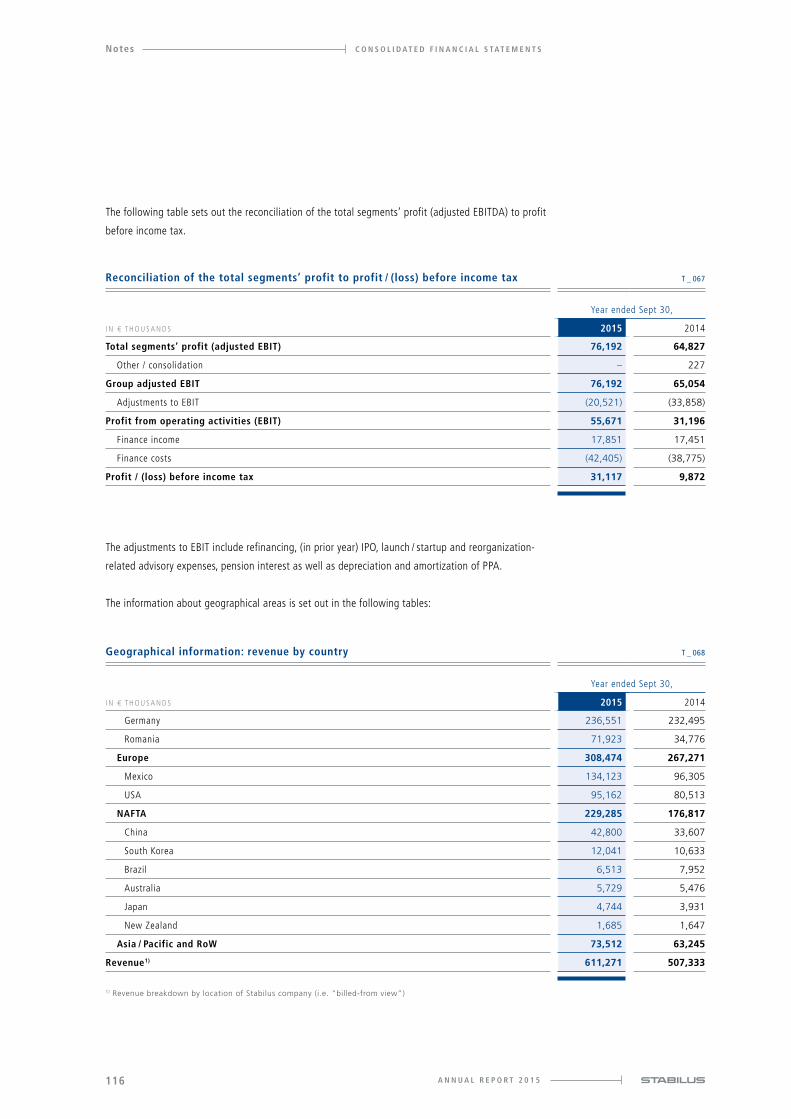
A N N U A L R E P O R T 2 0 1 5116
Notes C O N S O L I D A T E D F I N A N C I A L S TA T E M E N T S
The following table sets out the reconciliation of the total segments’ profit (adjusted EBITDA) to profit
before income tax.
The adjustments to EBIT include refinancing, (in prior year) IPO, launch / startup and reorganization-
related advisory expenses, pension interest as well as depreciation and amortization of PPA.
The information about geographical areas is set out in the following tables:
Reconciliation of the total segments’ profit to profit / (loss) before income tax T _ 067
Year ended Sept 30,
I N € T H O U S A N D S 2015 2014
Total segments’ profit (adjusted EBIT) 76,192 64,827
Other / consolidation – 227
Group adjusted EBIT 76,192 65,054
Adjustments to EBIT (20,521) (33,858)
Profit from operating activities (EBIT) 55,671 31,196
Finance income 17,851 17,451
Finance costs (42,405) (38,775)
Profit / (loss) before income tax 31,117 9,872
Geographical information: revenue by country T _ 068
Year ended Sept 30,
I N € T H O U S A N D S 2015 2014
Germany 236,551 232,495
Romania 71,923 34,776
Europe 308,474 267,271
Mexico 134,123 96,305
USA 95,162 80,513
NAFTA 229,285 176,817
China 42,800 33,607
South Korea 12,041 10,633
Brazil 6,513 7,952
Australia 5,729 5,476
Japan 4,744 3,931
New Zealand 1,685 1,647
Asia / Pacific and RoW 73,512 63,245
Revenue1) 611,271 507,333
1) Revenue breakdown by location of Stabilus company (i.e. “billed-from view”)

A N N U A L R E P O R T 2 0 1 5 117
NotesC O N S O L I D A T E D F I N A N C I A L S TA T E M E N T S
In fiscal year 2015, the Group had three customers who accounted for at least 10% of total external
revenue. The total revenue with these customers was €71,952 thousand (PY: €54,767 thousand),
€68,036 thousand (PY: €52,506 thousand) and €62,672 thousand (PY: €46,626 thousand) respectively
in the fiscal year ending September 30, 2015. In fiscal year 2015 and 2014 such revenue was generated
in all three segments.
Geographical information: non-current assets by country T _ 069
Year ended Sept 30,
I N € T H O U S A N D S 2015 2014
Germany 160,251 159,117
Romania 21,357 18,051
Spain 3,470 3,595
Luxembourg 821 873
UK 85 92
Switzerland 78 71
France 7 5
Gibraltar – –
Goodwill 27,787 27,787
Europe 213,856 209,591
USA 44,086 43,245
Mexico 26,562 27,326
Goodwill 13,379 13,379
NAFTA 84,027 83,950
China 30,277 28,193
South Korea 10,043 6,623
Brazil 2,065 2,579
Australia 1,054 1,083
Japan 503 520
New Zealand 275 342
Goodwill 10,292 10,292
Asia / Pacific and RoW 54,509 49,632
Total 352,392 343,173
The non-current assets above exclude financial instruments, deferred tax assets, post-employment benefit assets and rights arising under insurance contracts.

A N N U A L R E P O R T 2 0 1 5118
Notes C O N S O L I D A T E D F I N A N C I A L S TA T E M E N T S
36 Share-based payment
The Group established share-based payment arrangements for members of the Management Board
(Matching Stock Program) and for senior management employees (Phantom Stock Program).
Matching Stock Program
The variable compensation for the members of the Management Board includes a matching stock pro-
gram. The matching stock program (the “MSP”) provides for four annual tranches granted each year
during the time frame fiscal year ending September 30, 2015 until September 17, 2017. Participation
in the matching stock program requires Management Board members to invest in shares of the Com-
pany. The investment generally has to be held for the lock-up period.
As part of the matching stock program A (the “MSP A”) for each share the Management Board invests in
the Company in the specific year (subject to general cap), the Management Board members receive a
certain number of fictitious options to acquire shares in the Company for each tranche of the matching
stock program. The amount of stock options received depends upon a factor to be set by the Supervisory
Board (Renumeration Committee) annually in a range between 1.0 and 1.7 times for a certain tranche.
Thus, if a Management Board member were to buy 1,000 shares under the MSP in the Company, he
would receive 1,000 to 1,700 fictitious options for a certain tranche. The fictitious options are subject to
a lock-up period of four years and may be exercised during a subsequent two-year exercise period.
As part of matching stock program B (the “MSP B”) for each share the Management Board holds in
the Company in the specific year (subject to a general cap), the Management Board members receive a
certain number of fictitious options to acquire shares in the Company for each tranche of the matching
stock program. The amount of stock options received depends upon a factor to be set by the Supervi-
sory Board (Renumeration Committee) annually in a range between 0.0 and 0.3 times for a certain
tranche. Thus, if a Management Board member were to be holding 1,000 shares under the MSP in the
Company, he would receive 0 to 300 fictitious options for a certain tranche. The fictitious options are
subject to a lock-up period of four years and may be exercised during a subsequent two-year exercise
period. The options may only be exercised if the stock price of the Company exceeds a set threshold for
the relevant tranche, which the Supervisory Board will determine, and which needs to be between 10%
and 50% growth over the base price, which is the share price on the grant date. If exercised, the fictitious
options are transformed into a gross amount equaling the difference between the option price and
the relevant stock price multiplied by the number of exercised fictitious options. The generally limited
net amount resulting from the calculated gross amount is paid out to the Management Board members.
Alternatively, the Company may decide to buy shares in an amount equaling the net amount in order to
settle the exercised options. The Company plans a cash settlement. The maximum gross amounts resulting
from the exercise of the fictitious options of one tranche in general is limited in amount. Reinvestment of
IPO proceeds from previous equity programs are not taken into account for MSP A.
Phantom Stock Program
The Group initiated for 2015 and 2016 a Phantom Stock Program for senior management employees
excluding Stabilus S.A. directors. To participate in the program, the employees have to invest a certain

A N N U A L R E P O R T 2 0 1 5 119
NotesC O N S O L I D A T E D F I N A N C I A L S TA T E M E N T S
amount in Stabilus shares. The employee receives options in a ratio of two for each self-investment,
capped at an investment level of €10,000 per program year. The fictitious options are subject to a
lock-up period of four years and may be exercised during a subsequent two-year exercise period. The
exercise is triggered by the sale of the underlying shares. The payout price is triggered by the price of
the share sales in the exercise period. The payout is capped at 500% of the invested amount.
Measurement of fair values
The fair value of the share-based payments of the MSP has been measured by using a binomial simulation.
The inputs used in the measurement of the fair values at the grant date and the measurement date of the
MSP include market conditions and were as follows.
The expected volatility has been based on the historical volatility of the 3-year period to September 30,
2015. Since sufficient historical data is not available for the Stabilus shares, Stabilus decided to use
the mean value of the historical volatilities of the shares of the peer group.
In the fiscal year 2015 only options for the MSP B were issued.
Input parameter for fair value measurement of MSP T_070
Grant dateMeasurement
date
Oct 1, 2014 Sept 30, 2015
Fair value € 5.07 8.78
Share price € 24.82 32.25
Exercise price € 24.82 24.82
Expected volatility (weighted average) % 32 31
Expected life (weighted average) years 4 3
Expected dividends % 1.5 1.5
Risk-free interest rate % 0.04 (0.2)
MSP B options T_071
2015 2014
Number of options Exercise price
Number of options Exercise price
Outstanding at January 1 – – – –
Forfeit during the year – – – –
Exercised during the year – – – –
Granted during the year 19,721 24.82 – –
Outstanding at September 30 19,721 24.82 – –
Exercisable at September 30 – – – –

A N N U A L R E P O R T 2 0 1 5120
Notes C O N S O L I D A T E D F I N A N C I A L S TA T E M E N T S
The Phantom Stock Program is measured with the actual share price and accrued over the vesting time.
Expense recognized in profit or loss
An amount of €130 thousand has been recognized in the related employee benefit expenses and an
amount of €130 thousand in provisions for employee-related expenses.
37 Auditor’s fees
For fiscal year ended September 30, 2015, a global fee (excluding VAT) of €612 thousand (PY: 618 thou-
sand) was agreed for the audit of the consolidated and annual financial statements of the Stabilus
entities. These fees are included in the Group’s administrative expenses.
In addition, KPMG Luxembourg Société coopérative, Luxembourg, and other member firms of the
KPMG network, billed the Group audit-related fees amounting to, excluding VAT, €161 thousand
(PY: €929 thousand which relate to the initial public offering in May 2014).
Auditor’s fees T _ 073
Year ended Sept 30,
I N € T H O U S A N D S ( E X C L U D I N G VAT ) 2015 2014
Audit fees 612 618
Audit-related fees 161 929
Tax fees – –
Other fees – –
Total 772 1,547
Phantom Stock Program options T_072
2015 2014
Number of options
Exercise price
Number of options
Exercise price
Outstanding at January 1 – – – –
Forfeit during the year – – – –
Exercised during the year – – – –
Granted during the year
Program 2015 5,642 32.25 – –
Program 2016 3,217 32.25 – –
Outstanding at September 30 8,859 32.25 – –
Exercisable at September 30 – – – –

A N N U A L R E P O R T 2 0 1 5 121
NotesC O N S O L I D A T E D F I N A N C I A L S TA T E M E N T S
38 Related party relationships
In accordance with IAS 24, persons or entities that control or are controlled by the Stabilus Group shall
be disclosed, unless they are included in consolidation as a consolidated entity.
The disclosure obligation under IAS 24 furthermore extends to transactions with persons who exercise
a significant influence on the financial and business policies of the Stabilus Group, including close family
members or interposed entrepreneurs. A significant influence on the financial and business policies of
the Stabilus Group can hereby be based on a shareholding of 20% or more in Stabilus, a seat on the
Management Board of Stabilus or another key position.
Following the IPO on May 23, 2014, the shareholder structure of Stabilus changed. Related parties of the
Stabilus Group in accordance with IAS 24 primarily comprise the prior to the IPO sole shareholder Servus
Group HoldCo II and the Stabilus Group management which also holds an investment in the Company.
After selling its shares in Stabilus S.A., Servus Group HoldCo II is no longer defined as related party.
39 Remuneration of key management personnel
The key management personnel are the members of the Management Board Dietmar Siemssen (CEO),
Mark Wilhelms (CFO), Bernd-Dietrich Bockamp (Director Group Accounting) and Andreas Schröder
(Group Financial Reporting Director) as well as Hans-Josef Hosan (CTO - until May 29, 2015) and
Ansgar Krötz (COO - until September 30, 2015). The total remuneration paid to key management per-
sonnel of the Group is calculated as the amount of remuneration paid in cash and benefits in kind.
The latter primarily comprise the provision of company cars and pension.
The total remuneration of the above mentioned key management personnel at the various key Stabilus
Group affiliates during the reporting period amounted to €3,204 thousand (PY: €6,705 thousand) classified
as short-term employee benefits, €73 thousand (PY: €33 thousand) classified as post-employment benefits,
€3,935 thousand (PY: –) classified as termination benefits and €43 thousand (PY: –) classified as share-
based payments. The short-term employee benefits in the fiscal year 2014 included €3,979 thousand IPO
bonus-related payments of which the net amounts were largely reinvested in Stabilus stock. The compensa-
tion of the four Stabilus S.A. Management Board members is included in the above mentioned figure. Their
compensation for fiscal year 2015 was €2,128 thousand, split in a fix compensation of €975 thousand and
a variable compensation of €1,153 thousand.
Members of the Management and Supervisory Board have direct interest in Stabilus S.A. of about jointly
1% of the total shares.
The total remuneration to the members of the Supervisory Board amounts to €351 thousand (PY: € 146).

A N N U A L R E P O R T 2 0 1 5122
Notes C O N S O L I D A T E D F I N A N C I A L S TA T E M E N T S
40 Subsequent events
As of December 18, 2015, there were no further events or developments that could have materially
affected the measurement and presentation of Group’s assets and liabilities as of September 30, 2015.
Luxembourg, December 18, 2015
Stabilus S.A.
Management Board

A N N U A L R E P O R T 2 0 1 5 123
Responsibi l i ty StatementC O N S O L I D A T E D F I N A N C I A L S TA T E M E N T S
R E S P O N S I B I L I T Y S TAT E M E N T
We, Dietmar Siemssen (Chief Executive Officer), Mark Wilhelms (Chief Financial Officer), Bernd-
Dietrich Bockamp (Director Group Accounting) and Andreas Schröder (Group Financial Reporting
Director), confirm, to the best of our knowledge, that the consolidated financial statements which
have been prepared in accordance with the International Financial Reporting Standards as adopted
by the European Union, give a true and fair view of the assets, liabilities, financial position and
profit or loss of Stabilus S.A. and the undertakings included in the consolidation taken as a whole
and that the management report includes a fair review of the development and performance of the
business and the position of Stabilus S.A. and the undertakings included in the consolidation taken
as a whole, together with a description of the principal risks and uncertainties that they face.
Luxembourg, December 18, 2015
Management Board
Bernd-Dietrich BockampMark WilhelmsDietmar Siemssen Andreas Schröder

A N N U A L R E P O R T 2 0 1 5124
Management Board C O N S O L I D A T E D F I N A N C I A L S TA T E M E N T S
M A N AG E M E N T B OA R D O F S TA B I L U S S. A .
The Management Board comprises four members:
Dietmar Siemssen (Chairman) is the Chief Executive Officer and
was appointed to the Management Board in 2014 as well as the
Chairman of the Management Board. With 20 years of experience
in the automotive industry, Mr. Siemssen joined Stabilus in 2011
following a 19-year career in various management positions at
Continental AG. He holds a degree in mechanical engineering and
business administration. Mr. Siemssen also holds further manage-
ment positions within the Stabilus Group.
Mark Wilhelms is the Chief Financial Officer and was appointed
to the Management Board in 2014. With 25 years of experience in
the automotive industry, Mr. Wilhelms joined Stabilus in 2009 from
FTE Automotive, where he served as Chief Financial Officer for six
years. From 2007, he was also head of the NAFTA region at FTE.
Prior to that, he held various management positions in finance, plant
and marketing at various locations over his 17-year career at Ford.
He holds a degree in process engineering as well as a degree in
economics. Mr. Wilhelms also holds further management positions
within the Stabilus Group.
Bernd-Dietrich Bockamp is the Director Group Accounting and was
appointed to the Management Board in 2014. Mr. Bockamp joined
Stabilus in 2011. Prior to that, he led the financial projects and system
team at FTE Automotive following several years at KPMG Bayerische
Treuhand. He holds a degree in industrial engineering and manage-
ment. Mr. Bockamp also holds further management positions within
the Stabilus Group.
Andreas Schröder is the Group Financial Reporting Director and was
appointed to the Management Board in 2014. Mr. Schröder joined
Stabilus in 2010. Prior to that, he worked for several years in assurance
and advisory business services at Ernst & Young. He holds a degree in
business administration. Mr. Schröder also holds further management
positions within the Stabilus Group.

A N N U A L R E P O R T 2 0 1 5 125
Supervisory BoardC O N S O L I D A T E D F I N A N C I A L S TA T E M E N T S
The Supervisory Board comprises four members:
Udo Stark serves as a member of the Supervisory Board since 2014
as well as the Chairman of the Supervisory Board. He was Chairman of
the Executive Board of MTU Aero Engines AG until 2007. From 1991
until 2000, Mr. Stark led the listed plant construction and machinery
group Agiv AG. Subsequently, he became Chairman of the Shareholder
Committee at Messer Griesheim GmbH, Chairman of the Executive
Board of mg technologies AG and CEO of MTU Aero Engines AG. From
2008 to 2013, Mr. Stark served as a member of the Supervisory Board
of MTU Aero Engines AG. He is currently a member of the Supervi-
sory Board of Bilfinger SE and Chairman of the Advisory Board of
Arvos Group.
Nizar Ghoussaini (until September 30, 2015) served as a member of
the Supervisory Board since 2014. From 1999 until 2008 he was the
President and CEO of Benteler Automobiltechnik based in Paderborn,
Germany. Prior to that, he was President of the Premium Car Division
of Lear Corporation, based in Sulzbach, Germany with responsibil-
ity for seating, interiors and electrical / electronics business for the
German and French car companies worldwide.
Dr. Stephan Kessel serves as a member of the Supervisory Board
since 2014. He was Chief Executive of Continental AG until 2002. Pre-
viously, Dr. Kessel held a variety of management positions at Continen-
tal AG, joining its Management Board in 1997 and becoming Chief
Executive in 1999. In recent years, Dr. Kessel has taken up a number of
board positions at European companies including, among others, Sta-
bilus. From 2008 through 2010, Dr. Kessel was Chairman of the Board
of the former holding company of the Operating Stabilus Group.
S U P E RV I S O RY B OA R D O F S TA B I L U S S. A .
Andi Klein (until May 12, 2015) served as a member of the Supervi-
sory Board since 2014. He is an operating and investment partner at
WestPark management Services Germany GmbH, which provides ser-
vices exclusively to Triton and Triton portfolio companies. Formerly he
held several executive positions at Procter & Gamble (Executive in
M&A, Restructuring & Turnaround, Portfolio & Long Term Strategy,
Financial Management of diverse business units in Germany, Switzer-
land, Belgium and the U.S.).
Dr. Joachim Rauhut serves as a member of the Supervisory Board
since May 12, 2015. He was a member of the Executive Board of Wacker
Chemie AG until October 31, 2015. He joined the Management Board
of Wacker-Chemie GmbH in 2001 and supported Wacker Chemie’s
initial public offering in 2006. Previously, he served in various leading
corporate positions, including posts at Mannesmann AG and Krauss-
Maffei AG. He is member of the Supervisory Board of MTU Aero
Engines AG and B. Braun Melsungen AG and member of the Advisory
Counsel of J. Heinrich Kramer Holding GmbH.
Dr. Ralf-Michael Fuchs serves as a member of the Supervisory
Board since October 1, 2015. He joined Dürr AG in 2000. Today, he is
a member of the Dürr Senior Executive Management and CEO of the
Division Measuring and Process Systems. Furthermore, he is CEO of
Carl Schenck AG as well as Chairman of the Management Board of
Schenck RoTec GmbH, both subsidiaries of Dürr Group. Previously, he
had been serving in various leading roles, including positions at
AGIV AG and IWKA AG.

A N N U A L R E P O R T 2 0 1 5126
Independent Auditor ’s Report C O N S O L I D A T E D F I N A N C I A L S TA T E M E N T S
I N D E P E N D E N T AU D I TO R ’ S R E P O RT
To the Shareholders of
Stabilus S.A.
2, rue Albert Borschette,
L-1246 Luxembourg
Report of the réviseur d’entreprises agréé
R E P O RT O N T H E C O N S O L I DAT E D F I N A N C I A L S TAT E M E N T S
Following our appointment by the Annual General Meeting of the Shareholders dated February 18,
2015, we have audited the accompanying consolidated financial statements of Stabilus S.A. and its
subsidiaries (the “Group”), which comprise the consolidated statement of financial position as at Sep-
tember 30, 2015 and the consolidated statements of comprehensive income, changes in equity and
cash flows for the year then ended, and a summary of significant accounting policies and other explan-
atory information as set out on pages 59 to 122.
Management Board's responsibility for the consolidated financial statements
The Management Board is responsible for the preparation and fair presentation of these consolidated
financial statements in accordance with International Financial Reporting Standards as adopted by the
European Union, and for such internal control as the Management Board determines is necessary to
enable the preparation of consolidated financial statements that are free from material misstatement,
whether due to fraud or error.
Responsibility of the Réviseur d’Entreprises agréé
Our responsibility is to express an opinion on these consolidated financial statements based on our
audit. We conducted our audit in accordance with International Standards on Auditing as adopted for
Luxembourg by the Commission de Surveillance du Secteur Financier. Those standards require that we
comply with ethical requirements and plan and perform the audit to obtain reasonable assurance about
whether the consolidated financial statements are free from material misstatement.
An audit involves performing procedures to obtain audit evidence about the amounts and disclosures
in the consolidated financial statements. The procedures selected depend on the judgement of the
Réviseur d’Entreprises agréé, including the assessment of the risks of material misstatement of the con-
solidated financial statements, whether due to fraud or error. In making those risk assessments, the
Réviseur d’Entreprises agréé considers internal control relevant to the entity’s preparation and fair presenta-
tion of the consolidated financial statements in order to design audit procedures that are appropriate
in the circumstances, but not for the purpose of expressing an opinion on the effectiveness of the
entity’s internal control. An audit also includes evaluating the appropriateness of accounting policies
used and the reasonableness of accounting estimates made by the Management Board, as well as
evaluating the overall presentation of the consolidated financial statements.

A N N U A L R E P O R T 2 0 1 5 127
Independent Auditor ’s ReportC O N S O L I D A T E D F I N A N C I A L S TA T E M E N T S
We believe that the audit evidence we have obtained is sufficient and appropriate to provide a basis
for our audit opinion.
Opinion
In our opinion, the consolidated financial statements as set out on pages 59 to 122 give a true and
fair view of the consolidated financial position of Stabilus S.A. as of September 30, 2015, and of its
consolidated financial performance and its consolidated cash flows for the year then ended in accord-
ance with International Financial Reporting Standards as adopted by the European Union.
R E P O RT O N OT H E R L E G A L A N D R E G U L ATO RY R E Q U I R E M E N T S
The combined management report, including the corporate governance statement, which is the respon-
sibility of the Management Board, is consistent with the consolidated financial statements and
includes the information required by the law with respect to the corporate governance statement.
Luxembourg, December 18, 2015
KPMG Luxembourg Société coopérative
Cabinet de révision agréé
Ph. Meyer


The BLOC-O-LIFT gas springs are so-called locking gas springs. They are used for functions such as adjustments with force support, damping, as well as infinitely variable locking. This is achieved with a special piston valve sys-tem. If the valve is open, BLOC-O-LIFT provides force sup-port and damping. If the valve is closed, the gas springs locks and provides high resistance to any motion.
N A M E
4 9 3 6 – 4 1 6 7 5 1 – 0 3 4 7 P R – 1 0 5NT
D
D
P R E S S U R E T U B E
N I T R O G E N
P I S TO N R O D
S E A L A N D G U I D E PAC K AG E
T U B E E N D F I T T I N G
O I L
A N N UA L AC C O U N T S
AN
NU
AL
AC
CO
UN
TS
P I S TO N PAC K AG E W I T H VA LV E
AC T UAT I O N TA P P E TAC T UAT I O N TA P P E T
BLOC-O-LIFT®

A N N U A L R E P O R T 2 0 1 5130
Balance sheet A N N U A L A C C O U N T S
BA L A N C E S H E E T
as of September 30, 2015
Balance sheet T_074
I N € T H O U S A N D S N OT E Sept 30, 2015 Sept 30, 2014
Assets
Fixed assets 3 461,766 461,720
Intangible fixed assets
Concessions, patents, licences, trade marks and similar rights and assets, if they were acquired for valuable consideration and need not be shown under goodwill, to the extent that is was acquired for valuable consideration 16 –
Tangible fixed assets
Other fixtures and fittings, tools and equipment 35 5
Financial fixed assets 4
Shares in affiliated undertakings 461,715 461,715
Current assets 6,341 5,931
Debtors
Amounts owed by affiliated undertakings
becoming due and payable within one year 5 6,133 5,735
Other receivables
becoming due and payable within one year 69 50
Cash at bank, cash in postal cheque accounts, cheques and cash in hand 139 147
Prepayments 6 543 496
Total assets 468,650 468,147

A N N U A L R E P O R T 2 0 1 5 131
Balance sheetA N N U A L A C C O U N T S
Balance sheet T_074
I N € T H O U S A N D S N OT E Sept 30, 2015 Sept 30, 2014
Liabilities
Capital and reserves 7 451,115 451,224
Subscribed capital 207 207
Share premium and similar premiums 260,771 260,771
Reserves
Legal reserve 21 –
Other reserves 4,836 4,836
Profit or loss brought forward 185,389 (33,289)
Profit or loss for the financial year (108) 218,699
Subordinated debts 8 – 914
Non convertible loans
becoming due and payable after more than one year – 914
Provisions 9 9
Provisions for taxation 9 9
Non subordinated debts 17,525 16,000
Trade creditors
becoming due and payable within one year 922 1,985
Amounts owed to affiliated undertakings
becoming due and payable within one year 9 16,150 13,896
Tax and social security debts
Tax debts 25 78
Social security debts 83 –
Other creditors
becoming due and payable within one year 345 41
Total liabilities 468,650 468,147
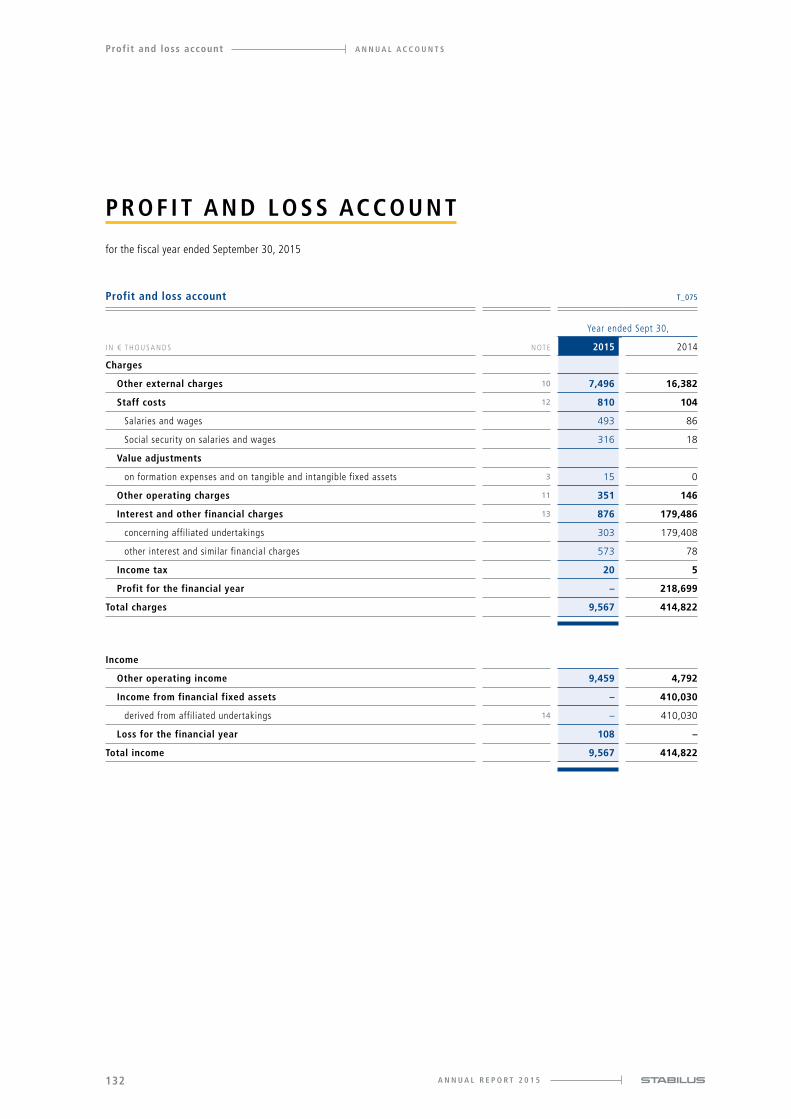
A N N U A L R E P O R T 2 0 1 5132
Profit and loss account A N N U A L A C C O U N T S
P R O F I T A N D L O S S AC C O U N T
for the fiscal year ended September 30, 2015
Profit and loss account T_075
Year ended Sept 30,
I N € T H O U S A N D S N OT E 2015 2014
Charges
Other external charges 10 7,496 16,382
Staff costs 12 810 104
Salaries and wages 493 86
Social security on salaries and wages 316 18
Value adjustments
on formation expenses and on tangible and intangible fixed assets 3 15 0
Other operating charges 11 351 146
Interest and other financial charges 13 876 179,486
concerning affiliated undertakings 303 179,408
other interest and similar financial charges 573 78
Income tax 20 5
Profit for the financial year – 218,699
Total charges 9,567 414,822
Income
Other operating income 9,459 4,792
Income from financial fixed assets – 410,030
derived from affiliated undertakings 14 – 410,030
Loss for the financial year 108 –
Total income 9,567 414,822
A N N U A L R E P O R T 2 0 1 5 133
A N N U A L A C C O U N T S Notes to the Annual Accounts
1 General
Stabilus S.A., Luxembourg, hereafter also referred to as “Stabilus” or the “Company” is a public lim-
ited liability company (société anonyme) incorporated in Luxembourg and governed by Luxembourg
law. The registered office of the Company is 2, rue Albert Borschette, L-1246 Luxembourg, Grand
Duchy of Luxembourg. The trade register number is B0151589. The Company was founded under the
name of Servus HoldCo S.à r.l. on February 26, 2010.
The Company is managed by a Management Board under the supervision of the Supervisory Board.
The Company is formed for an unlimited duration.
The purpose of the Company is (i) the acquisition, holding and disposal, in any form, by any means,
whether directly or indirectly, of participations, rights and interests in, and obligations of, Luxembourg
and foreign companies, including but not limited to any entities forming part of the Stabilus Group, (ii)
the acquisition by purchase, subscription, or in any other manner, as well as the transfer by sale,
exchange or in any other manner of stock, bonds, debentures, notes and other securities or financial
instruments of any kind (including notes or parts or units issued by Luxembourg or foreign mutual
funds or similar undertakings) and receivables, claims or loans or other credit facilities and agreements
or contracts relating thereto, and (iii) the ownership, administration, development and management of
a portfolio of assets (including, among other things, the assets referred to in (i) and (ii) above).
The Company’s financial year starts on October 1 and ends on September 30 each year.
The Company has no parent company which prepares consolidated financial statements including the
Company as a subsidiary. The Company also prepares consolidated financial statements in accordance
with EU regulation 1606/2002.
The copies of the consolidated financial statements are available at the registered office of the Com-
pany at 2, rue Albert Borschette, L-1246 Luxembourg or on www.stabilus.com.
N OT E S TO T H E A N N UA L AC C O U N T S
as of and for the fiscal year ended September 30, 2015
A N N U A L R E P O R T 2 0 1 5134
Notes to the Annual Accounts A N N U A L A C C O U N T S
2 Summary of significant accounting policies
BA S I S O F P R E S E N TAT I O N
The annual accounts are prepared in accordance with Luxembourg company law and generally accepted
accounting principles applicable in Luxembourg. The accounting policies and valuation principles are,
apart from those enforced by law, determined by the Management Board.
F O R E I G N C U R R E N C Y T R A N S L AT I O N
The Company maintains its books and records in euro (€). The balance sheet and the profit and loss
account are expressed in this currency.
Formation expenses, intangible, tangible and financial fixed assets denominated in currencies other
than euro are translated at the historical exchange rates.
Cash at bank denominated in currencies other than euro are translated at the exchange rates prevail-
ing at the date of the balance sheet.
Current assets and liabilities denominated in currencies other than euro (having an economic link and
similar characteristics) are recorded globally at the exchange rates prevailing at the date of the balance
sheet.
Long-term debts denominated in currencies other than euro having an economic link with receivables
recorded in financial assets (and having similar characteristics) are translated at the historical
exchange rates (loans “back to back”).
As a result, realized exchange gains and losses and unrealized exchange losses are recorded in the
profit and loss account. Unrealized exchange gains are not recognized.
VA L UAT I O N O F I N TA N G I B L E A N D TA N G I B L E F I X E D A S S E T S
Intangible and tangible assets are used for business purposes and are measured at cost less accumu-
lated value adjustments. Depreciation on intangible and tangible fixed assets is recorded on a straight-
line basis in accordance with its utilization and based on the useful lifes of the assets. The residual values,
depreciation methods and useful lifes are reviewed annually and adjusted, if necessary.
VA L UAT I O N O F F I N A N C I A L F I X E D A S S E T S
Shares in affiliated undertakings, participating interests and securities held as fixed assets are stated
at acquisition cost. Write-downs are recorded if, in the opinion of the Management Board, it is

A N N U A L R E P O R T 2 0 1 5 135
A N N U A L A C C O U N T S Notes to the Annual Accounts
expected the reduction in their value will be permanent. The impairment analysis is done individually
for each investment.
Loans to affiliated undertakings are recorded at their nominal value. Loans are written down to their
recoverable amount if, in the opinion of the Management Board, there is a permanent impairment.
These value adjustments may not be continued if the reasons for which the value adjustments were
made have ceased to exist.
D E B TO R S
Current receivables are recorded at their nominal value. Current receivables are written down to their
recoverable amount if, in the opinion of the Management Board, there is a permanent impairment.
These value adjustments may not be continued if the reasons for which the value adjustments were
made have ceased to exist.
D E B T S
Debts are recorded at their reimbursement value. Where the amount repayable on account is greater than
the amount received, the difference is shown as an asset and is written off over the period of the debt.
Debts are recorded under subordinated debts when their status is subordinated to unsecured debts.
P R OV I S I O N S
Provisions are intended to cover losses or debts, the nature of which is clearly defined and which, at
the date of the balance sheet, are either likely to be incurred or certain to be incurred but uncertain as
to their amount or the date on which they will arise.
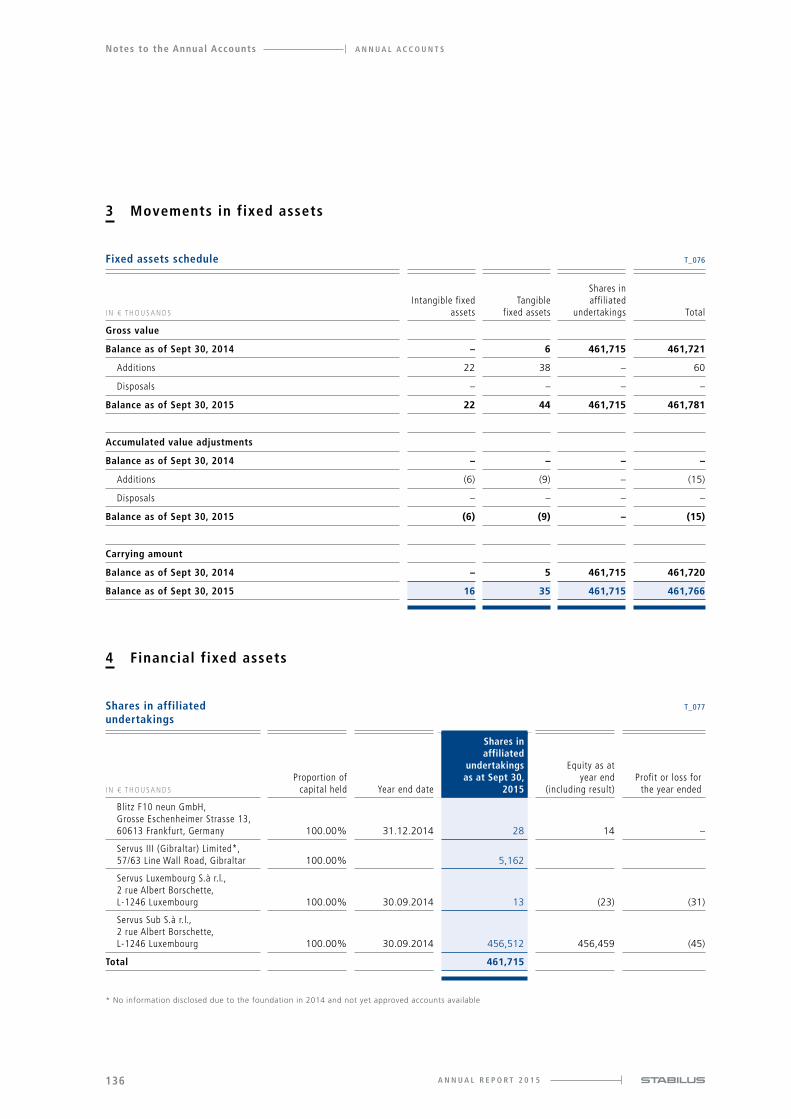
A N N U A L R E P O R T 2 0 1 5136
Notes to the Annual Accounts A N N U A L A C C O U N T S
4 Financial fixed assets
3 Movements in fixed assets
Shares in affiliated undertakings
T_077
I N € T H O U S A N D S
Proportion of capital held Year end date
Shares in affiliated
undertakings as at Sept 30,
2015
Equity as at year end
(including result)Profit or loss for
the year ended
Blitz F10 neun GmbH, Grosse Eschenheimer Strasse 13, 60613 Frankfurt, Germany 100.00% 31.12.2014 28 14 –
Servus III (Gibraltar) Limited*, 57/63 Line Wall Road, Gibraltar 100.00% 5,162
Servus Luxembourg S.à r.l., 2 rue Albert Borschette, L-1246 Luxembourg 100.00% 30.09.2014 13 (23) (31)
Servus Sub S.à r.l., 2 rue Albert Borschette, L-1246 Luxembourg 100.00% 30.09.2014 456,512 456,459 (45)
Total 461,715
* No information disclosed due to the foundation in 2014 and not yet approved accounts available
Fixed assets schedule T_076
I N € T H O U S A N D S
Intangible fixed assets
Tangible fixed assets
Shares in affiliated
undertakings Total
Gross value
Balance as of Sept 30, 2014 – 6 461,715 461,721
Additions 22 38 – 60
Disposals – – – –
Balance as of Sept 30, 2015 22 44 461,715 461,781
Accumulated value adjustments
Balance as of Sept 30, 2014 – – – –
Additions (6) (9) – (15)
Disposals – – – –
Balance as of Sept 30, 2015 (6) (9) – (15)
Carrying amount
Balance as of Sept 30, 2014 – 5 461,715 461,720
Balance as of Sept 30, 2015 16 35 461,715 461,766
A N N U A L R E P O R T 2 0 1 5 137
A N N U A L A C C O U N T S Notes to the Annual Accounts
5 Amounts owed by affil iated undertakings
The increase is mainly due to the new service level agreements with affiliated undertakings. An amount
of €156 thousand consists of receivables under these agreements. The remaining amount relates to
cash pool receivables owed by affiliated undertakings.
6 Prepayments
Prepayments mainly relate to insurance contracts.
7 Capital and reserves
Issued capital as of September 30, 2015 amounts to €207 thousand (September 30, 2014: €207 thou-
sand) and was fully paid in. It is divided into 20,723,256 shares with a nominal value of €0.01 each.
As at September 30, 2015, the share premium amounted to €261 million and the distributable other
reserve amounted to €4,836 thousand.
The authorized capital of the Company is set at €315 thousand represented by maximum of
31,500,000 shares, each with a nominal value of €0.01.
Under Luxembourg law, the Company is required to appropriate annually at least 5% of its statutory
net profit to a legal reserve until the aggregate reserve equals 10% of the subscribed share capital.
The reserve is not available for distribution. Following the decision of the Annual General Meeting on
February 17, 2015 the Company appropriated an amount of €21 thousand equal to 10% of the sub-
scribed share capital to the legal reserve.
8 Subordinated debts
An upstream loan has been granted by its affiliated undertaking Stable II S.à r.l. to the Company on
June 7, 2013 for an amount of €808 thousand used for repayment of mezzanine warrants in an
amount of €808 thousand. The upstream loan was repaid in 2015.
9 Amounts owed to affil iated undertakings
An amount of €16,150 thousand consists of cash pool liabilities owed to affiliated undertakings.

A N N U A L R E P O R T 2 0 1 5138
Notes to the Annual Accounts A N N U A L A C C O U N T S
10 Other external charges
Consulting fees include fees in relation to the refinancing in the financial year 2015 and to the IPO
and restructuring in the financial year 2014.
11 Other operating charges
The other operation charges refer to the remuneration of the Supervisory Board.
12 Staff costs
The Company employs 4 employees as of September 30, 2015 (PY: 3). The average number of employ-
ees in the financial year 2015 was 3 (PY: 1).
13 Interest and other financial charges
The interest from variable PPL interest in the fiscal year 2014 relates to the restructuring transactions.
Interest and other financial charges T_079
Year ended Sept 30,
I N € T H O U S A N D S 2015 2014
Interest from variable PPL interest – 179,301
Other 876 185
Total 876 179,486
Other external charges T_078
Year ended Sept 30,
I N € T H O U S A N D S 2015 2014
Administration fees 500 92
Consulting fees 6,324 15,549
Audit fees 378 280
Group insurance 111 40
Legal and professional fees 168 420
Bank charges 15 1
Total 7,496 16,382

A N N U A L R E P O R T 2 0 1 5 139
A N N U A L A C C O U N T S Notes to the Annual Accounts
14 Income from financial fixed assets
The gains on distribution of PPLs in the fiscal year 2014 relates to the restructuring transactions.
15 Taxation
The Company is subject to Luxembourg company tax law.
16 Related parties
The remuneration of the members of the Management Board amount to €278 thousand (PY: €86 thou-
sand). Further remuneration is paid by other affiliated undertakings.
The remuneration of the members of the Supervisory Board amount to €351 thousand (PY: €146 thousand).
Selected Stabilus Group management members hold interest in Stabilus S.A. directly of about jointly
1% of the total shares.
17 Share-based payment
The variable compensation for the members of the Management Board includes a matching stock pro-
gram. The matching stock program (the “MSP”) provides for four annual tranches granted each year
during the time frame fiscal year ending September 30, 2015 until September 17, 2017. Participation
in the matching stock program requires Management Board members to invest in shares of the Com-
pany. The investment generally has to be held for the lock-up period.
As part of the matching stock program A (the “MSP A”) for each share the Management Board invests
in the Company in the specific year (subject to general cap), the Management Board members receive
a certain number of fictitious options to acquire shares in the Company for each tranche of the match-
ing stock program. The amount of stock options received depends upon a factor to be set by the Super-
visory Board (Renumeration Committee) annually in a range between 1.0 and 1.7 times for a certain
tranche. Thus, if a Management Board member were to buy 1,000 shares under the MSP in the Company,
Income from financial fixed assets T_080
Year ended Sept 30,
I N € T H O U S A N D S 2015 2014
Gains on distributions of PPLs – 179,301
Dividend Servus II (Gibraltar) Limited – 5,159
Dividend Servus III (Gibraltar) Limited – 210,660
Profit in sale of shares – 14,910
Total – 410,030
A N N U A L R E P O R T 2 0 1 5140
Notes to the Annual Accounts A N N U A L A C C O U N T S
he would receive 1,000 to 1,700 fictitious options for a certain tranche. The fictitious options are subject
to a lock-up period of four years and may be exercised during a subsequent two-year exercise period.
As part of matching stock program B (the “MSP B”) for each share the Management Board holds in
the Company in the specific year (subject to a general cap), the Management Board members receive a
certain number of fictitious options to acquire shares in the Company for each tranche of the matching
stock program. The amount of stock options received depends upon a factor to be set by the Supervi-
sory Board (Remuneration Committee) annually in a range between 0.0 and 0.3 times for a certain
tranche. Thus, if a Management Board member were to be holding 1,000 shares under the MSP in the
Company, he would receive 0 to 300 fictitious options for a certain tranche. The fictitious options are
subject to a lock-up period of four years and may be exercised during a subsequent two-year exercise
period. The options may only be exercised if the stock price of the Company exceeds a set threshold for
the relevant tranche, which the Supervisory Board will determine, and which needs to be between 10%
and 50% growth over the base price, which is the share price on the grant date. If exercised, the ficti-
tious options are transformed into a gross amount equaling the difference between the option price and
the relevant stock price multiplied by the number of exercised fictitious options. The generally limited
net amount resulting from the calculated gross amount is paid out to the Management Board members.
Alternatively, the Company may decide to buy shares in an amount equaling the net amount in order
to settle the exercised options. The Company plans a cash settlement. The maximum gross amounts
resulting from the exercise of the fictitious options of one tranche in general is limited in amount.
Reinvestment of IPO proceeds from previous equity programs are not taken into account for MSP A.
In fiscal year 2015 17,721 options were issued for MSP B. The exercise price is €24.82 and the options
are valued with an fair value of €8.75 as of September 30, 2015.
18 Commitments, contingencies and pledges
The Company and other affiliated companies entered into a new senior facilities agreement with a
total amount of €320 million made up of a €270 million facility A commitment and a €50 million
revolving facility commitment. The new loan was used for the redemption of the bond issued on June 7,
2013 by Servus Luxembourg Holding S.C.A.
On June 11, 2015, all securities in relation to the bond issued on June 7, 2013 by Servus Luxembourg
Holding S.C.A. were released.
In order to collateralize the senior facility the assignment of the shares in affiliated undertakings have
been provided as items of security.
The Company is guarantor of the senior facility and is jointly and severally liable for potential cash pool
obligations. All obligations of the loan agreement were fulfilled by the Stabilus Group within the past
financial year or are expected to be fulfilled within the planning period. Therefore the Management
Board does not expect utilization as guarantor.

A N N U A L R E P O R T 2 0 1 5 141
A N N U A L A C C O U N T S Notes to the Annual Accounts
The Company has signed an office rent contract starting November 1, 2013 which will be terminated
on January 31, 2018. The commitments amount for the financial year 2016 and 2017 €171 thousand
each and the financial year 2018 €57 thousand. The Company issued a bank guarantee with an
amount of €100 thousand to the landlord.
19 Subsequent events
There were no events or developments that could have materially affected the measurement and
presen tation of the Company’s assets and liabilities as of September 30, 2015.
Luxembourg, December 18, 2015
Stabilus S.A.
Management Board

A N N U A L R E P O R T 2 0 1 5142
Notes to the Annual Accounts A N N U A L A C C O U N T S
I N D E P E N D E N T AU D I TO R ’ S R E P O RT
To the Shareholders of
Stabilus S.A.
2, rue Albert Borschette,
L-1246 Luxembourg
Report of the réviseur d’entreprises agréé
R E P O RT O N T H E A N N UA L AC C O U N T S
Following our appointment by the Annual General Meeting of the Shareholders dated February 18, 2015,
we have audited the accompanying annual accounts of Stabilus S.A. which comprise the balance sheet
as at September 30, 2015 and the profit and loss account for the year then ended, and a summary of
significant accounting policies and other explanatory information as set out on pages 130 to 141.
Management Board's responsibility for the annual accounts
The Management Board is responsible for the preparation and fair presentation of these annual
accounts in accordance with Luxembourg legal and regulatory requirements relating to the preparation
of the annual accounts, and for such internal control as the Management Board determines is neces-
sary to enable the preparation of annual accounts that are free from material misstatement, whether
due to fraud or error.
Responsibility of the Réviseur d’Entreprises agréé
Our responsibility is to express an opinion on these annual accounts based on our audit. We conducted
our audit in accordance with International Standards on Auditing as adopted for Luxembourg by the
Commission de Surveillance du Secteur Financier. Those standards require that we comply with ethical
requirements and plan and perform the audit to obtain reasonable assurance about whether the
annual accounts are free from material misstatement.
An audit involves performing procedures to obtain audit evidence about the amounts and disclosures in
the annual accounts. The procedures selected depend on the judgement of the Réviseur d’Entreprises
agréé, including the assessment of the risks of material misstatement of the annual accounts, whether
due to fraud or error. In making those risk assessments, the Réviseur d’Entreprises agréé considers inter-
nal control relevant to the entity’s preparation and fair presentation of the annual accounts in order to
design audit procedures that are appropriate in the circumstances, but not for the purpose of expressing
an opinion on the effectiveness of the entity’s internal control. An audit also includes evaluating the
appropriateness of accounting policies used and the reasonableness of accounting estimates made by the
Management Board, as well as evaluating the overall presentation of the annual accounts.
We believe that the audit evidence we have obtained is sufficient and appropriate to provide a basis for
our audit opinion.

A N N U A L R E P O R T 2 0 1 5 143
A N N U A L A C C O U N T S Notes to the Annual Accounts
Opinion
In our opinion, the annual accounts as set out on pages 130 to 141 give a true and fair view of the
financial position of Stabilus S.A. as of September 30, 2015, and of the results of its operations for the
year then ended in accordance with Luxembourg legal and regulatory requirements relating to the
preparation of the annual accounts.
R E P O RT O N OT H E R L E G A L A N D R E G U L ATO RY R E Q U I R E M E N T S
The combined management report, including the corporate governance statement, which is the respon-
sibility of the Management Board, is consistent with the annual accounts and includes the information
required by the law with respect to the corporate governance statement.
Luxembourg, December 18, 2015
KPMG Luxembourg Société coopérative
Cabinet de révision agréé
Ph. Meyer


E A D D I T I O N A L I N F O R M AT I O N
E
AD
DIT
ION
AL
IN
FO
RM
AT
ION
N A M E
5 3 4 5 – 7 2 9 0 8 8 – 2 5 9 7 P R – 1 6 0NT
P I S TO N R O D
P R E S S U R E T U B E
P I S TO N PAC K AG E
O I L
S E A L A N D G U I D E PAC K AG E
C O M P E N S AT I O N C H A M B E R
STAB-O-SHOC HD24/29 is a hydrolic vibration damper for high loads. The dampers are orientation-specific as stan-dard. Areas of application are, amont others, seat dampers, washing machines, and motion dampers with high force requirements for especially heavy flaps. One special design is the overrunning brake damper in automotive design.
STAB-O-SHOC® HD24/29
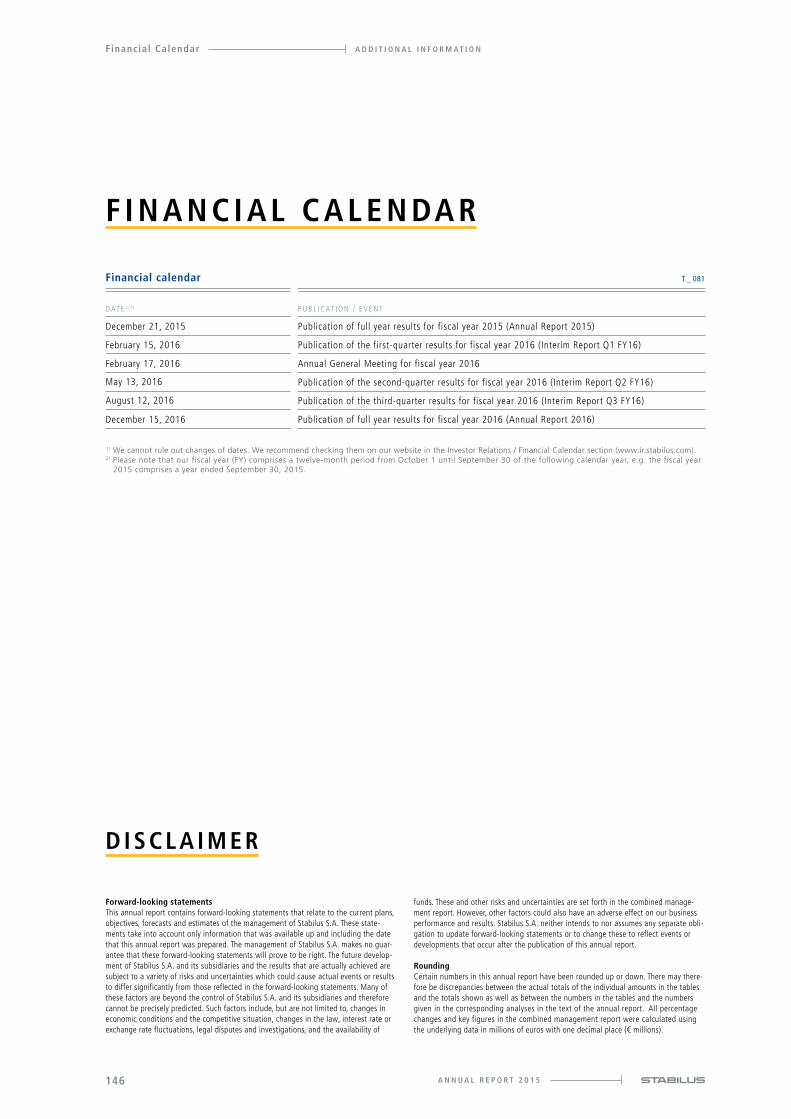
A N N U A L R E P O R T 2 0 1 5146
Financial Calendar A D D I T I O N A L I N F O R M A T I O N
F I N A N C I A L C A L E N DA R
D I S C L A I M E R
Forward-looking statementsThis annual report contains forward-looking statements that relate to the current plans, objectives, forecasts and estimates of the management of Stabilus S.A. These state-ments take into account only information that was available up and including the date that this annual report was prepared. The management of Stabilus S.A. makes no guar-antee that these forward-looking statements will prove to be right. The future develop-ment of Stabilus S.A. and its subsidiaries and the results that are actually achieved are subject to a variety of risks and uncertainties which could cause actual events or results to differ significantly from those reflected in the forward-looking statements. Many of these factors are beyond the control of Stabilus S.A. and its subsidiaries and therefore cannot be precisely predicted. Such factors include, but are not limited to, changes in economic conditions and the competitive situation, changes in the law, interest rate or exchange rate fluctuations, legal disputes and investigations, and the availability of
funds. These and other risks and uncertainties are set forth in the combined manage-ment report. However, other factors could also have an adverse effect on our business performance and results. Stabilus S.A. neither intends to nor assumes any separate obli-gation to update forward-looking statements or to change these to reflect events or developments that occur after the publication of this annual report.
RoundingCertain numbers in this annual report have been rounded up or down. There may there-fore be discrepancies between the actual totals of the individual amounts in the tables and the totals shown as well as between the numbers in the tables and the numbers given in the corresponding analyses in the text of the annual report. All percentage changes and key figures in the combined management report were calculated using the underlying data in millions of euros with one decimal place (€ millions).
Financial calendar T _ 081
D AT E 1 ) 2 ) P U B L I C AT I O N / E V E N T
December 21, 2015 Publication of full year results for fiscal year 2015 (Annual Report 2015)
February 15, 2016 Publication of the first-quarter results for fiscal year 2016 (Interim Report Q1 FY16)
February 17, 2016 Annual General Meeting for fiscal year 2016
May 13, 2016 Publication of the second-quarter results for fiscal year 2016 (Interim Report Q2 FY16)
August 12, 2016 Publication of the third-quarter results for fiscal year 2016 (Interim Report Q3 FY16)
December 15, 2016 Publication of full year results for fiscal year 2016 (Annual Report 2016)
1) We cannot rule out changes of dates. We recommend checking them on our website in the Investor Relations / Financial Calendar section (www.ir.stabilus.com).2) Please note that our fiscal year (FY) comprises a twelve-month period from October 1 until September 30 of the following calendar year, e.g. the fiscal year
2015 comprises a year ended September 30, 2015.
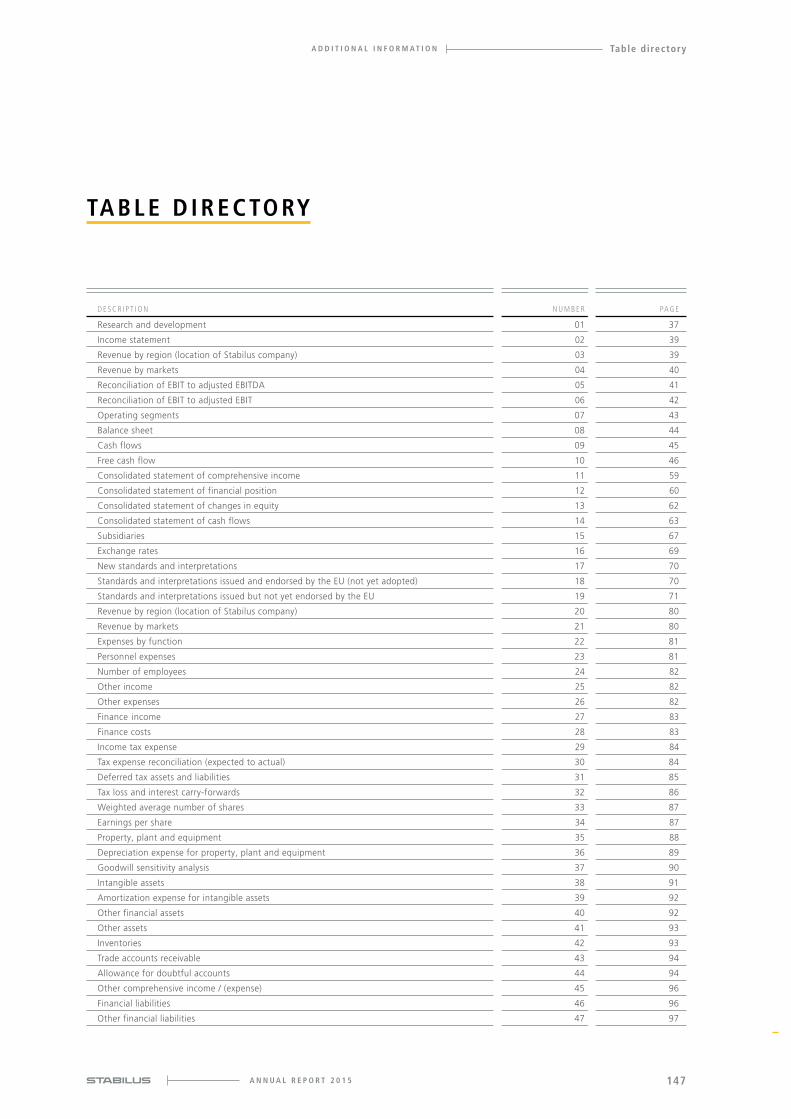
A N N U A L R E P O R T 2 0 1 5 147
Table directoryA D D I T I O N A L I N F O R M A T I O N
AD
DIT
ION
AL
IN
FO
RM
AT
ION
D
D E S C R I P T I O N N U M B E R PAG E
Research and development 01 37
Income statement 02 39
Revenue by region (location of Stabilus company) 03 39
Revenue by markets 04 40
Reconciliation of EBIT to adjusted EBITDA 05 41
Reconciliation of EBIT to adjusted EBIT 06 42
Operating segments 07 43
Balance sheet 08 44
Cash flows 09 45
Free cash flow 10 46
Consolidated statement of comprehensive income 11 59
Consolidated statement of financial position 12 60
Consolidated statement of changes in equity 13 62
Consolidated statement of cash flows 14 63
Subsidiaries 15 67
Exchange rates 16 69
New standards and interpretations 17 70
Standards and interpretations issued and endorsed by the EU (not yet adopted) 18 70
Standards and interpretations issued but not yet endorsed by the EU 19 71
Revenue by region (location of Stabilus company) 20 80
Revenue by markets 21 80
Expenses by function 22 81
Personnel expenses 23 81
Number of employees 24 82
Other income 25 82
Other expenses 26 82
Finance income 27 83
Finance costs 28 83
Income tax expense 29 84
Tax expense reconciliation (expected to actual) 30 84
Deferred tax assets and liabilities 31 85
Tax loss and interest carry-forwards 32 86
Weighted average number of shares 33 87
Earnings per share 34 87
Property, plant and equipment 35 88
Depreciation expense for property, plant and equipment 36 89
Goodwill sensitivity analysis 37 90
Intangible assets 38 91
Amortization expense for intangible assets 39 92
Other financial assets 40 92
Other assets 41 93
Inventories 42 93
Trade accounts receivable 43 94
Allowance for doubtful accounts 44 94
Other comprehensive income / (expense) 45 96
Financial liabilities 46 96
Other financial liabilities 47 97
TA B L E D I R E C TO RY

A N N U A L R E P O R T 2 0 1 5148
Table directory A D D I T I O N A L I N F O R M A T I O N
D E S C R I P T I O N N U M B E R PAG E
Provisions 48 98
Changes of non-current provisions 49 98
Changes of current provisions 50 99
Pension plans and similar obligations 51 100
Unfunded status 52 101
Present value of defined benefit obligations 53 101
Pension cost for defined benefit plans 54 101
Present value of the defined benefit obligation and the experience adjustments on the plan liabilities 55 102
Significant factors for the calculation of pension obligations 56 102
Other liabilities 57 104
Operating lease 58 104
Finance lease 59 105
Financial commitments 60 107
Financial instruments 61 108
Financial instruments 62 109
Credit risk included in financial assets 63 111
Liquidity outflows for liabilities 64 112
Equity ratio 65 113
Segment reporting 66 115
Reconciliation of the total segments’ profit to profit / (loss) before income tax 67 116
Geographical information: revenue by country 68 116
Geographical information: non-current assets by country 69 117
Input parameter for fair value measurement of MSP 70 119
MSP B options 71 119
Phantom Stock Program options 72 120
Auditor’s fees 73 120
Balance sheet 74 130
Profit and loss account 75 132
Fixed assets schedule 76 136
Shares in affiliated undertakings 77 136
Other external charges 78 138
Interest and other financial charges 79 138
Income from financial fixed assets 80 139
Financial calendar 81 146

I N F O R M AT I O N R E S O U R C E S
Further information including news, reports and publications can be found in the investor relations
section of our website at www.ir.stabilus.com.
Investor Relations
Phone: +352 286 770 21
Fax: +352 286 770 99
Email: [email protected]
Publisher
Stabilus S.A.
2, rue Albert Borschette,
L-1246 Luxembourg
Grand Duchy of Luxembourg
Phone: +352 286 770 1
Fax: +352 286 770 99
Email: [email protected]
Internet: www.stabilus.com
A N N U A L R E P O R T 2 0 1 5
Information ResourcesA D D I T I O N A L I N F O R M A T I O N
149