Rainforest Tourism Second Annual Report - Reef &...
40
Transcript of Rainforest Tourism Second Annual Report - Reef &...


Rainforest Tourism Second Annual Report: January – December 2008
Annual and Quarterly Patterns of Rainforest Tourism in the Wet Tropics World Heritage Area, North Queensland
Karen McNamara and Bruce Prideaux
School of Business, James Cook University
Supported by the Australian Government’s Marine and Tropical Sciences Research Facility
Project 4.9.2 Sustainable nature based tourism: planning and management

© James Cook University ISBN 9781921359330 This report should be cited as: McNamara, K.. and Prideaux, B. (2009) Rainforest Tourism Second Annual Report: January – December 2008. Annual and Quarterly Patterns of Rainforest Tourism in the Wet Tropics World Heritage Area, North Queensland. Report to the Marine and Tropical Sciences Research Facility. Reef and Rainforest Research Centre Limited and James Cook University, Cairns (37pp.). Published by the Reef and Rainforest Research Centre on behalf of the Australian Government’s Marine and Tropical Sciences Research Facility. The Australian Government’s Marine and Tropical Sciences Research Facility (MTSRF) supports world-class, public good research. The MTSRF is a major initiative of the Australian Government, designed to ensure that Australia’s environmental challenges are addressed in an innovative, collaborative and sustainable way. The MTSRF investment is managed by the Department of the Environment, Water, Heritage and the Arts (DEWHA), and is supplemented by substantial cash and in-kind investments from research providers and interested third parties. The Reef and Rainforest Research Centre Limited (RRRC) is contracted by DEWHA to provide program management and communications services for the MTSRF. This publication is copyright. The Copyright Act 1968 permits fair dealing for study, research, information or educational purposes subject to inclusion of a sufficient acknowledgement of the source. The views and opinions expressed in this publication are those of the authors and do not necessarily reflect those of the Australian Government or the Minister for the Environment, Water, Heritage and the Arts. While reasonable effort has been made to ensure that the contents of this publication are factually correct, the Commonwealth does not accept responsibility for the accuracy or completeness of the contents, and shall not be liable for any loss or damage that may be occasioned directly or indirectly through the use of, or reliance on, the contents of this publication. This report is available for download from the Reef and Rainforest Research Centre Limited website: http://www.rrrc.org.au/publications/research_reports.html Report completed April 2009 Published by the RRRC September 2009 RRRC thanks Suzanne Long, Bruce Prideaux, Duncan Watts and Fay Falco-Mammone for use of cover images.

Rainforest Tourism Second Annual Report
Contents List of Figures........................................................................................................................... ii List of Tables ............................................................................................................................ ii Acronyms and abbreviations ................................................................................................... iv Acknowledgements ................................................................................................................. iv 1. ......................................................................................................................1 Introduction
2. .....................................................................................................................2 Methodology
2.1 ..................................................................................................................3 Limitations
3. ............................................................................................................................4 Findings
3.1 ................................................4 Surveyed visitors’ socio-demographic characteristics
Gender and origin of surveyed visitors .......................................................................4 Occupation .................................................................................................................6 Age of surveyed visitors .............................................................................................8
3.2 ..................................10 Surveyed visitors’ travel behaviour and motivations for travel
Travel party ..............................................................................................................10 First visit and length of stay......................................................................................11 Accommodation........................................................................................................12 Transport ..................................................................................................................14 Previous holidays and alternative destinations.........................................................16 Motivations ...............................................................................................................17 Information sources..................................................................................................21
3.3 ..............................................................................................................23
Surveyed visitors’ experiences in and satisfaction with Tropical North Queensland
Rainforest locations visited and length of stay .........................................................23 Importance of visiting rainforests and knowledge.....................................................24 Rainforest activities ..................................................................................................24 Rainforest interpretation ...........................................................................................27 Budget and visitors’ overall trip satisfaction .............................................................29
4. ...........................................................................................30 Publication List – Year Two
Quarterly ‘Tourism Barometers’ ...............................................................................30 Survey Fact Sheet....................................................................................................30 Peer-Reviewed Articles ............................................................................................30
5. ......................................................................................................................31 References
i

McNamara and Prideaux
List of Figures Figure 1: Origin of visitors surveyed (as percentages of 2007 and 2008 annual
samples, and 2008 quarterly samples)..................................................................4
Figure 2: Occupation of visitors surveyed (as percentages of 2007 and 2008 annual samples, and 2008 quarterly samples) ......................................................6
Figure 3: Age of visitors surveyed (as percentages of 2007 and 2008 annual samples, and 2008 quarterly samples)..................................................................8
Figure 4: Travel party of visitors surveyed (as percentages of 2007 and 2008 annual samples, and 2008 quarterly samples) ....................................................10
Figure 5: Percentage of respondents who were on their first visit to North Queensland (as percentages of 2007 and 2008 annual samples, 2007 and 2008 quarterly samples, and per WTWHA region) ..............................11
Figure 6: Chosen accommodation type of visitors surveyed (as percentages of 2007 and 2008 annual samples, and 2008 quarterly samples) ...........................12
Figure 7: Surveyed visitors’ chosen mode of transport (as percentages of 2007 and 2008 annual samples, and 2008 quarterly samples) ....................................14
Figure 8: Surveyed visitors’ motivations for visiting North Queensland (as percentages of 2007 and 2008 annual samples, and 2008 quarterly samples) ..............................................................................................................17
Figure 9: Information sources used by surveyed visitors (as percentages of 2007 and 2008 annual samples, and 2008 quarterly samples) ...........................21
Figure 10: Rainforest locations visited, and intent to visit, by 2007 and 2008 survey results.......................................................................................................23
Figure 11: Time spent at rainforest locations in the WTWHA by respondents......................23
Figure 12: Visitors’ levels of interest in rainforest activities as percentages of 2008 annual and quarterly samples.....................................................................25
Figure 13: Impressions of surveyed visitors to attitudinal statements concerning environmental and cultural interpretation (as mean values of 2008 annual and quarterly samples) ............................................................................27
Figure 14: Surveyed visitors’ overall satisfaction with their trip to North Queensland, as means of annual and quarterly, domestic and international, and rainforest location totals in 2007 and 2008 .............................29
List of Tables Table 1: Survey regions in relation to WTWHA precincts....................................................2
Table 2: Comparison of the origin of survey respondents, as a percentage of surveyed visitors at four key WTWHA regions ......................................................5
Table 3: Comparison of surveyed domestic and international visitors’ occupations............................................................................................................7
Table 4: Comparison of the occupations of survey respondents, as a percentage of surveyed visitors at four key WTWHA regions................................7
Table 5: Comparison of age groups of surveyed domestic and international visitors....................................................................................................................8
Table 6: Age group of respondents, as a percentage of surveyed visitors at four key WTWHA regions ......................................................................................9
ii

Rainforest Tourism Second Annual Report
Table 7: Comparison of chosen travel parties of surveyed domestic and international visitors .............................................................................................10
Table 8: Travel parties of respondents, as a percentage of surveyed visitors at four key WTWHA regions ....................................................................................11
Table 9: Comparison of choice of accommodation by surveyed domestic and international visitors .............................................................................................13
Table 10: Respondents’ chosen accommodation types, as a percentage of surveyed visitors at four key WTWHA regions ....................................................13
Table 11: Comparison of surveyed domestic and international respondents’ chosen modes of transport ..................................................................................14
Table 12: Respondents’ chosen mode of transport, as a percentage of surveyed visitors at four key WTWHA regions ....................................................................15
Table 13: Most popular and recent holiday destinations for surveyed visitors (as percentages of 2007 and 2008 annual totals, and domestic and international visitors)............................................................................................16
Table 14: Alternative destinations considered by surveyed visitors (as percentages of 2007 and 2008 annual total) .......................................................16
Table 15: Comparison of surveyed domestic and international visitors’ motivations for visiting North Queensland ...........................................................18
Table 16: The rank for each motivation of the overall sample in 2007 and 2008, and by domestic and international visitors in 2008 ..............................................19
Table 17: Comparison of survey respondents’ motivations to visit North Queensland, as mean ratings per key WTWHA region .......................................20
Table 18: Comparison of surveyed domestic and international visitors’ information sources .............................................................................................21
Table 19: Information sources used by respondents, as a percentage of surveyed visitors at four key WTWHA regions ....................................................22
Table 20: Comparison of rainforest locations visited by surveyed domestic and international visitors .............................................................................................24
Table 21: Comparison of surveyed domestic and international visitors’ interests in rainforest activities ...........................................................................................25
Table 22: Respondents’ preferred rainforest activities, as a percentage of surveyed visitors at four key WTWHA regions ....................................................26
Table 23: Comparison of surveyed domestic and international visitors’ attitudes to on-site interpretation ........................................................................................28
Table 24: Comparison of surveyed visitors’ attitudes to on-site interpretation as a percentage of surveyed visitors at four key WTWHA regions...........................28
iii

McNamara and Prideaux
iv
Acronyms and abbreviations Ads..............Advertisements
CRC.............Cooperative Research Centre
MTSRF ........Marine and Tropical Sciences Research Facility
qtr................Quarter
TV................Television
UK ...............United Kingdom
USA.............United States of America
WTWHA ......Wet Tropics World Heritage Area
yrs ...............Years
Acknowledgements A number of individuals and organisations assisted in the development of this research project, for which we are grateful:
Wet Tropics Management Authority – in particular, Max Chappell and Campbell Clarke; and
Tropical Tourism North Queensland – in particular, Rob Giason and Annie Riddett.
Without the support and dedication of a number of individual rainforest operators and other organisations in the region, the data used in this annual report would not be nearly as fruitful. These operators and organisations have not only assisted in the development phases of the survey, but also provided staff to collect the surveys each month:
Daintree Discovery Centre;
Skyrail;
Tropic Wings;
Pioneer;
Wilderness Challenge; and
Back Country Bliss Adventures.
Lastly, to the research assistants who have injected a large amount of time and energy into this project, Jonathan Sibtain, Bruce Dale and Lisa King, many thanks for your hard work.

Rainforest Tourism Second Annual Report
1. Introduction In response to a need to more clearly identify the characteristics, motivations and travel patterns of visitors who visited the Wet Tropics World Heritage Area (WTWHA), this annual report presents a range of rainforest visitor data that can be used by the Wet Tropics Management Authority for planning and marketing purposes and by tourism industry operators. This report is a culmination of the research conducted in 2008 on rainforest tourism in the WTWHA. This research was funded through by Australian Government’s Marine and Tropical Sciences Research Facility (MTSRF). The key tasks allocated to MTSRF Project 4.9.2 Sustainable nature based tourism: Planning and management in relation to the Wet Tropics are:
To report on the sustainable use of rainforest resources by the tourism industry; and
To monitor visitors at the site level and community perceptions.
This project is designed to identify aspects of the annual tourist usage of the Wet Tropics rainforests, including key trends, visitation patterns, activities and behaviours, and motivations. Throughout this annual report, data is outlined on a quarterly and annual basis. Moreover, an annual comparison is provided with the 2007 data1. The quarters of data collection were January to March; April to June; July to September and October to December. A total of 1,010 surveys were completed by visitors across the whole WTWHA during 2008. The results in this annual report are discussed in three sections:
The socio-demographic characteristics of respondents;
The motivations and behaviours of respondents; and
The experiences and satisfaction of respondents.
The individual quarterly data that has already been released can be accessed at the MTSRF website2. This annual report analyses data from January to December 2008.
1 See McNamara, K. and Prideaux, B. (2008) Rainforest Tourism First Annual Report: January – December
2007. Annual and quarterly patterns of rainforest tourism in the Wet Tropics World Heritage Area, North Queensland.
2 See http://www.rrrc.org.au/publications/tourism_barometers.html
1

McNamara and Prideaux
2. Methodology The primary method used for this research was structured surveys. In order to establish a representative distribution system, a number of methods of survey distribution were used including distribution by employees of participating tour operators and on-site surveying (discussed further below). As listed in Table 1, the WTWHA is divided into twelve distinct precincts. For ease of distribution and analysis, these precincts were condensed into six survey regions, the Northern Tropics, Cairns/Kuranda, the Tablelands, the Central Coast (also known as the Cassowary Coast) and the Southern Tropics.
Table 1: Survey regions in relation to WTWHA precincts.
WTWHA Precincts Survey Regions
1 Bloomfield/Windsor
2 Daintree/Cape Tribulation
3 Douglas/Wangetti
4 Julatten/Mareeba
Northern Tropics
5 Kuranda/Cairns Cairns/Kuranda
6 Russell/Mulgrave
7 Tablelands
8 Wooroonooran
9 Koombooloomba/Kirrama
The Tablelands
10 Cassowary Coast Central Coast
11 Wallaman
12 Paluma Southern Tropics
It has been the intention of this project to obtain a representative sample in each survey region. However, in 2008 this was not achieved in all regions as discussed later on in this report. In cases were a proportional number of surveys were distributed in the WTWHA region, distribution numbers were based on tourist numbers and profiles in each of the WTWHA locations as identified by Bentrupperbäumer and Reser (2002) and Bentrupperbäumer (2002a; 2002b; 2002c). Visitors travelled to locations within the WTWHA either on tour buses/coaches or as independent travellers (using private or rented vehicles). To ensure coverage of each mode of transport, surveys were distributed by tour operators at visitor attractions and through on-site surveying. Operator support was sought through discussions with operational managers and business directors/owners. Throughout 2008, three large and one small tour operator, and two visitor attractions offered their support. Tour operators distributed surveys via tour guides in the Atherton Tablelands and Daintree National Park areas. Visitor attraction staff, under the guidance of operations managers, were responsible for distributing surveys to visitors at these sites. This limited the randomisation of the data, but was felt to be a necessary and acceptable compromise to ensure survey returns. According to Bentrupperbäumer (2002b; 2002c), the two most significant WTWHA locations that attract high visitor numbers are located in the Daintree National Park. Thus two sites in the National Park, Mossman Gorge and the Daintree Discovery Centre, were targeted for surveying by the MTSRF research team during 2008. Both sites were identified as locations
2

Rainforest Tourism Second Annual Report
visited by large audience numbers of tourists. Trained research assistants spent one day per month surveying visitors at Mossman Gorge, and one day per month at the Daintree Discovery Centre, alternating surveying days between weekdays and weekends. The survey contained a combination of questions on socio-demographics, motivations (using a Likert scale), behaviours, travel patterns and satisfaction. 2.1 Limitations The research approach adopted in this research has a number of limitations that should be considered before generalising results. First, seasonality was a limitation in survey collection. During the ‘low tourist season’ (January to March, and again in November and December), many rainforest tour operators either closed for the season or operated smaller numbers of tours to WTWHA locations. Consequently, it was difficult to achieve a high rate of sampling during this period. Moreover, during this period, the ‘wet season’ brought with it a period of heavy rainfall and localised flooding. This deterred self-drive visitors from travelling to rainforest locations such as Paluma, Daintree and Mossman Gorge. Another limitation was the potential that other specific markets have not been captured. In the 2008 collection period the survey instrument was distributed in English and Chinese, potentially causing a strong bias towards Anglophone and Chinese visitors. Given the difficulty of identifying other groups of visitors by nationality, no further translation of the instrument is planned at this time. Another key limitation that is expected to be further resolved in 2009 is the geographical distribution of surveys across the whole WTWHA. Based on the survey regions outlined in Table 1, the Central Coast region was underrepresented in this research. While operators were contacted on a number of occasions throughout 2008, time constraints and limited staffing prevented them from permanently participating in the research.
3

McNamara and Prideaux
3. Findings This section presents the overall annual and quarterly findings of rainforest tourism in North Queensland, based on surveys conducted on-site at Mossman Gorge and at the Daintree Discovery Centre, and from key rainforest tour operators and attractions throughout the WTWHA.
3.1 Surveyed visitors’ socio-demographic characteristics Gender and origin of surveyed visitors
During 2008, slightly more males (50.4%) than females (49.6%) completed the survey, differing from the 2007 results of males (47.3%) to females (52.7%). This was not always consistent throughout the year. For example, in Quarter 1 (Jan-Mar), the percentage of males who completed the survey dropped to 45.3%; whereas in Quarter 3 (Jul-Sep), this rose to 54.2%. There was little regional variation between the Northern Tropics and Cairns/Kuranda (51.2% and 53.1% male responses, respectively), but more variation existed with visitors to the Tablelands and the Southern Tropics, where only 42.9% and 43.7% of males completed the surveys. Based on the 2008 dataset, only 36.2% of respondents were from overseas, compared with 40.2% of respondents in 2007. The 2008 rate varied throughout the year. The percentage of international visitors completing the surveys dropped in Quarters 3 (Jul-Sep; 28.8%) and 4 (Oct-Dec; 27.8%), and increased substantially during Quarters 1 (Jan-Mar; 40.7%) and 2 (Apr-Jun; 41.4%). This indicates that international visitors tended to have high levels of visitation to the region during what is typically considered to be the ‘low season’ in North Queensland (particularly for domestic visitors). Figure 1 shows the origin of the entire 2008 sample of both international and domestic respondents. Domestic visitors made up the remaining 63.8% of the 2008 sample; 59.8% in 2007. Following domestic visitors, the second largest group of respondents for this research came from the United Kingdom and Ireland (9.3%; 14.0% in 2007), China (9.0%; 1.6% in 2007) and North America (5.6%; 8.9% in 2007).
0
10
20
30
40
50
60
70
80
Australia UK andIreland
China NorthAmerica
Europe NewZealand
Germany
Country of origin
% o
f sur
veye
d vi
sitor
s
20072008qtr 1qtr 2qtr 3qtr 4
Figure 1: Origin of visitors surveyed (as percentages of 2007 and 2008 annual samples, and 2008 quarterly samples).
4

Rainforest Tourism Second Annual Report
Table 2 compares the origins of visitors and the locations at whcih they completed the surveys within the WTWHA. The percentage of domestic visitors remained only somewhat consistent in each of the key regions illustrated in Table 2, peaking only at the Tablelands and the Southern parts of the World Heritage area, for instance near Paluma. Respondents from China and North America were more likely to be surveyed in the Cairns/Kuranda region.
Table 2: Comparison of the origin of survey respondents, as a percentage of surveyed visitors at four key WTWHA regions.
Country of origin Northern
Tropics (%) Cairns /
Kuranda (%) Tablelands
(%) Southern
Tropics (%)
Australia 68.5 39.9 73.6 94.2
UK and Ireland 10.6 9.2 9.9 1.2
North America 4.9 8.0 6.6 2.3
Europe 6.1 3.1 7.7 2.3
Germany 3.4 2.7 0.0 0.0
New Zealand 5.6 1.5 1.1 0.0
Scandinavia 0.7 0.0 0.0 0.0
Asia 0.2 1.5 0.0 0.0
China 0.0 34.1 1.1 0.0
5
McNamara and Prideaux
Occupation
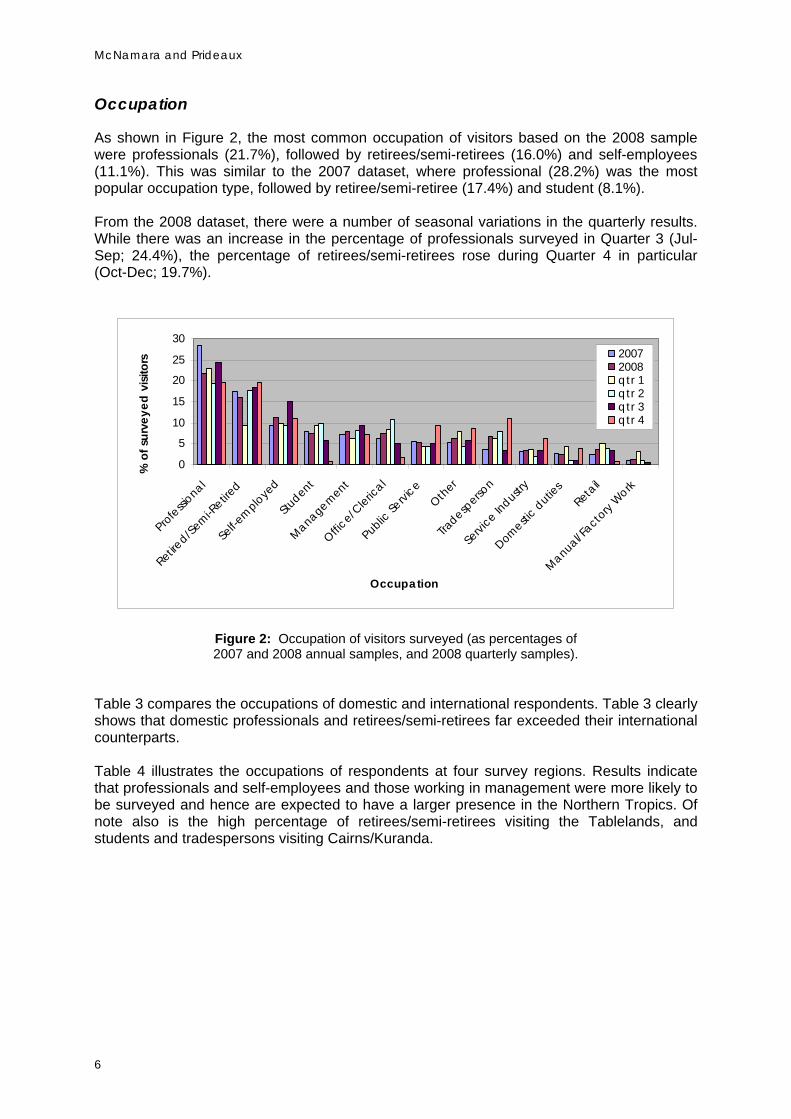
As shown in Figure 2, the most common occupation of visitors based on the 2008 sample were professionals (21.7%), followed by retirees/semi-retirees (16.0%) and self-employees (11.1%). This was similar to the 2007 dataset, where professional (28.2%) was the most popular occupation type, followed by retiree/semi-retiree (17.4%) and student (8.1%). From the 2008 dataset, there were a number of seasonal variations in the quarterly results. While there was an increase in the percentage of professionals surveyed in Quarter 3 (Jul-Sep; 24.4%), the percentage of retirees/semi-retirees rose during Quarter 4 in particular (Oct-Dec; 19.7%).
0
5
10
15
20
25
30
Professio
nal
Retired/Se
mi-Retire
d
Self-e
mploye
d
Student
Management
Office/C
lerical
Public Se
rvice
Other
Tradesp
erson
Servi
ce Industr
y
Domestic d
uties
Retail
Manual/Facto
ry Work
Occupation
% o
f sur
veye
d vi
sitor
s 20072008qtr 1qtr 2qtr 3qtr 4
Figure 2: Occupation of visitors surveyed (as percentages of 2007 and 2008 annual samples, and 2008 quarterly samples).
Table 3 compares the occupations of domestic and international respondents. Table 3 clearly shows that domestic professionals and retirees/semi-retirees far exceeded their international counterparts. Table 4 illustrates the occupations of respondents at four survey regions. Results indicate that professionals and self-employees and those working in management were more likely to be surveyed and hence are expected to have a larger presence in the Northern Tropics. Of note also is the high percentage of retirees/semi-retirees visiting the Tablelands, and students and tradespersons visiting Cairns/Kuranda.
6

Rainforest Tourism Second Annual Report
Table 3: Comparison of surveyed domestic and international visitors’ occupations.
Occupation Domestic visitors (%) International visitors (%)
Professional 24.1 17.8
Retired/Semi-Retired 18.3 11.4
Self-employed 11.5 10.6
Student 3.9 13.4
Management 7.6 8.4
Office-Clerical 6.1 10.0
Public Service 5.4 5.0
Other 6.3 5.6
Tradesperson 5.2 9.5
Service Industry 3.8 2.5
Domestic Duties 3.1 0.8
Retail 4.4 2.2
Manual/Factory Work 0.3 2.8
Table 4: Comparison of the occupations of survey respondents, as a percentage of surveyed visitors at four key WTWHA regions.
Occupation Northern
Tropics (%) Cairns /
Kuranda (%) Tablelands
(%) Southern
Tropics (%)
Professional 23.8 21.1 13.0 20.8
Retired/Semi-Retired 16.5 11.1 33.8 4.6
Self-employed 14.0 8.0 6.5 6.9
Student 5.8 12.2 3.3 9.2
Management 9.0 7.6 0.0 8.0
Office-Clerical 6.8 9.9 3.3 9.2
Public Service 5.0 6.5 6.5 1.1
Other 5.9 4.2 8.7 11.5
Tradesperson 4.3 11.8 6.5 6.9
Service Industry 3.6 1.1 6.5 4.6
Domestic Duties 1.1 1.5 5.4 9.2
Retail 3.8 0.8 6.5 8.0
Manual/Factory Work 0.4 4.2 0.0 0.0
7

McNamara and Prideaux
Age of surveyed visitors
Figure 3 presents the overall annual age of survey respondents, as well as data for each quarter. The combined bracket of 20-39 years (of age) constitutes over 41% of all respondents (also over 41% in 2007). The largest quarterly variation occurred in the 20-29 year age group. In Quarter 1 (Jan-Mar) and to a lesser extent Quarter 4 (Oct-Dec), there was a strong increase in respondents aged 20-29 years (34.2% and 23.0% respectively). Whereas towards the middle of the year, the 20-29 year age group declined in numbers, dropping to 18.4% in Quarter 2 (Apr-Jun) and 17.9% in Quarter 3 (Jul-Sep).
0
5
10
15
20
25
30
35
40
Under 20yrs 20-29yrs 30-39yrs 40-49yrs 50-59yrs 60-65yrs Over 65yrs
Age groups
% o
f sur
veye
d vi
sitor
s
20072008qtr 1qtr 2qtr 3qtr 4
Figure 3: Age of visitors surveyed (as percentages of 2007 and 2008 annual samples, and 2008 quarterly samples).
One of the aims of this research was to identify differences between the origin and age of visitors. As Table 5 illustrates, the main difference between the two groups was that international visitors were more inclined to sit within the Under 20 years or the 20-29 and 40-49 year age groups. In the 30-39, 50-59, 60-65 and Over 65 year age groups the percentage of domestic visitors exceeded international visitors.
Table 5: Comparison of age groups of surveyed domestic and international visitors.
Age group Domestic visitors (%) International visitors (%)
Under 20 yrs 3.3 3.9
20-29 yrs 19.4 28.8
30-39 yrs 19.7 18.3
40-49 yrs 14.3 18.1
50-59 yrs 22.7 19.2
60-65 yrs 11.9 6.4
Over 65 yrs 8.7 5.3
8

Rainforest Tourism Second Annual Report
Table 6 examines the age groups of respondents in four key rainforest regions in the WTWHA. The Southern Tropics was popular with younger visitors, whereas the Tablelands were popular with older visitors.
Table 6: Age group of respondents, as a percentage of surveyed visitors at four key WTWHA regions.
Age group Northern
Tropics (%) Cairns /
Kuranda (%) Tablelands
(%) Southern
Tropics (%)
Under 20 yrs 3.1 3.8 0.0 10.5
20-29 yrs 22.7 24.9 9.7 33.6
30-39 yrs 17.7 23.8 6.5 27.9
40-49 yrs 14.1 20.7 7.5 16.3
50-59 yrs 23.6 16.5 28.9 10.5
60-65 yrs 11.0 6.5 23.7 0.0
Over 65 yrs 7.8 3.8 23.7 1.2
9

McNamara and Prideaux
3.2 Surveyed visitors’ travel behaviour and motivations for travel
Travel party
The surveys conducted in 2008 reveal that the majority of visitors were travelling in North Queensland as a couple (52.7% of survey respondents; 55.8% in 2007). This figure remained largely consistent throughout the year, dropping only in Quarter 1 (Jan-Mar, 38.7%; see Figure 4).
0
10
20
30
40
50
60
70
Couple Friends Familywith
children
Relatives Alone Tour group Club
Travel party
% o
f sur
veye
d vi
sitor
s 20072008qtr 1qtr 2qtr 3qtr 4
Figure 4: Travel party of visitors surveyed (as percentages of 2007 and 2008 annual samples, and 2008 quarterly samples).
Based on travel party domestic respondents were more likely to travel as a family with children, with relatives, in a tour group or as part of a club. International respondents were more likely to travel as a couple, with friends or alone (see Table 7).
Table 7: Comparison of chosen travel parties of surveyed domestic and international visitors.
Travel Party Domestic visitors (%) International visitors (%)
Couple 52.8 52.9
Friends 15.3 15.6
Family with children 10.7 9.5
Relatives 10.2 7.0
Alone 3.8 8.9
Tour group 7.0 6.1
Club 0.2 0.0
10

Rainforest Tourism Second Annual Report
Table 8 illustrates survey regions visited by respondents in 2008, based on travel party composition.
Table 8: Travel parties of respondents, as a percentage of surveyed visitors at four key WTWHA regions.
Travel party Northern
Tropics (%) Cairns /
Kuranda (%) Tablelands
(%) Southern
Tropics (%)
Couple 58.1 50.8 49.4 26.3
Friends 13.8 12.2 17.2 36.9
Family with children 9.2 11.8 0.0 26.3
Relatives 9.7 8.4 5.4 7.9
Alone 4.7 8.8 5.4 2.6
Tour group 4.5 7.6 22.6 0.0
Club 0.0 0.4 0.0 0.0
First visit and length of stay
Figure 5 illustrates that overall, 60.4% of respondents were first-time visitors to North Queensland (65.8% in 2007). This figure remained relatively constant throughout the year, peaking in Quarter 2 (Apr-Jun) when 65.6% of respondents were on their first visit to the region. Moreover, the Southern region had the highest percentage of repeat visitors (81.4%). Of the respondents who had previously visited the region (39.6% of the total sample), the mean number of past visits to the region was four. During 2008, the average length of stay in the region was 8.46 nights (8.73 nights in 2007). While this average was consistent throughout Quarters 2 (Apr-Jun; 7.42 nights) and 4 (Oct-Dec; 7.57 nights), the average rose dramatically in Quarter 1 (Jan-Mar; 10.77 nights), and to a lesser degree in Quarter 3 (Jul-Sep; 8.52 nights).
01020304050607080
2008
2007
qtr 1 08
qtr 1 07
qtr 2 08
qtr 2 07
qtr 3 08
qtr 3 07
qtr 4 08
qtr 4 07
Northern
Cairns-K
uranda
The Ta
blelands
Southern
Time or locations
% o
f sur
veye
d vi
sitor
s
Figure 5: Percentage of respondents who were on their first visit to North Queensland (as percentages of 2007 and 2008 annual samples, 2007 and 2008 quarterly samples, and per WTWHA region).
11

McNamara and Prideaux
Accommodation
As Figure 6 illustrates, the types of accommodation chosen by respondents were resorts (25.8%), followed by hotels/motels (26.4%) and holiday apartments (18.2%). The popularity of resorts peaked in Quarters 3 (Jul-Sep; 31.4%) and 4 (Oct-Dec; 34.7%). These results were similar to the 2007 dataset, where the most popular choice of accommodation was resort (25.8%), followed by hotels/motel (24.1%) and holiday apartments (19.0%).
05
10152025303540
Resort
Hotel/M
otel
Holiday A
partment/U
nit
Carava
n Park/Cabin
Backp
acker H
ostel
Camping
Friends/R
elatives
B&B
Accommodation
% o
f sur
veye
d vi
sitor
s 20072008qtr 1qtr 2qtr 3qtr 4
Figure 6: Chosen accommodation type of visitors surveyed (as percentages of 2007 and 2008 annual samples, and 2008 quarterly samples).
Accommodation preferences based on domestic and international visitors are compared in Table 9. The results illustrate that international visitors preferred to stay in hotels/motels, backpackers’ hostels, and camping and caravan parks/cabins. On the other hand, domestic visitors preferred resorts, holiday apartments/units, caravan parks or staying with friends or relatives. Similar trends were recorded in 2007, where international visitors indicated a preference for hotels/motels, backpackers’ hostels and caravan parks/cabins, while domestic visitors’ preferences in order of popularity were resorts, hotels/motels, holiday apartments/units, caravan parks, and staying with friends or relatives. Table 10 highlights the types of accommodation chosen by respondents within each region of the WTWHA. The results highlight the prevalence of respondents camping in the Southern region of the Wet Tropics.
12

Rainforest Tourism Second Annual Report
Table 9: Comparison of choice of accommodation by surveyed domestic and international visitors.
Accommodation type Domestic visitors (%) International visitors (%)
Resort 30.3 18.2
Hotel/Motel 18.5 39.8
Holiday Apartment/Unit 22.1 11.7
Caravan Park/Cabin 7.2 7.5
Backpackers’ Hostel 3.9 7.5
Camping 7.9 8.4
Friends/Relatives 8.1 4.7
Bed ‘n’ Breakfast 2.0 2.2
Table 10: Respondents’ chosen accommodation types, as a percentage of surveyed visitors at four key WTWHA regions.
Accommodation type Northern
Tropics (%) Cairns /
Kuranda (%) Tablelands
(%) Southern
Tropics (%)
Resort 26.4 23.0 48.8 0.0
Hotel/Motel 18.4 44.1 36.0 12.1
Holiday Apartment/Unit 22.0 13.7 10.5 6.9
Caravan Park/Cabin 9.9 4.3 2.3 6.9
Backpackers’ Hostel 6.5 5.1 1.2 0.0
Camping 7.2 2.3 0.0 53.4
Friends/Relatives 6.7 5.9 1.2 20.7
Bed ‘n’ Breakfast 2.9 1.6 0.0 0.0
13

McNamara and Prideaux
Transport
It is clear from Figure 7 that the dominant mode of transport for respondents to travel to the region was air transport (41.9%), mirroring the finds from 2007 which also identified air transport as the most popular mode of travel to the region (40.9% in 2007). Other modes of transport used in 2008 included rented cars (25.1%; 30.4% in 2007) and private vehicles (21.0%; 16.0% in 2007).
0
10
20
30
40
50
60
Air
Rented car
Private
vehicle
Bus/c
oach
Rented campervan/c
arava
nOth
erRail
Cruise
boat
Transport
% o
f sur
veye
d vi
sitor
s 20072008qtr 1qtr 2qtr 3qtr 4
Figure 7: Surveyed visitors’ chosen mode of transport (as percentages of 2007 and 2008 annual samples, and 2008 quarterly samples).
In comparing international and domestic respondents, Table 11 reveals that private vehicles and rail were preferable options for domestic visitors, whereas international visitors preferred to travel by air, rental car, buses/coach and rental campervan/caravan.
Table 11: Comparison of surveyed domestic and international respondents’ chosen modes of transport.
Mode of transport Domestic visitors (%) International visitors (%)
Air 36.9 50.9
Rented car 25.0 25.9
Private vehicle 28.7 6.7
Bus/coach 5.6 7.2
Rented campervan/caravan 0.8 7.0
Other 1.0 1.7
Rail 1.8 0.3
Cruise boat 0.2 0.3
14

Rainforest Tourism Second Annual Report
Table 12 details the most popular mode of transport chosen by survey respondents to travel to the region at four key WTWHA regions. For example, visitors to the Northern Tropics region were more likely to have hired a car to travel to that region.
Table 12: Respondents’ chosen mode of transport, as a percentage of surveyed visitors at four key WTWHA regions.
Mode of transport Northern
Tropics (%) Cairns /
Kuranda (%) Tablelands
(%) Southern
Tropics (%)
Air 35.5 60.0 67.0 2.4
Rented car 35.4 16.9 1.1 3.6
Private vehicle 17.2 10.8 8.8 92.8
Bus/coach 4.3 8.8 16.5 0.0
Rented campervan/caravan 5.0 1.2 0.0 0.0
Other 1.1 1.5 1.1 1.2
Rail 1.3 0.4 5.5 0.0
Cruise boat 0.2 0.4 0.0 0.0
15

McNamara and Prideaux
Previous holidays and alternative destinations
Table 13 outlines the most popular destinations visited by respondents on their previous holiday prior to their current trip to the region. Comparisons are then made between the 2007 and 2008 annual datasets, and the destinations chosen by domestic and international visitors.
Table 13: Most popular and recent holiday destinations for surveyed visitors (as percentages of 2007 and 2008 annual totals, and domestic and international visitors).
Destinations 2007
Overall visitors (%)
2007 Domestic
visitors (%)
2007 Internat.
visitors (%)
2008 Overall
visitors (%)
2008 Domestic
visitors (%)
2008 Internat.
visitors (%)
Europe 2.6 2.9 2.1 2.4 1.9 3.3
France 3.0 0.6 6.3 3.2 0.8 7.5
Gold Coast 2.4 3.6 0.5 2.5 3.0 1.7
Italy 3.1 1.5 5.1 1.6 0.8 3.0
New Zealand 5.8 7.2 3.6 6.9 7.4 6.1
Sydney 2.0 2.3 1.6 2.8 2.4 3.6
Tasmania 3.2 4.9 0.5 3.2 3.8 2.2
UK 2.4 2.4 2.3 2.4 2.7 1.9
USA 1.8 1.5 2.0 1.9 1.3 3.0
The survey also asked respondents to list up to three alternative destinations they had considered when planning this trip. The most popular destinations are shown in Table 14. Based on the 2007 dataset, New Zealand was the most popular international destination considered, followed by Tasmania and Sydney. As for the 2008 dataset, the most popular domestic destination was Sydney, followed by Melbourne.
Table 14: Alternative destinations considered by surveyed visitors (as percentages of 2007 and 2008 annual total).
Destinations 2007 Overall visitors (%) 2008 Overall visitors (%)
New Zealand 4.5 4.0
Tasmania 2.5 1.3
Sydney 2.3 4.8
Darwin 1.8 1.8
Fiji .8 2.1
Perth 1.6 1.7
USA 1.3 1.5
Brisbane 1.2 1.6
Thailand 1.2 2.1
Western Australia 1.2 0.1
Broome 1.1 1.1
Melbourne 1.1 2.8
Uluru 1.0 0.6
16

Rainforest Tourism Second Annual Report
Motivations
The survey asked respondents to rank a number of factors that attracted them to North Queensland. Respondents were asked to rank each factor on a scale from 1 (‘Not at all important’) to 5 (‘Very important’). Results summarised in Figure 8 indicate that visiting the rainforest (mean = 4.25; 4.38 in 2007) and the Great Barrier Reef (mean = 4.22; 4.31 in 2007) was the most important motivation for visiting North Queensland. Other significant motivations included experiencing the natural environment (mean = 4.08; 4.12 in 2007), seeing wildlife (mean = 3.89; 3.94 in 2007), and rest and relaxation (mean = 4.15; 4.02 in 2007). Of interest is the low mean for meeting new people (mean = 3.05; 2.89 in 2007) and visiting friends and relatives (mean = 2.52; 2.43 in 2007). The results suggest that the major strength of the destination lies in nature-based tourism attractions and related activities.
0
0.5
1
1.5
2
2.5
3
3.5
4
4.5
5
Visit ra
inforest
Visit G
reat Barrie
r Reef
Experie
nce natural e
nvironment
Rest and re
lax
See A
ustralia
n wild
life
Climate
Visit beaches
Snorke
lling a
nd diving
Price m
atched m
y budget
Visit isl
ands
Spend tim
e with
my f
amily
Taste
tropical fr
uits
Adventure
activitie
s
Experie
nce Aborig
inal cultu
re
Experie
nce outb
ack
Meet new p
eople
Visiting fri
ends and re
latives
Go shopping
Busin
ess/confe
rence/meetin
g
Motivations
Mea
n va
lue
of v
isito
rs s
urve
yed
20072008qtr 1qtr 2qtr 3qtr 4
Figure 8: Surveyed visitors’ motivations for visiting North Queensland (as percentages of 2007 and 2008 annual samples, and 2008 quarterly samples).
A comparison of international and domestic visitors is presented in Table 15. Here it is revealed that international visitors rated the destinations’ natural features – including the Great Barrier Reef, Wet Tropics rainforests, wildlife, snorkeling and diving, beaches, islands, adventure activities, and the outback – more so than their domestic counterparts as motivations for visiting the region.
17

McNamara and Prideaux
Table 15: Comparison of surveyed domestic and international visitors’ motivations for visiting North Queensland.
Motivations Domestic visitors
(mean) International visitors
(mean)
Visit the Great Barrier Reef 3.96 4.63
Visit the rainforests 4.24 4.27
Experience the natural environment 4.12 4.03
Rest and relaxation 4.33 3.85
See Australian wildlife 3.67 4.25
Climate 3.96 3.60
Snorkelling and diving 3.24 3.70
Visit the beaches 3.55 3.57
The price matched my budget 3.48 3.25
Visit the islands 3.23 3.45
Adventure activities 3.05 3.11
Experience Aboriginal culture 2.95 3.41
Spend time with my family 3.65 3.26
Meet new people 2.99 3.14
Experience the ‘Outback’ 2.91 3.24
Taste tropical fruits 3.07 3.21
Visit friends and relatives 2.58 2.42
Go shopping 2.57 2.41
Business / conference / meeting 1.65 1.64
18

Rainforest Tourism Second Annual Report
Table 16 illustrates the total rank for each motivation in 2007 and 2008, followed by the ranks for domestic and international respondents throughout 2008. Table 16: The rank for each motivation of the overall sample in 2007 and 2008, and by domestic and international visitors in 2008.
Rank 2007 Overall sample
2008 Overall sample
2008 Domestic visitors
2008 Internat. visitors
1 Visit the rainforests Visit the rainforests Rest and relaxation Visit the Great Barrier Reef
2 Visit the Great Barrier Reef
Visit the Great Barrier Reef
Visit the rainforests Visit the rainforests
3 Experience the natural environment
Rest and relaxation Experience the natural environment
See Australian wildlife
4 Rest and relaxation Experience the natural environment
Visit the Great Barrier Reef
Experience the natural environment
5 See Australian wildlife See Australian wildlife Climate Rest and relaxation
6 Climate Climate See Australian wildlife Diving
7 Visit the beaches Visit the beaches Spend time with family Climate
8 Diving Spend time with family Visit the beaches Visit the beaches
9 The price matched my budget
Diving The price matched my budget
Visit the islands
10 Visit the islands The price matched my budget
Diving Experience Aboriginal culture
11 Spend time with family Visit the islands Visit the islands Spend time with family
12 Taste tropical fruits Taste tropical fruits Taste tropical fruits The price matched my budget
13 Adventure Experience Aboriginal culture
Adventure Experience the ‘Outback’
14 Experience Aboriginal culture
Adventure Meet new people Taste tropical fruits
15 Experience the ‘Outback’ Meet new people Experience Aboriginal culture
Meet new people
16 Meet new people Experience the ‘Outback’ Experience the ‘Outback’ Adventure
17 Visiting friends and relatives
Visiting friends and relatives
Visiting friends and relatives
Visiting friends and relatives
18 Go shopping Go shopping Go shopping Go shopping
19 Business / conference / meeting
Business / conference / meeting
Business / conference / meeting
Business / conference / meeting
19

McNamara and Prideaux
Table 17 highlights the motivations for travel to North Queensland according to the rainforest regions where visitors completed their surveys. For example, respondents in the Northern Tropics rated the Visiting the rainforests and Experiencing the natural environment as their key motivations, while respondents in the Southern region indicated that rest and relaxation was their major motivation for visiting the region. Table 17: Comparison of survey respondents’ motivations to visit North Queensland, as mean ratings per key WTWHA region.
Motivations Northern
Tropics (mean) Cairns /
Kuranda (mean) Tablelands
(mean) Southern
Tropics (mean)
Visit Great Barrier Reef 4.14 4.48 4.43 3.62
Visit rainforest 4.36 4.10 4.23 4.00
Experience natural environment 4.20 3.92 3.92 3.94
Rest and relax 4.24 3.98 3.76 4.48
See Australian wildlife 3.93 3.88 3.72 3.77
Climate 3.93 3.66 3.73 3.71
Snorkelling and diving 3.45 3.61 2.83 3.16
Visit beaches 3.67 3.50 3.08 3.47
Price matched my budget 3.38 3.46 3.47 3.50
Visit Islands 3.21 3.44 3.70 3.30
Adventure activities 3.03 3.09 3.04 3.43
Experience Aboriginal culture 3.08 3.25 3.32 2.75
Spend time with my family 3.38 3.60 3.42 4.15
Meet new people 2.98 3.07 3.16 3.49
Experience the ‘Outback’ 3.04 2.88 3.40 1.67
Taste tropical fruits 3.11 3.14 3.18 3.13
Visiting friends and relatives 2.45 2.47 2.33 3.47
Go shopping 2.41 2.60 2.57 2.83
Business/conference/meeting 1.53 1.82 1.69 1.91
20

Rainforest Tourism Second Annual Report
Information sources
The major source of information for visitors about North Queensland was friends and relatives (37.8%; 40.2% in 2007), which was reported fairly consistently across the four quarters, peaking in Quarter 3 (Jul-Sep; 44.7%). The other information sources that followed in terms of popularity – internet, guidebooks, previous visit (have been before) and travel agents – all incurred seasonal peaks and drops (see Figure 9).
05
101520253035404550
Friends a
nd relativ
es
Guidebook
Internet
Been b
efore
Travel a
gent
TV documenta
ry
Ads in prin
t
Visitor c
entreOth
er
Ads on TV
/radio
Information sources
% o
f sur
veye
d vi
sitor
s 20072008qtr 1qtr 2qtr 3qtr 4
Figure 9: Information sources used by surveyed visitors (as percentages of 2007 and 2008 annual samples, and 2008 quarterly samples).
Table 18 highlights differences in the use of information sources used by domestic and international visitors. For example, international visitors relied more heavily on guidebooks, the internet travel agents and visitor centres for information when compared with their domestic counterparts.
Table 18: Comparison of surveyed domestic and international visitors’ information sources.
Information sources Domestic visitors (%) International visitors (%)
Friends and relatives 38.8 36.0
Guidebook 18.4 34.9
Internet 25.0 29.9
Travel agent 7.2 24.7
Have been before 29.1 7.8
TV documentary 10.5 8.0
Other 7.4 2.5
Ads in print 6.1 5.3
Visitor centre 5.3 8.9
Ads on television/radio 4.1 2.8
21
McNamara and Prideaux
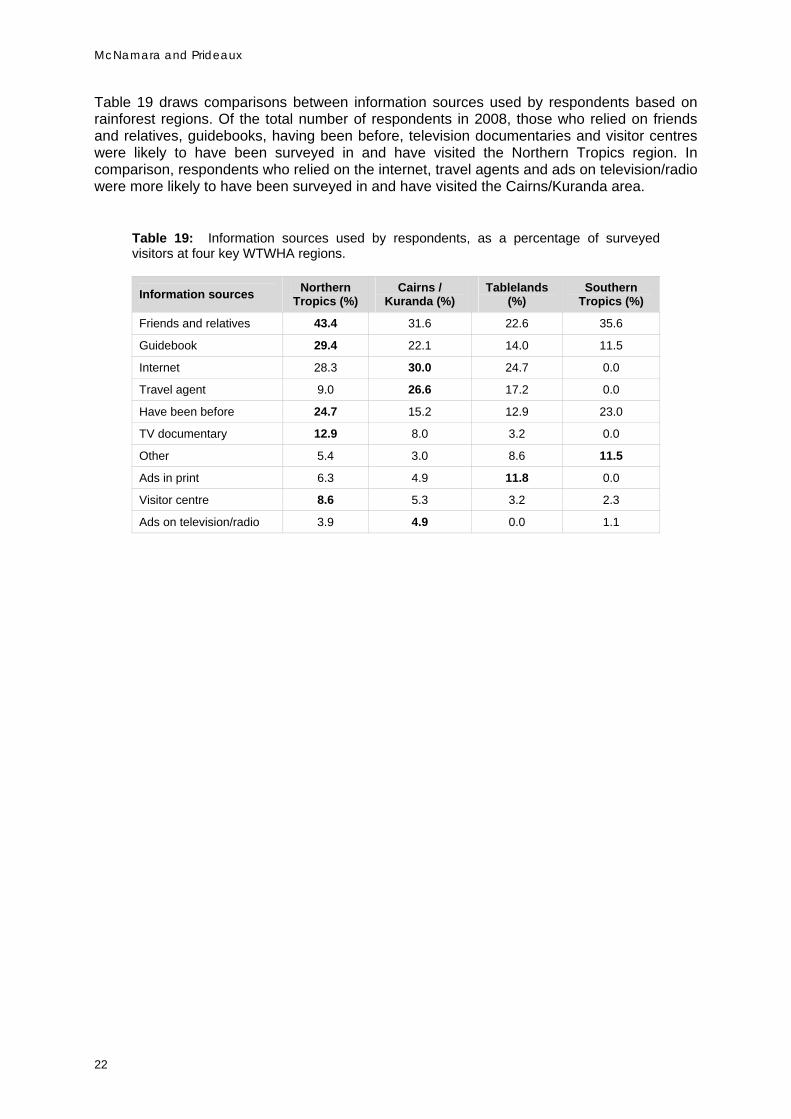
Table 19 draws comparisons between information sources used by respondents based on rainforest regions. Of the total number of respondents in 2008, those who relied on friends and relatives, guidebooks, having been before, television documentaries and visitor centres were likely to have been surveyed in and have visited the Northern Tropics region. In comparison, respondents who relied on the internet, travel agents and ads on television/radio were more likely to have been surveyed in and have visited the Cairns/Kuranda area.
Table 19: Information sources used by respondents, as a percentage of surveyed visitors at four key WTWHA regions.
Information sources Northern
Tropics (%) Cairns /
Kuranda (%) Tablelands
(%) Southern
Tropics (%)
Friends and relatives 43.4 31.6 22.6 35.6
Guidebook 29.4 22.1 14.0 11.5
Internet 28.3 30.0 24.7 0.0
Travel agent 9.0 26.6 17.2 0.0
Have been before 24.7 15.2 12.9 23.0
TV documentary 12.9 8.0 3.2 0.0
Other 5.4 3.0 8.6 11.5
Ads in print 6.3 4.9 11.8 0.0
Visitor centre 8.6 5.3 3.2 2.3
Ads on television/radio 3.9 4.9 0.0 1.1
22

Rainforest Tourism Second Annual Report
3.3 Surveyed visitors’ experiences in and satisfaction with Tropical North Queensland
Rainforest locations visited and length of stay
As Figure 10 shows, the key hotspots for experiencing the rainforests of North Queensland included Mossman Gorge (49.1%; 60.5% in 2007), Daintree (53.8%; 55.0% in 2007) and Kuranda (60.8%; 47.7% in 2007), and a strong level of intent to visit Cape Tribulation (31.8%; 31.2% in 2007).
010203040506070
Mossman G
orge
Daintree
Kuranda
Cape Tribulatio
n
Atherton
Innisfail
Mission Beach
Paluma
Rainforest locations
% o
f sur
veye
d vi
sitor
s
2007 have visited2007 intend to visit2008 have visited2008 intend to visit
Figure 10: Rainforest locations visited, and intent to visit, by 2007 and 2008 survey results. Figure 11 illustrates the length of time respondents stayed in each of the rainforest locations where they were surveyed. The table does not indicate intended length of stay in other locations. As presented in Figure 11, the results from both 2007 and 2008 show that Mossman Gorge is predominately visited for less than half a day, Kuranda for half to one day, and the Mission Beach region for more than one day.
020406080
100120140160180200
Mossman G
orge
Daintree
Kuranda
Cape Tribulatio
n
Atherton Ta
blelands
Innisfail r
egion
Mission Beach re
gion
Paluma
Rainforest locations
% o
f sur
veye
d vi
sitor
s
2008 more than one day2008 half to one day2008 less than half a day2007 more than one day2007 half to one day2007 less than half a day
Figure 11: Time spent at rainforest locations in the WTWHA by respondents.
23

McNamara and Prideaux
Table 20 provides a comparison of domestic and international visitors and their rainforest visitation patterns.
Table 20: Comparison of rainforest locations visited by surveyed domestic and international visitors.
Rainforest locations
Domestic visitors (%)
International visitors (%)
Mossman Gorge 56.3 36.0
Daintree 59.2 45.0
Kuranda 64.7 54.0
Cape Tribulation 43.0 29.2
Atherton Tablelands 53.0 22.6
Innisfail region 37.8 18.3
Mission Beach region 34.4 17.1
Paluma 21.8 5.4
Importance of visiting rainforests and knowledge
The survey posed a question on the importance of visiting the Wet Tropics rainforests while staying in the region. Visitors could respond on a scale of 1 (‘Not at all important’) through to 5 (‘Very important’). The mean from the entire sample was 4.07 (4.31 in 2007), which remained relatively consistent throughout the year, increasing only slightly in Quarters 3 (Jul-Sep; 4.18) and 4 (Oct-Dec; 4.12). The same occurred in 2007 with increases in Quarters 3 (Jul-Sep; 4.36) and 4 (Oct-Dec; 4.39). A similar follow-on question was also posed about the importance of visiting national parks whilst on holidays. The overall mean for the sample was 3.81 (3.86 in 2007). While substantially lower than the importance of visiting the Wet Tropics rainforests, this mean remained relatively consistent throughout the year, rising only slightly in Quarters 3 (Jul-Sep; 3.87) and 4 (Oct-Dec; 3.90). Again, the same occurred in 2007 with increases in Quarters 3 (Jul-Sep; 3.96) and 4 (Oct-Dec; 3.90). Visitors were also asked if they knew that the Wet Tropics rainforests were World Heritage listed prior to their visit. Of those surveyed, 61.9% (66.7% in 2007) of visitors were aware of the World Heritage listing before their visit. Almost three-quarters (72.0%; 80.7% in 2007) of domestic visitors knew that the rainforest was World Heritage listed, compared with only 44.3% (46.3% in 2007) of international visitors. A high percentage of visitors (88.6%; 95.1% in 2007) agreed that if the Wet Tropics rainforests were not World Heritage listed, they would still have visited. In this instance, there was little variation between domestic and international visitors. In that, 96.7% (89.4% in 2007) of domestic visitors and 92.4% (87.2% in 2007) of international visitors agreed that if the rainforests were not World Heritage listed they would still have visited. Rainforest activities
The survey also posed a question on visitors’ participation in a number of rainforest activities during their visit to North Queensland. Figure 12 outlines the popularity of these activities. From Figure 12, seasonality did not greatly influence the interest in any of the rainforest activities.
24

Rainforest Tourism Second Annual Report
0102030405060708090
100
Hiking
Viewing scenery
Socialisa
tion
4WD
Walkin
g
Viewing wild
life
Relaxatio
n
Guided tour
Photogra
phy
Visitor c
entres
Bike rid
ing
Camping
Birdwatching
Reading interp
reta
tion
Swim
ming
Rafting
Rainforest activities
% o
f sur
veye
d vi
sitor
sannualqtr 1qtr 2qtr 3qtr 4
Figure 12: Visitors’ levels of interest in rainforest activities as percentages of 2008 annual and quarterly samples.
Domestic visitors were more interested than international visitors in participating in all of the listed rainforest activities except for photography, visiting information centres, guided tours and bird watching. These comparisons are listed in Table 21.
Table 21: Comparison of surveyed domestic and international visitors’ interests in rainforest activities.
Rainforest activities Domestic visitors (%) International visitors (%)
Walking 82.0 66.9
Viewing scenery 74.5 69.9
General relaxation 62.8 40.7
Filming/photography 56.3 62.1
Viewing wildlife 59.7 59.6
Visiting information centres 35.4 42.1
Reading site interpretation 25.6 24.7
Guided tour 26.1 33.7
Bird watching 26.7 31.7
Swimming 36.7 34.8
Hiking 29.2 23.9
Socialising 27.6 16.0
Camping 12.0 8.4
Four-wheel driving 13.0 11.8
Rafting 9.0 4.2
Bike riding 7.9 5.9
25

McNamara and Prideaux
Table 22 highlights that a large number of visitors indicated they would participate in a number of rainforest activities in the Southern and Northern regions of the Wet Tropics.
Table 22: Respondents’ preferred rainforest activities, as a percentage of surveyed visitors at four key WTWHA regions.
Rainforest activities Northern
Tropics (%) Cairns /
Kuranda (%) Tablelands
(%) Southern
Tropics (%)
Walking 89.2 56.6 62.0 67.8
Viewing scenery 77.7 63.6 77.2 63.2
General relaxation 62.7 39.5 38.0 65.5
Film/Photography 65.4 53.5 45.7 41.4
Viewing wildlife 64.1 48.8 66.3 49.4
Visiting information centres 46.3 34.1 17.4 12.6
Reading site interpretation 32.1 17.1 15.2 16.1
Guided tour 24.3 26.7 82.6 4.6
Bird watching 34.1 22.1 13.0 28.7
Swimming 37.7 26.0 16.3 74.7
Hiking 33.6 17.1 9.8 34.5
Socialisation 20.9 17.8 26.1 48.3
Camping 9.9 4.7 1.1 44.8
4WD 12.3 10.9 4.3 28.7
Rafting 7.6 6.2 4.3 9.2
Bike riding 6.5 9.3 3.3 9.2
26

Rainforest Tourism Second Annual Report
Rainforest interpretation
This section explores the responses of surveyed visitors to a number of attitudinal statements about the on-site environmental and cultural interpretation. Six statements were posed to visitors concerning different facets of their experience. Visitors were asked to respond to these on a scale of 1 (‘Strongly disagree’) to 5 (‘Strongly agree’). Figure 13 provides a summary of these results and also provides seasonal variations. The results clearly illustrate that while the on-site environmental and cultural information was interesting and clear, it to a much lesser degree influenced site behaviour and attitude.
00.5
11.5
22.5
33.5
44.5
5
Env I
nfo inte
restin
g & clear
Env I
nfo influ
enced behavio
ur
Env I
nfo helped underst
anding
Env I
nfo influ
enced attit
ude
Cul Info in
tere
sting &
clear
Cul Info in
fluenced b
ehaviour
Cul Info helped un
derstanding
Cul Info in
fluenced a
ttitude
On-site interpretation
Mea
n va
lue
of s
urve
yed
visit
ors
annualqtr 1qtr 2qtr 3qtr 4
Figure 13: Impressions of surveyed visitors to attitudinal statements concerning environmental and cultural interpretation (as mean values of 2008 annual and quarterly samples).
27

McNamara and Prideaux
Table 23 illustrates the comparison between domestic and international visitors to six attitudinal statements regarding on-site interpretation. Domestic visitors provided increased overall means for all attitudinal statements.
Table 23: Comparison of surveyed domestic and international visitors’ attitudes to on-site interpretation.
Attitudinal statements Domestic visitors surveyed (mean)
International visitors surveyed (mean)
The environmental information…
Was interesting and clear 4.33 4.08
Influenced my site behaviour 3.81 3.61
Helped me to understand the ecological processes of this site
4.22 3.61
Influenced my attitude towards environmental conservation
3.93 3.67
The cultural information…
Was interesting and clear 4.07 3.84
Influenced my site behaviour 3.71 3.46
Helped me to understand the cultural significance processes of this site
3.99 3.73
Influenced my attitude towards environmental conservation
3.81 3.56
Table 24 presents visitors’ responses to attitudinal statements in relation to where they were surveyed. Those surveyed in the Tablelands area were more likely to agree that the level of on-site interpretation was adequate.
Table 24: Comparison of surveyed visitors’ attitudes to on-site interpretation as a percentage of surveyed visitors at four key WTWHA regions.
Attitudinal statements Northern Tropics (mean)
Cairns / Kuranda (mean)
Tablelands (mean)
Southern
Tropics (mean)
The environmental information…
Was interesting and clear 4.42 3.84 4.49 3.83
Influenced my site behaviour 3.91 3.41 3.65 3.56
Helped me to understand the ecological processes of this site
4.33 3.74 4.52 3.51
Influenced my attitude towards environmental conservation
3.98 3.51 4.07 3.49
The cultural information…
Was interesting and clear 4.13 3.66 4.40 3.54
Influenced my site behaviour 3.74 3.37 3.78 3.40
Helped me to understand the cultural significance processes of this site
4.03 3.57 4.27 3.54
Influenced my attitude towards environmental conservation
3.82 3.45 4.01 3.54
28

Rainforest Tourism Second Annual Report
Budget and visitors’ overall trip satisfaction
The survey posed a question to visitors on the overall budget for their travel party for this trip (including airfares, accommodation, tours and all other expenses). The average overall budget for surveyed visitors was $4,073 ($5,100 in 2007). This average amount budgeted for on average 2.02 (1.98 in 2007) adults and 0.20 (0.29 in 2007) children. The average budget for surveyed domestic visitors in 2008 was $3,327 (for 2.07 adults and 0.21 children). For international visitors during this same period, $5,477 was for 1.95 adults and 0.16 children. Visitors were asked to rate the overall quality of their Wet Tropics rainforest visit using a scale of 1 (‘Not at all satisfactory’) to 10 (‘Highly satisfactory’). The overall annual mean score for 2008 was 8.36 (8.55 in 2007), as shown in Figure 14. This score dropped slightly in Quarter 2 (Apr-Jun; 8.32) and quite substantially in Quarter 1 (Jan-Mar; 8.14). Furthermore, in comparing domestic and international respondents, international visitors to the region provided a lower overall annual mean (8.06; 8.50 in 2007) than domestic visitors (8.52; 8.57 in 2007). Lastly, in terms of key rainforest regions, those surveyed in the Northern Tropics region were more likely to indicate a higher level of overall trip satisfaction (8.55).
7.6
7.8
8
8.2
8.4
8.6
8.8
2007
2007 q
tr 1
2007 q
tr 2
2007 q
tr 3
2007 q
tr 4
2007 d
omestic vi
sitor
2007 i
nternatio
nal visit
or
2007 N
orthern
2007 C
airns-K
uranda
2007 T
he Tablelands
2007 C
entral C
oast20
08
2008 q
tr 1
2008 q
tr 2
2008 q
tr 3
2008 q
tr 4
2008 d
omestic vi
sitor
2008 i
nternatio
nal visit
or
2008 N
orthern
2008 C
airns-K
uranda
2008 T
he Tablelands
2008 S
outhern
Time, location, origin
Mea
n va
lue
of s
urve
yed
visit
ors
Figure 14: Surveyed visitors’ overall satisfaction with their trip to North Queensland, as means of annual and quarterly, domestic and international, and rainforest location totals in 2007 and 2008.
29

McNamara and Prideaux
4. Publication List – Year Two Quarterly ‘Tourism Barometers’
2008 Rainforest Tourism Barometers – Quarters 1, 2, 3 and 4 Available for download: http://www.rrrc.org.au/publications/tourism_barometers.html Survey Fact Sheet
McNamara, K. (2009) Visitors’ interest in walking trails and self-drive trips within the Wet Tropics of Queensland World Heritage Area. Available for download: http://www.rrrc.org.au/mtsrf/theme_4/project_4_9_2.html Peer-Reviewed Articles
McNamara, K.E. and Prideaux, B. (Accepted) From the one forest to the next: A profile of visitors to Australia’s tropical rainforest and their past forest-based travel patterns. Sakal Tourism Journal / World Tourism Journal. McNamara, K.E. and Prideaux, B. (Accepted) Threat or saviour? The case of tourism in Australia’s World Heritage rainforest. Consilience: The Journal of Sustainable Development. McNamara, K.E. and Prideaux, B. (In review) Experiencing ‘natural’ heritage. Area. McNamara, K.E. and Prideaux, B. (In review) More than just pretty trees: The educational, experiential and hiking market in Australia’s World Heritage Wet Tropics rainforest. Asia Pacific Journal of Tourism Research. McNamara, K.E. and Prideaux, B. (In review) Reading, learning and enacting: Visitor use of interpretation in the Wet Tropics rainforest, Australia. Environmental Education Research. McNamara, K.E. and Prideaux, B. (In review) Understanding your rainforest tourism market: A case of Australia’s Wet Tropics. Turismo em Análise.
For information about this project, contact the project team: Prof Bruce Prideaux, Project Leader [email protected] ...............................Phone (07) 4042 1039 Dr Karen McNamara, Project Manager [email protected] ...........................Phone (07) 4042 1762
These and related reports are available for download from the Marine and Tropical Sciences Research Facility website:
http://www.rrrc.org.au/publications/index.html
30

Rainforest Tourism Second Annual Report
31
5. References Bentrupperbäumer, J.M. (2002a) Lake Barrine: Site level Data Report 2001/2002. Cairns: Rainforest CRC. Available for download: Bentrupperbäumer, J.M. (2002b) Marrdja Boardwalk: Site level Data Report 2001/2002. Cairns: Rainforest CRC. Available for download: Bentrupperbäumer, J.M. (2002c) Mossman Gorge: Site level Data Report 2001/2002. Cairns: Rainforest CRC. Available for download: Bentrupperbäumer, J. and Reser, J. (2002) Measuring and Monitoring Impacts of Visitation and Use in the Wet Tropics World Heritage Area: A Site-Based Bioregional Perspective. Cairns: Rainforest CRC. Available for download: