Site- and rainfall-specific runoff coefficients and critical rainfall for ...

Rainfall-Runoff-Inundation Prediction at the River Basin Scale
Development of RRI Model and Its Application to Climate Change Impact
Assessment and Real-time Flood Inundation Predictions
1) Disaster Prevention Research Institute (DPRI), Kyoto University
2) International Centre for Water Hazard and Risk Management (ICHARM)
Takahiro Sayama1), Yusuke Yamazaki2), Yoichi Iwami2)

Summary of Rainfall-Runoff-Inundation (RRI) Model
- Since 2010 at ICHARM, Public Works Research Institute, Japan
- Concept: rainfall-runoff and inundation simulation at the river basin scale
- Target: real time inundation predictions and risk assessment
- As of 2016, the package including Fortran source codes, English manual, GUI (Model builder + Viewer) are available through ICHARM webpage (http://www.icharm.pwri.go.jp/research/rri/rri_top.html)
- Recent advancement: GW, detail cross section, time and space accounting,
coupling with WEB-DHM (mainly SiB2 component) and RRI.
- Practical applications at ICHARM: UNESCO Pakistan Project (Indus), JICA Thai Project (Chao Phraya), ADB Myanmar Project for hazard mapping (Irrawaddy)
- Application for scientific studies: hydrologic sensitivity, climate change impact, effects of GW etc.
2
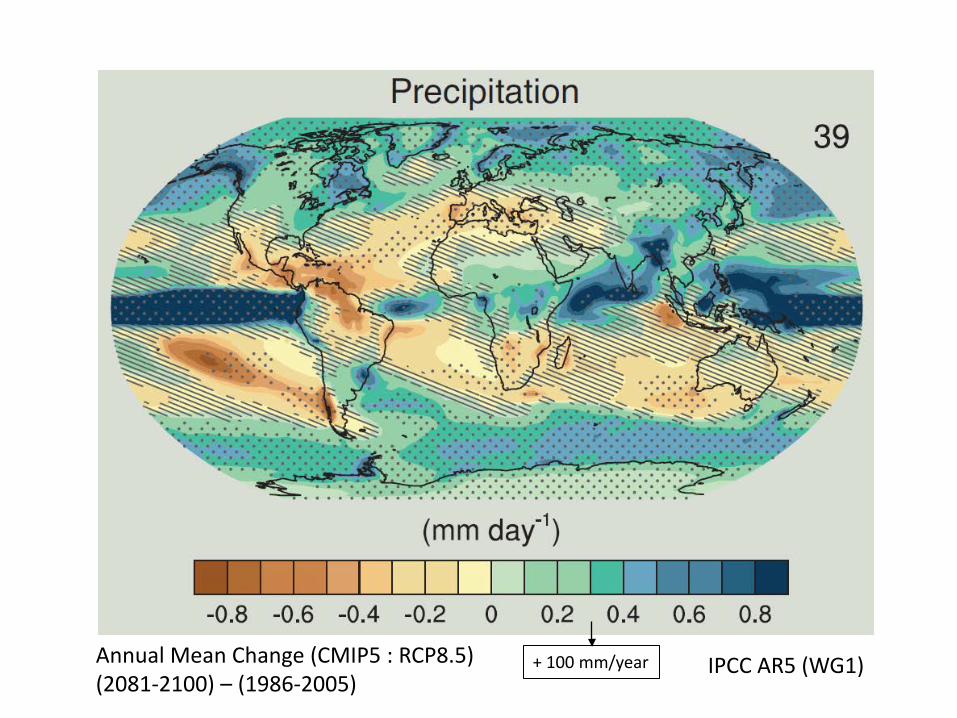
IPCC AR5 (WG1) Annual Mean Change (CMIP5 : RCP8.5) (2081-2100) – (1986-2005)
+ 100 mm/year
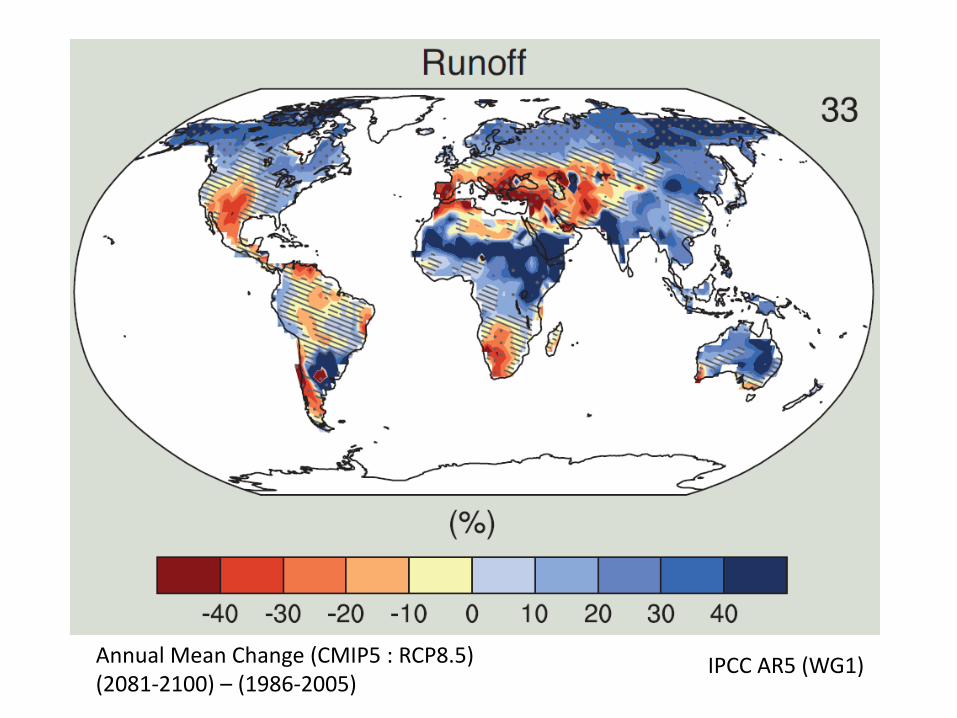
Annual Mean Change (CMIP5 : RCP8.5) (2081-2100) – (1986-2005)
IPCC AR5 (WG1)
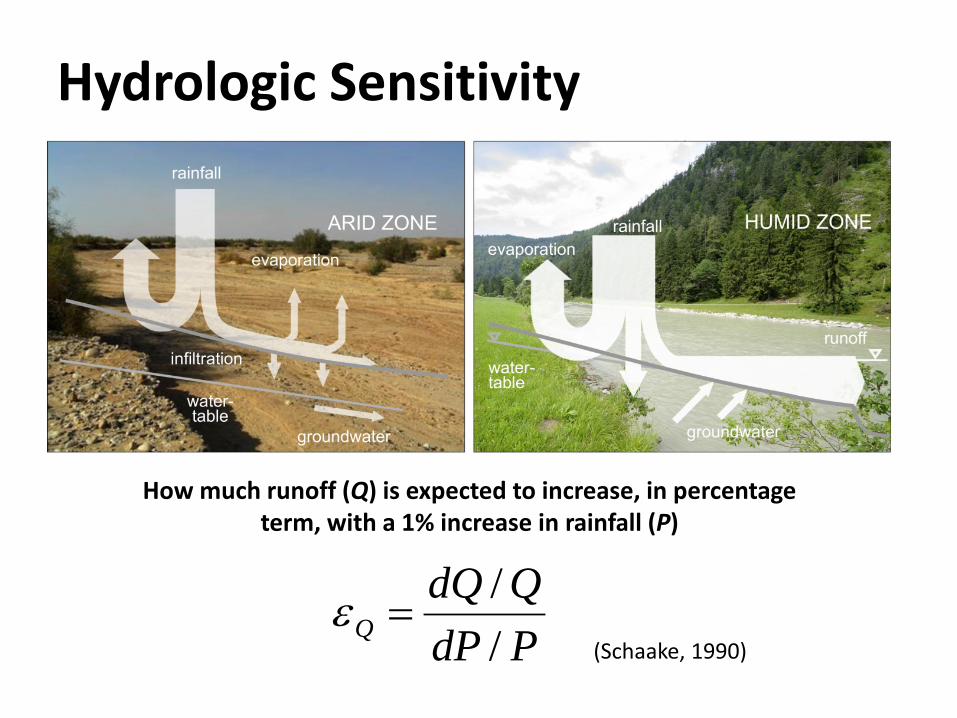
(Schaake, 1990) PdPQdQ
Q //
=ε
How much runoff (Q) is expected to increase, in percentage term, with a 1% increase in rainfall (P)
Hydrologic Sensitivity

Elasticity of Flood Runoff and Inundation
(Schaake, 1990) PdPQdQ
Q //
=ε
PdPFFd
F // ∆∆
=ε
6
How much runoff (Q) and inundation (∆F) volumes are expected to increase, in percentage term, with a 1% increase in rainfall (P)
(Sayama, NHESS, 2015)
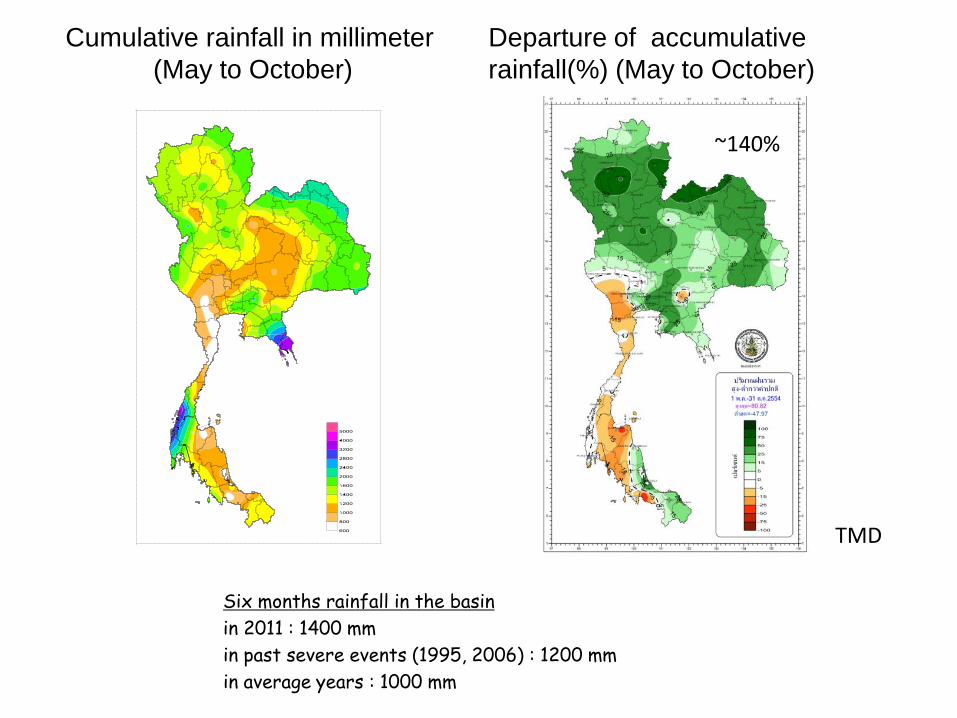
Departure of accumulative rainfall(%) (May to October)
Cumulative rainfall in millimeter (May to October)
97 98 99 100 101 102 103 104 105 106
9 98 99 00 0 0 03 0 05 06
5
6
7
8
9
10
11
12
13
14
15
16
17
18
19
20
21
TMD
~140%
Six months rainfall in the basin in 2011 : 1400 mm in past severe events (1995, 2006) : 1200 mm in average years : 1000 mm

STEP1 : Rainfall-Runoff-Inundation simulation with observed rainfall 2 km resolution, 52 years : 1960-2011 ⇒ Estimate rainfall and flood inundation volumes ⇒ Estimate elastisity of flood runoff and inundation to rainfall
STEP2: RRI simulation with MRI-AGCM projection AGCM3.2S (20 km), AGCM3.2H (60 km) – RCP 8.5 scenario ⇒ Present climate (1979-2003) : 1 cases (3.2S) ⇒ Future climate (2075-2099) : 4 cases (3.2S, 3.2H: 3 cases)
Approach

Rainfall-Runoff-Inundation Model
2D Diffusion on Land
Subsurface + Surface Vertical Infiltration
1D Diffusion in River
• Two-dimensional model capable of simulating rainfall-runoff and flood inundation simultaneously
• The model deals with slopes and river channels separately
• At a grid cell in which a river channel is located, the model assumes that both slope and river are
positioned within the same grid cell
Rainfall
DEM
Land Cover
Cross Sec.
Input
Discharge
W. Level
Inundation
Output
Sayama, T. et al.: Rainfall-Runoff-Inundation Analysis of Pakistan Flood 2010 at the Kabul River Basin, Hydrological Sciences Journal, 57(2), pp. 298-312, 2012.
20

10
Rainfall-Runoff-Inundation
1. Rainfall-runoff and inundation cannot be separated with large inundation 2. Kinematic wave is not suitable for flat topography 3. Important for representing inundation process for better river predictions 4. Inundation itself may be of interest in flood forecasting or risk assessment
Motivations of using Rainfall-Runoff-Inundation Model
Rainfall-Runoff Model
River Routing Model
Flood Inundation Model
Precipitation
Discharge
Water Level
Inundation
Three kinds of models for flood predictions

1 : July 1 31 : Aug 1 62 : Sep 1 92 : Oct 1 123 : Nov 1 152 : Nov 30
Rainfall-Runoff-Inundation Prediction
of Thailand Flood 2011 (conducted on 2011/10/14)
http://www.icharm.pwri.go.jp/news/news_j/111024_thai_flood_j.html
Simulation Domain : 163,293 km2
Grid Size : 60sec (1776 x 1884 m) Simulation Period: 2011/07/01 – 2011/11/30 Input Rainfall: 2011/07/01 – 2011/10/14 3B42RT (Satellite Based Rainfall) (Every 3hours, Spatial Resolution: 0.25 deg) 2011/10/14 – 2011/10/21 JMA- GSM Weekly Weather Forecasting (Forecasting Lead Time: 8 days, Update every 12 hours) 2011/11/15 – 2011/11/30 (Previous year’s 3B42RT rainfall in the same period)
Nakhon Sawan
Bangkok
Ayutthaya
W. Depth
11
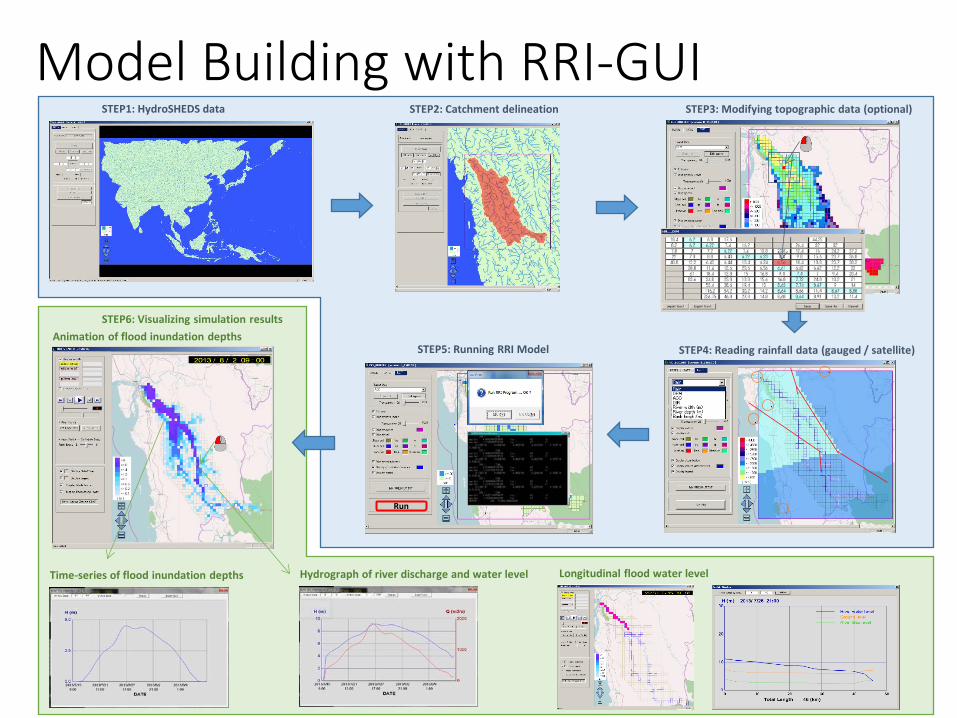
Model Building with RRI-GUI
Run
STEP1: HydroSHEDS data STEP2: Catchment delineation STEP3: Modifying topographic data (optional)
STEP4: Reading rainfall data (gauged / satellite) STEP5: Running RRI Model
STEP6: Visualizing simulation results Animation of flood inundation depths
Time-series of flood inundation depths Hydrograph of river discharge and water level Longitudinal flood water level

(A) Only overland flow (no infiltration loss, no
subsurface flow)
Surface / subsurface flow conditions
(B) Vertical infiltration + Infiltration excess
overland flow
(C) Saturated subsurface + Saturation excess overland
flow
Three Conditions of Surface / Subsurface Flow
13
( )
( )[ ] ( )
( )[ ] ( ) ( )
<−+−+−
≤<−+−
≤
−
=
hddhnIIdhkdk
dhdIdhkdk
dhIddhk
q
aamamm
ammamm
mmm
m
35
β
(Tachikawa et al., JSCE, 2004)

Annual Maximum Inundation Extent 2005 2006 2007 2008 2009 2010 2011
Remote Sensing
(Composite)
RRI Model
Source: GISTDA (Thailand) Source: UNOSAT
0
5000
10000
15000
20000
25000
2005 2006 2007 2008 2009 2010 2011
Inun
datio
n Ar
ea [
km2 ]
Year
RRI
RS
Relative Error FIT
2005 0.16 0.08
2006 0.47 0.31
2007 0.18 0.14
2008 0.05 0.15
2009 0.01 0.12
2010 0.52 0.25
2011 0.21 0.46
Avg. 0.23 0.21

2011 Flood (1391 mm)
Average (1019 mm)
Past Floods 1995, 2006 (~1200mm)
d∆F/dP = 0.25 with dams : + 200 mm rainfall + 50 mm (= 8.2 billion m3 ) inundation Available storages of Bhumipol and Sirikit dams in April 15, 2011 (six mo. before the peak) : 46 mm (=7.5 billion m3) The dams contributed to reduce the inundation by 26 mm (=4.4 billion m3)
no dam with dams
Flood Inundation Volume
Flood Runoff

Elasticity of Flood Runoff and Inundation
By taking 6 month rainfall = 1200 mm as the basis,
Elasticity of peak discharge at C2: εpQ = 1.5
Elasticity of total runoff: εQ = 2.3 Elasticity of flood inundation volume: εF = 4.2
Flood inundation volume increases by 4.2 %
if the monsoon rainfall increases by 1%
16
PdPQdQ
Q //
=εPdP
FFdF /
/ ∆∆=ε
Sayama et al., Hydrologic sensitivity of flood runoff and inundation: 2011 Thailand floods in the Chao Phraya River basin, Nat. Hazard Earth Syst. Sci., 15, pp. 1 – 14, doi:10.5194/nhess-15-1-2015, 2015