Railroad 101 & The Port and Railroad Relationship gravity due to the presence of a high proportion...
38
Presentation to Association of Pacific Ports, 2015 Winter Conference Lihue, Hawaii Eric B. Winters, P.E. T.Y. Lin International Railroad 101 & The Port and Railroad Relationship January 17 th , 2015
Transcript of Railroad 101 & The Port and Railroad Relationship gravity due to the presence of a high proportion...

Presentation to
Association of Pacific Ports, 2015 Winter Conference
Lihue, Hawaii
Eric B. Winters, P.E.
T.Y. Lin International
Railroad 101 &
The Port and
Railroad
Relationship
January 17th, 2015
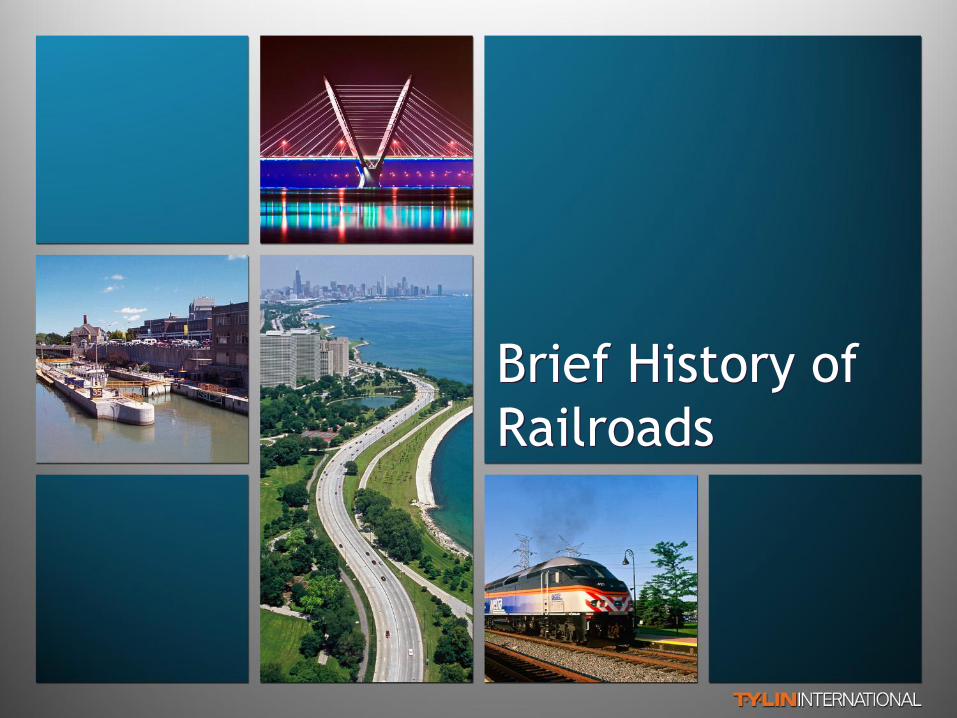
Brief History of
Railroads
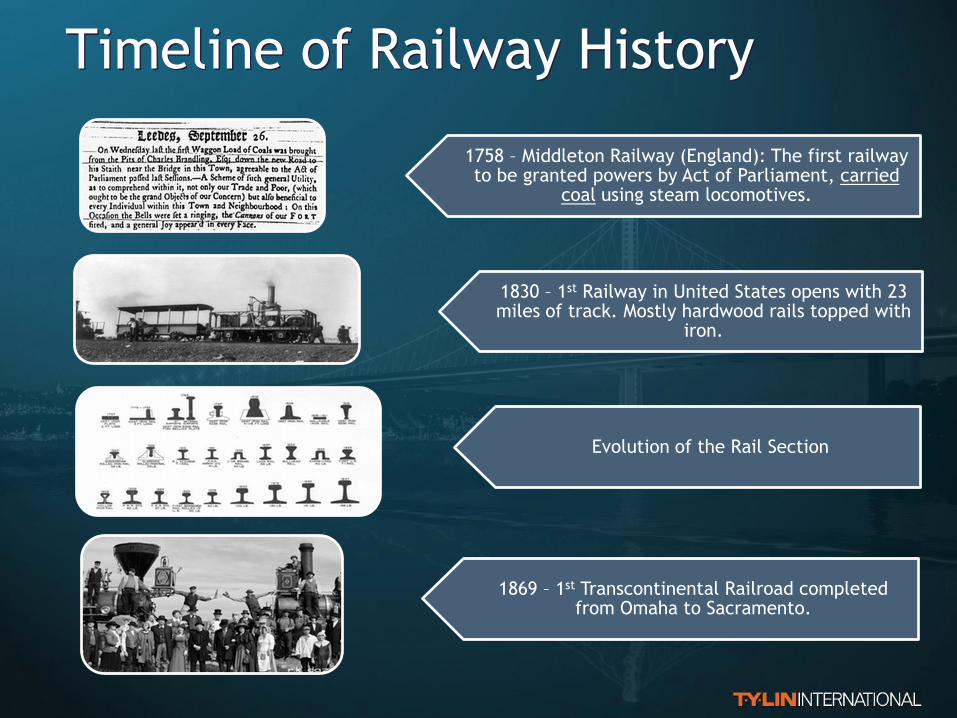
Timeline of Railway History
1758 – Middleton Railway (England): The first railway to be granted powers by Act of Parliament, carried
coal using steam locomotives.
1830 – 1st Railway in United States opens with 23 miles of track. Mostly hardwood rails topped with
iron.
Evolution of the Rail Section
1869 – 1st Transcontinental Railroad completed from Omaha to Sacramento.

Timeline of Railway History (cont)
1937-41 - Magnetic levitation (maglev) train patents awarded in Germany to Hermann Kemper, with design
propelled by linear motors.
1946 - U.S. railroads begin rapidly replacing their rolling stock with diesel-electric units. Process not completed
until the mid 1960s.
1950s and 1960s: Drastic decline in passenger travel in the United States, due to automobiles and also airplanes.
1980 Staggers Act – Federal Law that reduced federal regulation of railroads
Capacity and Investment
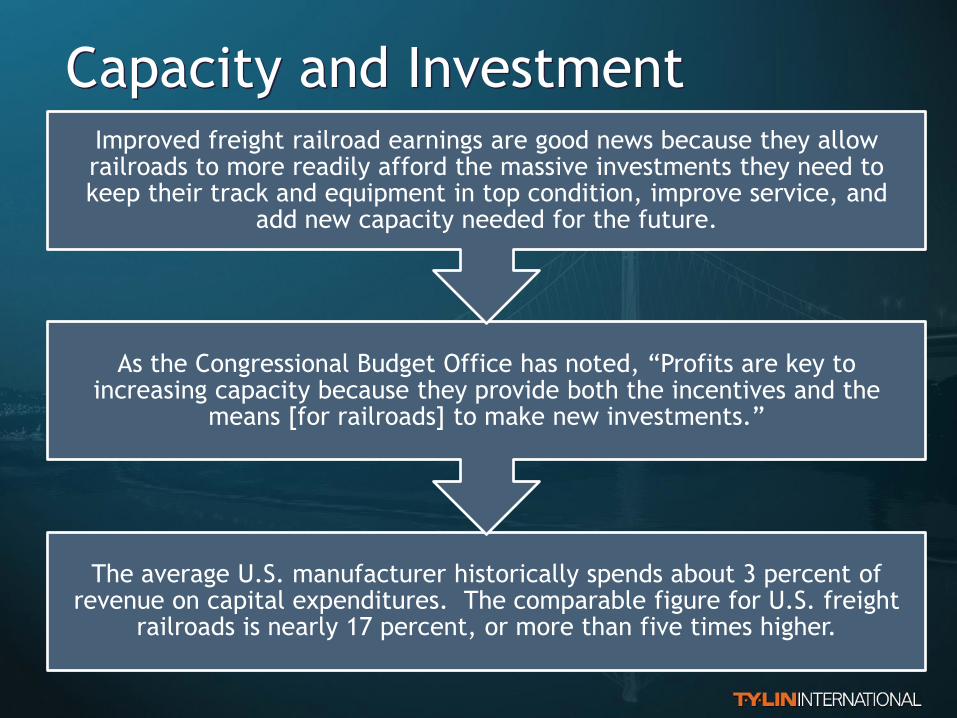
The average U.S. manufacturer historically spends about 3 percent of revenue on capital expenditures. The comparable figure for U.S. freight
railroads is nearly 17 percent, or more than five times higher.
As the Congressional Budget Office has noted, “Profits are key to increasing capacity because they provide both the incentives and the
means [for railroads] to make new investments.”
Improved freight railroad earnings are good news because they allow railroads to more readily afford the massive investments they need to keep their track and equipment in top condition, improve service, and
add new capacity needed for the future.
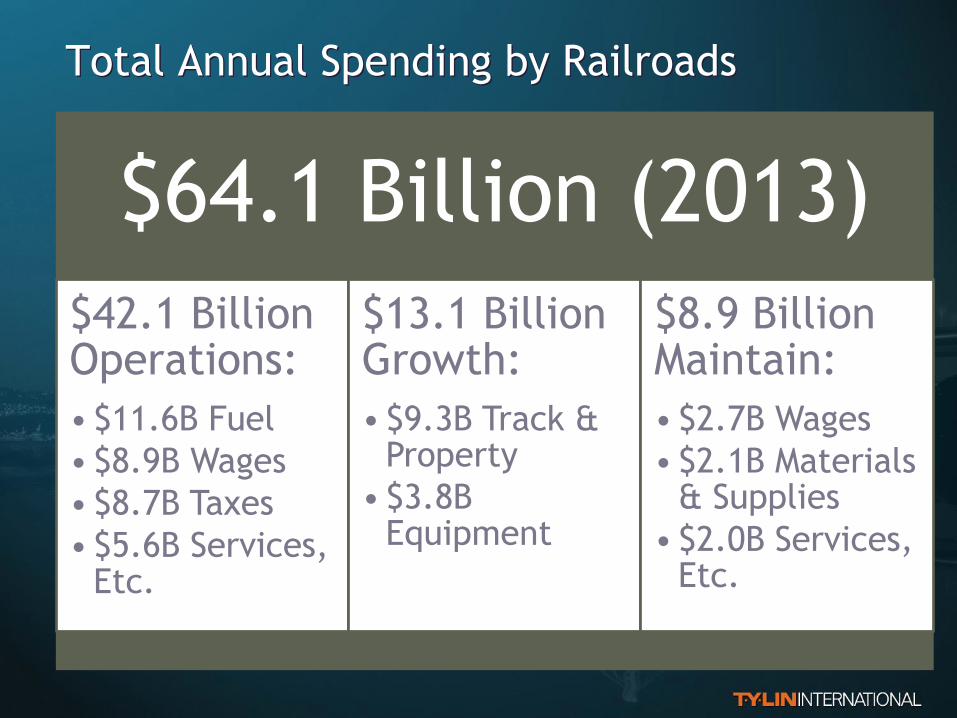
Total Annual Spending by Railroads
$64.1 Billion (2013)
$42.1 Billion Operations:
• $11.6B Fuel
• $8.9B Wages
• $8.7B Taxes
• $5.6B Services, Etc.
$13.1 Billion Growth:
• $9.3B Track & Property
• $3.8B Equipment
$8.9 Billion Maintain:
• $2.7B Wages
• $2.1B Materials & Supplies
• $2.0B Services, Etc.
Rail is Good Public Policy
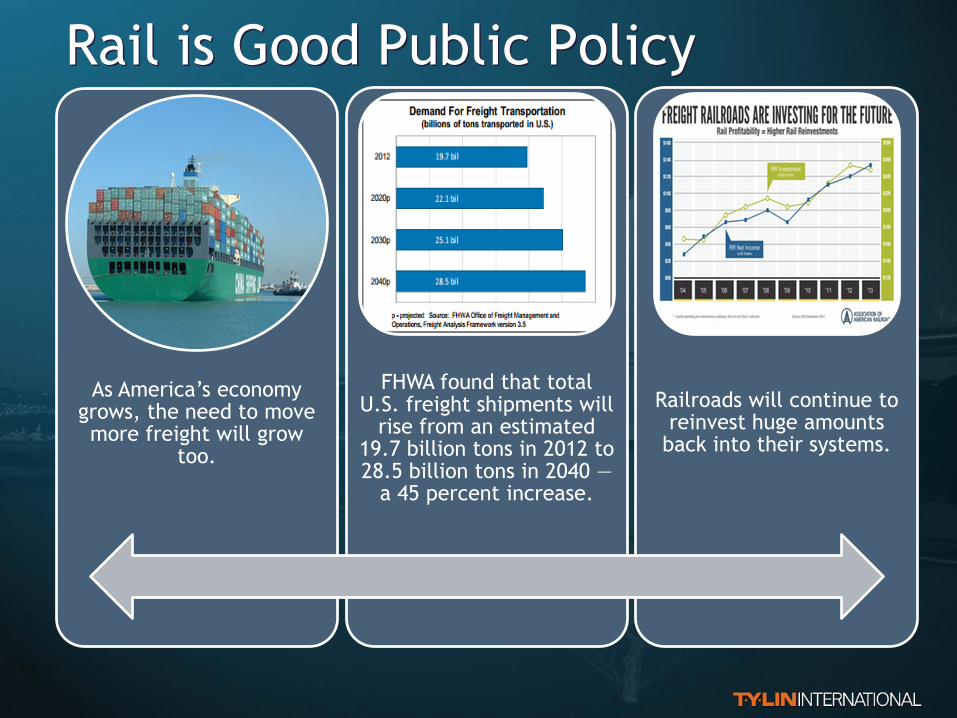
As America’s economy grows, the need to move more freight will grow
too.
FHWA found that total U.S. freight shipments will
rise from an estimated 19.7 billion tons in 2012 to 28.5 billion tons in 2040 —
a 45 percent increase.
Railroads will continue to reinvest huge amounts
back into their systems.
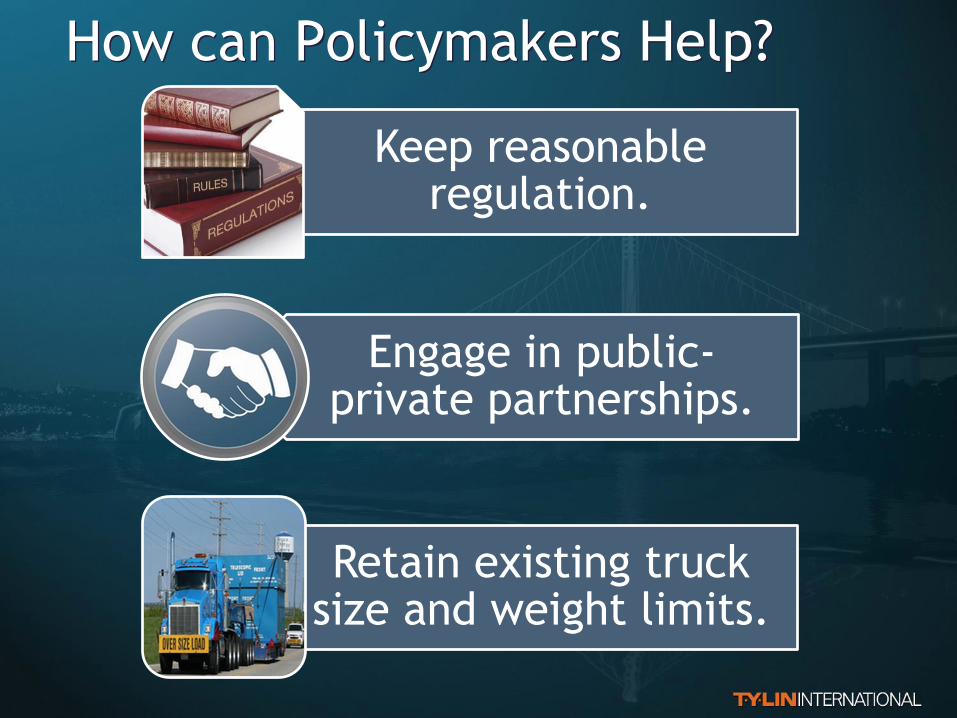
How can Policymakers Help?
Keep reasonable regulation.
Engage in public-private partnerships.
Retain existing truck size and weight limits.
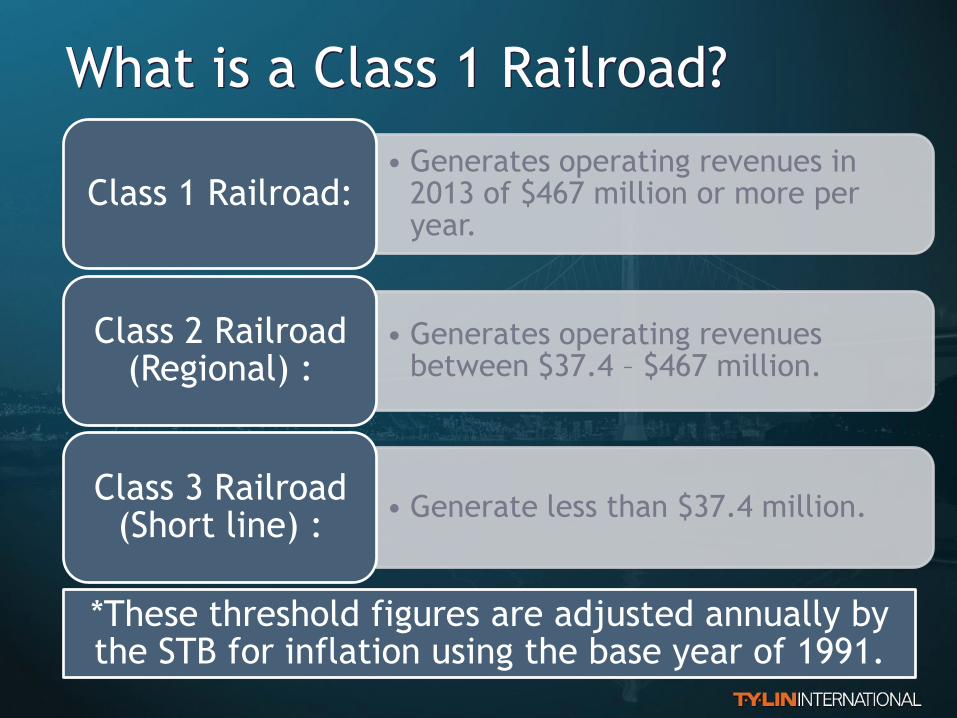
• Generates operating revenues in 2013 of $467 million or more per year.
Class 1 Railroad:
• Generates operating revenues between $37.4 – $467 million.
Class 2 Railroad (Regional) :
• Generate less than $37.4 million. Class 3 Railroad
(Short line) :
*These threshold figures are adjusted annually by the STB for inflation using the base year of 1991.
What is a Class 1 Railroad?


2014 Freight by Volume
• 17.0 million units Trailers & Containers
• 6.3 million carloads Coal
• 2.2 million carloads Chemicals
• 1.3 million carloads Autos
• 1.6 million carloads Grain
• 1.2 million carloads Petroleum
*As reported by the AAR

Ports and the
Railroad
Relationship
OEM Operations
Engineering
Maintenance

Intermodal/Container Yards
Massive overhead container cranes.
Straddle cranes or side loaders.
Support/storage tracks.
Parking/storage areas.
Gate areas.

Coal
In 2013, energy sources & percent share of electricity generation in the United States were
Coal 39% Natural Gas
27% Nuclear 19%
Hydropower 7%
Renewable 6%
Projections estimate demand for coal will increase 21% by 2030; therefore hauling coal will continue to play a major
role in the future of the Railroad Industry.
No single commodity is more important to America’s railroads than coal.

Coal Facilities
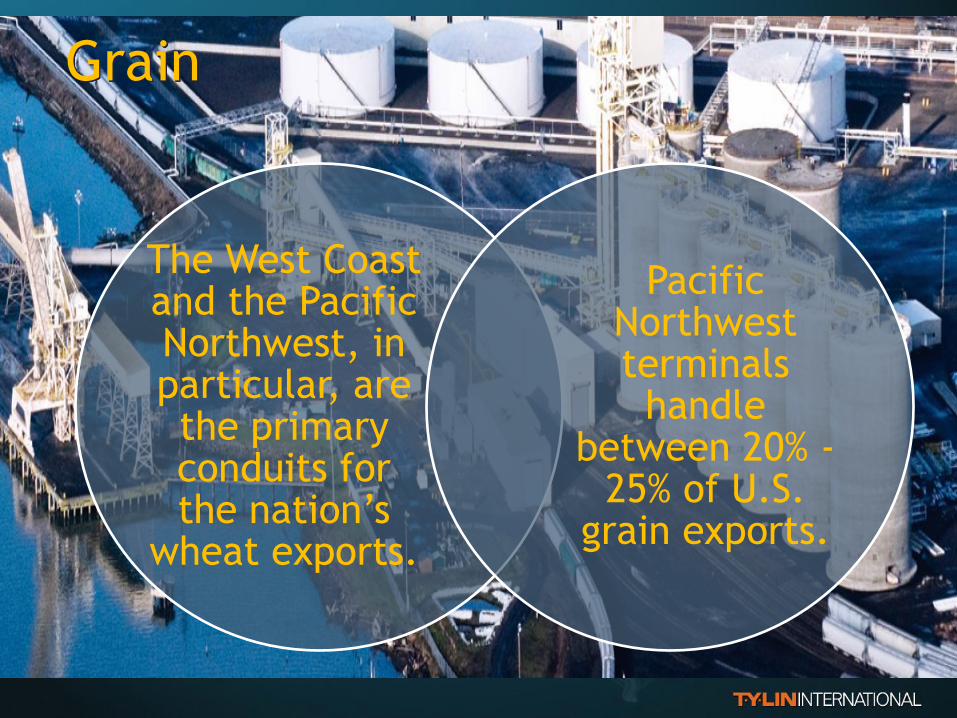
Grain
The West Coast and the Pacific Northwest, in particular, are the primary conduits for the nation’s
wheat exports.
Pacific Northwest terminals handle
between 20% - 25% of U.S.
grain exports.

Railroad Operations that affect design
Port and Terminal Operators should
have a basic understanding of the railroad operations when receiving and handling railroad
cars including
Type, Size, and Number of cars to be delivered.
How the cars will be handled
within the terminal
How the cars should be assembled for pickup.
What is the position of the train prior to
departure?
Is the terminal the
origin of train?
Time needed for
inspections (air test)
Will any maintenance
be performed at the terminal.

Track Design Criteria that affects footprint
Facility Footprint
Maximum Horizontal Curvature
Maximum Grade & Vertical Rate of Change
Track Centers
Walkways (No.1 & No.2)
Access Roads
(Railroad & Port Staff)
Crossings (Not
public)

Each Railroad will have its own Design Criteria, e.g.
•BNSF Guideline for Industrial Track Projects, (DGFITP).
•UPRR/BNSF Common Standards for Grade Separations.
•UPRR/BNSF Common Standards for turnouts.
Railroad Design Criteria

Walkways & Track Sections

Alternatives Development Phase Include car spot detail showing train car positions during
arrival & departure; including the locomotive units. Count the number of cars shown to verify capacity requirements.
Review construction phasing per alternative before
selecting preferred alternative including; Construction staging areas.
Haul roads within the terminal.
Demolition phase.
Areas of impact per phase.
Duration of each phase.
Must identify impacts to existing operations
An Alternative is NOT valid until the impacts of
construction are identified, evaluated and accepted.

Constructability (a part of Engineering)
Constructability (or buildability), the integration of
construction expertise into all phases of a project.
DON’T WAIT UNTIL PRE-CONSTRUCTION.
Can benefit cost, schedule, quality, and other key
objectives of the project.
Constructability is not just review of completed
drawings; it is not criticism of the designer; nor is it
optimizing construction at the expense of other
activities. Constructability involves thinking about how
to build a project even before it is designed..
Owners need to be aware of the impacts to their existing
facilities and operations during construction in order to
evaluate the true costs of construction.

Vancouver Wharves

Port of Vancouver, Washington
WVFA Project 2 — Utility Relocation
WVFA Projects 4 and 7 — Relocation of the Bulk Unloading Facility
WVFA Project 5 — Property Acquisition
WVFA Project 6 — Terminal 3 Rail Access
WVFA Project 8 — Grain Subdivision Phase B
WVFA Project 9 — Grain Track Unit Train Improvements Phase A
WVFA Project 10 — Bulk Facility/Subaru Track Relocation
WVFA Project 11 — Grain Track Unit Train Improvements Phase B
WVFA Project 12 — Grain Track Unit Train Improvements Phase C
WVFA Projects 13, 14 and 15 — Malting Facility Relocation
WFVA Project 19 — Gateway Avenue Overpass
WVFA Project 20 — BNSF Construction and Maintenance Agreement
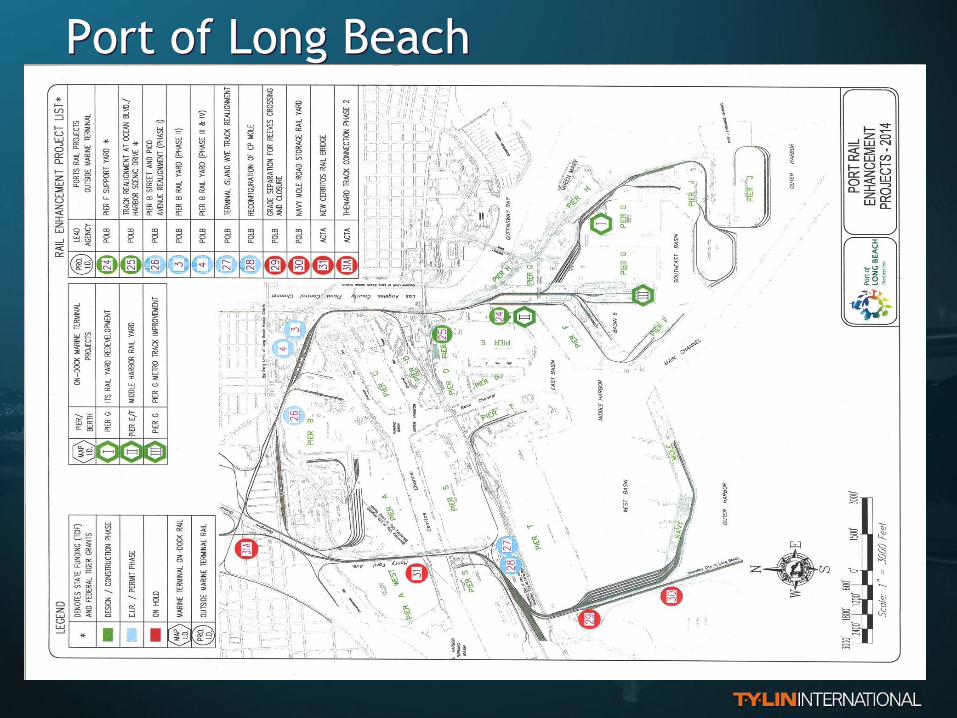
Port of Long Beach

Port of Los Angeles

Maintenance
All facilities require maintenance, Railroad facilities are
no different.
FRA Code of Federal Regulations (CFR) Title 49, Part
213, Subpart 233 – Track Inspections Tracks other than Main & Sidings require Monthly inspections with at
least 20 calendar days between inspections.
Include agreements for inspections and maintenance of
track owned by the Port.

Conclusions
OEM: Communication – Communication – Communication
Operations
• Train movements (arrival , internal & departure), train position.
• Required railroad procedures at the terminal; air & brake tests, car inspection, bad orders & maintenance. (Fueling?)
• Port operations around railcars
• Emergency procedures
Engineering
• Track geometry & track centers
• Walkways & Access Roads
• Lighting for nighttime operations
• Yard Air
• Crossings
• Constructability
Maintenance
• Who is inspecting, and who is maintaining.

Questions
Contact Information:
Eric B. Winters, P.E.
15440 Laguna Canyon Road
Suite 270
Irvine, CA 92618
Email: [email protected]
Mahalo for your time and attention!

Additional Information

Where do we get our Coal?
Appalachian Region (West Virginia & Pennsylvania) 25%
Interior Region (Illinois & Kentucky) 17%
Western Region (Wyoming) 58%
The Powder River Basin (PRB) is an area in southeast Montana and northeast Wyoming known for its natural coal deposits.
Powder River Basin coal is low-sulfur, subbituminous coal. While it contains 15 times less sulfur than Eastern (Appalachian) coal, it also has fewer Btu’s of energy or a lower “heat rate,” which means that coal-fired power plants need to burn nearly 50 percent more of it to match the power output from Eastern coal.

Power River Basin

Cool Coal Facts
There are currently plans to develop the largest coal
export facility in North America at Cherry Point, in
northwest Washington state.
Coal mined from the Powder River Basin would be
hauled by trains along BNSF rail lines.
The coal train corridor extends from mines in Montana
and Wyoming through Sandpoint, Idaho to Spokane,
down through the Columbia River Gorge, then up along
the Puget Sound coast, passing through Longview,
Tacoma, Seattle, Edmonds, Everett, Mt. Vernon,
Bellingham, Ferndale and all points in between.
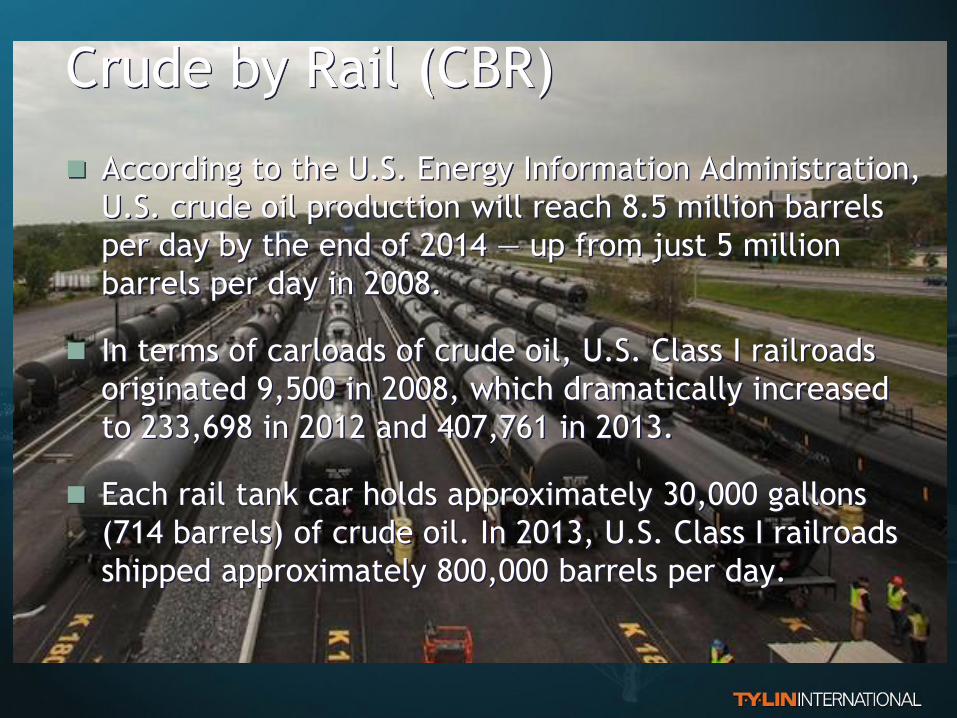
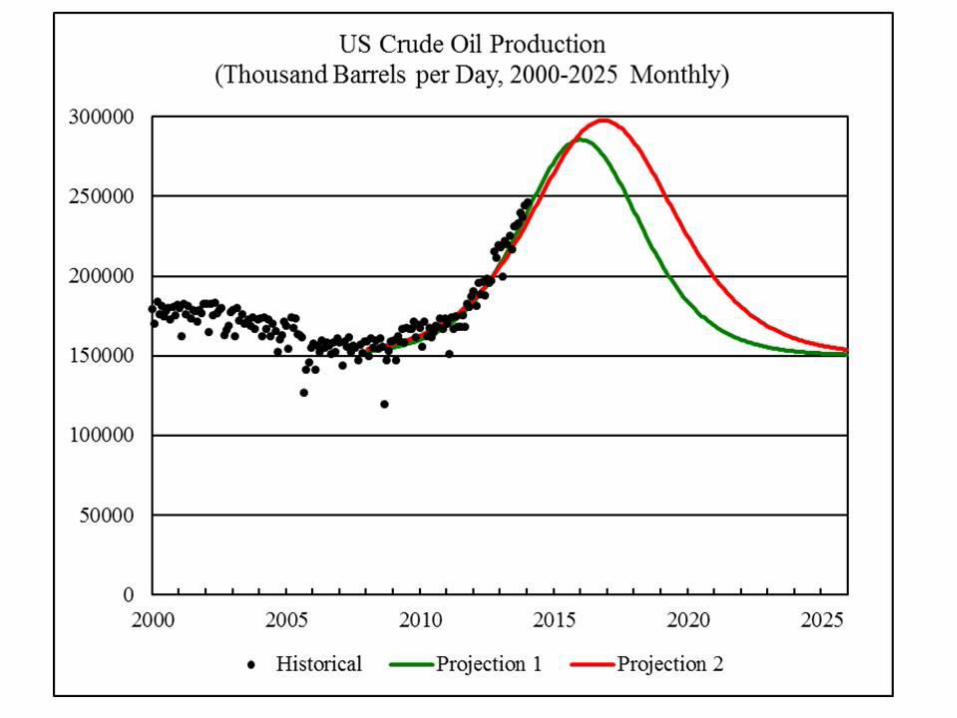
Crude by Rail (CBR)
According to the U.S. Energy Information Administration,
U.S. crude oil production will reach 8.5 million barrels
per day by the end of 2014 — up from just 5 million
barrels per day in 2008.
In terms of carloads of crude oil, U.S. Class I railroads
originated 9,500 in 2008, which dramatically increased
to 233,698 in 2012 and 407,761 in 2013.
Each rail tank car holds approximately 30,000 gallons
(714 barrels) of crude oil. In 2013, U.S. Class I railroads
shipped approximately 800,000 barrels per day.

Crude Oil: Light or Heavy?
Light crude oil is liquid petroleum that has a low
density and flows freely at room temperature. It has a low viscosity, low specific gravity and high
API gravity due to the presence of a high proportion
of light hydrocarbon fractions.
It generally has a low wax content.
Light crude oil receives a higher price than heavy
crude oil on commodity markets because it produces
a higher percentage of gasoline and diesel fuel when
converted into products by an oil refinery.

Crude Oil: Sweet vs. Sour The terms sweet and sour are a reference to the sulfur content of crude oil.
Early prospectors would taste oil to determine its quality, with low sulfur oil
actually tasting sweet.
Sweet Crude
Sweet Crude is currently considered sweet if it contains less than 0.5%
sulfur.
Sweet crude is easier to refine and safer to extract and transport than sour
crude. Because sulfur is corrosive, light crude also causes less damage to
refineries and thus results in lower maintenance costs over time. Due to all
these factors, sweet crude commands up to a $15 dollar premium per barrel
over sour.
Major locations where sweet crude is found include the Appalachian Basin
in Eastern North America, Western Texas, the Bakken Formation of North
Dakota and Saskatchewan, the North Sea of Europe, North Africa, Australia,
and the Far East including Indonesia.

Sweet vs. Sour Crude Oil
Sour Crude
Sour crude oil will have greater than 0.5% sulfur and some of this will be in
the form of hydrogen sulfide. Sour crude also contains more carbon dioxide.
Most sulfur in crude is actually bonded to carbon atoms, nevertheless, high
quantities of hydrogen sulfide in sour crude can pose serious health
problems or even be fatal.
Hydrogen sulfide is famous for its “rotten egg” smell, which is only noticed
at low concentrations.
At moderate concentrations, hydrogen sulfide can cause respiratory and
nerve damage. At high concentrations, it is instantly fatal. Hydrogen sulfide
is so much of a risk that sour crude has to be stabilized via removal of
hydrogen sulfide before it can be transported by oil tankers.
Sour crude is more common in the Gulf of Mexico, Mexico, South America,
and Canada. Crude produced by OPEC Member Nations also tends to be
relatively sour, with an average sulfur content of 1.77%.