Rail safety statistics - 2014-15 annual statistical...
18
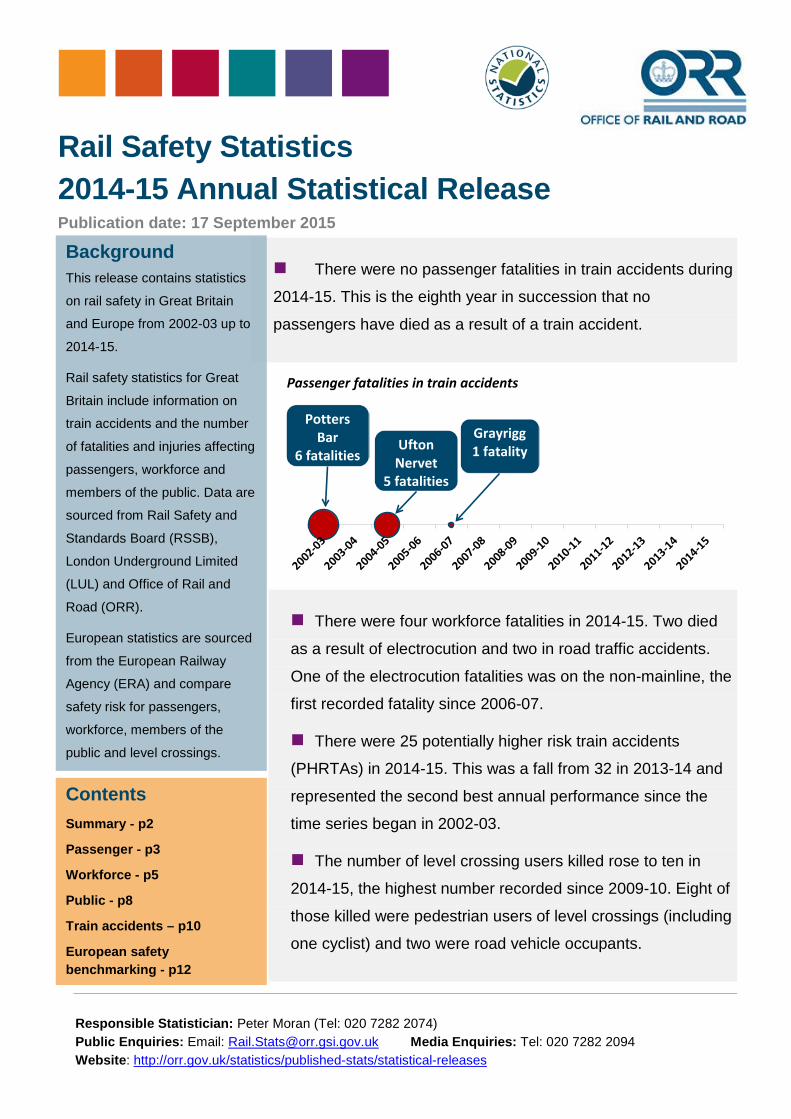
There were no passenger fatalities in train accidents during 2014-15. This is the eighth year in succession that no passengers have died as a result of a train accident. There were four workforce fatalities in 2014-15. Two died as a result of electrocution and two in road traffic accidents. One of the electrocution fatalities was on the non-mainline, the first recorded fatality since 2006-07. There were 25 potentially higher risk train accidents (PHRTAs) in 2014-15. This was a fall from 32 in 2013-14 and represented the second best annual performance since the time series began in 2002-03. The number of level crossing users killed rose to ten in 2014-15, the highest number recorded since 2009-10. Eight of those killed were pedestrian users of level crossings (including one cyclist) and two were road vehicle occupants. Passenger fatalities in train accidents Grayrigg 1 fatality Ufton Nervet 5 fatalities Potters Bar 6 fatalities Background This release contains statistics on rail safety in Great Britain and Europe from 2002-03 up to 2014-15. Rail safety statistics for Great Britain include information on train accidents and the number of fatalities and injuries affecting passengers, workforce and members of the public. Data are sourced from Rail Safety and Standards Board (RSSB), London Underground Limited (LUL) and Office of Rail and Road (ORR). European statistics are sourced from the European Railway Agency (ERA) and compare safety risk for passengers, workforce, members of the public and level crossings. Rail Safety Statistics 2014-15 Annual Statistical Release Publication date: 17 September 2015 Contents Summary - p2 Passenger - p3 Workforce - p5 Public - p8 Train accidents – p10 European safety benchmarking - p12 Responsible Statistician: Peter Moran (Tel: 020 7282 2074) Public Enquiries: Email: [email protected] Media Enquiries: Tel: 020 7282 2094 Website: http://orr.gov.uk/statistics/published-stats/statistical-releases
-
Upload
phungkhanh -
Category
Documents
-
view
213 -
download
0
Transcript of Rail safety statistics - 2014-15 annual statistical...
There were no passenger fatalities in train accidents during
2014-15. This is the eighth year in succession that no
passengers have died as a result of a train accident.
There were four workforce fatalities in 2014-15. Two died
as a result of electrocution and two in road traffic accidents.
One of the electrocution fatalities was on the non-mainline, the
first recorded fatality since 2006-07.
There were 25 potentially higher risk train accidents
(PHRTAs) in 2014-15. This was a fall from 32 in 2013-14 and
represented the second best annual performance since the
time series began in 2002-03.
The number of level crossing users killed rose to ten in
2014-15, the highest number recorded since 2009-10. Eight of
those killed were pedestrian users of level crossings (including
one cyclist) and two were road vehicle occupants.
Passenger fatalities in train accidents
Grayrigg1 fatalityUfton
Nervet5 fatalities
PottersBar
6 fatalities
Background This release contains statistics
on rail safety in Great Britain
and Europe from 2002-03 up to
2014-15.
Rail safety statistics for Great
Britain include information on
train accidents and the number
of fatalities and injuries affecting
passengers, workforce and
members of the public. Data are
sourced from Rail Safety and
Standards Board (RSSB),
London Underground Limited
(LUL) and Office of Rail and
Road (ORR).
European statistics are sourced
from the European Railway
Agency (ERA) and compare
safety risk for passengers,
workforce, members of the
public and level crossings.
Rail Safety Statistics 2014-15 Annual Statistical Release Publication date: 17 September 2015
Contents Summary - p2
Passenger - p3
Workforce - p5
Public - p8
Train accidents – p10
European safety benchmarking - p12
Responsible Statistician: Peter Moran (Tel: 020 7282 2074) Public Enquiries: Email: [email protected] Media Enquiries: Tel: 020 7282 2094 Website: http://orr.gov.uk/statistics/published-stats/statistical-releases
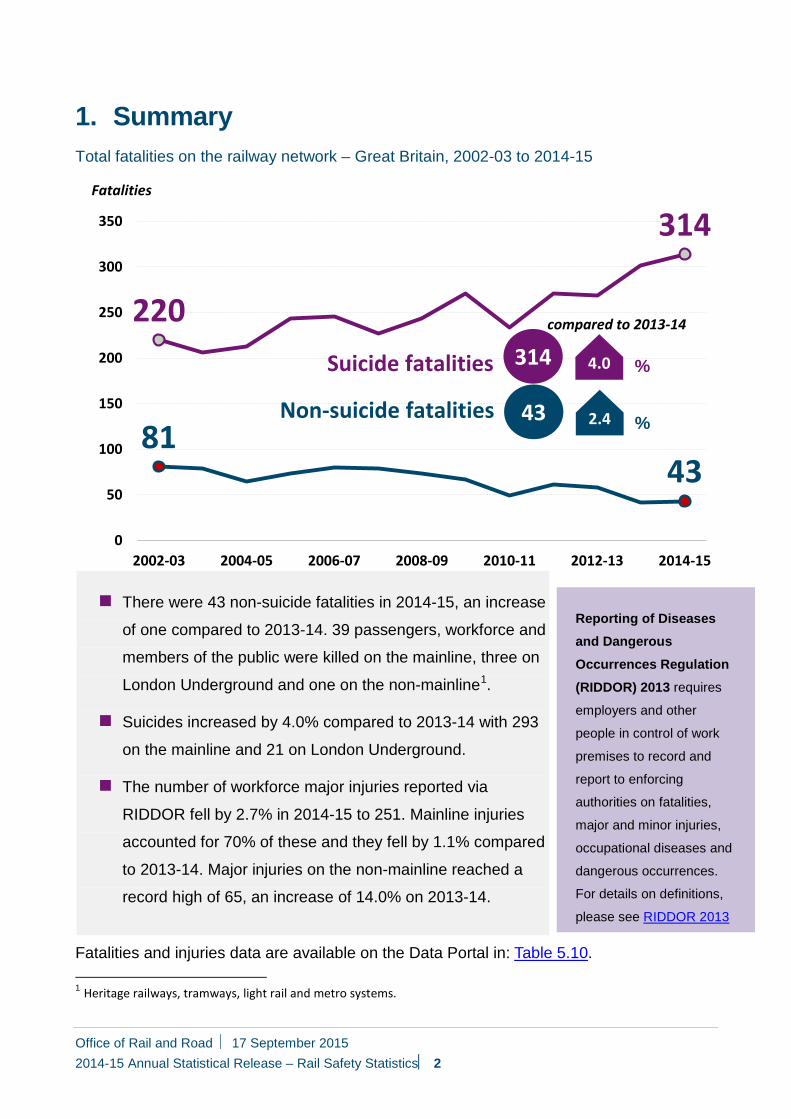
1. SummaryTotal fatalities on the railway network – Great Britain, 2002-03 to 2014-15
There were 43 non-suicide fatalities in 2014-15, an increase
of one compared to 2013-14. 39 passengers, workforce and
members of the public were killed on the mainline, three on
London Underground and one on the non-mainline1.
Suicides increased by 4.0% compared to 2013-14 with 293
on the mainline and 21 on London Underground.
The number of workforce major injuries reported via
RIDDOR fell by 2.7% in 2014-15 to 251. Mainline injuries
accounted for 70% of these and they fell by 1.1% compared
to 2013-14. Major injuries on the non-mainline reached a
record high of 65, an increase of 14.0% on 2013-14.
Fatalities and injuries data are available on the Data Portal in: Table 5.10.
1 Heritage railways, tramways, light rail and metro systems.
8143
220
314
0
50
100
150
200
250
300
350
2002-03 2004-05 2006-07 2008-09 2010-11 2012-13 2014-15
Non-suicide fatalities 2.4 %
compared to 2013-14
Fatalities
Suicide fatalities 314
43
4.0 %
Office of Rail and Road 17 September 2015 2014-15 Annual Statistical Release – Rail Safety Statistics 2
Reporting of Diseases and Dangerous Occurrences Regulation (RIDDOR) 2013 requires
employers and other
people in control of work
premises to record and
report to enforcing
authorities on fatalities,
major and minor injuries,
occupational diseases and
dangerous occurrences.
For details on definitions,
please see RIDDOR 2013
2. Passenger safety
There were a total of four passenger fatalities in 2014-
15, the lowest number since the time series began.
Three occurred on the mainline and all were within
stations; two at the platform/train interface, although
not during the boarding or alighting trains and the third
was a result of a fall at the station. The other fatality
was on London Underground and was also at the
platform/train interface.
There were no passenger fatalities in train accidents
during 2014-15. This is the eighth year in succession that no passengers have died
as a result of a train accident. The last train accident to result in a fatality was the
derailment at Grayrigg in 2006-07.
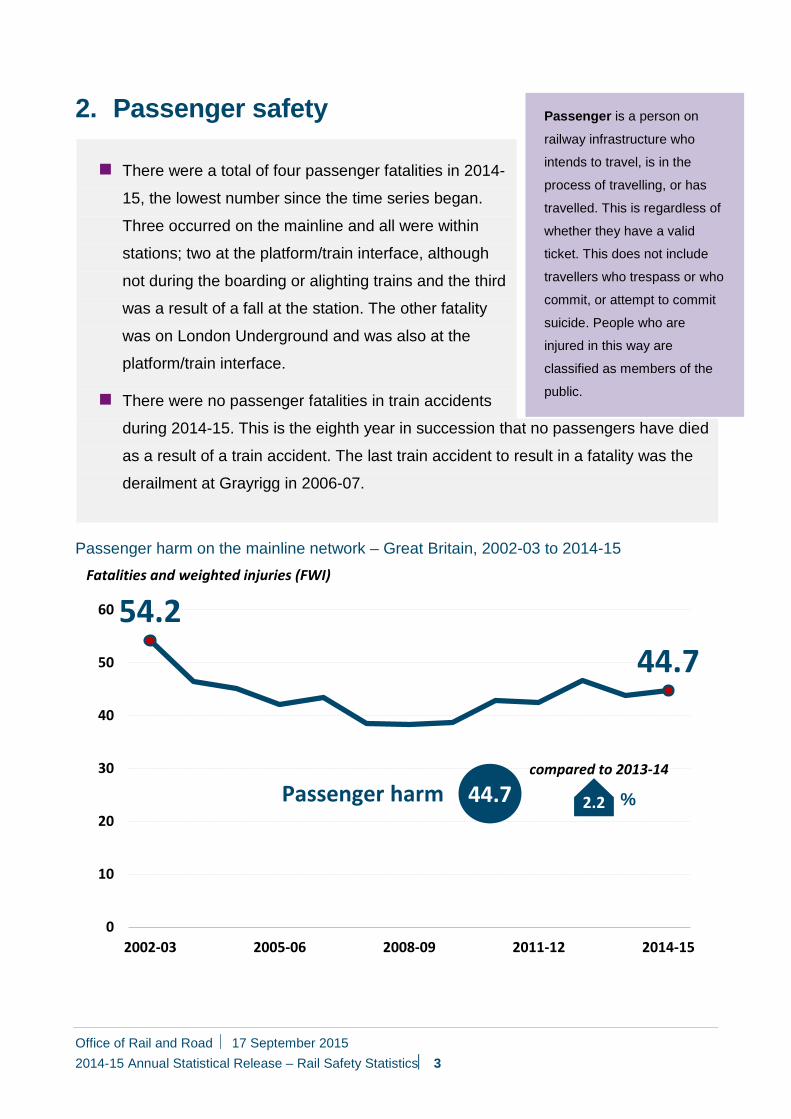
Passenger harm on the mainline network – Great Britain, 2002-03 to 2014-15
54.244.7
0
10
20
30
40
50
60
2002-03 2005-06 2008-09 2011-12 2014-15
Passenger harm 44.7 2.2 %
compared to 2013-14
Fatalities and weighted injuries (FWI)
Office of Rail and Road 17 September 2015 2014-15 Annual Statistical Release – Rail Safety Statistics 3
Passenger is a person on
railway infrastructure who
intends to travel, is in the
process of travelling, or has
travelled. This is regardless of
whether they have a valid
ticket. This does not include
travellers who trespass or who
commit, or attempt to commit
suicide. People who are
injured in this way are
classified as members of the
public.
Passenger harm on the mainline, as measured by FWI,
has risen 2.2% to 44.7 in 2014-15 though this has to be
considered alongside a 4.2% increase in passenger
journeys over the same period. Despite the number of
fatalities falling, harm has increased due to a rise in the
number of major injuries.
The number of passenger major injuries on the mainline
increased by 7.2% in 2014-15 to 296. The majority of
these were slips, trips and falls, accounting for 187 of the
reported injuries. There were 47 major injuries suffered
at the platform/train interface, a fall of 6.0% this year and
the lowest number reported since 2010-11.
The number of on-board major injuries on the mainline
increased from 28 to 35 in 2014-15 making it the highest
number of these types of incidents in a given year since
the time series began in 2002-03.
The total number of injuries reported on London
Underground exceeded 4,000 for the first time in 2014-
15. There were 4,075 in 2014-15, a rise of 4.3% since
2013-14. The split between major injury, Class 1 and
Class 2 minor injuries has changed in the last two years, primarily due to the
changes in RIDDOR 2013 legislation. This led to a fall in RIDDOR reportable
accidents (Class 1) that were deemed to be the fault of the injured party. However,
these accidents are still captured in Class 2 minor injuries which have increased
accordingly.
Passenger safety statistics are available on the Data Portal in: Table 5.18.
Office of Rail and Road 17 September 2015 2014-15 Annual Statistical Release – Rail Safety Statistics 4
Fatalities and weighted injuries (FWI) is a single
figure combining number of
fatalities, major injuries,
minor injuries and
shock/trauma incidents. For
weighting purposes, one
fatality is equivalent to:
- 10 major injuries
- 200 RIDDOR reportable
minor injuries (Class 1)
- 1000 non-RIDDOR
reportable injuries (Class 2)
- 200 Class 1 shock/trauma
(involved in or witness
events that have potential
of fatal outcomes)
- 1000 Class 2
shock/trauma (involved in
or witness events such as
verbal abuse, near misses
or accidents of a typically
non-fatal outcome)
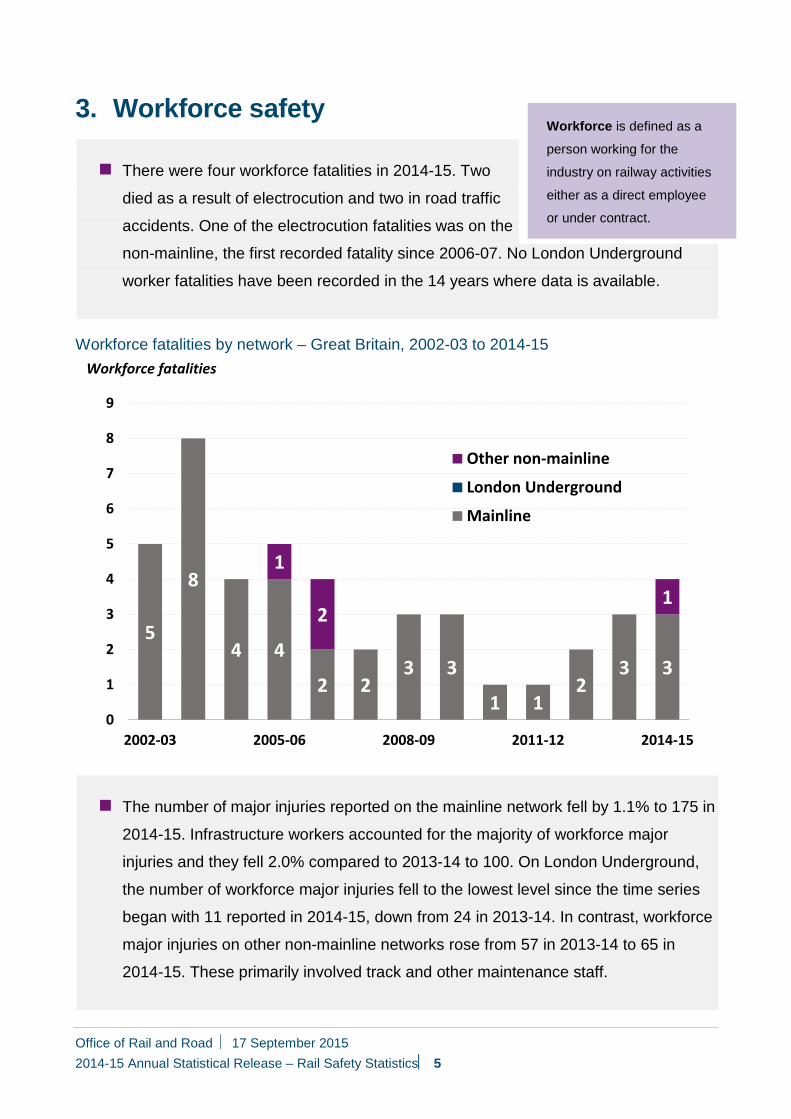
3. Workforce safety
There were four workforce fatalities in 2014-15. Two
died as a result of electrocution and two in road traffic
accidents. One of the electrocution fatalities was on the
non-mainline, the first recorded fatality since 2006-07. No London Underground
worker fatalities have been recorded in the 14 years where data is available.
Workforce fatalities by network – Great Britain, 2002-03 to 2014-15
The number of major injuries reported on the mainline network fell by 1.1% to 175 in
2014-15. Infrastructure workers accounted for the majority of workforce major
injuries and they fell 2.0% compared to 2013-14 to 100. On London Underground,
the number of workforce major injuries fell to the lowest level since the time series
began with 11 reported in 2014-15, down from 24 in 2013-14. In contrast, workforce
major injuries on other non-mainline networks rose from 57 in 2013-14 to 65 in
2014-15. These primarily involved track and other maintenance staff.
5
8
4 4
2 23 3
1 12
3 3
1
21
0
1
2
3
4
5
6
7
8
9
2002-03 2005-06 2008-09 2011-12 2014-15
Other non-mainline
London Underground
Mainline
Workforce fatalities
Office of Rail and Road 17 September 2015 2014-15 Annual Statistical Release – Rail Safety Statistics 5
Workforce is defined as a
person working for the
industry on railway activities
either as a direct employee
or under contract.
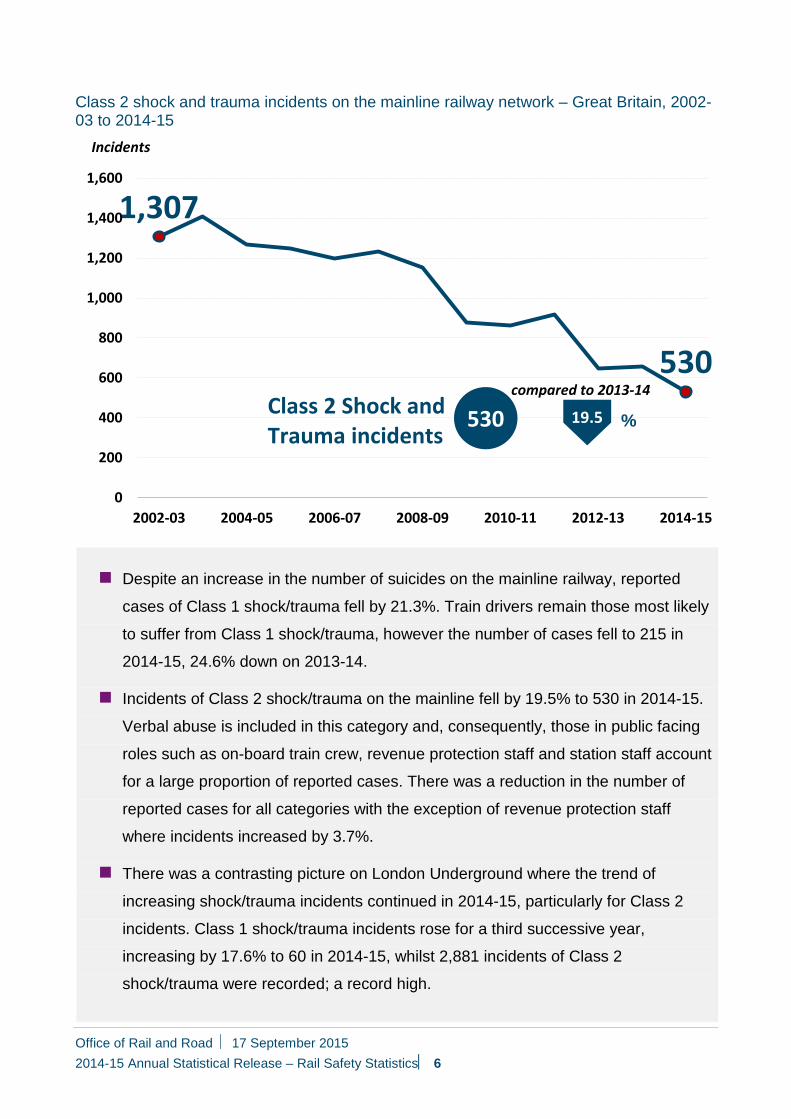
Class 2 shock and trauma incidents on the mainline railway network – Great Britain, 2002-03 to 2014-15
Despite an increase in the number of suicides on the mainline railway, reported
cases of Class 1 shock/trauma fell by 21.3%. Train drivers remain those most likely
to suffer from Class 1 shock/trauma, however the number of cases fell to 215 in
2014-15, 24.6% down on 2013-14.
Incidents of Class 2 shock/trauma on the mainline fell by 19.5% to 530 in 2014-15.
Verbal abuse is included in this category and, consequently, those in public facing
roles such as on-board train crew, revenue protection staff and station staff account
for a large proportion of reported cases. There was a reduction in the number of
reported cases for all categories with the exception of revenue protection staff
where incidents increased by 3.7%.
There was a contrasting picture on London Underground where the trend of
increasing shock/trauma incidents continued in 2014-15, particularly for Class 2
incidents. Class 1 shock/trauma incidents rose for a third successive year,
increasing by 17.6% to 60 in 2014-15, whilst 2,881 incidents of Class 2
shock/trauma were recorded; a record high.
1,307
530
0
200
400
600
800
1,000
1,200
1,400
1,600
2002-03 2004-05 2006-07 2008-09 2010-11 2012-13 2014-15
Class 2 Shock and Trauma incidents
530 19.5 %
compared to 2013-14
Incidents
Office of Rail and Road 17 September 2015 2014-15 Annual Statistical Release – Rail Safety Statistics 6
Workforce harm on the mainline in 2014-15 is measured at 31.4 FWI, an
improvement of 3.2% on 2013-14 and 17.4% on a decade ago. The improvement
since last year is a combination of factors; reported major injuries falling, the
reduction in the number of shock/trauma incidents and a fall of 3.4% in the number
of minor injuries.
Workforce safety statistics are available on the Data Portal in: Table 5.34.
Office of Rail and Road 17 September 2015 2014-15 Annual Statistical Release – Rail Safety Statistics 7
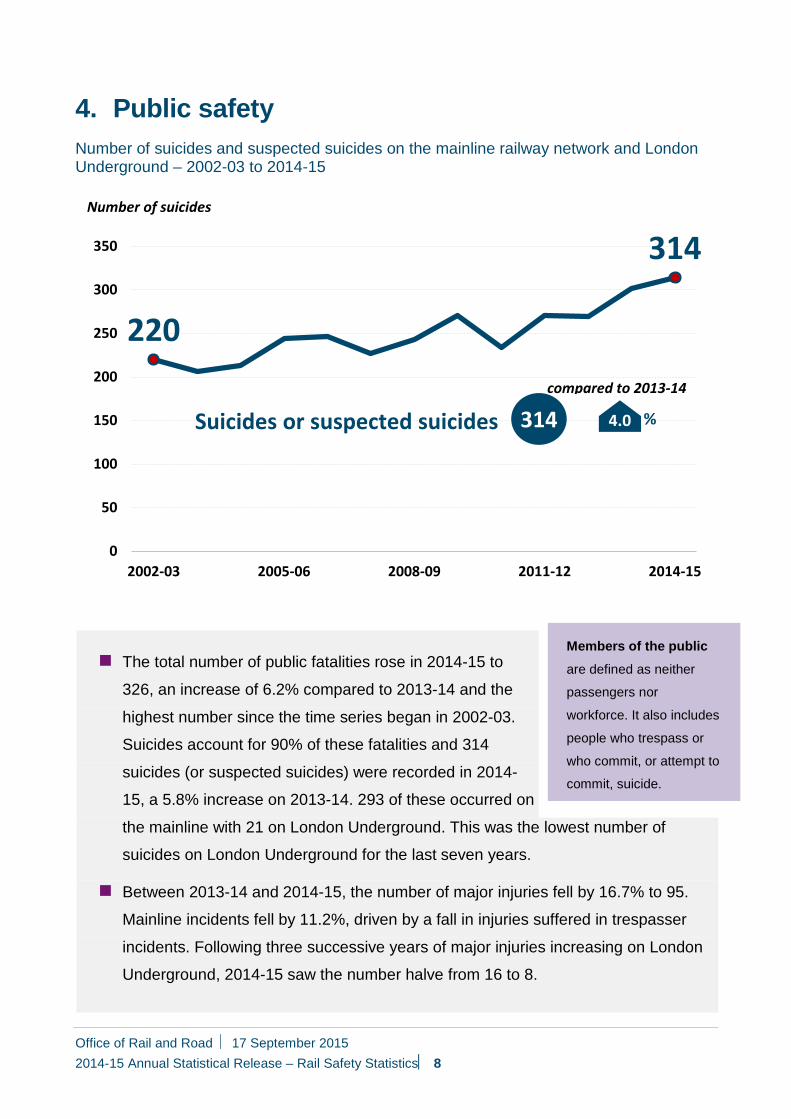
4. Public safetyNumber of suicides and suspected suicides on the mainline railway network and London Underground – 2002-03 to 2014-15
The total number of public fatalities rose in 2014-15 to
326, an increase of 6.2% compared to 2013-14 and the
highest number since the time series began in 2002-03.
Suicides account for 90% of these fatalities and 314
suicides (or suspected suicides) were recorded in 2014-
15, a 5.8% increase on 2013-14. 293 of these occurred on
the mainline with 21 on London Underground. This was the lowest number of
suicides on London Underground for the last seven years.
Between 2013-14 and 2014-15, the number of major injuries fell by 16.7% to 95.
Mainline incidents fell by 11.2%, driven by a fall in injuries suffered in trespasser
incidents. Following three successive years of major injuries increasing on London
Underground, 2014-15 saw the number halve from 16 to 8.
220
314
0
50
100
150
200
250
300
350
2002-03 2005-06 2008-09 2011-12 2014-15
Suicides or suspected suicides 4.0 %
compared to 2013-14
Number of suicides
314
Office of Rail and Road 17 September 2015 2014-15 Annual Statistical Release – Rail Safety Statistics 8
Members of the public
are defined as neither
passengers nor
workforce. It also includes
people who trespass or
who commit, or attempt to
commit, suicide.
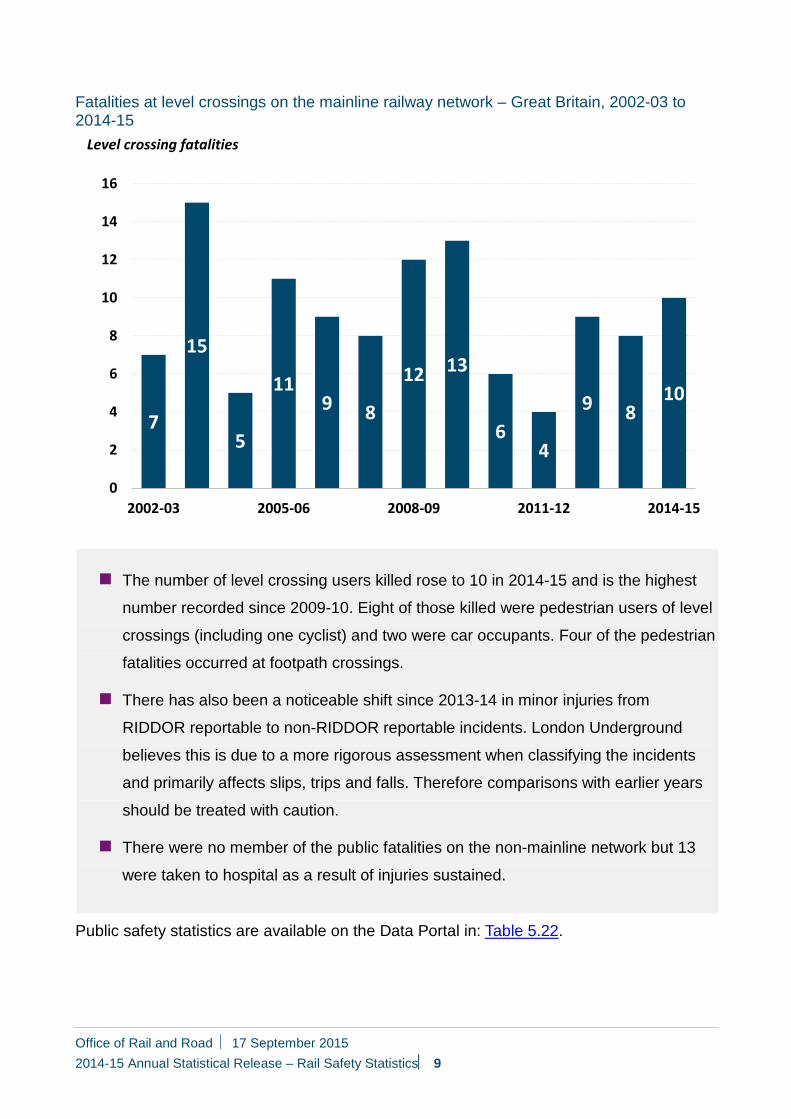
Fatalities at level crossings on the mainline railway network – Great Britain, 2002-03 to 2014-15
The number of level crossing users killed rose to 10 in 2014-15 and is the highest
number recorded since 2009-10. Eight of those killed were pedestrian users of level
crossings (including one cyclist) and two were car occupants. Four of the pedestrian
fatalities occurred at footpath crossings.
There has also been a noticeable shift since 2013-14 in minor injuries from
RIDDOR reportable to non-RIDDOR reportable incidents. London Underground
believes this is due to a more rigorous assessment when classifying the incidents
and primarily affects slips, trips and falls. Therefore comparisons with earlier years
should be treated with caution.
There were no member of the public fatalities on the non-mainline network but 13
were taken to hospital as a result of injuries sustained.
Public safety statistics are available on the Data Portal in: Table 5.22.
7
15
5
119 8
12 13
64
9 810
0
2
4
6
8
10
12
14
16
2002-03 2005-06 2008-09 2011-12 2014-15
Level crossing fatalities
Office of Rail and Road 17 September 2015 2014-15 Annual Statistical Release – Rail Safety Statistics 9
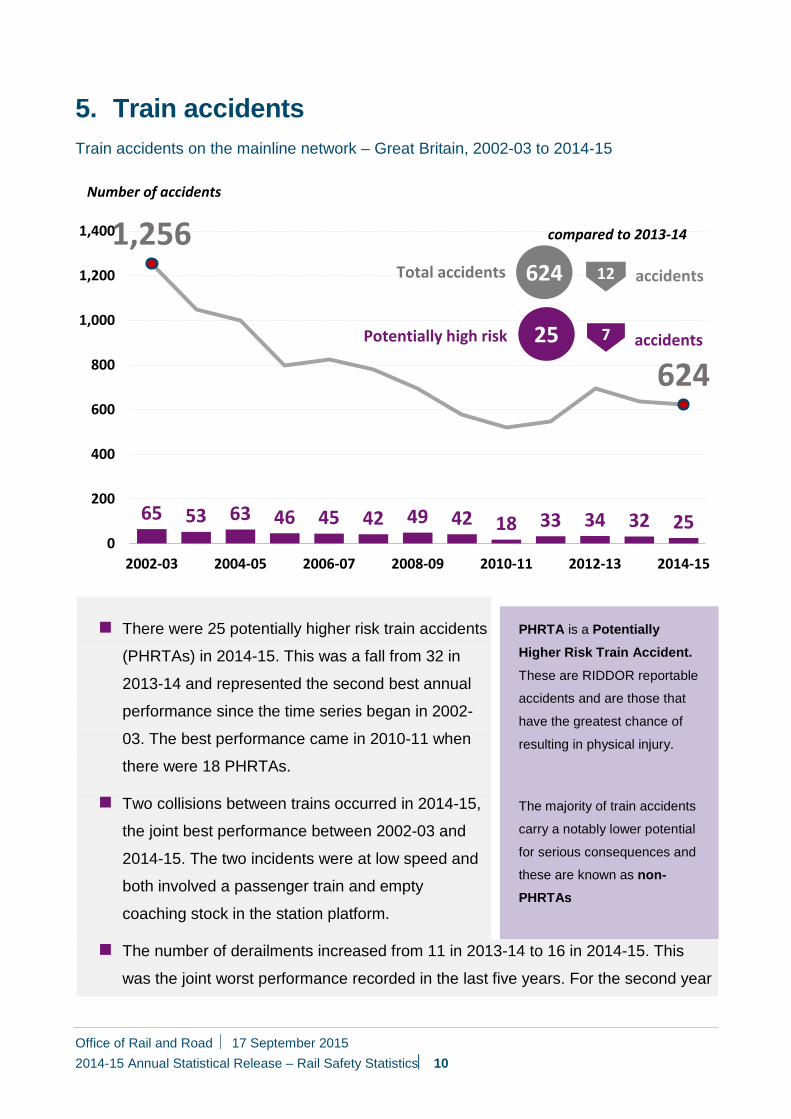
5. Train accidentsTrain accidents on the mainline network – Great Britain, 2002-03 to 2014-15
There were 25 potentially higher risk train accidents
(PHRTAs) in 2014-15. This was a fall from 32 in
2013-14 and represented the second best annual
performance since the time series began in 2002-
03. The best performance came in 2010-11 when
there were 18 PHRTAs.
Two collisions between trains occurred in 2014-15,
the joint best performance between 2002-03 and
2014-15. The two incidents were at low speed and
both involved a passenger train and empty
coaching stock in the station platform.
The number of derailments increased from 11 in 2013-14 to 16 in 2014-15. This
was the joint worst performance recorded in the last five years. For the second year
65 53 63 46 45 42 49 42 18 33 34 32 25
1,256
624
0
200
400
600
800
1,000
1,200
1,400
2002-03 2004-05 2006-07 2008-09 2010-11 2012-13 2014-15
Total accidents 624 12 accidents
7 accidents
compared to 2013-14
Number of accidents
25Potentially high risk
Office of Rail and Road 17 September 2015 2014-15 Annual Statistical Release – Rail Safety Statistics 10
PHRTA is a Potentially Higher Risk Train Accident.
These are RIDDOR reportable
accidents and are those that
have the greatest chance of
resulting in physical injury.
The majority of train accidents
carry a notably lower potential
for serious consequences and
these are known as non-PHRTAs
in a row, none of the derailments involved a passenger train as 14 were freight
trains and two were empty coaching stock.
Despite an increase of 10.5% in the number of collisions with animals (325 in 2014-
15), the total number of non-PHRTAs fell for the second year in a row to 599. This
was primarily driven by a fall in the number of collisions with other objects from 214
to 179. The number of trains struck by missiles fell to its lowest point in the time
series. There were 54 such incidents in 2014-15 compared to over 300 incidents a
decade ago.
There were 11 train accidents on the London Underground, three of which were
potentially higher risk train accidents (PHRTAs); one collision between trains, one
derailment and one train was struck by a large object. The total of 11 was the lowest
number of accidents since 2010-11.
The number of non-mainline accidents increased in 2014-15 to 110 from 24 the
previous year, though this is primarily because of improved reporting in the tramway
sector. Working with UKTram2, ORR has provided clearer guidance in response to
changes in RIDDOR regulations and this process highlighted the under-reporting of
minor tram-road vehicle collisions. Furthermore, the extension of Manchester
Metrolink has increased the likelihood of tram-road vehicle collisions.
Train accident statistics are available on the Data Portal in: Table 5.26.
2 Great Britain’s light rail and tramway industry trade body
Office of Rail and Road 17 September 2015 2014-15 Annual Statistical Release – Rail Safety Statistics 11
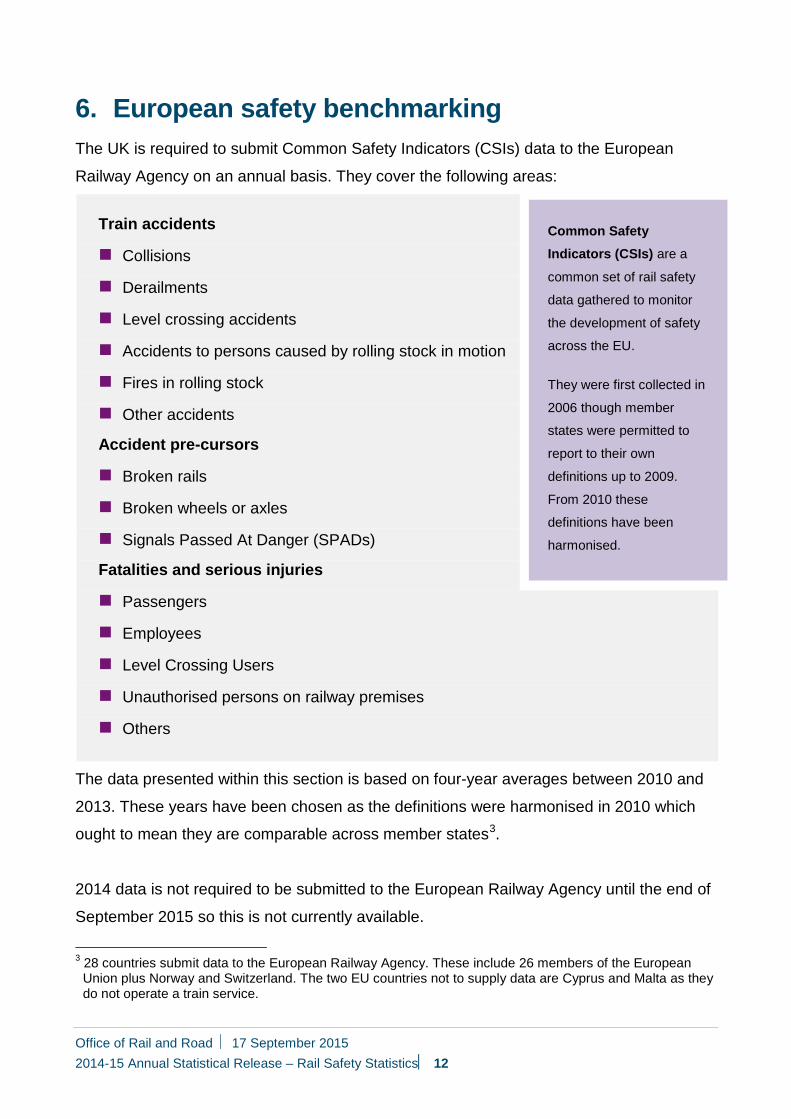
6. European safety benchmarkingThe UK is required to submit Common Safety Indicators (CSIs) data to the European
Railway Agency on an annual basis. They cover the following areas:
Train accidents
Collisions
Derailments
Level crossing accidents
Accidents to persons caused by rolling stock in motion
Fires in rolling stock
Other accidents
Accident pre-cursors
Broken rails
Broken wheels or axles
Signals Passed At Danger (SPADs)
Fatalities and serious injuries
Passengers
Employees
Level Crossing Users
Unauthorised persons on railway premises
Others
The data presented within this section is based on four-year averages between 2010 and
2013. These years have been chosen as the definitions were harmonised in 2010 which
ought to mean they are comparable across member states3.
2014 data is not required to be submitted to the European Railway Agency until the end of
September 2015 so this is not currently available.
3 28 countries submit data to the European Railway Agency. These include 26 members of the European Union plus Norway and Switzerland. The two EU countries not to supply data are Cyprus and Malta as they do not operate a train service.
Office of Rail and Road 17 September 2015 2014-15 Annual Statistical Release – Rail Safety Statistics 12
Common Safety Indicators (CSIs) are a
common set of rail safety
data gathered to monitor
the development of safety
across the EU.
They were first collected in
2006 though member
states were permitted to
report to their own
definitions up to 2009.
From 2010 these
definitions have been
harmonised.
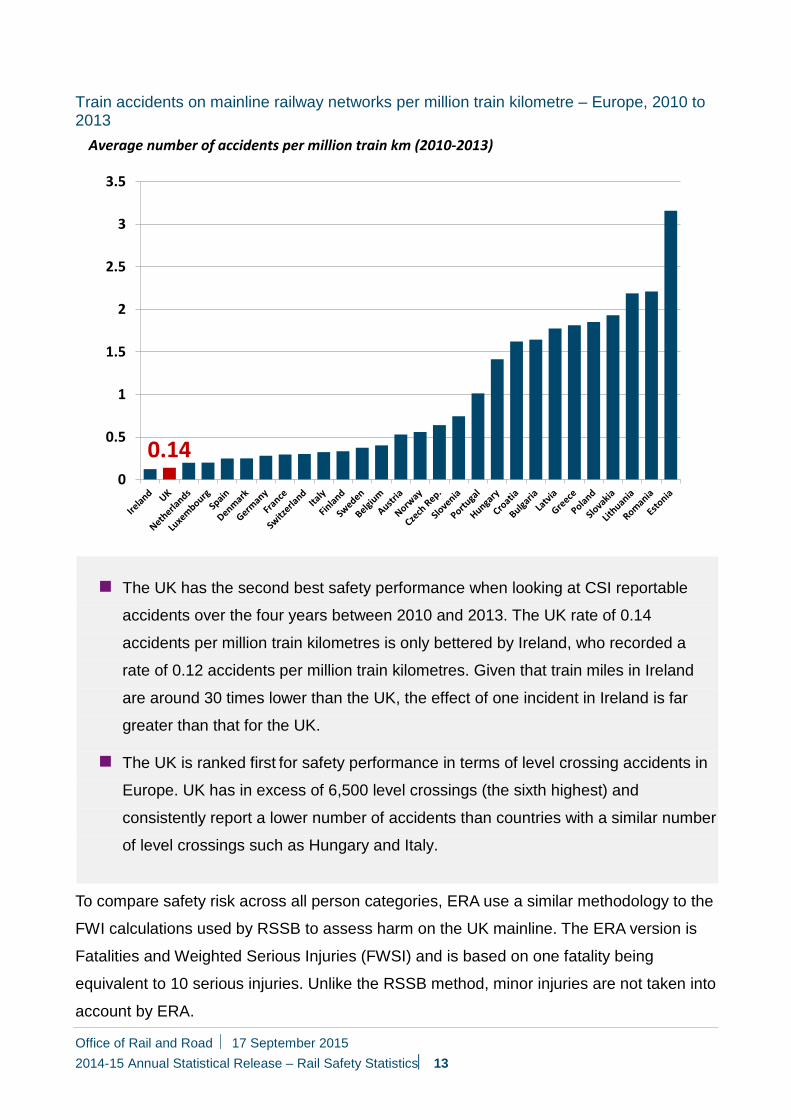
Train accidents on mainline railway networks per million train kilometre – Europe, 2010 to 2013
The UK has the second best safety performance when looking at CSI reportable
accidents over the four years between 2010 and 2013. The UK rate of 0.14
accidents per million train kilometres is only bettered by Ireland, who recorded a
rate of 0.12 accidents per million train kilometres. Given that train miles in Ireland
are around 30 times lower than the UK, the effect of one incident in Ireland is far
greater than that for the UK.
The UK is ranked first for safety performance in terms of level crossing accidents in
Europe. UK has in excess of 6,500 level crossings (the sixth highest) and
consistently report a lower number of accidents than countries with a similar number
of level crossings such as Hungary and Italy.
To compare safety risk across all person categories, ERA use a similar methodology to the
FWI calculations used by RSSB to assess harm on the UK mainline. The ERA version is
Fatalities and Weighted Serious Injuries (FWSI) and is based on one fatality being
equivalent to 10 serious injuries. Unlike the RSSB method, minor injuries are not taken into
account by ERA.
0.140
0.5
1
1.5
2
2.5
3
3.5
Average number of accidents per million train km (2010-2013)
Office of Rail and Road 17 September 2015 2014-15 Annual Statistical Release – Rail Safety Statistics 13
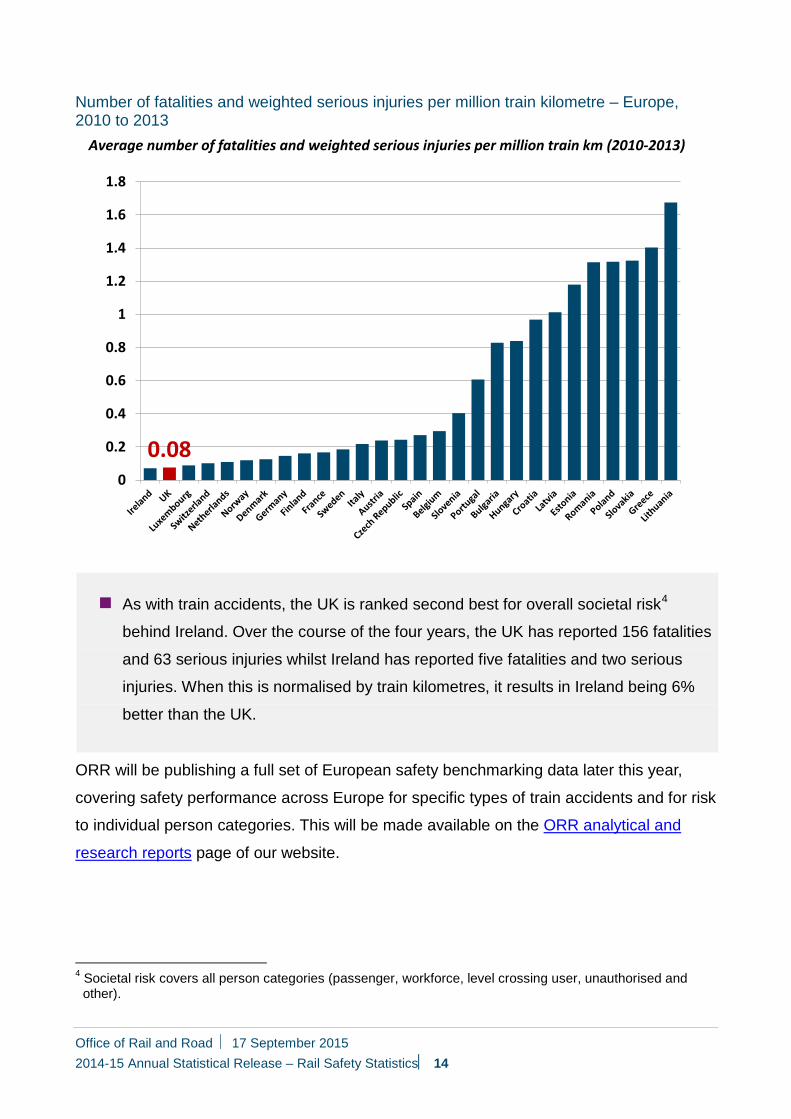
Number of fatalities and weighted serious injuries per million train kilometre – Europe, 2010 to 2013
As with train accidents, the UK is ranked second best for overall societal risk4
behind Ireland. Over the course of the four years, the UK has reported 156 fatalities
and 63 serious injuries whilst Ireland has reported five fatalities and two serious
injuries. When this is normalised by train kilometres, it results in Ireland being 6%
better than the UK.
ORR will be publishing a full set of European safety benchmarking data later this year,
covering safety performance across Europe for specific types of train accidents and for risk
to individual person categories. This will be made available on the ORR analytical and
research reports page of our website.
4 Societal risk covers all person categories (passenger, workforce, level crossing user, unauthorised and other).
0.080
0.2
0.4
0.6
0.8
1
1.2
1.4
1.6
1.8
Average number of fatalities and weighted serious injuries per million train km (2010-2013)
Office of Rail and Road 17 September 2015 2014-15 Annual Statistical Release – Rail Safety Statistics 14
Annex 1 – List of pre-created reports available on the ORR Data Portal All data tables can be accessed on the data portal free of charge. The ORR data portal
provides on screen data reports, as well as the facility to download data in Excel format
and print the report. We can provide data in csv format on request.
Rail safety statistics
Workforce assaults, threats and verbal abuse - Table 5.7
Key statistics - Fatalities and injuries - Table 5.10
Workforce near misses - Chart 5.11
Passenger and public assault - Table 5.15
Public fatalities occurring to children - Chart 5.21
Key statistics - Public safety - Table 5.22
Reported vandalism incidents - Table 5.23
Key statistics - Road rail interface - Table 5.24
Key statistics - Train accidents - Table 5.26
Train accidents with passenger or workforce fatalities - Table 5.27
Public injuries (FWI) at level crossings - Chart 5.28
Broken rails and buckled rails - Table 5.31
Key statistics - Workforce safety - Table 5.34
Key statistics - Passenger safety - Table 5.18
Revisions: There have been revisions to the previously published tables associated with
this statistical release. Further details can be found at: Revisions Log
Office of Rail and Road 17 September 2015 2014-15 Annual Statistical Release – Rail Safety Statistics 15
Annex 2 Statistical Releases This publication is part of the statistical releases which cover the majority of reports that
were previously released through the NRT Data Portal. The statistical releases combine
the previous quarterly reports into four quarterly and four annual themed releases. The
four annual statistical releases in the series are:
Annual
Rail Finance;
Rail Safety Statistics;
Rail Infrastructure, Assets and Environmental;
Regional Rail Usage.
Quarterly
Passenger and Freight Rail Performance;
Freight Rail Usage;
Passenger Rail Usage;
Passenger Rail Service Satisfaction.
A full list of publication dates for the next twelve months can be found in the release
schedule on the ORR website.
This is an annual release and the data in this release refer to financial year 2014-15 with
the exception of the European safety benchmarking, which covers calendar year data. All
the data contained and referred to within the release for Great Britain can be accessed via
the Data Portal. The European data is available from the European Railway Agency.
For more detail on data collection and the methodology used to calculate the statistics
within this release please see the accompanying Rail Safety Statistics Quality Report.
Office of Rail and Road 17 September 2015 2014-15 Annual Statistical Release – Rail Safety Statistics 16
National Statistics The United Kingdom Statistics Authority designated these statistics as National Statistics,
in accordance with the Statistics and Registration Service Act 2007 and signifying
compliance with the Code of Practice for Official Statistics.
Designation can be broadly interpreted to mean that the statistics:
meet identified user needs;
are well explained and readily accessible;
are produced according to sound methods; and
are managed impartially and objectively in the public interest.
Once statistics have been designated as National Statistics it is a statutory requirement
that the Code of Practice shall continue to be observed.
For more details please contact the Statistics Head of Profession Lyndsey Melbourne on
020 7282 3978 or contact [email protected].
The Department for Transport (DfT) also publishes a range of rail statistics which can be
found at DfT Rail Statistics
Related publications The Rail Safety and Standards Board (RSSB) publish an Annual Safety Performance
Report that covers safety on the mainline railway network. This can be found at RSSB
Safety Performance Report
In addition to this statistical release, ORR also publishes an annual Health & Safety Report
which sets out the current state of health and safety on our railways, trams, heritage and
metro systems. The 2014-15 report can be found at Health and Safety Report
The European Railway Agency publishes an annual Railway Safety Performance in the
European Union
Office of Rail and Road 17 September 2015 2014-15 Annual Statistical Release – Rail Safety Statistics 17
© Crown copyright 2015
This publication is licensed under the terms of the Open Government Licence v3.0 except where otherwise stated. To view this licence, visit nationalarchives.gov.uk/doc/open-government-licence/version/3 or write to the Information Policy Team, The National Archives, Kew, London TW9 4DU, or email: [email protected].
Where we have identified any third party copyright information you will need to obtain permission from the copyright holders concerned.
This publication is available at orr.gov.uk
Any enquiries regarding this publication should be sent to us at orr.gov.uk
Office of Rail and Road 17 September 2015 2014-15 Annual Statistical Release – Rail Safety Statistics 18