Ragnhild Valen - pdfs.semanticscholar.org · The gastrointestinal (GI) tract of fish is a...
123
MASTER THESIS University of Bergen, Norway Spatial and temporal mRNA expression of key gastrointestinal peptide hormones in Atlantic salmon during processing of a single meal- towards an understanding of their roles in regulation of digestion and appetite For the fulfillment of Master of Science in Cellular- and Developmental Biology By Ragnhild Valen Department of Biology November 2009
Transcript of Ragnhild Valen - pdfs.semanticscholar.org · The gastrointestinal (GI) tract of fish is a...

MASTER THESIS
University of Bergen, Norway
Spatial and temporal mRNA expression of key gastrointestinal peptide
hormones in Atlantic salmon during processing of a single meal-
towards an understanding of their roles in regulation of digestion and
appetite
For the fulfillment of Master of Science in Cellular- and Developmental Biology
By
Ragnhild Valen
Department of Biology
November 2009

2
Picture uploaded from:
http://www.vg.no/uploaded/image/bilderigg/2008/01/25/1201270442231_955.jpg

3
Abstract
Ghrelin (GRLN), Cholecystokinin (CCK) and the Neuropeptide Y (NPY) family member;
PYY are gastrointestinal (GI) tract peptide hormones involved in the optimization of the
digestive process and regulation of appetite in mammals. Although the functions of these
hormones have been extensively studied in higher vertebrates, less is known for fish. The high
diversity between fish species, suggest a species specific approach when studying the role of
GI tract peptide hormones. Two isoformes of GRLN (GRLN-1, GRLN-2) and CCK (CCK-L,
CCK-N), in addition to PYY were recently cloned and characterized in Atlantic salmon.
However, no information is available on the postprandial involvement of these peptide
hormones in Atlantic salmon GI tract. Therefore an experiment was initiated where the aim
was to increase the knowledge of regulation of the digestive process and appetite by these key
GI tract peptide hormones in Atlantic salmon.
This study describes the spatial distribution and postprandial changes in GRLN, CCK and
PYY mRNA expression in the GI tract during the complete processing of a single meal in
Atlantic salmon (average body weight: 44.7 ± 2.1 g). The mRNA expression values were
obtained by quantitative PCR from four GI tract segments covering stomach, pyloric cecae,
midgut and hindgut. In order to assess the GI tract transit, the content of feed and chyme in
each GI tract segment, and gallbladder content were assessed. Unfed fish were used as
control, and these fish were also used to assess potential diurnal patterns of GRLN-1, GRLN-
2, CCK-L, CCK-N and PYY mRNA expression in Atlantic salmon.
With the exception of CCK-N which was not expressed in midgut and hindgut, the genes for
all peptides were expressed in all GI tract segments analyzed in Atlantic salmon, although at
different levels. Both CCK-L and CCK-N mRNA expression increased within 1.5 hours past
feeding (hpf) when the stomach was still ca 80 % full, the gallbladder was nearly empty and
chyme had started to be transferred into the midgut. The CCK isoforms had different spatial
and temporal mRNA expression patterns during the 24 h processing of the meal. PYY mRNA
expression increased at 1.5 hpf and then decreased after 3 hpf. No differences were detected
between GRLN isoforms and both forms increased after processing of a single meal,
indicating minor effect of GRLN on regulation of digestion. Taken together this suggests that
CCK and PYY have in part similar roles in regulating digestive processes to that observed in
higher vertebrates. The two isoforms of CCK appear to have different functions. The results
did not identify a role for GRLN in regulating digestion and appetite comparable to mammals.

Contents
2
Table of contents Acknowledgements ................................................................................................................ 5
1. Introduction ..................................................................................................................................... 7
1.1 Background .................................................................................................................. 7
1.2 Digestion and absorption ............................................................................................. 7
1.3 Challenges of new feed ingredients ............................................................................. 8
1.4 Hormonal regulation of digestion .............................................................................. 10
1.4.1 GRLN .............................................................................................................................. 11
1.4.2 CCK ................................................................................................................................. 14
1.4.3 PYY ................................................................................................................................. 16
1.5 Summary .................................................................................................................... 19
1.6 Hypothesis and aim of thesis ..................................................................................... 20
2. Material and methods ................................................................................................................... 23
2.1 Animals and samples ................................................................................................. 23
2.2 RNA isolation ............................................................................................................ 24
2.3 RNA concentration and quality ................................................................................. 25
2.4 RNA integrity ............................................................................................................ 25
2.5 DNase treatment of RNA .......................................................................................... 25
2.6 cDNA synthesis ......................................................................................................... 26
2.7 Real-time quantitative PCR: quantification of gene expression ................................ 26
2.9 Statistical analysis ...................................................................................................... 28
3. Results ........................................................................................................................................... 31
3.1 GI tract compartment content and gallbladder weight .............................................. 31
3.1.1 GI tract compartment content ...................................................................................... 31
3.1.2 Gallbladder content ....................................................................................................... 31
3.2 Spatial distribution of GRLN-1, GRLN-2, PYY, CCK-L and CCK-N mRNA in
Atlantic salmon GIT ............................................................................................................. 34
3.2.1 GRLN-1 ........................................................................................................................... 34
3.2.2 GRLN-2 ........................................................................................................................... 34

Contents
3
3.2.3 PYY ................................................................................................................................. 34
3.2.4 CCK-L .............................................................................................................................. 35
3.2.5 CCK-N ............................................................................................................................. 35
3.3 Postprandial effect on mRNA copy numbers of GRLN-1, GRLN-2, PYY, CCK-L
and CCK-N in Atlantic salmon GI tract ............................................................................... 39
3.3.1 GRLN-1 ........................................................................................................................... 39
3.3.2 GRLN-2 ........................................................................................................................... 41
3.3.3 PYY ................................................................................................................................. 43
3.3.4 CCK-L .............................................................................................................................. 45
3.3.5 CCK-N ............................................................................................................................. 47
3.4 Results of correlation between sample Ct value and RIN ......................................... 48
4. Discussion ...................................................................................................................................... 49
4.1 Spatial mRNA expression of GI tract peptide hormones in Atlantic salmon ............ 49
4.1.1 GRLN-1 and GRLN-2 ....................................................................................................... 49
4.1.2 PYY ................................................................................................................................. 51
4.1.3 CCK-L and CCK-N ............................................................................................................ 52
4.2 Temporal changes in GI tract filling of feed and chyme, and gallbladder content in
Atlantic salmon ..................................................................................................................... 54
4.3 Postprandial changes of GI tract peptide hormones .................................................. 57
4.3.1 Postprandial regulation of digestion: GRLN-1 and GRLN-2 ........................................... 57
4.3.2 Postprandial regulation of digestion: PYY ..................................................................... 58
4.3.3 Postprandial regulation of digestion: CCK-L and CCK-N ................................................ 60
4.4 Regulation of appetite: postprandial variation in GRLN, CCK and PYY mRNA
expression ............................................................................................................................. 61
4.4.1 GRLN-1 and GRLN-2 in appetite regulation ................................................................... 61
4.4.2 CCK-L and CCK-N in appetite regulation ........................................................................ 63
4.4.3 PYY in appetite regulation ............................................................................................. 65
4.5 Circadian variation in GRLN-1, GRLN-2, PYY, CCK-L and CCK-N ..................... 67
5. Concluding remarks and future perspective ................................................................................. 68
5.1 Concluding remarks ................................................................................................... 68
5.1.1 Spatial distribution of peptide hormones in Atlantic salmon GI tract .......................... 68

Contents
4
5.1.2 Gastric filling and evacuation, GI tract transit of feed and chyme, and gallbladder
release in Atlantic salmon ............................................................................................................. 68
5.1.3 Postprandial changes in mRNA expression of GI tract peptides and the possible
involvement in regulating the digestive process and appetite in Atlantic salmon ....................... 69
5.1.4 Diurnal influences and possible suggestions of species specific effects on mRNA
expression of GI tract peptide hormones in Atlantic salmon........................................................ 69
5.2 Future perspective ...................................................................................................... 71
6. Methodological considerations ..................................................................................................... 73
6.1 Gene expression ......................................................................................................... 73
6.1.1 Sample acquisition and storage .................................................................................... 73
6.1.2 Assessment of RNA quantity, quality and integrity ....................................................... 73
6.1.3 Removal of genomical DNA ........................................................................................... 76
6.1.4 Reverse transcription: Synthesis of cDNA ..................................................................... 76
6.1.5 Q-PCR ............................................................................................................................. 77
6.1.6 Quantification ................................................................................................................ 78
6.2 Randomization ........................................................................................................... 79
6.3 Statistical methods ..................................................................................................... 79
7. References ..................................................................................................................................... 81
Appendix I .............................................................................................................................................. 93
Applied equipment ............................................................................................................... 93
Applied chemicals ................................................................................................................ 94
Appendix II ............................................................................................................................................. 95
Standard curves used in calculation of mRNA copy numbers ............................................. 95
Appendix III ............................................................................................................................................ 99
Statistics ................................................................................................................................ 99
cDNA synthesis efficiency ................................................................................................. 113
RNA integrity assessment .................................................................................................. 114
Linear regression of Ct against RIN ................................................................................... 115
Postprandial effects and tissue distribution of EF1α .......................................................... 119
Appendix IV ......................................................................................................................................... 121
Composition of feed used in the postprandial experiment ................................................. 121

Acknowledgements
5
Acknowledgements
Foremost I would like to thank my supervisor Prof. Ivar Rønnestad for introducing me to the
very interesting and complex field of digestive- and appetite regulatory peptide hormones. I
appreciate all the constructive and thorough feedback during the work of this thesis.
I would also like to thank my co-supervisor Dr. Ann-Elise Olderbakk Jordal for skillful
guidance on both the methodological part and on the writing. You have given me new insights
in molecular biological methods. I am also very grateful for the rapid feedback on the drafts I
sent you both late and early.
The sampling would not be possible without the assistance of several people. I would thus
like to thank, Dr. Pedro Gómez Requeni, Dr. Koji Murashita, Dr. Ann-Elise Olderbakk Jordal,
Prof. Ivar Rønnestad, Tharmini Kalananthan and Anne Grethe Gamst Moen.
I would like to thank Charlotte Gannefors Krafft for assistance in the lab, and also Valentina
Tronci for always answering my questions regarding the lab work.
I would especially like to thank my former co-master student, Margrethe Emblemsvåg for all
the discussions regarding the thesis, and also the not so serious discussions. Also thank to all
the students in the study place for making the days social and not all work.
Last, but not least I would like to thank my better half, Geir Ottar Fagerlid for all the patience
during this thesis. You have given me great moral support and kept it together at home when
the days in the lab seemed to last forever.
Bergen, November 2009
Ragnhild Valen

6

Introduction
7
1. Introduction
1.1 Background
Atlantic salmon (Salmo salar) is an important species in aquaculture worldwide. The
global production of Atlantic salmon was estimated to 1 433 708 tons in 2007 and is expected
to increase in the future (FAO 2007). It is thus of uttermost interest to fish farmers to optimize
fish growth while at the same time maintaining aquaculture as a sustainable industry.
Increased knowledge of factors underlying growth, digestion, digestion efficiency, control
systems of digestion and the integrated aspect of appetite and energy homeostasis is needed to
ensure continued production of high quality feed for farmed Atlantic salmon when there is a
gradual reduction of available fish meal and alternative feed ingredients are becoming
increasingly important.
1.2 Digestion and absorption
The main function of the digestive process is to hydrolyze macro nutrients from feed
in such a way that it can be easily absorbed by enterocytes in the gut and used in catabolic and
anabolic reactions in the body. The process of digestion is complex and finely orchestrated by
hormones and neurons culminating in responses such as secretion, motility, absorption and
evacuation. Factors affecting and modifying digestion includes feed composition, changes in
habitat characteristics, fish demand of nutrients, and the interplay with additional functions of
the organism (Krogdahl 2001). The gastrointestinal (GI) tract of fish is a multifunctional
organ involved not only in digestion, but also in regulation of water and electrolyte balance,
immunity and endocrine regulation of digestion and metabolism (Buddington et al. 1997). An
optimal digestive function requires proper coordination between GI tract and associated
organs such as liver, gallbladder and pancreas.
Food processing can be divided into three phases; a cephalic phase, a gastric phase and
an intestinal phase (Silverthorn 2004). The cephalic phase is provoked by the thought, sight,
smell, taste and chewing of food (Feldman and Richardson 1986). The central nervous system
(CNS) and enteric nervous system (ENS) are both involved in the cephalic phase. Responses
elicited are stimulation of secretion and motility in GI tract and accessory organs. The gastric
phase involves feed entering the stomach. The stomach digests and stores feed, and regulate
the transit of feed into intestine. During the gastric phase several enzymes, paracrines and

Introduction
8
hormones are secreted in addition to hydrochloric acid (HCl), mucus and tissue protective
bicarbonate. Digestion is carried out by both mechanical and chemical breakdown of feed
creating chyme. The presence of feed in the stomach creates distension of stomach walls
which activates neuronal and hormonal pathways involved in controlling gastric motility and
evacuation. Finally, the intestinal phase of digestion involves digestion of chyme entering the
small intestine. In the intestine these is additional secretions both from pancreas, and the
gallbladder but also by cells in the GI tract.
The cephalic phase overlaps and interacts with the gastric and intestinal phase
contributing to overall GI response to a meal (Katschinski 2000). A wide range of mediators
are involved in initiating the different phases and responses such as regulating secretion,
gastric evacuation and gut transit time. The ultimate step of digestion is absorption of
nutrients and evacuation of undigested material, thus enabling maintenance of body functions
and growth. The dynamic process of digestion consequently involves multiple steps tightly
regulated by both hormones and the nervous system. It is thus important to gain increased
knowledge of the dynamics of meal digestion in relation to GI tract peptide hormones. This
knowledge may then be useful in understanding the effects of alternative feed sources on
digestion and growth.
Feed composition has been shown to influence the efficiency of the different phases of
digestion. As Atlantic salmon is a carnivorous fish species, the structure and function of the
digestive system is optimized for processing dietary proteins while it has reduced capacity to
digest carbohydrates (Hemre et al. 1995; Buddington et al. 1997). The feed composition may
not only affect the digestive process itself and digestibility, but also the level of feed intake,
and control of appetite.
1.3 Challenges of new feed ingredients
Animal-based protein sources used in production of fish feeds constitutes a major cost
of fish farming and is also becoming increasingly scarce as a feed resource (Naylor et al.
2009). This has led to an increase in use of vegetable ingredients in feed as a substitute for
fish meal. These plant based proteins sources have been shown to contain variable amounts of
a range of bioactive compounds many of which cause problems to fish. Feeding soybean meal

Introduction
9
to salmonids causes enteritis1 in the distal intestine, characterized by shortening of mucosal
folds, widening of lamina propria and infiltration of inflammatory cells (Baeverfjord and
Krogdahl 1996). In addition to enteritis, reduced activity of digestive enzymes have been
found in salmonids fed only minor replacements with soybean (Krogdahl et al. 2003). A
reduced nutrient uptake by the gut caused by decreased carrier-mediated transport of amino
acids has also been found as a consequence of feeding a diet with 30 % of fish meal protein
replaced with soybean meal (Nordrum et al. 2000). This poorer utilization of vegetable
protein has been shown to affect the immune system and ultimately growth in rainbow trout
(Oncorhynchus mykiss) (Rumsey et al. 1994).
Reduction in protein utilization and digestion in fish may be caused by the presence of
antinutritional factors in vegetable derived feed ingredients such as protease inhibitors,
tannins and lectins (Francis et al. 2001). Studies in Atlantic salmon show that high levels of
trypsin inhibitors derived from soybean reduce trypsin activity and digestibility of protein and
fat, and ultimately weight gain (Olli et al. 1994). At low levels of trypsin inhibitor, pyloric
cecae compensated for trypsin inhibition by producing elevated levels of trypsin (Olli et al.
1994). In addition to plant derived proteins, carbohydrates are also used in different ratios in
fish feed. Carbohydrates are cheap feed ingredients which are used for their pellet-binding
properties and as energy sources (Krogdahl et al. 2005). As a consequence excess amount of
carbohydrates may be added to the feed, thus above the levels which efficiently can be
utilized (Krogdahl et al. 2005).
Studies in Atlantic salmon explain reduction in growth partially by a reduction in feed
intake when 80-95 % of fish meal is replaced with vegetable protein from wheat, gluten and
extracted soybean meal (Espe et al. 2006; Torstensen et al. 2008). Plant based ingredients may
thus inhibit fish growth when added to feed by reducing appetite of fish. It may also be
possible that the effect of enteritis and enzyme inhibitors partly is mediated through GI tract
peptide hormones involved in appetite regulation. Studies in farmed rainbow trout and
farmed turbot (Scophthalmus maximus) show an increased number of cholecystokinin(CCK)-
8 immunoreactive (IR) cells in fish possibly caused by enteritis due to parasite infection (Bosi
et al. 2005; Bermúdez et al. 2007). GI tract peptide hormones are key signals linking the
regulation of digestion to changes in appetite. A reduction in appetite may thus serve as a
1 Enteritis is characterized as inflammation of the intestine (Baeverfjord and Krogdahl 1996)

Introduction
10
protective mechanism in response to negative effects of vegetable feed ingredients or
parasites.
In contrast to protein and carbohydrates, the effect of substituting fish oil with
vegetable oil in fish feed appear to have a somewhat less detrimental effect on fish growth in
terms of weight and feed conversion ratio, however certain types of lipids may affect muscle
composition (Bell et al. 2001; Torstensen et al. 2008; Bahuaud et al. 2009). Whether different
sources of lipids in fish feed result in different responses in appetite, remains to be elucidated.
Little is known regarding the basic regulation of digestion and absorption of nutrients
in Atlantic salmon. Knowledge of the regulation of digestion and absorption will aid in
understanding the physiological and nutritional effects of new feed ingredients and aid in
optimizing feed composition and feeding regimes in aquaculture. As the digestive process is
associated with appetite, the regulation of these processes in response to meal processing
should be studied in Atlantic salmon. GI tract peptide hormones have been shown to be
mediators of this regulation in mammals and fish (Buddington and Krogdahl 2004; Chaudhri
et al. 2006).
1.4 Hormonal regulation of digestion
The GI tract is the largest endocrine organ in the body and while the endocrine
regulation of digestion has been extensively studied in mammals, there are only a few studies
describing these endocrine control systems in fish (see reviews by; (Holst et al. 1996;
Buddington and Krogdahl 2004)). It has been suggested that the evolutionary signaling
pathways and molecules involved are conserved among vertebrates, but some available data
suggest that there are specific differences in fish (Buddington and Krogdahl 2004). These
authors classify endocrine signaling as three operational networks based on distance of
communication; including local paracrine, intra-GI tract and intra organ signaling networks.
The digestive process involves the GI tract and accessory organs which collectively combine
all of these signaling networks. An example of intra-GI tract signaling is the role of
Cholecystokinin (CCK) in digestion. When hydrolyzed feed stuff enters the proximal intestine
in mammals, CCK producing “I” cells in the intestine is stimulated and secretes CCK into the
circulation (Liddle 1997). CCK then binds to receptors on the gallbladder and pancreas to
induce secretion of bile and pancreatic enzymes respectively (Liddle 1997).

Introduction
11
There are various types of GI tract signaling molecules, including hormones,
neurotransmitters and neuromodulators. Most of the signaling molecules are peptides. Many
of the regulatory peptide hormones in the GI tract are also involved in the regulation of feed
intake and appetite control. The close interaction between endocrine and nervous regulation of
GI tract is confounded by the sharing of similar signaling molecules. Gut hormones influence
the rate at which feed is transferred to the different compartments of the GI tract, and also the
level of appetite. Thus, the gut hormones play a dual role in regulation of digestion and
nutrient uptake, both by optimizing the gut itself for nutrient processing, and by controlling
the intake of nutrients. Both CNS classical neural reflexes and ENS short reflexes regulate GI
function (Clements and Raubenheimer 2006). Motility and secretion can thus be altered by
both hormones and the nervous system. The effect observed include variations in gastric
emptying, gall bladder contraction and absorption.
The gut-brain axis provides a higher level of optimizing digestion and absorption,
where gut hormones can alter food intake by providing a signal from the gut to brain centers
involved in regulation of feed intake (Chaudhri et al. 2006). The appetite regulating hormones
described in fish have been reviewed by several authors (Lin et al. 2000b; Volkoff et al. 2005;
Volkoff 2006). The GI tract peptide hormones Ghrelin, CCK and neuropeptide Y (NPY)
family of peptides have all been shown to be involved in the regulation of appetite as these
peptides undergo periprandial variation in mRNA expression and plasma levels (Peyon et al.
1999; Narnaware and Peter 2001; Unniappan et al. 2004). Ghrelin (GRLN), CCK and PYY
may thus regulate both the digestive process and appetite in Atlantic salmon.
1.4.1 GRLN
GRLN is an acylated peptide initially discovered in rat stomach as an endogenous
ligand for the growth hormone secretagogue receptor (GHS-R) (Kojima et al. 1999). The
name is derived from “ghre” meaning “grow” in Proto-Indo-European languages (Kojima et
al. 1999). Although GRLN was initially shown to regulate growth hormone release from the
pituitary, later studies showed that GRLN is a multifunctional peptide hormone involved in
energy homeostasis in mammals (Tschop et al. 2000; Wren et al. 2000; Nakazato et al. 2001).
GRLNs ranging from 12- to 23- amino acids have been identified in goldfish (Carassius
auratus) (Unniappan et al. 2002), rainbow trout (Kaiya et al. 2003a), Japanese eel (Anguilla
japonica) (Kaiya et al. 2003b), Mozambique tilapia (Oreochromis mossambicus) (Kaiya et al.

Introduction
12
2003c), Nile tilapia (Oreochromis niloticus) (Parhar et al. 2003), channel catfish (Ictalurus
punctatus) (Kaiya et al. 2005), seabream (Acanthopagrus schlegeli) (Yeung et al. 2006),
European seabass (Dicentrarchus labrax) (Terova et al. 2008), zebrafish (Danio rerio)
(Amole and Unniappan 2009) and Atlantic salmon (Murashita et al. 2009). While extensive
studies in humans and other mammals have described multiple roles of GRLN, the role of
GRLN in fish is less certain (Unniappan et al. 2004; Jönsson et al. 2007).
In rats and humans, the mature 28-amino acid GRLN peptide is produced by cleavage
of a 117 amino acid precursor (Kojima et al. 1999; Kojima et al. 2001). In fish, species to
species variation exists in the length of the precursor protein, but all teleosts have an amide
structure on the C-terminus of the mature peptide, (reviewed by; (Kaiya et al. 2008)). A
unique feature of GRLN is its post translational modification in which Ser-3 is covalently
linked to octanoic acid. This acyl modification is required for binding to its receptor, GHS-
R1a (Kojima et al. 1999) and thus for exhibiting hormonal effects. GRLN lacking acyl
modification; des-acyl GRLN, has been identified in rats (Hosoda et al. 2000) and goldfish
(Matsuda et al. 2006a). In goldfish des-acyl GRLN can inhibit GRLN-induced food intake
(Matsuda et al. 2006a). GRLN modified by decanoic acid is the major form in Mozambique
tilapia (Kaiya et al. 2003c). The “active core” of the peptide in mammals consists of the first
four N-terminal amino acids including the acyl modification (Bednarek et al. 2000). This is
required for GHS-R1a binding. Comparison between the N-terminal seven amino acids
display high sequence homology among non-mammalian vertebrates such as; reptiles,
amphibians, birds and teleost species (Kaiya et al. 2008).
In the non-mammalian vertebrates mentioned above the principal site of GRLN
production was stomach and GI tract, but with species specific differences in tissue
distribution (Kaiya et al. 2008). Recently Murashita et al. (2009) cloned two GRLN isoforms2,
GRLN-1 (Gene bank acc. no AB443431) and GRLN-2 (Gene bank acc. no AB443432) in
Atlantic salmon. Both isoforms exhibit highest expression in stomach tissue, with decreasing
expression levels in pyloric cecae and midgut, adipose tissue and testis. In addition to GI tract,
GRLN mRNA is expressed in CNS in the hypothalamic arcuate nucleus and in pituitary of
rats and human, though in lesser extent than the GI tract (Korbonits et al. 2001; Lu et al. 2002;
2 Murashita et al. (2009) suggest that GRLN-1 and GRLN-2 are alternatively spliced variants of the same gene.
However, it is uncertain whether CCK-L and CCK-N are separate genes or alternatively spliced mRNA. Even
though, the term isoforms will be used for both CCKs and GRLNs in this thesis.

Introduction
13
Mondal et al. 2005). RT-PCR have also detected GRLN mRNA expression in fish brain for
goldfish (Unniappan et al. 2002), rainbow trout (Kaiya et al. 2003a), Mozambique tilapia
(Kaiya et al. 2003c), Japanese eel (Kaiya et al. 2003b) and hammerhead shark (Kawakoshi et
al. 2007).
In mammals, the gastric fundus is the principal site of GRLN synthesis (Kojima et al.
1999; Ariyasu et al. 2001; Kojima et al. 2001; Taniaka-Shintani and Watanabe 2005), but
GRLN can also be found in various other GI tract tissues (Gnanapavan et al. 2002). GRLN is
produced from X/A like enteroendocrine cells in mucosal epithelium of the stomach, which
recently have been renamed into “ghrelin cells” (Date et al. 2000; Cummings 2006). GRLN
has been shown to promote gastric and gut motility in mammals (Peeters 2005). GRLN is
further secreted into the bloodstream and circulates in the body (Kojima et al. 2001).
Immunological studies in rats and human found GRLN IR cells in duodenum with a gradual
decrease in distal intestines from ileum to colon (Date et al. 2000). For a schematic
presentation of GRLN and its main known effects in mammals, see Figure 1.1.
GRLN is the endogenous ligand of GHS-R1a receptor and stimulates GH release
(Kojima et al. 1999). Studies show that GRLN acts directly on the pituitary gland to induce
GH release in a specific, dose dependent manner in both human and rats (Arvat et al. 2000;
Seoane et al. 2000; Takaya et al. 2000). GRLN also stimulates GH release in several fish
species. In vitro studies on Mozambique tilapia organ cultured pituitary cells show that GRLN
stimulates release of both GH and prolactin in this species (Kaiya et al. 2003c). Though later
studies failed to reproduce the effect of GRLN induced prolactin release in this species (Fox
et al. 2007). In addition to studies in tilapia, reports on GRLN induced GH release exist for;
seabream (Chan and Cheng 2004), goldfish (Unniappan and Peter 2004), orange spotted
grouper (Epinephelus coioides) (Ran et al. 2004) and rainbow trout (Kaiya et al. 2003a).
GRLN has also been demonstrated to have a regulatory function on appetite in
mammals. It is the only orexigenic GI peptide isolated to date, and stimulates food intake in
mammals (Tschop et al. 2000; Wren et al. 2000; Nakazato et al. 2001). Whether the appetite
regulatory mechanism is the same for non-mammals is uncertain. Both ICV and IP injection
of GRLN in goldfish, stimulate food intake (Unniappan et al. 2002; Matsuda et al. 2006a).
The effect of GRLN has been studied in rainbow trout by measuring periprandial changes in
GRLN plasma levels and IP injection of GRLN (Jönsson et al. 2007). The result of this study

Introduction
14
showed no postprandial changes in plasma GRLN levels and no effect on appetite, thus
concluding no effect of GRLN on appetite regulation in this species. These opposing results
suggest a species difference in GRLN function. GRLN may have additional roles in fish
including reproduction, GI motility, water intake, immune function and behavior (Mustonen
et al. 2002; Kozaka et al. 2003; Matsuda et al. 2006b; Yada et al. 2006; Olsson et al. 2008).
The role of GRLN in Atlantic salmon is uncertain as very limited information exists for this
species. The changes of GRLN in response to a meal should thus be studied in order to
increase the understanding of the regulation of appetite and digestion, and thus verify whether
GRLN has a potential orexigenic role in Atlantic salmon, similar to mammals.
1.4.2 CCK
Cholecystokinin (CCK) was originally identified by Ivy and Oldberg (1928). The
name refers to “that which excite or moves the gallbladder which was consistent with the
reported ability to induce gallbladder contraction (Ivy and Oldberg 1928). Since then
numerous studies in mammals have demonstrated additional CCK regulating effects on
digestion like stimulation of pancreatic enzyme secretion, inhibition of gastric acid
production, regulation of gastric emptying (delaying), gut motility (peristalsis) and control of
appetite (satiety) (Figure 1.1) (Liddle 1997).
In mammals CCK is secreted by enteroendocrine “I” cells located in the mucosa of the
proximal intestine, and in neurons in the myenteric plexuses and brain (Chandra and Liddle
2007). CCK secreting cells have also been identified in proximal GI tract of herring
(Kamisaka et al. 2005). The I cells have a triangular shape with their apical surface facing the
intestinal lumen, and the secretory granules with CCK located towards the basolateral base
(Buchan et al. 1978). CCK is secreted into the blood in response to a meal and binds to CCK-
1 or CCK-2 receptors on target organs, where cellular signal transduction pathways are
initiated (Chandra and Liddle 2007).
CCK is also well known as a potent satiety signal in mammals (Moran and Kinzig
2004). CCK has been identified in a number of teleost species; cod (Gadus morhua) (Jonsson
et al. 1987), goldfish (Himick and Peter 1994), rainbow trout (Jensen et al. 2001), spotted
green puffer (Tetraodon nigroviridis) and Japanese flounder (Paralichtys olivaceus)
(Kurokawa et al. 2003), Atlantic herring (Clupea harengus) (Kamisaka et al. 2005) and
Atlantic salmon (Murashita et al. 2009). In fish as in mammals, CCK has been shown to

Introduction
15
regulate digestive function, although less knowledge exist on the endocrine effect of CCK on
controlling feed intake.
By measuring gallbladder pressure, Aldman and Holmgren (1995) suggested a
mechanism for CCK in gallbladder contraction in rainbow trout. In this study it was for the
first time demonstrated that luminal fat and amino acids entering the proximal intestine
induced gallbladder contraction by stimulating CCK release (Aldman and Holmgren 1995).
Subsequent infusion of sulphated CCK octapetide mimicked this effect, which lead to the
hypothesis that fat and amino acids in the proximal intestine stimulate CCK to induce
gallbladder contraction. In addition to this effect, CCK is also suggested to have a role in the
delaying of stomach emptying in the same species (Olsson et al. 1999). In Atlantic salmon,
infusion of porcine CCK induced pancreatic cell secretion of trypsin and chymotrypsin in
vitro. The same CCK also induced gallbladder discharge in a dose dependent manner in vivo
(Einarsson et al. 1997).
In goldfish, CCK immunoreactivity was found in gut and brain and both centrally and
peripheral injection of sulfated CCK-8 suppressed food intake (Himick and Peter 1994). High
levels of CCK IR neurons and mRNA were found in the hypothalamic inferior lobe and
posterior ventrolateral regions, suggesting that CCK also have a role as a neuroendocrine (and
neurotransmitter) satiety signal in fish (Himick and Peter 1994; Peyon et al. 1998; Peyon et al.
1999). Peyon et al. (1999) further demonstrated that CCK mRNA increased 2 hours after a
meal (postprandial) in goldfish brain. The mechanism CCK induces satiety in fish may be
both direct by CCK acting as a neurotransmitter in the brain, or indirect through the gut by
CCK delaying gastric emptying and thus maintaining stomach distension which further
activates vagal afferents and induces satiety, as seen in rainbow trout (Olsson et al. 1999). In
both ways vagal pathways are involved, though there might exist non-vagal pathways of
hormonal relay systems (Bail and Ruf 1997). One such “relay system” may involve leptin,
which in goldfish potentiates the satiety actions of CCK in hypothalamus and further blocking
of CCK receptors in the brain attenuates leptin mediated inhibition of NPY and orexin
(Volkoff et al. 2003b).
Studies on rainbow trout demonstrated for the first time the identification of three
different CCK cDNAs in the same species, with the mRNA encoding three CCK
preprohormones (Jensen et al. 2001). CCK-8 is well conserved in vertebrates within the

Introduction
16
amino acid sequence; DYMGWMDF (∙NH2) with methionine as the sixth amino acid from
the carboxy terminal. Amidation of the carboxy terminal is implicated in receptor binding and
thus biological activity (Johnsen 1998). The three different CCK preprohormones identified in
rainbow trout, is suggested based on processing signals to give rise to CCK-N (Aspargine),
CCK-L (Leucine) and CCK-T (Threonine) named according to amino acid variations in C-
terminal position six (Methionine) (Jensen et al. 2001). The three different CCK mRNA
showed differences in tissue distribution. All CCK forms were expressed in brain and
intestine. CCK-N showed highest expression in brain and pyloric cecae, while CCK-L was
expressed more evenly throughout the gut including stomach, small intestine and large
intestine, altogether potentially suggesting differences in biological functions.
Recently, Murashita et al (2009) cloned two isoforms of CCK in Atlantic salmon
based on rainbow trout CCK sequences; CCK-L (GenBank acc.# AB443433) and CCK-N
(GenBank acc.# AB443434) encoding the precursor peptides prepro-CCK-L and prepro-
CCK-N, respectively (Murashita et al. 2009). When compared within a phylogenetic tree,
salmonids CCKs separate as CCK-1 and CCK-2, with rainbow trout/Atlantic salmon CCK-N
and rainbow trout CCK-T falling into CCK-1 group, and rainbow trout/Atlantic salmon CCK-
L in fish CCK-2 group (Murashita et al. 2009). Both CCK-L and CCK-N were mainly
expressed in Atlantic salmon brain tissue with lower expression in eye (with CCK-L
expressing the highest level), pyloric cecae and midgut among others (Murashita et al. 2009)
Recent research has shown an additional role for CCK in mediating a protective effect
against inflammatory responses in rats fed a high-fat diet (Luyer et al. 2005). Whether this
effect is the same in fish remains to be elucidated. It is thus important to study the effect of
CCK in regulating the digestive process and appetite in Atlantic salmon, and also the potential
involvement in GI tract inflammatory responses. This knowledge may further be useful in
understanding the growth inhibitory effect of increased inclusions of vegetable derived
nutrients in fish feed.
1.4.3 PYY
PYY is a GI peptide hormone originally discovered in porcine intestine (Tatemoto and
Mutt 1980). In mammals PYY is synthesized and secreted from intestinal “L” cells located in
the distal intestinal mucosa, with the apical membrane facing towards the lumen sensing its
content (Ueno et al. 2008) similar to the CCK “I” cells. In humans PYY release is particularly

Introduction
17
high when a high-protein meal is ingested (Batterham et al. 2006). PYY immunoreactivity has
also been located in neuronal cells in the stomach and proximal intestine (Bottcher et al.
1993). In response to luminal lipids, PYY mediates inhibition of intestinal motility partly by
the “ileal brake mechanism” where lipids in the distal intestine inhibit motor activity in the
proximal intestine (Spiller et al. 1984). PYY further inhibits gastric acid secretion and the
cephalic phase of gallbladder secretion in mammals (Guo et al. 1987; Hoentjen et al. 2001). In
mammals PYY also inhibits both pancreatic secretion stimulated by secretin and CCK and
pancreatic secretion stimulated by the vagus nerve and luminal nutrients (Tatemoto 1982;
Lluis et al. 1987). Thus, PYY act as an endogenous antagonist to CCK‟s stimulation of
intestinal activity and gallbladder and pancreatic secretion (Figure 1.1). The role of PYY as a
vasoconstrictor regulating blood flow to splanchnic vasculature may partly mediate these
inhibitory effects (Adrian et al. 1986; Ueno et al. 2008). The hormone has been shown to have
additional regulatory roles in mammals including regulation of feeding behavior and body
weight (see Ueno et al. (2008) for review).
PYY belongs to the NPY family of peptides which includes; NPY, PYY, PP and PY
where most are 36 amino acid long peptides including three proline and two tyrosine residues
constructing the so-called PP-fold (Larhammar 1996). The NPY peptides mediate their effects
through Y-receptors (Y1, Y2, Y4; Y5, Y6) which differ in their distribution and affinity for
PYY (Ueno et al. 2008). The enzyme dipetidyl peptidase IV cleaves the N-terminal tyrosine
and proline residues generating Y2 receptor specific PYY3-36 which is the major form in
circulation as well as gut endocrine cells (Mentlein et al. 1993; Grandt et al. 1994). Y2
receptors can be found in the hypothalamus (including ARC), intestine and on vagal afferent
nerves in mammals (Koda et al. 2005). In mammals, the role of PYY as a satiety factor is
believed to be mediated through Y2 receptors on vagal afferents signaling to hypothalamic
ARC via NTS in the brainstem (Ueno et al. 2008).
In fish, PYY sequences have been detected in lamprey (Soderberg et al. 1994),
zebrafish (Larhammar et al. 1995), seabass (Cerda-Reverter et al. 2000), Japanese flounder
(Kurokawa and Suzuki 2002), pufferfish, three-spined stickleback, medaka and torafagu
(Sundstrom et al. 2008). Much of the research on PYY in fish has focused on the evolution of
the neuropeptide Y family of peptides (Larhammar 1996; Sundstrom et al. 2008). Studies
indicate that NPY and PYY evolved from a gene duplication event from a common ancestral
gene, and a second duplication of PYY gave rise to PY (renamed PYYb) (Sundstrom et al.

Introduction
18
2008). There appear to be a difference in distribution of PYY in fish compared to mammals,
with fish PYY being more widespread in the nervous system and endocrine cells (Cerda-
Reverter and Larhammar 2000; Soderberg et al. 2000; Kurokawa and Suzuki 2002). Recently
Murashita et al. (2009) cloned the PYY gene in Atlantic salmon. Atlantic salmon PYY were
found to be highly expressed in midgut, pyloric cecae and brain, with lower expression in
eyes, stomach, adipose tissue and gonads (Murashita et al. 2009). In fish, PYY may thus be
expressed in more proximal parts of the digestive system in contrast to mammals. The role of
PYY in fish is unknown.
Figure 1.1. Central and peripheral effects of key gastrointestinal (GI) tract peptide hormones in
mammals. See next page for legend (page 19).
Introduction
19
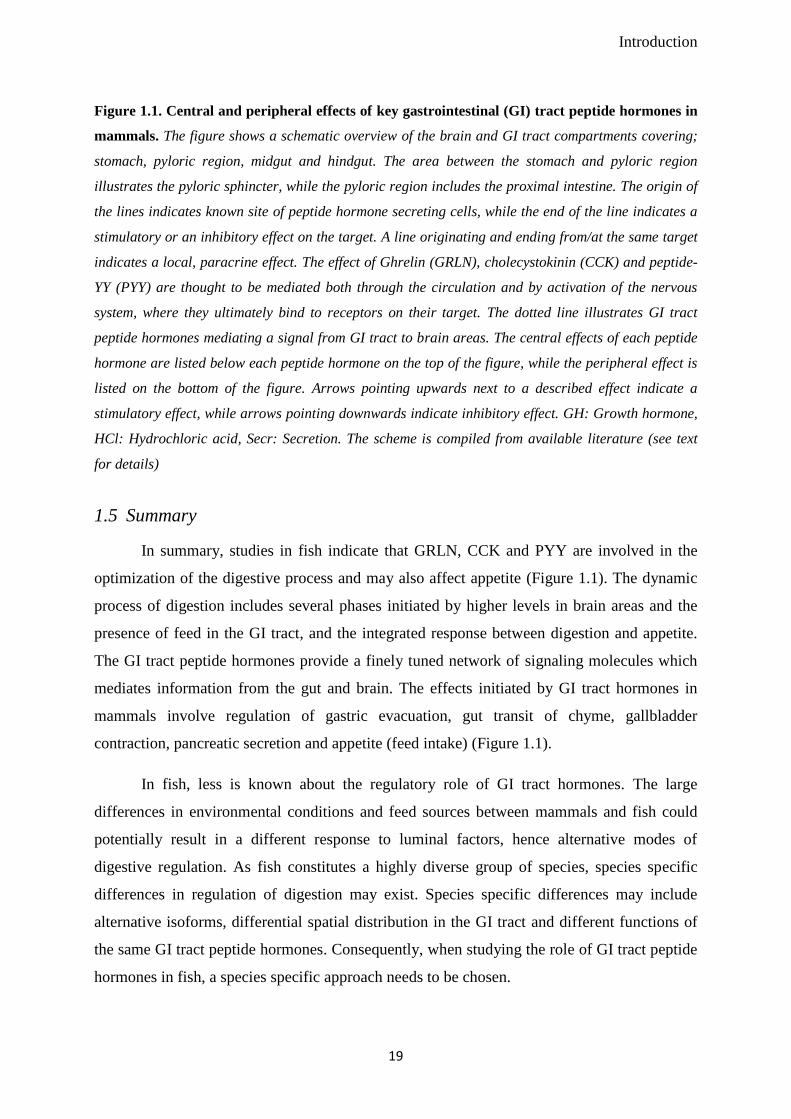
Figure 1.1. Central and peripheral effects of key gastrointestinal (GI) tract peptide hormones in
mammals. The figure shows a schematic overview of the brain and GI tract compartments covering;
stomach, pyloric region, midgut and hindgut. The area between the stomach and pyloric region
illustrates the pyloric sphincter, while the pyloric region includes the proximal intestine. The origin of
the lines indicates known site of peptide hormone secreting cells, while the end of the line indicates a
stimulatory or an inhibitory effect on the target. A line originating and ending from/at the same target
indicates a local, paracrine effect. The effect of Ghrelin (GRLN), cholecystokinin (CCK) and peptide-
YY (PYY) are thought to be mediated both through the circulation and by activation of the nervous
system, where they ultimately bind to receptors on their target. The dotted line illustrates GI tract
peptide hormones mediating a signal from GI tract to brain areas. The central effects of each peptide
hormone are listed below each peptide hormone on the top of the figure, while the peripheral effect is
listed on the bottom of the figure. Arrows pointing upwards next to a described effect indicate a
stimulatory effect, while arrows pointing downwards indicate inhibitory effect. GH: Growth hormone,
HCl: Hydrochloric acid, Secr: Secretion. The scheme is compiled from available literature (see text
for details)
1.5 Summary
In summary, studies in fish indicate that GRLN, CCK and PYY are involved in the
optimization of the digestive process and may also affect appetite (Figure 1.1). The dynamic
process of digestion includes several phases initiated by higher levels in brain areas and the
presence of feed in the GI tract, and the integrated response between digestion and appetite.
The GI tract peptide hormones provide a finely tuned network of signaling molecules which
mediates information from the gut and brain. The effects initiated by GI tract hormones in
mammals involve regulation of gastric evacuation, gut transit of chyme, gallbladder
contraction, pancreatic secretion and appetite (feed intake) (Figure 1.1).
In fish, less is known about the regulatory role of GI tract hormones. The large
differences in environmental conditions and feed sources between mammals and fish could
potentially result in a different response to luminal factors, hence alternative modes of
digestive regulation. As fish constitutes a highly diverse group of species, species specific
differences in regulation of digestion may exist. Species specific differences may include
alternative isoforms, differential spatial distribution in the GI tract and different functions of
the same GI tract peptide hormones. Consequently, when studying the role of GI tract peptide
hormones in fish, a species specific approach needs to be chosen.

Introduction
20
GRLN, CCK and PYY were recently cloned and characterized in Atlantic salmon
(Murashita et al. 2009). However, no information was available on the short term postprandial
effects on mRNA expression of these peptide hormones in the GI tract. Therefore an
experiment was initiated with the aim of increasing the knowledge of postprandial regulation
of the digestive process and appetite by GI tract peptide hormones in Atlantic salmon. Very
limited information exists concerning changes in GRLN, CCK and PYY in relation to meal
processing in Atlantic salmon, and studies on these genes in relation to meal digestion have
only recently been described in goldfish and tilapia (Unniappan et al. 2004; Fox et al. 2009).
1.6 Hypothesis and aim of thesis
The hypothesis is that GRLN-1, GRLN-2, PYY, CCK-L and CCK-N are involved in
the regulation of digestion and appetite in Atlantic salmon similar to mammals. If this is the
case, these peptide hormones are expected to change in mRNA expression according to the
dynamic process of digestion and appetite including stomach filling and evacuation, release of
bile and pancreatic secretion, and the transit of feed through the gut. The regional distribution
pattern of each peptide hormone is expected to reflect its role in the GI tract. If GRLN-1,
GRLN-2, PYY, CCK-L and CCK-N are involved in regulation of digestion and appetite,
potential postprandial changes in gene expression is expected to occur at specific time points
related to the phase of digestion.
In order to test this hypothesis an experiment was conducted were Atlantic salmon
were fed a single meal and the gene expression was analyzed during the postprandial
processing until the GI tract was empty. Unfed fish were used as control and to determine
potential diurnal patterns in mRNA expression. The main aim of the experiment was to:
1) Describe the regional tissue distribution of GRLN-1, GRLN-2, PYY, CCK-L and
CCK-N mRNA in stomach, pyloric cecae, midgut and hindgut.
2) Describe the processing of a single meal by looking at; changes in stomach filling and
emptying, gut transit assessed as filling of pyloric cecae, midgut and hindgut.
3) Describe the release of bile and subsequent refilling of the gallbladder during
processing of a meal.
4) Describe the regulation of meal digestion by analyzing postprandial changes in mRNA
expression of GRLN-1, GRLN-2, PYY, CCK-L and CCK-N during complete
digestion of a meal.

Introduction
21
5) Describe the potential involvement of GRLN-1, GRLN-2, PYY, CCK-L and CCK-N
in regulation of appetite by analyzing postprandial changes in mRNA expression
during complete digestion of a meal.
6) Describe the diurnal variation in GRLN-1, GRLN-2, PYY, CCK-L and CCK-N by
analyzing mRNA expression of these peptide hormones in unfed Atlantic salmon.
In this thesis GRLN, CCK and NPY are discussed as peptide hormones and thus refer
to a group of peptides with described roles of hormones. GRLN, CCK and PYY have all been
shown to act both in an endocrine and in a local paracrine manner. We therefore emphasize
that we are not excluding additional modes of action.

22

Material and methods
23
2. Material and methods
2.1 Animals and samples
Atlantic salmon average body weight 44.7 ± 2.1 g, were reared at the Bergen High-
Technology centre in indoor tanks supplied with a continuous flow of fresh water at 8° C and
with a light regime of 12:12. The fish were fed a commercial pellet diet (EWOS, Bergen,
Norway); see Appendix IV (Table AIV1). Two weeks prior to the postprandial sampling fish
were divided in to two tanks, and hand fed ad libitum at 0900 every morning (7 days/week).
At the first day of sampling, 6 fish in the first tank (unfed group) were sampled at each
selected time point (0, 0.5, 1.5, 3, 6, 9, 12 and 24 hours), whereas fish in the second tank
received food (fed group) as usual. Before sampling the second day, fish were fed as
described above.
At sampling fish were anaesthetized using 50 mg/l MS-222 and killed with a blow to the
head. The weight and length of each fish was recorded before the whole GI tract was
removed. All dissecting work was done using dry-ice. The GI tract was selected for q-PCR,
and the whole gallbladder and GI tract content were selected for weight assessment. The GI
tract was divided into four segments as indicated in Figure 2.1, consisting of stomach, pyloric
cecae, midgut and hindgut. The intestine was emptied of any leftover food and chyme by
gently striking the content out in to pre-weighed aluminium foils. The stomach, midgut and
hindgut segments were then each divided into three segments. Segments were then
flashfrozen using liquid nitrogen, and stored at –80 ºC until further use. The gall bladder was
collected in pre-weighed eppendorf tubes.

Material and methods
24
Figure 2.1. The Atlantic salmon gastrointestinal (GI) tract. The picture shows an unfolded GI tract
representative for Atlantic salmon sampled in this experiment (average weight 44.7 ± 2.1 g). During
sampling, the GI tract were first cut into four main segments consisting of stomach, pyloric cecae
region, midgut and hindgut segments indicated by the dotted line and the area between. The triangles
below the end of each dotted line indicate cutting points. Food and chyme were emptied from stomach,
pyloric cecae intestinal region, midgut and hindgut segments. Each segment excluding pyloric cecae
region were then cut into three segments indicated by the arrows. Pyloric cecae used in gene
expression analyses were cut at the indicated arrow at the base of the shaded area. In the current
study S2, S4, S6 and S9 (indicated by the shaded areas and blue letters) were analyzed by q-PCR as
these are representative for their respective GI regions. The gallbladder was cut off from the intestine
and weighed with content (cutting point indicated by an arrow).
2.2 RNA isolation
Total RNA was isolated according to (Chomczynski 1993) from Atlantic salmon GI tract
segments including; stomach (S2), pyloric cecae (S4), midgut (S6) and hindgut (S9), using
TRI Reagent® (Sigma, USA) for phenol-chloroform extraction.
Tissue samples were brought directly from -80 °C freezer and cut on dry ice to avoid thawing,
then weighed. Each sample was kept in the weight range of 40-45 mg ± 10%. The tissue
samples were quickly transferred to 2 ml FastPrep homogenization vials for tissue disruption,
each vial containing 1 mL cold TRI Reagent® and kept on ice for at least 5 min. Tissue
homogenization was executed using FastPrep™ FP120, BIO101 ThermoSavant (Q-BIOgene,
USA), with the following settings: speed 4 for 20 seconds. The samples were then kept at
room temperature (RT), for 5 minutes. Two hundred µl Chlorofrom (Sigma, USA) was added
and samples thoroughly vortexed for 1 minute until appearance of a milky-white color. To

Material and methods
25
achieve phase separation, the samples were centrifuged for 15 minutes, 12000 x g on 4 °C
(Eppendorf Centrifuge, 5415R, Heracus Instruments, Germany). The upper phase clear
supernatant (approximately 360 µl), was transferred to a clean 1.5 mL microcentrifuge tube
(Axygen, USA) leaving a small volume left to avoid DNA and protein residues. Five hundred
µl of Isopropanol (Sigma) was added to the supernatant, sample inverted five times for
mixing then left for precipitation of RNA for 10 minutes at RT. RNA was precipitated by
centrifugation for 15 minutes, 12000 x g and 4 °C. To ensure a sample with pure RNA, the
pellet was washed with 500 ul 80 % Ethanol (Arcus, Norway). The samples were centrifuged
for 5 minutes, 7600 x g on 4 °C and the supernatant wash removed. Since ethanol may disturb
further enzymatic analysis, all traces of ethanol were removed thoroughly. The samples were
subsequently air dried for 5-10 minutes and reconstituted in 100 µl Nuclease-Free Water
(Ambion, USA). Samples were placed on a heating block (Techne DRI-BLOCK, DB-3D,
Techne, USA) for 5 min at 55 °C, with casual flicking of the vials to ensure a completely
dissolved pellet.
2.3 RNA concentration and quality
RNA concentration was measured using NanoDrop ND-1000 absorbance technology (Thermo
Scientific, USA), where 1.5 µl of total RNA was added to NanoDrop ND-1000 and
quantitative/qualitative measurements were recorded. The 260/280 and 260/230 absorbance
ratio were used as indicators of sample quality in terms of sample pureness. Concentration
measurements for all samples were used as basis for calculations in downstream enzymatic
reactions.
2.4 RNA integrity
RNA integrity was tested by the use of a RIN algorithm („RNA Integrity Number‟ (RIN)) on
the Agilent 2100 Bioanalyzer (Agilent Technologies, USA) in conjunction with RNA 6000
Nano and RNA 6000 Pico LabChip kit (Agilent Technologies) to test sample RNA integrity.
The procedure was followed according to manufacturer‟s guidelines.
2.5 DNase treatment of RNA
To remove traces of genomic DNA, TURBO DNA-free Kit™ (Ambion) was used on total
isolated RNA, following manufacturer‟s instructions for Routine DNase treatment, with one

Material and methods
26
modification: instead of using 10 µg of total RNA into reaction, 12 µg was used. One sample
was split into two parallels in DNase treatment. To minimize loss of RNA during precipitation
and storage these samples were pooled and co-precipitated3.
2.6 cDNA synthesis
cDNA was synthesized using Superscript III First-Strand Synthesis System (Invitrogen, USA)
on 5 µg total RNA template. Oligo(dT) (Sigma, USA) was chosen as primer as it maximizes
the number of mRNA molecules available for analysis in a small sample of RNA. Each
individual sample was split into two parallels and kept as parallels during q-PCR. All reagents
used were provided with the Superscript III kit. Eight µl of RNA sample and 1 µl of dNTPs
and 1 µl of oligo(dT) was heat denatured for 5 min at 65 °C in Gene Amp PCR 2700 machine
(ABI, USA) to limit secondary structures, then chilled on ice for at least 1 min for the primer
to anneal properly. A mastermix containing RT buffer, MgCl2, DTT, and SuperScript™ III
RT was made to a total volume of 10 µl and added to the RNA/primer mixture. Samples were
then heated at 50 °C for 50 min which is the optimum temperature for SuperScript™ III RT,
85 °C for 5 min for reaction termination, then chilled on ice. To remove RNA in the sample,
one µl RNase H was added to each tube an incubated for 20 min at 37 °C. The cDNA
reactions were stored in -20 °C freezer. Two negative controls were made by using RNA
sample leftovers from all samples during each run, one excluding the SuperScript™ III RT,
and one excluding the oligo(dT) primer. All reactions were run on Gene Amp PCR 2700
machine (ABI, USA).
2.7 Real-time quantitative PCR: quantification of gene expression
Real-time quantitative PCR (q-PCR) was used to measure mRNA expression in Atlantic
salmon stomach, pyloric cecae, midgut and hindgut. Q-PCR amplification and analysis were
performed using Chromo4 Continuous Fluorescence Detector (Bio-Rad) and MJ Opticom
Monitor Analysis software (Version 3.1, Bio-Rad). For GRLN-1, GRLN-2 and Atlantic
salmon elongation factor 1α (EF1α) 100 ng cDNA was used. Atlantic salmon EF1α was used
as an internal standard reference gene. For PYY, CCK-N and CCK-L 500 ng cDNA was used.
3 All samples were precipitated with 1/10 of total sample volume with 3 M Sodium Acetate
(pH 5.5) (Ambion) and 2.5 sample volume with 80 % Ethanol, then kept in -80 °C freezer for
storage.

Material and methods
27
The quantities selected were within the range of the standard curve for the respective gene.
Total q-PCR reaction volume of 25 µl was prepared using; 2.5 µl diluted cDNA, 12.5 µl
Power SYBR® Green PCR Master Mix (Applied Biosystems), 0.75 µl forward primer (10
µM), 0.75 µl reverse primer (10 µM) and 8.5 µl Nuclease-Free Water (Ambion). See Table
2.1 for Genebank accession number and primer sequences. The enzymatic amplification
reactions were carried out in 96-Well Skirted PCR plates (Bio-Rad) with thermal cycling
protocol: A first degeneration at 94 °C for 3 min then 40 cycles at 94 °C for 30 s, 60 °C for 30
s and 72 °C for 30 s. A melting curve was performed for each assay to verify the absence of
primer dimers (60-95 °C, read every 0.2 °C and hold for 1 sec).
Each sample was run in duplicate reactions kept from the cDNA synthesis. Standards were
also run in duplicates. Controls included in each plate were; non template negative control, a
between plate control and minus RT. Cycle threshold was set manually to 0.010 which was
within the exponential phase and above background noise for all assays. Q-PCR data were
analyzed in RJ Opticom 3.2.32 (Bio-Rad) software and exported to Excel® and Statistica 8.0
(StatSoft, Inc., USA) for further analysis.
Table 2.1: Primer sequences used in q-PCR
Gene Genebank
Acc. No.
Primer name Sequence (5’-3’)
GRLN-1
AB443431
Ghr Fw3
Ghr Rv3
CCAGAAACCACAGGTAAGACAGGGTA
CTCCTGAAACTCCTCCTCACTCATGG
GRLN-2
AB443432
Ghr Fw4
Ghr Rv3
GCCCCTCCCAGAAACCACAGGGTAAA
CTCCTGAAACTCCTCCTCACTCATGG
PYY
AB443435 PYY Fw5
PYY Rv5
ACTACACCGCGCTCAGACACTACATC
TCTCTGGTCTCTCTCTGCATTGTTGCCG
CCK-L
AB443433 CCK-L Fw3
CCK-L Rv3
GCGCGAACTACTGGCAAGATTGATA
TGTCCTTTATCTTGTGGCTGGGACCCG
CCK-N
AB443434 CCK-N Fw3
CCK-N Rv3
CCTCTGAAGCACGTCTTGAAGCCTAC
GAGATGAGTCTAGCCAACAGTTCACTGA
EF1α AF321836 Ss EF1 SYBR Fw
Ss EF1 SYBR Rv
GAGAACCATTGAGAAGTTCGAGAAG
GCACCCAGGCATACTTGAAAG

Material and methods
28
2.8 Calculation of copy number
The resulting cycle threshold (Ct) values from the two parallels of each sample were averaged
and the average deviation between sample Ct values calculated. Samples with average
deviation between parallels exceeding 20 % were rerun in q-PCR.
A dilution series of plasmid recDNA standards prepared was analyzed in duplicate reactions
by q-PCR for each assay. The plasmid recDNA standards was made by Dr. Koji Murashita,
(Murashita et al. 2009) according to protocols from Applied Biosystems (AppliedBiosystems
2003).
Standard curves were prepared by plotting the Ct values against the logarithm of the copy
numbers in the standards, and linear regression was performed (Bustin 2000). The initial copy
number was calculated using the following equation:
Ct = - slope ∙ (Ci) + intercept (Equation 2.1)
Where Ct is the sample Ct value from q-PCR and Ci is the unknown initial copy number in
the sample. Rewriting equation (2.1):
Ci = (Ct – intercept) / (- slope) (Equation 2.2)
Based on the constructed dilution curves of the standard, the R2
was calculated using least
square linear regression, resulting in values > 0.99 for all assays. The obtained copy numbers
for all samples were normalized against Atlantic salmon elongation factor 1 α by dividing
sample copy number on EF1a copy number (target gene/reference gene).
2.9 Statistical analysis
All statistical analysis was performed in Statistica 8.0 (StatSoft, Inc., USA). Both unfed and
fed fish groups were tested for normality within all time groups in separate segments (S2, S4,
S6 and S9), using Shapiro-Wilk W-test. Homogeneity of variance was tested on the same

Material and methods
29
groups with Levene‟s F-test. Significant differences in mRNA copy number expression was
determined with main effects ANOVA using fish group (unfed, fed) and time as effects. For
both unfed and fed fish, a one way ANOVA was included to determine changes caused by
time alone within each group. In addition an independent between-variable t-test was
performed to determine differences between unfed and fed fish group means at each time
point. For differences in mRNA expression between segments within each gene, factorial
ANOVA was used with fish group and segment as variables.
The null hypothesis was rejected at significance level α < 0.05, and a Tukey HSD post-hoc
test was then followed up. Log transformation of data was performed to better meet the
assumptions of ANOVA for normal distribution and homogeneity of variance. Some groups
still failed to meet these demands (see Appendix III).

30

Results
31
3. Results
3.1 GI tract compartment content and gallbladder weight
3.1.1 GI tract compartment content
Four compartments of the GI tract were assessed through the weighing of their
contents to assess the amount of contents of feed and chyme. The average feed intake was
estimated to 3.9 % (GI tract content (g) / average fish weight (g) at time 0.5). At the first
sampling point, 30 min after termination of the meal, most of the ingested food (ca 87 %) was
still in the stomach with only a small fraction transferred into the pyloric segment (Figure
3.1.1, a). Subsequently, there was a rapid emptying of stomach content and ca 50 % had been
transferred from stomach at 4.5 hpf. Most of the stomach content (ca 83%) was emptied at 9-
12 hpf, and at 24 hpf the stomach was empty. The unfed fish had an empty stomach
throughout the experiment confirmed by visual inspection and content weight (Figure 3.1.1,
b). The graph presenting measurements of pyloric cecae (S4) contents in fed fish (Figure
3.1.1, a) displayed a more gradual content increase, lacking a distinct peak but showed a
decreasing trend from 9 hpf towards 24 hpf where it was empty. The midgut and hindgut
compartments in fed fish displayed a weak gradual increase in chyme towards 12 h past
feeding followed by minimal content at 24 hpf. In unfed fish, all gut compartments showed
minimal and stable chyme content within the time of the experiment (Figure 3.1.1, b).
3.1.2 Gallbladder content
The gallbladder showed a rapid release of content 0.5 h past feeding shown by a decrease in
gallbladder weight (g) (Figure 3.1.2, a). At 1.5 hpf the gallbladder was empty. From 6 and 9
hpf bile there was an increase in gallbladder weight (Figure 3.1.2, a). At 24 hpf the
gallbladder shows high content levels equal to time 0 h (prefeeding levels). There are no
differences in gallbladder weight throughout the whole sampling period for the unfed fish
group (Figure 3.1.2, b).

Results
32
Figure 3.1.1 Measurements of GIT compartment content (g). The data in graph (a) are
represented as the average weight (g) of feed and chyme of each GIT compartment (stomach, pyloric
cecae, midgut and hindgut) for six fish sampled at time (h): 0 (prefeeding), and 0.5, 1.5, 3, 6, 9, 12 and
24 after feeding ± SD. In (b) the data are represented as in (a), but for fish fasted for 24 h prior to
sampling (Time (h): 0) and throughout the sampling period (unfed for 48 h in total). The data point for
each segment at each time point is shifted relative to each other to better distinguish the segments. The
fish in (a) and (b) were kept in separate tanks during the experiment.
0,0
1,5
3,0
4,5
6,0
7,5
9,0
10,5
12,0
13,5
15,0
16,5
18,0
19,5
21,0
22,5
24,0
Time (h)
0,0
0,5
1,0
1,5
2,0G
IT c
om
pa
rtm
en
t con
ten
t (g
)
0,0
1,5
3,0
4,5
6,0
7,5
9,0
10,5
12,0
13,5
15,0
16,5
18,0
19,5
21,0
22,5
24,0
Time (h)
0,0
0,5
1,0
1,5
2,0
GIT
co
mpa
rtm
en
t con
ten
t (g
)
(a) Fed fish Stomach
Pyloric cecae
Mid gut
Hind gut
(b) Unfed fish

Results
33
Figure 3.1.2 Measurements of gallbladder weight (g). Graph (a) and (b) each represents the
average weight of the gallbladder (g) for six fish sampled at time (h): 0 (prefeeding), 0.5, 1.5, 3, 6, 9,
12 and 24 after feeding in (a) = fed fish (with the exception of time (h): 0 which is fish sampled prior
to feeding), and 24 h since last meal prior to sampling in (b) = unfed fish. The dotted line represents
the weight (g) of an empty gallbladder (a gallbladder with minimal content).
0,0
1,5
3,0
4,5
6,0
7,5
9,0
10,5
12,0
13,5
15,0
16,5
18,0
19,5
21,0
22,5
24,0
Time (h)
0,0
0,1
0,2
0,3
Weig
ht (g
)
0,0
1,5
3,0
4,5
6,0
7,5
9,0
10,5
12,0
13,5
15,0
16,5
18,0
19,5
21,0
22,5
24,0
Time (h)
0,0
0,1
0,2
0,3
Weig
ht (g
)
Gallbladder
Empty
(a) Fed fish
(b) Unfed fish
Empty

Results
34
3.2 Spatial distribution of GRLN-1, GRLN-2, PYY, CCK-L and CCK-N mRNA
in Atlantic salmon GIT
3.2.1 GRLN-1
GRLN-1 mRNA copy numbers was highest in stomach tissue (S2) of Atlantic salmon. Figure
3.2.1 shows the GRLN-1 average copy numbers at all selected time points for each fish group
(fed/unfed). GRLN-1 exhibited significantly lower copy numbers in pyloric cecae (S4),
midgut (S6) and hindgut (S9) tissue (p<0.05) compared to stomach (S2), using factorial
ANOVA. The hindgut (S9) exhibited lowest GRLN-1 mRNA copy numbers (p<0.01), (Figure
3.2.1, Segment 9). No significant difference in GRLN-1 mRNA copy numbers were found
between pyloric cecae (S4) and midgut (S6) tissue for any of the fish. GRLN-1 mRNA copy
numbers were not significant different between unfed and fed fish for any of the segments.
3.2.2 GRLN-2
GRLN-2 average mRNA copy numbers were highest in stomach tissue (S2) (Figure 3.2.2).
GRLN-2 appeared to have the same spatial mRNA expression pattern as GRLN-1 in Atlantic
salmon. The factorial ANOVA and post-hoc Tukey HSD test, showed statistical significant
lower GRLN-2 copy numbers in pyloric cecae (S4), midgut (S6) and hindgut (S9) tissue
(p<0.05) compared to stomach (S2) (p<0.001). GRLN-2 copy numbers in hindgut (S9)
showed significant lower copy numbers than all other tissues studied (p<0.001, Tukey HSD).
No significant difference in mRNA expression of GRLN-2 could be seen between fed and
unfed fish for any of the tissues.
3.2.3 PYY
PYY mRNA copy numbers were higher in pyloric cecae (S4) and midgut (S6) in Atlantic
salmon compared to stomach (S2) and hindgut (S9) tissue (p<0.001) (Figure 3.2.3). Fed fish
exhibited higher PYY copy numbers than unfed fish in the stomach (S2) (p<0.05). The
hindgut (S9) of Atlantic salmon was the third most expressing tissue of PYY mRNA, and
exhibited a significant higher PYY copy number than stomach tissue (S2) (p<0.001). The
largest variation in PYY copy numbers within fish groups were found in stomach tissue (S2)
(unfed fish SD=0.02 and fed fish SD=0.03). The lowest variation within fish groups was
found in midgut (S6) tissue for unfed and fed fish (SD=0.005 for both groups). No significant

Results
35
differences were found in PYY mRNA copy numbers between pyloric cecae (S4) or midgut
(S6) tissues for fed and unfed fish.
3.2.4 CCK-L
CCK-L mRNA copy numbers were found to be significant higher (p<0.01) in hindgut (S9)
tissue of Atlantic salmon, compared with those in stomach (S2), pyloric cecae (S4) and
midgut tissue (S6) (Figure 3.2.4). CCK-L copy numbers were expressed in moderate levels in
pyloric cecae (S4) and midgut (S6). Stomach (S2) exhibited the lowest level of CCK-L copy
numbers (p<0.001) compared to the other segments. Pyloric cecae showed the largest
variation within each fish group compared with the other tissues, indicated by the error bars
(±SD) in Figure 3.2.4. No significant differences were found in CCK-L mRNA expression
between unfed and fed fish in any of the segments analyzed.
3.2.5 CCK-N
CCK-N mRNA copy numbers were found in stomach (S2) and pyloric cecae (S4) of Atlantic
salmon (Figure 3.2.5). No significant differences in CCK-N copy numbers were detected
between stomach (S2) and pyloric cecae (S4), neither between fish groups (fed/unfed) within
each tissue (S2 and S4). Atlantic salmon only expressed low levels of CCK-N mRNA in
midgut (S6) and hindgut (S9). Several fish sampled in these compartments were below the
detectable limit for q-PCR. No statistical analyses could thus be performed on these two
tissues.

Results
36
Figur 3.2.1. GRLN-1 mRNA distribution in Atlantic salmon GI tract. Data are represented as
mean calculated copy number for unfed fish (n= 18), and fed fish (n= 15) normalized against Atlantic
salmon EF1α copy numbers ((copy numbers of target gene/copy numbers of EF1a reference gene) ±
SD), for GI tract segments; stomach (2), pyloric cecae (4), midgut (6) and hindgut (9).
Figur 3.2.2. GRLN-2 mRNA distribution in Atlantic salmon GI tract. See caption in Figure 3.2.1
for information on data representation.
2 4 6 9
Segment
0,0
0,1
0,2
0,3
0,4
0,5
0,6
0,7
0,8
0,9G
hre
lin-1
norm
aliz
ed e
xp
ressio
n
Unfed fish
Fed fish
2 4 6 9
Segment
0,0
0,1
0,2
0,3
0,4
0,5
0,6
0,7
0,8
0,9
Ghre
lin-2
norm
aliz
ed e
xp
ressio
n
Unfed fish
Fed fish

Results
37
Figur 3.2.3. PYY mRNA distribution in Atlantic salmon GI tract. See caption in Figure 3.2.1 for
information on data representation. An asterisk above bars represents significant differences between
unfed and fed fish within a segment.
Figur 3.2.4. CCK-L mRNA distribution in Atlantic salmon GI tract. See caption in Figure 3.2.1
for information on data representation.
2 4 6 9
Segment
0,00
0,05
0,10
0,15
0,20
0,25P
YY
norm
aliz
ed e
xp
ressio
n
Unfed fish
Fed fish
2 4 6 9
Segment
0,00
0,05
0,10
0,15
0,20
CC
K-L
norm
aliz
ed e
xp
ressio
n
Unfed fish
Fed fish
*

Results
38
Figur 3.2.5. CCK-N mRNA distribution in Atlantic salmon GI tract. See caption in Figure 3.2.1
for information on data representation. Several fish in midgut and hindgut tissue (Segment 6 and 9)
showed CCK-N mRNA expression below the detectable limit for q-PCR. The bars representing midgut
and hindgut should thus be interpreted with some caution as these bars include only the fish which
showed CCK-N mRNA levels above the detectable limit in q-PCR.
2 4 6 9
Segment
0,00
0,05
0,10
0,15
0,20C
CK
-N n
orm
aliz
ed e
xp
ressio
n
Unfed fish
Fed fish

Results
39
3.3 Postprandial effect on mRNA copy numbers of GRLN-1, GRLN-2, PYY,
CCK-L and CCK-N in Atlantic salmon GI tract
3.3.1 GRLN-1
Significant differences in mRNA copy numbers of GRLN-1 were found between unfed and
fed fish in midgut (S6) (p<0.05), (Figure 3.3.1; c) and in hindgut (S9) (p<0.05), (Figure 3.3.1;
d) at time 24 h. No significant differences were found in GRLN-1 mRNA expression between
fed and unfed fish in stomach (S2), (Figure 3.3.1; a) or pyloric cecae (S4), (Figure 3.3.1; b).
The mRNA expression pattern of GRLN-1 in stomach (S2) is the same for fed and unfed fish.
ANOVA analysis of main effects using time (h) and fish groups (fed, unfed) as effects, and
one-way ANOVA to identify the influence of time within each fish group, did not show
significant values at p<0.05.

Results
40
Figure 3.3.1. GRLN-1 copy numbers in Atlantic salmon GI tract. GRLN-1 mRNA copy numbers
are shown for stomach (a), pyloric cecae (b), midgut (c) and hindgut (d). Data are presented as mean
(n=3) calculated copy number (±S.D) normalized against EF1α reference gene (copy numbers), for
unfed fish (black square) and fed fish (red triangle) at time (h); 0.5, 1.5, 3, 6 and 24. Time 0 is
represented for unfed fish only. Mean values with an asterisk above show significant differences
between fish groups at a given time point (p<0.5).
(a) Stomach (S2)
0 3 6 9 12 15 18 21 24
Time (h)
0,2
0,3
0,4
0,5
0,6
0,7
0,8
Ghre
lin-1
norm
aliz
ed e
xpre
ssio
n(b) Pyloric cecae (S4)
0 3 6 9 12 15 18 21 24
Time (h)
0,2
0,3
0,4
0,5
0,6
0,7
0,8
Ghre
lin-1
norm
aliz
ed e
xpre
ssio
n
(c) Mid gut (S6)
0 3 6 9 12 15 18 21 24
Time (h)
0,2
0,3
0,4
0,5
0,6
0,7
0,8
Ghre
lin-1
norm
aliz
ed e
xpre
ssio
n
(d) Hind gut (S9)
0 3 6 9 12 15 18 21 24
Time (h)
0,2
0,3
0,4
0,5
0,6
0,7
0,8
Ghre
lin-1
norm
aliz
ed e
xpre
ssio
n
Fasted fish
Fed fish
*
*

Results
41
3.3.2 GRLN-2
Significant higher GRLN-2 copy numbers (p<0.05) were found in fed fish than unfed fish at
time 24 h in midgut (S6) (Figure 3.3.2; c) and hindgut (S9) (Figure 3.3.2; d) of Atlantic
salmon. No significant differences were found between fish groups at time; 0.5, 1.5, 3 and 6
hour (t-test) in any of the gut tissues studied (Figure 3.3.2; a, b, c, d). No significant
differences were found between fish groups in stomach (S2) tissue (Figure 3.3.2; a) or pyloric
cecae (Figure 3.3.2; b). GRLN-2 copy numbers in stomach (S2) exhibited the lowest variation
in copy numbers both between and within fish groups (Figure 3.3.2; a).
ANOVA analysis of main effects using time (h) and fish groups (fed, unfed) as effects
showed significant values at p<0.05 for fish group as an effect. No significant differences
were found in one-way ANOVA using time as an independent factor for each fish group.

Results
42
Figure 3.3.2. GRLN-2 copy numbers in Atlantic salmon GI tract. GRLN-2 mRNA copy numbers
are shown for stomach (a), pyloric cecae (b), midgut (c) and hindgut (d). See caption in Figure 3.3.1
for information on data representation.
(a) Stomach (S2)
0 3 6 9 12 15 18 21 24
Time (h)
0,2
0,3
0,4
0,5
0,6
0,7
0,8
Ghre
lin-2
norm
aliz
ed e
xpre
ssio
n(b) Pyloric cecae (S4)
0 3 6 9 12 15 18 21 24
Time (h)
0,2
0,3
0,4
0,5
0,6
0,7
0,8
Ghre
lin-2
norm
aliz
ed e
xpre
ssio
n
(c) Mid gut (S6)
0 3 6 9 12 15 18 21 24
Time (h)
0,2
0,3
0,4
0,5
0,6
0,7
0,8
Ghre
lin-2
norm
aliz
ed e
xpre
ssio
n
(d) Hind gut (S9)
0 3 6 9 12 15 18 21 24
Time (h)
0,2
0,3
0,4
0,5
0,6
0,7
0,8
Ghre
lin-2
norm
aliz
ed e
xpre
ssio
n
Fasted fish
Fed fish
*
*

Results
43
3.3.3 PYY
Significant differences in PYY mRNA copy numbers were found between unfed and fed fish
in hindgut (S9) of Atlantic salmon at time 1.5 h, 3 h and 24 h (p<0.05), (Figure 3.3.3; d). In
hindgut (S9) at time 1.5 h, fed fish exhibited higher PYY copy numbers than unfed fish. At
time 3 h and 24 h unfed fish exhibited the highest PYY copy numbers in hindgut (S9). No
significant differences were found in PYY mRNA copy numbers between unfed or fed fish in;
stomach (S2), pyloric cecae (S4) or midgut (S6) (Figure 3.3.3; a, b and c, respectively).
Stomach (S2) tissue showed more variation within the time groups than pyloric cecae (S4),
midgut (S6) and hindgut (S9), indicated by the standard deviation (SD) in Figure 3.3.3; a.
ANOVA analysis of main effects using time (h) and fish groups (fed, fasted) as effects
showed significant values at p<0.05 for time on PYY mRNA expression in midgut, the Tukey
HSD post-hoc test found this significant difference in PYY copy numbers between time 0 h
and 1.5 h in midgut. However the one-way ANOVA using time as independent factor for each
fish group did not show any significant effect of time alone.

Results
44
Figure 3.3.3. PYY copy numbers in Atlantic salmon GI tract. PYY mRNA copy numbers are shown
for stomach (a), pyloric cecae (b), midgut (c) and hindgut (d). See caption in Figure 3.3.1 for
information on data representation.
(a) Stomach (S2)
0 3 6 9 12 15 18 21 24
Time (h)
0,06
0,08
0,10
0,12
0,14
0,16
0,18
PY
Y n
orm
aliz
ed e
xpre
ssio
n(b) Pyloric cecae (S4)
0 3 6 9 12 15 18 21 24
Time (h)
0,06
0,08
0,10
0,12
0,14
0,16
0,18
PY
Y n
orm
aliz
ed e
xpre
ssio
n
(c) Mid gut (S6)
0 3 6 9 12 15 18 21 24
Time (h)
0,06
0,08
0,10
0,12
0,14
0,16
0,18
PY
Y n
orm
aliz
ed e
xpre
ssio
n
(d) Hind gut (S9)
0 3 6 9 12 15 18 21 24
Time (h)
0,06
0,08
0,10
0,12
0,14
0,16
0,18
PY
Y n
orm
aliz
ed e
xpre
ssio
n
Fasted fish
Fed fish
* * *

Results
45
3.3.4 CCK-L
Significant differences in CCK-L mRNA copy numbers (p<0.05) were found between fed and
unfed fish in stomach (S2) of Atlantic salmon at time 3 h, where unfed fish exhibited higher
CCK-L copy numbers than fed fish (Figure 3.3.4; a). Significant higher CCK-L copy numbers
were found in the midgut (S6) of fed fish at time 0.5 h and time 24 h (p<0.05), than in unfed
fish at the same time points (Figure 3.3.4; c). CCK-L copy numbers were significantly higher
in unfed fish than fed fish at time 1.5 h postprandial (p<0.05) in hindgut (S9) (Figure 3.3.4;
d). No significant differences between fish groups were found in pyloric cecae (S4) (Figure
3.3.4; b).
Results from main effect ANOVA using time (h) and fish groups (unfed, fed) as effects
showed significant effect of time at p<0.05 on CCK-L copy numbers in pyloric cecae. The
followed up Tukey HSD post hoc test, found this significant effect between time 0 h and 0.5 h
(p<0.05). Main effect ANOVA detected additional significant effects of fish group on CCK-L
mRNA copy numbers in stomach (S2) (p<0.01) and midgut (S6) (p<0.01). No significant
effect of time was detected using one-way ANOVA with time as independent factor on CCK-
L copy numbers within each fish group (fed/unfed).

Results
46
Figure 3.3.4. CCK-L copy numbers in Atlantic salmon GI tract. CCK-L mRNA copy numbers are
shown for stomach (a), pyloric cecae (b), midgut (c) and hindgut (d). See caption in Figure 3.3.1 for
information on data representation.
(a) Stomach (S2)
0 3 6 9 12 15 18 21 24
Time (h)
0,04
0,06
0,08
0,10
0,12
0,14
CC
K-L
norm
aliz
ed e
xpre
ssio
n(b) Pyloric cecae (S4)
0 3 6 9 12 15 18 21 24
Time (h)
0,04
0,06
0,08
0,10
0,12
0,14
CC
K-L
norm
aliz
ed e
xpre
ssio
n
(c) Mid gut (S6)
0 3 6 9 12 15 18 21 24
Time (h)
0,04
0,06
0,08
0,10
0,12
0,14
CC
K-L
norm
aliz
ed e
xpre
ssio
n
(d) Hind gut (S9)
0 3 6 9 12 15 18 21 24
Time (h)
0,04
0,06
0,08
0,10
0,12
0,14
CC
K-L
norm
aliz
ed e
xpre
ssio
n
Fasted fish
Fed fish
*
* *
*

Results
47
3.3.5 CCK-N
CCK-N mRNA copy numbers in Atlantic salmon stomach (S2) exhibited significant
differences (p<0.05) between unfed and fed fish at time 1.5 h, where fed fish show a higher
CCK-N mRNA copy numbers than unfed fish (Figure 3.3.5; a). No significant differences
were found in CCK-N mRNA expression in pyloric cecae (S4) (Figure 3.3.5; b). The midgut
(S6) and hindgut (S9) are not presented for CCK-N as q-PCR results of CCK-N mRNA copy
numbers were below the detectable limit for q-PCR. Results from main effect ANOVA using
time (h) and fish groups (fed, unfed) as effects failed to show significant values at p<0.05.
This was also the case for one-way ANOVA using time as independent factor for each fish
group.
Figure 3.3.5 CCK-N copy numbers in Atlantic salmon GI tract. CCK-N mRNA copy numbers are
shown for stomach (a) and pyloric cecae (b). See caption in Figure 3.3.1 for information on data
representation. Midgut and hindgut were not included in this figure as several fish spread over
different time groups showed CCK-N mRNA expression below the detectable limit in q-PCR.
(a) Stomach (S2)
0 3 6 9 12 15 18 21 24
Time (h)
0,04
0,06
0,08
0,10
0,12
0,14
CC
K-N
no
rma
lize
d e
xp
ressio
n
(b) Pyloric cecae (S4)
0 3 6 9 12 15 18 21 24
Time (h)
0,04
0,06
0,08
0,10
0,12
0,14
CC
K-N
no
rma
lize
d e
xp
ressio
n
Fasted fish
Fed fish
*

Results
48
3.4 Results of correlation between sample Ct value and RIN
Table 3.4 summarizes the results from the linear regression of sample Ct values and their
corresponding RIN value obtained from q-PCR and RNA integrity assessment, respectively.
All genes analyzed in pyloric cecae (S4) showed significant correlation at p<0.05. In midgut
(S6); EF1α (reference gene), PYY and CCK-N showed significant correlation between Ct and
RIN. In stomach (S2), GRLN-1 and GRLN-2 showed significant correlation with p values
(<0.05). However in hindgut (S9), only CCK-L showed significant correlation (p<0.05). The
coefficient of determination (r2) showed low values for all genes (r
2<31).
Table 3.4 Correlation between RNA integrity and cycle threshold (Ct). Results of Cycle
threshold (Ct) values (y) plotted against RNA integrity (x). Data are represented for the
different genes expressed in different segments of the GI tract (S2, S4, S6 and S9) showing;
coefficient of determination (r2) and regression p value. All samples underwent similar
experimental treatment. Data were considered significant at α < 0.05, n.s. = non significant (α
> 0.05). Significant values are shown in bold and underlined.
Stomach (S2) Pyloric cecae (S4) Midgut (S6) Hindgut (S9)
r2 p r2 p r2 p r2 p
EF1α 0.091
n.s.
0.290
0.002
0.306
0.001
0.082
n.s.
GRLN-1 0.144
0.033
0.134
0.040
0.001
n.s.
0.025
n.s.
GRLN-2 0.135
0.042
0.143
0.033
0.035
n.s.
0.037
n.s.
PYY 0.056
n.s.
0.309
0.001
0.298
0.001
0.025
n.s.
CCK-L 0.001
n.s.
0.146
0.031
0
n.s.
0.172
0.018
CCK-N 0.003
n.s.
0.210
0.008
0.174
0.048
0.047
n.s.

Discussion
49
4. Discussion
4.1 Spatial mRNA expression of GI tract peptide hormones in Atlantic salmon
4.1.1 GRLN-1 and GRLN-2
The GI tract has been shown to be the main site of GRLN production in all vertebrates
studied to date (Kaiya et al. 2008). This recently included Atlantic salmon (Murashita et al.
2009). The current study showed that GRLN-1 and GRLN-2 is expressed throughout the GI
tract in Atlantic salmon (Figure 3.2.1 and 3.2.2) which correlates well with results from
studies in other vertebrates (Kaiya et al. 2008; Murashita et al. 2009). GRLN-1 and GRLN-2
were both highest expressed in the stomach, moderately expressed in pyloric cecae and
midgut, and lowest expressed in hindgut. No differences were found between GRLN-1 and
GRLN-2 spatial mRNA expression, possibly indicating similar functions. The high levels of
GRLN in Atlantic salmon stomach observed in the present study, is in agreement with
previous studies in Atlantic salmon, rainbow trout, eel, catfish, tilapia (Murashita et al. 2009)
(for more details on species comparison see; Kaiya et al. 2008).
In the current study, apparently higher GRLN mRNA expression for the two GRLN
isoforms were found in pyloric cecae, midgut and hindgut compared to results presented in
Murashita et al. (2009). In their work, Murashita et al. (2009) did not detect GRLN mRNA
expression in Atlantic salmon hindgut after 32 amplification rounds using real time (RT)-
PCR. However as RT-PCR results of GRLN expression in Atlantic salmon hindgut are only
semi-quantitative, a direct comparison of the results should be avoided (Murashita et al.
2009). In addition fish size and consequently life stage differs and there may be physiological
differences in the expression between juvenile fish in the present study and adult fish in
Murashita et al. (2009).
In immature rainbow trout, regional studies on GRLN mRNA expression in the GI
tract also showed a moderate GRLN expression in the intestine, but low expression in pyloric
cecae (Kaiya et al. 2003a). GRLN mRNA expression has not been investigated in adult
rainbow trout, however moderate GRLN levels in immature Atlantic salmon and rainbow
trout could imply life stage differences in GRLN expression. Although high expression of
GRLN in stomach was found in all fish studied by Kaiya et al. (2003a) one of the fish
expressed very low levels of GRLN mRNA in the intestine. Thus, individual differences

Discussion
50
GRLN expression may also be a factor to be considered when performing tissue distribution
studies on GRLN. A moderate expression of GRLN in midgut and hindgut of Atlantic salmon
thus agrees with studies in rainbow trout, but contrasts former studies in Atlantic salmon
(Kaiya et al. 2003a; Murashita et al. 2009). The higher mRNA expression of GRLN in pyloric
cecae compared with hindgut agrees with Murashita et al. (2009). In contrast, rainbow trout
show significantly lower GRLN expression in pyloric cecae, indicating species specific tissue
distribution of GRLN in salmonids.
Comparative studies in fish show high to moderate levels of GRLN in the intestine of
eel, catfish, goldfish, and rainbow trout (Kaiya et al. 2008). Goldfish lacks a stomach,
however the intestine was shown to be the main site of GRLN expression in this species
(Unniappan et al. 2002). GRLN was not detected in the intestine of tilapia (Kaiya et al.
2003c). The degree of GI tract compartmentalization in the form of a well demarcated
stomach may thus influence the tissue distribution pattern of GRLN. In general, GRLN is
expressed in high levels in the stomach of fishes and in high to moderate levels in the
intestine. However there are species specific variations and individual variations in GRLN
tissue distribution, thus possibly indicating species specific functions of GRLN in GI tract. In
addition developmental life stage may also influence the spatial GRLN distribution.
No differences in GRLN expression were found between fed and unfed fish groups.
As these groups (fed/unfed fish) show the group average result of GRLN expression within 24
hours, there may not be a direct effect of GRLN-1/2 on the entire fish group. However
potential short term effects of GRLN-1/2 on regulating digestion and appetite within this
period may still exist, and will be discussed more in depth in section 4.2 and 4.3.
The specific function of GRLN in different areas of the GI tract is currently unknown.
The higher expression in stomach of Atlantic salmon, suggest this region to be the most
important in GRLN function. Intraperitoneal (IP) injections of GRLN have been shown to
increase appetite in goldfish, while no effect was observed in rainbow trout (Unniappan et al.
2004; Jönsson et al. 2007). It is thus uncertain if GRLN act as an orexigenic factor in fish as
observed in mammals (Kojima and Kangawa 2002). Studies in mammals suggest that GRLN
mediate its main effects through vagal afferents and not through circulating levels (Date et al.
2002). Locally produced GRLN in the GI tract may thus have a more direct role in mediating
the function of GRLN, in contrast to GRLN released into the circulation. The regional

Discussion
51
distribution of GRLN in Atlantic salmon show similarities with rainbow trout, and thus
indicates similarities in GRLN function in salmonids. This could include the effect of GRLN
on appetite.
It is also possible that GRLN produced in the GI tract is released into the circulation
and affect distant targets. IP injections of GRLN have been shown to increase circulating
levels of GH in goldfish, channel catfish, rainbow trout and tilapia (Kaiya et al. 2003a;
Unniappan and Peter 2004; Kaiya et al. 2005; Fox et al. 2007). GRLN synthesized and
secreted by endocrine cells in the stomach and intestine may thus bind to GHS-R receptors in
the pituitary and stimulate GH release. GHS-R receptors in salmonids have been identified in
the pituitary of rainbow trout (Kaiya et al. 2009). It would thus be interesting to study GHS-R
receptors in Atlantic salmon.
4.1.2 PYY
The highest expression of PYY mRNA was found in pyloric cecae and midgut, while
lower levels were detected in hindgut and stomach (Figure 3.2.3) in accordance with
Murashita et al. (2009). In contrast to Murashita et al. (2009), this study accurately quantifies
regional PYY mRNA expression in Atlantic salmon GI tract.
Recently, Sundström et al. (2008) suggested a renaming of PY to PYYb. This naming
will thus be used in this discussion as recommended in Murashita et al. (2009). Phylogenetic
studies separate PYY into PYYa and PYYb type groups (Murashita et al. 2009). Atlantic
salmon PYY is classified as PYYa type (Murashita et al. 2009). Semi-quantitative RT-PCR
studies in tiger puffer fish (Takifugu rubripes) detected apparently high levels of PYYa and
PYYb mRNA expression in intestine, similar to this current study (Sundstrom et al. 2008).
However, Sundström et al. (2008) does not show the spatial tissue distribution of the two
PYY types within the intestine. Quantitative spatial expression studies should thus be
executed in tiger puffer fish in order to conclude on any similarities in PYYa expression with
Atlantic salmon PYY. Q-PCR studies in yellowtail found high mRNA expression of PYYb in
anterior intestine, -and lower expression in pyloric cecae, stomach and posterior intestine
(Murashita et al. 2006). Although yellowtail PYYb belongs to the second teleost PYY group,
PYYb show similar expression pattern with Atlantic salmon PYY in anterior intestine.
However Atlantic salmon show higher levels of PYY mRNA in pyloric cecae, suggesting a
species specific pattern of PYY mRNA expression.

Discussion
52
In conclusion, studies on PYYa and PYYb distribution in fish GI tract all show a
higher mRNA expression in anterior intestine and lower expression in stomach and hindgut.
This is in contrast to mammals where PYY secreting cells are concentrated in distal intestine
(Lundberg et al. 1982). Different expression patterns of PYY between fish and mammals
suggest species specific functions of PYY in the GI tract. Also, the similarities in tissue
distribution of PYYa and PYYb in fish possibly suggest similarities in function.
In the current study fed fish exhibits higher PYY mRNA expression compared to
unfed fish in stomach (Figure 3.2.3). In conclusion, this may indicate a potential effect of
PYY during feeding in Atlantic salmon, however this effect is minor as no temporal
differences were observered in PYY mRNA expression in stomach during meal processing
(Figure 3.3.3; a). The postprandial effect of PYY is discussed under section 4.3 and 4.4.
4.1.3 CCK-L and CCK-N
This study demonstrated differences in the regional distribution for CCK-L and CCK-
N in Atlantic salmon GI tract. This was only indicated semi-quantitatively by Murashita et al.
(2009). In the current study, CCK-L mRNA expression was detected in all GI tract regions
studied (Figure 3.2.4). The highest expression of CCK-L mRNA was found in hindgut,
whereas moderate expression was detected in midgut and pyloric cecae, and lowest
expression in stomach. All results are in agreement with Murashita et al. (2009). Although
CCK-L were only presented semi-quantitatively by Murashita et al. (2009), the band intensity
are consistent with our results. In agreement with our results, Jensen et al. (2001) found high
levels of trout CCK-L expression in anterior intestine and distal intestine. However, trout
expresses higher levels of CCK-L in stomach and low levels in pyloric cecae. This finding
contrast our results. A species specific distribution of CCK-L may thus exist in salmonids.
In this study, CCK-N mRNA expression was detected in stomach and pyloric cecae,
while the expression of CCK-N in intestine showed low or no detectable levels (Figure 3.2.5).
The low expression in intestine is in agreement with semi-quantitative results presented by
Murashita et al. (2009). In contrast to Murashita et al. (2009), equal CCK-N levels were
detected in stomach and pyloric cecae in this current experiment. Murashita et al. (2009) did
not find expression of CCK-N in stomach, however the differences in assay specifications and
fish size could have influenced this result (as previously discussed for GRLN). Thus, the use
of more sensitive methodology in the present study seems to have enabled the detection of

Discussion
53
CCK-N in stomach. All together, this may indicate that stomach and pyloric cecae are the
main sites of CCK-N production in Atlantic salmon GI tract. Semi-quantitative studies in
rainbow trout show apparently no CCK-N in rainbow trout stomach in contrast to our results
(Jensen et al. 2001). CCK-N was mainly expressed in pyloric cecae in rainbow trout (Jensen
et al. 2001). In conclusion, the results suggest an important role for CCK-N in pyloric cecae
and possibly also in stomach of salmonids.
Studies in both rainbow trout and Atlantic salmon demonstrate different expression
patterns for CCK. While CCK-L shows expression throughout the gut in both species, CCK-
N is expressed mainly in pyloric cecae (and stomach in Atlantic salmon). The difference in
regional expression between CCK-L and CCK-N may indicate specific roles including
regulation of digestion and appetite. In addition, CCK-T which is found in trout was
expressed in high levels in middle regions of the small intestine (Jensen et al. 2001). This
could indicate the presence of additional CCK isoforms also in Atlantic salmon. In contrast to
rainbow trout, Atlantic salmon exhibit higher expression of CCK-L in pyloric cecae, and
CCK-N in stomach. Rainbow trout on the other hand expresses higher levels of CCK-L in
stomach compared to Atlantic salmon. These results indicate species differences in the
regional expression of CCK in salmonids.
In conclusion, the expression of CCK isoforms found in Atlantic salmon GI tract in
the current study, agrees with previous studies indicating roles for CCK in inhibition of
gastric emptying, inducing gallbladder contraction and stimulating pancreatic secretion
(Aldman and Holmgren 1995; Einarsson et al. 1997).
Altogether this point to a difference in mRNA expression of GRLN, CCK and PYY as
chyme is transported through the different GI tract compartments after feed ingestion.

Discussion
54
4.2 Temporal changes in GI tract filling of feed and chyme, and gallbladder
content in Atlantic salmon
In fed fish almost all ingested feeds was still present in the stomach 0.5 h after the
termination of the meal (=hours past feeding, hpf) (Figure 3.1.1; a). Thereafter there was a
rapid response in emptying of stomach content. These results demonstrate that the ingested
feed are kept in the stomach for gastric digestion, and then emptied to proximal intestine for
digestion and absorption by a gradual regulated mechanism. It is interesting to note that at 0.5
hpf when very little transfer apparently had taken place from stomach, the gallbladder was
already nearly empty (Figure 3.1.2; a). At this time point minimal content was present in
proximal intestine and pyloric cecae (Figure 3.1.1; a). Thus, the gallbladder appears to
contract and release bile when feed is present in the stomach prior to significant chyme entry
in the proximal intestine. These results may indicate feed-forward response of bile release in
response to feed present in the stomach. This feed-forward response is possibly mediated by
hormones in the stomach stimulated by luminal factors. In this current experiment all peptide
hormones were expressed in stomach. The role of GI tract peptide hormones in regulating
digestion will be discussed under section 4.3.
At 1.5 hpf, the stomach was still filled with feed and chyme, a time point characterized
by an empty gallbladder. The gallbladder volume did not seem to increase before 9 hpf, and
reached prefeeding levels only between 12-24 hpf. It is important to notice that the
relationship between gallbladder volume/mass and secretion rates is more complex than what
can be interpolated directly from the presently available data. The gallbladder weight (Figure
3.1.3; a) indicates that no bile is released into intestine from gallbladder from 1.5 hpf to 12
hpf, a period characterized by gastric evacuation. The emulsification of lipids in this period
may thus take place by; 1) residues of bile still present in the intestine, 2) bile originating
from other organs, or 3) re-circulation of bile absorbed in the distal intestine and transferred
by circulation to proximal intestine via liver and directly secreted through the Ductus
choleductus. It may be possible that a combination of these mechanisms exist in GI tract. The
presently available data suggest that the hormonal regulation of gallbladder contraction
mainly seems to occur within 1.5 hpf which represents the intestinal phase of digestion.
The gradual slower increase in luminal content in pyloric cecae, midgut and hindgut
compared to stomach (Figure 3.1.1; a), imply a gradual transit of feed into intestine which
most likely optimizes the capacity of intestine to digest and absorb nutrients. It is known that

Discussion
55
gastric emptying takes place when the resistance to the flow of chyme through the pyloric
sphincter and intestine is overcome (Olsson et al. 1999). A decrease in stomach content also
allows ingestion of more feed and return of appetite. The current data for Atlantic salmon
showed a concomitant increase in pyloric cecae content with decrease in stomach content,
indicating gastric evacuation and relaxation of the pyloric sphincter. Although absorption and
evacuation was not measured in this experiment, this may represent a loss of content observed
in the graphs. The more gradual pattern of chyme filling observed in pyloric cecae, midgut
and hindgut may thus include absorption. The pyloric cecae has been shown to absorb 50 %
or more of amino acids, lipids and starch in Atlantic salmon and is thus considered to be the
most important region for nutrient absorption (Krogdahl et al. 1999). However both proximal
and distal intestine have also been shown to be involved in absorption (Krogdahl et al. 1999).
Pyloric cecae serve to increase the absorptive area in fish and is surrounded by pancreatic
tissue in Atlantic salmon (Buddington and Diamond 1987; Buddington et al. 1997). Filling of
chyme into the cecae and mixing of chyme with pancreatic enzymes, have been suggested to
occur by retrograde peristalsis in teleosts (Rønnestad et al. 2000). Taken together the observed
increase of chyme in pyloric cecae at 0.5-9 hpf, together with reduction of overall content in
the GI tract indicates release of pancreatic enzymes and absorption of nutrients.
Studies on gut transit in rainbow trout using chromic oxide feed indicator
demonstrated that an increasing fraction of the meal were present and processed in pyloric
cecae and midgut from 3 hpf and it reached a maximum at 12 hpf (Sveier et al. 1999).
Differences in experimental conditions and estimation of GI content may have caused the
difference between the data of Sveier et al. (1999) and the present study. In our experiment,
weight measurements of GI tract content were used to estimate the compartmental distribution
and transfer of ingested food/chyme, while Sveier et al. (1999) used an indicator in the feed.
One major limitation in the present study is the low water content in dry feed and the
fluid balance that includes both swelling of the diets and release and absorption of fluids in
the GI tract. The mass balance should therefore be done with precaution. Further, in the
present experiment the content in pyloric cecae is not based on all the content in pyloric
appendages as content was very difficult to remove from these cecae. The contents in the
pyloric cecae were therefore probably underestimated (for more details, see Material and
methods section). The fish used in the current experiment was ~45 g, while Sveier et al.

Discussion
56
(1999) used ~695 g Atlantic salmon. The difference in fish size could also have caused a more
rapid increase in content in proximal intestine and midgut in the current study.
At the same time, the present data is a good indicator of GI tract compartment filling.
There is normally a combination of enteroendocrine cells and neuronal sensing (chemical and
stretch) of luminal content (nutrients and volume). The gut transit data in the present study
could therefore be expected to give a good indication as to the progress of the digestive
process, including the gastric and intestinal phases, and the interpretation of the spatial and
temporal mRNA expression of the peptide hormones during processing of a meal.
Altogether the increase in pyloric cecae content at 0.5-9 hpf followed by increased
content in midgut and hindgut (1.5-12 hpf), indicate an increased expression of peptide
hormones regulating pancreatic secretion, gallbladder contraction and gut motility. All
peptide hormones analyzed in this current study was expressed in pyloric cecae region,
suggesting a possible role of these in controlling gut secretion and motility. CCK-N was not
detected in midgut and hindgut, however it may have an endocrine intra-GI tract. This will be
discussed under section 4.3.
In the current experiment, all compartments were close to empty at 24 hpf, indicating
the endpoint of digestion and evacuation of non digestible feedstuff and waste. This time scale
is in agreement with Sveier et al. (1999). At this time the gallbladder weight is the same as
prefeeding levels, indicating minimal digestion and refilling of the gallbladder. If GRLN,
PYY or CCK are involved in regulating the digestive process, changes in expression could be
expected to occur within the first 12-18 hours, when chyme is still present in GI tract.
Gastric evacuation is thought to be a good predictor of the return of appetite (Grove et
al. 1978). In their study it was estimated that gastric evacuation of 80-90% of stomach content
corresponded to an increase in appetite in rainbow trout (Grove et al. 1978). In the current
experiment 80-90 % of stomach content was evacuated between 12-24 hpf. GRLN, CCK and
PYY have been shown to change in expression and plasma levels according to meal ingestion
(Peyon et al. 1999; Batterham and Bloom 2003; Unniappan et al. 2004). In conclusion,
potential anorexigenic peptide hormones (PYY, CCKs) are expected to increase within the
initial 12 or more hours, while potential orexigenic peptide hormones (GRLN) are expected to
increase when the stomach is close to empty (12-24 hpf) and increases appetite.

Discussion
57
4.3 Postprandial changes of GI tract peptide hormones
4.3.1 Postprandial regulation of digestion: GRLN-1 and GRLN-2
The distribution of GRLN throughout the GI tract of Atlantic salmon may suggest a
more direct effect on the digestive process other than stimulation of GH and appetite. Studies
have shown that GRLN stimulate gastric acid secretion in mammals (Masuda et al. 2000).
Previous studies have localized GRLN producing cells in gastric glands in rainbow trout,
Japanese eel and summer flounder indicating a possible role in the regulation of gastric
secretion (Sakata et al. 2004; Kaiya et al. 2006; Breves et al. 2009). It is however uncertain if
GRLN regulates gastric acid secretion in fish. Gastric acid production has however been
shown to be regulated by gastrin and histamine in the presence of luminal factors in fish
(Buddington and Krogdahl 2004). In this current study, no postprandial changes in GRLN
mRNA were detected during the first 12 hours of digestion including stomach (Figure 3.3.1
and 3.3.2; a-d). The increase observed at 24 hpf in midgut and hindgut is concurrent with an
empty gut (Figure 3.1.1, a). Together this may indicate an alternative mechanism of GRLN in
regulating the digestive process. What should also be noticed is that the objective of the
current study was to detect changes in mRNA expression. Thus possible effects of protein
regulation are not included, but may exert an important step in GRLN regulation and function.
Studies in mammals and birds show that GRLN have a motor effect in the gut (Peeters
2005; Kitazawa et al. 2007). GRLN is structurally related to motilin which has a role in
inducing the migrating motor complex (MMC) and accelerates gastric emptying in mammals
(Vantrappen et al. 1979; Peeters 2005). MMC are spontaneous contractions which occur
along certain patterns in the fasted state (Olsson and Holmgren 2001). Both the interstitial
cells of cajal (ICC), the enteric nervous system and hormones have been implicated in the
control of MMC (Olsson and Holmgren 2001). Studies in mammals recently suggested a role
for GRLN in inducing MMC (reviewed by Peeters (2005)). Recently, both GRLN and motilin
receptor genes were identified in the gut of zebrafish (Olsson et al. 2008). Although zebrafish
do not have a stomach, immunohistochemical analysis detected GRLN receptor and motilin
receptors throughout the gut of this species.
A contradictory aspect of this should however be mentioned as is discussed by Peeters
(2005). While plasma GRLN levels typically decreases rapidly after feeding as seen in
goldfish (Unniappan et al. 2004), there may not be high enough levels of GRLN in the blood

Discussion
58
to induce MMC which is a phenomena occurring between meals, or enough to induce gastric
emptying (Olsson and Holmgren 2001). The effect is thus suggested to be mediated via
paracrine actions of GRLN on vagal afferents, vagal efferents or the enteric nervous system
(Peeters 2005). Studies in zebrafish detected GRLN receptor in all muscle layers of the gut
(Olsson et al. 2008). It was also shown that both GRLN and motilin had excitatory effects on
gut motility in this species. These results may thus suggest a possibly role for GRLN in both
paracrine and endocrine excitation of gut muscle activity.
In conclusion, the structural resemblance of GRLN and motilin, and the presence of both
receptors in fish gut possibly indicate a role for GRLN in inducing MMC. The regional
increase in GRLN mRNA expression observed in midgut and hindgut of fed fish when
intestine is nearly empty (24 hpf) (Figure 3.1.1, a), and the effect of GRLN on fish gut
motility strengthens the theory of GRLN involvement in MMC in Atlantic salmon. MMC has
previously been described in trout and cod (Karila and Holmgren 1995; Olsson et al. 1999).
GRLN mRNA expression did not increase at any of the time points in stomach or pyloric
cecae region. Studies in zebrafish indicate a role for GRLN in motility throughout the GI tract
(Olsson et al. 2008). However it is not possible to conclude on the regional effects of GRLN
in Atlantic salmon. More studies should be conducted where the protein as well as the mRNA
levels of GRLN is analyzed. Also, species specific responses may exist.
4.3.2 Postprandial regulation of digestion: PYY
PYY have been shown to have an inhibitory effect on pancreatic enzyme secretion,
gallbladder release and intestinal motility in mammals (Batterham and Bloom 2003). In the
current study, there was an increase in PYY mRNA expression at 1.5 hpf and a decrease at 3
hpf in hindgut (Figure 3.3.3; d) which occurred concurrent to gastric emptying and transit of
chyme into intestine (Figure 3.1.1; a). These results may thus indicate a postprandial effect on
PYY mRNA expression in hindgut. The initial increase in PYY mRNA expression at 1.5 hpf
may suggest a possible role for PYY in regulating the digestive process. At 3 hpf and 24 hpf
PYY mRNA expression decreases, which may suggest the main postprandial effect on PYY
mRNA levels take place before 3 hpf. At 1.5 hpf minimal content is present in hindgut.
However, it is possible that initial transit of chyme during this period triggers a rapid and
transient response in mRNA expression. At 3 hpf chyme content in the hindgut increased,
however the transient response in mRNA expression appeared to be over. It is possible that

Discussion
59
processing and secretion of PYY peptides takes place although no changes in mRNA
expression were observed at 3 hpf. If so, this agrees with mammalian studies where chyme
directly stimulate PYY producing L cells (Adrian et al. 1985).
No postprandial changes in PYY mRNA expression were detected in stomach, pyloric
cecae or midgut in Atlantic salmon in the present study (Figure 3.3.3; a, b and c). These
results may however indicate an alternative mechanism of stimulating PYY mRNA
expression other than direct stimulation by chyme. Studies in rats suggest a vagal stimulation
of PYY producing L cells in the distal intestine by food in the proximal intestine (Fu-Cheng et
al. 1997). In this study PYY plasma levels increased with peak values at 60 min after feeding,
then decreased at 120 min. During this time food had not reached the PYY producing L cells.
In the current experiment, PYY expression exhibits a similar short term response pattern after
feeding. Thus, a vagal stimulation of PYY expression may be the case also in fish. However,
future studies are needed to determine region specific response of PYY in Atlantic salmon.
PYY mRNA expression may also be regulated by other GI tract peptide hormones.
Murashita et al. (2008) demonstrate that PYYb mRNA levels in yellowtail decrease after
feeding while CCK mRNA expression increases. This is opposite to mammals where CCK
has been shown to stimulate PYY release in the distal gut in response to lipids in the proximal
gut (Lin et al. 2000a). In the current study CCK-L and PYY show opposite responses in
mRNA expression when comparing CCK-L mRNA at 0.5 hpf and 24 hpf in midgut and 1.5
hpf in hindgut, with PYY mRNA in hindgut at the same time points (Figure 3.3.4; c, d and
Figure 3.3.3; d, respectively). This could indicate an inhibitory effect of CCK-L in midgut and
hindgut on PYY mRNA expression in hindgut.
The physiological effect of these results on digestion may be an initial stimulation of
CCK by food in midgut, shown by an increase in CCK-L expression concurrent with an
increase in stomach and midgut content. Increased secretion of CCK may then exert its effect
on pancreatic secretion, gallbladder contraction and increased intestinal motility. CCK may
thus inhibit PYY-inhibition of these effects in the initial phase of digestion, optimizing the
digestive process. In contrast to CCK-L, CCK-N mRNA expression increases in stomach at
1.5 hpf. The different expression patterns of CCK-L and CCK-N may suggest different
functions, also possibly in inhibition of PYY. It is possible that CCK and PYY are involved in
a regulatory feedback loop in Atlantic salmon, similar to yellowtail (Murashita et al. 2008).

Discussion
60
This feedback loop may possibly regulate the release of pancreatic secretion, gut motility and
gallbladder contraction in response to feeding.
4.3.3 Postprandial regulation of digestion: CCK-L and CCK-N
The effect of CCK on digestion in Atlantic salmon has previously been described by
Einarsson et al. (1997). In this study porcine CCK was IP injected and the release of
pancreatic enzymes was measured. It was shown that CCK caused a dose dependent release of
trypsin and chymotrypsin from the pancreas (Einarsson et al. 1997). In the present study
CCK-N mRNA expression in stomach increased at 1.5 hpf, and mRNA levels of CCK-L in
midgut increased at 0.5 hpf (Figure 3.3.5; a, and Figure 3.3.4; c, respectively). In this period,
high content of feed and chyme was present in the stomach, and was also starting to be
evacuated into pyloric region of intestine. The rapid increase in CCK-L levels, followed by
CCK-N suggests a postprandial role in regulation of digestion, possibly involving secretion of
pancreatic enzymes. Consequently, feed and chyme present in the GI tract may act in the
direct stimulation of I-cells. Previous studies in mammals suggest that proteins present in the
intestine serve as a substrate for proteases which normally degrades CCK-releasing factors
(Liddle 1997). These studies may suggest that a similar mechanism exist in fish, with proteins
in the feed indirectly stimulating CCK secretion.
Previous studies in Atlantic salmon show that CCK has a stimulatory effect on
gallbladder discharge (Einarsson et al. 1997). In the present study, the increased expression of
CCK-N in stomach and CCK-L in midgut correlated with a decrease in gallbladder content
(Figure 3.1.2; a). The increased CCK-L mRNA at 0.5 hpf in midgut, was concurrent with a
rapid reduction in gallbladder content, while CCK-N in stomach increased at 1.5 hpf when the
gallbladder was nearly empty. Thus, increased CCK-L mRNA expression and subsequent
CCK secretion from midgut could have induced release of bile in Atlantic salmon. There may
be differences in response time or function of different CCK isoforms in this species.
Consequently, CCK-L appears to show a more rapid response compared to CCK-N, and may
thus have a more rapid excitatory role on gallbladder discharge.
In addition to potential stimulation of pancreatic secretion and gallbladder contraction,
CCK may be involved in delaying gastric emptying. Studies in rainbow trout show that gastric
emptying involves a lag phase before evacuation of chyme (Olsson et al. 1999). It was further
demonstrated that IP injection of CCK-8 delayed gastric emptying, most likely by inhibiting

Discussion
61
gastric motility and contracting smooth muscle cells in the pyloric sphincter (Olsson et al.
1999). In this experiment, no direct measurements were performed on gut motility or gastric
evacuation of feed. Measurements of content of feed and chyme in fish sampled at different
time points after a meal does however give an indication of the anterograde movement of gut
content through the GI tract. Based on previous studies in fish, peptide hormones like CCK
are expected to have a role in regulating the motility required for digestion and transfer of
feed and chyme also in Atlantic salmon. The increase observed at 0.5 and 1.5 hpf in
expression of both CCKs correlates with high content of feed and chyme in stomach. It may
thus be possible that CCK-N and/or CCK-L is involved in delaying stomach evacuation.
It would be interesting to see the effect of IP injected Atlantic salmon CCK on motility
patterns in the stomach and intestine of Atlantic salmon. It would also be interesting to
identify how CCK mediates its effect in the GI tract. Olsson et al. (1999) suggest that CCK
mediate its inhibitory effect on motility via a vago-vagal non-cholinergic pathway, while the
excitatory effect of higher doses of CCK may be mediated via cholinergic pathways. Thus, it
is good reason to believe that CCK mediates its effect by a similar mechanism in Atlantic
salmon.
4.4 Regulation of appetite: postprandial variation in GRLN, CCK and PYY
mRNA expression
4.4.1 GRLN-1 and GRLN-2 in appetite regulation
GRLN has been shown to undergo periprandial variation and increases appetite in
both mammals and goldfish (Unniappan et al. 2004; Cummings 2006). In rainbow trout and
Mozambique tilapia the role of GRLN in regulating appetite is uncertain (Riley et al. 2005;
Jönsson et al. 2007; Shepherd et al. 2007; Fox et al. 2009). In this experiment, no short term
effect of feeding was observed for GRLN-1 and GRLN-2 in Atlantic salmon GI tract within
the first 6 hours after feeding (Figure 3.3.1, 3.3.2; a, b, c, d). However, higher expression of
GRLN-1 and GRLN-2 at 24 hours after feeding was found in midgut and hindgut (Figure
3.3.1, 3.3.2; c, d). During this time period the stomach is almost empty, suggesting a possible
return of appetite (Grove et al. 1978). The effect of increased GRLN at 24 hpf, could further
indicate a role for GRLN in meal initiation in Atlantic salmon as observed for mammals, as

Discussion
62
this time point is characterized by the normal scheduled feeding time (Cummings et al. 2001).
More studies should be conducted to establish the effect of GI tract derived GRLN in
initiating a meal in Atlantic salmon.
Studies in Mozambique tilapia did not detect periprandial variation in GRLN mRNA
expression in the stomach of this species (Fox et al. 2009). In this study, GRLN mRNA levels
were measured at 0.5, 2, 10 and 24 hpf in the stomach. No differences were found between
fed and unfed Mozambique tilapia in this study. However, Mozambique tilapia does not
express GRLN in intestine (Kaiya et al. 2003c). An increase in GRLN expression in Atlantic
salmon at 24 hpf in midgut and hindgut might thus be a species specific response due to
physiological differences in GRLN expression.
In contrast to what was observed in the present study, and for Mozambique tilapia,
instant postprandial responses of GRLN mRNA was observed in goldfish (Unniappan et al.
2004). In goldfish, GRLN undergoes periprandial variation in mRNA expression in the GI
tract (Unniappan et al. 2004). Goldfish GRLN mRNA expression decreased at 1- and 3 hpf,
suggesting an appetite stimulatory role for GRLN. It should be noticed that in contrast to
Atlantic salmon and Mozambique tilapia, goldfish do not have a stomach. The study by
Unniappan et al. (2004) measured the total GRLN mRNA expression in goldfish gut, lacking
region specific analysis of GRLN expression.
The previous discussion has focused on changes in GRLN mRNA expression.
However, several studies report periprandial variation in GRLN plasma levels. Plasma levels
of GRLN were not included in this experiment as the objective of this study was to detect
changes in mRNA expression of peptide hormones. In goldfish, both GRLN expression levels
and plasma levels decreased within 3 hours after feeding. However while unfed fish showed a
slight decrease in GRLN expression an increase in plasma levels was observed within the
same time scale. One possible explanation for this is that while expression studies of GRLN
in gut tissue only detect differences in expression within the gut tissue, plasma levels
represents GRLN produced by all tissues secreting GRLN into blood. The increase in plasma
GRLN at time 0 in unfed goldfish, which indicate the normal scheduled feeding time, could
thus suggest a role for GRLN in meal initiation.
However, Fox et al. (2009) reports no significant periprandial changes in plasma
GRLN levels in Mozambique tilapia, concurrent with no changes in GRLN mRNA

Discussion
63
expression. Also, no postprandial changes in plasma GRLN levels were observed for rainbow
trout (Jönsson et al. 2007). No mRNA levels of GRLN are available for rainbow trout in the
study of Jönsson et al. (2007). Although no short term effect was observed in GRLN mRNA
expression in Atlantic salmon, studies in tilapia and rainbow trout indicate no postprandial
change in GRLN plasma levels. However, since GRLN may exert its appetite effect through
direct activation of vagal afferents, the measurements of mRNA expression might have
indicated an effect not detected by assessment of GRLN plasma levels (Date et al. 2002). All
together, the lack of short term postprandial changes in GRLN mRNA expression in Atlantic
salmon indicates that GRLN may not be synthesized as mRNA by the GI tract to mediate
short term regulation of feeding.
In addition to a role in appetite, IP injections of GRLN have been shown to stimulate
the GH/IGF-1 axis in several fish species (Kaiya et al. 2003a; Unniappan and Peter 2004;
Kaiya et al. 2005; Fox et al. 2007). Stimulation of the somatotrophic axis is however mediated
through circulation. It is possible that GRLN has a similar role in Atlantic salmon, thus
linking short term meal signals to longer term energy balance. Measurements of plasma
GH/IGF-1 in rainbow trout, suggest no direct effect of GRLN on GH release (Jönsson et al.
2007). In this study GH levels were elevated in fasted fish, while plasma GRLN levels were
suppressed. The lack of effect of GRLN in stimulating GH release may thus be a salmonid
adaption.
4.4.2 CCK-L and CCK-N in appetite regulation
Postprandial increase in CCK-L mRNA expression was detected at 0.5 hpf (midgut),
while a decrease was observed at 1.5 hpf (hindgut), 3 hpf (stomach) and 24 hpf (midgut).
CCK-N mRNA expression was increased in stomach at 1.5 hpf. Altogether the results indicate
a short term postprandial effect of CCK-L and CCK-N in Atlantic salmon GI tract. CCK has
previously been shown to control appetite as a satiety signal in mammals (Gibbs et al. 1973;
Chandra and Liddle 2007). However, little research on the role of CCK in regulating appetite
in fish exists. Studies in goldfish and rainbow trout suggest a role for CCK in inhibiting
appetite in these species (Himick and Peter 1994; Gelineau and Boujard 2001). In goldfish,
CCK IR was detected in brain (including hypothalamic areas) and in anterior gut on nerve
fibers and endocrine cells (Himick and Peter 1994). IP injection of sulphated CCK-8 in

Discussion
64
goldfish decreased food intake in a dose dependent manner (Himick and Peter 1994).
Altogether these studies suggest a role for peripheral CCK in decreasing food intake.
It has previously been shown in rainbow trout that CCK is released in response to an
acidification of the proximal intestine and the presence of proteins and fats (Aldman and
Holmgren 1995). Thus, it is possible that secreted CCK mediates a satiety action in
salmonids.
In this current experiment, CCK-L showed higher expression in fed fish compared to
unfed fish in midgut at 0.5 h after feeding. Himick and Peter (1994) demonstrate an
immediately decrease in food intake when goldfish receive IP injection of CCK-8 30 min
after feeding. Although feed intake was not monitored in this current experiment, an increase
in CCK-L mRNA expression in Atlantic salmon midgut 30 min after feeding suggest a similar
satiety action in these species. A higher mRNA expression of CCK-L was also observed in
midgut at 24 hpf. At this time point, minimal chyme was present in this region. The potential
role for increased CCK-L in regulation appetite at this time point is thus uncertain. In contrary
to midgut, CCK-L exhibited no postprandial change in mRNA expression in Atlantic salmon
hindgut at 0.5 hpf, and decreased at 1.5 hpf. Although CCK-L was expressed in low levels in
stomach, a decreased mRNA expression was detected at 3 hpf. In conclusion, these results
require further studies.
Although CCK-N exhibits a different regional tissue distribution than CCK-N,
similarities exist in the postprandial regulation with respect to time. CCK-N mRNA levels
were higher at 0.5 hpf, but instead of midgut tissue, this elevated expression was found in
stomach tissue. Again this points to a region specific response for the different CCK isoforms.
The elevation in mRNA expression of both CCK isoforms shortly after feeding, suggest a role
for CCK as a satiety signal in Atlantic salmon. It is possible that CCK-N mediates a potential
satiety effect in stomach in response to stomach filling. In contrast, CCK-L may possibly
serve as an intestinal satiety signal, stimulated when food and chyme enters the midgut.
Although the stomach is filled with chyme at 0.5 hpf, the increase in CCK-N in stomach at
1.5 hpf may provide a lag phase prior to mediating a potential satiety effect. In all cases CCK
expression decreased at 3 hpf, indicating a rapid postprandial effect (within 1.5 hours) on
mRNA expression.

Discussion
65
In an experiment, rainbow trout were fed capsules containing CCK-1 receptor
antagonist (Gelineau and Boujard 2001). The study showed a significant increase in appetite
in fish provided CCK-1 receptor antagonist, indicating a role for CCK as a satiety signal
trough CCK-1 receptors in rainbow trout. The present study is to our knowledge the first
study that aims to describe the postprandial mRNA expression of CCK in GI tract of Atlantic
salmon. It is possible that CCK have a satiety effect in Atlantic salmon similar to goldfish and
rainbow trout. It is also unknown whether the distribution of CCK-1 receptors is similar for
Atlantic salmon and rainbow trout. However, the two salmonid species show differences in
regional CCK mRNA expression (as previously described). If the satiety effect of CCK is
mediated through CCK-1 receptors on vagal afferents in Atlantic salmon as described for
mammals, it may be activated by nearby CCK producing cells (Raybould 2007). It is thus
possible that a region specific activation of CCK receptors and satiety exists for Atlantic
salmon. As CCK mediates its satiety effect through CCK-1 receptors in mammals and trout,
knowledge on tissue distribution of this receptor in Atlantic salmon would be valuable in
describing the mechanism CCK mediates its action (Gelineau and Boujard 2001; Chandra and
Liddle 2007).
4.4.3 PYY in appetite regulation
The physiological role of PYY on appetite regulation is not known for fish. However,
the available information of PYY in regulating food intake is derived from mammalian
studies. In mammals, PYY is characterized as a satiety signal based on a preprandial decrease
and a postprandial increase in plasma concentration (Ueno et al. 2008). Both intravenous
infusion and chronic administration of PYY1-36 in mammals decrease food intake (Batterham
et al. 2003). In mammals plasma levels of PYY begin to rise within 15 min of the start of
eating, with peak values within 90 min (1.5 hpf), and high levels kept until 6 h after a meal
(Adrian et al. 1985).
A short term postprandial increase in PYY levels in mammalian hindgut 1.5 hpf is in
agreement with our results. This could indicate a role for PYY in mediating a satiety effect
from the hindgut of Atlantic salmon. The rapid response in PYY mRNA levels 1.5 hpf in
hindgut may possibly have provided an appetite regulating signal in the form of increased
PYY secretion. However, these results require future studies. The lack of postprandial effect
on PYY mRNA levels in stomach, pyloric cecae or midgut may indicate a region specific

Discussion
66
response to feeding within the GI tract. Although minimal chyme content were observed in
hindgut at 1.5 hpf, chyme present in proximal pyloric cecae region could have initiated a
neuronal signal which further stimulates PYY secreting cells in hindgut as seen in mammals
(Fu-Cheng et al. 1997). The decrease in PYY expression observed at 3 hpf in hindgut, could
however not be explained by this hypothesis as chyme is still present in proximal intestine at
this time point. Consequently, PYY may thus initiate a rapid response to feeding within 1.5
hpf in Atlantic salmon.
Although fish PYYb belongs to a different phylogenetic group than fish PYYa, they
both originate from a common PYY ancestor gene (Larhammar 1996; Murashita et al. 2009).
The similar tissue distribution pattern between Atlantic salmon PYYa and yellowtail PYYb
could imply similar physiological functions (Murashita et al. 2006; Murashita et al. 2009).
Murashita et al. (2006) found decreased PYYb expression in anterior intestine of yellowtail 3
hpf, compared to fish fasted for 72 h. No such differences were found in this current
experiment in anterior intestine of Atlantic salmon. This could indicate a species specific
response to feeding by PYY. At time 3 h in this current experiment, unfed fish was fasted for
27 h, and maximum hours of fasting was 48 hours. Thus, differences in the experimental
conditions could have affected the difference in results. In the yellowtail experiment only 3
hpf-fish were sampled, lacking a postprandial time scale. However, the lower expression of
PYYb in fed yellowtail indicates an opposite effect in response to feeding compared to
mammals (Murashita et al. 2006).
In conclusion, very limited knowledge exists on the effect of nutrient intake on PYY
expression in fish. It is possible that PYY signals a satiety signal via Y2 receptors to
hypothalamic brain centres involved in appetite regulation as is the case in mammals
(Batterham et al. 2002). Recently NPY-receptors were identified in rainbow trout (Larsson et
al. 2006). This study showed that Y7 receptors were more abundant in the intestine than Y2
receptors which were most abundant in gills. PYYa and PYYb bound to both receptors,
indicating that PYY produced in GI tract signals through Y7 receptor. This also strengthens
the theory of similar functions of PYYa and PYYb. No information exists on the effect of
this binding. It is possible that Atlantic salmon PYY binds to nearby intestinal Y7 receptors in
a paracrines manner if these receptors exist in this species. It is also possible that PYY
produced in the intestine is transferred by the blood and binds to Y2 receptors on gills or
distant targets including brain areas involved in feeding regulation.

Discussion
67
4.5 Circadian variation in GRLN-1, GRLN-2, PYY, CCK-L and CCK-N
Food availability and meals can act as a powerful zeitgeber capable of synchronizing
many biological rhythms in fish (SanchezVazquez et al. 1997). Goldfish synchronized to
feeding at a particular schedule, overcame variations in light cycles and altered their activity
pattern according to meals (SanchezVazquez et al. 1997). GRLN has been shown to change in
a diurnal pattern in mammals, with levels rising throughout the day to a zenith at 01.00, then
falling overnight to 09.00 (Cummings et al. 2001). In this experiment fish were fed once a day
at the same time of day in two weeks prior to sampling. This period should have acclimated
the fish to the feeding regime. Unfed fish were subsequently fasted for 24 hours prior to
sampling. Results from the assessment of GI tract compartment filling and gallbladder content
in unfed control group, show an empty GI tract (Figure 3.1.2; b) and gallbladder with overall
high content (Figure 3.1.3; b) throughout the experimental period. Minimal effects of feed
should thus have influenced the expression of the analyzed genes. The results from this
current study showed no statistical effect of time alone on mRNA copy numbers of peptide
hormones in unfed fish. Consequently, these results indicate minimal effect of diurnal
rhythms on mRNA expression patterns of GI tract peptide hormones in Atlantic salmon.
Although not statistical significant, the expression of GRLN-1, GRLN-2, PYY, CCK-L and
CCK-N in unfed fish shows minor variations in expression over time. In pyloric cecae, CCK-
L expression increases from time 0 h (fish fasted for 24 hours) to 0.5 h. Thus, CCK-L may be
an exception compared to the other genes. It is also possible that a circadian rhythm apart
from a 24 h-profile exist in fish. However, in order to detect potential diurnal expression
patterns, or alternative circadian profiles of GI tract derived peptide hormones, further studies
are needed. In conclusion, no clear effect of diurnal rhythm on mRNA expression levels of GI
tract peptide hormones was detected in Atlantic salmon.

Concluding remarks and future perspective
68
5. Concluding remarks and future perspective
5.1 Concluding remarks
5.1.1 Spatial distribution of peptide hormones in Atlantic salmon GI tract
GRLN-1 and GRLN-2 expression was found throughout the GI tract in Atlantic
salmon. Both isoforms exhibited the same spatial distribution. The highest GRLN expression
was found in stomach, as seen in previous studies in vertebrates. Moderate expression was
detected in pyloric cecae and midgut, and lowest expression was found in hindgut. PYY was
expressed in all segments of the GI tract. The highest PYY expression was found in pyloric
cecae and midgut, moderate expression in hindgut and lowest expression in stomach. CCK-L
and CCK-N exhibits different tissue expression patterns, suggesting different functions in
Atlantic salmon (see Figure 5.1). CCK-L exhibited highest mRNA levels in hindgut, with
slightly lower expression in pyloric cecae and midgut. The lowest CCK-L expression was
detected in stomach. CCK-N is mainly expressed in the stomach and pyloric cecae region,
while only low expression levels were detected in midgut and hindgut. The spatial expression
patterns of peptide hormones suggest involvement in regulation of digestive process and
appetite.
5.1.2 Gastric filling and evacuation, GI tract transit of feed and chyme, and
gallbladder release in Atlantic salmon
The stomach of Atlantic salmon was filled with feed and chyme at 0.5 hpf, shortly
followed by gastric evacuation mainly between 0.5-12 hpf. At 24 hpf the stomach was empty.
Pyloric cecae, midgut and hindgut show more gradual changes in content, indicating a
regulated emptying of stomach content, and absorption of nutrients, however not assayed. At
24 hpf all GI tract compartments are empty, indicating the end point of digestion. The
immediate release of gallbladder content within 0.5-1.5 hpf, suggest a rapid excitation of
gallbladder contraction possibly induced by chyme in the proximal intestine or feed in the
stomach. In conclusion these results indicate that the digestive process in Atlantic salmon is
highly regulated by synchronizing events such as; gastric evacuation, GI tract peristalsis,
digestive secretion, absorption and evacuation of non-digestible feed. GI tract peptide
hormones are expected to be involved in this regulation.

Concluding remarks and future perspective
69
5.1.3 Postprandial changes in mRNA expression of GI tract peptides and the possible
involvement in regulating the digestive process and appetite in Atlantic salmon
Both CCK-L and CCK-N mRNA levels increased within 1.5 hpf in midgut and
stomach, respectively, concurrent with an increase in feed and chyme in stomach and a
decrease in gallbladder weight. This supports a possible role for CCK in regulating gastric
evacuation, pancreas secretion and gallbladder contraction in Atlantic salmon (Figure 5.1). In
addition, it is also possible that an increase in CCK mRNA expression in response to feeding
is to mediate a satiety signal from the gut to the brain (Figure 5.1). PYY mRNA expression
increases in 1.5 hpf, then decreases at 3 hpf. In this period chyme is evacuated into the pyloric
region and is also present in midgut and hindgut, while the gallbladder is empty. These results
support a role for PYY in regulating the digestive process, possibly involving GI tract motility
and digestive secretion. In addition, PYY may also regulate appetite in Atlantic salmon
(Figure 5.1). GRLN mRNA expression is not increased before 24 hpf, a time point
characterized with minimal content of feed and chyme in the GI tract. Thus, GRLN may not
have a short term postprandial effect on digestion, but may have a between-meal effect related
to regulation of GI tract motility and a role in meal initiation (Figure 5.1). The mRNA
expression results of CCK and PYY may further suggest that these peptide hormones are
involved in a regulatory feedback loop where CCK possibly inhibits PYY. Consequently,
CCK and PYY may have antagonistic effects on gallbladder contraction, pancreatic secretion
and possibly GI tract motility in Atlantic salmon.
5.1.4 Diurnal influences and possible suggestions of species specific effects on
mRNA expression of GI tract peptide hormones in Atlantic salmon
No clear diurnal rhythms were observed in mRNA expression of GRLN, PYY or CCK
in unfed Atlantic salmon. However alternative circadian rhythms may still exist which may
have a potential effect on GRLN, PYY and CCK mRNA levels or peptide levels. If this is the
case, GRLN, PYY and CCK may be involved in long term energy homeostasis in Atlantic
salmon.
Several differences in results were detected between this current experiment and
mammals, and also between other fish species. Goldfish has been used as an extensive model
organism when studying the effect of appetite regulating hormones. This species is in contrast
to Atlantic salmon an omnivorous temperate freshwater fish that usually lives under relatively

Concluding remarks and future perspective
70
constant environmental conditions (Volkoff et al. 2009). Atlantic salmon is a carnivorous
euryhaline aquaculture species adapted to seasonal changes in temperature and light
conditions. As fish are a highly diverse group of ectothermic species, the surrounding
environment will influence the different species in a higher degree than mammals. Thus the
difference in habitats, feeding habits and response to feeding suggest a species specific
endocrine regulation of digestion and appetite in Atlantic salmon.
Figure 5.1. Suggested scheme of central and peripheral effects of gastrointestinal (GI) peptide
hormones in Atlantic salmon based on their mRNA expression levels during processing of a
single meal. See next page for legend (page 71).

Concluding remarks and future perspective
71
Figure 5.1. Suggested scheme of central and peripheral effects of gastrointestinal (GI) peptide
hormones in Atlantic salmon based on their mRNA expression levels during processing of a
single meal. The GI tract is represented by four compartments including; stomach, pyloric region,
midgut and hindgut with pancreas and gallbladder. The area between the stomach and pyloric region
illustrates the pyloric sphincter and thus the control of gastric emptying. The origin site of the arrows
represents a significant increase in mRNA expression of the representative peptide hormone in this
compartment in the present experiment. The end of the arrow represents a suggested effect
(stimulatory/inhibitory) of this peptide hormone on possible locations. Arrows arising and ending at
the same target indicate local paracrines effects. The central effect of each peptide hormone is listed
on top of the figure, while peripheral effects are listed on the bottom of the figure. Arrows pointing
upwards next to a description indicates a possible stimulatory effect on this description, while arrows
pointing downwards indicate a possible inhibitory effect. The dotted colored lines represent less
supported effects. Colored lines crossing the dotted line running across the figure indicates indicate
GI tract peptide hormones mediating a central effect on brain areas through vagal afferents or
through the blood. The effect of GRLN (GRLN)- 1 and -2 are shown as one color coding (red) as no
differences in mRNA expression were detected between the isoforms. MMC; migrating motor complex,
GB; gallbladder, Secr.; Secretion, Contr.; Contraction.
5.2 Future perspective
The current study is the first extensive description of the postprandial changes in
mRNA expression of GRLN, PYY and CCK in Atlantic salmon. The results of these changes
was then related to gastric evacuation, gut transit of feed and chyme and regulation of
gallbladder contraction hence bile release. The data also indicate some of the roles served by
these peptide hormones in the regulation and optimization of digestion and appetite in
Atlantic salmon. However, in order to achieve a clearer understanding of the roles of GI tract
peptide hormones in Atlantic salmon, future research should aim to assess protein levels as
well as plasma concentrations, in addition to gene expression analysis of GI tract peptide
hormones. This will enable to assess both their endocrine and paracrines roles. In addition
experiments should be conducted to obtain information concerning the local effect of different
peptides in the GI tract and both in vivo and in vitro studies could be included. Both GRLN,
PYY and CCK have been described as brain-gut peptides. In the brain, the gut derived signals
are involved in multiple redundant pathways regulating feed intake in order to maintain
energy homeostasis (Volkoff et al. 2009). The distribution of GHS-R, CCK-R and NPY

Concluding remarks and future perspective
72
receptors should be assessed to increase the knowledge of the regional effect of GRLN, PYY
and CCK within Atlantic salmon GI tract, and in additional tissues including brain areas.
It would also be valuable to study the effect of both IP injected and centrally injected
GRLN, PYY and CCK on appetite and digestion. In this case the use of recombinant peptides
provides a valuable tool, not only in preparation of injections, but also by adding recombinant
peptides into osmotic pumps. Insertion of osmotic pumps into Atlantic salmon can then be
used to study the longer term (week-month) effects of peptide hormones on appetite and
energy homeostasis, and potential alternative functions in this species.
The pathways GRLN, CCK and PYY are involved in when mediating a signal should
also be studied to increase the knowledge of the roles of each peptide hormone. It has
previously been shown that GRLN mediate its appetite stimulatory action via the orexigenic
NPY in the goldfish brain (Miura et al. 2006). Further, CCK has been shown to mediate the
effect of leptin in goldfish (Volkoff et al. 2003a). In goldfish leptin potentiates the satiety
effect of CCK, and a blocking of CCK receptors attenuate leptin inhibition of NPY induced
feeding (Volkoff et al. 2003a). PYY have been shown to inhibit NPY induced feeding in
mammals, but limited information of PYY exist for fish (Vincent and le Roux 2008).
Several of the gut derived peptide hormones have been shown to respond differently
according to meal composition and total calorie content. It should thus be of uttermost interest
to the aquaculture industry to study the effect of feed with different compositions of proteins,
lipids and carbohydrates on the digestive process and appetite in Atlantic salmon. An
increased knowledge of the dynamic process of digestion and its complex regulation is needed
in order to produce fish feeds with alternative ingredients that still maintain appetite and an
efficient digestion in Atlantic salmon.

Methodological considerations
73
6. Methodological considerations
6.1 Gene expression
Q-PCR is considered to be the method of choice for detecting low abundance mRNA
due to its high sensitivity (Bustin 2000). It is a highly sensitive method which may
compromise the specificity of the reaction and detect false positives, as it does not distinguish
between illegitimate transcripts and low abundance transcripts (Kwok and Higuchi 1989)
.Several critical areas must be taken into consideration before analyzing the transcriptome
such as; standardization of q-PCR protocols, assay design, reagents, template preparation and
analytical methods (Freeman et al. 1999). In addition to operator variability; template quality,
reverse transcription (RT) reaction and data analysis are all technical aspects which could bias
the data interpretation (Bustin and Nolan 2004). The areas which will be discussed in this part
include; sample acquisition, RNA isolation, DNase treatment, cDNA synthesis and qPCR.
RNA quality and the reverse transcription reaction will be especially emphasized, as
downstream results demands optimality of these factors.
6.1.1 Sample acquisition and storage
The first step towards qPCR is acquisition of biological material. The integrity and
quality of RNA are the most critical determinants for reliable downstream qPCR results
(Bustin and Nolan 2004). As RNA is unstable, the initial tissue preservation should be
executed in a carefully manner. In this study, gut tissue were sampled quickly on dry ice after
the removal of gut content. Samples wrapped in aluminum foil were then fresh frozen in
liquid nitrogen. The frozen samples were kept at -80° C for storage. Prior to RNA isolation,
samples were at all times kept on dry ice when not in -80° C freezer to avoid thawing.
6.1.2 Assessment of RNA quantity, quality and integrity
Prior to RNA isolation, tissue samples were weighed within a standardized range of
40-45 mg ± 5 %. 10 % of the samples had equal to or below 36 mg as total weight, for these
samples all of the tissue was used. To estimate total RNA quantity and to ensure pure RNA
samples, all samples were analyzed using NanoDrop ND-1000 spectrophotometer (Thermo
Scientific), measuring sample absorbance. The A260/A280 gives an estimate of the RNA to
protein ratio. As proteins and phenol absorb strongly around 280 nm, an impure sample will

Methodological considerations
74
have a lower A260/A280 value. A value of ~2.0 is accepted as pure for RNA, though this
value may be influenced by pH and ionic strength in solvent (Wilfinger et al. 1997). All RNA
was dissolved in Nuclease-Free Water (Ambion) and found to have A260/A280 value > 2.0
(results not shown). An overestimation of total RNA concentration may occur if DNA is
present in the sample. This is caused by the absorbance of DNA at 260 nm (Imbeaud et al.
2005). All samples were DNase treated prior to cDNA synthesis to ensure RNA of high
quality and correct quantity to be submitted to cDNA synthesis.
A secondary qualitative measure of A260/A230 was included for all samples. Both
carbohydrates and phenol absorb at wavelength 230 nm, A260/A230 ratio should thus be
above ~2.0-2.2 in order to classify a sample as pure (ThermoScientific 2009).All samples
showed A260/A230 ratio above 2.2.
Although the results from the A260/A280 and A260/A230 ratios indicate a good
quality sample in terms of pure RNA, these values do not give an estimate of RNA quality in
terms of integrity; hence “RNA intactness”. The RIN value obtained from Agilent 2100
Bioanalyzer (Agilent Technologies) was thus used a superior RNA quality estimate.
When handling RNA, RNases and long term storage under sub-optimal conditions can
impair RNA integrity (Schoor et al. 2003). Thus, every RNA preparation should be tested for
RNA integrity (Bustin and Nolan 2004). The RIN based Agilent method uses “state of the art
technology”, and is the most objective way of assessing RNA integrity (Bustin and Nolan
2004). Agilent 2100 uses microfluidic capillary electrophoresis technology, and in
combination with a size standard, RNA bands can be estimated and contaminants ignored
(Imbeaud et al. 2005). A RIN value of 1 corresponds to a completely degraded sample and a
value of 10 indicates a fully intact sample (Mueller et al. 2000). Degraded RNA can affect
later Ct values in q-PCR (Raeymaekers 1993; Imbeaud et al. 2005). It is also shown that RIN
values and Ct values possess a negative relationship, where typically degraded RNA with low
RIN value show higher Ct values (lower expression), (Fleige et al. 2006; Schroeder et al.
2006). A more fragmented sample demands a higher number of cycles to obtain cycle
threshold. Fleige et al. (2006) suggest that all RIN values > 8 can be considered as optimal
templates; RIN values 8 > 5 can result in sub optimal qPCR results, and degraded mRNA
with RIN < 5 can interfere with PCR performance.

Methodological considerations
75
RIN values were obtained on all samples. 57 % of the samples showed partially
degradation with total sample RIN average of 7.8 (±0.99 SD) (Appendix III, Figure AIII.2).
There appeared to be a tissue/segment variation in RIN value, with stomach tissue having the
most intact RNA with average RIN values of 8.9 (±0.68 SD). Tissue from pyloric cecae
showed average RIN value of 7.0 (±0.53 SD). The midgut and hindgut both showed large
variations within the group with average RIN values of 7.6 (±0.88 SD) and 7.5 (±0.76 SD),
respectively (see Appendix III, Figure A.III.2). Consequently all samples were analyzed by
linear regression plotting Ct values against RIN.
Table 3.4 lists the r2 and p values of the linear regression, with p<0.05 considered
significant correlation. The coefficient of determination r2, is used as a measure of the straight
line relationship with r2=1, showing full explanation of the y value (Ct) by the regression line
(Zar 1996). All genes analyzed in segment 4 (pyloric cecae) show significant p values at α =
0.05, although the r2 show larger variation within the values for the different genes (Table
3.4). For a graphical presentation of the linear regression for all genes, see Appendix III,
Figure A.III.3-10. The pyloric cecae are intervened with pancreatic tissue in Atlantic salmon
which produces several enzymes including RNase. What can also be seen in Table 3.2 is that
r2 for PYY in pyloric cecae is higher compared with the other genes with 30.9% of variation
in ct values explained by the regression line (p<0.05) followed by EF1α (r2=0.290, p<0.05).
An r2 value of 0.309 should still be considered as a low value, indicating that the regression
line explain the correlation between Ct and RIN for ~31% of the samples. These results are in
contrast to the study executed by Fleige et al. (2006), where average r2
> 0.812. In contrast to
pyloric cecae, the stomach, midgut and hindgut each show significant values only for a few
genes. No single gene show significant values for all tissues (Table 3.2). Consequently, the
effect of assay is thought to have minor influence of Ct/RIN correlation. In conclusion, the
results indicate a tissue specific effect on RIN, which is in accordance with Fleige et al.
(2006). Furthermore, results from linear regression of Ct and RIN in the current study do not
show an obvious relationship of low quality RNA and high Ct values, with the possible
exception of pyloric cecae. The use of sub optimal RNA in q-PCR does not appear to affect
Ct results in a critical manner.
On the basis of these findings, an experiment was set out to obtain the optimal
sampling strategy for ensuring high quality RNA. In this experiment several GI tract sampling
strategies were tested in both fed and unfed fish; 1) GI tract content were removed and tissue

Methodological considerations
76
cut on dry ice, 2) GI tract content were removed on bench top (room temperature) and the
tissue cut on dry ice, and 3) the GI tract were immediately transferred to RNA later®
(Ambion, USA) where the content was removed and the GI tract cut into segments. The
second sampling strategy is identical to the sampling strategy applied in the present study.
The results from this experiment should hopefully indicate which sampling strategy gives the
highest RNA quality, and will clarify whether the current sampling strategy is optimal when
sampling GI tissue (Valen et al., in prep).
6.1.3 Removal of genomical DNA
In this study all samples were DNase treated, thus minimal traces of DNA should be
present in sample prior to reverse transcription. The effect of this step is somewhat
questionable as oligo-DT primers used in cDNA synthesis poly(A)+-selects mRNA. However,
DNase treatment may have a negative effect on RNA integrity, hence RIN value (personal
communication, Ann-Elise O. Jordal).
6.1.4 Reverse transcription: Synthesis of cDNA
The reverse transcription reaction was separated from the qPCR reaction and
consequently the RNA- and DNA-dependent polymerases were added to different tubes. Also,
leftover cDNA could be kept for long term storage. The conversion of RNA into single
stranded cDNA is not a well understood step, and is considered to be the most uncertain step
in gene expression analysis (Stahlberg et al. 2004). Sources of variation are; biological
inherent variation in RNA, variable quality of RNA and hence stability, RNA template
abundance, background nucleic acids, secondary and tertiary structure of mRNA, priming
approaches and properties of the reverse transcriptase enzyme itself.
In the current study, SuperScript™ III First-Strand Synthesis System for RT-PCR was
used. The SuperScript III Reverse Transcriptase enzyme is a version of M-MLV RT which
has less RNAse H activity, and is the better choice if full length cDNA are to be amplified
(Bustin 2000). Oligo(dT), which poly(A)+-selects RNA, was used as primer in the cDNA
synthesis. Oligo(dT) primers have the ability to maximize the number of mRNA molecules
that can be analysed from a small sample of RNA (Bustin 2000). It is more specific than
random priming, but as it requires full length RNA (with intact poly(A) tail), it can be less
efficient when it comes to transcribing fragmented RNA (Bustin et al. 2005), especially

Methodological considerations
77
mRNA which is not intact in the 3‟ end (Kubista et al. 2006). As samples showed variable
RIN values, different efficiencies in the RT step may be the case. However, as concluded
earlier the use of sub optimal RNA in q-PCR does not appear to affect the Ct results in a
critical manner.
In order to minimize sample to sample variation, samples were run in duplicate
reactions taken from the same DNase treated RNA pool. According to Stahlberg et al. (2004),
both inhibition that affect reaction efficiencies, and efficiency deviation that cause variation in
copy number are eliminated by running multiple reactions in cDNA synthesis and averaging
the measurement results. Stahlberg et al. (2004) show that by splitting the samples before
reverse transcription a two times higher accuracy in sampling error occur, than by splitting the
samples in the qPCR step.
A minus reverse transcriptase (-RT) control was included in each PCR run to check
for genomic DNA contamination in the RNA sample. No signal was observed in the –RT,
indicating minimal SYBR green background binding due to gDNA. To avoid variation caused
by different stocks of reagents, reagents were pooled and then aliquoted to minimize stock-to-
stock variations as far as possible.
6.1.5 Q-PCR
For the qPCR reaction, SYBR green I based Power SYBR® Green PCR Master Mix
was used (Applied Biosystems). SYBR green I is a DNA binding dye, which binds in the
minor groove of double-stranded DNA in a sequence independent way and the fluorescence
increases over 100-fold when bound (Deprez et al. 2002). Melting curve analysis was
performed to detect unwanted products (primer-dimers) that may occur because SYBR green
I bind non-specifically to double-stranded DNA. By slowly increasing the temperature above
Tm (melting temperature) of the amplicon, the fluorescence signal changes. Plotting
fluorescence as a function of temperature can distinguish the characteristic peak of the
product from artifacts that typically melt at lower temperatures (Bustin 2000). No primer-
dimers were detected for any of the assays. The threshold cycle fluorescence level was set
manually to 0.010, above background noise and within the exponential phase for all qPCR
runs. As all cDNA samples were diluted the effect of potentially PCR inhibitory substances is
reduced (Kubista et al. 2006). A non template control (NTC) and a between plate control
(BPC), were included to detect contamination in mastermix and water, and to detect variations

Methodological considerations
78
between plates, respectively. No signal was observed in NTC control. The standard deviation
of BPC for each gene was as follows; EF1α: 0.21, GRLN-1: 0.35, GRLN-2: 0.56, PYY: 0.49,
CCK-L: 0.52 and CCK-N: 0.54.
The eukaryotic elongation factor 1α (EF1α) was included in the qPCR reaction as an
endogenous control to compensate for intra- and inter-kinetic qPCR variations (Pfaffl 2004).
Since the GI tract exists of several segments extracted from different individuals, normalizing
the data against a constantly expressed reference gene may adjust for some of these
differences. EF1α have been tested as a candidate reference gene in Atlantic salmon and
shown to be a suitable choice (Olsvik et al. 2005).
6.1.6 Quantification
In this study absolute quantification was used. This quantification strategy relates
qPCR signal (Ct value) to input copy number using an external calibration curve (Pfaffl
2004). Although this method produces highly specific, sensitive and reproducible data (Bustin
2000), the accuracy of absolute quantification in qPCR depends entirely on the accuracy of
the standards (Pfaffl 2004). External calibration curves can be generated from recombinant
RNA (recRNA) and recombinant DNA (recDNA) (Pfaffl and Hageleit 2001). Pfaffl et al.
(2001) suggest that using recDNA calibration provides a better model than recRNA in
quantifying mRNA, in terms of quantitative range, sensitivity, reproducibility and stability.
The standards used for all assays were produced from recDNA by Dr. Koji Murashita
(Murashita et al. 2009).
RecDNA does not undergo reverse transcription like the mRNA samples, thus
variability of the qPCR results and amplification results may lead to difficulties when
comparing results from the tested sample (Pfaffl 2004). CDNA efficiency was monitored as a
function of input total RNA and linear regression performed (Appendix III, Figure A.III.1).
This is important as the recDNA calibration curve model only measures the cDNA out of RT
reaction, and this may not reflect the mRNA molecules in the native sample. The linear
regression, r2 value was 0.935, indicating a linear relationship between Ct and input RNA, but
with a certain deviation from of a perfectly linear relationship (approaching r2 = 1). This
deviation could be caused by cDNA synthesis efficiency below 100 %, or inaccurate
pipetting. In the current study, samples were run in parallels in cDNA synthesis which is
thought to minimize the effect of suboptimal efficiency in RT reaction (Stahlberg et al. 2004).

Methodological considerations
79
6.2 Randomization
All tissue samples were randomized across all segments when isolating RNA and
during DNase treatment and cDNA synthesis. When running RNA integrity analysis, samples
were randomized according to http://randomization.com. In q-PCR, samples were run
chronologically according to sample id. On the q-PCR plate, each sample was loaded into the
same well location for the various assays, thus minimizing the effect of well variation on
individual samples. Pipetting was done by one operator, thus minimizing operator variability.
6.3 Statistical methods
In the present study, parametric tests were chosen over nonparametric tests. The
parametric tests make more assumptions than the nonparametric tests, but may give a more
accurate and precise estimate, with the nonparametric tests requiring a larger sample size to
achieve the same power (Walpole 2002). The underlying assumptions of parametric tests
include random sampling from a normal distributed population, and equal variance between
groups (Zar 1996).
All samples were randomly sampled in this study as far as possible and for each level
of analysis and sampling. When it comes to testing for normality, the Shapiro-wilks W test
was chosen due to its good power (Zar 1996). The test has been shown to be robust even for
small sample sizes with n < 20 (Shapiro and Wilk 1965). Since some groups mean deviated
from normality, the data were log transformed. After this only a few groups failed the
normality assumption (see Appendix III).
In order to detect differences between means of unfed and fed fish groups at a given
time point, a t test was used giving the two-tailed hypothesis:
H0: µ1 ־ µ2 = 0 an HA: µ1 ־ µ2 ≠ 0. This parametric test is extremely robust despite non-
normality and heterogeneity of variance (Zar 1996).
The assumption that samples come from a normally distributed population and show
homogeneity of variance is true also for analysis of variance (ANOVA). Especially if n is
equal for all groups (Zar 1996), as is the case for this study. The weaker non-parametric tests
show lack in the robustness of normality and variance assumptions. For these reasons,
ANOVA was the preferred choice.

Methodological considerations
80
When three or more samples are included in a group, the hypothesis that the samples
came from a population with identical variances can be tested (Zar 1996). Due to its
robustness against non-normality, Levene´s F-test was used to test for equality in variance
(Zar 1996).
In the current study statistical tests were at times run on mRNA expression data for
three fish, which is a minimum number of individuals required for statistical analysis in
several statistical tests. However, originally six fish were sampled at each time point of the
experiment. The reason for the reduction in fish number was due to fish in fed fish group
which had not eaten and had large gallbladders (and vice versa for unfed fish control), and
consequently would have biased the results. In addition the aspects of running costs
associated with q-PCR and time available during this thesis limits the number of fish in each
time group.

References
81
7. References
Adrian, T. E., G. L. Ferri, A. J. Bacaresehamilton, H. S. Fuessl, J. M. Polak and S. R. Bloom (1985). "Human distribution and release of a putative new gut hormone, peptide-YY." Gastroenterology 89(5): 1070-1077.
Adrian, T. E., G. R. Sagor, A. P. Savage, A. J. Bacaresehamilton, G. M. Hall and S. R. Bloom (1986). "Peptide YY kinetics and effects on blood-pressure and circulating pancreatic and gastrointestinal hormones and metabolites in man." Journal of Clinical Endocrinology and Metabolism 63(4): 803-807.
Aldman, G. and S. Holmgren (1995). "Intraduodenal Fat and Amino Acids Activate Gallbladder Motility in the Rainbow Trout, Oncorhynchus mykiss." General and Comparative Endocrinology 100(1): 27-32.
Amole, N. and S. Unniappan (2009). "Fasting induces preproghrelin mRNA expression in the brain and gut of zebrafish, Danio rerio." General and Comparative Endocrinology 161(1): 133-137.
AppliedBiosystems. (2003). "Creating standard curves with genomic DNA or plasmid DNA templates for use in quantitative PCR." from http://www.appliedbiosystems.com/support/tutorials/pdf/quant_pcr.pdf.
Ariyasu, H., K. Takaya, T. Tagami, Y. Ogawa, K. Hosoda, T. Akamizu, M. Suda, T. Koh, K. Natsui, S. Toyooka, G. Shirakami, T. Usui, A. Shimatsu, K. Doi, H. Hosoda, M. Kojima, K. Kangawa and K. Nakao (2001). "Stomach is a major source of circulating ghrelin, and feeding state determines plasma ghrelin-like immunoreactivity levels in humans." Journal of Clinical Endocrinology and Metabolism 86(10): 4753-4758.
Arvat, E., L. Di Vito, F. Broglio, M. Papotti, G. Muccioli, C. Dieguez, F. F. Casanueva, R. Deghenghi, F. Camanni and E. Ghigo (2000). "Preliminary evidence that Ghrelin, the natural GH secretagogue (GHS)-receptor ligand, strongly stimulates GH secretion in humans." Journal of Endocrinological Investigation 23(8): 493-495.
Baeverfjord, G. and A. Krogdahl (1996). "Development and regression of soybean meal induced enteritis in Atlantic salmon, Salmo salar L, distal intestine: A comparison with the intestines of fasted fish." Journal of Fish Diseases 19(5): 375-387.
Bahuaud, D., T. K. Østbye, B. E. Torstensen, M. B. Rørå, R. Ofstad, E. Veiseth, M. S. Thomassen and B. Ruyter (2009). "Atlantic salmon (Salmo salar) muscle structure integrity and lysosomal cathepsins B and L influenced by dietary n-6 and n-3 fatty acids." Food Chemistry 114(4): 1421-1432.
Bail, P.-Y. L. and G. Ruf (1997). "What hormones may regulate food intake in fish?" Aquat. Living Resour. 10(6): 371-379.
Batterham, R. L. and S. R. Bloom (2003). The gut hormone peptide YY regulates appetite. Melanocortin systems. R. D. Cone, New York Acad Sciences. 994: 162-168.
Batterham, R. L., M. A. Cohen, S. M. Ellis, C. W. Le Roux, D. J. Withers, G. S. Frost, M. A. Ghatei and S. R. Bloom (2003). "Inhibition of food intake in obese subjects by peptide YY3-36." New England Journal of Medicine 349(10): 941-948.
Batterham, R. L., M. A. Cowley, C. J. Small, H. Herzog, M. A. Cohen, C. L. Dakin, A. M. Wren, A. E. Brynes, M. J. Low, M. A. Ghatei, R. D. Cone and S. R. Bloom (2002). "Gut hormone PYY3-36 physiologically inhibits food intake." Nature 418(6898): 650-654.
Batterham, R. L., H. Heffron, S. Kapoor, J. E. Chivers, K. Chandarana, H. Herzog, C. W. Le Roux, E. L. Thomas, J. D. Bell and D. J. Withers (2006). "Critical role for peptide YY in protein-mediated satiation and body-weight regulation." Cell Metabolism 4(3): 223-233.
Bednarek, M. A., S. D. Feighner, S. S. Pong, K. K. McKee, D. L. Hreniuk, M. V. Silva, V. A. Warren, A. D. Howard, L. H. Y. Van der Ploeg and J. V. Heck (2000). "Structure-function studies on the new growth hormone-releasing peptide, ghrelin: Minimal sequence of ghrelin necessary for

References
82
activation of growth hormone secretagogue receptor 1a." Journal of Medicinal Chemistry 43(23): 4370-4376.
Bell, J. G., J. McEvoy, D. R. Tocher, F. McGhee, P. J. Campbell and J. R. Sargent (2001). "Replacement of fish oil with rapeseed oil in diets of Atlantic salmon (Salmo salar) affects tissue lipid compositions and hepatocyte fatty acid metabolism." Journal of Nutrition 131(5): 1535-1543.
Bermúdez, R., F. Vigliano, M. I. Quiroga, J. M. Nieto, G. Bosi and C. Domeneghini (2007). "Immunohistochemical study on the neuroendocrine system of the digestive tract of turbot, Scophthalmus maximus (L.), infected by Enteromyxum scophthalmi (Myxozoa)." Fish & Shellfish Immunology 22(3): 252-263.
Bosi, G., A. P. Shinn, L. Giari, E. Simoni, F. Pironi and B. S. Dezfuli (2005). "Changes in the neuromodulators of the diffuse endocrine system of the alimentary canal of farmed rainbow trout, Oncorhynchus mykiss (Walbaum), naturally infected with Eubothrium crassum (Cestoda)." Journal of Fish Diseases 28(12): 703-711.
Bottcher, G., E. Ekblad, R. Ekman, R. Hakanson and F. Sundler (1993). "Peptide-YY - A neuropeptide in the gut - immunocytochemical and immunocytochemical evidence." Neuroscience 55(1): 281-290.
Breves, J. P., P. A. Veillette and J. L. Specker (2009). "Ghrelin in the summer flounder: Immunolocalization to the gastric glands and action on plasma cortisol levels." Comparative Biochemistry and Physiology - Part A: Molecular & Integrative Physiology 152(2): 268-272.
Buchan, A. M. J., J. M. Polak, E. Solcia, C. Capella, D. Hudson and A. G. E. Pearse (1978). "Electron immunohistochemical evidence for human intestinal I cells as source of CCK." Gut 19(5): 403-407.
Buddington, R. K. and J. M. Diamond (1987). "Pyloric ceca of fish: a "new" absorptive organ." American Journal of Physiology and Gastrointestinal Liver Physiology 252(1): G65-76.
Buddington, R. K. and A. Krogdahl (2004). "Hormonal regulation of the fish gastrointestinal tract." Comparative biochemistry and physiology a-molecular & integrative physiology 139(3): 261-271.
Buddington, R. K., A. Krogdahl and A. M. BakkeMcKellep (1997). "The intestines of carnivorous fish: structure and functions and the relations with diet." Acta physiologica scandinavica 161(638): 67-80.
Bustin, S. A. (2000). "Absolute quantification of mRNA using real-time reverse transcription polymerase chain reaction assays." Journal of Molecular Endocrinology 25(2): 169-193.
Bustin, S. A., V. Benes, T. Nolan and M. W. Pfaffl (2005). "Quantitative real-time RT-PCR--a perspective." J Mol Endocrinol 34(3): 597-601.
Bustin, S. A. and T. Nolan (2004). "Pitfalls of quantitative real-time reverse-transcription polymerase chain reaction." J Biomol Tech 15(3): 155-166.
Cerda-Reverter, J. M. and D. Larhammar (2000). "Neuropeptide Y family of peptides: Structure, anatomical expression, function, and molecular evolution." Biochemistry and cell biology 78(3): 371-392.
Cerda-Reverter, J. M., G. Martinez-Rodriguez, I. Anglade, O. Kah and S. Zanuy (2000). "Peptide YY (PYY) and fish pancreatic peptide Y (PY) expression in the brain of the sea bass (Dicentrarchus labrax) as revealed by in situ hybridization." Journal of Comparative Neurology 426(2): 197-208.
Chan, C. B. and C. H. K. Cheng (2004). "Identification and functional characterization of two alternatively spliced growth hormone secretagogue receptor transcripts from the pituitary of black seabream Acanthopagrus schlegeli." Molecular and Cellular Endocrinology 214(1-2): 81-95.
Chandra, R. and R. A. Liddle (2007). "Cholecystokinin." Current Opinion in Endocrinology, Diabetes and Obesity 14(1): 63-67.

References
83
Chaudhri, O., C. Small and S. Bloom (2006). "Gastrointestinal hormones regulating appetite." Philosophical Transactions of the Royal Society B-Biological Sciences 361(1471): 1187-1209.
Chomczynski, P. (1993). "A reagent for the single-step simultaneous isolation of RNA, DNA and proteins from cell and tissue samples." Biotechniques 15(3): 532-534, 536-537.
Clements, K. D. and D. Raubenheimer (2006). The Physiology of fishes. Marine biology series. D. H. Evans and J. B. Claiborne. Boca Raton, Fla., CRC/Taylor & Francis: 47-74.
Cummings, D. E. (2006). "Ghrelin and the short- and long-term regulation of appetite and body weight." Physiology & Behavior 89(1): 71-84.
Cummings, D. E., J. Q. Purnell, R. S. Frayo, K. Schmidova, B. E. Wisse and D. S. Weigle (2001). "A preprandial rise in plasma ghrelin levels suggests a role in meal initiation in humans." Diabetes 50(8): 1714-1719.
Date, Y., M. Kojima, H. Hosoda, A. Sawaguchi, M. S. Mondal, T. Suganuma, S. Matsukura, K. Kangawa and M. Nakazato (2000). "Ghrelin, a novel growth hormone-releasing acylated peptide, is synthesized in a distinct endocrine cell type in the gastrointestinal tracts of rats and humans." Endocrinology 141(11): 4255-4261.
Date, Y., N. Murakami, K. Toshinai, S. Matsukura, A. Niijima, H. Matsuo, K. Kangawa and M. Nakazato (2002). "The role of the gastric afferent vagal nerve in ghrelin-induced feeding and growth hormone secretion in rats." Gastroenterology 123(4): 1120-1128.
Deprez, R. H. L., A. C. Fijnvandraat, J. M. Ruijter and A. F. M. Moorman (2002). "Sensitivity and accuracy of quantitative real-time polymerase chain reaction using SYBR green I depends on cDNA synthesis conditions." Analytical Biochemistry 307(1): 63-69.
Einarsson, S., P. S. Davies and C. Talbot (1997). "Effect of exogenous cholecystokinin on the discharge of the gallbladder and the secretion of trypsin and chymotrypsin from the pancreas of the Atlantic salmon, Salmo salar L." Comparative Biochemistry and Physiology C-Toxicology & Pharmacology 117(1): 63-67.
Espe, M., A. Lemme, A. Petri and A. El-Mowafi (2006). "Can Atlantic salmon (Salmo salar) grow on diets devoid of fish meal?" Aquaculture 255(1-4): 255-262.
FAO. (2007). "Cultured aquatic species information programme, Salmo salar: Statistics." from http://www.fao.org/fishery/culturedspecies/Salmo_salar/en#tcN900D6.
Feldman, M. and C. T. Richardson (1986). "Role of thought, sight, smell, and taste of food in the cephalic phase of gastric-acid secretion in humans." Gastroenterology 90(2): 428-433.
Fleige, S., V. Walf, S. Huch, C. Prgomet, J. Sehm and M. W. Pfaffl (2006). "Comparison of relative mRNA quantification models and the impact of RNA integrity in quantitative real-time RT-PCR." Biotechnology Letters 28(19): 1601-1613.
Fox, B. K., J. P. Breves, T. Hirano and E. G. Grau (2009). "Effects of short- and long-term fasting on plasma and stomach ghrelin, and the growth hormone/insulin-like growth factor I axis in the tilapia, Oreochromis mossambicus." Domestic Animal Endocrinology 37(1): 1-11.
Fox, B. K., L. G. Riley, C. Dorough, H. Kaiya, T. Hirano and E. G. Grau (2007). "Effects of homologous ghrelins on the growth hormone/insulin-like growth factor-I axis in the Tilapia, Oreochromis mossambicus." Zoological Science 24(4): 391-400.
Francis, G., H. P. S. Makkar and K. Becker (2001). "Antinutritional factors present in plant-derived alternate fish feed ingredients and their effects in fish." Aquaculture 199(3-4): 197-227.
Freeman, W. M., S. J. Walker and K. E. Vrana (1999). "Quantitative RT-PCR: Pitfalls and potential." Biotechniques 26(1): 112-+.
Fu-Cheng, X., Y. Anini, J. Chariot, N. Castex, J.-P. Galmiche and C. Rozé (1997). "Mechanisms of peptide YY release induced by an intraduodenal meal in rats: neural regulation by proximal gut." Pflügers Archiv European Journal of Physiology 433(5): 571-579.
Gelineau, A. and T. Boujard (2001). "Oral administration of cholecystokinin receptor antagonists increase feed intake in rainbow trout." Journal of Fish Biology 58(3): 716-724.

References
84
Gibbs, J., R. C. Young and G. P. Smith (1973). "Cholecystokinin decreases food intake in rats." Journal of Comparative and Physiological Psychology 84(3): 488-495.
Gnanapavan, S., B. Kola, S. A. Bustin, D. G. Morris, P. McGee, P. Fairclough, S. Bhattacharya, R. Carpenter, A. B. Grossman and M. Korbonits (2002). "The tissue distribution of the mRNA of ghrelin and subtypes of its receptor, GHS-R, in humans." Journal of Clinical Endocrinology and Metabolism 87(6): 2988-2991.
Grandt, D., M. Schimiczek, C. Beglinger, P. Layer, H. Goebell, V. E. Eysselein and J. R. Reeve (1994). "2 Molecular forms of Peptide YY (PYY) are abundant in human blood - characterization of a radioimmunoassay recognizing PYY-1-36 and PYY-3-36." Regulatory Peptides 51(2): 151-159.
Grove, D. J., L. G. Loizides and J. Nott (1978). "Satiation amount, frequency of feeding and gastric emptying rate in Salmo gairdneri." Journal of Fish Biology 12(5): 507-516.
Guo, Y. S., M. Fujimura, F. Lluis, Y. Tsong, G. H. Greeley, Jr and J. C. Thompson (1987). "Inhibitory action of peptide YY on gastric acid secretion." Am J Physiol Gastrointest Liver Physiol 253(3): 298-302.
Hemre, G.-I., K. Sandnes, Ø. Lie, O. Torrissen and R. Waagbø (1995). "Carbohydrate nutrition in Atlantic salmon, Salmo salar L.: growth and feed utilization." Aquaculture Research 26(3): 149-154.
Himick, B. A. and R. E. Peter (1994). "CCK/Gastrin-like immunoreactivity in brain and gut, and CCK suppression of feeding in goldfish." American Journal of Physiology 267(3): 841-851.
Hoentjen, F., W. P. M. Hopman and J. Jansen (2001). "Effect of circulating peptide YY on gallbladder emptying in humans." Scandinavian Journal of Gastroenterology 36(10): 1086-1091.
Holst, J. J., J. Fahrenkrug, F. Stadil and J. F. Rehfeld (1996). "Gastrointestinal endocrinology." Scandinavian Journal of Gastroenterology 31: 27-38.
Hosoda, H., M. Kojima, H. Matsuo and K. Kangawa (2000). "Ghrelin and des-acyl ghrelin: Two major forms of rat ghrelin peptide in gastrointestinal tissue." Biochemical and Biophysical Research Communications 279(3): 909-913.
Imbeaud, S., E. Graudens, V. Boulanger, X. Barlet, P. Zaborski, E. Eveno, O. Mueller, A. Schroeder and C. Auffray (2005). "Towards standardization of RNA quality assessment using user-independent classifiers of microcapillary electrophoresis traces." Nucleic Acids Research 33(6): e56 (51-12).
Ivy, A. C. and E. Oldberg (1928). "A hormone mechanism for gallbladder contraction and evacuation." Am J Physiol 86(3): 599-613.
Jensen, H., I. J. Rourke, M. Moller, L. Jonson and A. H. Johnsen (2001). "Identification and distribution of CCK-related peptides and mRNAs in the rainbow trout, Oncorhynchus mykiss." Biochimica Et Biophysica Acta-Gene Structure and Expression 1517(2): 190-201.
Johnsen, A. H. (1998). "Phylogeny of the Cholecystokinin/Gastrin Family." Frontiers in Neuroendocrinology 19(2): 73-99.
Jonsson, A. C., S. Holmgren and B. Holstein (1987). "Gastrin/CCK-like immunoreactivity in endocrine cells and nerves in the gastrointestinal tract of the cod, Gadus morhua, and the effect of peptides of the gastrin/CCK family on cod gastrointestinal smooth muscle." General Comparative Endocrinology 66(2): 190-202.
Jönsson, E., A. Forsman, I. E. Einarsdottir, H. Kaiya, K. Ruohonen and B. T. Björnsson (2007). "Plasma ghrelin levels in rainbow trout in response to fasting, feeding and food composition, and effects of ghrelin on voluntary food intake." Comparative Biochemistry and Physiology - Part A: Molecular & Integrative Physiology 147(4): 1116-1124.
Kaiya, H., M. Kojima, H. Hosoda, S. Moriyama, A. Takahashi, H. Kawauchi and K. Kangawa (2003a). "Peptide purification, complementary deoxyribonucleic acid (DNA) and genomic DNA cloning, and functional characterization of ghrelin in rainbow trout." Endocrinology 144(12): 5215-5226.

References
85
Kaiya, H., M. Kojima, H. Hosoda, L. G. Riley, T. Hirano, E. G. Grau and K. Kangawa (2003b). "Amidated fish ghrelin: purification, cDNA cloning in the Japanese eel and its biological activity." Journal of Endocrinology 176(3): 415-423.
Kaiya, H., M. Kojima, H. Hosoda, L. G. Riley, T. Hirano, E. G. Grau and K. Kangawa (2003c). "Identification of tilapia ghrelin and its effects on growth hormone and prolactin release in the tilapia, Oreochromis mossambicus." Comparative Biochemistry and Physiology B-Biochemistry & Molecular Biology 135(3): 421-429.
Kaiya, H., M. Miyazato, K. Kangawa, R. E. Peter and S. Unniappan (2008). "Ghrelin: A multifunctional hormone in non-mammalian vertebrates." Comparative Biochemistry and Physiology - Part A: Molecular & Integrative Physiology 149(2): 109-128.
Kaiya, H., T. Mori, M. Miyazato and K. Kangawa (2009). "Ghrelin receptor (GHS-R)-like receptor and its genomic organisation in rainbow trout, Oncorhynchus mykiss." Comparative Biochemistry and Physiology a-Molecular & Integrative Physiology 153(4): 438-450.
Kaiya, H., B. C. Small, A. L. Bilodeau, B. S. Shepherd, M. Kojima, H. Hosoda and K. Kangawa (2005). "Purification, cDNA cloning, and characterization of ghrelin in channel catfish, Ictalurus punctatus." General and Comparative Endocrinology 143(3): 201-210.
Kaiya, H., T. Tsukada, S. Yuge, H. Mondo, K. Kangawa and Y. Takei (2006). "Identification of eel ghrelin in plasma and stomach by radioimmunoassay and histochemistry." General and Comparative Endocrinology 148(3): 375-382.
Kamisaka, Y., O. Drivenes, T. Kurokawa, M. Tagawa, I. Ronnestad, M. Tanaka and J. V. Helvik (2005). "Cholecystokinin mRNA in Atlantic herring, Clupea harengus - molecular cloning, characterization, and distribution in the digestive tract during the early life stages." Peptides 26(3): 385-393.
Karila, P. and S. Holmgren (1995). "Enteric reflexes and nitric oxide in the fish intestine." Journal of Experimental Biology 198(11): 2405-2412.
Katschinski, M. (2000). "Nutritional implications of cephalic phase gastrointestinal responses." Appetite 34(2): 189-196.
Kawakoshi, A., H. Kaiya, L. G. Riley, T. Hirano, E. G. Grau, M. Miyazato, H. Hosoda and K. Kangawa (2007). "Identification of a ghrelin-like peptide in two species of shark, Sphyrna lewini and Carcharhinus melanopterus." General and Comparative Endocrinology 151(3): 259-268.
Kitazawa, T., H. Kaiya and T. Taneike (2007). "Contractile effects of ghrelin-related peptides on the chicken gastrointestinal tract in vitro." Peptides 28(3): 617-624.
Koda, S., Y. Date, N. Murakami, T. Shimbara, T. Hanada, K. Toshinai, A. Niijima, M. Furuya, N. Inomata, K. Osuye and M. Nakazato (2005). "The role of the vagal nerve in peripheral PYY3-36-induced feeding reduction in rats." Endocrinology 146(5): 2369-2375.
Kojima, M., H. Hosoda, Y. Date, M. Nakazato, H. Matsuo and K. Kangawa (1999). "Ghrelin is a growth-hormone-releasing acylated peptide from stomach." Nature 402(6762): 656-660.
Kojima, M., H. Hosoda, H. Matsuo and K. Kangawa (2001). "Ghrelin: discovery of the natural endogenous ligand for the growth hormone secretagogue receptor." Trends in Endocrinology and Metabolism 12(3): 118-122.
Kojima, M. and K. Kangawa (2002). "Ghrelin, an orexigenic signaling molecule from the gastrointestinal tract." Current Opinion in Pharmacology 2(6): 665-668.
Korbonits, M., S. A. Bustin, M. Kojima, S. Jordan, E. F. Adams, D. G. Lowe, K. Kangawa and A. B. Grossman (2001). "The expression of the growth hormone secretagogue receptor ligand ghrelin in normal and abnormal human pituitary and other neuroendocrine tumors." Journal of Clinical Endocrinology and Metabolism 86(2): 881-887.
Kozaka, T., Y. Fujii and M. Ando (2003). "Central effects of various ligands on drinking behavior in eels acclimated to seawater." Journal of Experimental Biology 206(4): 687-692.
Krogdahl, A., G. I. Hemre and T. P. Mommsen (2005). "Carbohydrates in fish nutrition: digestion and absorption in postlarval stages." Aquaculture Nutrition 11(2): 103-122.

References
86
Krogdahl, Å. (2001). Fordøyelsessystemet hos kaldtvannsfisk - Oppbygging og funksjon. Fiskeernæring. R. Waagbø, M. Espe, K. Hamre and Ø. Lie. Bergen, Kystnæringen forl. & bokklubb: 11-35.
Krogdahl, Å., A. M. Bakke-McKellep and G. Baeverfjord (2003). "Effects of graded levels of standard soybean meal on intestinal structure, mucosal enzyme activities, and pancreatic response in Atlantic salmon (Salmo salar L.)." Aquaculture Nutrition 9(6): 361-371.
Krogdahl, Å., S. Nordrum, M. Sørensen, L. Brudeseth and C. Røsjø (1999). "Effects of diet composition on apparent nutrient absorption along the intestinal tract and of subsequent fasting on mucosal disaccharidase activities and plasma nutrient concentration in Atlantic salmon, Salmo salar L." Aquaculture Nutrition 5(2): 121-133.
Kubista, M., J. M. Andrade, M. Bengtsson, A. Forootan, J. Jonak, K. Lind, R. Sindelka, R. Sjoback, B. Sjogreen, L. Strombom, A. Stahlberg and N. Zoric (2006). "The real-time polymerase chain reaction." Mol Aspects Med 27(2-3): 95-125.
Kurokawa, T. and T. Suzuki (2002). "Development of neuropeptide Y-related peptides in the digestive organs during the larval stage of Japanese flounder, Paralichthys olivaceus." General and Comparative Endocrinology 126(1): 30-38.
Kurokawa, T., T. Suzuki and H. Hashimoto (2003). "Identification of gastrin and multiple cholecystokinin genes in teleost." Peptides 24(2): 227-235.
Kwok, S. and R. Higuchi (1989). "Avoiding false positives with PCR." Nature 339(6221): 237-238. Larhammar, D. (1996). "Evolution of neuropeptide Y, peptide YY and pancreatic polypeptide."
Regulatory Peptides 62(1): 1-11. Larhammar, D., C. Soderberg, A. G. Blomqvist, I. Lundell and L. Brodin (1995). "Evolution of the
neuropeptide Y-peptide YY family." Netherlands Journal of Zoology 45(1-2): 15-17. Larsson, T. A., E. T. Larson, R. Fredriksson, J. M. Conlon and D. Larhammar (2006). "Characterization
of NPY receptor subtypes Y2 and Y7 in rainbow trout Oncorhynchus mykiss." Peptides 27(6): 1320-1327.
Liddle, R. A. (1997). "Cholecystokinin cells." Annual Review of Physiology 59: 221-242. Lin, H. C., W. Y. Chey and X. T. Zhao (2000a). "Release of distal gut peptide YY (PYY) by fat in proximal
gut depends on CCK." Peptides 21(10): 1561-1563. Lin, X. W., H. Volkoff, Y. Narnaware, N. J. Bernier, P. Peyon and R. E. Peter (2000b). "Brain regulation
of feeding behavior and food intake in fish." Comparative Biochemistry and Physiology a-Molecular & Integrative Physiology 126(4): 415-434.
Lluis, F., G. Gomez, M. Fujimura, G. H. Greeley and J. C. Thompson (1987). "Peptide-YY inhibits nutrient-stimulated, hormonal-stimulated, and vagally-stimulated pancreatic exocrine secretion." Pancreas 2(4): 454-462.
Lu, S., J. L. Guan, Q. P. Wang, K. Uehara, S. Yamada, N. Goto, Y. Date, M. Nakazato, M. Kojima, K. Kangawa and S. Shioda (2002). "Immunocytochemical observation of ghrelin-containing neurons in the rat arcuate nucleus." Neuroscience Letters 321(3): 157-160.
Lundberg, J. M., K. Tatemoto, L. Terenius, P. M. Hellstrom, V. Mutt, T. Hokfelt and B. Hamberger (1982). "Localization of peptide-YY (PYY) in gastrointestinal endocrine-cells and effects on intestinal blood-flow and motility." Proceedings of the National Academy of Sciences of the United States of America-Biological Sciences 79(14): 4471-4475.
Luyer, M. D., J. W. M. Greve, M. h. Hadfoune, J. A. Jacobs, C. H. Dejong and W. A. Buurman (2005). "Nutritional stimulation of cholecystokinin receptors inhibits inflammation via the vagus nerve." J. Exp. Med. 202(8): 1023-1029.
Masuda, Y., T. Tanaka, N. Inomata, N. Ohnuma, S. Tanaka, Z. Itoh, H. Hosoda, M. Kojima and K. Kangawa (2000). "Ghrelin stimulates gastric acid secretion and motility in rats." Biochemical and Biophysical Research Communications 276(3): 905-908.

References
87
Matsuda, K., T. Miura, H. Kaiya, K. Maruyama, S. I. Himakura, M. Uchiyama, K. Kangawa and S. Shioda (2006a). "Regulation of food intake by acyl and des-acyl ghrelins in the goldfish." Peptides 27(9): 2321-2325.
Matsuda, K., T. Miura, H. Kaiya, K. Maruyama, M. Uchiyama, K. Kangawa and S. Shioda (2006b). "Stimulatory effect of n-octanoylated ghrelin on locomotor activity in the goldfish, Carassius auratus." Peptides 27(6): 1335-1340.
McCormick, S. D., J. M. Shrimpton, J. B. Carey, M. F. O'Dea, K. E. Sloan, S. Moriyama and B. T. Bjornsson (1998). "Repeated acute stress reduces growth rate of Atlantic salmon parr and alters plasma levels of growth hormone, insulin-like growth factor I and cortisol." Aquaculture 168(1-4): 221-235.
Mentlein, R., P. Dahms, D. Grandt and R. Kruger (1993). "Proteolytic processing of neuropeptide-Y and peptide-YY by dipeptidyl peptidase-IV." Regulatory Peptides 49(2): 133-144.
Miura, T., K. Maruyama, S. I. Shimakura, H. Kaiya, M. Uchiyama, K. Kangawa, S. Shioda and K. Matsuda (2006). "Neuropeptide Y mediates ghrelin-induced feeding in the goldfish, Carassius auratus." Neuroscience Letters 407(3): 279-283.
Mondal, M. S., Y. Date, H. Yamaguchi, K. Toshinai, T. Tsuruta, K. Kangawa and M. Nakazato (2005). "Identification of ghrelin and its receptor in neurons of the rat arcuate nucleus." Regulatory Peptides 126(1-2): 55-59.
Moran, T. H. and K. P. Kinzig (2004). "Gastrointestinal satiety signals - II. Cholecystokinin." American Journal of Physiology-Gastrointestinal and Liver Physiology 286(2): 183-188.
Murashita, K., H. Fukada, H. Hosokawa and T. Masumoto (2006). "Cholecystokinin and peptide Y in yellowtail (Seriola quinqueradiata): Molecular cloning, real-time quantitative RT-PCR, and response to feeding and fasting." General and Comparative Endocrinology 145(3): 287-297.
Murashita, K., H. Fukada, I. Rønnestad, T. Kurokawa and T. Masumoto (2008). "Nutrient control of release of pancreatic enzymes in yellowtail (Seriola quinqueradiata): Involvement of CCK and PY in the regulatory loop." Comparative Biochemistry and Physiology - Part A: Molecular & Integrative Physiology 150(4): 438-443.
Murashita, K., T. Kurokawa, T. O. Nilsen and I. Rønnestad (2009). "Ghrelin, cholecystokinin, and peptide YY in Atlantic salmon (Salmo salar): Molecular cloning and tissue expression." General and Comparative Endocrinology 160(3): 223-235.
Mustonen, A. M., P. Nieminen and H. Hyvarinen (2002). "Leptin, ghrelin, and energy metabolism of the spawning burbot (Lota lota)." Journal of Experimental Zoology 293(2): 119-126.
Nakazato, M., N. Murakami, Y. Date, M. Kojima, H. Matsuo, K. Kangawa and S. Matsukura (2001). "A role for ghrelin in the central regulation of feeding." Nature 409(6817): 194-198.
Narnaware, Y. K. and R. E. Peter (2001). "Effects of food deprivation and refeeding on neuropeptide Y (NPY) mRNA levels in goldfish." Comparative Biochemistry and Physiology - B: Biochemistry and molecular biology 129(2-3): 633-637.
Naylor, R. L., R. W. Hardy, D. P. Bureau, A. Chiu, M. Elliott, A. P. Farrell, I. Forster, D. M. Gatlin, R. J. Goldburg, K. Hua and P. D. Nichols (2009). "Feeding aquaculture in an era of finite resources." Proceedings of the National Academy of Sciences of the United States of America 106(36): 15103-15110.
Nordrum, S., A. M. Bakke-McKellep, Å. Krogdahl and R. K. Buddington (2000). "Effects of soybean meal and salinity on intestinal transport of nutrients in Atlantic salmon (Salmo salar) and rainbow trout (Oncorhynchus mykiss)." Comparative Biochemistry and Physiology Part B: Biochemistry and Molecular Biology 125(3): 317-335.
Olli, J. J., K. Hjelmeland and A. Krogdahl (1994). "Soybean trypsin-inhibitors in diets for Atlantic salmon (Salmo salar) - effects on nutrient digestibility and trypsin in pyloric ceca homogenate and intestinal content." Comparative Biochemistry and Physiology a-Physiology 109(4): 923-928.

References
88
Olsson, C., G. Aldman, A. Larsson and S. Holmgren (1999). "Cholecystokinin affects gastric emptying and stomach motility in the rainbow trout Oncorhynchus mykiss." Journal of Experimental Biology 202(2): 161-170.
Olsson, C., J. D. Holbrook, G. Bompadre, E. Jonsson, C. H. V. Hoyle, G. J. Sanger, S. Hohngren and P. L. R. Andrews (2008). "Identification of genes for the ghrelin and motilin receptors and a novel related gene in fish, and stimulation of intestinal motility in zebrafish (Danio rerio) by ghrelin and motilin." General and Comparative Endocrinology 155(1): 217-226.
Olsson, C. and S. Holmgren (2001). "The control of gut motility." Comparative Biochemistry and Physiology - Part A: Molecular & Integrative Physiology 128(3): 479-501.
Olsvik, P. A., K. K. Lie, A. E. Jordal, T. O. Nilsen and I. Hordvik (2005). "Evaluation of potential reference genes in real-time RT-PCR studies of Atlantic salmon." BMC Mol Biol 6: 21.
Pankhurst, N. W., S. L. Ludke, H. R. King and R. E. Peter (2008). "The relationship between acute stress, food intake, endocrine status and life history stage in juvenile farmed Atlantic salmon, Salmo salar." Aquaculture 275(1-4): 311-318.
Parhar, I. S., H. Sato and Y. Sakuma (2003). "Ghrelin gene in cichlid fish is modulated by sex and development." Biochemical and Biophysical Research Communications 305(1): 169-175.
Peeters, T. L. (2005). "Ghrelin: A new player in the control of gastrointestinal functions." Gut 54(11): 1638-1649.
Peyon, P., X. W. Lin, B. A. Himick and R. E. Peter (1998). "Molecular cloning and expression of cDNA encoding brain preprocholecystokinin in goldfish." Peptides 19(2): 199-210.
Peyon, P., H. Saied, X. Lin and R. E. Peter (1999). "Postprandial, seasonal and sexual variations in cholecystokinin gene expression in goldfish brain." Molecular Brain Research 74(1-2): 190-196.
Pfaffl, M. W. (2004). Quantification strategies in real-time PCR. A-Z of quantitative PCR. S. Bustin. La Jolla, Ca, USA, International University Line (IUL): 87-112.
Pfaffl, M. W. and M. Hageleit (2001). "Validities of mRNA quantification using recombinant RNA and recombinant DNA external calibration curves in real-time RT-PCR." Biotechnology Letters 23(4): 275-282.
Raeymaekers, L. (1993). "Quantitative PCR: theoretical considerations with practical implications." Anal Biochem 214(2): 582-585.
Ran, X. Q., W. S. Li and H. R. Lin (2004). "Rat ghrelin stimulates GH release and GH mRNA expression in the pituitary of orange-spotted grouper, Epinephelus coioides." Fish Physiology and Biochemistry 30(2): 95-102.
Raybould, H. E. (2007). "Mechanisms of CCK signaling from gut to brain." Current Opinion in Pharmacology 7(6): 570-574.
Riley, L. G., B. K. Fox, H. Kaiya, T. Hirano and E. G. Grau (2005). "Long-term treatment of ghrelin stimulates feeding, fat deposition, and alters the GH/IGF-I axis in the tilapia, Oreochromis mossambicus." General and Comparative Endocrinology 142(1-2): 234-240.
Rumsey, G. L., A. K. Siwicki, D. P. Anderson and P. R. Bowser (1994). "Effect of soybean protein on serological response, non-specific defense mechanisms, growth, and protein utilization in rainbow trout." Veterinary Immunology and Immunopathology 41(3-4): 323-339.
Rønnestad, I., C. R. Rojas-Garcia and J. Skadal (2000). "Retrograde peristalsis; a possible mechanism for filling the pyloric caeca?" Journal of Fish Biology 56(1): 216-218.
Sakata, I., T. Mori, H. Kaiya, M. Yamazaki, K. Kangawa, K. Inoue and T. Sakai (2004). "Localization of ghrelin-producing cells in the stomach of the rainbow trout (Oncorhynchus mykiss)." Zoological Science 21(7): 757-762.
SanchezVazquez, F. J., J. A. Madrid, S. Zamora and M. Tabata (1997). "Feeding entrainment of locomotor activity rhythms in the goldfish is mediated by a feeding-entrainable circadian oscillator." Journal of Comparative Physiology a-Neuroethology Sensory Neural and Behavioral Physiology 181(2): 121-132.

References
89
Schoor, O., T. Weinschenk, J. Hennenlotter, S. Corvin, A. Stenzl, H. G. Rammensee and S. Stevanovic (2003). "Moderate degradation does not preclude microarray analysis of small amounts of RNA." Biotechniques 35(6): 1192-1198.
Schroeder, A., O. Mueller, S. Stocker, R. Salowsky, M. Leiber, M. Gassmann, S. Lightfoot, W. Menzel, M. Granzow and T. Ragg (2006). "The RIN: an RNA integrity number for assigning integrity values to RNA measurements." BMC Molecular Biology 7(3): 1-14.
Seoane, L. M., S. Tovar, R. Baldelli, E. Arvat, E. Ghigo, F. F. Casanueva and C. Dieguez (2000). "Ghrelin elicits a marked stimulatory effect on GH secretion in freely-moving rats." European Journal of Endocrinology 143(5): R7-R9.
Shapiro, S. S. and M. B. Wilk (1965). "An analysis of variance test for normality (complete samples)." Biometrika 52(3-4): 591-611.
Shepherd, B. S., J. K. Johnson, J. T. Silverstein, I. S. Parhar, M. M. Vijayan, A. McGuire and G. M. Weber (2007). "Endocrine and orexigenic actions of growth honnone secretagogues in rainbow trout (Oncorhynchus mykiss)." Comparative Biochemistry and Physiology a-Molecular & Integrative Physiology 146(3): 390-399.
Silverthorn, D. U. (2004). Digestion. Human physiology: an integrated approach. D. U. Silverthorn. San Francisco, Pearson Education Inc, Benjamin Cummings: 659-694.
Soderberg, C., V. A. Pieribone, J. Dahlstrand, L. Brodin and D. Larhammar (1994). "Neuropeptide role of both peptide YY and neuropeptide-Y in vertebrates suggested by abundant expression in their messenger-RNAs in a cyclostom brain." Journal of Neuroscience Research 37(5): 633-640.
Soderberg, C., A. Wraith, M. Ringvall, Y. L. Yan, J. H. Postlethwait, L. Brodin and D. Larhammar (2000). "Zebrafish genes for neuropeptide Y and peptide YY reveal origin by chromosome duplication from an ancestral gene linked to the homeobox cluster." Journal of Neurochemistry 75(3): 908-918.
Spiller, R. C., I. F. Trotman, B. E. Higgins, M. A. Ghatei, G. K. Grimble, Y. C. Lee, S. R. Bloom, J. J. Misiewicz and D. B. A. Silk (1984). "The ileal break - inhibition of jejunal motility after ileal fat perfusion in man." Gut 25(4): 365-374.
Stahlberg, A., J. Hakansson, X. J. Xian, H. Semb and M. Kubista (2004). "Properties of the reverse transcription reaction in mRNA quantification." Clinical Chemistry 50(3): 509-515.
Sundstrom, G., T. A. Larsson, S. Brenner, B. Venkatesh and D. Larhammar (2008). "Evolution of the neuropeptide Y family: New genes by chromosome duplications in early vertebrates and in teleost fishes." General and Comparative Endocrinology 155(3): 705-716.
Sveier, H., E. Wathne and E. Lied (1999). "Growth, feed and nutrient utilisation and gastrointestinal evacuation time in Atlantic salmon (Salmo salar): the effect of dietary fish meal particle size and protein concentration." Aquaculture 180(3-4): 265-282.
Takaya, K., H. Ariyasu, N. Kanamoto, H. Iwakura, A. Yoshimoto, M. Harada, K. Mori, Y. Komatsu, T. Usui, A. Shimatsu, Y. Ogawa, K. Hosoda, T. Akamizu, M. Kojima, K. Kangawa and K. Nakao (2000). "Ghrelin strongly stimulates growth hormone (GH) release in humans." Journal of Clinical Endocrinology and Metabolism 85(12): 4908-4911.
Taniaka-Shintani, M. and M. Watanabe (2005). "Distribution of ghrelin-immunoreactive cells in human gastric mucosa: comparison with that of parietal cells." Journal of Gastroenterology 40(4): 345-349.
Tatemoto, K. (1982). "Isolation an characterization of peptide YY (PYY), a candidate gut hormone that inhibits pancreatic exocrine secretion." Proceedings of the National Academy of Sciences of the United States of America-Biological Sciences 79(8): 2514-2518.
Tatemoto, K. and V. Mutt (1980). "Isolation of 2 novel candidate hormones using a chemical method for finding naturally-ocurring polypeptides." Nature 285(5764): 417-418.

References
90
Terova, G., S. Rimoldi, G. Bernardini, R. Gornati and M. Saroglia (2008). "Sea bass ghrelin: Molecular cloning and mRNA quantification during fasting and refeeding." General and Comparative Endocrinology 155(2): 341-351.
ThermoScientific. (2009). "260/280 and 260/230 ratios." from www.nanodrop.com/Library/T009-NanoDrop%201000-&-NanoDrop%208000-Nucleic-Acid-Purity-Ratios.pdf.
Torstensen, B. E., M. Espe, M. Sanden, I. Stubhaug, R. Waagbo, G. I. Hemre, R. Fontanillas, U. Nordgarden, E. M. Hevroy, P. Olsvik and M. H. G. Berntssen (2008). "Novel production of Atlantic salmon (Salmo salar) protein based on combined replacement of fish meal and fish oil with plant meal and vegetable oil blends." Aquaculture 285(1-4): 193-200.
Tschop, M., D. L. Smiley and M. L. Heiman (2000). "Ghrelin induces adiposity in rodents." Nature 407(6806): 908-913.
Ueno, H., H. Yamaguchi, M. Mizuta and M. Nakazato (2008). "The role of PYY in feeding regulation." Regulatory Peptides 145(1-3): 12-16.
Unniappan, S., L. F. Canosa and R. E. Peter (2004). "Orexigenic actions of ghrelin in goldfish: Feeding-induced changes in brain and gut mRNA expression and serum levels, and responses to central and peripheral injections." Neuroendocrinology 79(2): 100-108.
Unniappan, S., X. W. Lin, L. Cervini, J. Rivier, H. Kaiya, K. Kangawa and R. E. Peter (2002). "Goldfish ghrelin: Molecular characterization of the complementary deoxyribonucleic acid, partial gene structure and evidence for its stimulatory role in food intake." Endocrinology 143(10): 4143-4146.
Unniappan, S. and R. E. Peter (2004). "In vitro and in vivo effects of ghrelin on luteinizing hormone and growth hormone release in goldfish." American Journal of Physiology-Regulatory Integrative and Comparative Physiology 286(6): R1093-R1101.
Vantrappen, G., J. Janssens, T. L. Peeters, S. R. Bloom, N. D. Christofides and J. Hellemans (1979). "Motilin and the interdigestive migrating complex in man." Digestive Diseases and Sciences 24(7): 497-500.
Vincent, R. P. and C. W. le Roux (2008). "The satiety hormone peptide YY as a regulator of appetite." Journal of Clinical Pathology 61(5): 548-552.
Volkoff, H. (2006). "The role of neuropeptide Y, orexins, cocaine and amphetamine-related transcript, cholecystokinin, amylin and leptin in the regulation of feeding in fish." Comparative Biochemistry and Physiology a-Molecular & Integrative Physiology 144(3): 325-331.
Volkoff, H., L. F. Canosa, S. Unniappan, J. M. Cerda-Reverter, N. J. Bernier, S. P. Kelly and R. E. Peter (2005). "Neuropeptides and the control of food intake in fish." General Comparative Endocrinology 142(1-2): 3-19.
Volkoff, H., A. J. Eykelbosh and R. E. Peter (2003a). "Role of leptin in the control of feeding of goldfish Carassius auratus: interactions with cholecystokinin, neuropeptide Y and orexin A, and modulation by fasting." Brain Research 972(1-2): 90-109.
Volkoff, H., A. Joy Eykelbosh and R. Ector Peter (2003b). "Role of leptin in the control of feeding of goldfish Carassius auratus: interactions with cholecystokinin, neuropeptide Y and orexin A, and modulation by fasting." Brain Research 972(1-2): 90-109.
Volkoff, H., M. Xu, E. MacDonald and L. Hoskins (2009). "Aspects of the hormonal regulation of appetite in fish with emphasis on goldfish, Atlantic cod and winter flounder: Notes on actions and responses to nutritional, environmental and reproductive changes." Comparative Biochemistry and Physiology - Part A: Molecular & Integrative Physiology 153(1): 8-12.
Walpole, R. E., Myers, Raymond H., Myers, Sharon L., Ye, Keying (2002). Probability & statistics for engineers & scientists. Upper Saddle River, N.J., Prentice-Hall.
Wilfinger, W. W., K. Mackey and P. Chomczynski (1997). "Effect of pH and ionic strength on the spectro-photometric assessment of nucleic acid purity." Biotechniques 22(3): 474-477.
Wren, A. M., C. J. Small, H. L. Ward, K. G. Murphy, C. L. Dakin, S. Taheri, A. R. Kennedy, G. H. Roberts, D. G. A. Morgan, M. A. Ghatei and S. R. Bloom (2000). "The novel hypothalamic peptide

References
91
ghrelin stimulates food intake and growth hormone secretion." Endocrinology 141(11): 4325-4328.
Yada, T., H. Kaiya, K. Mutoh, T. Azuma, S. Hyodo and K. Kangawa (2006). "Ghrelin stimulates phagocytosis and superoxide production in fish leukocytes." Journal of Endocrinology 189(1): 57-65.
Yeung, C. M., C. B. Chan, N. Y. S. Woo and C. H. K. Cheng (2006). "Seabream ghrelin: cDNA cloning, genomic organization and promoter studies." Journal of Endocrinology 189(2): 365-379.
Zar, J. H. (1996). Biostatistical analysis. Upper Saddle River, N.J., Prentice-Hall.

92

Appendix I
93
Appendix I
Applied equipment
Bio freezer: Forma ULT – 86 C Freezer (Thermo Scientific, USA)
Scale: Mettler AC88 DeltaRange® (Mettler Toledo AS, Switzerland)
Centrifuge: Eppendorf Centrifuge 5415R (Heracus Instruments, Germany)
Tissue homogenizer: FastPrep™ FP120, BIO101 ThermoSavant (Q-BIOgene, USA)
Vortex: Test Tube Shaker (Wilmington, USA)
Heat block: Techne DRI-BLOCK, DB-3D (Techne, USA) and VWR™ Digital Heatblock
(Henry Troemner LLC, USA)
PCR machine: Gene Amp PCR systems 2700 (ABI, USA)
Real-Time RT-PCR machine: Chromo4™ Continuous Fluorescence Detector (Bio-Rad,
Hercules, CA, USA)
Spectrophotometer: NanoDrop ND-1000 (Thermo Scientific, USA)
Electrophoresis equipment: Agilent 2100 Bioanalyzer (Agilent Technologies, USA)
Pipettes: PipetMan (Gilson, France)
Pipette tips: Gilson Diamond® Filter tips (Gilson, France)
Vials: 1.5ml Microcentrifuge tubes (Axygen, USA) and 0.6 ml PCR tubes (Axygen, USA)
qPCR plates: Hard-Shell Thin-Wall 96-Well Skirted PCR Plates

Appendix I
94
Applied chemicals
TRI-Reagent®: Batch # 087K0752 (Sigma, USA)
Chloroform: Batch # 055K0070 (Sigma, USA)
Isopropanol: Batch # 103K3724 (Sigma, USA)
Nuclease-Free Water: Lot # 0809008 (Ambion, USA)
Ethanol: 1000 ml Absolutt Prima (Arcus, Norway)
Sodium Acetate: 3 M NaAc pH (5.5), Lot # 0708003, (Ambion, USA)
DNase kit: TURBO DNA-free Kit™, Lot # 0809014, (Ambion, USA)
Reverse transcription kit: Superscript III First-Strand Synthesis System, Lot # 495661
(Invitrogen, USA)
Primer for cDNA synthesis: Oligo(dT) (Sigma, USA)
Real-time qPCR mastermix: Power SYBR® Green PCR Master Mix (Applied Biosystems),
Lot # 0902071
RNA integrity kit: RNA 6000 Pico LabChip kit (Agilent Technologies, USA), Lot #
MB18BK04

Appendix II
95
Appendix II
Standard curves used in calculation of mRNA copy numbers
Figure A.II.1: Standard calibration curve for GRLN-1. The GRLN-1 standard curve is constructed
with serial 10-fold dilutions of GRLN-1 (recDNA), ranging from 1 x 10² to 1 x 10
10 (copies/ul). Each
standard dilution was run in duplicate reactions in qPCR. Determined Ct values were averaged and
plotted against the logarithm of their initial copy numbers. A linear regression through these point
results in a standard curve with: y = -3.9685x + 43.512, R2 = 0.9984.
0
5
10
15
20
25
30
35
40
0 1 2 3 4 5 6 7 8 9 10
Ct
va
lue
s
Log standard copy no

Appendix II
96
Figure A.II.2: Standard calibration curve for GRLN-2. The GRLN-2 standard curve is constructed
with serial 10-fold dilutions of GRLN-2 (recDNA), ranging from 1 x 10² to 1 x 10
10 (copies/ul). Each
standard dilution was run in duplicate reactions in qPCR. Determined Ct values were averaged and
plotted against the logarithm of their initial copy numbers. A linear regression through these point
results in a standard curve with: y = -3.8163x + 41.066, R2 = 0.9972.
Figure A.II.3: Standard calibration curve for PYY. The PYY standard curve is constructed with
serial 10-fold dilutions of PYY (recDNA), ranging from 1 x 10² to 1 x 10
10 (copies/ul). Each standard
dilution was run in duplicate reactions in qPCR. Determined Ct values were averaged and plotted
against the logarithm of their initial copy numbers. A linear regression through these point results in a
standard curve with: y = -3.9685x + 43.512, R2 = 0.9984.
0
5
10
15
20
25
30
35
40
0 1 2 3 4 5 6 7 8 9 10
Ct
valu
es
Log standard copy no
0
5
10
15
20
25
30
35
0 1 2 3 4 5 6 7 8 9 10
Ct
va
lue
s
Log standard copy no

Appendix II
97
Figure A.II.4: Standard calibration curve for CCK-L. The CCK-L standard curve is constructed
with serial 10-fold dilutions of CCK-L (recDNA), ranging from 1 x 10² to 1 x 10
10 (copies/ul). Each
standard dilution was run in duplicate reactions in qPCR. Determined Ct values were averaged and
plotted against the logarithm of their initial copy numbers. A linear regression through these point
results in a standard curve with: y = -3.7811x + 42.463, R2 = 0.9965.
Figure A.II.5: Standard calibration curve for CCK-N. The CCK-N standard curve is constructed
with serial 10-fold dilutions of CCK-N (recDNA), ranging from 1 x 10² to 1 x 10
10 (copies/ul). Each
standard dilution was run in duplicate reactions in qPCR. Determined Ct values were averaged and
plotted against the logarithm of their initial copy numbers. A linear regression through these point
results in a standard curve with: y = -3.5341x + 39.012, R2 = 0.9992.
0
5
10
15
20
25
30
35
40
0 1 2 3 4 5 6 7 8 9 10
Ct
valu
es
Log standard copy no
0
5
10
15
20
25
30
35
40
0 1 2 3 4 5 6 7 8 9 10
Ct v
alue
s
Log standard copy no

Appendix II
98
Figure A.II.6: Standard calibration curve for EF1α. The EF1α standard curve is constructed with
serial 10-fold dilutions of EF1α (recDNA), ranging from 1 x 10³ to 1 x 10
10 (copies/ul). Each standard
dilution was run in duplicate reactions in qPCR. Determined Ct values were averaged and plotted
against the logarithm of their initial copy numbers. A linear regression through these point results in a
standard curve with: y = -3.7621x + 41.102, R2 = 0.995.
0
5
10
15
20
25
30
35
40
0 1 2 3 4 5 6 7 8 9 10
Ct
valu
es
Log standard copy no

Appendix III
99
Appendix III
Statistics
Testing of normality
Table A.III.1: Shapiro-Wilks test of goodness of fit on log transformed normalized expression data for
unfed fish, segment 2 (stomach). W=1 if data are perfectly normal in distribution. Underlined and
bold W values are significantly smaller than 1 (p<0.05), indicating rejection of the normal distribution
hypothesis.
GRLN-1 GRLN-2 PYY CCK-L CCK-N
Time 0h W = 0.861 W = 0.902 W = 0.989 W = 0.973 W = 0.946
Time 0.5h W = 0.991 W = 0.795 W = 0.999 W = 0.944 W = 0.948
Time 1.5h W = 0.984 W = 0.993 W = 0.864 W = 0.953 W = 0.820
Time 3h W = 0.795 W = 0.970 W = 0.785 W = 0.753 W = 0.953
Time 6h W = 0.982 W = 1 W = 0.928 W = 0.970 W = 0.941
Time 24h W = 0.855 W = 0.831 W = 0.972 W = 0.860 W = 0.970
Table A.III.2: Shapiro-Wilks test of goodness of fit on log transformed normalized expression data for
unfed fish, segment 4 (pyloric cecae). W=1 if data are perfectly normal in distribution. Underlined
and bold W values are significantly smaller than 1 (p<0.05), indicating rejection of the normal
distribution hypothesis.
GRLN-1 GRLN-2 PYY CCK-L CCK-N
Time 0h W = 0.944 W = 0.891 W = 0.787 W = 1 W = 0.980
Time 0.5h W = 0.986 W = 0.772 W = 0.967 W = 0.960 W = 0.997
Time 1.5h W = 0.924 W = 0.885 W = 0.777 W = 0.868 W = 0.965
Time 3h W = 0.962 W = 0.968 W = 0.777 W = 0.941 W = 0.991
Time 6h W = 0.959 W = 0.983 W = 0.893 W = 0.977 W = 0.991
Time 24h W = 0.973 W = 0.879 W = 0.898 W = 0.918 W = 0.874

Appendix III
100
Table A.III.3: Shapiro-Wilks test of goodness of fit on log transformed normalized expression data for
unfed fish, segment 6 (midgut). W=1 if data are perfectly normal in distribution. Underlined and bold
W values are significantly smaller than 1 (p<0.05), indicating rejection of the normal distribution
hypothesis.
GRLN-1 GRLN-2 PYY CCK-L CCK-N
Time 0h W = 0.869 W = 0.890 W = 0.973 W = 0.873 W = -
Time 0.5h W = 0.977 W = 0.992 W = 0.776 W = 0.963 W = -
Time 1.5h W = 0.964 W = 0.996 W = 0.880 W = 0.844 W = -
Time 3h W = 0.988 W = 0.998 W = 0.982 W = 0.912 W = -
Time 6h W = 0.863 W = 0.791 W = 0.992 W = 0.871 W = -
Time 24h W = 0.853 W = 0.988 W = 0.996 W = 0.818 W = -
Table A.III.4: Shapiro-Wilks test of goodness of fit on log transformed normalized expression data for
unfed fish, segment 9 (hindgut). W=1 if data are perfectly normal in distribution. Underlined and bold
W values are significantly smaller than 1 (p<0.05), indicating rejection of the normal distribution
hypothesis.
GRLN-1 GRLN-2 PYY CCK-L CCK-N
Time 0h W = 0.826 W = 0.839 W = 0.789 W = 0.801 W = -
Time 0.5h W = 0.956 W = 0.955 W = 0.906 W = 0.842 W = -
Time 1.5h W = 0.983 W = 1 W = 0.954 W = 0.765 W = -
Time 3h W = 0.992 W = 0.993 W = 0.833 W = 0.888 W = -
Time 6h W = 0.784 W = 0.962 W = 0.883 W = 0.763 W = -
Time 24h W = 0.923 W = 0.926 W = 0.992 W = 0.962 W = -

Appendix III
101
Table A.III.5: Shapiro-Wilks test of goodness of fit on log transformed normalized expression data for
fed fish, segment 2 (stomach). W=1 if data are perfectly normal in distribution. Underlined and bold
W values are significantly smaller than 1 (p<0.05), indicating rejection of the normal distribution
hypothesis.
GRLN-1 GRLN-2 PYY CCK-L CCK-N
Time 0.5h W = 0.982 W = 0.910 W = 0.910 W = 0.997 W = 0.865
Time 1.5h W = 0.995 W = 0.928 W = 0.900 W = 0.985 W = 0.987
Time 3h W = 0.752 W = 0.807 W = 0.961 W = 0.985 W = 0.835
Time 6h W = 0.998 W = 0.754 W = 0.906 W = 0.995 W = 0.840
Time 24h W = 0.865 W = 0.924 W = 0.757 W = 0.861 W = 0.863
Table A.III.6: Shapiro-Wilks test of goodness of fit on log transformed normalized expression data for
fed fish, segment 4 (pyloric cecae). W=1 if data are perfectly normal in distribution. Underlined and
bold W values are significantly smaller than 1 (p<0.05), indicating rejection of the normal distribution
hypothesis.
GRLN-1 GRLN-2 PYY CCK-L CCK-N
Time 0.5h W = 0.978 W = 0.972 W = 0.824 W = 0.953 W = 0.996
Time 1.5h W = 0.871 W = 0.902 W = 0.990 W = 0.773 W = 0.969
Time 3h W = 0.845 W = 0.754 W = 0.871 W = 0.979 W = 0.923
Time 6h W = 0.954 W = 0.945 W = 0.975 W = 0.958 W = 0.996
Time 24h W = 0.976 W = 0.976 W = 0.855 W = 0.910 W = 0.975

Appendix III
102
Table A.III.7: Shapiro-Wilks test of goodness of fit on log transformed normalized expression data for
fed fish, segment 6 (midgut). W=1 if data are perfectly normal in distribution. Underlined and bold W
values are significantly smaller than 1 (p<0.05), indicating rejection of the normal distribution
hypothesis.
GRLN-1 GRLN-2 PYY CCK-L CCK-N
Time 0.5h W = 0.988 W = 0.999 W = 0.999 W = 0.915 W = -
Time 1.5h W = 0.998 W = 0.866 W = 0.915 W = 0.970 W = -
Time 3h W = 0.997 W = 1 W = 0.906 W = 0.979 W = -
Time 6h W = 0.930 W = 0.883 W = 0.810 W = 0.850 W = -
Time 24h W = 0.994 W = 0.982 W = 0.985 W = 0.944 W = -
Table A.III.8: Shapiro-Wilks test of goodness of fit on log transformed normalized expression data for
fed fish, segment 9 (hindgut). W=1 if data are perfectly normal in distribution. Underlined and bold W
values are significantly smaller than 1 (p<0.05), indicating rejection of the normal distribution
hypothesis.
GRLN-1 GRLN-2 PYY CCK-L CCK-N
Time 0.5h W = 0.984 W = 0.983 W = 0.804 W = 0.998 W = -
Time 1.5h W = 1 W = 0.829 W = 0.753 W = 0.965 W = -
Time 3h W = 1 W = 0.941 W = 0.798 W = 0.919 W = -
Time 6h W = 0.857 W = 0.837 W = 0.922 W = 0.805 W = -
Time 24h W = 0.955 W = 0.996 W = 0.995 W = 0.863 W = -

Appendix III
103
Tissue distribution of GRLN-1, GRLN-2, PYY, CCK-L and CCK-N mRNA in Atlantic
salmon GIT: Factorial ANOVA results
Table A.III.9: Factorial ANOVA of GRLN-1 mRNA tissue distribution in stomach, pyloric
cecae, midgut and hindgut (segments ) of unfed and fed (group) Atlantic salmon
SS DF MS F p
Intercept 126.977 1 126.977 2637.796 <<0.001
Segment 19.460 3 6.487 134.749 <<0.001
group 0.129 1 0.129 2.680 0.104
Segment*group 0.037 3 0.012 0.255 0.858
Error 5.969 124 0.048
Table A.III.10:Factorial ANOVA of GRLN-2 mRNA tissue distribution in stomach,
pyloric cecae, midgut and hindgut (segments ) of unfed and fed (group) Atlantic salmon
SS DF MS F p
Intercept 151.6494 1 151.6494 2831.984 <<0.001
Segment 30.7324 3 10.2441 191.305 <<0.001
group 0.4021 1 0.4021 7.508 <0.01
Segment*group 0.1181 3 0.0394 0.735 0.533
Error 6.6401 124 0.0535
Table A.III.11:Factorial ANOVA of PYY mRNA tissue distribution in stomach, pyloric
cecae, midgut and hindgut (segments ) of unfed and fed (group) Atlantic salmon
SS DF MS F p
Intercept 1172.915 1 1172.915 29094.31 <<0.001
Segment 25.856 3 8.619 213.78 <<0.001
group 0.072 1 0.072 1.79 0.183
Segment*group 0.402 3 0.134 3.32 <0.05
Error 4.999 124 0.040
Table A.III.12:Factorial ANOVA of CCK-L mRNA tissue distribution in stomach, pyloric
cecae, midgut and hindgut (segments ) of unfed and fed (group) Atlantic salmon
SS DF MS F p
Intercept 1591.657 1 1591.657 60158.325 <<0.001
Segment 26.644 3 8.881 335.680 <<0.001
group 0.000 1 0.000 0.001 0.975
Segment*group 0.447 3 0.149 5.629 <0.01
Error 3.281 124 0.026

Appendix III
104
Table A.III.13: Factorial ANOVA of CCK-N mRNA tissue distribution in stomach, pyloric
cecae, midgut and hindgut (segments ) of unfed and fed (group) Atlantic salmon
SS DF MS F p
Intercept 908.096 1 908.096 6744.100 <<0.001
Segment 0.013 1 0.013 0.096 0.758
Group 0.381 1 0.381 2.829 0.098
Segment*Group 0.178 1 0.178 1.320 0.255
Error 8.348 62 0.135
Tukey HSD post-hoc test results:
Table A.III.14: Tukey HSD test results for log transformed GRLN-1 mRNA data in stomach (S2),
pyloric cecae (S4), midgut (S6) and hindgut (S9) for unfed and fed fish. Non significant p values are
listed as n.s.
Error: Between MS = 0.04814, df = 124.00
Cell
No.
Segment
(S)
group {1} {2} {3} {4} {5} {6} {7} {8}
1 2 Unfed fish n.s <<0.0
01
<<0.0
01
<<0.0
01
<<0.0
01
<<0.0
01
<<0.0
01
2 2 Fed fish n.s <<0.0
01
<<0.0
01
<<0.0
01
<<0.0
01
<<0.0
01
<<0.0
01
3 4 Unfed fish <<0.001 <<0.00
1
n.s n.s n.s <<0.0
01
<<0.0
01
4 4 Fed fish <<0.001 <<0.00
1
n.s n.s n.s <<0.0
01
<<0.0
01
5 6 Unfed fish <<0.001 <<0.00
1
n.s n.s n.s <<0.0
01
<0.05
6 6 Fed fish <<0.001 <<0.00
1
n.s n.s n.s <<0.0
01
<<0.0
01
7 9 Unfed fish <<0.001 <<0.00
1
<<0.0
01
<<0.0
01
<<0.0
01
<<0.0
01
n.s
8 9 Fed fish <<0.001 <<0.00
1
<<0.0
01
<<0.0
01
<<0.0
01
<<0.0
01
n.s

Appendix III
105
Table A.III.15: Tukey HSD test results for log transformed GRLN-2 mRNA data in stomach (S2),
pyloric cecae (S4), midgut (S6) and hindgut (S9) for unfed and fed fish. Non significant p values are
listed as n.s.
Error: Between MS = ,03617, df = 124,00
Cell No. Segmen
t (S)
group {1} {2} {3} {4} {5} {6} {7} {8}
1 2 Unfed
fish
n.s <<0.0
01
<<0.0
01
<<0.0
01
<<0.0
01
<<0.0
01
<<0.0
01
2 2 Fed fish n.s <<0.0
01
<<0.0
01
<<0.0
01
<<0.0
01
<<0.0
01
<<0.0
01
3 4 Unfed
fish
<<0.0
01
<<0.00
1
n.s n.s n.s <<0.0
01
<<0.0
01
4 4 Fed fish <<0.0
01
<<0.00
1
n.s n.s n.s <<0.0
01
<<0.0
01
5 6 Unfed
fish
<<0.0
01
<<0.00
1
n.s n.s n.s <<0.0
01
<<0.0
01
6 6 Fed fish <<0.0
01
<<0.00
1
n.s n.s n.s <<0.0
01
<<0.0
01
7 9 Unfed
fish
<<0.0
01
<<0.00
1
<<0.0
01
<<0.0
01
<<0.0
01
<<0.0
01
n.s
8 9 Fed fish <<0.0
01
<<0.00
1
<<0.0
01
<<0.0
01
<<0.0
01
<<0.0
01
n.s

Appendix III
106
Table A.III.16: Tukey HSD test results for log transformed PYY mRNA data in stomach (S2), pyloric
cecae (S4), midgut (S6) and hindgut (S9) for unfed and fed fish. Non significant p values are listed as
n.s.
Error: Between MS = ,04031, df = 124,00
Cell
No.
Segment
(S)
group {1} {2} {3} {4} {5} {6} {7} {8}
1 2 Unfed fish <0.05 <<0.00
1
<<0.00
1
<<0.0
01
<<0.0
01
<<0.0
01
<<0.0
01
2 2 Fed fish <0.05 <<0.00
1
<<0.00
1
<<0.0
01
<<0.0
01
<<0.0
01
<<0.0
01
3 4 Unfed fish <<0.0
01
<<0.00
1
n.s n.s n.s <<0.0
01
<<0.0
01
4 4 Fed fish <<0.0
01
<<0.00
1
n.s n.s n.s <<0.0
01
<<0.0
01
5 6 Unfed fish <<0.0
01
<<0.00
1
n.s n.s n.s <<0.0
01
<<0.0
01
6 6 Fed fish <<0.0
01
<<0.00
1
n.s n.s n.s <<0.0
01
<<0.0
01
7 9 Unfed fish <<0.0
01
<<0.00
1
<<0.00
1
<<0.00
1
<<0.0
01
<<0.0
01
n.s
8 9 Fed fish <<0.0
01
<<0.00
1
<<0.00
1
<<0.00
1
<<0.0
01
<<0.0
01
n.s

Appendix III
107
Table A.III.18: Tukey HSD test results for log transformed CCK-L mRNA data in stomach (S2),
pyloric cecae (S4), midgut (S6) and hindgut (S9) for unfed and fed fish. Non significant p values are
listed as n.s.
Error: Between MS = ,02646, df = 124,00
Cell No. Segm
ent
(S)
group {1} {2} {3} {4} {5} {6} {7} {8}
1 2 Unfed fish 0,059 <<0.0
01
<<0.0
01
<<0.0
01
<<0.0
01
<<0.0
01
<<0.0
01
2 2 Fed fish 0,059 <<0.0
01
<<0.0
01
<<0.0
01
<<0.0
01
<<0.0
01
<<0.0
01
3 4 Unfed fish <<0.0
01
<<0.00
1
n.s n.s n.s <<0.0
01
<<0.0
01
4 4 Fed fish <<0.0
01
<<0.00
1
n.s <0.01 n.s <<0.0
01
<<0.0
01
5 6 Unfed fish <<0.0
01
<<0.00
1
n.s <0.01 n.s <<0.0
01
<<0.0
01
6 6 Fed fish <<0.0
01
<<0.00
1
n.s n.s n.s <<0.0
01
<<0.0
01
7 9 Unfed fish <<0.0
01
<<0.00
1
<<0.0
01
<<0.0
01
<<0.0
01
<<0.0
01
n.s
8 9 Fed fish <<0.0
01
<<0.00
1
<<0.0
01
<<0.0
01
<<0.0
01
<<0.0
01
n.s

Appendix III
108
Postprandial effect on mRNA expression of GRLN-1, GRLN-2, PYY, CCK-L and CCK-
N in Atlantic salmon GIT: Main effect ANOVA
Main effects ANOVA
Table A.III.19: Main effects ANOVA for log transformed CCK-L copy no in segment
2 (stomach) of Atlantic salmon with time (h) and fish groups (unfed/fed) as effects. Non
significant values are listed as n.s.
Effect SS DF MS F p
Intercept 534.770 1 534.770 27135.926 <<0.001
Time: 0.029 5 0.006 0.299 n.s
Group 0.206 1 0.202 10.477 <0.01
Error 0.512 26 0.020
Table A.III.20: Main effects ANOVA for log transformed CCK-L copy no in segment
4 (pyloric cecae) of Atlantic salmon with time (h) and fish groups (unfed/fed) as effects.
Non significant values are listed as n.s.
SS DF MS F p
Intercept 335.970 1 335.870 5824.966 <<0.001
Time 0.804 5 0.161 2.787 <0.05
Group 0.013 1 0.013 0.226 n.s
Error 1.500 26 0.058
Table A.III.21: Main effects ANOVA for log transformed GRLN-2 copy no in segment
6 (midgut) of Atlantic salmon with time (h) and fish groups (unfed/fed) as effects. Non
significant values are listed as n.s.
Effect SS DF MS F p
Intercept 36.700 1 36.700 850.468 <<0.001
Time: 0.164 5 0.033 0.761 n.s
Group 0.247 1 0.247 5.716 <0.05
Error 1.122 26 0.043
Table A.III.22: Main effects ANOVA for log transformed PYY copy no in segment 6
(midgut) of Atlantic salmon with time time (h) and fish groups (unfed/fed) as effects.
Non significant values are listed as n.s.
Effect SS DF MS F p
Intercept 201.484 1 201.484 173407.129 <<0.001
Time: 0.016 5 0.003 2.780 <0.05
Group 0 1 0 0.099 n.s
Error 0.030 26 0.001

Appendix III
109
Table A.III.23: Main effects ANOVA for log transformed CCK-L copy no in segment
6 (midgut) of Atlantic salmon with time (h) and fish groups (unfed/fed) as effects. Non
significant values are listed as n.s.
Effect SS DF MS F p
Intercept 349.819 1 349.819 48114.319 <<0.001
Time: 0.054 5 0.011 1.498 n.s
Group 0.063 1 0.063 8.691 <0.01
Error 0.189 26 0.007
Tukey HSD post hoc tests for significant values in main effects ANOVA
Table A.III.24: Tukey HSD test for log transformed
CCK-L copy no data in segment 2 (somach) of Atlantic
salmon
Cell No. Group {1} {2}
1 Unfed fish
<0.01
2 Fed fish <0.01
Table A.III.25: Tukey HSD test for log transformed CCK-L copy no in segment 4 (pyloric cecae) with
time as main effect. Non significant values are listed as n.s.
Cell No. Time: {1} {2} {3} {4} {5} {6}
1 0 <0.05 n.s n.s n.s <0.05
2 0,5 <0.05
n.s n.s n.s n.s
3 1,5 n.s n.s
n.s n.s n.s
4 3 n.s n.s n.s
n.s n.s
5 6 n.s n.s n.s n.s
n.s
6 24 <0.05 n.s n.s n.s n.s
Table A.III.26: Tukey HSD test for log transformed
GRLN-2 copy no data in segment 6 (midgut) of Atlantic
salmon
Cell No. Group {1} {2}
1 Unfed fish <0.05
2 Fed fish <0.05

Appendix III
110
Table A.III.27: Tukey HSD test for log transformed PYY copy no in segment 6 (midgut) of
Atlantic salmon. Non significant values are listed as n.s.
Cell No. Time: {1} {2} {3} {4} {5} {6}
1 0 <0.05 n.s n.s n.s n.s
2 0,5 <0.05
n.s n.s n.s n.s
3 1,5 n.s n.s
n.s n.s n.s
4 3 n.s n.s n.s
n.s n.s
5 6 n.s n.s n.s n.s
n.s
6 24 n.s n.s n.s n.s n.s
Table A.III.28: Tukey HSD test for log transformed
CCK-L copy no data in segment 6 (midgut) of Atlantic
salmon
Cell No. Group {1} {2}
1 Fasted fish <0.01
2 Fed fish <0.01
Postprandial effect on GRLN-1, GRLN-2, PYY, CCK-L and CCK-N mRNA expression:
T-test results
Table A.III.29: T-test of log transformed GRLN-1 mRNA normalized expression in S6 at time:=24.
Groups were treated as independent samples. Group 1=Unfed fish (n=3), Group 2=Fed fish (n=3).
Mean group 1
Mean group
2 t-value df p
Std.Dev.
Group 1
Std.Dev.
Group 2
Fasted fish:
vs. Fed fish: -1.088 -0.852 -13.535 4 <<0.001 0.029 0.010
Table A.III.30: T-test of log transformed GRLN-1 mRNA normalized expression in S9 at time:=24.
Groups were treated as independent samples. Group 1= Unfed fish (n=3), Group 2=Fed fish (n=3).
Mean group 1 Mean group 2 t-value df p
Std.Dev.
Group 1
Std.Dev.
Group 2
Fasted fish:
vs. Fed fish: -1.483 -1.115 -7.078 4 <0.01 0.052 0.074
Table A.III.31: T-test of log transformed GRLN-2 mRNA normalized expression in S6 at time:=24.
Groups were treated as independent variables. Group 1= Unfed fish (n=3), Group 2=Fed fish (n=3).
Mean group 1 Mean group 2 t-value df p
Std.Dev.
Group 1
Std.Dev.
Group 2
Fasted fish:
vs. Fed fish: -1.178 -0.846 -6.515 4 <0.01 0.078 0.042

Appendix III
111
Table A.III.32: T-test of log transformed GRLN-2 mRNA normalized expression in S9 at time:=24.
Groups were treated as independent samples. Group 1= Unfed fish (n=3), Group 2=Fed fish (n=3).
Mean group 1
Mean group
2 t-value df p
Std.Dev.
Group 1
Std.Dev.
Group 2
Fasted fish:
vs. Fed fish: -1.851 -1.312 -9.558 4 <<0.001 0.065 0.073
Table A.III.33: T-test of log transformed PYY mRNA normalized expression in S9 at time:=1.5.
Groups were treated as independent variables. Group 1= Unfed fish (n=3), Group 2=Fed fish (n=3).
Mean group 1 Mean group 2 t-value df p
Std.Dev.
Group 1
Std.Dev.
Group 2
Fasted fish:
vs. Fed fish: -3.036 -2.916 -4.210 4 <0.05 0.048 0.013
Table A.III.34: T-test of log transformed PYY mRNA normalized expression in S9 at time:=3. Groups
were treated as independent variables. Group 1= Unfed fish (n=3), Group 2=Fed fish (n=3).
Mean group 1 Mean group 2 t-value df p
Std.Dev.
Group 1
Std.Dev.
Group 2
Fasted fish:
vs. Fed fish: -2.917 -3.084 4.059 4 <0.05 0.062 0.036
Table A.III.35: T-test of log transformed PYY mRNA normalized expression in S9 at time:=24.
Groups were treated as independent variables. Group 1= Unfed fish (n=3), Group 2=Fed fish (n=3).
Mean group 1 Mean group 2 t-value df p
Std.Dev.
Group 1
Std.Dev.
Group 2
Fasted fish:
vs. Fed fish: -2.957 -3.004 3.100 4 <0.05 0.024 0.011
Table A.III.36: T-test of log transformed CCK-L mRNA normalized expression in S2 at time:=3.
Groups were treated as independent variables. Group 1= Unfed fish (n=3), Group 2=Fed fish (n=3).
Mean group 1 Mean group 2 t-value df p
Std.Dev.
Group 1
Std.Dev.
Group 2
Fasted fish:
vs. Fed fish: -4.102 -4.397 2.900 4 <0.05 0.112 0.135
Table A.III.37: T-test of log transformed CCK-L mRNA normalized expression in S6 at time:=0.5.
Groups were treated as independent variables. Group 1= Unfed fish (n=3), Group 2=Fed fish (n=3).
Mean group 1 Mean group 2 t-value df p
Std.Dev.
Group 1
Std.Dev.
Group 2
Fasted fish:
vs. Fed fish: -3.558 -3.362 -4.996 4 <0.01 0.014 0.067

Appendix III
112
Table A.III.38: T-test of log transformed CCK-L mRNA normalized expression in S6 at time:=24.
Groups were treated as independent variables. Group 1= Unfed fish (n=3), Group 2=Fed fish (n=3).
Mean group 1 Mean group 2 t-value df p
Std.Dev.
Group 1
Std.Dev.
Group 2
Fasted fish:
vs. Fed fish: -3.450 -3.267 -3.270 4 <0.05 0.095 0.017
Table A.III.39: T-test of log transformed CCK-L mRNA normalized expression in S9 at time:=1.5.
Groups were treated as independent variables. Group 1= Unfed fish (n=3), Group 2=Fed fish (n=3).
Mean group 1 Mean group 2 t-value df p
Std.Dev.
Group 1
Std.Dev.
Group 2
Fasted fish:
vs. Fed fish: -2.959 -3.018 2.906 4 <0.05 0.033 0.013
Table A.III.40: T-test of log transformed CCK-N mRNA normalized expression in S2 at time:=1.5.
Groups were treated as independent variables. Group 1= Unfed fish (n=3), Group 2=Fed fish (n=3).
Mean group 1 Mean group 2 t-value df p
Std.Dev.
Group 1
Std.Dev.
Group 2
Fasted fish:
vs. Fed fish: -4.115 -3.406 -2.846 4 <0.05 0.423 0.087

Appendix III
113
cDNA synthesis efficiency
Figure A.III.1 cDNA synthesis efficiency. Data are represented as qPCR Ct values (y-axis) of
a random gene (GRLN-1) plotted against the logarithm of a standard dilution series of RNA
from 12 random samples into cDNA synthesis (x-axis). The four different dilutions (D1-D4)
were run in parallel reactions into reverse transcription (RT) reaction with the following
amount of total RNA (estimated with Nanodrop): D1=5000 ng, D2=2500 ng, D3=1250 ng
and D4=625 ng. The qPCR reaction gave the following Ct values ±SD(standard deviation):
D1=24.47±0.35, D2=24.81±0.01, D3=25.64±0.08 and D4=26.70±0.14. The slope of the RNA
dilution curve was calculated by linear regression: y = -2.508x + 33.56 and the coefficient of
determination (r²) = 0.935.
24
24,5
25
25,5
26
26,5
27
2,5 3 3,5 4
Ct
valu
es
stan
dar
ds
log cDNA amount

Appendix III
114
RNA integrity assessment
Figure A.III.2: RNA integrity numbers (RIN) for different segments in Atlantic salmon GI
tract. The y-axis show RIN categories 1 to 10, where 10 is a fully intact sample and 1 is a
totally degraded sample. The x-axis show the mean combined results for unfed and fed fish
groups in different segments of the GI tract, including stomach tissue (Segment 2); n=32,
pyloric cecae (Segment 4); n=32, midgut (Segment 6); n=33 and hindgut (Segment 9); n=32.
Error bars express ±SD.
2 4 6 9
Segment
1
2
3
4
5
6
7
8
9
10
RIN

Appendix III
115
Linear regression of Ct against RIN
Figure A.III.3: Correlation between cycle threshold value (Ct) and RNA integrity number (RIN) in
stomach tissue of Atlantic salmon (segment 2). The results are represented as average Ct of two
parallels from q-PCR absolute expression for EF1a reference gene (n=32), GRLN-1 (n= 32) and
GRLN-2 (n=32). The linear regression lines show the following values; EF1a: y = -0.239x + 18.39,
GRLN-1: y = -0.370x + 26.76 and GRLN-2: y = -0.341x + 24.53. The r2 and p values of regression are
shown in Table 3.4.
Figure A.III.4: Correlation between cycle threshold value (Ct) and RNA integrity number (RIN) in
stomach tissue of Atlantic salmon (segment 2). The results are represented as average Ct of two
parallels from q-PCR absolute expression for PYY (n= 32), CCK-L (n= 32) and CCK-N (n= 32). The
linear regression lines show the following values; PYY: y = 1.081x + 19.99, CCK-L: y = -0.025x +
35.88 and CCK-N: y = -0.188x + 31.66. The r2 and p values of regression are shown in Table 3.4.
1 2 3 4 5 6 7 8 9 10
RIN values
14
16
18
20
22
24
26
Cycle
thre
shold
(C
t)
EF1a
Ghrelin-1
Ghrelin-2
1 2 3 4 5 6 7 8 9 10
RIN values
18
20
22
24
26
28
30
32
34
36
38
Cycle
thre
shold
(C
t)
PYY
CCK-L
CCK-N

Appendix III
116
Figure A.III.5: Correlation between cycle threshold value (Ct) and RNA integrity number (RIN) in
pyloric cecae tissue of Atlantic salmon (segment 4). The results are represented as average Ct of two
parallels from qPCR absolute expression for EF1a reference gene (n= 32), GRLN-1 (n=32 ) and
GRLN-2 (n= 32). The linear regression lines show the following values; EF1a: y = -0.795x + 22.53,
GRLN-1: y = -1.242x + 39.42 and GRLN-2: y = -1.233x + 38.12. The r2 and p values of regression are
shown in Table 3.4.
Figure A.III.6: Correlation between cycle threshold value (Ct) and RNA integrity number (RIN) in
pyloric cecae tissue of Atlantic salmon (segment 4). The results are represented as average Ct of two
parallels from qPCR absolute expression for PYY (n= 32), CCK-L (n= 32) and CCK-N (n= 32). The
linear regression lines show the following values; PYY: y = -1.101x + 28.44, CCK-L: y = -1.714x +
42.03 and CCK-N: y = -1.933x + 43.64. The r2 and p values of regression are shown in Table 3.4.
1 2 3 4 5 6 7 8 9 10
RIN values
12
14
16
18
20
22
24
26
28
30
32
34
36C
ycle
thre
shold
(C
t)
RIN values:Avrage CT EF1a:: y = 22,5307 - 0,7954*x;
r = -0,5382; p = 0,0015; r 2 = 0,2897
RIN values:Avrage CT Ghrelin-1: y = 39,4177 - 1,242*x;
r = -0,3654; p = 0,0397; r 2 = 0,1335
RIN values:Avrage CT Ghrelin-2: y = 38,1154 - 1,2329*x;
r = -0,3787; p = 0,0325; r 2 = 0,1434
EF1a
Ghrelin-1
Ghrelin-2
1 2 3 4 5 6 7 8 9 10
RIN values
16
18
20
22
24
26
28
30
32
34
36
Cycle
thre
shold
(C
t)
PYY
CCK-L
CCK-N

Appendix III
117
Figure A.III.7: Correlation between cycle threshold value (Ct) and RNA integrity number (RIN) in
midgut tissue of Atlantic salmon (segment 6). The results are represented as average Ct of two
parallels from qPCR absolute expression for EF1a reference gene (n= 33), GRLN-1 (n= 33) and
GRLN-2 (n=33). The linear regression lines show the following values; EF1a: y = -0495x + 21.07,
GRLN-1: y = -0.080x + 32.15 and GRLN-2: y = 0.362x + 27.04. The r2 and p values of regression are
shown in Table 3.4.
Figure A.III.8: Correlation between cycle threshold value (Ct) and RNA integrity number (RIN) in
midgut tissue of Atlantic salmon (segment 4). The results are represented as average Ct of two
parallels from qPCR absolute expression for PYY (n= 33), CCK-L (n= 33) and CCK-N (n= 33). The
linear regression lines show the following values; PYY: y = -0.372x + 22.93, CCK-L: y = -0.004x +
31.25 and CCK-N: y = -0.922x + 43.77. The r2 and p values of regression are shown in Table 3.4.
1 2 3 4 5 6 7 8 9 10
RIN values
14
16
18
20
22
24
26
28
30
32
34
36
38C
ycle
thre
shold
(C
t)
EF1a
Ghrelin-1
Ghrelin-2
1 2 3 4 5 6 7 8 9 10
RIN values
18
20
22
24
26
28
30
32
34
36
38
40
42
Cycle
thre
shold
(C
t)
PYY
CCK-L
CCK-N

Appendix III
118
Figure A.III.9: Correlation between cycle threshold value (Ct) and RNA integrity number (RIN) in
hindgut tissue of Atlantic salmon (segment 9). The results are represented as average Ct of two
parallels from qPCR absolute expression for EF1a reference gene (n= 32), GRLN-1 (n=32) and
GRLN-2 (n=32). The linear regression lines show the following values; EF1a: y = -0.269x + 19.93,
GRLN-1: y = -0.446x + 37.76 and GRLN-2: y = -0.530x + 37.78. The r2 and p values of regression are
shown in Table 3.4.
Figure A.III.10: Correlation between cycle threshold value (Ct) and RNA integrity number (RIN) in
hindgut tissue of Atlantic salmon (segment 9). The results are represented as average Ct of two
parallels from qPCR absolute expression for PYY (n= 32), CCK-L (n= 32) and CCK-N (n= 32). The
linear regression lines show the following values; PYY: y = -0.205x + 26.56, CCK-L: y = -0.478x +
31.53 and CCK-N: y = -0.374x + 40.80. The r2 and p values of regression are shown in Table 3.4.
1 2 3 4 5 6 7 8 9 10
RIN values
16
18
20
22
24
26
28
30
32
34
36
38
40C
ycle
thre
shold
(C
t)
EF1a
Ghrelin-1
Ghrelin-2
1 2 3 4 5 6 7 8 9 10
RIN values
20
22
24
26
28
30
32
34
36
38
40
42
Cycle
thre
shold
(C
t)
PYY
CCK-L
CCK-N

Appendix III
119
Postprandial effects and tissue distribution of EF1α
Figure A.III.11: EF1a expression in Atlantic salmon gut tissue. Data are presented as mean (n=3)
calculated copy number (±S.D) for fasted fish (black square) and fed fish (red triangle) at time (h);
0.5, 1.5, 3, 6 and 24. Time 0 is represented for fasted fish only, as this marks the start of the
experiment. a) Represents results for stomach tissue (S2), b) represents results for pyloric cecae (S4),
c) represents result for midgut (S6) and d) represents result for hindgut (S9). Mean values with an
asterisk above show significant differences between fish groups at a given time point (p<0.5).
(a)
0 3 6 9 12 15 18 21 24
Time (h)
34
36
38
40
42
EF
1a e
xpre
ssio
n
(b)
0 3 6 9 12 15 18 21 24
Time (h)
34
36
38
40
42
EF
1a e
xpre
ssio
n
(c)
0 3 6 9 12 15 18 21 24
Time (h)
34
36
38
40
42
EF
1a e
xpre
ssio
n
(d)
0 3 6 9 12 15 18 21 24
Time (h)
34
36
38
40
42
EF
1a e
xpre
ssio
n Fasted fish: Fed fish:

Appendix III
120
Figure A.III.12: Segmental distribution of EF1a reference gene mRNA in Atlantic salmon GI tract.
Data are represented as mean calculated copy number for fasted fish (n= 18), and fed fish (n= 15) ±
SD, for stomach (S2), pyloric cecae (S4), midgut (S6) and hindgut (S9).
2 4 6 9
Segment
0
10
20
30
40
50
60E
F1a c
opy n
o
Fasted fish
Fed fish

Appendix IV
121
Appendix IV
Composition of feed used in the postprandial experiment
Table AIV1. Dietary ingredients, chemical composition and energy of the feed used. Values
provided by the producer (EWOS, Norway).
EWOS Micro 50
Ingredients (g kg-1
)
Fish meal 471
Wheat 140
Plant proteins 200
Fish oil 185
Premix (vitamin, minerals) 2
Composition (g kg-1
)
Protein 48
Fat 24
Water 8
Ash 8.5
Fiber 1
Extracts 12
Gross energy (MJ kg-1
) 22.9