Radisav Vidic University of Pittsburgh David Dzombak ... Library/Research/Coal/ewr/water... ·...
55
REUSE OF INTERNAL OR EXTERNAL WASTEWATERS IN THE COOLING SYSTEMS OF COAL-BASED THERMOELECTRIC POWER PLANTS Radisav Vidic University of Pittsburgh David Dzombak Carnegie Mellon University October 27, 2008
Transcript of Radisav Vidic University of Pittsburgh David Dzombak ... Library/Research/Coal/ewr/water... ·...

REUSE OF INTERNAL OR EXTERNAL
WASTEWATERS IN THE COOLING SYSTEMS OF
COAL-BASED THERMOELECTRIC POWER PLANTS
Radisav Vidic
University of Pittsburgh
David Dzombak
Carnegie Mellon University
October 27, 2008

OVERVIEW
• Project goal
• Background and regulatory information
• Materials and methods
– Lab-scale studies
– Pilot-scale studies
• Project accomplishments
– Lab-scale studies
– Pilot-scale studies
• Summary

PROJECT GOAL
• Assess potential of three different
impaired waters for use in recirculating
cooling water systems
– secondary-treated municipal
wastewater
– passively-treated coal mine drainage
– ash pond effluent

NONTRADITIONAL SOURCES OF COOLING
WATER: TREATED MUNICIPAL WASTEWATER
• 11.4 trillion gallons of municipal
wastewater collected and treated annually
in U.S.
• Experience with use of treated municipal
water for power plant cooling in arid west;
e.g., Burbank, Las Vegas, Phoenix
• Significant additional treatment beyond
secondary treatment (e.g., clarification,
filtration, N and P removal)
NONTRADITIONAL SOURCES OF COOLING
WATER: PASSIVELY-TREATED AMD
• Significant flows of abandoned mine drainage
(AMD) in coal mining regions
• NETL has confirmed magnitude and reliability
of AMD as source of cooling water
• Adequate treatment (to raise pH, remove
dissolved solids and metals) prior to use is
largest concern
• Passive treatment systems offer potential for
inexpensive source of cooling water

NONTRADITIONAL SOURCES OF COOLING
WATER: ASH POND EFFLUENT
• Water-ash slurry systems used
commonly to remove bottom ash and fly
ash
• Slurry is directed to ponds where
settling of ash particles occurs
• Slurry water is often discharged
• Potential to reuse the slurry water in the
slurry system and as cooling system
makeup water
PROBLEMS WITH USE OF
IMPAIRED WATERS
• Precipitation and scaling
• Accelerated corrosion
• Biomass growth

Review of Regulations Relevant to
Reuse of Impaired Waters
The basis of reusing water.
Cooling tower blowdown
discharge.
Air emissions when using
impaired waters.
Transporting wastewater
across boundaries (interstate
or intrastate). Franklin Township Municipal Sanity Authority,
Murrysville, PA.

Basis for Water Reuse
• None of the current regulations
directly prohibit the use of reclaimed
water as power plant cooling water.
In the “Guidelines of U.S. Water
Reuse” (2004), USEPA suggested
the treatment requirements and
standards for reclaimed water
reutilized as cooling water in
thermoelectric systems.

Cooling Tower Blowdown
Discharge• Clean Water Act (CWA) §402, EPA establishes the
National Pollutant Discharge Elimination System
(NPDES), which requires that all point source discharges
of pollutants to surface waters must be authorized by
NPDES discharge permits. Limits in NPDES permits can
be technology-based or water quality based.
10
Depending on technologies
adapted in cooling tower design,
the concentrations of available
chlorine, chromium, and zinc are
likely to be confining factors.

Control of Air Emissions
• Aerosols are the major concern for cooling tower emissions
• In National Ambient Air Quality Standards (NAAQS) and Regional Haze Regulations,” (EPA, 2005), cooling towers are categorized as potential point sources of pollutants emission with volatile organic compounds, PM10, PM2.5, and NH3
• Possible issues with emissions of concentrated metal and chemicals
11

Transporting Wastewater
Across Boundaries
• One potential approach that may alleviate severe water shortages in drought areas, such as Arizona, Texas, and Florida, is to transfer natural or treated water from other regions where it may be available in larger quantities
12
• Most transfer events between states were evaluated on a case-by-case basis and records indicate few prohibitions against water transfer
SUMMARY – Task 1
• Existing regulations do not prohibit the
use of impaired waters for cooling
purposes. Regular monitoring and
evaluation is required to meet the
discharge and air emission regulations.
• Cases of interbasin transfer showed that
most transfer events were evaluated on
a case-by-case basis without explicit
prohibition.

Feasibility Analysis of Using
Wastewater in Cooling Towers
Assess availability of impaired waters (quantity and
proximity) to meet cooling needs of coal-based
thermoelectric power plants:
• Build a scenario of water supply: Construct a map of publicly owned treatment plants on GIS.
• Build a scenario of water demand: Develop an equation to estimate the water demand for a proposed power plant.
• Spatial analysis: Use the GIS map to evaluate the potential wastewater flowrate within a specific range of each proposed power plant.
• Compare available wastewater flowrate and estimated water needed for proposed power plants.
14
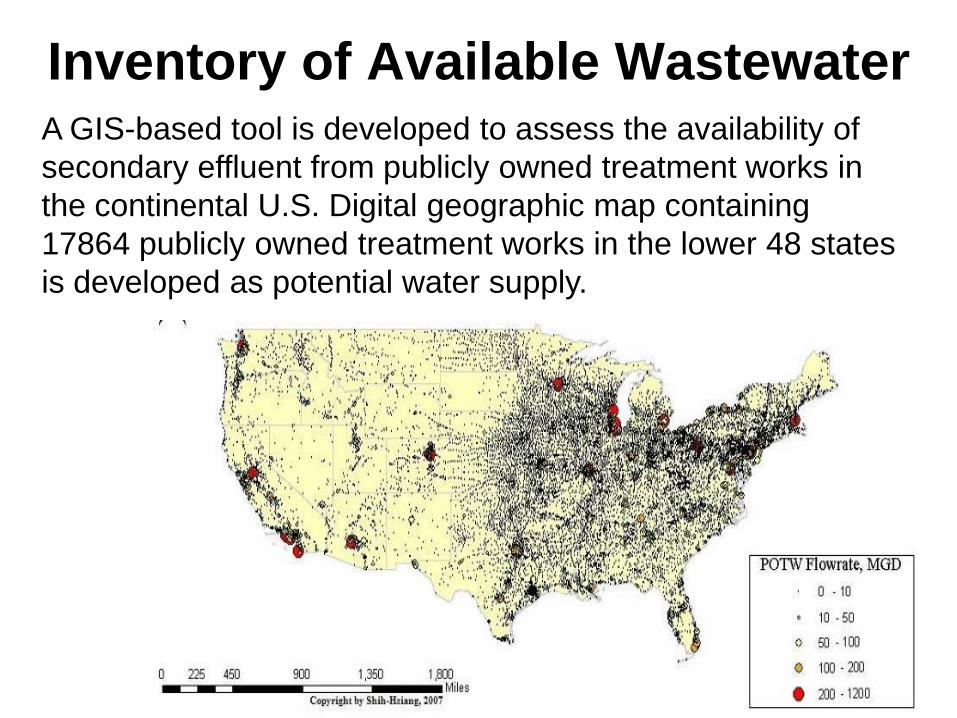
A GIS-based tool is developed to assess the availability of
secondary effluent from publicly owned treatment works in
the continental U.S. Digital geographic map containing
17864 publicly owned treatment works in the lower 48 states
is developed as potential water supply.
Inventory of Available Wastewater

Inventory of Water Needs
• The 110 proposed power plants are from EIA annual
report 2007.
• U.S. is divided into 8 major NERC regions (shown in
color) and 13 minor regions.
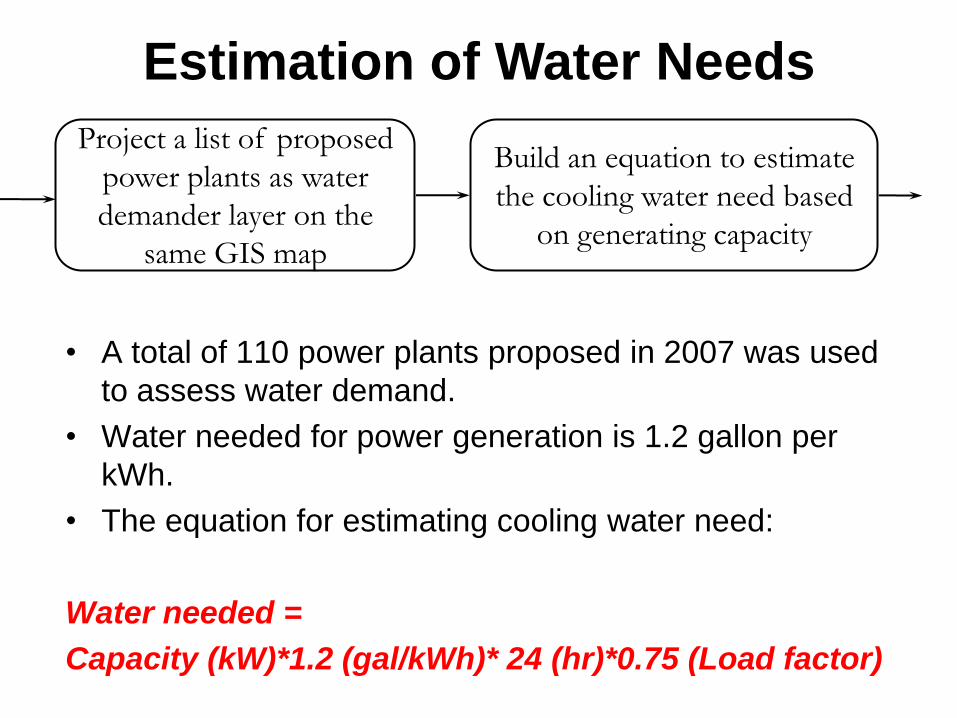
Estimation of Water Needs
• A total of 110 power plants proposed in 2007 was used
to assess water demand.
• Water needed for power generation is 1.2 gallon per
kWh.
• The equation for estimating cooling water need:
Water needed =
Capacity (kW)*1.2 (gal/kWh)* 24 (hr)*0.75 (Load factor)
Project a list of proposed
power plants as water
demander layer on the
same GIS map
Build an equation to estimate
the cooling water need based
on generating capacity

RegionTotal Daily Cooling
Water Need, MGD
Total Daily
Wastewater Flow
rate, MGD
Percentage of
Available Wastewater
needed for cooling, %
ECAR 27.5 4873 0.56
ERCOT 15.0 1993 0.76
FRCC 42.9 1374 3.12
MAIN 1.6 3318 0.05
MAPP 25.7 1167 2.20
NPCC/NY 0.1 1112 0.01
SERC 28.2 3915 0.72
SPP 17.5 2077 0.84
WECC/CA 22.5 3636 0.62
WECC/NWCC 44.9 1910 2.35
WECC/RM 9.3 1061 0.8818
Supply vs. Demand
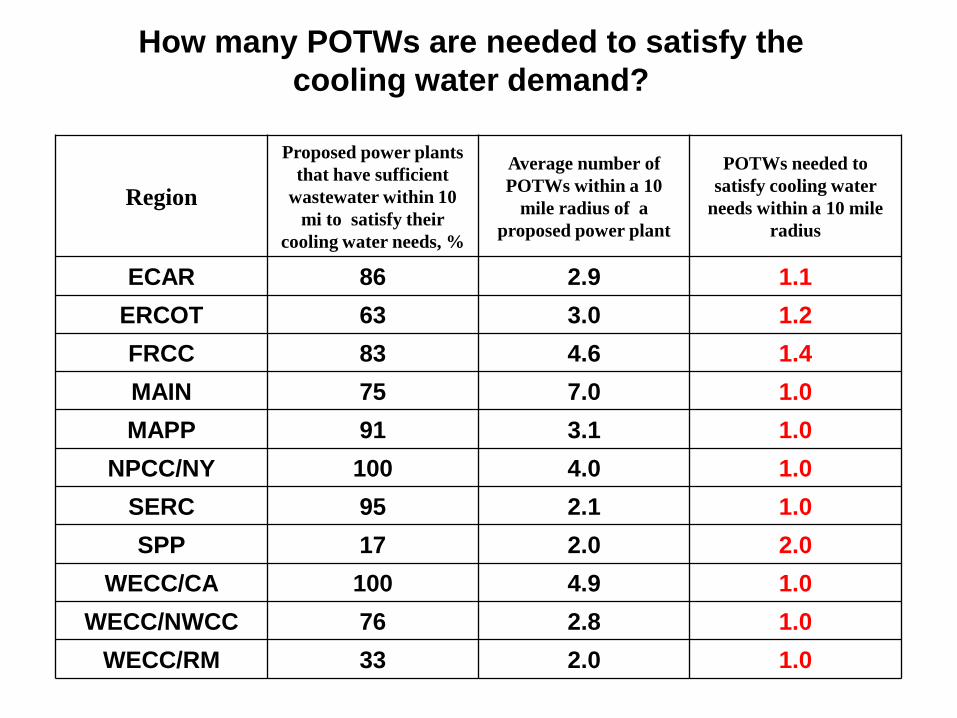
How many POTWs are needed to satisfy the
cooling water demand?
Region
Proposed power plants
that have sufficient
wastewater within 10
mi to satisfy their
cooling water needs, %
Average number of
POTWs within a 10
mile radius of a
proposed power plant
POTWs needed to
satisfy cooling water
needs within a 10 mile
radius
ECAR 86 2.9 1.1
ERCOT 63 3.0 1.2
FRCC 83 4.6 1.4
MAIN 75 7.0 1.0
MAPP 91 3.1 1.0
NPCC/NY 100 4.0 1.0
SERC 95 2.1 1.0
SPP 17 2.0 2.0
WECC/CA 100 4.9 1.0
WECC/NWCC 76 2.8 1.0
WECC/RM 33 2.0 1.0

Percentage of proposed plants which
have sufficient wastewater within 10 mi
0%
20%
40%
60%
80%
100%
ECAR
ERCO
T
FRCC
MAIN
MAPP
NPC
C/N
Y
SERC
SPP
WECC/C
A
WECC/N
WCC
WECC/R
M
NERC Region
Co
olin
g w
ate
r su
ffic
ien
cy p
erc
en
tag
e, %
Proposed plants have insuff icient w astew ater resource w ithin 10 miles
Proposed plants have suff icient w astew ater resource w ithin 10 miles
0%
20%
40%
60%
80%
100%
ECAR
ERCO
T
FRCC
MAIN
MAPP
NPC
C/N
Y
SERC
SPP
WECC/C
A
WECC/N
WCC
WECC/R
M
NERC RegionC
oo
lin
g w
ate
r su
ffic
ien
cy p
erc
en
tag
e, %
Proposed plants have insuff icient w astew ater resource w ithin 25 miles
Proposed plants have suff icient w astew ater resource w ithin 25 miles
How many POTWs are needed to satisfy the
cooling water demand?
Percentage of proposed plants which
have sufficient wastewater within 25 mi
Summary – Task 2
POTWs located within 10 and 25 mile
radius from the proposed power plants can
satisfy 81% and 97% of power plant cooling
water needs, respectively.
On average, one fairly large POTW can
completely satisfy the cooling water
demand for each of these power plants.
OVERVIEW
• Project goal
• Background and regulatory information
• Materials and methods
– Lab-scale studies
– Pilot-scale studies
• Project accomplishments
– Lab-scale studies
– Pilot-scale studies
• Summary
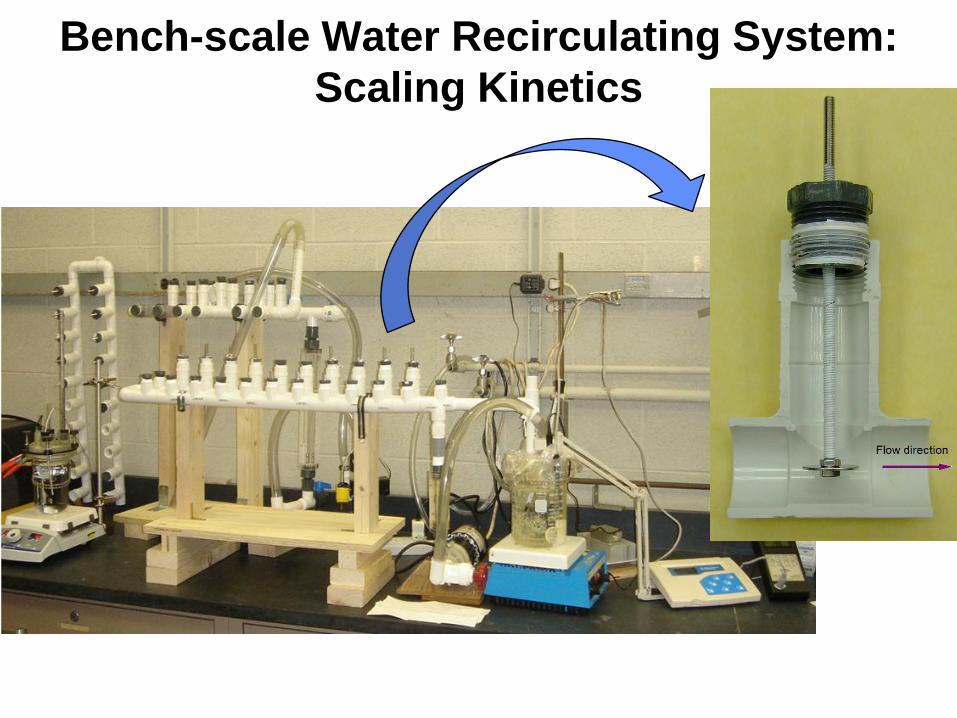
Bench-scale Water Recirculating System:
Scaling Kinetics

P
Hot plate
Flo
w m
ete
r
Valve
Pump
Electrode holder
Synthetic
wastewater
PTPotentiostat Electrode
Recirculating flow
Bench-scale Water Recirculating System:
Corrosion Studies

Flow direction
Working
electrode (alloy)Counter electrode
(graphite)
Luggin capillary
Reference
electrode (SCE)
Applied small
Voltage (ΔE)
VA
Measure inducedCurrent (ΔI)
Potentiostat
Design of T-section for Electrochemical Study
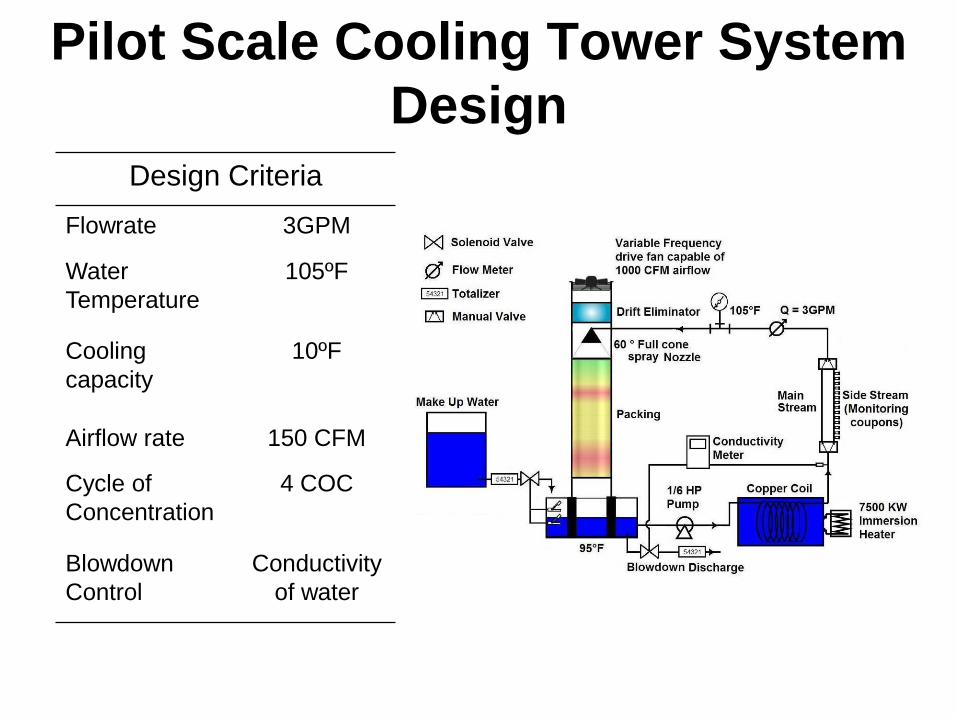
Pilot Scale Cooling Tower System
DesignDesign Criteria
Flowrate 3GPM
Water
Temperature
105ºF
Cooling
capacity
10ºF
Airflow rate 150 CFM
Cycle of
Concentration
4 COC
Blowdown
Control
Conductivity
of water

Pilot Scale Cooling Tower System
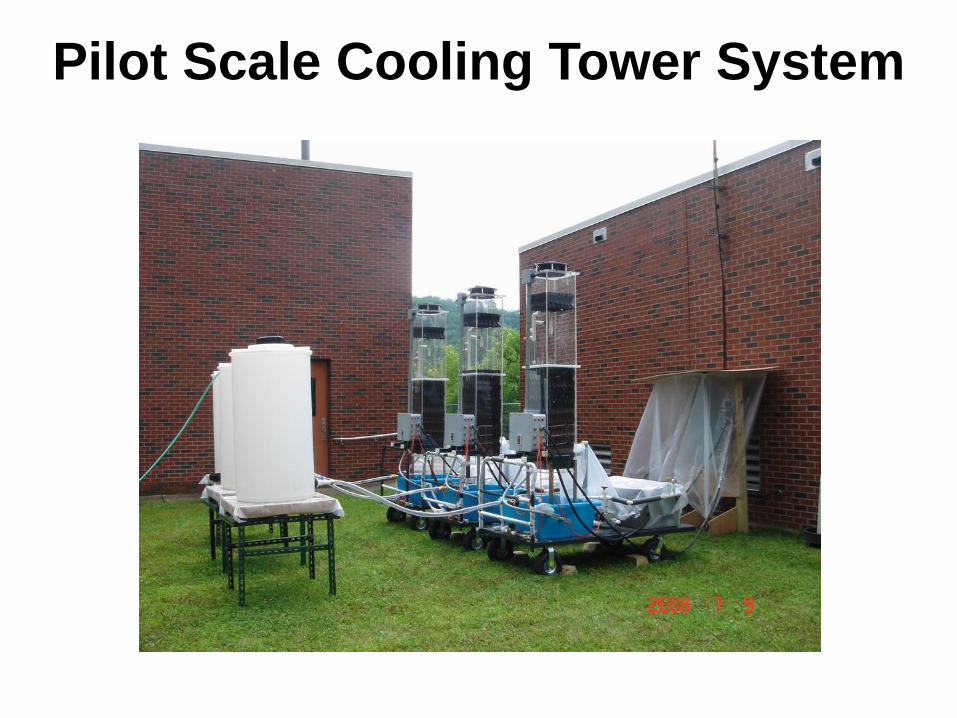
Pilot Scale Cooling Tower System

Pilot Scale Cooling Tower System

OVERVIEW
• Project goal
• Background and regulatory information
• Materials and methods
– Lab-scale studies
– Pilot-scale studies
• Project accomplishments
– Lab-scale studies
– Pilot-scale studies
• Summary

Exp. #Source Water
CoC Chlorine addition α
Concentration of antiscalant (mg/L)Actual Synthetic PMA PBTC TKPP
a √ 1 - - - -
b √ 4 - - - -
c √ 4 - - 10 10
d √ 4 1ppm chloramines - 10 10
e √ 1 - - - -
f √ 4 - - - -
g √ 4 - - 5 5
h √ 4 - - 10 10
i √ 4 1ppm chlorine β - 10 10
j √ 4 1ppm chloramines - 10 10
k √ 4 1ppm chloramines 10 5 -
l √ 4 1ppm chloramines 20 10 -
m √ 4 w/o ammonia - 10 10
n √ 4 w/o phosphate - 10 10
Experimental Matrix for Scaling Study with
Secondary Wastewater

Scaling behavior of secondary wastewater:
actual vs. synthetic
0
1
2
3
0 2 4 6 8 10
De
po
sit
s (
mg
)
Water recirculating day
CoC 1 (a)
CoC 4 (b)
0
1
2
3
0 2 4 6 8 10
De
po
sit
s (
mg
)
Water recirculating day
Blank (b)
PBTC-TKPP 10ppm each (c)
(c)+1ppm choramines (d)
0
1
2
3
0 1 2 3 4
De
po
sit
s (
mg
)
Water recirculating day
CoC 1 (e)
CoC 4 (f)
0
1
2
3
0 1 2 3 4
De
po
sit
s (
mg
)
Water recirculating day
Blank (f)
PBTC-TKPP 5ppm each (g)
PBTC-TKPP 10ppm each (h)

0
200
400
600
800
1 2 3 4 5
TD
S (
mg
/L)
CoC
Theoretic
Model predicted
Measured
Actual waters concentrated by evaporation are not
suitable for scaling studies because a significant
amount of dissolved solids precipitates during the
evaporation process

Impact of disinfection by chlorine and chloramines
on scaling control effectiveness
0
1
2
3
0 1 2 3 4
De
po
sit
s (
mg
)
Water recirculating day
Blank (f)
PBTC-TKPP 10ppm each (h)
PBTC-TKPP 1ppm chlorine (i)
PBTC-TKPP 1ppm chloramines (j)
0
1
2
3
0 1 2 3 4 5 6 7
De
po
sit
s (
mg
)
Blank (f)
PMA-PBTC 10/5 ppm 1ppm chloramines (k)
PMA-PBTC 20/10ppm 1ppm chloramines (l)
0
5
10
15
20
25
0 1 2 3 4 5 6 7
PM
A (
mg
/L)
Water recirculating day

Relative Corrosivity
(normalized to COC4)
Ammonia is
corrosive
especially in the
absence of PO4
Ammonia is
corrosive in the
absence of TTA

Relative
inhibitivity
(normalized to
COC4)
TKPP is
protective to mild
steel and
aluminum;
TTA is protective
to copper
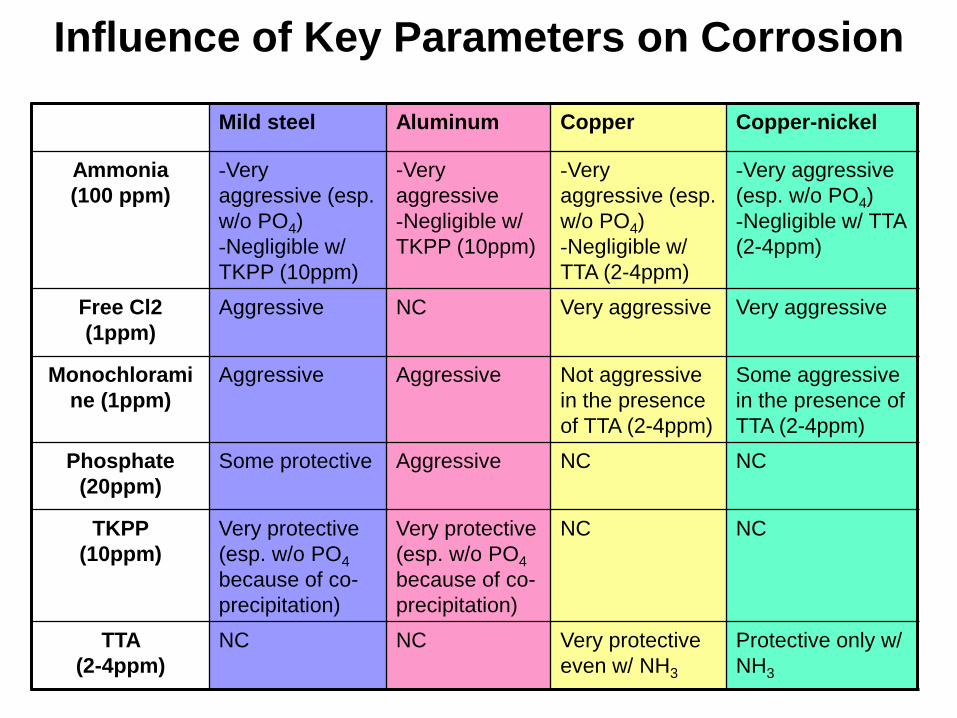
Influence of Key Parameters on Corrosion
Mild steel Aluminum Copper Copper-nickel
Ammonia
(100 ppm)
-Very
aggressive (esp.
w/o PO4)
-Negligible w/
TKPP (10ppm)
-Very
aggressive
-Negligible w/
TKPP (10ppm)
-Very
aggressive (esp.
w/o PO4)
-Negligible w/
TTA (2-4ppm)
-Very aggressive
(esp. w/o PO4)
-Negligible w/ TTA
(2-4ppm)
Free Cl2
(1ppm)
Aggressive NC Very aggressive Very aggressive
Monochlorami
ne (1ppm)
Aggressive Aggressive Not aggressive
in the presence
of TTA (2-4ppm)
Some aggressive
in the presence of
TTA (2-4ppm)
Phosphate
(20ppm)
Some protective Aggressive NC NC
TKPP
(10ppm)
Very protective
(esp. w/o PO4
because of co-
precipitation)
Very protective
(esp. w/o PO4
because of co-
precipitation)
NC NC
TTA
(2-4ppm)
NC NC Very protective
even w/ NH3
Protective only w/
NH3

Biofouling potential of Secondary Treated Municipal
Wastewater in Bench-Scale Experiments
• Heterotrophic bacteria count
in both COC1 and COC4
exceeded the target criteria
of 104 CFU / ml (CTI, 2006)
• As the cycles of
concentration increase,
wastewater may be more
susceptible to biofouling,
due to increase in organic
loading and nutrients
Planktonic HPC
3.00
3.50
4.00
4.50
5.00
5.50
6.00
6.50
7.00
7.50
8.00
0 3 7
Time (days)
Lo
g o
f P
lan
kto
nic
co
un
t (C
FU
/mL
)
FTWW 1 COC, no inhibitor and no biocide
FTWW4COC, no inhibitor and no biocide
FTWW 4 COC,w ith inhibitor,no biocide
3.00
3.50
4.00
4.50
5.00
5.50
6.00
6.50
7.00
3 7
Time (days)
Lo
g o
f S
essil
e c
ou
nt
(CF
U/c
m2)
FTWW 1 COC, no inhibitors, no biocide
FTWW4COC, no inhibitors, no biocide
FTWW 4 COC, w ith inhibitors, no biocide
Sessile HPC
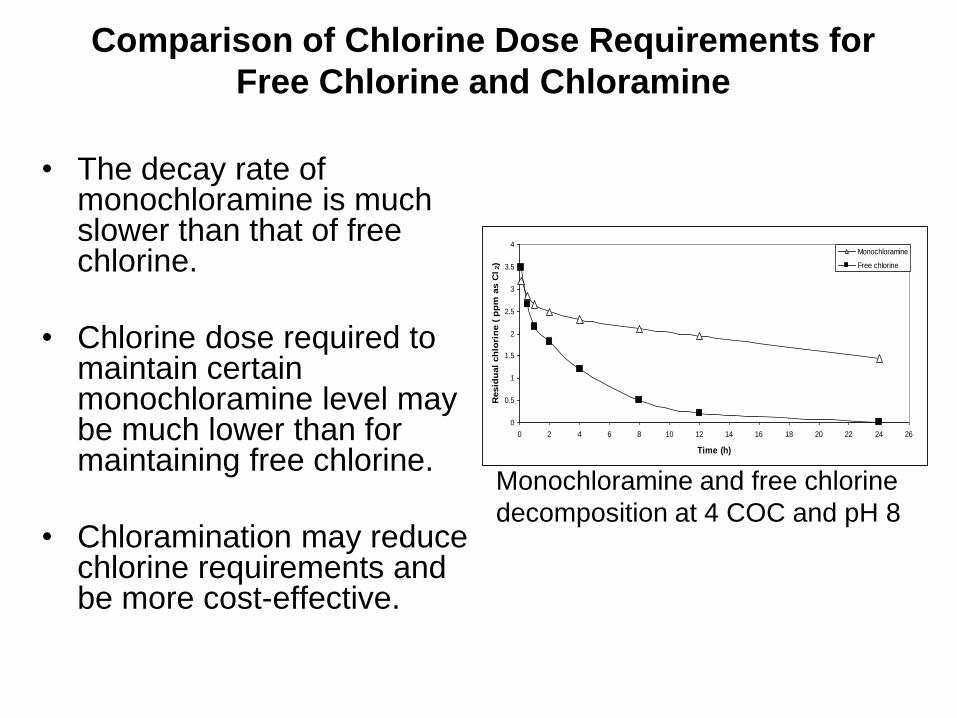
Comparison of Chlorine Dose Requirements for
Free Chlorine and Chloramine
• The decay rate of monochloramine is much slower than that of free chlorine.
• Chlorine dose required to maintain certain monochloramine level may be much lower than for maintaining free chlorine.
• Chloramination may reduce chlorine requirements and be more cost-effective.
0
0.5
1
1.5
2
2.5
3
3.5
4
0 2 4 6 8 10 12 14 16 18 20 22 24 26
Time (h)
Resid
ual
ch
lori
ne (
pp
m a
s C
l2)
Monochloramine
Free chlorine
Monochloramine and free chlorine
decomposition at 4 COC and pH 8
2
3
4
5
6
7
8
9
10
0 2 4 6 8 10 12 14 16 18 20 22 24 26 28
Time (h)
Lo
g o
f H
PC
(C
FU
/ m
L)
0
0.5
1
1.5
2
2.5
Resid
ual ch
lori
ne (
pp
m a
s C
l2)
HPC Monochloramine Total Chlorine
0
1
2
3
4
5
6
0 2 4 6 8 10 12 14 16 18 20 22 24 26
Time (h)
Log o
f H
PC
(C
FU
/ m
L)
0
0.2
0.4
0.6
0.8
1
1.2
Resid
ual chlo
rine (
ppm
as C
l2)
HPC Monochloramine Total Chlorine
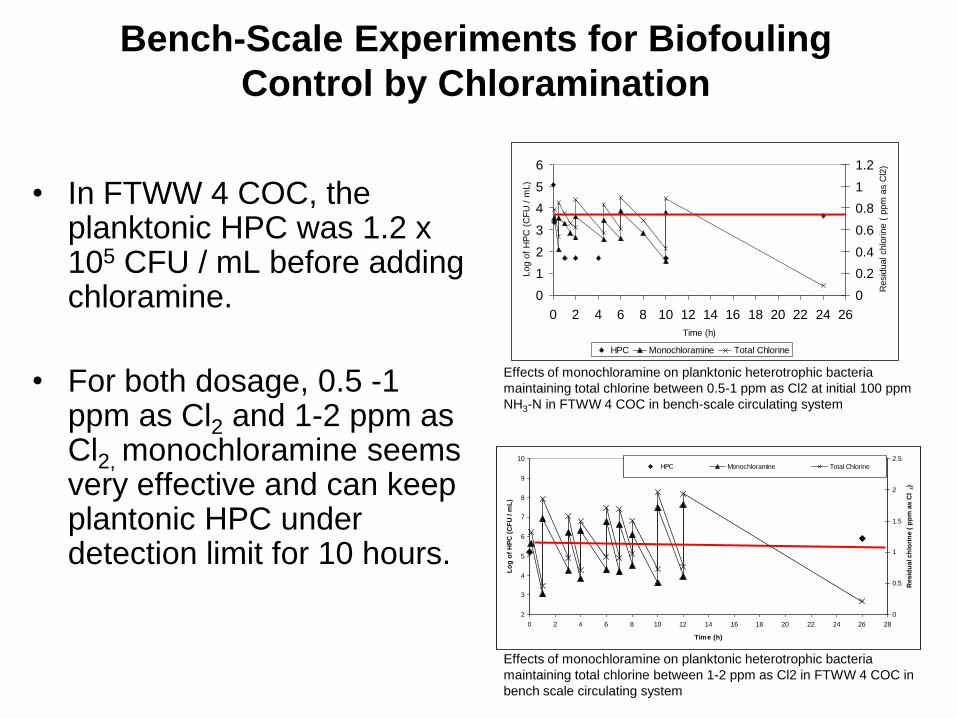
Bench-Scale Experiments for Biofouling
Control by Chloramination
• In FTWW 4 COC, theplanktonic HPC was 1.2 x 10⁵ CFU / mL before adding chloramine.
• For both dosage, 0.5 -1 ppm as Cl2 and 1-2 ppm as Cl2, monochloramine seems very effective and can keep plantonic HPC under detection limit for 10 hours.
Effects of monochloramine on planktonic heterotrophic bacteria
maintaining total chlorine between 0.5-1 ppm as Cl2 at initial 100 ppm
NH3-N in FTWW 4 COC in bench-scale circulating system
Effects of monochloramine on planktonic heterotrophic bacteria
maintaining total chlorine between 1-2 ppm as Cl2 in FTWW 4 COC in
bench scale circulating system
OVERVIEW
• Project goal
• Background and regulatory information
• Materials and methods
– Lab-scale studies
– Pilot-scale studies
• Project accomplishments
– Lab-scale studies
– Pilot-scale studies
• Summary
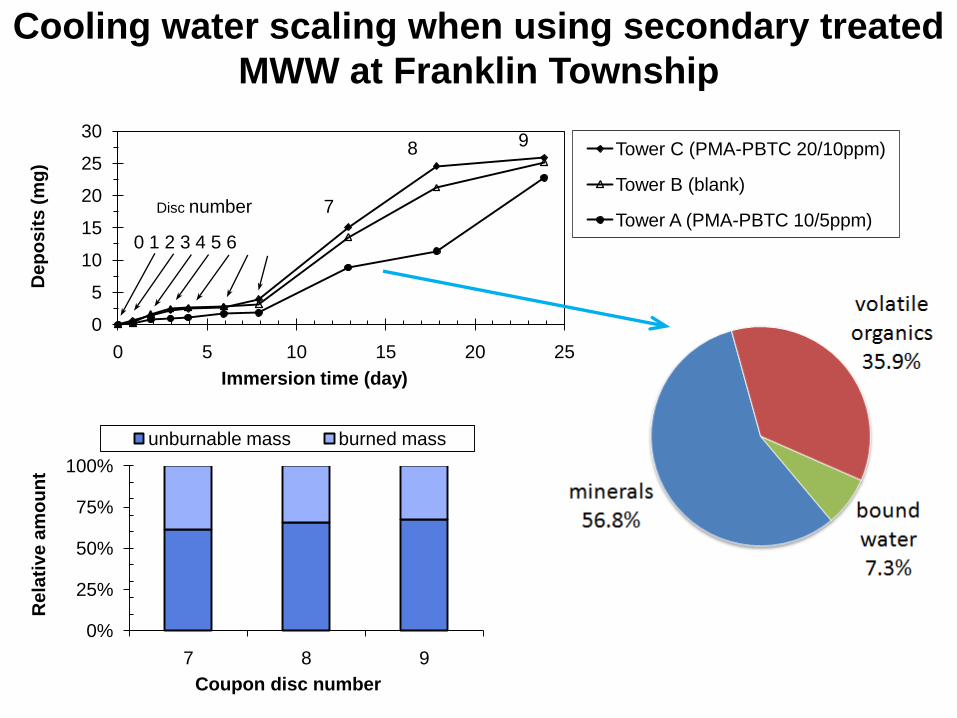
Cooling water scaling when using secondary treated
MWW at Franklin Township
0
5
10
15
20
25
30
0 5 10 15 20 25
De
po
sit
s (
mg
)
Immersion time (day)
Tower C (PMA-PBTC 20/10ppm)
Tower B (blank)
Tower A (PMA-PBTC 10/5ppm)
98
7
0 1 2 3 4 5 6
Disc number
0%
25%
50%
75%
100%
7 8 9
Re
lati
ve
am
ou
nt
Coupon disc number
unburnable mass burned mass
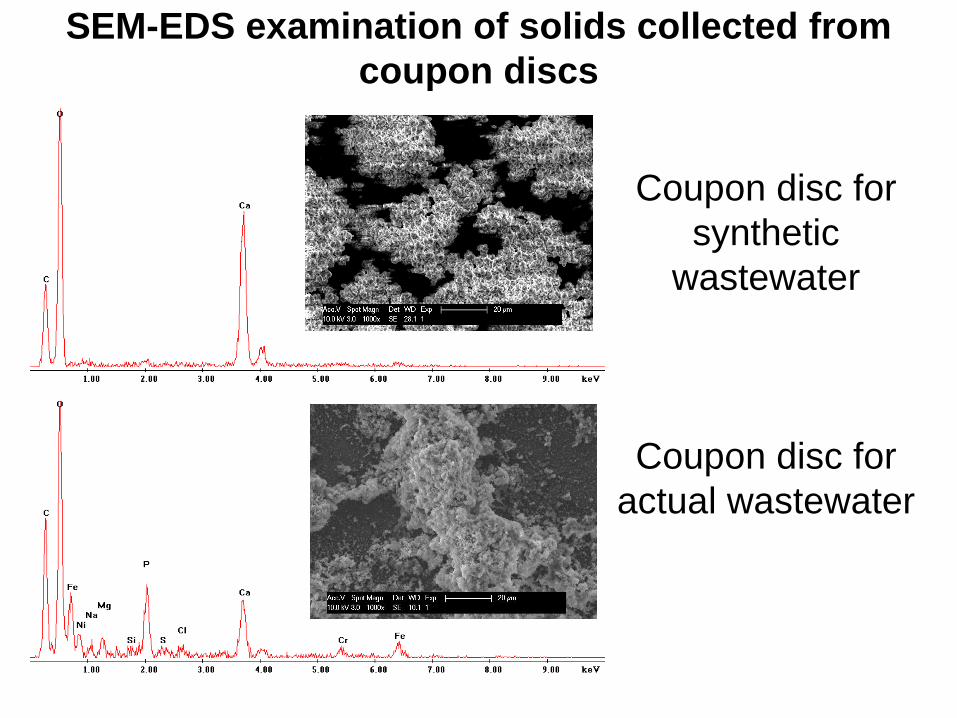
SEM-EDS examination of solids collected from
coupon discs
Coupon disc for
synthetic
wastewater
Coupon disc for
actual wastewater

Bio-growth in the deposited solids of disc coupons

Settled solids at the
bottom of recirculating
water basin
Algal cells found inside
the in-line flowmeter
Nitzschia palea

Corrosion Criteria for
commonly used alloys
1 MPY
3 MPY
5 MPY
10 MPY
0.1 MPY
0.2 MPY
0.3 MPY
0.5 MPY
Excellent
Good
Fair
Poor
Unacceptable
Mild steel piping Copper and copper alloys
Source: Puckorius, (2003) Cooling Water System
Corrosion Guidelines. Process Cooling & Equipment.

0
2
4
6
8
10
12
14
Co
rro
sio
n r
ate
(M
PY
)
TKPP10_TTA
2_MCA1-2
TTA1_MCA1-2 TKPP10_TTA
2_MCA1-2
TTA2_MCA2-3 MCA2-3
mild steel (21 day avg)
mild steel (16-21 day avg)
aluminum (21 day avg)
0
0.02
0.04
0.06
0.08
0.1
0.12
Co
rro
sio
n r
ate
(M
PY
)
TKPP10_TTA
2_MCA1-2
TTA1_MCA1-2 TKPP10_TTA
2_MCA1-2
TTA2_MCA2-3 MCA2-3
copper (21 day avg)
copper-nickel (21 day avg)
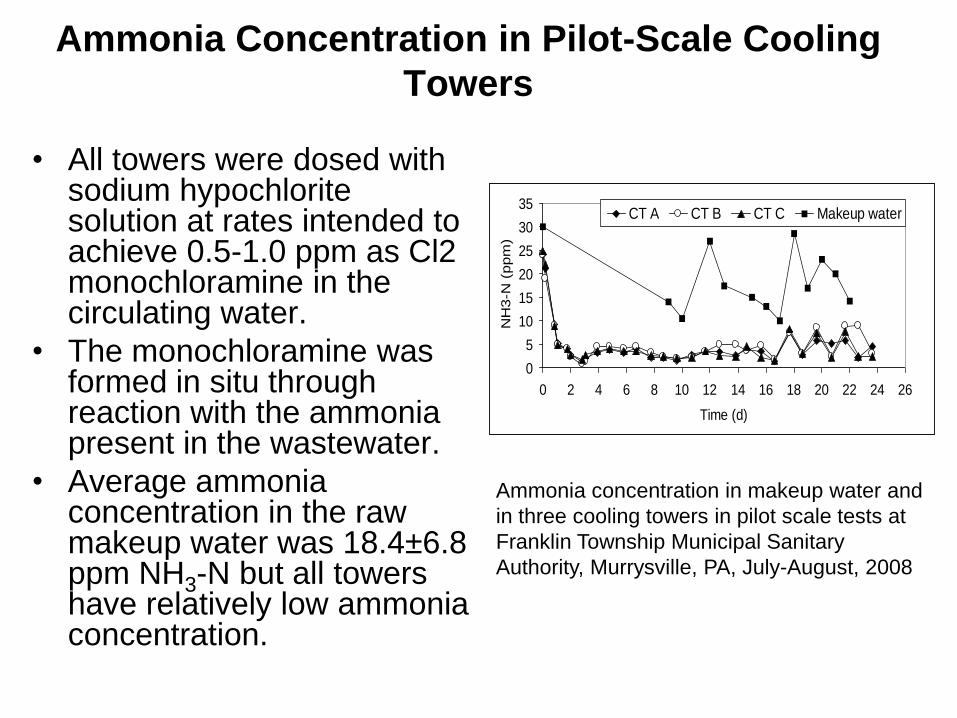
• All towers were dosed with sodium hypochlorite solution at rates intended to achieve 0.5-1.0 ppm as Cl2 monochloramine in the circulating water.
• The monochloramine was formed in situ through reaction with the ammonia present in the wastewater.
• Average ammonia concentration in the raw makeup water was 18.4±6.8 ppm NH3-N but all towers have relatively low ammonia concentration.
Ammonia Concentration in Pilot-Scale Cooling
Towers
Ammonia concentration in makeup water and
in three cooling towers in pilot scale tests at
Franklin Township Municipal Sanitary
Authority, Murrysville, PA, July-August, 2008
0
5
10
15
20
25
30
35
0 2 4 6 8 10 12 14 16 18 20 22 24 26
Time (d)
NH
3-N
(ppm
)
CT A CT B CT C Makeup water
0
0.5
1
1.5
2
2.5
3
3.5
4
0 2 4 6 8 10 12 14 16 18 20 22 24 26
Time (d)
Re
sid
ua
l c
hlo
rin
e (
pp
m a
s C
l2)
0
1
2
3
4
5
6
7CT C total chlorine CT C monochloramine CT C planktonic HPC
log
of
pla
nk
ton
ic H
PC
(C
FU
/ m
L)
0
0.5
1
1.5
2
2.5
3
3.5
4
0 2 4 6 8 10 12 14 16 18 20 22 24 26
Time (d)
Re
sid
ua
l c
hlo
rin
e (
pp
m a
s C
l2)
0
1
2
3
4
5
6
7CT B total chlorine CT B monochloramine CT B planktonic HPC
log
of
pla
nk
ton
ic H
PC
(C
FU
/ m
L)
0
0.5
1
1.5
2
2.5
3
0 2 4 6 8 10 12 14 16 18 20 22 24 26
Time (d)
Re
sid
ua
l c
hlo
rin
e (
pp
m a
s C
l2)
0
1
2
3
4
5
6
7CT A total chlorine CT A monochloramine CTA planktonic HPC
log
of
pla
nk
ton
ic H
PC
(C
FU
/ m
L)
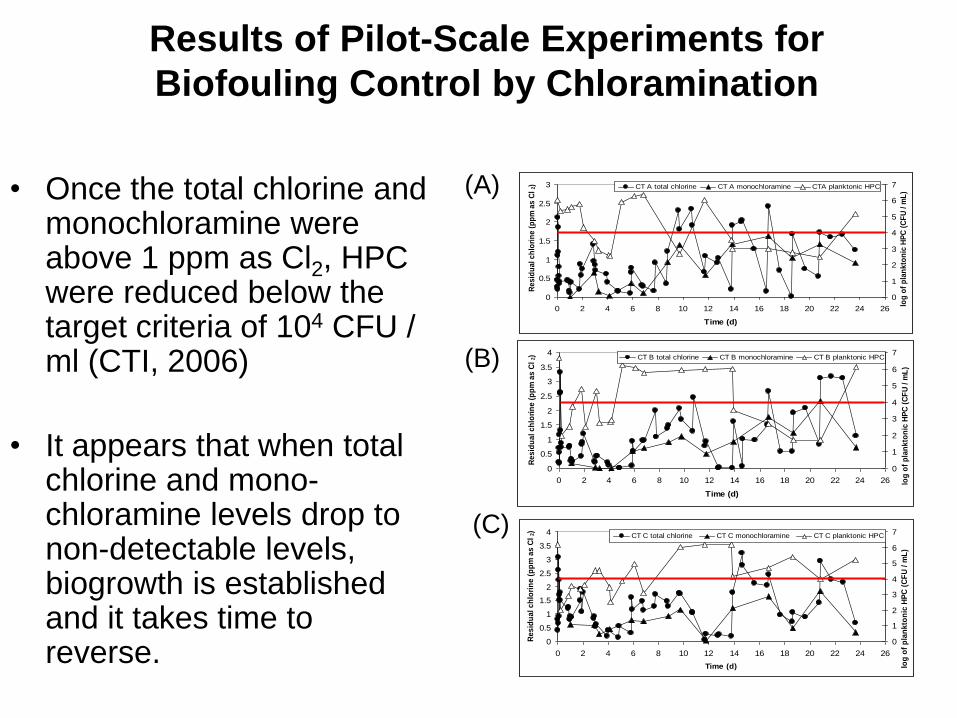
Results of Pilot-Scale Experiments for
Biofouling Control by Chloramination
• Once the total chlorine and monochloramine were above 1 ppm as Cl2, HPC were reduced below the target criteria of 104 CFU / ml (CTI, 2006)
• It appears that when total chlorine and mono-chloramine levels drop to non-detectable levels, biogrowth is established and it takes time to reverse.
(A)
(B)
(C)

SUMMARY: Scaling (1)
• Water pre-concentrated by evaporation is not representative of higher COCs.
• Several scale inhibitors were effective in the absence of disinfectants.
• Addition of chlorine impaired the effectiveness of the antiscalants.
• Phosphate, either present in the makeup water or added as corrosion inhibitor, worsened scaling.
• Ammonia helped mitigate scaling.

SUMMARY: Scaling (3)
• Biomass significantly contributed to scaling; therefore, control of biogrowth in both the makeup tank and the recirculating system is required.
• Addition of phosphate-containing chemicals should be avoided or minimized.
• Less aggressive disinfectants, such as chloramines, worked better with scale control chemicals.
• The beneficial effect of ammonia observed in bench-scale studies could not be relied on as the ammonia was effectively stripped out in the pilot-scaling cooling towers.

SUMMARY: Corrosion (1)
• Methodology of instantaneous corrosion rate (ICR) is established.
• In terms of corrosion, feasibility of using impaired waters in cooling systems can be evaluated through ICR measurement
• From lab experiment, key parameters to corrosion have been identified: – Protective: phosphate, TKPP, TTA
– Aggressive: ammonia, free Cl2 and monochloramine
– Aggressivity of ammonia overcome by TKPP and TTA

SUMMARY: Corrosion (2)
• TKPP failed to reduce corrosion since it co-precipitated with PO4
• MCA 2-3 was more corrosive than MCA 1-2 to all alloys, especially to copper.
• All alloys were covered by deposition, and thus were protected. The deposition also made TTA less effective.
• In general, except for aluminum (pitting in all situations), corrosion rate of alloys were within acceptable range
SUMMARY: Biofouling (1)
• Increase in cycles of concentration can increase the susceptibility of biofoulingfor secondary treated municipal wastewater
• Bench-scale recirculating system results show that chloramination can be an effective oxidizing biocide option forsecondary treated municipal wastewater.
SUMMARY: Biofouling (2)
• Relatively high organic load in secondary treated municipal wastewater makes biofouling control a challenging task
• Ammonia stripping can significantly affect biocidal efficacy of monochloramine formed by adding chlorine directly into the wastewater
• Continuous supply of biocide may be required to control biogrowth in cooling tower using secondary treated municipal wastewater as makeup


![Estimation of speciation and distribution of long-lived ... · [5] Dzombak, D.A. and Morel F.M.M. 1990. Surface Complexation Modeling: Hydrous Ferric Oxide. Wiley-Interscience, New](https://static.fdocuments.us/doc/165x107/5fcd4eebb92f771a0740d83d/estimation-of-speciation-and-distribution-of-long-lived-5-dzombak-da-and.jpg)


![Untitled-3-1 [] · Oblikovanje giba in ples: Luka Bokšan, Žan Brelih Hatunić, Lana Bučevec, Lara Fortuna, Andraž Harauer, Julija Klavžar, Martin Mlakar, Gal Oblak, Nika Vidic,](https://static.fdocuments.us/doc/165x107/6122b7143b86c272f962537d/untitled-3-1-oblikovanje-giba-in-ples-luka-bokan-an-brelih-hatuni-lana.jpg)