Measurement and simulation of radionuclide product yields in iron from 400 AMeV carbon ions
Upload
duongnguyetCategory
view
214download
1
radionuclide fact sheet
Carbon-14 and the environment
Contents characteristics 3origins 3environmental concentrations 4Metrology, analytical techniques and detection limits 6Mobility and bioavailability in terrestrial environments 7Mobility and bioavailability in continental aquatic environments 8Mobility and bioavailability in marine environments 10Mobility and bioavailability in semi-natural ecosystems 10environmental dosimetry 11environmental toxicity 11summary 11review of measurement methods 12usual radioecological models (at equilibrium): terrestrial environments 12food processing 15usual radioecological models (at equilibrium): freshwater environments 15radiotoxicological parameters 17selected bibliography 18
C146
Oliv
ier
Seig
nett
e/M
ikaë
l Laf
onta
n/IR
SN

radionuclide fact sheet carBone-14 and the environment
This fact sheet describes the behaviour of the chemical element in the principal compartments of terrestrial and aquatic ecosystems using the following assumptions. Isotope discrimination is negligible, which is verified for most of the elements considered. When the element has stable isotopes, the behavioural analogy between the stable and radioactive isotopes is accepted implicitly, with the understanding that for naturally-occurring elements, the chemical form and emission environment for anthropogenic discharge may involve pathways and transfer processes different from those identified for the stable natural element.
The radioactive isotope designated in the title of the fact sheet has major radioecological importance with regard to quantity and persistence in the environment, with other isotopes, both radioactive and stable, being cited as well. The information, which has intentionally been simplified, is intended to reflect the state of knowledge on the topic at the time of publication and provide values for the principal radioecological parameters normally used to estimate transfer in the environment and in the food chain in particular.
Written by: J. Garnier-Laplace and S. Roussel-DebetVerified by: C. MourlonDate of first issue: 1 August 2001
Revision: Terrestrial ecosystem: S. Le Dizès-Maurel Continental aquatic ecosystem: F. Alonzo Marine ecosystem: B. Fiévet Metrology: B. Boulet, J. Loyen and J.L. Picolo Concentrations in the environment: P. Renaud
Verified by: D. Boust, K. Beaugelin-Seiller and C. TamponnetDate of revision: 2010
Illustrations: Laurent Stefano
This document is the intellectual property of IRSN and may not be reproduced without its consent.

radionuclide fact sheet carBone-14 and the environment
3
Characteristics
Chemical characteristicsCarbon-14 (14C) is a radioactive carbon isotope present in infinitesimal quantities in the atmosphere. Carbon-12 and carbon-13 are the stable carbon isotopes and respectively represent 98.9% and 1.1% of the total carbon. Carbon-14 only exists in trace quantities. The chemical forms of 14C vary according to the method of production. In the environment, 14C exists in two main forms:
- as 14CO2, it acts as stable carbon dioxide, which means it can remain in gas form in the air, becoming
bicarbonate and carbonate in water;
- during photosynthesis, 14CO2 is incorporated in the organic material, forming its carbon skeleton.
Equilibrium between the specific activity of atmospheric carbon and that of organic material is then finally reached and maintained by carbon recycling.
In the gaseous effluents of boiling water reactors, 14C is 95% 14CO2, 2.5% carbon monoxide (14CO) and
2.5% hydrocarbon. In the gaseous effluents of pressurised water reactors, it is assumed that 80% of 14C is in organic form (14CH
4) whereas 20% is in the form of 14CO
2. In the liquid releases, the carbon chemical
species are carbonates and various organic compounds, their relative quantities being currently unknown.
Nuclear characteristicsCarbon has 15 isotopes, with masses of 8 to 22. Only isotopes 12 and 13 are stable. The radioactive half-life is higher than a year only for carbon-14, its maximum value for the other isotopes being around 20 minutes.
Carbon-14, a b- emitter, gives rise to stable 14N with 100% yield.
14C
Radioactive half-life 5,700 years
Specific activity 1.66 x 10¹¹ Bq.g-1
Precursors 14B, 15B
Decay product 14N
Principal emission through disintegration (emission probability, %)
b- Emax
= 156 keV (100%)
(nucleonica, ec 2011)
Origins
Natural originsNatural 14C results from cosmic neutrons acting on nitrogen atoms in the stratosphere and in the upper troposphere (14N +n 14C+1p). The annual production level is around 1.40 x 10¹⁵ Bq and the atmospheric stock of carbon-14 at equilibrium is around 140 x 1015 Bq (UNSCEAR, 2008). Production fluctuates due to variation in cosmic ray intensity. This fluctuation results from various factors that are not yet well understood, but mainly include the 11-year solar cycle and, on a larger temporal scale, variations in the terrestrial magnetic field that serves as a shield against cosmic rays (Garnier-Laplace et al., 1998).
Artificial origins
Fallout from atmospheric nuclear explosionsDuring nuclear explosions, the emitted neutrons interact with atmospheric nitrogen, as cosmic neutrons do, to form carbon-14, according to the same reaction as above: 14N + n 14C+1p.
Nuclear explosions carried out before 1972 released around 3.5 x 10¹⁷ Bq of carbon-14. Later explosions increased this amount by around 1% (UNSCEAR, 2008).

radionuclide fact sheet carBone-14 and the environmentradionuclide fact sheet carBone-14 and the environment
4
Nuclear reactor releasesIn nuclear reactors, carbon-14 is produced from reactions in the fuel, the core structural materials and the moderator. The production rate depends on the spectrum and the neutron flux, on cross-sections and on the concentration of the following target elements: uranium, plutonium, nitrogen and oxygen. Water in the primary coolant circuit of pressurised water reactors contains excess hydrogen that combines with oxygen from radiolysis. In this reducing environment, compounds such as methane (CH
4) and ethane (C
2H
6) form.
Most of the carbon-14 released in a pressurised water reactor is in the form of alkanes. Various estimations indicate that the annual production rate for a light water reactor (pressurised or boiling water reactor) is between 0.5 and 1.9 x 10¹² Bq.Gwe-1.year -1, with carbon-14 mainly taking organic forms (CH
4). The rest
is released during reprocessing, or remains in the fuel cladding and is later disposed of as solid waste (Garnier-Laplace et al., 1998).
Releases by irradiated fuel reprocessing plantsSpent nuclear fuel 14C is released during the dissolution step in reprocessing plants. Depending on the operating mode, these releases are continuous or discontinuous. In reprocessing plants that use the PUREX process (e.g. the AREVA NC La Hague plant), the 14C is mainly released as CO
2. Commissioning of the UP3
and UP2-800 plants at La Hague resulted in increased annual gaseous 14C releases starting in the early 1990s. In 2009, the gaseous releases of carbon-14 at the site corresponded to 1.45 x 10¹³ Bq and the liquid releases corresponded to 6.12 x 10¹² Bq. Carbon-14 in fuel cladding is not released during dissolution and remains trapped. It is disposed of later as solid waste.
At the Sellafield plant in the UK in 2009, the 14C gaseous releases reached 3.8 x 10¹¹ Bq and the liquid releases, 8.2 x 10¹² Bq (Sellafield Ltd, 2009).
Various sources (medical, industrial, research)In research, carbon-14 is widely used in carbonate form for isotopic labelling of molecules. The activities used are greater than 1 GBq. For example, carbon-14 is used to study metabolic dysfunction related to diabetes and anaemia. It can also be used as a marker to track the metabolism of new pharmaceutical molecules. More generally, carbon-14 can be used to uncover new metabolic pathways, and to identify their normal functioning and any departures from it, e.g. for photosynthesis (Calvin and Benson, 1948) or, more recently, for the methylaspartate cycle in halobacteria (Khomyakova et al., 2011).
It is assumed that all 14C used for labelling molecules will be released into the atmosphere as CO2. According
to UNSCEAR, the annual production of 14C is equivalent to 3 x 10¹⁰ Bq per million inhabitants in developed countries and to 5 x 10¹³ Bq worldwide. This estimation is based on the results of a 1978 US study. A 1987 British estimation led to values at least twice as high (UNSCEAR, 1993).
Environmental concentrations Carbon-14 background in the environment and changes over the last 60 yearsIn the terrestrial environment, the consensus (relatively well supported by observations) is that the specific activity, expressed in becquerels of 14C per kilogram of total carbon, is constant in the environmental components and at equilibrium with the specific activity of atmospheric CO
2 (Roussel-Debet et al., 2006,
Roussel-Debet, 2007, 2009). Uninfluenced by nuclear facilities, the 14C specific activities for the biological compartments of the terrestrial environment reached their maximum values (more than 400 Bq.kg-1 of C) in the mid-1960s, due to fallout from atmospheric nuclear arms testing, then at its height (Figure 1). These activities have slowly decreased since then (by less than 0.5% per year) with the end of testing and the continuous increase in CO
2 from fossil fuels (gasoline, coal, gas). The specific activities of terrestrial
biological compartments are currently around 238 Bq 14C.kg-1 C (2009 measurements), which is very close to 1950 values (226 Bq.kg-1 C), before atmospheric testing.

radionuclide fact sheet carBone-14 and the environment
5
According to Roussel-Debet and Claval (2010). Compilation of bibliographic and OPERA data
0
50
100
150
200
250
300
350
400
450
1950 1960 1970 1980 1990 2000 2010
Bq.k
g-1 C
(an
nual
ave
rage
in t
erre
stri
al e
nvir
onm
ent)
figure 1: changes in average specific activity of carbon-14 (Bq.kg-1 c) for biological compartments sampled in terrestrial environment, during the last 60 years.
In aquatic environments, the specific activity of 14C varies with its dilution in carbon substances, particularly carbonates from old sedimentary rocks lacking carbon-14. Unlike the terrestrial environment, 14C in freshwater ecosystems is not in equilibrium with atmospheric CO
2: freshwater specific activity is
then lower, around 200 Bq.kg-1 C.
Based on the specific activity and the total proportion of carbon in the various environmental matrices (air, plants, animals and thus food products), the activity concentration for the 14C in these matrices can be estimated (Figure 2). The more carbon the product contains (sugars, oils, grains, etc.), the higher the activity.
Leaf vegetables and fruits
Milk
Root vegetables
Fish
Meat
Grains
0 10 20 30 40 50 60 70 80 90 100
Carbone 14 (Bq.kg-1 wet)
figure 2: carbon-14 activity concentration range for food products.
Depending on the proportion of carbon per wet mass unit of food product, the activity concentration of these products varies between less than 15 (lettuce, mussels) and more than 80 (grains) Bq.kg-1 wet. Atmospheric activities vary from 3 x 10⁻² to 7 x 10⁻² Bq.m-3. Carbon-14 thus has the highest environmental activities amongst the radionuclides released from nuclear facilities.

radionuclide fact sheet carBone-14 and the environmentradionuclide fact sheet carBone-14 and the environment
6
Influence of nuclear facilitiesWith atmospheric releases of around 2 x 10¹³ Bq.year-1 of 14C, mainly as CO
2, the AREVA-NC La Hague
plant causes an added carbon-14 activity (above the natural background) regularly detectable in the site’s terrestrial environment, leading to specific activities of 500 to 1,000 Bq.kg-1 C, and occasionally 2,000 Bq.kg-1 C. The corresponding activity concentrations range from 20 to 140 Bq.kg-1 of wet grass or vegetables, compared with a background of around 5 to 20 Bq.kg-1 of wet material in this type of matrix. In milk and meat, this contamination is also significant although much less so, probably due to a feeding component outside the area influenced by the atmospheric releases. Note that the maximum radioactivity in the air at ground level after dispersion, set at 1 Bq.m-3 by the French order authorising AREVA-NC La Hague releases, would correspond to specific activity in plants of 5,000 Bq.kg-1 C, if attained at all times throughout the year.
The carbon-14 addition around nuclear power plants (atmospheric releases of 0.2 to 1 x 10¹² Bq.year-1) is extremely limited: the associated specific activity is around 3 Bq.kg-1 C in addition to the 243 Bq.kg-1 of C representing the average background for 1994-2003 (Roussel-Debet et al., 2006), i.e. an added activity of around 1%. This low level is the result not only of low releases, but also of a clear predominance of releases in the form of methane (CH
4), which plants cannot assimilate.
In rivers, the carbon-14 released by nuclear power plants is diluted in the dissolved stable carbon from carbonates, which are found in sediment. This significantly decreases the specific activity of carbon-14 in physical components. For semi-underwater aquatic plants, dilution also occurs in the atmospheric CO
2
used during photosynthesis; the associated specific activities rarely exceed 400 Bq.kg-1 C. For reasons that remain to be elucidated, fish do not seem to benefit from these dilution phenomena. Their specific activity under the influence of nuclear power plants regularly exceeds 600 Bq.kg-1 C and may reach 1,000 Bq.kg-1 C.
Metrology, analytical techniques and detection limitsCarbon-14 in an environmental sample may be quantified by activity measurement or by atom counting. These two destructive techniques require converting the sample to CO
2 (Maro et al., 2008).
Activity measurementPrinciple: the carbon contained in the test portion is transformed to carbon dioxide from which a sample is prepared for measurement by liquid scintillation (AFNOR, 2006).
Two sample preparation methods are mainly used: combustion by oxydiser and benzene synthesis (Fournier et al., 1999).
Preparation of samples by oxydiserThe sample is placed in a cellulose cone, which is inserted in a platinum filament. The entire unit is placed in a combustion chamber. Voltage applied to the ends of the filament in the presence of O
2 causes combustion
of the sample. The combustion gases are pushed by nitrogen(1) in a column containing Carbosorb®, which traps CO
2 in the form of carbamate. This mixture is eluted from the column by the scintillation liquid and
then collected for measurement.
The oxydiser allows to prepare several samples per day for counting. The test portions are generally less than 0.5 g of the dry sample. They must be rich enough in carbon to undergo a complete oxidation.
Combustion yield must be determined on a reference sample labelled for 14C. This reference sample must be as close as possible in nature and composition to the samples to be analysed.
The 14C naturally contained in the combustion cone cellulose contributes to the increase in background and thus in higher measurement uncertainty. Background must thus be determined as precisely as possible.
The expression of the sample’s activity in Bq of 14C per kg of carbon also requires measuring its elementary carbon content, generally by gas chromatography.
The measurement uncertainty, around 30 to 40% (k=2) for activities of around 260 Bq.kg-1 of carbon (natural level in the environment), makes it difficult to detect low concentrations with this method. This uncertainty can, however, be reduced by increasing the test portions or by combining the measurements of several test portions from the same sample.
1 Allows in the same time steam to be collected for potential 3H assays (see corresponding sheet)

radionuclide fact sheet carBone-14 and the environment
7
14C analysis by benzene synthesisThe sample is burned in the presence of under pressure oxygen in a combustion bomb. The CO
2 produced
is then reduced by a heated reaction with lithium to obtain lithium carbide (Li2C
2), the hydrolysis of which
produces acetylene (C2H
2), which is trimerised by catalysis in benzene (C
6H
6).
The counting vial is prepared by weighing out synthesised benzene and scintillants. Spectroscopy-quality benzene is added if needed.
The activity of the 14C present in the vial is then measured using liquid scintillation. The result can be directly converted into Bq.kg-1 of carbon.
The test portions consist of 7 to 10 g of finely ground, dry sample. The chemical processing time for one sample is 3 days, 2 more days being necessary for counting. Uncertainty at the level of the environmental background corresponds to 6 to 7% (k=2).
This method is suitable for solid dry samples containing high carbon and for water matrices in the form of carbonate (e.g. barium carbonate). For water matrices, CO
2 is extracted from the sample by acid attack
(e.g. addition of orthophosphoric acid) rather than by combustion bomb. The rest of the protocol does not change.
The analysis methods involving oxydiser or benzene synthesis are not well suited for carbon-poor matrices, such as soil and sediment.
Atom countingPrinciple: The carbon present in the sample is extracted in the form of ions. The carbon ions are accelerated, sorted by mass in a magnetic field which alters their trajectory. They are then counted.
14C measurement by accelerator (AMS)After decarbonation and combustion of the sample, the CO
2 obtained is reduced by H
2 in the presence of
powdered iron. The carbon is deposited on the powdered iron and the mixture is pressed into a target to allow for measurement by mass spectrometry. The sample’s 14C activity is calculated by comparing 14C, 13C and 12C beam intensities, measured sequentially, with the CO
2 reference intensities.
The test portions consist in around 0.10 g of material. Uncertainty at the level of the environmental background corresponds to 2 to 3% (k=2).
Accelerator Mass Spectrometry (AMS) is characterised by high sensitivity, which is obtained by good separation of 14C from other ions having the same mass (particularly nitrogen). It is favoured for low-quantity samples or those containing low levels of organic materials (soil, sediment, sea water, air samples, etc.).
Expression of resultsThe activity concentration results are expressed in Bq.kg-1 of dry material, Bq.kg-1 of wet material or Bq.kg-1
of carbon.
Mobility and bioavailability in terrestrial environmentsCarbon-14 data and the models on the fate of this radionuclide in terrestrial environments (Scott et al., 1991; Sheppard et al., 1994; Garnier-Laplace et al., 1998; Fontugne et al., 2004; Tamponnet, 2005a and b) are based on knowledge of the carbon cycle at equilibrium (Ouyang and Boersma,1992). Carbon-14 is integrated in the carbon cycle, which is very complex due to the presence of inorganic and organic carbon, in solid, liquid or gaseous forms (Figure 3).

radionuclide fact sheet carBone-14 and the environmentradionuclide fact sheet carBone-14 and the environment
8
SOIL
ATMOSPHERE
Photosynthesis
Respiration
Emanation from soil
Mineralisation
Animalbiomass
Plantbiomass
CO2
AtmosphericCO2
Wet organic material
Root incorporation
Root respiration
CaCO3 H2CO3
Microbial biomass
Humidified substances
Food chain
figure 3: carbon cycle in soil-plant-animal systems.
SoilThe average quantity of carbon in organic material of cultivated soils is in France around 20 g of carbon per kg of dry soil. The soil solution carbon can be in the form of CO
2, carbonate (CO
32-) or bicarbonate (HCO
3-),
depending on the pH and the quantity of calcium ions.
Plants The average CO
2 quantity of gaseous soil phase varies from 0.5 to 1%. It increases in the presence of plants
(due to root respiration, the pH decreases and the dissolved CO2 increases by around 38% per pH unit).
Root absorption of carbon by plants is negligible. Root incorporation from carbonate ions, poorly understood, appears to represent 5% maximum of the total carbon incorporated in a plant. Most of the carbon is assimilated by leaves as CO
2 during photosynthesis. Isotopic discrimination, which depends on
the plant’s photosynthetic cycle, is negligible (14C / 12C ratio less than 5% maximum between the plant and the atmospheric CO
2).
CO2 emanation from the mineralisation of organic soil residues and root respiration tends to increase the
concentration of CO2 in the air, at the plant cover level. The daily flux of CO
2 released by the soil appears to
be 2 to 13 g per m2. This flux appears to contribute around 10% to the total carbon assimilated by leaves during photosynthesis (Le Dizès-Maurel et al., 2009).
Animals More than 99% of the carbon incorporated by livestock comes from their feed. Carbon from inhalation is negligible, as is carbon from ingestion of water or soil.
Mobility and bioavailability in continental aquatic environmentsCarbon-14 data and the models on the fate of this radionuclide in continental aquatic environments (Sheppard et al., 1994; Garnier-Laplace et al., 1998) are based on knowledge of the carbon cycle at equilibrium (Stumm and Morgan, 1981; Amoros and Petts, 1993).
The 14C organic compounds released by nuclear facilities are incorporated into the organic carbon of the hydrosystem that receives them (Figure 4).
Zooplankton
Poissons

radionuclide fact sheet carBone-14 and the environment
9
ATMOSPHERE
WATERCOLUMN
SEDIMENT
M2++CO3 solidZoobenthos
Bacteria
Bacteria
Protozoa
Fish
ZooplanktonAllochtonous
organicmaterial
Organicmaterial
Allochtonousorganicmaterial
PhytoplanktonPrimary
production
Excretion
Photosynthesis
Inorganic carbon Organic carbon Metabolic processesBiological components
CO2 dissolved
Foodchain
CO2 dissolvedRespiration
2-
figure 4: carbon cycle in freshwater hydrosystems
The inorganic carbon released by nuclear facilities or present in the hydrosystem takes the form of species in the carbonate system (CO
2 aqueous/HCO
3-/CO
32-), which is one of the main chemical systems involved
in controlling freshwater pH. In most running waters, pH varies from 6 to 9, with bicarbonate forms dominating. Carbon-14 in liquid effluents, released as carbonates, is incorporated in the inorganic carbon. Isotopic dilution varies according to atmospheric exchanges, run-off contribution and exchanges with hydrogeological systems. In all cases, the specific activity of inorganic 14C must be considered in terms of the value measured in situ for total CO
2, according to the following equation:
Water and sedimentCarbon-14 is integrated in the carbon cycle of continental hydrosystems where the main forms are organic carbon (dissolved organic carbon/DOC, 1 to 3 mg of carbon per litre; and particulate carbon, which is highly variable from one hydrosystem to another) and inorganic carbon (essentially in the form of dissolved bicarbonate, 1 to 120 mg of carbon per litre). Humic and fulvic acids represent from 50 to 75% of the DOC, whilst the colloidal forms represent 20%. The particulate forms are also varied: allogenic detrital forms, living organisms and compounds from their decay.
PlantsTransfers to plants are governed by photosynthesis. Photosynthesis is mainly carried out by higher plants, periphytic and planktonic algae, and cyanobacteria. In schematic terms, it can be considered the dominant biological process that influences the concentration of inorganic carbon in the hydrosystem; respiration and bacterial fermentation can be considered negligible. On average, the concentration of total carbon in freshwater plants is 5 x 10⁴ mg of carbon per kilogram of wet material.
AnimalsTransfers to animals are governed by ingestion. For aquatic organisms, the processes of respiration and osmoregulation that use inorganic carbon are similarly negligible in the animal’s carbon balance compared to transfers via food ingestion. Carbon concentration in animals varies from one species to another.

radionuclide fact sheet carBone-14 and the environmentradionuclide fact sheet carBone-14 and the environment
10
Mobility and bioavailability in marine environmentsThe mechanisms of 14C transfer in marine and freshwater environments are identical, and the models are based on the assumption that equilibrium is reached due to environmental carbon recycling. Most of the 14C released into the sea is in dissolved inorganic form and is incorporated by organic material. Close to release points, when the variations in the quantities released are rapid and large, equilibrium between the specific activities of the organic material and the sea water is not always reached (Fiévet et al., 2006).
Sea waterIn the Channel, the research of Douville et al. (2004) indicates that the 14C in sea water at Cap de La Hague mainly takes the form of dissolved inorganic carbon (dissolved CO
2, HCO
3-, CO
32-), which is the
predominant form of carbon in sea water, with activities between 300 and 800 Bq.kg-1 of carbon.
SeaweedAs in the case of freshwater plants, the transfer of 14C to seaweed occurs by photosynthesis. The total carbon concentration in seaweed is roughly equivalent to the freshwater plant concentration. This concentration was found to be 8 x 10⁴ mg of carbon per wet kilogram of the brown seaweed Fucus serratus, an example of the algal flora of north-western European coasts. Used as a model compartment for 14C exchanges between sea water and a photosynthetic organism, this alga was used to estimate a biological half-life for 14C of around 5 months. The value of this parameter explains the absence of equilibrium close to the release point (Cap de La Hague), where the variations in seawater 14C concentration are large and rapid, due to the history of releases by the AREVA NC reprocessing plant (Fiévet et al., 2006).
AnimalsAs in the case of the terrestrial and freshwater animals, transfers to marine animals are mainly governed by ingestion. Although cell membranes are permeable to bicarbonates dissolved in water, the quantity of absorbed carbon that they represent is low compared to the carbon incorporated in organic material. The carbon concentration by unit of wet weight in marine animals varies a great deal from one organism to another, especially due to the different water contents (e.g. jellyfish, bivalves, gastropods, echinoderms, crustaceans, fish, etc.). The limpet has been used as a model compartment for 14C exchanges between sea water and a grazing animal, making it possible to estimate a biological half-life for 14C of around 8 months. This half-life integrates all the transfer pathways between the sea water and the gastropod’s flesh, including 14C incorporation from the animal’s food source. Biological half-life is estimated to be around 1 month in mussels, which are used as a model of filtering organisms (Fiévet et al., 2006). Although there is great variability in the speed of carbon recycling between sea water and the different biological compartments, these half-life values clearly explain why a state of equilibrium is not reached where the sea water 14C concentration may vary rapidly, close to release points for example.
Mobility and bioavailability in semi-natural ecosystemsThis section is based on the international literature review conducted for the revision of the IAEA handbook on parameter values for predicting radionuclide transfer in terrestrial and temperate continental aquatic environments (IAEA, 2010).
Forests There is no specific information on the mobility and bioavailability of carbon-14 in forest ecosystems.
Arctic ecosystemsThere is no specific information on the mobility and bioavailability of carbon-14 in arctic ecosystems.
Alpine ecosystems There is no specific information on the mobility and bioavailability of carbon-14 in alpine ecosystems.

radionuclide fact sheet carBone-14 and the environment
11
Environmental dosimetryThe effects of exposure to ionising radiation depend on the quantity of energy absorbed by the target organism, expressed by a dose rate (µGy.h-1). This dose rate is evaluated by applying dose conversion coefficients (DCCs, µGy.h-1 per Bq.unit-1 of mass or volume) to radionuclide concentrations in exposure environments or in organisms (Bq.unit-1 of mass or volume).
The characteristic 14C DCCs were determined without considering decay products and without RBE(2) weighting. Version 2.3 of EDEN software (Beaugelin-Seiller et al., 2006) was used, taking into account shape, dimensions and chemical composition of the organisms and of their environments, as well as their geometrical relations. The modelled species were chosen as examples.
Except in the particular case of the fescue (10-3 µGy.h-1 per Bq.kg-1 wet), internal exposure is generally characterised by DCCs of around 10-5 µGy.h-1 per Bq.kg-1 wet.
External exposure is characterised by lower DCCs that vary according to the organism, within a range of 10-10 and 10-5 µGy.h-1 per Bq.kg-1.
For more details on how to calculate DCC, see the Environmental Dosimetry Sheet.
Environmental toxicity
Element chemotoxicityNot applicable.
Radiotoxicity of the radioactive isotope 14CCarbon-14 is a low b emitter, with a low penetrating power which causes radiation stress mainly due to internal irradiation, if the 14C is incorporated. Carbon-14 is interesting from a radiobiological standpoint because it is integrated in cellular components (proteins, nucleic acids), particularly cellular DNA (Le Dizès-Maurel et al., 2009). The resulting DNA damage, involving molecular breaks, may lead to cell death or induce potentially inheritable mutations.
However, there is currently not enough data to determine whether the ecosystem protection threshold criterion of 10 µGy.h-1 is relevant for 14C (Le Dizès-Maurel et al., 2009). This criterion is consensual in Europe relative to chronic exposure to external gamma radiation.
SummaryEmitting b radiation with a half-life of 5,730 years, Carbon 14 follows the cycle of the stable element C, one of the components of the living materials, in which it is diluted. Carbon-14 is indeed around 10-12 times less abundant than stable carbon. The main source of exposure is due to naturally occurring 14C (cosmogenic origin).
With regard to the impact of chronic releases, the general consensus is that 14C behaves in the same manner as the stable 12C isotope (representing 99% of carbon). Carbon-14 transfers between two compartments of the environment are generally evaluated based on the assumption that the isotopic ratio between the radioactive carbon and the stable carbon (considered to be 12C) is maintained, between the organism and the surrounding environment. This assumes that the transfer of the trace radionuclide 14C is identical to that of 12C and that equilibrium between the two compartments is achieved. Under this assumption, the impact on the environment and populations can only be evaluated for environmental releases and concentrations that are constant over time, generally by using average annual values.
The environmental toxicity of 14C is only related to radioactive emissions of the pure, low-energy b type. This toxicity is mainly the result of internalisation, essentially by ingestion.
2 Relative Biological Effectiveness: expresses how effective different types of radiation are at producing the same biological effect.

radionuclide fact sheet carBone-14 and the environmentradionuclide fact sheet carBone-14 and the environment
12
Review of measurement methodsOxydiser Benzene synthesis AMS
Sample typeDry solid samples, with high carbon content;
water matrices in carbonate form
Samples available in low quantities or with a low
content of organic matter (soil, sediment, sea water,
air samples, etc.)
Test portion 0.5 g dry weight 7 to 10 g dry weight 0.1 g
Measurement uncertainty (k=2) in Bq.kg-1 of carbon
30 to 40% 6 to 7% 2 to 3%
Average sample analysis time*
2 days 5 days 2 days
*The time shown is the "technical time" needed for analysis (processing of the dry sample and measurement). It does not integrate
organisational constraints, such as the fact that heavy instrumentation (e.g. AMS) can generally only be used on a batch of samples, by
campaign and on fixed dates.
Usual radioecological models (at equilibrium): terrestrial environmentsThe conventional evaluations of the radioecological impact of 14C in terrestrial ecosystems remain very empirical, implicitly or explicitly assuming a 14C/12C isotopic equilibrium in the soil-plant-atmosphere system. Recently, models related to biomass have been developed that take into consideration the dynamic nature of acute exposure (Tamponnet, 2005b, Galeriu et al., 2007).
SoilGiven that 14C is easily incorporated in food products and that humans mainly assimilate carbon by ingestion, the soil is not modelled as an exposure environment.
Models based on this assumption overlook the various soil compartments that may influence carbon isotope equilibrium. In addition, these models do not consider the physical/chemical form of the source term (whether the addition to the soil is liquid or solid), which will undergo a process of incorporation in the organic material cycle and/or be mineralised. A simplified model can be employed that uses default transfer factor values based on the assumption of 14C/12C isotopic equilibrium between organic matter in soil and in plant, but this substitute approach appears to be very conservative for evaluating plant transfer.
However, the importance of the soil is reflected in certain models, given that it is a potential source of contamination for plants, as indicated in the following section.
PlantsCarbon-14 transfer to plants is modelled with the assumption that the soil-atmosphere-plant equilibrium is perfectly reached. Most models only integrate atmospheric contamination subsequent to gaseous releases. During photosynthesis, CO
2 is incorporated in organic matter, for which it contributes to the
carbon skeleton. Equilibrium is then rapidly established between the specific activities of atmospheric CO2
and CO2 of organic plant material under construction.
The atmosphere plant transfer is modelled with the assumption that the specific activity (Bq of 14C per kg of 12C) of plant carbon is the same as the atmospheric specific activity. The underlying assumption is that the transfer of the trace radionuclide 14C is identical to 12C transfer and that the two compartments are at equilibrium. This results in the following equation (IAEA, 2010):

radionuclide fact sheet carBone-14 and the environment
13
activity concentration of wet plant material (Bq.kg-1 wet)
mass of carbon in CO2 form by unit volume of air (kg C.m-3 of air) 0.2 x 10⁻³
activity concentration of inorganic 14C in the air (Bq.m-3 of air)
proportion of plant carbon (kg C.kg-1 wet)
Proportion of stable carbon in terrestrial plants ( *1,000, g C.kg-1 wet)(3)
Plant categoryNumber of
Values UsedAverage
Standard deviation
Min. Max.
Grass or greenfeed 25 100 1.31 40 160
Leafy vegetables 49 30 1.40 18 65
Root vegetables 23 46 1.46 22 95
Legumes:SeedsPlant part
75
41059
1.081.46
38041
470110
Fruits 48 62 1.27 31 100
Grains (including rice) 29 390 1.05 360 430
Tubercles 6 1,030 1.20 86 130
Silage 13 130 1.42 65 180
The irrigation water plant transfer is modelled with the assumption that the 14C from irrigation is incorporated via photosynthesis, as a result of emanation of CO
2 from the soil. The plant’s activity
concentration is evaluated by considering the 12C and 14C fluxes emanating from the soil, and the fraction of the carbon flux that comes from the soil and that participates in photosynthesis.
activity concentration of wet plant material (Bq.kg-1 wet)
irrigation water activity concentration (Bq.m-3 )
carbon flux, with carbon in CO2 form emanating from soil (kg.m-2.year -1 ) 0.5
irrigation water depth (m3.m-2.year -1 )
proportion of plant carbon (kgC.kg-1 wet)
fraction of carbon flux from soil and involved in photosynthesis 0.1
Transfer to plants from soil that is contaminated, in particular via liquids, is still poorly understood. The only recent work in this area was conducted as part of radioactive waste disposal studies (BIOPROTA, 2010).
3 In addition to these measured values, there are values calculated from the carbon content in proteins, lipids and carbohydrates
(52%, 77% and 42%, respectively) and the fractions of proteins, lipids and carbohydrates in the plant (Ciba-Geigy, 1981).

radionuclide fact sheet carBone-14 and the environmentradionuclide fact sheet carBone-14 and the environment
14
AnimalsTransfer to animal products is modelled based on the transfer pathway (atmospheric and/or liquid contamination pathway for plants included in the animals' food ration) according to the respective expressions:
activity concentration of animal product (Bq.kg-1 wet or Bq.L-1
wet volume)
activity concentration of inorganic 14C in the air (Bq.m-3 of air)
mass of carbon as CO2 per unit volume of air (kg C.m-3of air)
2 x 10⁻⁴
proportion of carbon from animal product (kg of C.kg-1 wet)
fraction of animal feed that is contaminated = 1 by default (lack of specific local value)(4)
irrigation water activity concentration (Bq.m-3 )
carbon flux, with carbon in CO2 form emanating from soil (kg.m-2.year -1) 0.5
irrigation water depth (m3.m-2.year-1)
fraction of carbon flux from soil and involved in photosynthesis 0.1
Proportion of stable carbon in animal products ( *1,000, g C.kg-1 wet)(5)
Number of Values Used
Average Standard deviation
Min. Max.
MilkCowSheepGoat
811
6511071
1.03--
62--
69--
MeatBeefVealMuttonLambGoatPorkChickenEggs
143121
1252
200160290280170300150160
1.191.21
-1.26
-1.391.231.01
160130
-230
-170110160
290190
-320
-550200160
4 Factor is used to integrate the fact that animals can be fed with concentrates or from far-away sources that are not
contaminated. The value of this factor should be based on local agricultural practices. If a site-specific value is not available,
must be conservatively set to 1.
5 Some of these values were measured directly (Garnier-Laplace et al., 1998), but most were calculated from the carbon quantities in
proteins, lipids and carbohydrates (52%, 77% and 42%, respectively) and from the protein, lipid and carbohydrate fractions in animal
products (Ciba-Geigy, 1981).
radionuclide fact sheet carBone-14 and the environment
15
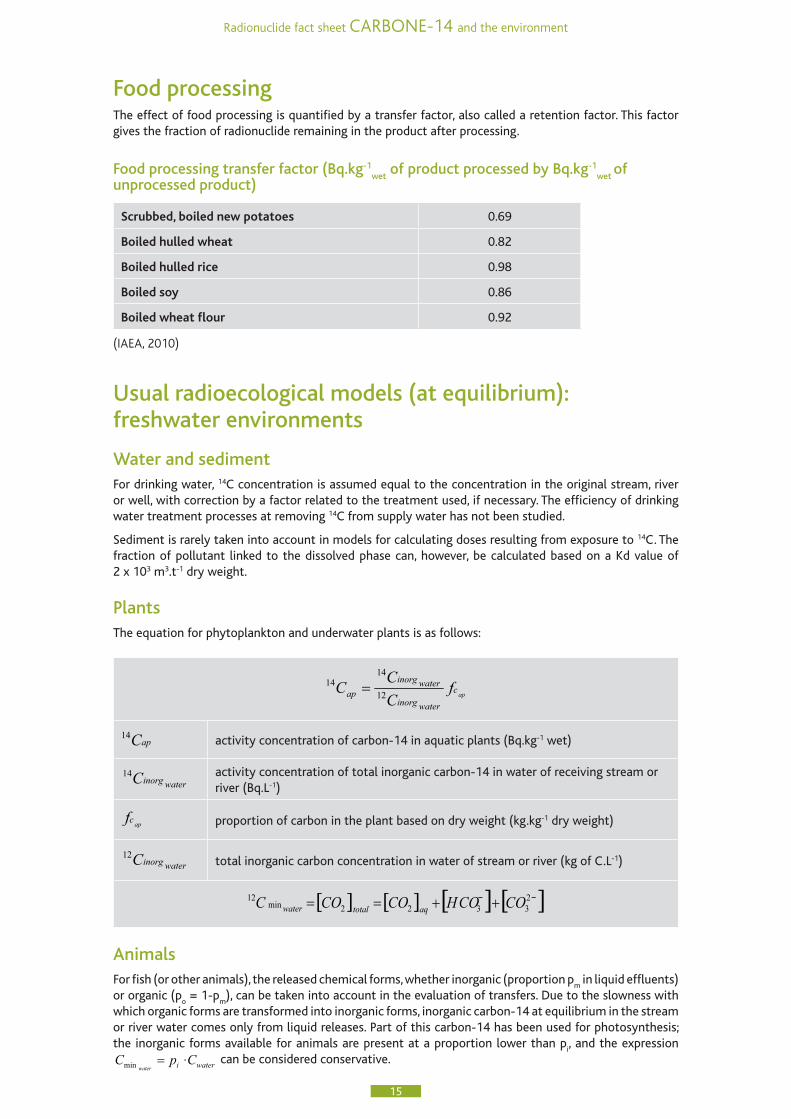
Food processingThe effect of food processing is quantified by a transfer factor, also called a retention factor. This factor gives the fraction of radionuclide remaining in the product after processing.
Food processing transfer factor (Bq.kg-1wet
of product processed by Bq.kg-1wet
of unprocessed product)
Scrubbed, boiled new potatoes 0.69
Boiled hulled wheat 0.82
Boiled hulled rice 0.98
Boiled soy 0.86
Boiled wheat flour 0.92
(iaea, 2010)
Usual radioecological models (at equilibrium): freshwater environments
Water and sedimentFor drinking water, 14C concentration is assumed equal to the concentration in the original stream, river or well, with correction by a factor related to the treatment used, if necessary. The efficiency of drinking water treatment processes at removing 14C from supply water has not been studied.
Sediment is rarely taken into account in models for calculating doses resulting from exposure to 14C. The fraction of pollutant linked to the dissolved phase can, however, be calculated based on a Kd value of 2 x 10³ m3.t-1 dry weight.
PlantsThe equation for phytoplankton and underwater plants is as follows:
activity concentration of carbon-14 in aquatic plants (Bq.kg-1 wet)
activity concentration of total inorganic carbon-14 in water of receiving stream or river (Bq.L-1)
proportion of carbon in the plant based on dry weight (kg.kg-1 dry weight)
total inorganic carbon concentration in water of stream or river (kg of C.L-1)
AnimalsFor fish (or other animals), the released chemical forms, whether inorganic (proportion p
m in liquid effluents)
or organic (po = 1-p
m), can be taken into account in the evaluation of transfers. Due to the slowness with
which organic forms are transformed into inorganic forms, inorganic carbon-14 at equilibrium in the stream or river water comes only from liquid releases. Part of this carbon-14 has been used for photosynthesis; the inorganic forms available for animals are present at a proportion lower than p
i, and the expression
can be considered conservative.
radionuclide fact sheet carBone-14 and the environmentradionuclide fact sheet carBone-14 and the environment
16
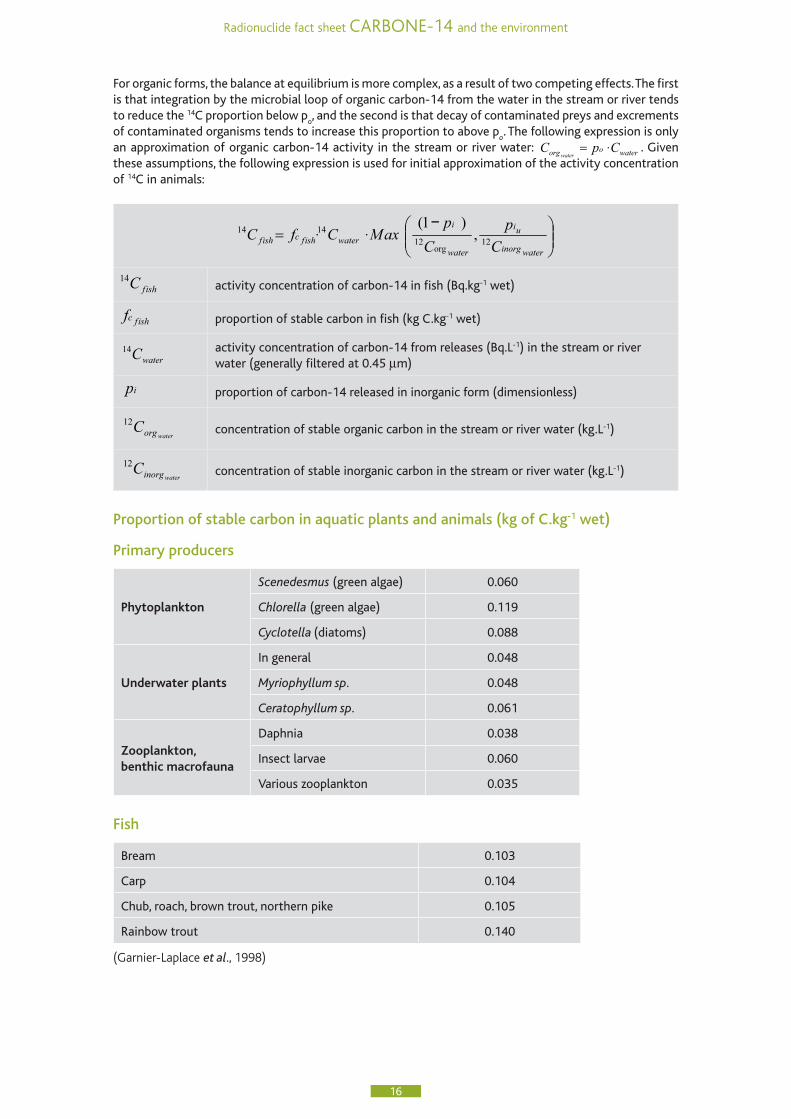
For organic forms, the balance at equilibrium is more complex, as a result of two competing effects. The first is that integration by the microbial loop of organic carbon-14 from the water in the stream or river tends to reduce the 14C proportion below p
o, and the second is that decay of contaminated preys and excrements
of contaminated organisms tends to increase this proportion to above po. The following expression is only
an approximation of organic carbon-14 activity in the stream or river water: . Given these assumptions, the following expression is used for initial approximation of the activity concentration of 14C in animals:
activity concentration of carbon-14 in fish (Bq.kg-1 wet)
proportion of stable carbon in fish (kg C.kg-1 wet)
activity concentration of carbon-14 from releases (Bq.L-1) in the stream or river water (generally filtered at 0.45 mm)
proportion of carbon-14 released in inorganic form (dimensionless)
concentration of stable organic carbon in the stream or river water (kg.L-1)
concentration of stable inorganic carbon in the stream or river water (kg.L-1)
Proportion of stable carbon in aquatic plants and animals (kg of C.kg-1 wet)
Primary producers
Phytoplankton
Scenedesmus (green algae) 0.060
Chlorella (green algae) 0.119
Cyclotella (diatoms) 0.088
Underwater plants
In general 0.048
Myriophyllum sp. 0.048
Ceratophyllum sp. 0.061
Zooplankton, benthic macrofauna
Daphnia 0.038
Insect larvae 0.060
Various zooplankton 0.035
Fish
Bream 0.103
Carp 0.104
Chub, roach, brown trout, northern pike 0.105
Rainbow trout 0.140
(Garnier-laplace et al., 1998)

radionuclide fact sheet carBone-14 and the environment
17
Radiotoxicological parametersTerrestrial environment Dose conversion coefficients (DCCs), expressed in wet weight
Model species
Internal DCC(µGy.h-1 per Bq.kg-1)
External DCC(µGy.h-1 per Bq.kg-1 of soil)
Earthworm 2.66 x 10⁻⁵ 3.65 x 10⁻⁹
Snail 2.66 x 10⁻⁵ 7.17 x 10⁻¹⁰
Titmouse 2.66 x 10⁻⁵ nd
Rabbit 2.66 x 10⁻⁵ 3.88 x 10⁻¹⁰
Fescue 3.55 x 10⁻³ 1.66 x 10⁻⁹
Freshwater Dose conversion coefficients (DCCs), expressed in wet weight
Internal DCC External DCC
Model species (µGy.h-1 per Bq.kg-1)
Sediment(µGy.h-1 per Bq.kg-1)
Water(µGy.h-1 per Bq.L-1)
Seaweed 7.00 x 10-6 nd* 2.64 x 10-5
Daphnia 2.55 x 10⁻⁵ nd 1.28 x 10⁻⁶
Chironomid 2.49 x 10⁻⁵ 1.97 x 10⁻⁶ nd
Roach 2.66 x 10⁻⁵ nd 4.25 x 10⁻⁸
Common carp 2.66 x 10⁻⁵ 1.74 x 10⁻¹² 1.15 x 10⁻⁸
Water milfoil 2.85 x 10⁻⁵ 3.45 x 10⁻⁹ 1.48 x 10⁻⁹
nd*: DCC not determined due to the distance or to the shield effect of sediment
Sea water Dose conversion coefficients (DCCs), expressed in wet weight
Internal DCC External DCC
Model species (µGy.h-1 per Bq.kg-1)
Sediment(µGy.h-1 per Bq.kg-1)
Water(µGy.h-1 per Bq.L-1)
Phytoplankton 8.75 x 10-6 nd* 2.03 x 10-5
Fucus (tuft) 2.66 x 10⁻⁵ 2.86 x 10⁻¹³ 7.92 x 10⁻⁹
Zooplankton 2.63 x 10⁻⁵ nd 4.67 x 10⁻⁷
Lobster 2.66 x 10⁻⁵ 7.13 x 10⁻¹² 1.88 x 10⁻⁸
Summer flounder 2.66 x 10⁻⁵ 7.04 x 10⁻¹¹ 3.55 x 10⁻⁸
Mackerel 2.66 x 10⁻⁵ nd 2.76 x 10⁻⁸
nd*: DCC cannot be determined because of distance

radionuclide fact sheet carBone-14 and the environmentradionuclide fact sheet carBone-14 and the environment
18
Selected bibliography AFNOR (2006). Mesure de la radioactivité dans l’environnement. - Partie 2 : mesurage de l’activité du carbone 14 par scintillation liquide dans les matrices carbonées de l’environnement (indice de classement : M60-812-2). Norme NF M60-812-2, 35 p.
Amoros C and Petts GE (1993). Hydrosystèmes fluviaux. Collection d’écologie, Masson, Paris.
Beaugelin-Seiller K, Jasserand F, Garnier-Laplace J, Gariel JC (2006). Modelling the radiological dose in non-human species: principles, computerization and application. Health Phys, 90 : 485-493.
BIOPROTA (2010). C-14 Long-Term Dose Assessment: Data Review, Scenario Development, and Model Comparison, WORKSHOP REPORT, L. Limer & M. Thorne (Eds), April 2010.
Calvin M and Benson AA (1948) .The Path of Carbon in Photosynthesis. Science 107: 476-480
Ciba-Geigy (1981). “Units of measurement, body fluids, composition of the body, nutrition”, Geigy Scientific Tables, Vol. 1, 8th edn, Ciba-Geigy Ltd., Basel (1981).
CE - Commission Européenne (2009). Nucleonica...web driven nuclear science. (application available at http://www.nucleonica.net/Application/CommunityPortal.aspx, page consulted 6 June 2011).
Douville E, Fiévet B, Germain P, Fournier M (2004). Radiocarbon behaviour in seawater and the brown algae Fucus serratus in the vicinity of the COGEMA La Hague spent fuel reprocessing plant (Goury) - France. J Environ Radioactiv 77: 335-368
Fiévet B, Voiseux C, Rozet M, Masson M, Bailly du Bois P (2006). Transfer of radiocarbon liquid releases from the AREVA La Hague spent fuel reprocessing plant in the English Channel. J Environ Radioactiv 90: 173-196
Fontugne M, Maro D, Baron Y, Hatté, Hébert D, Douville E (2004). 14C sources and distribution in the vicinity of La Hague nuclear reprocessing plant: Part 1. Terrestrial environment. Radiocarbon, 46 : 827-830.
Fournier M, Henry A, Loyen J (1999). Oxidiser et benzène : deux méthodes de mesurage du 14C, Journées Techniques CETAMA « Mesures et analyses dans les matrices environnementales et biologiques ».
Galeriu D, Melintescu A, Beresford NA, Crout NMJ, Peterson R, Takeda H (2007) Modelling 3H and 14C transfer to farm animals and their products under steady state conditions. J Environ Radioactiv, 98:205-217
Garnier-Laplace J, Roussel-Debet S, Calmon P (1998). Modélisation des transferts du carbone 14, émis par les réacteurs à eau pressurisée en fonctionnement normal, dans l’environnement proche du site. Rapport IPSN/DPRE/SERE 98/007, IRSN, Cadarache.
IAEA (2010). Handbook of Parameter Values for the Prediction of Radionuclide Transfer in Terrestrial and Freshwater Environments, Technical Reports, Series No.472, IAEA, Vienna.
Khomyakova M, Bükmez Ö, Thomas LK, Erb TJ, Berg IA (2011) A Methylaspartate cycle in Haloarchaea. Science 331:334-337.
Le Dizès-Maurel S, Maro D, Lebaron-Jacobs L, Masson M (2009). « Carbone 14 », in Chapitre 31, Toxicologie nucléaire environnementale et humaine. Ménager M.T., Garnier-Laplace J., Goyffon M. (Coord). Editions Tex&Doc – Lavoisier., 603-618.
Maro D, Masson M, Fiévet B, Bailly du Bois P, Connan O, Boust D, Germain P (2008). Analyse critique des données disponibles de carbone 14 et de tritium dans le nord Cotentin et en Manche. IRSN, rapport DEI/SECRE 2008-006.
Ouyang Y and Boersma L (1992). Dynamic oxygen and carbon dioxide exchange between soil and atmosphere. Soil Science Soc Am J, 56: 1695-1710.
Roussel-Debet S (2007). Evaluation of 14C doses since the end of the 1950s in metropolitan France. Radioprotection, 42 (3): 297-313.
Roussel-Debet S. (2009). Bilan des mesures OPERA terrestre 2007-2008. IRSN, rapport DEI/SESURE 2009-19.
Roussel-Debet S, Gontier G, Siclet F, Fournier M (2006). Distribution of carbon 14 in the terrestrial environment close to French nuclear power plants. J Environ Radioact 87(3): 246-259
Roussel-Debet S, Claval D (2010). Constat radiologique régional -Étude prototype « Val de Loire ».IRSN, rapport DEI/SESURE 2010-22.
Sellafield Ltd ( 2009). Monitoring our Environment. Discharges and Monitoring in the United Kingdom.
radionuclide fact sheet carBone-14 and the environment
19
Annual Report 2009. (can be consulted at http://www.sellafieldsites.com/UserFiles/File/Monitoring%20Our%20Environment%202009.pdf. Consulted 17 November 2010).
Scott EM, Baxter MS and McCartney M (1991). Considerations on the modelling of environmental radiocarbon. BIOMOVS. Symposium on the validity of environmental transfer models. Stockholm (Sweden). SSI. 498 Swedish Radiation Protection Institute, Stockholm (Sweden), pp. 107-123.
Sheppard S.C., Amiro B.D., Sheppard M.I., Stephenson M., Zach R., Bird G.A. (1994). Carbon-14 in the biosphere: Modeling and porting research for the Canadian Nuclear Fuel Waste Management program, Waste-Management, 14 (5) 445-456
Stumm W and Morgan JJ (1981). Aquatic Chemistry. John Wiley, New-York.
Tamponnet C (2005a) Dynamics of Carbon 14 in soils: A review, Radioprotection 40: 465-470.
Tamponnet C (2005b) Modelling Tritium and Carbon in the environment: A biomass-oriented approach, Radioprotection 40: 713-719.
United Nations Scientific Committee on the Effects of Atomic Radiation (UNSCEAR) (1993). Report of the general assembly, with annexes. United Nations publications, New York.
United Nations Scientific Committee on the Effects of Atomic Radiation (UNSCEAR) (2008). Sources and effects of ionizing radiation. Report Vol. I: sources. United Nations publications, New York.