Radiometric profiling of tropospheric temperature ... using historical radiosonde data and neural...
11
submitted to Radio Science, Nov. 2001 1 Radiometric profiling of tropospheric temperature, humidity and cloud liquid Randolph Ware 1,2 , Fredrick Solheim 1 , Richard Carpenter 3 , Juergen Gueldner 4 , James Liljegren 5 , Thomas Nehrkorn 6 , Francois Vandenberghe 7 1 Radiometrics Corporation, Boulder CO 80301 2 University Corporation for Atmospheric Research, Boulder CO 80307 3 Weather Decision Technologies Inc., Norman OK 73069 4 Deutscher Wetterdienst, Lindenberg Germany D-15864 5 Argonne National Laboratory, Argonne IL 60439 6 Atmospheric and Environmental Research Inc., Lexington MA 02421 7 National Center for Atmospheric Research, Boulder CO 80307 Abstract Radiometric profiling provides accurate and reliable temperature and humidity profiles up to 10 km height, and low resolution cloud liquid profiles. Retrieval algorithms are derived for specific locations using historical radiosonde data and neural network or regression analysis. Radiometric profiler measurements can be used for high resolution mesoscale modeling and forecasting -- par- ticularly when combined with wind profiler measurements. Other applications include boundary layer dispersion and transport forecasting, obser- vation of supercooled water for weather modifi- cation operations and for identification of aircraft icing hazards, correction of tropospheric effects in artillery targeting, and studies of clouds and climate-related radiative transfer. Introduction A radiometric profiler has been developed that provides temperature and humidity soundings up to 10 km height and low resolution one-layer cloud liquid soundings during clear and cloudy conditions 1 . The instrument (shown at right) passively observes 12 discrete frequencies in regions of the microwave spectrum dominated by emission from water vapor (near 22 GHz) and molecular oxygen (near 60 GHz). The instrument observes radiation intensity or “brightness temperature” at 5 frequencies near the water vapor feature and 7 on the oxygen feature, and in one infrared channel. The water vapor feature is pressure broadened at decreasing altitudes. Thus, by fitting the line shape information 1. Model TP/WVP-3000 manufactured by Radiometrics Corporation, Boulder, Colorado.
Transcript of Radiometric profiling of tropospheric temperature ... using historical radiosonde data and neural...

submitted to Radio Science, Nov. 2001 1
Radiometric profiling of tropospheric temperature, humidity and cloud liquid
Randolph Ware1,2, Fredrick Solheim1, Richard Carpenter3, Juergen Gueldner4,
James Liljegren5, Thomas Nehrkorn6, Francois Vandenberghe7
1Radiometrics Corporation, Boulder CO 803012University Corporation for Atmospheric Research, Boulder CO 80307
3Weather Decision Technologies Inc., Norman OK 730694Deutscher Wetterdienst, Lindenberg Germany D-15864
5Argonne National Laboratory, Argonne IL 604396Atmospheric and Environmental Research Inc., Lexington MA 02421
7National Center for Atmospheric Research, Boulder CO 80307
Abstract
Radiometric profiling provides accurate and reliable temperature and humidity profiles up to 10km height, and low resolution cloud liquid profiles. Retrieval algorithms are derived for specificlocations using historical radiosonde data and neural network or regression analysis. Radiometricprofiler measurements can be used for high resolution mesoscale modeling and forecasting -- par-ticularly when combined with wind profiler measurements. Other applications include boundarylayer dispersion and transport forecasting, obser-vation of supercooled water for weather modifi-cation operations and for identification ofaircraft icing hazards, correction of troposphericeffects in artillery targeting, and studies ofclouds and climate-related radiative transfer.
Introduction
A radiometric profiler has been developed thatprovides temperature and humidity soundings upto 10 km height and low resolution one-layercloud liquid soundings during clear and cloudy
conditions1. The instrument (shown at right)passively observes 12 discrete frequencies inregions of the microwave spectrum dominatedby emission from water vapor (near 22 GHz)and molecular oxygen (near 60 GHz).
The instrument observes radiation intensity or “brightness temperature” at 5 frequencies near thewater vapor feature and 7 on the oxygen feature, and in one infrared channel. The water vaporfeature is pressure broadened at decreasing altitudes. Thus, by fitting the line shape information
1. Model TP/WVP-3000 manufactured by Radiometrics Corporation, Boulder, Colorado.
submitted to Radio Science, Nov. 2001 2
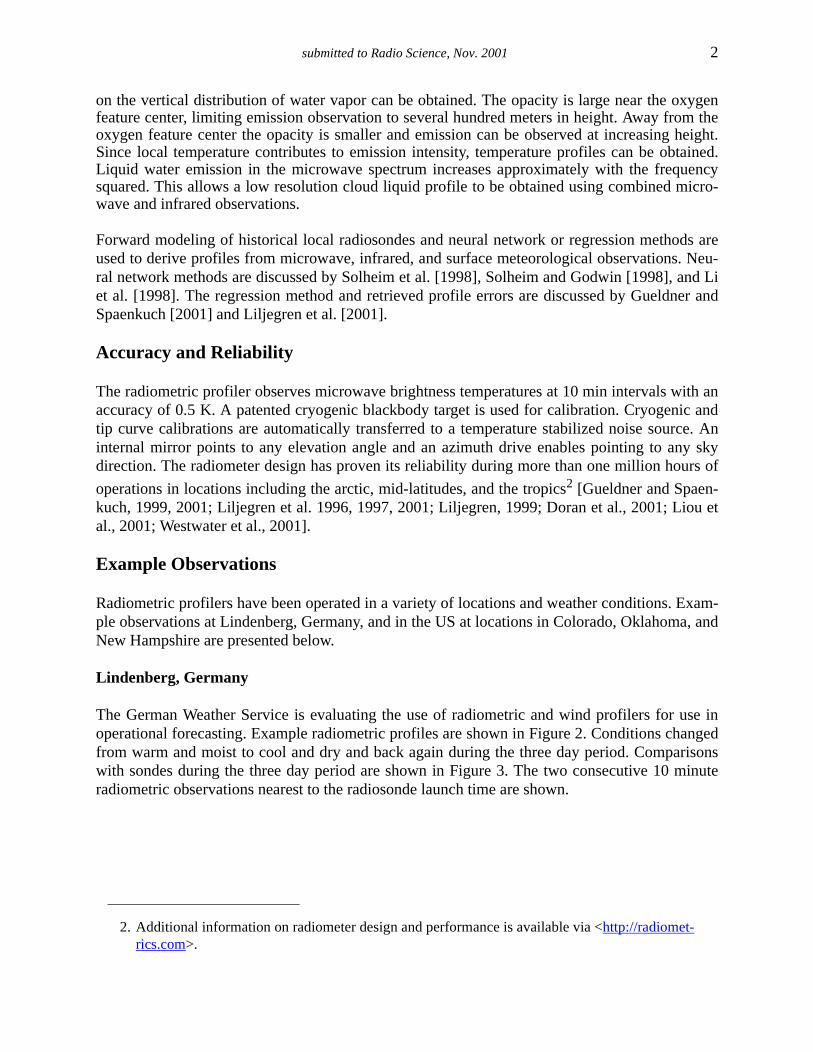
on the vertical distribution of water vapor can be obtained. The opacity is large near the oxygenfeature center, limiting emission observation to several hundred meters in height. Away from theoxygen feature center the opacity is smaller and emission can be observed at increasing height.Since local temperature contributes to emission intensity, temperature profiles can be obtained.Liquid water emission in the microwave spectrum increases approximately with the frequencysquared. This allows a low resolution cloud liquid profile to be obtained using combined micro-wave and infrared observations.
Forward modeling of historical local radiosondes and neural network or regression methods areused to derive profiles from microwave, infrared, and surface meteorological observations. Neu-ral network methods are discussed by Solheim et al. [1998], Solheim and Godwin [1998], and Liet al. [1998]. The regression method and retrieved profile errors are discussed by Gueldner andSpaenkuch [2001] and Liljegren et al. [2001].
Accuracy and Reliability
The radiometric profiler observes microwave brightness temperatures at 10 min intervals with anaccuracy of 0.5 K. A patented cryogenic blackbody target is used for calibration. Cryogenic andtip curve calibrations are automatically transferred to a temperature stabilized noise source. Aninternal mirror points to any elevation angle and an azimuth drive enables pointing to any skydirection. The radiometer design has proven its reliability during more than one million hours of
operations in locations including the arctic, mid-latitudes, and the tropics2 [Gueldner and Spaen-kuch, 1999, 2001; Liljegren et al. 1996, 1997, 2001; Liljegren, 1999; Doran et al., 2001; Liou etal., 2001; Westwater et al., 2001].
Example Observations
Radiometric profilers have been operated in a variety of locations and weather conditions. Exam-ple observations at Lindenberg, Germany, and in the US at locations in Colorado, Oklahoma, andNew Hampshire are presented below.
Lindenberg, Germany
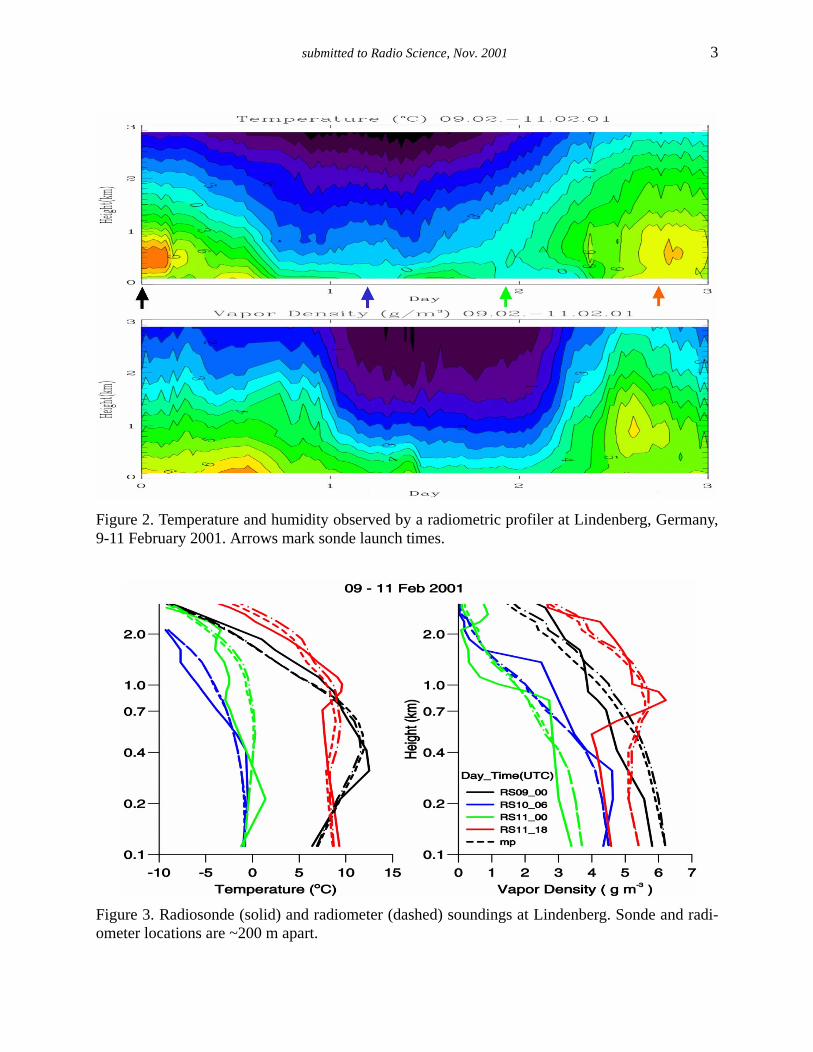
The German Weather Service is evaluating the use of radiometric and wind profilers for use inoperational forecasting. Example radiometric profiles are shown in Figure 2. Conditions changedfrom warm and moist to cool and dry and back again during the three day period. Comparisonswith sondes during the three day period are shown in Figure 3. The two consecutive 10 minuteradiometric observations nearest to the radiosonde launch time are shown.
2. Additional information on radiometer design and performance is available via <http://radiomet-rics.com>.
submitted to Radio Science, Nov. 2001 3
Figure 2. Temperature and humidity observed by a radiometric profiler at Lindenberg, Germany,9-11 February 2001. Arrows mark sonde launch times.
Figure 3. Radiosonde (solid) and radiometer (dashed) soundings at Lindenberg. Sonde and radi-ometer locations are ~200 m apart.
submitted to Radio Science, Nov. 2001 4
We attribute the difference in the surface humidity measurements to the difference in measure-ment locations. The sonde was launched at ground level in an area free of vegetation whereas theradiometer is located on the roof of a three story building several hundred meters distant. Other-wise, the radiometer and sonde measurements of temperature and humidity changes during thethree day period are in good agreement.
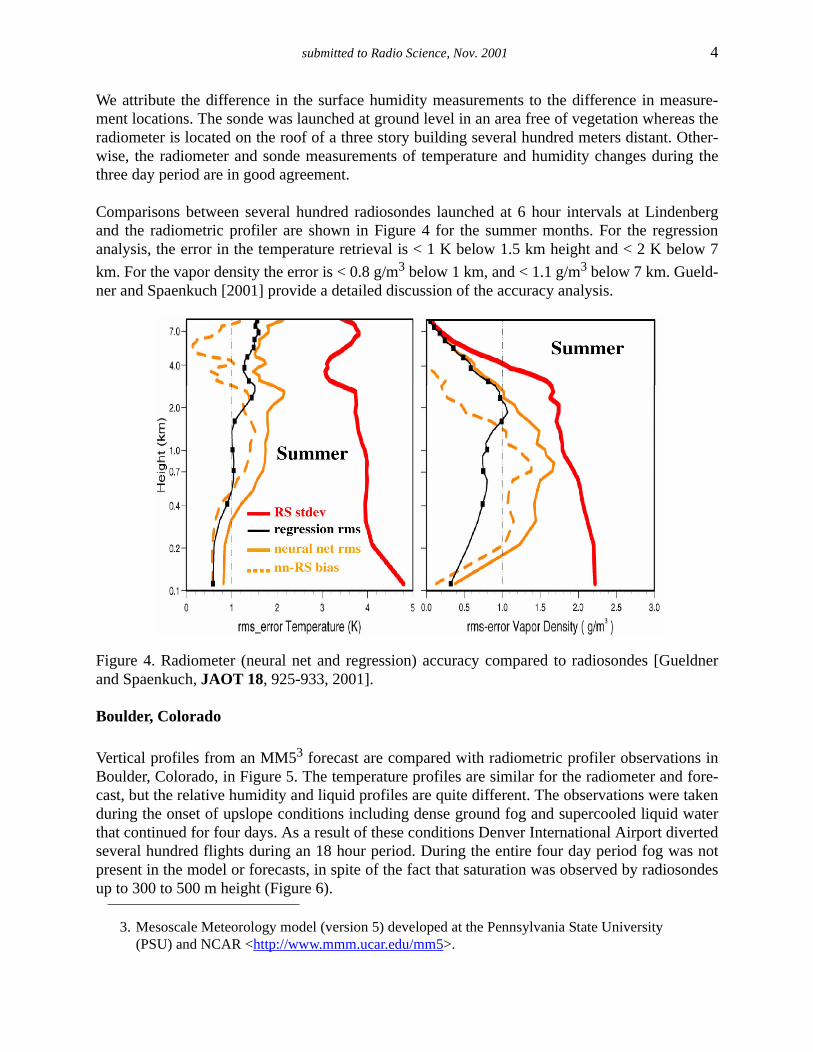
Comparisons between several hundred radiosondes launched at 6 hour intervals at Lindenbergand the radiometric profiler are shown in Figure 4 for the summer months. For the regressionanalysis, the error in the temperature retrieval is < 1 K below 1.5 km height and < 2 K below 7
km. For the vapor density the error is < 0.8 g/m3 below 1 km, and < 1.1 g/m3 below 7 km. Gueld-ner and Spaenkuch [2001] provide a detailed discussion of the accuracy analysis.
Figure 4. Radiometer (neural net and regression) accuracy compared to radiosondes [Gueldnerand Spaenkuch, JAOT 18, 925-933, 2001].
Boulder, Colorado
Vertical profiles from an MM53 forecast are compared with radiometric profiler observations inBoulder, Colorado, in Figure 5. The temperature profiles are similar for the radiometer and fore-cast, but the relative humidity and liquid profiles are quite different. The observations were takenduring the onset of upslope conditions including dense ground fog and supercooled liquid waterthat continued for four days. As a result of these conditions Denver International Airport divertedseveral hundred flights during an 18 hour period. During the entire four day period fog was notpresent in the model or forecasts, in spite of the fact that saturation was observed by radiosondesup to 300 to 500 m height (Figure 6).
3. Mesoscale Meteorology model (version 5) developed at the Pennsylvania State University (PSU) and NCAR <http://www.mmm.ucar.edu/mm5>.

submitted to Radio Science, Nov. 2001 5
Figure 5. Forecast (left) and radiometric (right) temperature (K), relative humidity (%) and cloud
liquid (g/m3) profiles at Boulder, Colorado, 16 Feb 2001. Three hour 10-km MM5 forecasts arebased on the 16 Feb 00 Z analysis. Supercooled fog was observed after 11:30 UT but was notforecast.
Figure 6. Denver radiosonde (50-km SE of Boulder) showing fog consistent with radiometricobservations but not forecast.
Max. liquid= 0.15 g/m3
Max. liquid= 0.30 g/m3
submitted to Radio Science, Nov. 2001 6
A senior modeler explained that the Denver radiosonde is 50 km southeast of Boulder and thattopography and the weighting of surface measurements between Denver and Boulder make it dif-
ficult to model and forecast low level conditions including upslope and fog4. This shortcoming ofradiosonde-based modeling presents an opportunity for radiometric profiling. Efforts are cur-
rently underway5 to assimilate radiometric profiler (and wind radar) observations into local highresolution models to improve modeling and forecasting of fog and short term precipitation.
Lamont, Oklahoma
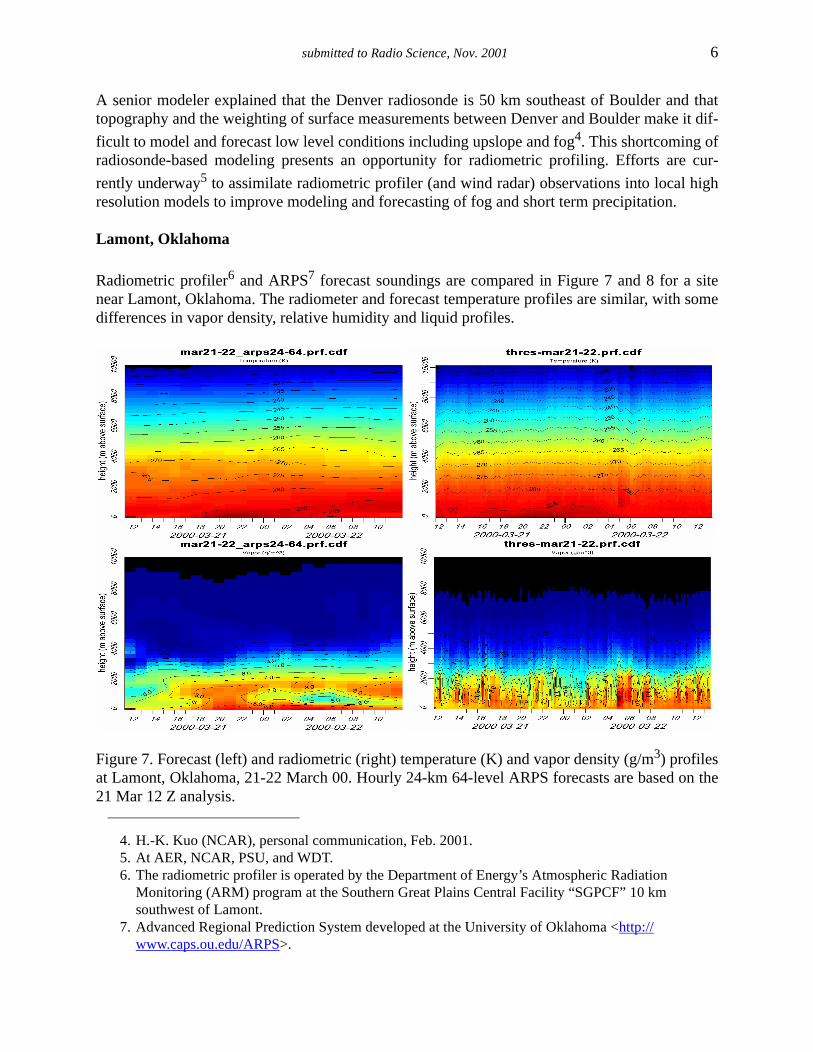
Radiometric profiler6 and ARPS7 forecast soundings are compared in Figure 7 and 8 for a sitenear Lamont, Oklahoma. The radiometer and forecast temperature profiles are similar, with somedifferences in vapor density, relative humidity and liquid profiles.
Figure 7. Forecast (left) and radiometric (right) temperature (K) and vapor density (g/m3) profilesat Lamont, Oklahoma, 21-22 March 00. Hourly 24-km 64-level ARPS forecasts are based on the21 Mar 12 Z analysis.
4. H.-K. Kuo (NCAR), personal communication, Feb. 2001.5. At AER, NCAR, PSU, and WDT.6. The radiometric profiler is operated by the Department of Energy’s Atmospheric Radiation
Monitoring (ARM) program at the Southern Great Plains Central Facility “SGPCF” 10 km southwest of Lamont.
7. Advanced Regional Prediction System developed at the University of Oklahoma <http://www.caps.ou.edu/ARPS>.
submitted to Radio Science, Nov. 2001 7
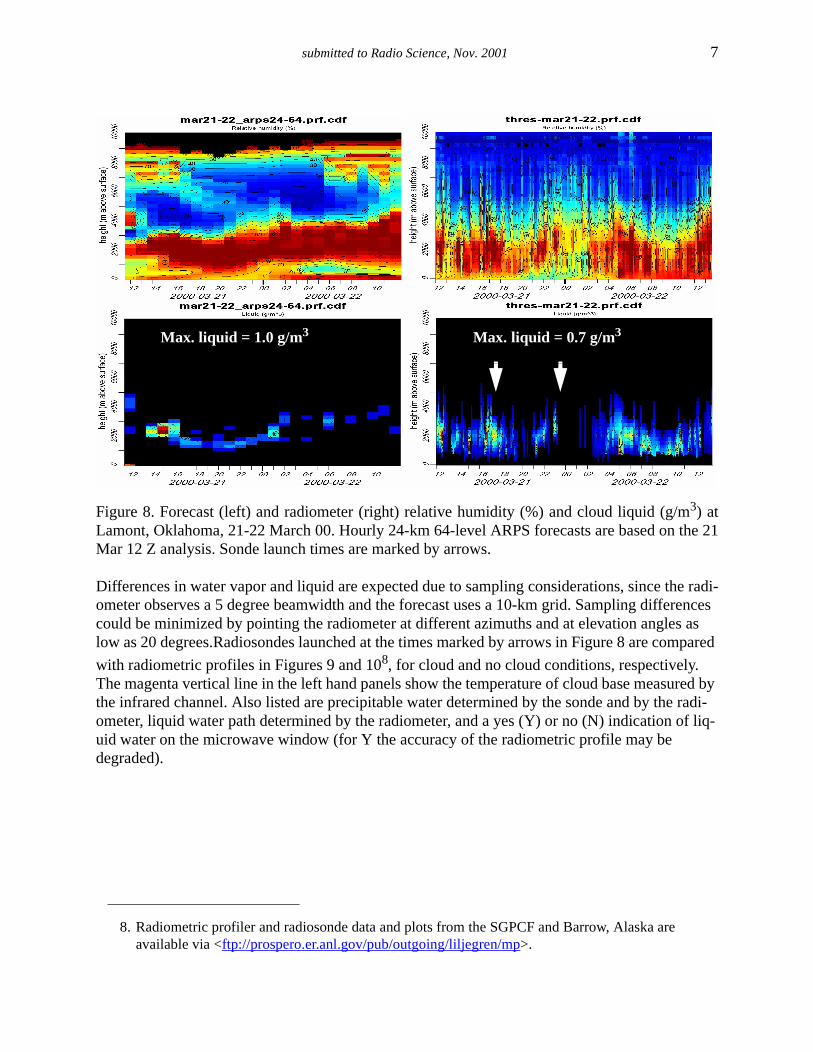
Figure 8. Forecast (left) and radiometer (right) relative humidity (%) and cloud liquid (g/m3) atLamont, Oklahoma, 21-22 March 00. Hourly 24-km 64-level ARPS forecasts are based on the 21Mar 12 Z analysis. Sonde launch times are marked by arrows.
Differences in water vapor and liquid are expected due to sampling considerations, since the radi-ometer observes a 5 degree beamwidth and the forecast uses a 10-km grid. Sampling differences could be minimized by pointing the radiometer at different azimuths and at elevation angles as low as 20 degrees.Radiosondes launched at the times marked by arrows in Figure 8 are compared
with radiometric profiles in Figures 9 and 108, for cloud and no cloud conditions, respectively. The magenta vertical line in the left hand panels show the temperature of cloud base measured by the infrared channel. Also listed are precipitable water determined by the sonde and by the radi-ometer, liquid water path determined by the radiometer, and a yes (Y) or no (N) indication of liq-uid water on the microwave window (for Y the accuracy of the radiometric profile may be degraded).
8. Radiometric profiler and radiosonde data and plots from the SGPCF and Barrow, Alaska are available via <ftp://prospero.er.anl.gov/pub/outgoing/liljegren/mp>.
Max. liquid = 1.0 g/m3 Max. liquid = 0.7 g/m3

submitted to Radio Science, Nov. 2001 8
Figure 9. Radiosonde and radiometer measurements during cloud liquid conditions at Lamont,Oklahoma, 21 March 2000, 17:31 UT.
Figure 10. Radiosonde and radiometer measurements during conditions of no cloud liquid atLamont, Oklahoma, 21 March 2000, 23:30 UT.

submitted to Radio Science, Nov. 2001 9
Mt. Washington, New Hampshire
Cloud liquid profile measurements were obtained during April 1999 at Mt. Washington, New
Hampshire, using special balloon-based cloud liquid water sensors9. Comparisons with radiomet-ric profiler retrievals of cloud liquid are shown in Figure 11. The best and worst cases out of atotal of 24 comparisons are shown. The radiometric cloud liquid profile was calculated using therelative humidity profile, cloud base temperature determined from the zenith infrared measure-ment, and integrated liquid water. In spite of expected sampling differences between the in-situliquid density measurement along the balloon ascent path and the radiometric observation over a5 degree zenith beamwidth, reasonably good agreement is seen.
Figure 10. Radiosonde (in situ along trajectory) and radiometer (zenith 5 degree beamwidth) liq-uid profiles at Mt. Washington (1999). Best and worst cases from 24 comparisons are shown.
Cloud liquid profile measurements can be used to initialize mesoscale models and for studies ofcloud physics and climate-related radiative transfer. The radiometric profiler presents an opportu-nity to obtain reliable cloud liquid profiles in an automated fashion at fixed locations.
Mobile Profiling
Figure 1. Short term (1 to 12 hr) forecasting has notoriously low skill level. During the first hour of forecasting the skill level is reasonably good because the weather conditions in the sonde-based analysis tend to prevail. However, skill levels tend to degrade until the next radiosonde is used for a new analysis 12 hours later. Local radiometric and wind profiler data can be assimilated at
9. The special “ATEK” sondes carried vibrating wires for sensing supercooled cloud liquid water density. The accuracy of the sensor is estimated at ~50% [M. Politovich, NCAR, personal com-munication, 1999].
submitted to Radio Science, Nov. 2001 10
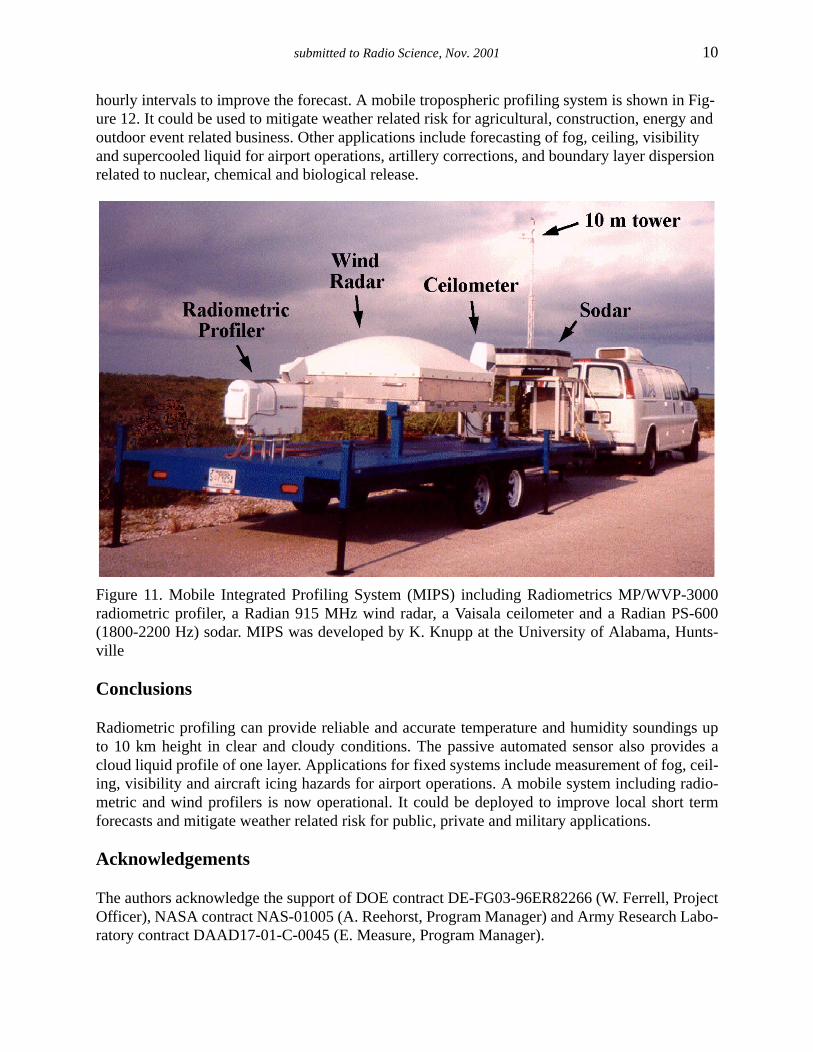
hourly intervals to improve the forecast. A mobile tropospheric profiling system is shown in Fig-ure 12. It could be used to mitigate weather related risk for agricultural, construction, energy and outdoor event related business. Other applications include forecasting of fog, ceiling, visibility and supercooled liquid for airport operations, artillery corrections, and boundary layer dispersion related to nuclear, chemical and biological release.
Figure 11. Mobile Integrated Profiling System (MIPS) including Radiometrics MP/WVP-3000radiometric profiler, a Radian 915 MHz wind radar, a Vaisala ceilometer and a Radian PS-600(1800-2200 Hz) sodar. MIPS was developed by K. Knupp at the University of Alabama, Hunts-ville
Conclusions
Radiometric profiling can provide reliable and accurate temperature and humidity soundings upto 10 km height in clear and cloudy conditions. The passive automated sensor also provides acloud liquid profile of one layer. Applications for fixed systems include measurement of fog, ceil-ing, visibility and aircraft icing hazards for airport operations. A mobile system including radio-metric and wind profilers is now operational. It could be deployed to improve local short termforecasts and mitigate weather related risk for public, private and military applications.
Acknowledgements
The authors acknowledge the support of DOE contract DE-FG03-96ER82266 (W. Ferrell, ProjectOfficer), NASA contract NAS-01005 (A. Reehorst, Program Manager) and Army Research Labo-ratory contract DAAD17-01-C-0045 (E. Measure, Program Manager).

submitted to Radio Science, Nov. 2001 11
References
Doran, J., S. Zhong, J. Liljegren, and C. Jakob, A comparison of cloud properties at a coastal site and inland site at the North Slope of Alaska, J. Geophys. Res. (submitted) 2001.
Gueldner, J., and D. Spaenkuch, Results of Year-Round Remotely Sensed Integrated Water Vapor by Ground-Based Microwave Radiometry, J. Appl. Meteorol., 38, 981-988, 1999.
Gueldner, J., and D. Spaenkuch, Remote Sensing of the Thermodynamic State of the Atmospheric Boundary Layer by Ground-Based Microwave Radiometry, J. Atmos. Oceanic Tech., 18, 925-933, 2001.
Li, L., J. Vivekanandan, C. Chan, and L. Tsang, Microwave Radiometric Technique to Retrieve Vapor, Liquid, and Ice, Part I - Development of a Neural Network-Based Inversion Method, IEEE Trans. Geosci. Rem. Sens., 35, 224-236, 1997.
Liljegren, J., and B. Lesht, Measurements of Integrated Water Vapor and Cloud Liquid Water from Microwave Radiometers at the DOE ARM Cloud and Radiation Testbed in the U.S. Southern Great Plains, Proc. Int. Geophys. Rem. Sens. Symp. 96, Lincoln, NB, 1675-1677, 1996.
Liljegren, J., Integrated Water Vapor and Cloud Liquid Water at MCTEX, Proc. 7th Atmos. Rad. Meas. (ARM) Sci. Team Meet., San Antonio, Texas, March 3-7, 1997.
Liljegren, J., Observations of integrated water vapor and cloud liquid water at the SHEBA ice sta-tion, Microwave Radiometry and Remote Sensing of the Earth’s Surface and Atmo-sphere, edited by P. Pampaloni and S. Paloscia, 155-163, VSP Press, 1999.
Liljegren, J., E. Clothiaux, S. Kato, B. Lesht, F., Initial Evaluation of Profiles of Temperature, Water Vapor and Cloud Liquid Water from a New Microwave Profiling Radiometer, Proc. 5th Am. Met. Society (AMS) Symp. Int. Obs. Systems, Albuquerque, NM, 14-19 Jan. 2001.
Liou, Y.-A., Y.-T. Teng, T. Van Hove, and J. Liljegren, Comparison of precipitable water observa-tions in the near tropics by GPS, microwave radiometer, and radiosondes, J. App. Meteorol., 4, 5-15, 2001.
Solheim, F., J. Godwin, E. Westwater, Y. Han, S. Keihm, K. Marsh, and R. Ware, Radiometric Profiling of Temperature, Water Vapor, and Liquid Water using Various Inversion Methods, Rad. Sci., 33, 393-404, 1998.
Solheim, F., and J. Godwin, Passive ground-based remote sensing of atmospheric temperature, water vapor, and cloud liquid water profiles by a frequency synthesized microwave radiometer, Meterol. Zeit., 7, 370-376,1998.
Westwater, E., B. Stankov, D. Cimini, Y. Han, J. Shaw, B. Lesht, and C. Long, Radiosonde Humidity Soundings and Microwave Radiometers during Nauru99, J. Atm. Oceanic Tech. (submitted) 2001.