RADIOACTIVITY IN THE BIOTA AT ISLANDS OF THE … · sampling program for radiobiologi-cal analyses...
20
m7Fk79 Biology and Medicine 410911 RADIOACTXVIW IN THE BIOTA AT ISJANDS OF THE CEN’NWL PACIFIC 1954 - 1958 Ralph F. Palumbo Laboratory of Radiation Biology University of Washington Seattle, Washington Lauren R. Donaldson Director 326V?SDR!O%fY’Nf’RGY RG COMMISS1ON —— IFebruary 15, 1962 Operated by the University of Washingto under Contract No. AT (45-1)1385 with th United States Atomic Energy Commission
Transcript of RADIOACTIVITY IN THE BIOTA AT ISLANDS OF THE … · sampling program for radiobiologi-cal analyses...
m7Fk79Biology and Medicine
410911
RADIOACTXVIW IN THE BIOTA AT ISJANDS OF THE CEN’NWL PACIFIC1954 - 1958
Ralph F. Palumbo
Laboratory of Radiation BiologyUniversity of Washington
Seattle, Washington
Lauren R. DonaldsonDirector
326V?SDR!O%fY’Nf’RGY
RG COMMISS1ON——IFebruary 15, 1962
Operated by the University of Washingtounder Contract No. AT (45-1)1385 with thUnited States Atomic Energy Commission

RADIOACTIVITY IN THE BIOTA AT ISLANDS
OF THE CENTML PACIFIC, 1954 - 1958
Evaluations of the radioactive contamination of bio-
logical organisms in the vicinity of the Eniwetok Test Site
have been made by the Laboratory of Radiation Biology since
Operation Crossroads in 1946. In order to determine the
geographical limits of the contamination, the area of the
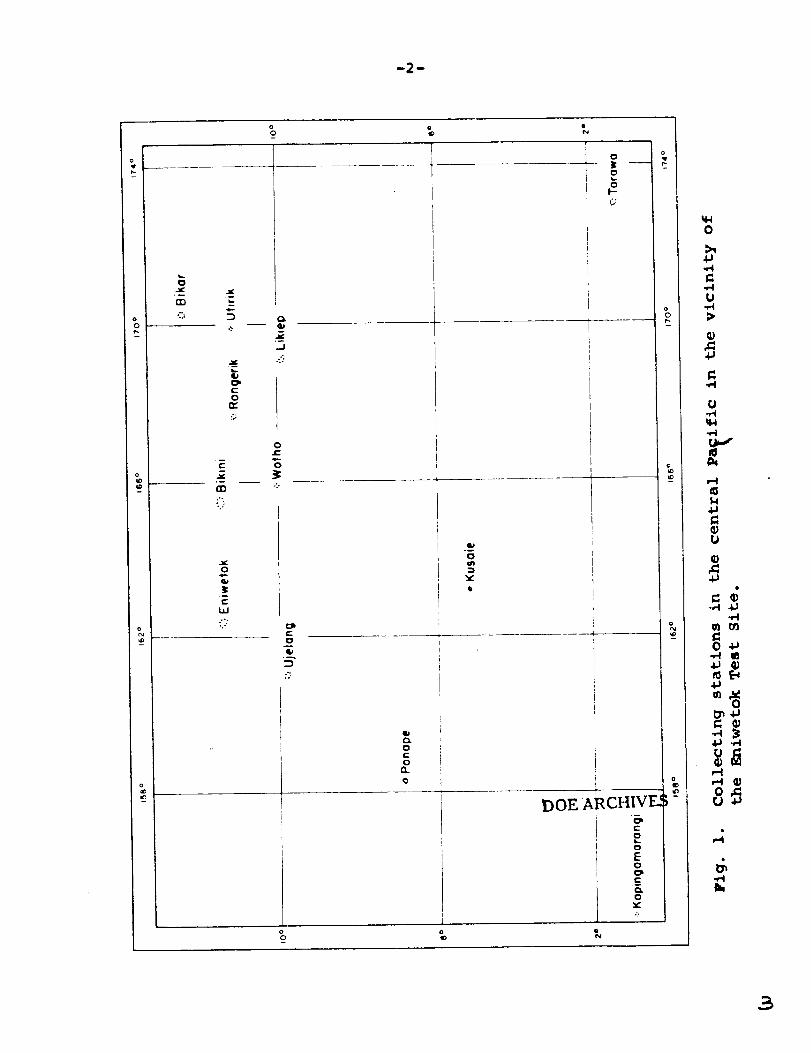
surveys was extended,in 1954,to include several islands away*
from the test site. The “off-site” collecting areas, shuwn
in Figure 1, include locations in the Marshall, Caroline,
and Gilbert Islands and were selected because of their direc-
tion and distance from Eniwetok as well as their accessibility.
Surveys made at these islands In 1954, 1955, 1956, and 1958
showed that in 1956 and 1958 the radioactivity decreased with
distance and direction from the test site and that at the
islands within a 130-mile radius the radioactivity was approxi-
mately tinor nmre tines that of the other islands. Tarawa, an
atoll 800 miles to the southeast of the test site, contained
very low levels of radioactivity. DOE ARCHIVM
The results of studies by several laboratories on the
radioactive contamination of areas adjacent to the test site
and in the open ocean in 1954 to 1956 have been summarized by
-2-
———
0 0 00 e N
1 T
I I–-–——–—~- ,:—
1?Ii:
I
.2. 5—%.? z.-
-1..
x ......-
I
I
I 01 —
I
“-----T----I
I
1
I
I
I
—
3

-3-
Dunning (1957). Collections of marine organisms for radio-
biological analyses also were made in the western Pacific
follwing the Redwing (1956) and Hardtack (1958) test series.
The 1956 collection was made by the George Vanderbilt
Foundation at Saipan, Guam, Ulithi, Yap and Palau and was
sent to the Hanford Atomic Products Operation laboratories
for analysis. The results have been published by Thomas et al.——
(1958). Following Hardtack the George Vanderbilt Foundation
made six collections (at three-month intervals) at Guam,
Palau and the Gulf of Siam.
the Laboratory of Radiation
There was also another
<
These collections were sent to
Biology for analysis.
sampling program for radiobiologi-
cal analyses made at the time of Hardtack. A series of col-
lections of tuna from the western Pacific and Indian
Oceans were made by the Japanese. One-half of the samples,
which were obtained at the port of landing in Japan, were
sent b the Laboratory of Radiation Biolqy for analysis.
me analyses made by the National Institute of Health, Tokyo,
have been reported by Kawabata (1960). DOE ARCHIVES
The present report will be confined to the results of
the studies made at the ten “off-site” islands and the
one test site island shown in Figure 1, during a period which
encompasses three nuclear testing programs at the Eniwetok
-4-
Test Site. These were Castle - 1954, Redwing - 1956, and
Hardtack - 1958.
MATERIALS AND METHODS
The visits to the islands were made possible by the
cooperation of Task Force 7.1 and the Trust Territory of the
United States. Two to five-man teams were flown to the
islands to collect samples which were refrigerated, returned
<to the Eniwetok Marine Biological Laboratory, dissected,
weighed, dried, packaged and then sent to the Laboratory of
Radiation Biology, Seattle, Washington, for further proces-
sing and analysis. The samples were prepared on 1.5-inch
stainless steel planchets and counted for gross beta radio-
activity in either one of two counting systems operated in
the Geiger-Muller region: (a) One and one-half-inch end-
window “pancake” type Anton tube in a 3-inch lead Anton
shield connected to a Nuclear Chicago Model 181 scaler and
equipped with an automatic sample changer. This system has
DOE ~RCHIV~a background of about 18 counts per minute and an efficiency
of approximately 12 per cent based on #*. (b) An internal
counting chamber continuously flushed with methane in a
Radiation Counter Laboratory Nucleometer Mark 9, lbdel 3.
5

-s-
I%ia system has ● background of about 50 counts per minute
and an efficiency of approximately 38 per cent based on P32.
The counts for biological samples were converted to disinte-
grations per minute per gram (d/m/g) of wet tissue and the
counts for samples of island soil and beach sand were con-
verted to d/~g of dry material at time of counting by apply-
ing correction factors for sample weight, counter efficiency,
and self-absorption.
The values for gross beta activity in the appendix+
tables are given in d/tig PIUS or minus the 95 F$r cent
counting error, which was obtained from nomography based on
the ratio of the counting rate and total time of counting of
the sample to the counting rate and total time of counting “
of background (Kinsman, 19S7). The values in the summary
tables, Tables 2 and 3, hmever, have been calculated in
terms of micromicrocuries per gram (L~c/g) of wet tissue.
The samples collected in 1958 were analyzed for gamma-
emitting isotopes with a 3 x 3-inch sodium iodide crystal
DOE ARCHIVESconnected to a Radiation Counter Laboratory 256-channel ana-
lyzer. The radioisotopes present in the samples
fled by their gamma energies and for some of the
amount of each radioisotope was determined by a
were identi-
samples the
subtractive

-6-
procedure similar to that described by Lawman ~ Q. (1957).
The counts per minute (c/m) for each radioisotope were
verted to disintegrations per minute (d/m) by applying
correction factors listed in Table 1. The size of the
sample affects the geometry,and the correction factors
con-
the
listed
do not include error due to the differences in geometry
between the biological samples and the radioisotope standards
used @ calibrate the efficiency of the counting system.
This error ranged from 10 per cent for the smallest biologi-
+cal samples to 60 per cent for the largest samples.
The appropriate decay-correction
also to correct the values to the date
Table 1. Correction factors
factor was applied
of collection.
used to convertgamma counts to disintegrations
Radioisotope Correctionfactor
#o 409
~8137 16.5
~65 54
~n95+95 14.5
C057 8.6
~e144+@44 40
#35 9.6
RU106+106 66.4
DOE ARCHIVM

-7-
A semiquantitative analysis of a Messerschmidla sample
collected in 1956 at Wotho Atoll was made in a single-channel,
50-position, automatic advance gamma spectrometer with a two-
inch well-type sodium iodide crystal.
For some of the 1958 samples the amount of Sr90 was
determined by the precipitation plus ion-exchange method of
Kawabata and Held (1958).
Radioactive beta decay data were obtained for some of
the 1956 samples.
The common names of the organisms are used in the tex~
and tables. The scientific names are given in Appendix
Table M.
RESULTS
Gross Beta Radioactivity
The individual gross beta values plus or minus the 95
~r cent counting error from ten collection sites during the
interval 1954 to 1958 are given in Appendix Tables%
to K.OE ARC
A value identified as background signifies that the counting
error was as great or greater than the net count, i.e., the
count after background was subtracted. The data from the
appendix tables for algae, coconut meat and milk, fish muscle
and liver, and sea cucumber muscle are sununarized in Table 2.

-8-
I I
I I
04m
a
8
Q
~~ DOE ARCHIV1I II
mAA
+01
7

-9-
I+1t-4
Go4
CQ
II
lr)’Q
d?’!’fiarod
All

-1o-
00
n
.mco
PoE ARCtilV=
-11-
In this table the plus or minus values are based on standard
deviation. For the purpose of comparing the radioactivity of
samples at tie test site with samples from the “off-site”
islands, values for Bikini Island have been included in Table 2.
Radioisotopic Composition
The results of the aemiquantitative analyses of gamma
spectra of samples collected in 1956 and 1958 are given in
Appendix Table L; results of quantitative analyses for some
of the 1958 samples are given in Table 3. The latter tabl&
also includes the results of the Srgo analyses. The samples ,
were not analyzed lnznediately after collection ; consequently
the short-lived radioisotopes which might have been present at
the time of collection are not included in the results.
DISCUSSION
The highest levels of gross beta radioactivity were
found in samples of algae, fish liver and muscle, and sea
cucumber muscle from Ujelang, Wotho, Utirik and RongerikDOE ARCHIVES
Atolls (Table 2), which are only one hundred ti three hundred
miles from the test site; however, the levels in coconut meat
and milk were low, even at these atolls. The radioactivity
of similar samples from the outlying atolls and islands of

-12-
4r’-)F
●
0Ill Ill 0
illllll +1
0“ o’I1+! +-1
N+
n00
,*00
II
oLn
●
o“ o000000
+1 +1
●
o o“
DOE ARCHIVES

-13-
Kapingamarangi, Tarawa, Ponape, and Kusaie was only slightly
above the background level of the counter. The naturally-
occurring isotope #* contributed most of the radioactivity,
which, for the samples listed in Table 3, ranged frm 1.8 to
19 ~~c/g of wet tissue.
The levels of radioactivity in samples from one of the
islands at the test site (Bikini) were considerably higher
than in the “off-site” samples. For example, algae collected
at Bikini Island in September 1956, two months after comple-<
tion of the Redwing series, averaged 5,500 ~~dg, whereas
samples collected at the same the at Ponape Island averaged
78 ~~c/g. Similar comparisons with the fish, coconut and sea
cucumber tissues showed that the major portion of the radio-
activity was deposited at or close to the test sites at Eni-
wetok and Bikini Atolls.
Comparisons of the radioactivity of different tissues
and of similar tissues at different times are limited
number of samples. However, some general conclusions
made. The algae and fish liver contained the highest
by the
can be
levels
of radioactivity and the coconut meat and milk were the least
radioactive tissues at the majority of the stationsQOE~CHIV=
The samples collected in January-February, 1955,
atolls east of the test site contained relatively high
at the
amounts
/+

-14-
of radioactivity, indicating that these islands, Bikar,
Likiep and Rongerik (Appendix Tables A, D, F, and X), had
become contaminated with the 1954 Bravo test fallout as had
Rongelap Atoll. Of special note are the high levels of
radioactivity in the island Boil, fish liver and viscera
and the low levels in the coconut samples collected at
Rongerik. Later collections were not made at these islands
and we do not know whether further contamination occurred
there, as it did at islands to the south and west of the<
tent site.
Birds were sampled only at Ujelang, Bikar and Rongerik
in 1955 and at Tarawa in 1956. The 1955 samples contained
relatively high levels of beta radioactivity, whereas those
from Tarawa contained low levels. The white of a tern egg
from Tarawa (Appendix Table G), however, contained more
beta radioactivity (99 d/m/g) than any other tissue s~pled,
and fish, a principal food item of these birds,
tained significant amounts of radioactivity.
Qualitative analyses of gamma spectra aleo
cation of the quantity of the isotopes present.
also con-
‘~OE ARCHIV=
give an indi-
Analyses of
tiis kind made shortly after
Table L) show that Zr95.*95
predominant radioisotopes in
the 1958 collections (Appendix
and Rulo3tlo6_Rhlo3, 106 were the
the samples. !lWoexceptions were
)5

-15-
noted, W181~ 185 contributed the major portion of the radio-
activity in $caevola leaves from Kusaie and in ~esserschmidia
and ScaevQla leaves from Ujelang (Lowman et al. 1959), and.—
Zn65 ns predominant in fish tissues from Ponape and Utirik.
C057 was present usually in lesser amounts, and C058 and Co60
were found only in a sample of clam kidney from Ujelang and a
fish liver sample from Utirik. Other radioisotopes were
present only in a few samples. c~137, for example, was found
in plants from Kapingamarangi and
a few samples from Kusaie, Ponape
fish skin and gut from Ponape and
Fesg was detected once only, in a
from Ponape.
The quantitative results of
Utirik, Ce141’lU-Pr144 in<
and Ujelang, and Bin54 in
clam kidney from Ujelang.
sample of skipjack muscle
the gamma spectrum analyses
shown in Table 3 are based on analyses made approximately
eighteen months after the samples were collected; consequently
the shorter-lived radioisotopes Zr95-Nb95 (half life 65 days),
C058 (71 days) Ru103-~1°3 (4o days) and Ce’41 (32 days) had
decayed to insignificant or non-detectable levels. In a 161-
DO~&RC~&’=gram sample of yellw-fin tuna from Ponape, however, Zr -Nb
were found in low amounts (0.12 ~c/g at time of counting) ;
at time of collection the level of Zr95-Nb95 would have besn
40 ~c/g do was present in all samples analyzed. In some.
/c

-16-
samples from Wotho, Tarswa, Ponape, and Kapingamarangi,~40
contributed the major portion of the radioactivity. Other
samples collected at the same time contained W181’185,
radioisotopes identified with the 1958 fallout. Some samples,
such as coconut crab abdomen and whole fish from Wotho, coP-
tained 2n65, whereas others, such as land plants, contained
none. Some of the land plants contained measurable amounts
of the long-lived fission products Cs137 and Sr90. The high-
est level of Sr90 was found ina
pace from Wotho (18 ~c/g dry) .
isotope by the carapace of land
reported by Held (1957).
The relatively rapid decay
some of the samples collected in
Wotho (Fig. 2 A-E) indicates the
sample of coconut crab cara-<
The concentration of this
crabs at Eniwetok has been
of beta radioactivity in
1956 at Tarawa, Ponape and
presence of short-lived
isotopes. A gamma spectrum analysis of one of the samples
(leaves and stems of a Messerschmidia plant from Wotho)
showed that Zr‘%bgs were the predominant radioisotopes in
this sample. Thomas ~t.DOE ARCHIV~
(1958) found that these isotopes
contributed approximately 84 per cent of the total radioac-
tivity in a duplicate sample. The presence of short-lived
isotopes in the 1956 samples indicated recent fallout at
these islands.

-17-
. ! , 1 1 1
1A Messe~schrmdm Ieoves ond s!e-s
A
\
I Wotho, 6-18-56
~B Co Ccn LJ+ m,’k To.owa, 7-6-56
~c ~Ym~~Ya entre Ponape, 9-27-56
D, E Hyd.octothrus entire pOn Ope,
5-!3-56n
D
\
L 1 1 1 I , , 1 1 1 1 {
June I July I Aug I Sepf I Ott I Nov I Dec I Jon I Feb I Mar I Apr I May I
I 1956 ~ 1957 1
Date of Codn~ ng
DOE ARCHIVES
Fig. 2. Beta decay curves of samples collected in 1956.

-18-
SUMMARY
1. Surveys were made in 1954 to 1958 to determine the
geographical limits of the radioactive contamination from
the tests in the central Pacific Ocean.
2. Collections of biological samples and soils were made
at one test site island (Bikini) and ten “off-site” islands.
3. The gross
from the test
beta radioactivity decreased with distance#
site; in 1956 and 1958 islands within a 130-
mile radius contained at least ten times as much radioac- ‘
tivity as the other islands.
4. The levels of radioactivity also were related to direc-
tion from the test site. In 1955 the islands to the east
contained high levels of radioactivity. In 1956 and 1958
Tarawa, 800 miles southeast of the test site, contained very
lW levels whereas Kapingamarangi, approximately the same
distance to the southwest, contained significantly higher
. amounts of radioactivity.DOE liRCHIV~
5. Zr9~.~95 and Ru103t 106-~103,106 were the predominant
radioisotopes present in the majority of the samples.
*

-19-
Other isotopes, such as W181~185, Zn65 and c~137 were
present in relatively high amounts in some samples. Sr90
was found usually in very low amounts.
DOE ARCHIVES