Radio propagation
54
OT REPORT 78-144 RADIO PROPAGATION IN URBAN AREAS A. G. LONGLEY U.S. DEPARTMENT OF COMMERCE Juanita M. Kreps, Secretary April 1978
Transcript of Radio propagation

OT REPORT 78-144
RADIO PROPAGATION IN URBAN AREAS
A. G. LONGLEY
U.S. DEPARTMENT OF COMMERCE Juanita M. Kreps, Secretary
April 1978


TABLE OF CONTENTS
Page ABSTRACT.....................................................................1 1. INTRODUCTION...........................................................1 2. SURVEY OF PREVIOUS WORK................................................2 2.1. Results of Measurement Programs..................................3 2.2. Some Height Gain and Polarization Effects.......................11 2.3. Attenuation by Trees............................................14 2.4. Multipath Fading................................................17 2.5. Diversity Techniques............................................21 3. PROPAGATION MODELS FOR URBAN AREAS....................................23 3.1 Existing Propagation Models.....................................23 3.2. A Computer Prediction Model.....................................30 4. SUMMARY AND CONCLUSIONS...............................................34 5. REFERENCES............................................................36 APPENDIX – 1977 Modification of the Longley-Rice Computer Model ............................................43
iii

LIST OF FIGURES Figures Page 1. Prediction curve for basic median attenuation relative to 26 free space in urban areas over quasi-smooth terrain, re- ferred to hte= 200 m, hre = 3 m. From Okumura et al. (1968). 2. Median value of environmental clutter effect as a function 27 of angle of elevation. From Kinase (1969). 3. Median value of clutter effect as a function of frequency. From Kinase (1969). 27 A-1 Field strength (for 1 kW ERP) as a function of distance over a smooth homogeneous earth. Frequency 100 MHz, ε = 10, σ = 10 mS/m, h1 = 20 m, h2 = 0 to 20,000 m. 46 A-2 Attenuation relative to free space as a function of dis- tance over a smooth homogeneous earth. Frequency 100 MHz, ε = 15, σ = 5 mS/m, h1 = 5 m, h2 = 5 to 2000 m. 47 A-3 Attenuation relative to free space as a function of dis- tance over a smooth homogeneous earth. Frequency 300 MHz, ε = 15, σ = 5 mS/m, h1 = 5 m, h2 = 5 to 2000 m. 48 A-4 Attenuation relative to free space as a function of dis- tance over a smooth homogeneous earth. Frequency 1000 MHz, ε = 15, σ = 5 mS/m, h1 = 20 m, h2 = 5 to 2000 m. 49
iv

RADIO PROPAGATION IN URBAN AREAS
Anita G. Longley*
This report reviews much of the earlier work on radio propa-gation in urban areas, including a good deal of data from measure-ment programs, careful studies of multipath propagation, and tech-niques to reduce multipath fading. A number of investigators have also developed propagation models for use in urban areas. Most of these are largely empirical, and are presented as curves with vari-ous correction factors for antenna height, frequency and terrain irregularity.
The present report describes a model, intended for use with a digital computer, which provides a rapid means for calculating both the median attenuation and the location variability expected in ur-ban areas. The model has been tested against measured values and is applicable for a wide variety of conditions.
Key words: Broadcast systems; irregular terrain; land-mobile sys- tems; location variability; radio propagation; urban
communications.
1. INTRODUCTION
For many years land-mobile and broadcast services were concerned mainly
with the lower part of the VHF band, but higher frequencies are now allocated,
so for both broadcast and mobile systems we must consider frequencies up to
1000 MHz.
The random selection of receiver locations for these systems results in
greater median propagation loss than would occur with selected sites, and also
in greater path-to-path variability. Some irregularity in terrain causes an
increase in field strength by breaking up the destructive phasing between
direct and reflected radio waves that occurs over smooth terrain. However,
as terrain irregularity increases, or as buildings and trees are added to the
surface, the signal is reduced by shadowing, absorption, and scattering of the
radio energy, and there is also an increased range of variation with location.
*The author is with the Institute for Telecommunication Sciences, National Telecommunications and Information Administration, U. S. Department of Commerce, Boulder, Colorado 80303.

These effects of terrain irregularity, and of surface clutter, increase with
increasing frequency. With the present trend toward the use of higher fre-
quencies these effects become more and more important.
In land-mobile systems the antenna height on the mobile unit is low,
usually not more than 3 m above ground. Between the base station and a
mobile unit, and between the units themselves, an ever-changing and very
large number of propagation paths are formed due to the motion from place to
place. This multipath interference causes the signal to fade rapidly and
deeply, and can be a serious problem in highly built-up urban areas where a
large number of propagation paths may be formed.
In addition to the rapid, multipath type of fading, there is a variabil-
ity in signal level from one location to another. This may be referred to
as path-to-path or location variability. In urban areas the location vari-
ability is highly dependent on the type and density of surface features, as
well as on terrain irregularity, and radio frequency.
The problems encountered in propagation in an urban environment contain
too many unknown elements for complete theoretical modeling. For this reason
data from measurements have been depended on in attempts to model radio pro-
pagation in urban conditions. Many such empirical models have been proposed
as indicated in section 3.1. Of these several are presented in the form of
curves of median field strength as a function of distance or range, with an
allowance for path-to-path variability.
This report reviews much of the available data, considers techniques to
overcome or control the rapid, multipath type of fading, and describes early
and existing models for predicting median propagation loss and location vari-
ability. A model is described which takes into account the dependence of
transmission loss on radio frequency, antenna heights, terrain irregularity,
and distance, with an additional allowance for attenuation in urban areas
as a function of surface obstacles and radio frequency. This model is devel-
oped for use with a digital computer and has been tested against available
data.
2. SURVEY OF PREVIOUS WORK
Many measurement programs have been carried out to ascertain the effects
2

of shadowing by terrain and by natural and man-made objects. Such shadowing
may cause great attenuation of the radio signal and wide variation from one
receiver location to another. The results of a number of such programs are
described. Some studies of antenna height gain, the effects of differences in
polarization, and the attenuation caused by trees are also discussed.
A serious problem in urban propagation is the multipath interference,
which causes the radio signal to fade rapidly and deeply, depths of 30 dB
being quite common. Many investigators have studied multipath fading, de-
scribing and analyzing its characteristics, and small scale statistics, with
a view to developing techniques to limit or control this fading. Several
approaches have been tried, including the use of directional antennas to re-
duce the number of reflected signals received, but probably a more useful
technique is some form of space diversity. Much of this work on multipath
interference and its control is referenced and discussed below.
2.1. Results of Measurement Programs
A great many measurement programs have been carried out to determine
the effects of urban conditions on radio propagation. A number of these pro-
grams are discussed in this section, with significant numerical values listed
in Table 1.
The effects of shadowing and multipath in an urban area were studied
more than 40 years ago by Burrows et al. (1935). They measured the signal
transmitted at a frequency of 34.6 MHz from the top of a high building, in
the downtown area of Boston, to a mobile receiver. The received signal was
quite variable, with an average value 12 dB less than that for a flat earth
and a range of ±10 dB. They concluded that transmission under urban condi-
tions may be considered in terms of transmission over level ground plus the
wave interference patterns caused by reflections from the buildings, and an
additional urban attenuation that is independent of path length. At about
the same time measurements were made in Ann Arbor, Michigan by Muyskens and
Kraus (1933). They obtained good coverage of Ann Arbor and environs with a
signal at 58.8 MHz transmitted from a tower on the university campus. They
obtained better results with vertical than with horizontal polarization.
Jones (1933) reported observations at 44 and 61 MHz from the Empire State
3

Building in New York. He reported the absorption through and around buildings
as about 50% per 500 ft at 44 MHz and per 200 ft at 61 MHz. He also discussed
reflection phenomena and interference patterns. During the same period Holmes
and Turner (1936) made field strength surveys in the Camden-Philadelphia area
at 30 and 100 MHz. They noted that the shielding effect of the thickly built-
up downtown area of Philadelphia was very apparent, especially at 100 MHz, and
that local conditions sometimes completely mask the relationship between
terrain elevation and field strength.
Other early measurements reported by Goldsmith et al. (1949) showed that
channel 5 signals in the streets of New York City were far below theoretical
values and showed great variability in level, even though the terrain is es-
sentially flat. They concluded that these effects were caused by the shadows
and multipath reflections from the many high buildings. Brown et al. (1948)
reported on measurements made in New York City at frequencies of 67, 288, 510,
and 910 MHz from a transmitter atop the Empire State Building. A receiving
van moved along two radials, one west over very hilly country through suburban
areas with large houses and trees, and the other southwest over level terrain
toward Princeton, New Jersey. They noted that shadowing by hills or other
obstructions has a steadily increasing effect as frequency increases, and
in hilly or obstructed areas multipath effects become severe at 510 and 910
MHz. On the smooth southwest radial outside of Manhattan there was little
evidence of multipath, while along the other radial, especially in shadowed
areas, signals arriving by many paths were numerous. As directional
receiving antenna arrays were rotated, several positions were noted where
strong signals were received, some as strong as the main signal. At the higher
frequencies, multipath signals are profuse and the field may be badly distor-
ted. In suburban areas over smooth terrain with many houses and trees, the
median losses observed were 15 and 20 dB greater than calculated smooth earth
values at 510 and 910 MHz, respectively. In these measurements, transmission
from directional antennas at 510 and 910 MHz prevented multipath signals that
would be caused by reflections from the buildings on Manhattan Island. High-
gain directive receiving antennas failed to function properly in shadowed
areas where the field is distorted.
Kirke et al. (1951) conducted a mobile survey of field strength in the
streets of London, with the transmitter at Wrotham, Kent. Transmission at
4

90.8 MHz from an antenna 220 ft above ground was received on mobile units with
20 ft antennas. They found that buildings of normal height in London reduced
the average field strength by 10 to 12 dB, and also that the average for one
street represented the average ±4 dB for the district. In a hilly and highly
populated district the contours covered a range of some 34 dB. Local varia-
tions were much greater with vertical than with horizontal polarization, es-
pecially in the vicinity of trees. With vertically polarized radiation, the
trees seemed to act as screening or absorbing agents rather than as
reflectors, as the field strength tends to drop near trees.
In a series of mobile measurements in the Washington, D. C. and Baltimore
areas, at frequencies of 71.75 and 94 MHz, Kirby and Capps (1956) compared the
the path-to-path variability in various surroundings. They noted consistently
more variability at the higher frequency, with 10 to 90% ranges of 7, 13, 14,
and 15 dB in overwater, wooded, urban, and farm areas, respectively, for dis-
tances up to 50 mi. These ranges correspond to standard deviations of about
3, 5.2, 5.6, and 6 dB. Glentzer (1956) performed tests at 450 MHz from four
possible coverage stations in Chicago, Illinois. He observed the best cover-
age over a 30 mi radius from the top of the Field building, about 575 ft above
ground. He also noted that coverage is affected by the shadows of tall build-
ings, trees, and hills. Head and Prestholdt (1960) on analyzing a large num-
ber of measurements at VHF and UHF found much more variability of field
strength values in rugged than in smooth terrain, and a much wider range of
values in the higher frequency band. From a study of the variation of field
intensity over irregular terrain, within line of sight, Fine (1952) reported
that, for a distance of 5 to 30 mi, the median measured field strength at
400 to 600 MHz is 22 dB below that for a plane earth, with a standard devia-
tion of about 12 dB. He also observed somewhat more variability at 910 MHz
than at the lower frequencies.
Measurements were made by Aikens and Lacy (1950) at 150 and 450 MHz from
a transmitter on top of the telephone building in New York City to mobile re-
ceivers. In Manhattan, city of skyscrapers, all measured values were 20 to
40 dB below calculated smooth-earth values. The mean excess loss was about
30 dB on cross-town streets but only about 15 dB on the north-south avenues.
In suburban rolling country the excess loss was 5 to 40 dB, with a mean of
23 dB. On city streets, the variation over a distance of 200 to 400 ft was
5
roughly 20 to 25 dB, while in open country it was only about half as much.
In Manhattan and the Bronx, Young (1952) compared mobile radio performance
at 150, 450, 900, and 3700 MHz. He concluded that for mobile radio telephone
both 450 and 900 MHz are somewhat preferable to 150 MHz. At frequencies above
1000 MHz performance falls off because fluctuations in received signal level
occur at an audible rate when the unit moves at normal speeds. For all fre-
quencies the losses are about 30 and 20 dB greater than smooth-earth values
for urban and suburban areas, respectively, with a 10 to 90% range of values
of 25 dB in urban areas.
Studies by Epstein and Peterson (1953) and (1956) of transmission at
850 MHz in an urban area show the effects of different transmitting antenna
heights. The radio signal was broadcast from station WOR in Jersey City and
received at points along radials to the west and southwest through a heavily
congested area, and through open country. At each receiving site the maximum
field between 10 and 30 ft above ground was recorded. In the congested area
over quite smooth terrain, within 13 mi of the transmitter, the attenuation
relative to free space was about 26 dB from a transmitting antenna height
of 200 ft, and only 15 dB when the height was increased to 740 ft. Similarly,
about 14 to 20 mi from the transmitter, in an area of open farm land with
occasional woods and some buildings, the corresponding attenuations are 16
and 0 dB, respectively. They conclude that useful estimates of propagation
loss can be made by calculating the free-space loss, the terrain shadow
loss using knife-edge diffraction theory, and an additional factor which
depends on the elevation of the transmitting antenna above suburban and rural
areas. This attenuation factor depends on the angle of approach at the re-
ceiving antenna. This is the angle between an incoming ray from the trans-
mitter and a tangent to the earth at the receiver. Attenuation is greater
for low angles of approach since the path through intervening obstacles is
longer. Based on an analysis of data at 67 and 850 MHz they define a "clutter
loss" as a function of frequency and the angle of arrival of the signal.
(In this study the receiving antennas were 5 to 10 ft above housetops so the
clutter loss does not include a dependence on the height of the receiving
antenna.) For angles of arrival greater than 2° the clutter loss is quite
small but for smaller angles it becomes appreciable, more than 20 dB estimated
at 900 MHz.
6

Bullington (1957) reported that in New York City the median field for
random locations at street level is about 25 dB below the corresponding plane
earth value at 150 and 450 MHz, with a 10 to 90% range of 20 dB. Similarly,
Nylund (1968) reported on mobile tests at 152.6 MHz in New York City and
suburban areas. In the suburbs, the base station antenna was 80 ft high while
in the city transmission was from a 205 ft antenna which was partially blocked
by nearby buildings. The losses in excess of calculated smooth-earth values
averaged about 11 and 36 dB in the suburban and urban areas, respectively.
The statistical distributions of the depth and width of fades in rural, sub-
urban, and urban areas are similar. The average fading depth was about 10 dB
with 10% of fades reaching a depth of 25 dB, and a maximum of 35 dB.
The Federal Communication Commission (FCC) carried out a large measure-
ment program to determine the usefulness of a UHF broadcasting station in the
canyon-like city of Manhattan. The plan for this program was reported by
Skrivseth (1961), data from mobile measurements along radials were listed by
Hutton (1963), and the results of the program were described by Waldo (1963).
Transmission from the top of the Empire State Building on channels 2, 7, and
31 (about 58, 178, and 576 MHz) was measured out to a range of 25 mi, with
mobile surveys along radials to the limit of measurement. Tests were also
made at nearly 4000 fixed locations, half of them in Manhattan within 5 mi
of the transmitter. The average attenuation relative to free space on unob-
structed roofs within a range of 15 mi was about 10 dB at all three frequen-
cies. Comparison between reception at rooftop sites and with indoor antennas
showed additional loss inside buildings in Manhattan of about 30 dB at the
two lower frequencies, and 26 dB at the higher one. Outside of Manhattan
the building penetration losses were about 5 dB less at all three frequencies.
Peterson (1963) discussed the results of the FCC measurement program with
particular attention to the mobile surveys along radials. Along a radial over
smooth terrain through a residential area, the average losses at all tested
frequencies were 20 dB more than calculated smooth-earth values. A second
radial over highly irregular terrain showed heavy shadowing by mountains
but little "clutter" loss. He stated that the use of high-gain transmitting
antennas has objectionable consequences in hilly terrain, and in a heavily
built-up city area the receiving antennas are immersed in a sea of clutter,
7
with no possible use of antenna directivity or gain.
Measurements at 836 MHz in Phi1adelphia, reported by Black and Reudink
(1972), were from a 500 ft base station antenna to a van moving at 15 mi per
hr along streets in a small area in the central part of the city, and a larger
area farther out. In the smaller area, variations of 20 dB or more were ob-
served in the shadows of tall buildings, with a median path loss about 27 dB
in excess of the calculated 1ine-of-sight loss. In the larger area, where the
buildings are more uniform in size, the median attenuation was about 17 dB,
with an interdeci1e range of 13 dB. Changes in signal level with distance
from 2 to 5 mi show local mean values about 24 dB below free space, with a
spread of some 30 dB. Near the transmitter, the variability is greater than
it is farther away. Changes in local mean level depend on the terrain, the
width of the street, sizes of buildings, and whether or not the transmitter
is shadowed by tall buildings. They noted that the signal along radial
streets is about 10 dB higher than on cross streets, even at a distance of 3
mi from the transmitter. Measurements at 956 MHz from a base station 80 ft
above ground in Washington, D. C., are reported by Deitz (1971). Signals
received by a mobile unit fluctuate at a rapid rate, with fading amplitudes up
to 40 dB. Along a narrow valley, Rock Creek Park, he observed about 5 dB more
attenuation when the trees were in full leaf than during winter months.
Recently Barton and Wagner (1974), have reported mobile radio performance
in urban, hilly terrain. They measured transmission loss at 455 and 862 MHz
from a base station transmitter located on a bluff some 125 m high, in the
central part of Pittsburgh. Measurements were made at Meadow Lands and at
Harmarvi11e, at distances of 32 and 16 km, respectively, over terrain with
deep valleys and thick tree cover, the terrain having a peak-to-peak variation
of 156 m. The average measured power received at 862 MHz was -107 and -97.5
dBm for the longer and shorter paths, respectively. This corresponds to an at-
tenuation relative to free space of about 40 dB. Similar values were obtained
at 455 MHz. They concluded that city-wide dispatch systems at 900 MHz will be
practical not only in level areas but in hilly terrain as well. They also
made measurements in long tunnels and under elevated roads which showed a
remarkable improvement at 862 MHz over those at 450 MHz. They attributed
this to more scattered signal illumination at tunnel entrances and multipath
8

reflections along the tunnel walls at the higher frequency.
Extensive studies of land-mobile radio services in Japan have been re-
ported by Okumura et al. (1968), and by Kinase (1969). Measurements at 200,
453, 922, 1310, 1430, and 1920 MHz, were made in the heart of Tokyo and its
environs. Okumura et al. show the effects of "environmental clutter" in
urban, suburban, and open areas for various frequencies, antenna heights,
distances, and terrain types. They define an open area as clear for 300 to
400 m from the receiving antenna, a suburban area includes villages with scat-
tered trees, and an urban area is a built-up city crowded with large build-
ings, two-story houses, and tall trees. (Until recently, the maximum building
height in Japan has been 31 m.) Measured values of field strength in urban
areas, over smooth terrain, are plotted versus path length for each frequency
at several transmitting antenna heights with a 3 m receiving antenna. From
these measurements they derived a set of curves of median attenuation relative
to free space as a function of frequency for various distances in an urban
area over practically smooth terrain. For a frequency range of 100 to 1000
MHz, the attenuation is 6 to 10 dB less in suburban areas, while in open areas
it is 23 to 29 dB less than in an urban area. They note that the variability
of the signal increases with frequency, and that there is less loss on radial
than on cross streets.
Kinase (1969), reporting on measurements at 670 MHz in Tokyo and suburban
areas, stated that in the heavily built-up central area of Tokyo the attenua-
tion relative to free space is about 15 dB greater than in any other area.
He reported median values of attenuation of 40, 30, and 25 dB in central
urban, urban, and suburban areas. He calculated the effects of terrain ir-
regularity to obtain a basic or theoretical field strength, and defined a
clutter factor C as the ratio of observed to calculated field strength.
This factor increases progressively with lower antenna heights, and with
lower elevation angles, and is independent of terrain type. He noted that in
suburban areas with large trees, C is comparable to that in built-up areas.
Kinase defined a single parameter Γ as the area occupied by buildings, vege-
tation, etc., expressed as a percentage of the total area, in a unit area
of 2 km2. The clutter factor is then expressed as a function of elevation
angle and radio frequency for each value of Γ. For example, in central
9
Tokyo, Γ = 50%, and the median clutter factors for a frequency of 700 MHz are
about 22 and 32 dB at elevation angles of 0.055 and 0.008 radians, respec-
tively. This parameter Γ can be used to describe clutter independent of such
classifications as rural, small city, urban, etc.
Mobile measurements in other large cities have been reported by several
investigators. In a large Russian city such measurements are reported by
Trifonov et al. (1964) at frequencies of 50, 150, and 300 MHz. They observed
deep fading with minima every half wavelength in the center of the city, about
every wavelength at open sites within the city, and practically no interfer-
ence fading at open sites outside of the city. The distribution of samples
taken every half wavelength along city streets was log-normal in multilevel
streets in the center of the city and Rayleigh in suburban areas, with inter-
mediate Nakagami-Rice (Rayleigh plus a constant) distributions. They also ob-
served less fading on wide streets and along radials than in cross streets.
Mobile measurements in Poland* at 158 and 306 MHz are reported from War-
saw, and from a town with a population of about 30,000. At 158 MHz in the
heart of Warsaw attenuation due to urban clutter is 9 to 18 dB. At 306 MHz
in suburban areas, 9 to 14km from the transmitter, the attenuation is 12 to
21 dB, while in a small town it is about 10 dB. In another series of tests,
signals received on a 30 m antenna in suburban and denser areas from a base
station 1 to 6 km away, show clutter attenuations of approximately 5, 7, 10,
and 13 dB at frequencies at 34, 46, 171, and 306 MHz, respectively.
Measurements on city streets in Italy* at 146 and 475 MHz from a mobile
transmitter show that the additional loss in an urban environment depends on
the density and heights of the buildings and on the vertical angle of arrival
of the signal. These results are quite similar to those reported by Okumura
from measurements in Japan, where the attenuation increases about 30 dB as the
elevation angle is reduced from 4° to nearly zero.
Measurements in West Berlin at 12 GHz are reported by Sakowski (1971).
Transmission was with vertical polarization from three transmitting antennas
at heights of 200, 95, and 56 m above average ground. He did not obtain ade-
quate reception on 10 m receiving antennas but with 25 m receiving antennas
the attenuation relative to free space for distances of 10 to 25 km was zero
for 200 m height, 2 to 14 dB for 95 m height, and 10 to 25 dB for the 56 m
__________________
* Private communication
10

antenna height.
Some of the results of these measurement programs are listed in table 1.
Values shown in the table were for the most part recorded over smooth terrain
and represent the attenuation caused by built-up urban and suburban develop-
ments at several frequencies. Some of the effects of irregular terrain will
be considered in the section on propagation models.
In heavily built-up city areas we have seen that the additional loss may
range from zero to about 40 dB, depending on frequency, antenna height, angle
of arrival of the signal, and the density and height of the buildings. At
frequencies from 40 to 250 MHz there is no great difference in signal level
between urban and rural areas as long as the receiving antenna is above local
roof levels, but with the receiving antenna at 10 m the additional attenuation
in urban areas is 6 to 16 dB depending on the character and height of the
buildings. At higher frequencies, 450 to 1000 MHz, urban attenuation may be
from about 6 to 28 dB depending on the density and heights of the buildings.
2.2. Some Height Gain and Polarization Effects
In a land-mobile service, the receiving antenna is usually only about 3 m
above ground, while for a broadcast service the height is about 10 m. The
median height gain when the receiving antenna is raised from 3 to 10 m depends
on the frequency. The CCIR (1974d) reported that in the range 40 to 100 MHz
the height gain is 9 to 10 dB in both rural and urban areas. For frequencies
of 150 to 250 MHz the height-gain is 10 to 11 dB in urban or hilly areas, and
about 7 dB in flat terrain. At 450 to 1000 MHz the height gain is 14 dB in
urban areas and 6 to 7 dB in the suburbs, while in irregular terrain it de-
pends on terrain irregularity, going from 10 to 0 dB as ∆h increases from
10 to 500 m. (The parameter, ∆h, is the difference in heights exceeded by 10%
and 90% of the terrain in the range 10 km to 50 km from the transmitter.) At
any specific location the actual height gain on raising the receiving antenna
from 3 to 10 m may be quite different from these median values. As the re-
ceiving antenna is raised above surface obstacles a further height gain is to
be expected. In an urban area, with receiving antennas above local roof le-
vels no increase in transmission loss above that in rural areas is expected at
frequencies below 100 MHz. In the 150 to 250 MHz band there may be an addi-
tional attenuation of 5 to 15 dB in urban areas depending on the density and
11

12

height of the buildings and the angle of arrival of the signal at the receiv-
ing antenna. In urban areas in England an additional 9 dB attenuation was ob-
served in the range 450 to 1000 MHz. When the receiving antenna is lowered
from 3 to 1.5 m the additional attenuation is approximately 3 dB.
In both urban and suburban situations, increasing the height of the
transmitting antenna may have a marked effect. The increased field can be
related to the increase in elevation angle, as noted by Kinase (1969) and
Epstein and Peterson (1953). The amount of attenuation should depend on the
angle of approach at the receiving antenna, and should be greater for low
angles of approach because the path length through intervening obstacles is
longer. Another effect of raising the transmitting antenna is that this may
elevate it above nearby obstructions, such as tall buildings, which may prac-
tically block out a whole segment, as noted by Black and Reudink (1972).
The directive gain patterns, polarization, and other characteristics of
antennas are often greatly affected by the proximity of buildings and vegeta-
tion. In shadow regions at VHF the effect of reflections on vertically pola-
rized signals is often sufficient to seriously distort FM reception, while
they have little effect on horizontally polarized signals. Bullington (1957)
noted that at 100 MHz the average loss from nearby trees was 5 to 10 dB with
vertical polarization and only 2 to 3 dB for horizontally polarized signals.
Such polarization differences were not observed at frequencies from 300 to
500 MHz.
Measurements in a hilly, wooded region near Detmold, Germany* at 97 MHz
show the advantage of horizontal polarization in both field strength and qual-
ity of reception. The field strength was 5 dB higher and practically no
reflections were observed with horizontal polarization.
Even at higher frequencies, Cunningham (1973) noted that small sector
signal variations at 900 MHz are greater for vertical polarization than for
either horizontal or circular polarization. The received signal typically
exhibits a variation of t6 dB with vertical as compared with ±2 to 3 dB with
horizontal or circular polarization.
When a transmitter is located at a clear site some discrimination against
unwanted signals may be achieved by the use of orthogonal polarizations. In
an urban setting, however, where multipath fading caused by scattering and
__________________
*Private communication
13

reflection from buildings and trees is common, the resulting field is largely
depolarized. Polarization discrimination exceeded at 90% of receiving sites
is 20, 14, and 0 dB in flat, hilly, and mountainous terrain, respectively.
with the transmitting antenna at a clear site the polarization discrimination
at rooftop level in an urban area has a 90% value of about 9 dB (CCIR, 1974c).
Some measurements at UHF indicate that there is slightly more depolarization
for vertically than for horizontally polarized waves.
2.3. Attenuation by Trees
Many measurements have been made of the effects of forests and of indi-
vidual trees on radio propagation. Typical dense, and rather extensive woods
are practically opaque to radio signals at UHF and higher frequencies. The
signal in the presence of woods near the receiving antenna appears to be
principally that diffracted over the trees, but with less dense woods the
signal transmitted through may be greater than that diffracted over them.
A small number of trees, or even a single tree, can cause considerable
spatial variation in field strength at points within the shadow zone. When
an antenna is placed in a grove of trees the signal is severely attenuated and
the directive gain pattern, polarization, and other characteristics of the
antenna may be strongly affected. Measurements made in jungles and rain
forests by Herbstreit and Crichlow (1964) show that jungle attenuation of
radio signals at VHF is very great, and that vertically polarized signals are
attenuated about 15 dB more than horizontally polarized fields at a distance
of one mile. Bergman and Vivian (1970) report measurements in jungles in
the mountainous terrain of Panama. At about 50 MHz, for distances of 10 to
40 km, the average jungle loss was about 18 to 20 dB below free space, with
a standard deviation of about 12 dB.
Large measurement programs have been carried out in tropical jungles,
and the vegetation has been modeled as an imperfect dielectric slab. This
so-called "slab model" represents the inhomogeneous, anisotropic, real jungle
as an homogeneous, isotropic, lossy dielectric. (See reports by Pounds and
La Grone, 1963; Hagn and Barker, 1970; Sturgill et al., 1967; Tamir, 1967;
and others.) However, Vincent (1969) noted that scattering of VHF radio
waves by trees is a significant factor, especially scattering by the tree
14

trunks. He also measured values of the relative dielectric constant, ε, and
conductivity, σ, for various frequencies. As the frequency is increased from
7 to 100 MHz ε decreases from 15 to 10 and σ increases from 3 to 20 mS/m. As
frequency is further increased, above 100 MHz, the trees tend to act more and
more as individual scatterers, multipath effects become increasingly signifi-
cant, and there is much more radiowave attenuation than would be predicted
by a "slab model". At VHF and UHF large attenuations are observed between
antennas separated by a few hundred meters of trees. This attenuation is
strongly frequency dependent, and is rather insensitive to tree density.
In urban areas we are concerned with the absorption, reflection, and
scattering of radio energy by trees and other vegetation, and their effects
on multipath near the receiving antenna.
Trevor (1940) measured attenuation through a patch of woods 500 ft thick
at 500 and 250 MHz in summer and in winter. He observed strong standing wave
patterns, with 3 to 4 dB more loss with vertical than with horizontal polari-
zation. At 500 MHz the attenuations were 19 and 15 dB in the summer and
winter, respectively, with vertical polarization. At 250 MHz the correspond-
ing winter loss was 14 dB. The loss over 5 to 6 ft scrub pines was about
8 dB more than over a smooth earth. Sofaer and Bell (1966) also reported a
foliage loss of about 4 dB at frequencies of 200 and 750 MHz in dense woods,
with somewhat less loss through a single line of trees. Recently, Reudink
and Wazowicz (1973) reported foliage attenuations of 10 and 20 dB behind a
tree-covered obstacle at 836 MHz and 11.2 GHz, respectively.
La Grone and Chapman (1961) reported the effect of a single large oak
tree on propagation at 2880 MHz. At distances of 300 and 900 ft from the
tree the measured attenuations were 28 and 25 dB, respectively. These results
agree with those of McPetrie and Ford (1946) which show a loss of 24 dB at
a distance of 7 m behind the trunk of a large tree, at a frequency of
3260 MHz. They note that, at this frequency, trees in full leaf are prac-
tically as opaque everywhere as the tree trunk itself. Megaw (1948) reported
measurements at 3260 MHz over a 37 mi line-of-sight path, where a row of trees
and houses near the receiver caused 25 dB attenuation below free space.
Saxton and Lane (1955) summarized the results of several sets of measure-
ments in terms of rate of attenuation in dB per m of trees as a function
15

of frequency. For trees in full leaf the attenuation rates range from about
0.05 to 0.5 dB/m as frequency is increased from 100 to 3000 MHz. The authors
warn that this serves only as a guide to the order of magnitude, and that the
rate of attenuation depends on many factors, such as the density of the woods.
It should also be noted that these rates apply to situations where both an-
tennas are in the woods.
Head (1960) considered the effects of thickets of trees between the path
terminals, but with the receiver in the clear. Measurements at 485 MHz show
that the signal is much attenuated near the woods, and that considerable
clearing distance is required for recovery. He defined a clearing depth as the
distance from the woods to the receiver. The signal then increases in pro-
portion to the logarithm of the clearing depth, expressed in miles. At clear-
ing depths of 0.01 and 1 mi the corresponding attenuations are 35 and 12 dB.
A paper by P. L. Rice (1971) summarizes much of the previous work on the
effects of vegetation. He notes that wetting the foliage increases its con-
ductivity sharply, which tends to produce a depolarization of the overall
field; and that the motion of trees causes depolarization fading of several
decibels amplitude even with quite moderate winds.
In a recent paper La Grone (1977) reports measurements over a grove of
trees at frequencies of 82, 210, 633, 1280, and 2950 MHz. The transmitter
antenna elevations were 424, 148, 170, 225, and 225 m for each frequency, re-
spectively, with path lengths of about 40 to 67 km. The grove of trees was
about 9 m tall. The receiver was placed successively 4.5, 19.8, 35.1, 65.6,
and 111.3 m behind the trees and the receiving antennas lowered from 18.3 to
1.5 m. The measured data show a better fit to propagation over an ideal
knife-edge than that over a smooth spherical earth. At short receiver dis-
tances a significant amount of the signal energy propagates through the trees
so that their effective height is less than their true height. This agrees
with observations by Longley and Hufford (1975) of propagation to low antennas
placed near, or within, heavy pine forests. They allowed for some trans-
mission through the trees above the critical angle of internal reflection.
Assuming an effective dielectric constant ε for the woods, the critical angle
θc, defined as 21
sin−
≡ εθ c ,
16

was about 110 mr or 6°. This was then taken as the maximum allowable eleva-
tion angle at the receiver. The predicted values agreed well with measure-
ments.
2.4. Multipath Fading
In a mobile radio environment the signal fades rapidly and deeply as a
result of shadowing, multipath reflections, and scattering caused by terrain,
buildings and trees. Fading depths of 30 dB are quite common. The fading
rate is proportional to the radio frequency and the speed at which the vehicle
travels. Increasing terrain irregularity and clutter cause increasing scatter
and divergence or defocusing of the radio waves. Convergence or focusing and
specular reflection also playa part in multipath phenomena.
Many studies have been made of the interference caused by multipath.
Brooks (1965) analyzed the multipath interference to FM transmission of tele-
vision between vehicles moving over a flat earth. Young and Lacy (1950), us-
ing short pulses at 450 MHz studied the echoes resulting from transmission
from a land station to a moving car in lower Manhattan. Their results show
delays ranging from -3 to +12 µs, with the greatest number from 1 to 3 µs.
In the interval 2 to 3 µs delay there is a 45% chance of a path within 12 dB
of the main one, and an 18% chance of one within 6 dB. Such echoes may seri-
ously limit the performance of wide-band radio systems.
Engel (1969) described the effects of multipath transmission on the
propagation delay of a signal. Measurements of differences in propagation
delay are used in automatic location of mobile units. If the signal is a
pulse the receiver can detect the leading edge of the pulse and multipath
does not impair the measurement. Engel described a procedure to determine
the distribution of errors in measured values of propagation delay. Simi-
larly, Figel et al. (1969) describe a method of vehicle location based on
measurement of signal attenuation from a mobile transmitter. They developed
an automatic sampler and totalizer for this purpose.
In measurements at 836 MHz in New Providence, N. J., Lee (1966) and
Stidham (1966) observed a marked reduction in fading rate using a directional
antenna on the mobile unit. Increasing the antenna directivity further re-
duced the fading rate, at a distance of about 2 mi with an average attenuation
of about 33 dB below free space. Antenna orientation had little effect
17

on the average signal level, but minimum fading occurred along and at right
angles to the direction of motion and in the direction of the base station.
Many studies have been made of the characteristics of multipath. Some
of these deal with the statistics of time-domain representations of
multipath propagation in a mobile radio environment. For some applications
such descriptions are convenient, but in other cases frequency-domain descrip-
tions such as frequency correlation functions and correlation bandwidths are
more useful. In the time domain we consider Doppler shifts, time delays, and
crossing rates. Reudink (1972) noted that fading rate is proportional to ve-
hicle speed and frequency with minima occurring at about half wavelength spac-
ing. The rate of fading and crossing rate are the same for urban and suburban
streets, and for those parallel to and perpendicular to the transmitter in New
York City. In a later report, Reudink (1974) describes the amplitude varia-
tion of the signal envelope as Rayleigh distributed when measured over dis-
tances of a few 10's of wavelengths, with statistically independent phases
from zero to 2π. The vehicle motion introduces a Doppler shift in every wave
and the received frequency differs from that transmitted by an amount
nn kvw αcos= ,
where k=2π/λ, λ is the radio wavelength, v is the velocity of the mobile unit
and αn is the angle between the incoming wave and the direction of motion.
The Doppler shift is bounded by ± kv which is much less than the carrier fre-
quency. For example, at 1000 MHz, with a vehicle traveling 96 km/hr the Dop-
pler shift wn is 560 Hz. At much higher frequencies the Doppler shifts may
lie well within the audio band. Signals arriving by various paths may be
shifted by different amounts producing a beat between them.
Cox (1972a,b) described small-scale statistics of time delays and Doppler
shifts associated with multipath propagation in a vehicle traveling along
suburban streets. He notes that while the distribution of signal amplitudes
at fixed delays is usually Rayleigh this is not always the case. For Doppler
shifts associated with scattered fields arriving from different angles, multi-
path characteristics can be obtained by measuring the complex bandpass impulse
response as a function of distance along the direction of travel. These mea-
surements yield delay Doppler power profiles (scattering functions), average
18

power delay profiles (power impulse responses), and correlation of transfer
function fluctuations as a function of frequency separation. These parameters
set bounds on system performance parameters such as FM-distortion, adjacent
channel interference levels, error rates in digital systems, the effectiveness
of some diversity systems and the accuracy of vehicle locating systems. His
measurements in Middletown, New Jersey, at 910 MHz showed excess power delays
of 6 or 7 µs and delay spread of about 2 µs. In suburban residential and
commercial areas in relatively flat terrain the delay spread is usually less
than 0.25 µs. Cox (1973) reported that measurements in New York City at the
same frequency showed excess time delays of 9 to 10 µs with delay spreads of 2
µs. He describes an urban mobile radio channel as a Gaussian quasi-wide-sense
stationary uncorrelated scattering channel within a 10 MHz bandwidth and for
intervals along the street of up to 30 m. Usually for intervals of more than
50 to 100 m along a street the multipath scattering process becomes grossly
non-stationary.
Bello (1963) has shown that since time and frequency-domain descriptions
are related through Fourier transforms, frequency-domain descriptions can be
obtained directly from time-domain measurements. He suggests that time-
varying linear channels may be characterized in a symmetrical manner by
arranging system functions in time and frequency pairs. For example, he
considers a wide-sense stationary channel in terms of channel correlation
functions. Jakes and Reudink (1967), considering the envelope of the received
signal as a bandlimited time-varying function, obtained power spectra by
taking the Fourier Transform of the autocorrelation function. The spectrum
cutoff occurs at the expected value of 2v/λ Hz. Below this frequency the
energy is approximately uniformly distributed.
Bello (1971) relates multipath and frequency-selective fading caused by
scatter phenomena to the statistical spatial characteristics of the refractive
index. When multipath causes distortion he suggests that the scatter portion
of the channel be modeled as a continuum of uncorrelated scatterers.
Schmid (1970) described a model to predict the probability distribution
of direct path and multipath received signal power. He calculated the proba-
bility of occurrence of distinct multipath propagation of pulse signals over
irregular terrain, and with an irregular distribution of obstacles such as
buildings. Pulse communication systems are generally tolerant of multipath
19
propagation that produces a reflected pulse whose delay is small compared to
the pulse width. If delays are sufficient to pose a potential problem, their
amplitudes will generally have to fall within a certain range of the amplitude
of the direct path signal before system degradation results.
Turin et al. (1972) performed measurements in the San Francisco Bay area
with the simultaneous transmission of 100 ns pulses at 488, 1280, and 2920 MHz
received at a mobile van. They state that most data are by CW techniques and
show fading distributions useful for narrow band systems but are of little use
for analysis and design of wide-band systems, which use as much as 10 MHz
bandwidth for some radiolocation systems. They consider that the propagation
medium acts as a linear filter and consider the impulse response to this fil-
ter. The procedure requires absolute timing for radio-location techniques,
and they used stable, synchronized, and calibrated atomic clocks at both
transmitting and receiving terminals to obtain the statistics of excess
delays. The model assumes that the carrier phases of the various paths are
mutually independent and uniformly distributed over the range zero to 2π. The
statistics of path delays and strengths are then needed to describe the propa-
gation medium. They assume that path strengths over local areas have a
Rayleigh or Rice distribution, while over larger areas they are log-normal,
and that path delays form a Poisson sequence.
Ossanna (1964) described a model for mobile radio fading based on the
geometry of reflections from randomly placed vertical plane reflectors. He
noted that the detailed shape and especially the sharp cutoff frequency of
spectra depend critically on the angle between the direction of vehicle motion
and the direction to the fixed station. As the angle increases from 0° to
90° the cutoff frequency falls from about 37 to 20 Hz. Clarke (1968) devel-
oped a scatter model in contrast to Ossanna's reflection model. This scatter
model assumes that the incident field is composed of randomly phased azimuthal
plane waves of arbitrary azimuthal angles. Amplitude and phase distributions,
spatial correlations, amplitude spectra, and frequency correlations of the
received signal are deduced. In urban areas the amplitude for a short run is
Rayleigh distributed which implies that there is no significant direct com-
ponent and the fields are entirely scattered. In towns and woodlands the dis-
tribution may be Rice or non-zero-mean Gaussian.
20

indicating a significant direct component wave. The spatial correlation of
the field components is derived from the probability density function p(α)
where α is the angle between an input component wave and the vehicle. The
spectrum is derived from p(α) and g(α), the azimuthal gain of the antenna,
and the coherence of two radio frequencies is derived from p(∆t) the proba-
bility of time delays. The model then describes mobile radio fields in terms
of p(α,∆t).
A knowledge of the fine structure of the radio field can be useful in
determining ways to offset destructive fading. For instance, Gilbert (1965)
derived statistical properties from mathematical models of multipath fading,
which include energy density distribution functions. He points out the ad-
vantages of receivinq from a vertically polarized transmitting antenna on
three antennas, a vertical dipole and a pair of loop antennas whose axes are
perpendicular to each other and to the dipole. These receive the three field
components Ez, Hx, and Hy, which are added to obtain the total energy density.
Lee (1967) noted that using an energy density antenna the signal fades only
about half as often as the electric field and the fades do not last as long.
(The antenna receives the three field components simultaneously, and summing
the squares of these signals gives an output proportional to the energy den-
sity.) Several other ways to reduce fading effects are discussed below.
2.5. Diversity Techniques
The depth of fading can be reduced by spatial diversity and predetection
combining. Rustako (1967) noted that multipath fading is greatly reduced
using a predetection combining receiver in four branches. Tests were made at
836 MHz in a mobile van moving at 15 mi per hr in New Providence, using a
single channel and two, three, and four-channel diversity. The receiving
antennas were one-fourth wavelength vertical whips with antenna spacings of
1/4, 3/4, and 5/4 λ. In all tests there was increasing improvement with in-
creasing diversity. With four-channel diversity the fading was reduced from 30
dB to 10 dB fades for 0.1% of the distribution. Rustako et al. (1973)
compared two types of predetection switching space diversity systems at 840
MHz with vehicle speeds at 80 mi per hr. The first type was conventional re-
ceiving antenna switching with a single transmitting antenna. The second type
21
was a feedback diversity system with a single receiving antenna and two trans-
mitting antennas which were switched by remote control from the receiver.
The differences in performance were due primarily to the time delay inherent
in the remote antenna switching. Parsons et al. (1973) suggest the use of a
single receiver diversity system, with a predetection combiner incorporated
into the receiver design, using a 3-element self-phasing antenna array. A
later paper, Parsons et al. (1976), discusses the nature of the electromag-
netic field in urban environments and surveys a number of diversity techniques
as applied to mobile systems. The authors conclude that diversity at the
mobile receiver appears to be preferable to diversity at the base station.
Bitler et al. (1973) describe a system to provide two-way diversity with
diversity combining done at the base station. The mobile transceiver is very
simple, while at the base station we have a multiple branch diversity receiver
and diversity transmitter. Jakes (1971) noted that relatively modest use of
diversity can afford savings in transmitter power of 10 to 20 dB. Such sav-
ings may be achieved using receiver diversity with either selective or maximum
ratio combining of two to four branches, with selection giving somewhat better
performance. The advantages of transmitter diversity are for larger
bandwidths and generally are not as great as for receiver diversity.
Lee (1973) studied the correlation between signals received on two base
station antennas to determine the spacing required for diversity. He noted
that propagation in the direction of a line connecting the two antennas is the
critical case, and requires a large separation of about 70 λ. When the
incoming wave is as much as 150 away from the in-line axis the required spac-
ing drops to 30 λ. Local scatterers near the base station tend to decrease
the correlation between signals at the two antennas, and when the correlation
is less than 0.7 most of the advantages of dual diversity are obtained. In a
built-up urban area, where the base station is surrounded by tall buildings,
the correlation is expected to be low.
Arredondo and Smith (1977) discussed diversity and vehicle speed as they
affect fade durations on voice transmission, and bit-error probability for
data systems.
Different base stations in a mobile radio system transmit different
signals simultaneously, at the same frequency, to mobile vehicles in their
22
respective areas or "cells". As a vehicle moves, both desired and interfering
signals show local deep fading so that at times the undesired signal may be
the stronger. Schiff (1972) described the use of additional antennas to
provide independently fading signals. He considered three different switch
diversity techniques to avoid interference.
3. PROPAGATION MODELS FOR URBAN AREAS
Many investigators have tried to develop ways to predict median values of
propagation loss in built-up areas, where buildings and trees may cause severe
attenuation of the radio signals. Others have been concerned with describing
path-to-path variability and multipath fading in statistical terms.
3.1. Existing Propagation Models
When we consider the median path loss in urban areas, we find that many
investigators calculate first the propagation loss to be expected if the
buildings and other surface features were not present. The additional ob-
served loss is then assumed to be caused by the urban, or suburban, develop-
ment. Over rather smooth terrain, such as we find in Manhattan, theoretical
plane earth values have first been calculated. The differences between
these and the measured values have then been variously referred to as the
shadow loss, excess loss, urban factor, clutter factor, etc. In a similar
manner some investigators have compared measured losses with calculated free
space values.
An early model by Bullington (1947) describes a simplified method for
calculating propagation over a smooth spherical earth, with empirical allow-
ances for the effects of hills and buildings. In a later report, Bullington
(1950) described a "shadow loss" as a function of frequency and terrain irreg-
ularity, which is added to theoretical "plane earth" values. This shadow loss
increases from 0 to 35 dB as a parameter λ/H increases from 0 to 26. Here λ
is the wavelength, and H is the difference in elevation between the lowest
point on a path and the elevation required to provide line-of-sight conditions.
In discussing the effects of buildings and trees he noted that in the range
40 to 450 MHz in Manhattan the median loss at street level is 25 dB greater
than the plane earth value, with a 50 to 90% range of 10 dB. For trees and
23

other objects he found the shadow loss to be small, but it increases with in-
creasing frequency.
Egli (1957) used available data to develop empirical formulas, which he
presented in the form of nomograms and correction curves. The basic model is
the theoretical plane earth field to which he added a "terrain factor" that
depends on frequency but not distance, and an estimate of location variability
that is frequency dependent.
Sets of propagation curves have been developed by the International Radio
Consultative Committee (CCIR) and by the US Federal Communication Commission
(FCC). The CCIR (1974a) Curves for broadcasting services are presented in Re-
commendation 370-2. These show field strength as a function of distance for
various frequency ranges, with correction factors for terrain irregularity,
and estimates of location variability. The FCC curves, reported by Carey
(1964), were derived from certain of the CCIR curves, with adjustments for
antenna heights. These curves of field strength versus distance were adjusted
downward by 9 dB to allow for the low receiving antenna heights. The curves
for various transmitting antenna heights assumed a linear height gain within
line of sight and are blended into the transhorizon values. Damelin and
Daniels (1965) reported some modification in the FCC curves.
Burroughs (1966) compared measurements in urban areas with those in
jungles. He concluded that the additional attenuation observed in both cities
and jungles is frequency sensitive, but its average value is independent of
both antenna height and path length. When the terrain is irregular additional
problems are encountered as some allowance must be made for terrain effects.
Epstein and Peterson (1953) suggest that useful predictions of propagation
can be made using the calculated free-space field reduced by knife-edge
shadow loss in hilly areas, and certain "experience factors" which are func-
tions of transmitting antenna heights in congested suburban and rural areas.
Later the same authors, Epstein and Peterson (1956), noted that received
field strength is a function of surface clutter around the receiving site,
unless the receiving antenna is above the clutter. They therefore defined
a "clutter loss" as a function of angle of arrival of the radiation at the
receiving site, and the frequency, assuming a linear frequency dependence.
Based on the analysis of data at 67 and 850 MHz they define this clutter
24

loss for antennas 5 to 10 ft above housetop levels. La Grone and Chapman
(1961) also noted that the elevation angle toward the transmitter has a
marked effect on the attenuation caused by a solid grove of pine trees. Reu-
dink and Wazowicz (1973) calculated knife-edge diffraction to predict the loss
over a tree-covered hill. The measured loss was about 10 and 20 dB greater
at 836 MHz and 11.2 GHz, respectively. They suggest predicting coverage from
a base station using knife-edge diffraction plus a factor for foliage. Dey-
gout (1966) suggested calculations of multiple knife-edge diffraction to esti-
mate the effects of a series of hills or ridges.
Gilbert (1975) describes a simple model for line-of-sight paths over ran-
dom terrain. He considers all terrain irregularities as composed of conical
hills, all the same height, distributed randomly over a spherical earth. He
then assumed that a base station is located at the peak of a hill and calcu-
lated horizon distances, coverage area, and the probability that a random
point at ground level is within line of sight of a peak at a specified dis-
tance. Neham (1974) compared several propagation models and finally chose
a coverage prediction model based on the plane earth formulation described
by Egli (1957) but his modification allows for irregular terrain in terms of
a factor for location variability.
A somewhat different approach is taken by a group of Japanese investiga-
tors. Okumura et al. (1968) used an extended series. of measurements in Tokyo
and its environs to develop a series of curves of median attenuation relative
to free space as a function of frequency at various distances. These curves,
shown in figure 1, are for an urban area in almost smooth terrain with antenna
heights hte = 200 and hre = 3 m. This basic prediction can then be modified by
a series of correction factors to obtain a prediction for the required situa-
tion. Correction factors relating to suburban and open areas, different an-
tenna heights, vertical angle of arrival of the signal, orientation of the
street, and terrain irregularity, are given.
Kinase (1969) introduced a parameter Γ to represent the effects of envi-
ronmental clutter in the vicinity of a receiving site. He calculates a refer-
ence value using theoretical values for a smooth spherical earth, single and
multiple mountain ridges, cliffs, and rounded and rectangular objects. This
calculated theoretical value is then compared with the observed field to
25

obtain a clutter factor C which is independent of terrain, and describes the
additional attenuation caused by buildings and trees. The clutter factor is
sensitive to differences in urban structure, in frequency, and in angle of
elevation. The parameter Γ expresses the area occupied by buildings, vegeta-
tion, etc. as a percentage of the total area in a unit of 2 sq km. Figure 2
shows median values of C as a function of elevation angle for frequencies of
150 and 750 MHz and values of Γ from 1 to 50%. Figure 3 shows median values
of C as a function of frequency at a constant elevation angle of 0.005 rad for
values of Γ from 1 to 50%.
While Kinase (1969) observed that lowering the receiving antenna from
26

27

10 m to 4 m had little effect on location variability in rural and suburban
areas, one would expect greater variability at street level than on rooftops
in an urban area.
A study by Dymovich (1959), which reviewed the results of early measure-
ment programs and prediction models, suggested that field strength in towns be
predicted as a function of the radiated power, the product of the antenna
heights, and the reciprocal path length, with two coefficients to be deter-
mined by data. He noted that measured values of field strength are log-
normally distributed, and that measurements in Leningrad at 45 MHz, with
receiving antenna heights of 5.2 and 8.2 m show the same location distribu-
tion, with a 10 to 90% range of 6 dB.
Palmer (1976) reviewed much of the work on propagation in land mobile
systems in the 470 to 890 MHz frequency range. He considered a number of
propagation models that are currently in use. These have all been developed
to fit measured data, and are expressed as functions of frequency, antenna
heights, and distance, with allowances for path-to-path variability. Neham
(1974) in a similar comparison of existing models noted that the various
models give similar results in predicting coverage ranges for 90% of the
receiver locations. For this 90% comparison he used location variability
factors of 11, 14, and 17 dB in the frequency bands 25 to 50 MHz, 150 to 170
MHz and 450 to 470 MHz, respectively.
Allsebrook and Parsons (1977) report the results of measurements in
three British cities, Birmingham, Bath, and Bradford. The median attenuation
relative to plane earth values was 16, 18, and 35 dB at frequencies of 86,
167, and 441 MHz respectively. This urban attenuation was not dependent on
distance for a range of 1 to 10 mi, but was strongly frequency dependent.
They suggest a model for predicting propagation loss to mobile receivers as
the sum of plane earth loss plus diffraction loss over obstacles plus a cor-
rection factor for UHF. For a hilly city, such as Bradford, they use an
additional term to allow for the effects of hills.
In a recent paper Bullington (1977) presented a series of nomograms for
the ready calculation of free space, plane earth, and diffraction losses.
He commented that buildings are more transparent to radio waves than the earth
is, so they should not cause as much attenuation as hills. On the other hand
28

the artificial canyons caused by buildings in cities are much narrower than
naturally occurring ones, which would increase the attenuation. At higher
frequencies, about 1000 MHz, if trees block one's vision they are equivalent
to solid obstacles.
Durkin (1977) reports a prediction model used for frequency assignment
procedures for the land-mobile services in the United Kingdom. This model
combines values from the CCIR (1974a) curves within line-of-sight with values
calculated using the Longley and Rice (1968) model for transhorizon paths.
The latter is used, with digitized terrain elevations, to calculate the at-
tenuation to a large number of points along 72 equally spaced radials from the
transmitter. Field strength contours are then drawn to show the predicted
service area. He gives a comparison with measurements made at 85 MHz along
one of these contours from a transmitter base in Barkway, Hertfordshire.
The various models described above have been used to estimate median
attenuation in urban areas. There is also considerable variation from path-
to-path about this median value. Estimates of path-to-path or location vari-
ability are based on the results of measurements, which show that the varia-
bility is log-normally distributed with a standard deviation that ranges from
about 5 to 20 dB depending on the radio frequency, type of terrain, and whe-
ther the lower terminal is in open or cluttered surroundings.
Saxton and Harden (1954) reported measurements at 593.6 MHz which showed
10 to 90% ranges of 19 to 34 dB. Location variations over short distances
showed smaller ranges of 2 to 4 dB at open sites, 8 to 10 dB with isolated
trees and buildings, and 15 to 20 dB in a built-up area with trees and large
buildings.
Report number 228, CCIR (1974b) describes a variation factor, V (50 to
90% of locations) for towns in the United Kingdom. In 121 towns at frequen-
cies from 700 to 1000 MHz the median location variability V was 9.8 dB, while
in 40 towns at 250 MHz the observed median V was 7.7 dB. These correspond to
standard deviations of approximately 7.8 and 6.2 dB for the higher and lower
frequency bands, respectively.
Okumura et al. (1968) observed a gradual increase in location variability
with increasing frequency, the standard deviation increasing from 5 to 8 dB,
and from 6.5 to 10 dB as frequency increased from 100 to 3000 MHz in the
29

smooth urban area of Tokyo, and in the hilly suburbs, respectively. However,
in highly built-up urban areas the variability may be much greater. Waldo
(1963) reported standard deviations of 16, 17, and 18 dB at frequencies of 57,
177, and 576 MHz at rooftop receiving antennas in Manhattan.
Reudink and Wazowicz (1973) observed that location variability in Holm-
del, New Jersey, increased with increasing distance from a base station to
standard deviations of 15, and 18 to 20 dB at 836, and 11,200 MHz, respec-
tively, at a distance of 12,000 to 18,000 ft. Neham (1974) suggests that in
an urban area location variability factors of 11, 14, and 17 dB be used for
frequency ranges of 25 to 50, 150 to 170, and 450 to 470 MHz to estimate 90%
values. These would correspond to standard deviations of about 9, 11 and 14
dB for these three frequency ranges. The CCIR (1974c) recommends that
location variability at frequencies from 450 to 1000 MHz should include an
allowance for terrain irregularity. They show standard deviations of 10, 15,
and 18 dB for rolling, hilly and mountainous terrain, respectively, in this
frequency range.
Several investigators have shown that location variability increases with
increasing frequency. This relationship has been expressed mathematically in
terms that agree fairly well in the lower VHF range but give estimates of
standard deviation that differ by more than 10 dB at 1000 MHz. A recent
report, Longley (1976), summarizes much of the earlier work, and describes
location variability as a function of the parameter ∆h/λ, where λ is the
radio wavelength and ∆h is a measure of terrain irregularity. This relation-
ship was developed from data that were obtained largely in non-urban areas.
3.2. A Computer Prediction Model
Some of the parameters that have been shown to be important in urban
propagation are: the radio frequency, the heights of buildings and trees
relative to the height of the receiving antenna, the distance from the
receiving antenna to the nearest obstacles, the uniformity and density of
surface structures, and the possible absorption of radio energy by such
obstacles.
Since the distribution and shape of clutter surroundings is quite irreg-
ular we must consider the problems on a statistical basis. The transmitting
30
antennas for broadcast services, and the base station antennas for mobile sys-
tems, are usually well elevated above the buildings and trees, so we may con-
sider the dominant factors influencing propagation to homes and mobile units
to be (a) terrain irregularities along the transmission path, and (b) the ur-
ban or environmental clutter near the receiving site. If, however, the trans-
mitting antenna is not elevated well above surrounding buildings, some atten-
uation results from interference to the direct transmission path, and nearby
buildings could block out whole areas from adequate service.
A propagation model for computerized predictions of transmission loss
over irregular terrain, developed by Longley and Rice (1968), is applicable to
broadcast and mobile services. This model is based on propagation theory, and
has been compared with measurements for a wide range of frequencies, antenna
heights, terrain types and distances. Several small modifications have been
made since the development of the original prediction model. Some of these
have simplified certain computations, or increased the efficiency of computer
programming. But, recently, changes have been made in the original formula-
tion of the model in the line-of-sight region. These changes are described in
the appendix to this report. They provide better agreement with both theo-
retical and measured values, especially at UHF with one antenna elevated, than
was obtained with the original method. The propagation model calculates
transmission loss, with allowances for radio frequency, terrain irregularity,
path length, and antenna elevations.
Most of the data previously considered were from open areas, towns and
small cities. To this model we can now add an allowance for the additional
attenuation due to urban clutter near the receiving antenna. This allowance
is a function of radio frequency, distance from the transmitter, and probably
the density of urban clutter. To estimate this allowance, a comparison is
made with curves through measured values.
Some of the most widely used prediction curves that were drawn through
measured values are those of the International Radio Consultative Committee
(CCIR), the U. S. Federal Communication Commission (FCC), and those derived
by Okumura et al. (1968) and shown in figure 1. These are all empirical curves,
based on measurements, and are to a considerable extent interrelated. The
curves shown in CCIR Report number 567 (1974d), and intended for the land-mobile
services at 150 MHz, are obtained from the curves in CCIR Recommendation 370
31

by adjusting the receiving antenna height from 10 m down to 3 m, an increase
in attenuation of about 10 dB. The CCIR 150 MHz curve, with h1 = 200 m and
h2 = 3 m, for rural conditions, shows about 3 dB less attenuation than the
corresponding Okumura curve, for urban conditions. The CCIR curves at
frequencies of 450 and 900 MHz for an urban area are taken directly from the
basic Okumura curves, with 3 dB additional attenuation for a receiving antenna
height of 1.5 m instead of 3 m. The FCC curves, in turn, were derived in part
from the CCIR curves shown in Recommendation No 370 (1974a) assuming a linear
height gain within line of sight and blending into the transhorizon region.
Because these prediction curves have been widely accepted, and are inter-
related as shown, we compared values of attenuation relative to free space
calculated for non-urban areas using the modified Longley-Rice computer model,
with those read from Okumura's curves, figure 1, for an urban area. For both
models we assumed rather smooth terrain with effective antenna heights of
200 m and 3 m. Values were obtained for frequencies from 100 to 3000 MHz,
and for distances up to 100 km. As expected, the Okumura urban curves show
greater attenuation. The differences between the two models may be considered
as representing the additional power loss in an urban area, and referred to
as an "urban factor". The values listed in Table 2 show this factor for each
frequency and distance. The urban factor, UF, increases smoothly with in-
creasing frequency, and decreases with increasing distance from the transmit-
ter. With frequency in MHz and distance in km this relationship can be ex-
pressed quantitatively as
UF=16.5+15 log(f/100)–0.12d dB, (1)
with an error of less than 1 dB at all frequencies, to a distance of 70 km.
At frequencies greater than 500 MHz, and distances greater than 70 km this
relationship tends to over-estimate the loss, because the attenuation de-
creases somewhat more rapidly with distance in this range.
Comparisons were also made between the two models at frequencies of
150 and 450 MHz with transmitter effective heights of 30, 50, 100, 200, 600,
and 1000 m. The differences between Okumura and Longley-Rice predictions show
little change with height as the height is increased from 30 to 600 m.
This computer prediction model, with the urban factor added, should ade-
quately predict the median attenuation for moderately large cities in rather
32

smooth terrain. The median attenuation is calculated as a function of dis-
tance for a desired frequency, antenna heights, and degree of terrain irregu-
larity in both urban and non-urban areas.
There is also a place-to-place or location variability to be considered.
As described in an earlier report, Longley (1976), the standard deviation,
σL, of this location variability is a function of frequency and terrain ir-
regularity. For data from non-urban areas, with randomly located receiving
antennas, this relationship is expressed as
σL=6+0.55(∆h/λ)1/2-0.004(∆h/λ) dB, (2)
where ∆h is the terrain irregularity parameter and λ is the radio wavelength.
In smooth to slightly hilly terrain the frequency dependence is
σL ≅ 5 log f-1 dB (3)
for frequencies ≥ 10 MHz. This is more variability than that observed by
Okumura in Japan but agrees with the relationship shown by Egli (1957).
To determine the service area of a transmitting station, a simple area
prediction of transmission loss as a function of distance may be used as
described above. However, if the terrain in an area is not homogeneous, the
computer model may be used to compute attenuation from point-to-point along
33

a large number of radials from the transmitter. When digitized terrain ele-
vations are available the profile along each radial is computed and the at-
tenuation to a large number of points along each radial is calculated. With
this information field strength contours can then be drawn to show in detail
the predicted service area. Durkin (1977) describes using the Longley-Rice
(1968) model for this purpose in automated frequency assignment procedures for
the land mobile radio services in the United Kingdom.
4. SUMMARY AND CONCLUSIONS
This paper has reviewed much of the earlier work on urban propagation
including the results of measurements by many investigators, and a number of
models developed for predicting transmission loss in urban conditions. Some
of the more important propagation parameters have been identified. A compu-
terized model is described in section 3.2 for predicting median attenuation as
a function of distance and for determining the service area of a transmitting
station, in an urban area. Equations are also given for calculating the loca-
tion variability as a function of frequency and terrain irregularity, or for
rather smooth terrain as a function of frequency alone. This computer model
provides a ready means for determining the service area of a transmitter for
broadcast and mobile services. However, a number of questions remain, and
further analysis and development are desirable.
For example, most of the urban data are from areas where the terrain
itself is rather smooth. What happens in a city where the terrain is hilly?
Would this modify the "urban factor"? A limited amount of data indicates
that this may indeed be the case. Measurements made in Pittsburgh by Barton
and Wagner (1974) were compared with the Longley-Rice (1968) area prediction.
The measurements at 455 and 862 MHz were made over 2 paths at distances of
16 and 32 km. For the shorter path the terrain parameter ∆h=185 m and for
the longer one ∆h=116 m. This represents quite hilly terrain. For these
paths the computed attenuation agreed well with the measured values with no
addition of an urban factor. This would suggest that the urban factor is
also a function of terrain irregularity and decreases as the terrain becomes
more irregular. Further study, including point-to-point predictions along the
two profiles, would help to clarify this question.
34

It would be of considerable interest to pursue the question of the
effects of elevation angle at the receiving antenna. This would require a
knowledge of the heights of buildings and trees relative to the height of
the receiving antenna, and the distance to the nearest obstacles. When the
angle is low the ray path through the surface clutter is long, causing consi-
derable attenuation, but as the elevation angle is increased the attenuation
decreases rather sharply as the path of the radio ray rises above the clutter.
This suggests a possible critical angle above which the radio energy is dif-
fracted over and around the surface obstacles.
We have tended to emphasize the effects of buildings and trees near the
lower, or mobile, antenna. With very high transmitting antennas this is
probably the most important effect, but with antennas only 50 to 80 m high
the proximity of very tall buildings has a marked effect. Recent measurements
show field strength values some 15 dB lower from a transmitter in an urban
area than from one in a suburban or residential area to receivers in similar
surroundings (Kozono and Watanabe, 1977).
In a highly built-up area, such as parts of Manhattan, a general propa-
gation model, such as that described in section 3.2 of this report, cannot al-
low for the differences observed along radial and cross streets, and for areas
that are screened by very tall buildings. Such problems would require special
treatment including consideration of the specific situations involved.
35

5. REFERENCES Aikens, A. J., and L. Y. Lacy (1950), A test of 450 Mc urban area transmission
to a mobile receiver, IRE Proc. 38, pp. 1317-1319. Allsebrook, K., and J. D. Parsons (1977), Mobile radio propagation in British
cities at frequencies in the VHF and UHF bands. IEEE Trans. VT-26, pp. 313-323.
Arredondo, G. A., and J. I. Smith (1977), Voice and data transmission in a
mobile radio channel at 850 MHz. IEEE Trans. VT-26 No 1, pp. 88-93. Barton, F. A., and G. A. Wagner (1974), What happens when 900 MHz and 450 MHz
take to the hills? Communications Mar pp. 20-24, Apr pp. 22-25. (Also IEEE VT Conf Record 1973).
Bello, P. A. (1963), Characterization of randomly time-variant linear
channels, IEEE Trans. CT-ll pp. 360-393. Bello, P. A. (1971), A study of the relationship between multipath distortion
and wavenumber spectrum of refractive index in radio links, Proc. IEEE 59, pp. 47-75.
Bergman, C. W., and H. C. Vivian (1970), Long-range patrol communications,
Final Report, JPL Doc 650-109. NASA. Bitler, H. S., H. H. Hoffman, and C. O. Stevens (1973), A mobile radio single-
frequency two-way diversity system using adaptive retransmission from the base, IEEE Trans. VT-22, pp. 157-163.
Black, D. M., and D. O. Reudink (1972), Some characteristics of mobile radio
propagation at 836 MHz in the Philadelphia area, IEEE Trans. VT-2l, pp. 45-51.
Brooks, C. N. (1965), FM transmission of video between moving vehicles moving
over a flat earth. IEEE Trans. VC-14, No 1, pp. 67-87. Brown, G. H., J. Epstein, and D. W. Peterson (1948), Comparative propagation
measurements: TV transmission at 67.25, 288, 510, and 910 megacycles, RCA Rev. 9, pp. 177-201.
Bullington, K. (1947), Radio propagation at frequencies above 30 MHz. Proc.
IRE 35, pp. 1122-1136. Bullington, K. (1950), Radio propagation variations at VHF and UHF. Proc. IRE
38, pp. 27-32. Bullington, K. (1957), Radio propagation fundamentals, BSTJ 36, pp. 593-626.
36

Bullington, K. (1977), Radio propagation for vehicular communications, IEEE Trans. VT-26, No 4, pp. 295-308.
Burrows, C. R. (1966), Ultra-short-wave propagation in the jungle. IEEE Trans
AP-14, No 3, pp. 386-388. Burrows, C. R., L. E. Hunt, and A. Decino (1935), Ultra-short-wave propaga-
tion: mobile urban transmission characteristics. BSTJ 14, pp. 253-272. Carey, R. (1964), Technical factors affecting the assignment of facilities in
the domestic land mobile radio service. FCC Report R-6406. CCIR,* (1974a) VHF and UHF propagation curves for the frequency range from
30 MHz to 1000 MHz. Broadcasting services, Recommendation 370-2, Vol V CCIR XIIIth Plenary Assembly, Geneva.
CCIR,* (1974b) Measurement of field strength for VHF and UHF broadcast ser-
vices, including television. Report 228-1, Vol V, XIIIth Plenary As-sembly, Geneva.
CCIR,* (1974c) Propagation statistics required for broadcasting services,
using the frequency range 30 to 1000 MHz. Report 239-3, Vol V, XIIIth Plenary Assembly, Geneva.
CCIR,* (1974d) Propagation curves and statistics required for land mobile ser-
vices using the frequency range 30 MHz to 1 GHz. Report 567, Vol V, XIIIth Plenary Assembly. Geneva.
Clarke, R. H. (1968), A statistical theory of mobile radio reception, BSTJ 47,
pp. 957-1000. Cox, D. C. (1972a), Delay Doppler characteristics of multipath propagation at
910 MHz in a suburban mobile-radio environment, IEEE Trans. AP-20, pp. 625-635.
Cox, D. C. (1972b), Time-and-frequency domain characterizations of multipath
propagation at 910 MHz in a suburban mobile-radio environment, Radio Sci. 7, pp. 1069-1077.
Cox, D. C. (1973), 910 MHz urban mobile-radio propagation: multipath charac-
teristics in New York City, IEEE Trans. COM-2l, pp. 1188-1193. See also IEEE Trans. VT-22, pp. 104-110.
Cunningham, M. L. (1973), 900 MHz land-mobile radio improved using circular
polarization, IEEE Trans. VT-22, pp 237-239. Damelin, J., and W. A. Daniels (1965), Development of new VHF and UHF propaga-
tion curves for TV broadcasting. FCC Report No R-6502. _____________ *Published by the International Telecommunication Union, Geneva, Switzerland.
37

Deitz, J. (197l), Examination of the feasibility of conventional land-mobile operations at 950 MHz. Phase 1, Base to Mobile, FCC Report No R-7102.
Deygout, J. (1966), Multiple knife-edge diffraction of microwaves. IEEE
Trans. AP-14, p. 480. Durkin, J. (1977) Computer prediction of service areas for VHF and UHF land
mobile radio services. IEEE Trans. VT-26, No 4, pp. 323-327. Dymovich, N. D. (1959), Urban propagation of ultrashort, radio waves. Tele-
comm. No 12, pp. 1343-1355. (USSR Translation, Pergammon Press) Egli, J. J. (1957), Radio propagation above 40 MHz over irregular terrain.
Proc IRE 45, pp. 1383-1391. Engel, J. S. (1969), Effects of multipath transmission on the measured propa-
gation delay of an FM signal. IEEE Trans. VT-18, No 1, pp. 44-52. See also VT-18, pp. 110-116.
Epstein, J., and D. W. Peterson (1953), An experimental study of wave propa-
gation at 850 Mc. Proc IRE 41, pp. 595-611. Epstein, J., and D. W. Peterson (1956), A method of predicting the coverage of
a television station. RCA Rev 17, pp. 571-582. Figel, W. G., N. H. Shepherd, and W. F. Trammell (1969), Vehicle location by a
signal attenuation method. IEEE Trans. VT-18, No 3, pp. 105-109. Fine, H. (1952), Variation of field intensity over irregular terrain within
line-of-sight for the UHF band. IEEE Trans. AP-4, pp. 53-65. Gilbert, E. N. (1965), Energy reception for mobile radio. BSTJ 44, pp. 1779-
1803. Gilbert, E. N. (1975), Line-of-sight paths over random terrain, BSTJ 54, pp.
735-765. Glentzer, K. V. (1956), 450 Mc coverage at Chicago. IRE Trans VC-6, pp. 20-32. Goldsmith, T. I., R. P. Wakeman, and J. D. O’Neill (1949), A field survey of
television channel 5 propagation of New York Metro Area, Proc. IRE 37, pp. 556-560.
Hagn, G. H., and G. E. Barker (1970), "Research Engineering and Support for
Tropical Communications" Final Report Sept 1962 - Feb 1970. SRI Project 4240, Stanford Res. Inst., Menlo Park, Calif, (NTIS, Springfield VA, Ac-cess No. AD 889 169).
Head, H. T. (1960), The influence of trees on television field strengths at
ultra-high frequencies, Proc. IRE 48, pp. 1016-1020.
38

Head, H. T. and O. L. Prestholdt (1960), The measurement of television field strengths in the VHF and UHF bands. Proc. IRE 48, pp. 1000-1008.
Herbstreit, J. W., and W. Q. Crichlow (1964), Measurement of the attenuation
of radio signals by jungles, J. Res. NBS (Radio Sci.) 68D, pp. 903-906. Holmes, R. S., and A. H. Turner (1936), An urban field strength survey at
thirty and one hundred megacycles. Proc. IRE 24, pp. 755-770. Hutton, D. B. (1963), Report on mobile field strength measurements, New York
City UHF-TV Project, FCC Rept. No. R-6302. Jakes, W. C., Jr. (1971), A comparison of specific space diversity techniques
for reduction of fast fading in UHF mobile radio systems, IEEE Trans. VT-20, pp. 81-92.
Jakes, W. C. Jr., and D. O. Reudink (1967), Comparison of mobile radio trans-
mission at UHF and X-band, IEEE Trans. VT-16, pp. 10-14. Jones, L. F. (1933), A study of the propagation of wavelengths between three
and eight meters. Proc. IRE 21, pp. 349-386. Kinase, A. (1969), Influence of terrain irregularities and environmental clut-
ter surroundings on the propagation of broadcasting waves in the UHF and VHF bands, NHK (Japan Broadcasting Corp.), Tech. Memo 14, pp. 1-64.
Kirby, R. S., and F. M. Capps (1956), Correlation of VHF propagation over
irregular terrain. IRE Trans. AP-4, pp. 77-85. Kirke, H. L., R. A. Rowden, and G. I. Ross (1951), A vhf field strength survey
on 90 mc/s. Proc. IEE 98 Part 3, pp. 343-359. Kozono, S., and K. Watanabe (1977), Influence of environmental buildings on
UHF land mobile radio propagation. IEEE Trans. COM-25, No 10, pp. 1133-1143.
La Grone, A. H. (1977), Propagation of VHF and UHF electromagnetic waves over
a grove of trees in full leaf. IEEE Trans. AP-25, pp. 866-869. La Grone, A. H., and C. W. Chapman (1961), Some propagation characteristics of
high UHF signals in the immediate vicinity of trees, IRE Trans. AP 9, pp. 487-491.
Lee, W.C-Y. (1966), Preliminary investigation of mobile radio signal fading
using directional antennas on the mobile unit. IEEE Trans. VT-15, pp. 8-15.
Lee, W.C-Y. (1967), Statistical analysis of the level crossings and duration
of fades of the signal from an energy density mobile radio antenna, BSTJ 46, pp. 417-448. See also Theoretical and Experimental study of the properties of the signal from an energy density mobile radio antenna, IEEE Trans. VT-16, pp. 25-32.
39

Lee, W.C-Y. (1973), Effects on correlation between two mobile base-station antennas, IEEE Trans. VT-22, pp. 130-140.
Longley, A. G. (1976), Location variability of transmission loss--land mobile
and broadcast systems, OT Report 76-87 (NTIS, Springfield VA, Access No. PB 254 472).
Longley, A. G., and G. A. Hufford (1975), Sensor path loss measurements,
analysis and comparison with propagation models, OT Report 75-74 (NTIS, Springfield VA, Access No. PB 247 638/AS).
Longley, A. G., and P. L. Rice (1968), Prediction of tropospheric radio trans-
mission loss over irregular terrain--A computer method--1968. Essa Tech Report ERL79-ITS67 (NTIS, Springfield VA, Access No. 676 874).
Megaw, E. C. S. (1948), Some effects of obstacles on the propagation of very
short radio waves, Jour. IEE 95, Pt. III, pp. 97-105. McPetrie, J. S., and L. H. Ford (1946), Some experiments on the propagation
overland of radiation of 9.2 cm wavelength especially on the effects of obstacles, Jour. IEE 93, Pt. IIIA, pp. 531-538.
Muyskens, H., and J. D. Kraus (1933), Some characteristics of ultra high fre-
quency transmission. Proc. IRE 21, pp. 1302-1316. Neham, E. A. (1974), An approach to estimating land-mobile radio coverage,
IEEE Trans. VT-23, pp. 135-138. Nylund, H. W. (1968), Characteristics of small-area signal fading on mobile
circuits in the 150 MHz band, IEEE Trans. VT-17, pp. 24-30. Okumura, Y., E. Ohmori, T. Kawano, and K. Fukuda (1968), Field strength and
its variability in VHF and UHF land-mobile radio service, (Tokyo), Rev. Elec. Com. Lab. 16, pp. 825-873.
Ossanna, J. F. Jr. (1964), A model for mobile radio fading due to building
reflections, Theoretical and experimental fading waveform power spectra, BSTJ 43, pp. 2935-2971.
Palmer, F. H. (1976), Review of propagation in the 470-890 MHz band with em-
phasis on land mobile and cellular systems. CRC Report No 1218, Com Res Center, Ottawa, Canada.
Parsons, J. D., P. A. Ratliff, M. Henze, and M. J. Withers (1973), Single--
receiver diversity systems, IEEE Trans. VT-22, pp. 192-196. Parsons, J. D., M. Henze, P. A. Ratliff, and M. J. Withers (1976), Diversity
techniques for mobile radio reception, IEEE Trans. VT-25 No 3, pp. 75-85. Peterson, D. W. (1963), Comparative study of low VHF, high VHF, and UHF tele-
vision broadcasting in the New York City area, RCA Rev. 24, pp. 57-93.
40

Pounds, D. J., and A. H. La Grone (1963), Considering forest vegetation as an imperfect dielectric slab, Rept. No. 6-53, EERL, University of Texas.
Reudink, D. O. (1972), Comparison of radio transmission at X-band frequencies
in suburban and urban areas, IEEE Trans. AP 20, pp. 470-473. Reudink, D. O. (1974), Properties of mobile radio propagation above 400 MHz,
IEEE Trans. VT-23, pp. 143-159. Reudink, D. O., and M. F. Wazowicz (1973), Some propagation experiments re-
lating foliage loss and diffraction loss at X-band and UHF frequencies, IEEE Trans. VT-22, pp. 114-122. See also IEEE Trans. Com 21, pp. 1198-1206.
Rice, P. L. (1971), Some effects of buildings and vegetation on VHF/UHF
propagation, IEEE EMC Conf. Record, Tucson, Arizona. Rustako, A. J. Jr. (1967), Evaluation of a mobile-radio multipath channel
diversity receiver using pre-detection combining, IEEE VT-16, pp. 46-57. Rustako, A. J. Jr., Y. S. Yeh, and R. R. Murray (1973), Performance of feed-
back and switch space diversity 900 MHz FM mobile radio systems with Rayleigh fading, IEEE Trans. VT-22, pp. 173-184.
Sakowski, K. H. (1971), Results of propagation measurements in cities at
12 GHz. NTZ 1971, Heft 11, pp. 585-588. Saxton, J. A., and B. N. Harden (1954), Ground-wave field strength surveys at
100 and 600 Mc/s, Proc. IEE 101, Pt. III, pp. 215-221. Saxton, J. A., and J. A. Lane (1955), VHF and UHF reception effects of trees
and other obstacles, Wireless World 61, pp. 229-232. Schiff, L. (1972), Statistical suppression of interference with diversity in a
mobile-radio environment, IEEE Trans. VT-21, pp. 121-128. Schmid, H. F. (1970), A prediction model for multipath propagation of pulse
signals at VHF and UHF over irregular terrain, IEEE Trans. AP 18, pp. 253-258.
Skrivseth, A. G. (1961), New York UHF-TV Project of the Federal Communications
Commission, IRE Trans. PGB 7, pp. 24-26. See also IRE Conv. Record (1962), 7, pp. 101-103.
Sofaer, E., and C. P. Bell (1966), Factors affecting the propagation and re-
ception of broadcasting signals in the UHF bands, Proc. IEE 113, pp. 1133-1140.
Stidham, J. R. (1966), Experimental study of UHF mobile radio transmission
using a directive antenna. IEEE Trans. VC-15 No 2, pp. 16-24.
41
Sturgill, L. G. et al. (1965-1967), Tropical propagation and research. A series of semi-annual reports No. 6-10, and Final Rept. 1, Atlantic Re-search Corp., Alexandria, Va.
Tamir, T. (1967), On radio-wave propagation in forest environments, IEEE
Trans. AP 15, pp. 806-817. Trevor, B. (1940), Ultra-high frequency propagation through woods and under-
brush, RCA Rev. 5, pp. 97-100. Trifonov, P. M., V. N. Buelko, and V. S. Zotov (1964), Structure of USW field
strength spatial fluctuations in a city, Trans. Telecomm. Radio Eng. 9, pp. 26-30. (Translated from Russian Elektrosvyoz and Radiotekhnika.)
Turin, G. L., F. D. Clapp, T. L. Johnston, S. B. Fine, and D. Lavry (1972),
A statistical model of urban multipath propagation, IEEE Trans. VT-21, pp. 1-9.
Vincent, W. R. (1969), Comments on the performance of VHF vehicular radio sets
in tropical forests, IEEE Trans. VT-18, No 2, pp. 61-65. Waldo, G. V. (1963), Report on the analysis of measurements and observations
New York City UHF-TV Project, IEEE Trans. BC 9, No 2, 7-36. Young, W. R. (1952), Comparison of mobile radio transmission at 150, 450, 900,
and 3700 Mc, BSTJ 31, pp. 1068-1085. Young, W. R. Jr., and L. Y. Lacy (1950), Echoes in transmission at 450 Mc from
land-to-car radio units. Proc. IRE 38, pp. 255-258.
42

APPENDIX
1977 MODIFICATION OF THE LONGLEY-RICE COMPUTER MODEL
The Longley-Rice model was originally developed for use with rather low
antennas in irregular terrain, and was tested against data from measurements
made with low antennas at frequencies from 20 to 100 MHz. Very few of these
original test paths had terminals within radio line-of-sight. Later tests
against data obtained with higher antennas and at higher frequencies showed
rather poor agreement with the line-of-sight area predictions.
The present study was undertaken to improve the formulation in the area
prediction model for possible line-of-sight paths. As a first step computa-
tions made using the original propagation model for smooth earth conditions
were compared with values obtained from smooth earth theory. Then comparisons
were made between calculated values and data obtained from measurements over
irregular terrain. These studies indicate the need for several changes in the
line-of-sight model for area predictions.
In considering propagation over a smooth earth, the model makes no at-
tempt to predict the "lobing" that occurs with high antennas at UHF as a re-
sult of alternate enhancement and cancellation of the direct ray by one re-
flected from the surface of the ground. This "lobing" is illustrated in fig-
ure A-1, which shows field strength as a function of distance over a smooth
homogeneous earth at a frequency of 100 MHz, for several antenna heights. The
horizon distance is marked by a dot on each curve, while the dashed line rep-
resents the free space field. Our "area" prediction model calculates atten-
uation relative to free space for distances beyond that at which the field is
last equal to the free space field. For shorter distances we assume that the
field is equal to the free space field, disregarding both the enhancement and
cancellation that may occur. We made this decision because the model is
intended for use over irregular terrain, where changes in the surface features
break up the regular reflection pattern that occurs over smooth terrain.
In the propagation model, two distances, d0, d1, smaller than the smooth-
earth horizon distance, dLS, are chosen, and the attenuation relative to free
space is calculated for each of these three distances. A smooth curve is then
fitted through these three points to provide an estimate of attenuation as a
43
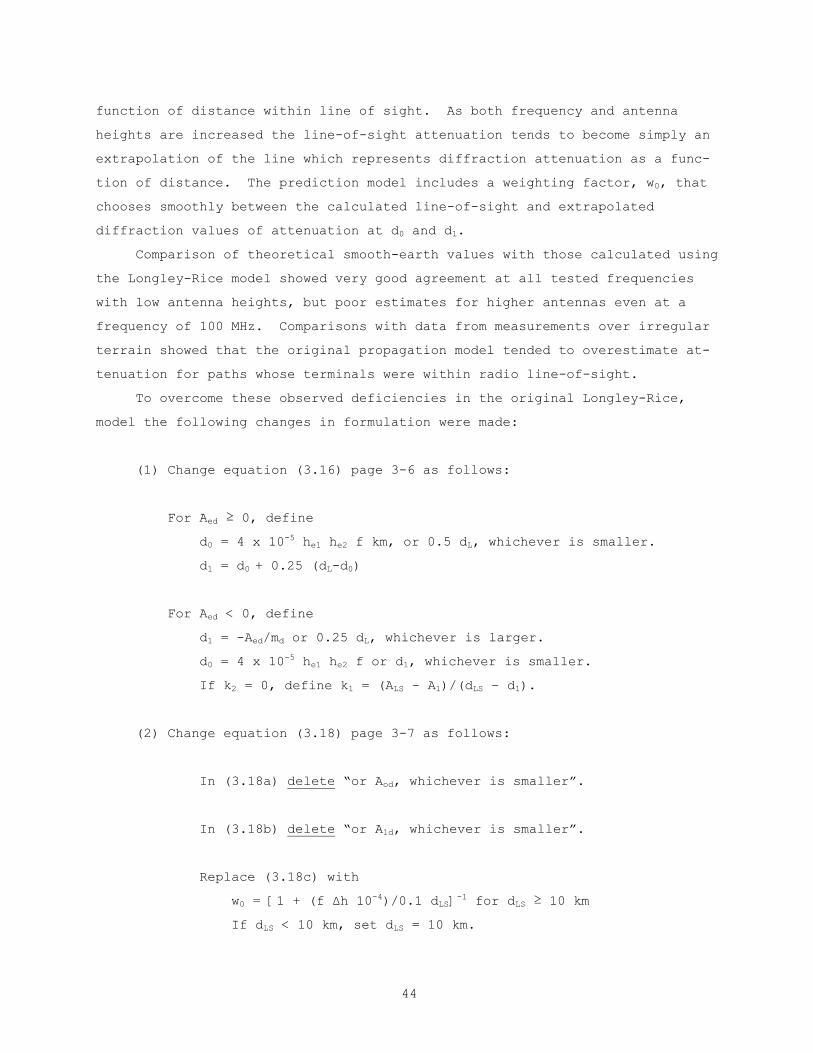
function of distance within line of sight. As both frequency and antenna
heights are increased the line-of-sight attenuation tends to become simply an
extrapolation of the line which represents diffraction attenuation as a func-
tion of distance. The prediction model includes a weighting factor, w0, that
chooses smoothly between the calculated line-of-sight and extrapolated
diffraction values of attenuation at d0 and d1.
Comparison of theoretical smooth-earth values with those calculated using
the Longley-Rice model showed very good agreement at all tested frequencies
with low antenna heights, but poor estimates for higher antennas even at a
frequency of 100 MHz. Comparisons with data from measurements over irregular
terrain showed that the original propagation model tended to overestimate at-
tenuation for paths whose terminals were within radio line-of-sight.
To overcome these observed deficiencies in the original Longley-Rice,
model the following changes in formulation were made:
(1) Change equation (3.16) page 3-6 as follows:
For Aed ≥ 0, define
d0 = 4 x 10⁻⁵ he1 he2 f km, or 0.5 dL, whichever is smaller.
d1 = d0 + 0.25 (dL-d0)
For Aed < 0, define
d1 = -Aed/md or 0.25 dL, whichever is larger.
d0 = 4 x 10⁻⁵ he1 he2 f or d1, whichever is smaller.
If k2 = 0, define k1 = (ALS – A1)/(dLS – d1).
(2) Change equation (3.18) page 3-7 as follows:
In (3.18a) delete “or Aod, whichever is smaller”.
In (3.18b) delete “or A1d, whichever is smaller”.
Replace (3.18c) with
w0 = [1 + (f ∆h 10-4)/0.1 dLS]-1 for dLS ≥ 10 km
If dLS < 10 km, set dLS = 10 km.
44

Some comparisons of calculated theoretical smooth-earth values of attenu-
ation relative to free-space loss with those calculated by the original Long-
ley-Rice model, and as modified above, are shown in figures A-2, A-3, and A-4.
These three figures show attenuation below free space as a function of dis-
tance over a smooth earth. In all three figures one antenna is at a fixed
elevation, with the other at the elevations shown which range from 5 to 2000
m. The solid dots are at the horizon distance on each curve. The solid lines
were drawn using the proposed modifications, and the dashed lines were calcu-
lated using the original Longley-Rice 1968 Model. The open circles are calcu-
lated points based on smooth earth theory, which are connected by smooth
curves. These figures clearly show good agreement of the model with
theoretical values with low antennas, and the improvement using the modified
prediction with higher antennas.
45
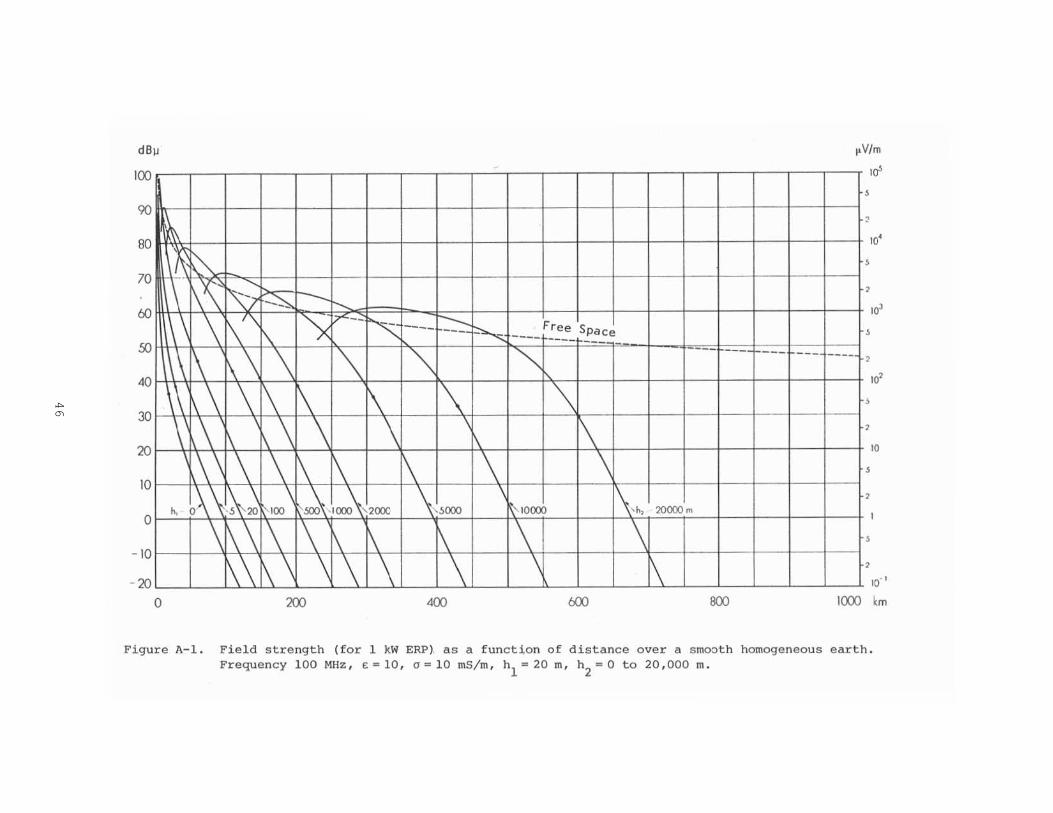
46
dBu
100
' ~~
1\ f0-. S 1'\/ -~ --
90
80
70
\ \ r\\ )< ~--1,\
o
\\ 1\ \ \ '\ \ \ \ \ 1\ \ \ .\ \ \ \\ \ \ \ \ \
, ~~ \ I~~ o(lO ~" <XX>\ \ 1\\ 1\ \ \
1\\ 1\ \ \ \
40
30
20
10
- 10
- 20 o 200
"'" ---- t:::- Free Space ---- ---- --- -
"" "" \ i\ '\ \ 1\ i\ \ \
200c \ ,<XX> ~1000'J 1\" \,. ,\ \ \ \ \
400
--- - - --- - -
2O<XX>m
1\ BOO
- --
I'V/m
.0' , . . ,' , ,
,
10'
, ,
10
, ,
, ,
Figure A-l. Field strength (for 1 kW ERP ), as a function of distance over a smooth homogeneous earth . Frequenc y 100 MHz , £ .. la , (} = 10 mS/m , h
l" 20 m, h
Z" 0 to 20,000 m.

47
Ol~~~~-r~~~~~~ I \\ Modified L- R Model
--- L- R '6& Moc.el
"."-\-----'1,-+--------'
" ., , .•
'0 • 5011---~' .,-+-~d_--+.-:"I.rl--%O+---~---'>;M---+-~
601~--~-----L~--~--~~--~----~----~--~----~--~ o 20 40 60 eo 100 120 140 160 180 200
Distance in km
fi<Jure A- 2 . Attenuation relative to free space as a function of di stance over a smooth homogeneous earth. Frequency 100 MHz, t -15 , (1- 5 mS/m, hl = 5 I'l , h2 = 5 to 2000 m

48
o~~~~,,~~~I=~~~ I ~ Modified L-R Hodel
L-R '68 Model
--0 Smooth Larth Theory
50 f------+---.:'-t-----.Jip,
'o~--_+.~--~--~~--~~--~~-~~--~~--~--~~--~ o 20 40 60 80 100 120 140 160 180 200
Di stance in km
Figure 1\-3. Attenuation relative to free space as a function of distance over a smodth homogeneous earth . Frequency 300 MHz, [. = 15, cr = 5 mS/m , hI'" 5 m, h2 = 5 to 2000 rn.

49
2°r-----_+\_--~rr_----~~----_P __ ----+_--~~r_----~--~~+_----_+------4
3°r-----_+----~4_~\_--r_--~_+--~\_1_------r_~--_+------+_~~_4------4 • '0
C .-< 40r-------r------1~~--_i __ ----_+~ __ --~~----~------~------+_----~~----_1
Modified L- R Hodel
L-R '6B Hodel
60 LO------~------~----~~----_O~----_,~----_7~----~n_----~o_----~,_----~ ,,- 20 40 60 80 100 120 140 160 IBO 200
Distance i n km
Fig u re A-~ . Attenuation relative to free space as a function of distance over a smooth homogeneous earth . Frequency 1000 MHZ, c " 15, 0" 5 mS/m . hI = 20 m, h 2 " 5 to 2000 m.

50
.. 0 .... OT·29 U.S. OEP ..... T .. I!NT O~ CO .... ERCE ' .... 711 o~",eo: 0 .. To: .. o:eO .... UNle .. TIONI
BIBLIOGRAPHIC OATA SH EET
I'· PUBLICATION OR REPORT N012. Go.', AccuuOll No. ,. ikclp,u,·. Acc""011 No.
OTR 78 - 144
•• TITLE ANO SUBTITLE ,. Public.,;on Da,c
IWlIO PROPAGATION IN URSAN AREAS n 'Q" •• Perf",.,., Or ••• iu.i"" Code
910. 01
1. AUTHOA.(S ) •• P'o;cc./T .. k/ .... k U." No.
Anita G. Lon ,. 9108208 8. PERFORNING ORGANIZATION NANE AND ADDRESS
U. s. Department of Commerce National Telecommunications and Information Mmin . 10. CO"".cr/G ... , No .
Institue for Telecommunication Sciences Boulder Colorado 80303
11. SpOll .... i •• Or ... iu,,;011 No •• sad Addtc .. 12. T,pc of Repo" ud Pellod C .... ered
S~e U.
14. SUPPLENENTARY NOTES
15. ABSTRACT (A 200-_1'<10. I ••• (.Cl .... ' .umm.". 01 mOIl .,,,,iI/un. /n(onnoticn. If documenl includ •••• ign/fic"" 1>11>//01"""'" Of hlltoru ... u .... .,.. mention it " .... )
This report reviews much of the earlier work on radio propagation in urban areas, including a good deal of data from measurement programs, careful studies of mUltipath propagation, and techniques to reduce multipath fading. A number of in-vestigators have also developed propagation models for use in urban areas. Most of these are largely empirical, and are presented ., curves with various c·orrection factors for antenna height, frequency and terrain irregularity.
Th. pr •• ent rcport dc~cribc~ a model , i,ntendad for u,. with a digital corn;;"uter, which provides a rapid means for calculating both the median attenuation and the lo-cation variability expected in urban areas . The model has been tested against mea-sured values and " applicable for a wide variety of conditions .
16. ICc, Wotd. (A'~I>.t/u' order. """. ,<><1",. •• m/colon.) Broadcast systems; irregular terrain; land-mobile systems; location variability; radio propagation; urban communications.
". AVAILABILITY STATEWENT 18. Sec""", Clo .. (»Ii. tepo<1) '". N~.be, of PI,CO
Unclassified 55
XiI UNLlNITED.
19. Sec""i,y Cia .. (»Ii. p"~) ". PIIC~:
0 FOR OfFICIAL DISTRIBUTION. Unclassified
• • ll'U.S.OO Il .. N "NT ~ •• "TI"O o ..... eo: ' '."_'::777 ... s_, •• '·seo .... ·".: 2." .. ~'"