Radar vs. Video Vehicle Detection: And the Winner Is?present. This makes FMCW radar is a more...
18
Radar vs. Video Vehicle Detection: And the Winner Is? Reggie Chandra, Ph.D., PE Rhythm Engineering
Transcript of Radar vs. Video Vehicle Detection: And the Winner Is?present. This makes FMCW radar is a more...

Radar vs. Video Vehicle Detection:And the Winner Is?
Reggie Chandra, Ph.D., PERhythm Engineering
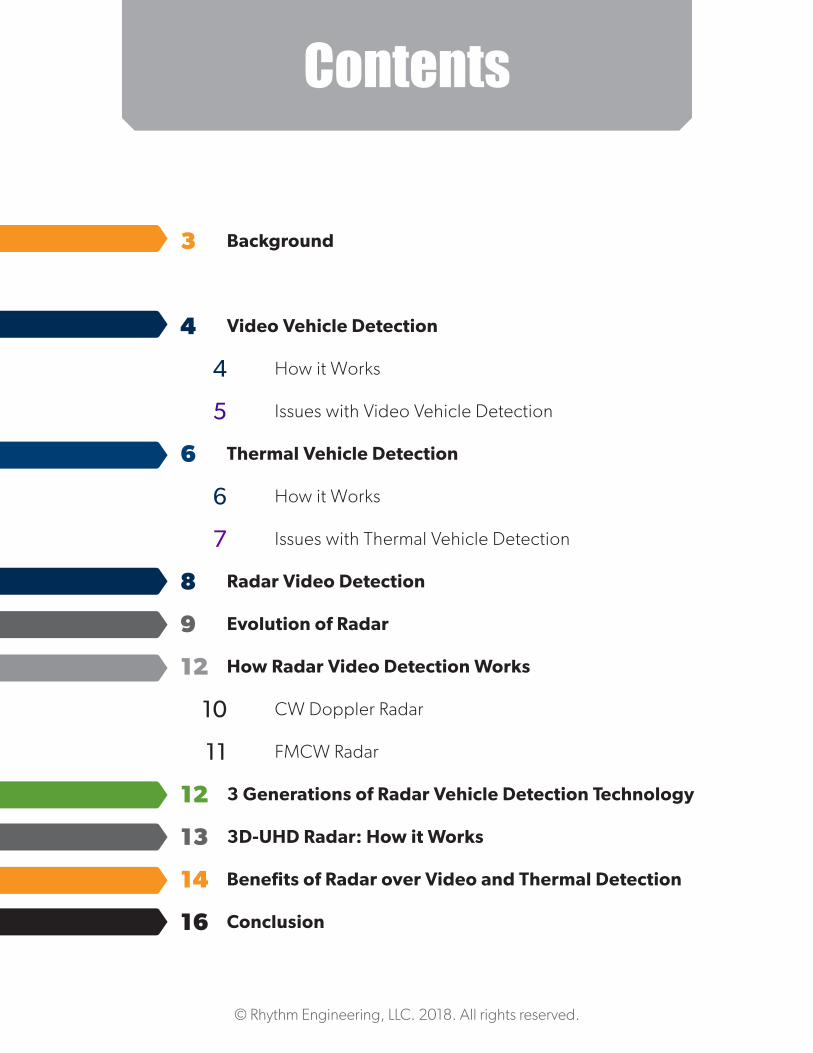
Contents
Background
Video Vehicle Detection
How it Works
Issues with Video Vehicle Detection
Thermal Vehicle Detection
How it Works
Issues with Thermal Vehicle Detection
Radar Video Detection
Evolution of Radar
How Radar Video Detection Works
CW Doppler Radar
FMCW Radar
3 Generations of Radar Vehicle Detection Technology
3D-UHD Radar: How it Works
Benefits of Radar over Video and Thermal Detection
Conclusion
3
4
4
5
6
6
7
8
9
12
10
11
12
13
14
16
© Rhythm Engineering, LLC. 2018. All rights reserved.
Background
3
Inductive loop detectors are still the most common form of detection in the USA, though many issues exist with this technology. Loops constantly break, the wires could be accidentally cut during construction or resurfacing of pavement, and the detectors often transmit false results due to chatter or cross talk. An additional problem is that loop replacement is intrusive, with traffic needing to be stopped in order for workers to enter the roadway and conduct repairs. Most agencies have incurred significant annual costs in the regular maintenance and replacement of faulty loop detectors.
Disillusioned with poorly performing inductive loop detectors, traffic professionals started turning to video-based methods out of sheer desperation about 20 years ago. Beyond video, which detects vehicles in only the visible spectrum, thermal-imaging devices came along later as a solution to improve video detection performance. While video or thermal devices do satisfy some requirements of modern traffic professionals, decades after their introduction they have failed to provide reliable detection and the accurate traffic data needed.
This paper will not only discuss the advantages and disadvantages of video and thermal vehicle detection but will also provide an in-depth picture of the new, cutting-edge 3D-UHD radar technology which currently surpasses video and thermal-based detection in terms of accuracy, reliability, benefits and performance.

4
Video Vehicle Detection
Cameras are mounted over the roadway and aimed at approaching traffic. Each one of them sends visual data to a processing unit in the traffic signal cabinet, which then analyzes the images and uses them to distinguish and separate objects of interest (vehicles). This process is referred to as segmentation and is achieved via two common methods: object-tracking algorithms and background subtraction.
Object-tracking algorithms take the transmitted images and identify individual vehicles as unique blobs of pixels, then track them as they travel in the area of interest. These pixel blobs can also be tracked using sub-algorithms like edge detection.
Background subtraction is a process in which information about the background of the camera’s frame of view is absorbed and slowly learned over time. After the processor can remember which pixels should appear in the background, it subtracts from them moving objects in the foreground in order to differentiate these as vehicles.
Using these two methods for segmentation, video detectors are able to count vehicles and alert the presence of vehicles at an approach, as well as collect vehicle occupancy and classification data. Only the presence data, however, can be relied upon by traffic professionals in their traffic management planning. This is due to the remaining data provided by the cameras being negatively affected by occlusion and other image-quality issues.
How it Works

5
Occlusion, one of video detection’s chief obstacles in providing reliable data, happens when something obstructs the view of the camera and thus renders the sensor completely useless. Video cameras also become faulty in poor weather conditions, such as heavy rain, thick fog, ice and snow, or even when dirt and other debris cover the lens. Not only does this affect the quality of image data but the device could also fail to detect vehicles passing by (false negatives). Similarly, low vehicle-road contrast (i.e., when the color of a car matches the road surface) will also produce false negatives in video detection as it hinders the processor from distinguishing objects from the learned background.
The underperformance of video detection devices is also evidenced by the frequency of cars being detected when they are not there (false positives). Some common scenarios which may result in this error include: the blooming effect of headlights reflected from wet pavement, especially at night, shadows moving across the camera frame, the sun’s changing position and objects like tree branches moving into the frame.
Furthermore, different times of day can prove difficult for cameras to accurately detect vehicles, for example, during transition periods (dawn and dusk). It is common for both positive and false negatives to occur at those times.
Issues withVideo Vehicle Detection

6
How it WorksOptical cameras are replaced in thermal detection by thermal cameras. Thermal cameras utilize a special lens which aggregates and focuses the infrared light emitted by objects. This light is scanned and a temperature pattern, called a thermogram, is created through a phased array of infrared elements. This thermogram is translated into electric impulses that are then sent to a signal processor which converts the impulses into data for display. The data is displayed on a color spectrum where varying colors, from red, orange and yellow for higher temperatures to blue, purple or green for lower temperatures, represent the heat signature of the object and intensity of the infrared emission.
Since thermal imaging shows the radiation of heat off of an object, one of its major advantages over video detection is that the thermal image will not be not affected by sun, glare, headlights, shadows, etc., which are all inevitable factors making light-based imaging less reliable.
Thermal Vehicle Detection
Issues withThermal Vehicle Detection
Thermal detection does not suffer from all the same problems facing video detection; however, it is not a perfect tool for detecting vehicles or collecting data. Like video cameras, thermal devices can produce false positives and negatives. This often happens due to thermal shadows encroaching on moving vehicles and in hot weather, when the temperature of a car could be close to that of the road surface.
Electric cars without a combustion engine may be problematic to detect, as well. Occlusions blocking the thermal image can prevent accurate data about queue length from being collected, and this problem can also occur due to the limited range of thermal imaging devices.
7

8
Christian Doppler first described the phenomenon that would ultimately bear his name in 1842. As a source and its observer move toward or away from one another, the frequency of a wave (sound, light, etc.) will increase or decrease, respectively.
RAdio Detection And Ranging (RADAR) began its development in the late 19th century when Heinrich Hertz demonstrated that radio waves are reflected by metallic objects. German inventor Christian Hülsmeyer used them for ship detection at sea a few decades later. Finally, the technology gained another very important application during World War II: sending short pulses of radio energy timed on an oscilloscope. These pulses and the direction of the antenna provided enough information for scientists to determine the range and angular location of targets. Radar was perhaps one of the best technological tools at the Allies’ disposal in wartime, and now, the better part of a century after their victory, it has reached even greater utility across a number of scientific fields and various industries.
Vehicle detection is among them, and the numerous advancements in radar technology since its inception have positioned it at the very cutting edge of traffic management and data collection today.
Radar Vehicle Detection
OBJECTSENDER / RECEIVER WAVE
REFLECTED WAVE
Doppler Effect

9
Figure 1 shows a radar device mounted overhead, focused on the traveled way.The vehicle’s reflected signal can be utilized to measure presence, passage, volume, speed, gaps and classification, as well as provide dilemma zone warning, collision avoidance warning, presence of stopped vehicles, wrong-way travel warning, etc.
Evolution of Radar
There are two types of microwave radar sensors used in vehicle detection applications. They are continuous wave (CW) Doppler radar and frequency modulated continuous wave (FMCW) radar. They differ in that FMCW sensors manage to detect stopped vehicles, while CW sensors can only do this when an auxiliary sensor is present. This makes FMCW radar is a more precise detection method than CW radar.
The Federal Communications Commission (FCC) designates 10.5 GHz, 24.0 GHz and 34.0 GHz frequency intervals in roadside applications of radar. The higher the frequency, the greater the spatial resolution (larger change in frequency) of the radar for a given antenna’s size. End users need not worry about frequencies or FCC compliance, since manufacturers are required to satisfy all requirements.
Figure 1. Radar detector
10
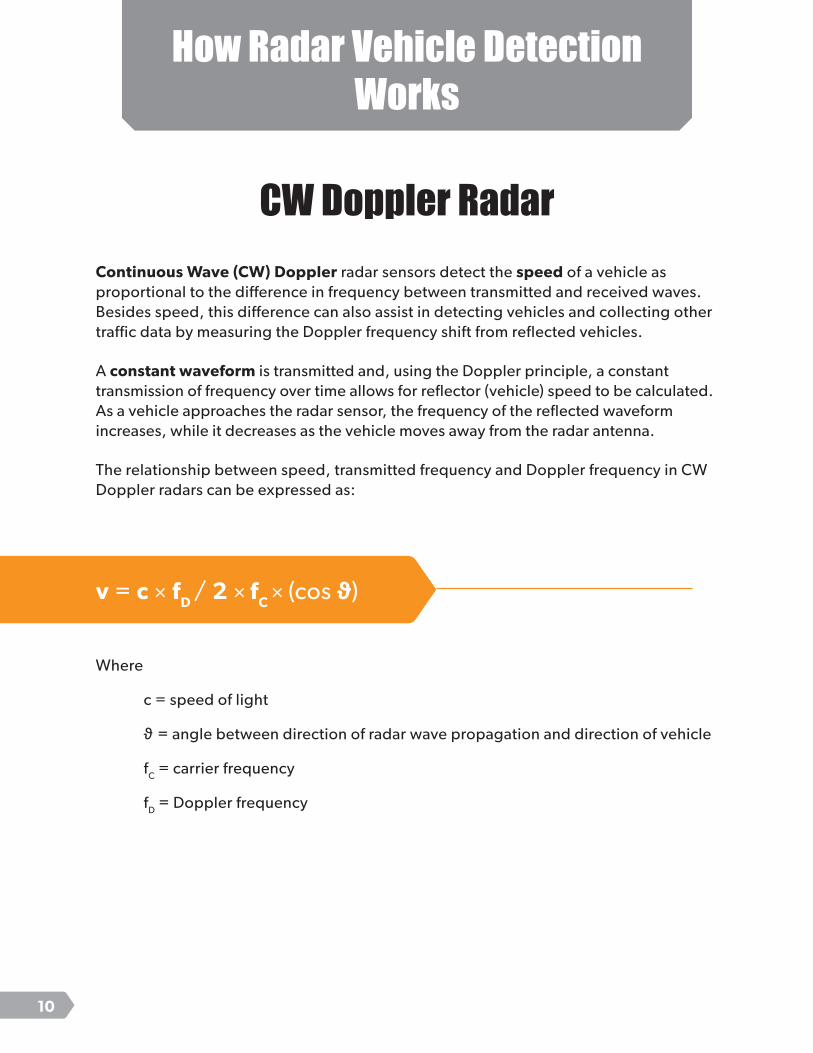
Continuous Wave (CW) Doppler radar sensors detect the speed of a vehicle as proportional to the difference in frequency between transmitted and received waves. Besides speed, this difference can also assist in detecting vehicles and collecting other traffic data by measuring the Doppler frequency shift from reflected vehicles.
A constant waveform is transmitted and, using the Doppler principle, a constant transmission of frequency over time allows for reflector (vehicle) speed to be calculated. As a vehicle approaches the radar sensor, the frequency of the reflected waveform increases, while it decreases as the vehicle moves away from the radar antenna.
The relationship between speed, transmitted frequency and Doppler frequency in CW Doppler radars can be expressed as:
v = c × fD / 2 × fC × (cos ϑ)
Where
c = speed of light
ϑ = angle between direction of radar wave propagation and direction of vehicle
fC = carrier frequency
fD = Doppler frequency
How Radar Vehicle Detection Works
CW Doppler Radar

11
FMCW RadarFrequency Modulated Continuous Wave radar operates with the wavelength frequency changing constantly with respect to time. This frequency modulation is useful because the radar device detects the presence of stopped vehicles (not possible with CW) and also improves precision in its vehicle presence detection to a much higher degree than Doppler radar.
Vehicle range is proportional to the difference in transmitter frequency at the time it was detected and the time it was received, and is expressed as:
Where
R = vehicle range
Δf = instantaneous difference in frequency between signal transmission and receipt
B = RF modulation Bandwidth
T = period time or modulation period
FMCW radar devices calculate a vehicle’s travel speed by dividing the lanes of the traveled way into zones or bins of a known length. Vehicle speed is expressed as:
Where
v = vehicle speed
d = distance between leading edges of zones (bins)
ΔT = time between vehicle arrival at the leading edges of adjacent zones/bins
Versatile in nature, FMCW radars may also use the Doppler effect to calculate vehicular speed. Compared to CW radar devices, FMCW ones are superior in their ability to detect vehicles and collect data. They more accurately determine presence, speed, estimated time of arrival, occupancy, vehicle classification and queue length, and can additionally detect incidents, identify stopped vehicles and provide dilemma zone warning, wrong-way travel warning, etc.
R = c × T × Δf / (2 × B)
v = d /ΔT

12
3 Generations of Radar Technology in Vehicle Detection
The technology behind radar vehicle detectors has advanced quickly in recent years. Migrating sensors to FMCW radars first enabled better presence detection because the devices could now detect stopped vehicles. What followed were three giant leaps forward in radar vehicle detection. First-generation radar used slow-speed modulation, detecting vehicles using a combination of range and speed. Since vehicle separation was based on this same combination, however, two vehicles traveling at the same speed within the same range could not be separated or classified.
Second-generation or 2D-HD radar could, on the other hand, separate speed and range even at high speeds, making it more accurate in classifying vehicles too.
The third generation of radar, 3D-UHD, is the latest link in this evolutionary chain:it provides the best reliability and precision over all previous developments because it not only separates vehicles by range and speed but also by the angle of travel.The radar’s 8 adaptive beams ensure the accurate collection and categorization of reflected data.
STANDARD TECHNOLOGY
• SEPARATION IN FREQUENCY
• SLOW SPEED MODULATION
2D-HD
• SEPARATION IN SPEED
• SEPARATION IN RANGE
• HIGH SPEED MODULATION
3D-UHD
• SEPARATION IN SPEED
• SEPARATION IN RANGE
• SEPARATION IN ANGLE
• HIGH SPEED MODULATON
• ADAPTIVE BEAMS
Figure 2. The three generations of radar vehicle detection
13
3D-UHD Radar: How it Works
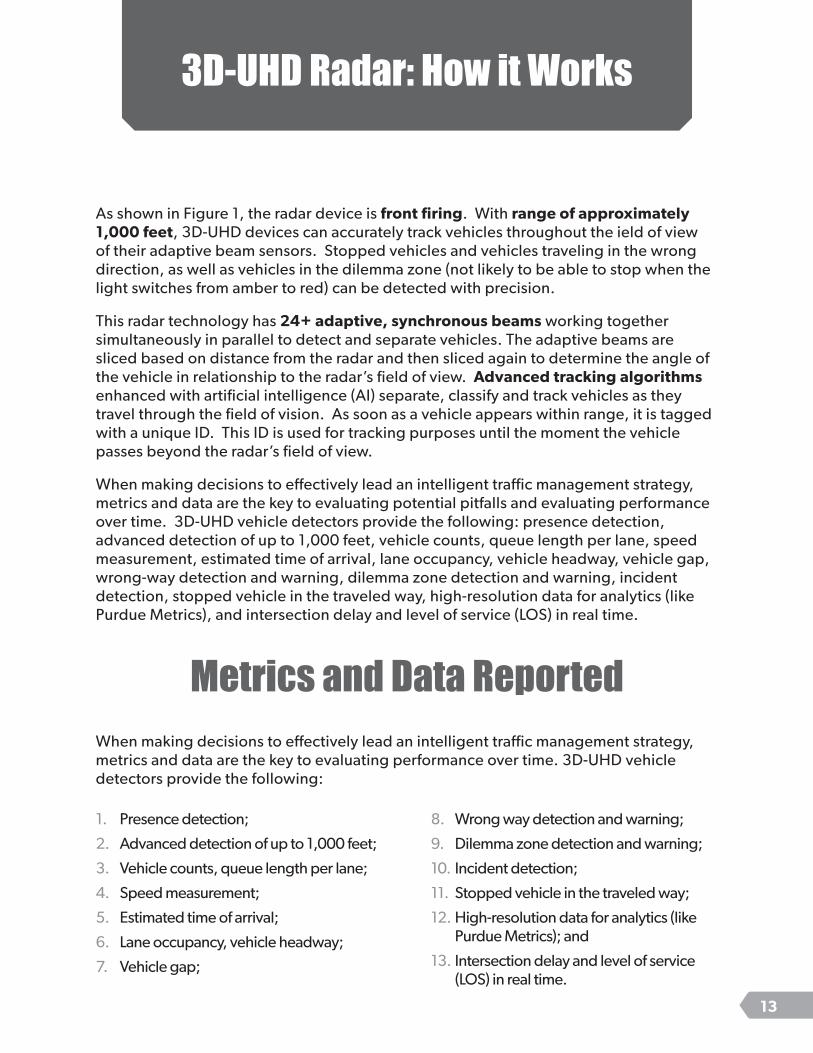
As shown in Figure 1, the radar device is front firing. With range of approximately 1,000 feet, 3D-UHD devices can accurately track vehicles throughout the ield of view of their adaptive beam sensors. Stopped vehicles and vehicles traveling in the wrong direction, as well as vehicles in the dilemma zone (not likely to be able to stop when the light switches from amber to red) can be detected with precision.
This radar technology has 24+ adaptive, synchronous beams working together simultaneously in parallel to detect and separate vehicles. The adaptive beams are sliced based on distance from the radar and then sliced again to determine the angle of the vehicle in relationship to the radar’s field of view. Advanced tracking algorithms enhanced with artificial intelligence (AI) separate, classify and track vehicles as they travel through the field of vision. As soon as a vehicle appears within range, it is tagged with a unique ID. This ID is used for tracking purposes until the moment the vehicle passes beyond the radar’s field of view.
When making decisions to effectively lead an intelligent traffic management strategy, metrics and data are the key to evaluating potential pitfalls and evaluating performance over time. 3D-UHD vehicle detectors provide the following: presence detection, advanced detection of up to 1,000 feet, vehicle counts, queue length per lane, speed measurement, estimated time of arrival, lane occupancy, vehicle headway, vehicle gap, wrong-way detection and warning, dilemma zone detection and warning, incident detection, stopped vehicle in the traveled way, high-resolution data for analytics (like Purdue Metrics), and intersection delay and level of service (LOS) in real time.
Metrics and Data ReportedWhen making decisions to effectively lead an intelligent traffic management strategy,metrics and data are the key to evaluating performance over time. 3D-UHD vehicle detectors provide the following:
1. Presence detection;
2. Advanced detection of up to 1,000 feet;
3. Vehicle counts, queue length per lane;
4. Speed measurement;
5. Estimated time of arrival;
6. Lane occupancy, vehicle headway;
7. Vehicle gap;
8. Wrong way detection and warning;
9. Dilemma zone detection and warning;
10. Incident detection;
11. Stopped vehicle in the traveled way;
12. High-resolution data for analytics (like Purdue Metrics); and
13. Intersection delay and level of service (LOS) in real time.
14
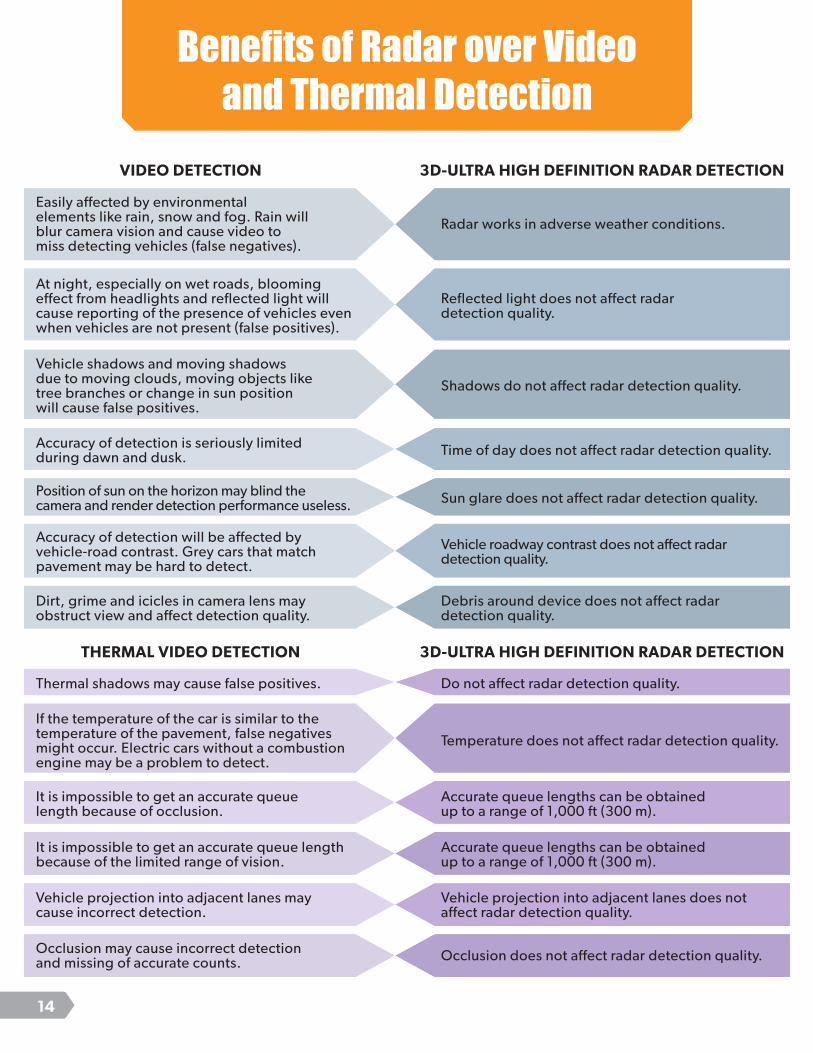
Benefits of Radar over Videoand Thermal Detection
Easily affected by environmentalelements like rain, snow and fog. Rain willblur camera vision and cause video tomiss detecting vehicles (false negatives).
At night, especially on wet roads, blooming effect from headlights and reflected light will cause reporting of the presence of vehicles even when vehicles are not present (false positives).
Vehicle shadows and moving shadowsdue to moving clouds, moving objects liketree branches or change in sun positionwill cause false positives.
Accuracy of detection is seriously limitedduring dawn and dusk.
Position of sun on the horizon may blind the camera and render detection performance useless.
Accuracy of detection will be affected byvehicle-road contrast. Grey cars that match pavement may be hard to detect.
Dirt, grime and icicles in camera lens mayobstruct view and affect detection quality.
Thermal shadows may cause false positives.
If the temperature of the car is similar to the temperature of the pavement, false negatives might occur. Electric cars without a combustion engine may be a problem to detect.
It is impossible to get an accurate queuelength because of occlusion.
It is impossible to get an accurate queue length because of the limited range of vision.
Vehicle projection into adjacent lanes maycause incorrect detection.
Occlusion may cause incorrect detectionand missing of accurate counts.
Radar works in adverse weather conditions.
Reflected light does not affect radar detection quality.
Shadows do not affect radar detection quality.
Time of day does not affect radar detection quality.
Sun glare does not affect radar detection quality.
Vehicle roadway contrast does not affect radar detection quality.
Debris around device does not affect radar detection quality.
Do not affect radar detection quality.
Temperature does not affect radar detection quality.
Accurate queue lengths can be obtainedup to a range of 1,000 ft (300 m).
Accurate queue lengths can be obtainedup to a range of 1,000 ft (300 m).
Vehicle projection into adjacent lanes does not affect radar detection quality.
Occlusion does not affect radar detection quality.
VIDEO DETECTION 3D-ULTRA HIGH DEFINITION RADAR DETECTION
THERMAL VIDEO DETECTION 3D-ULTRA HIGH DEFINITION RADAR DETECTION

15
Accuracy, Reliability and Performance3D-UHD radar devices are not affected by occlusion or environmental conditions. High-precision data is reliably delivered, regardless of daytime or nighttime lighting conditions, temperatures of roadways or cars, shadows, sun glare or vehicle-roadway contrast. This gives 3D-UHD radar a clear advantage over less precise detection methods like video and thermal imaging, and also ensures greater safety for drivers and passengers on the road. Unlike other methods, the fact that radar can separate objects by range, speed and angle means that it offers the most precise and reliable (nearly 100% accurate) presence detection on the market today.
Advanced DetectionA key point to make note of here is that 3D-UHD radar devices can track vehicles through a 1,000-foot range of view, collecting data at multiple points along the traveled way. This is an unprecedented advanced detection range which no other method currently provides. Overall, it is quality data that permits proactive traffic professionals to implement quality operations management strategies. 3D-UHD radar provides that reliably accurate data as part of its broad spectrum of features.
FEATURE VIDEO THERMALHAWKEYE™
(3D-UHD)
Presence Detection
Bicycle Detection
Advance Detection over 200’
Vehicle Counts
Queue Length Estimation
Occupancy over 150’ Length
Speed Measurement
Vehicle Headway
Vehicle Gap
Dilemma Zone Detection
Wrong Way Detection Warning
Vehicle Separation and Classification
Incident Detection
High Resolution Data for Data Visualization
Vehicle Detection Range of 1000’
Estimated Time of Arrival
Inaccurate Inaccurate
Inaccurate Inaccurate
Additional Detection Needed

16
Conclusion
Traffic engineers and planners are fully aware of the limitations of the existing methods of vehicle detection. Lack of accurate data collection methods has a very negative impact on effectively managing traffic flow and optimizing traffic signal timing. Up to 90% of domestic traffic signals are not properly timed or synchronized due to poor methods of vehicle detection and data collection.
This is not a problem that affects efficiency of operations and travel time alone.The Federal Highway Administration’s Office of Safety Programs stated in 2015 that one-quarter of traffic fatalities and about half of all injuries are attributed to intersections.
Whether through video, thermal, radar or other detection methods, it’s clear that vehicular data collection within roadway networks is the key to developing responsive, adaptive and intelligent systems for traffic management. With accuracy of advanced detection approaching 100% and multiple points of enhanced data collection, 3D-UHD radar is an innovative technology leading the charge in lowering these tragic statistics and allowing us to improve our traffic flow.

17
ReferencesIntersection Safety (December 2015). Federal Highway Administration, U.S. Department of Transportation. Retrieved from the FHA Office of Safety website: https://safety.fhwa.dot.gov/intersection/
Martin, Dr. P.T., Dharmavaram, G. & Stevanovic, A. (December 2004). Evaluation of UDOT’S Video Detection Systems: System’s Performance in Various Test Conditions. Salt Lake City, UT: Department of Civil and Environmental Engineering, University of Utah Traffic Lab.
Mimbela, L.E.Y., Klein, L., et al. (August 2017). A Summary of Vehicle Detection and Surveillance Technologies use in Intelligent Transportation Systems (updated version). Retrieved from https://www.fhwa.dot.gov/policyinformation/pubs/vdstits2007/
Minge, E. (September 2010). Evaluation of Non-Intrusive Technologies for Traffic Detection (technical report). Minneapolis, MN: SRF Consulting Group.
Traffic Detector Handbook, 3rd ed. Vol. 1 (October 2006). Retrieved from https://www.fhwa.dot.gov/publications/research/operations/ITS/06108/06108.pdf
2012 National Traffic Signal Report Card: Strategic Investments Make a Difference (May 2012). Retrieved from http://www.ite.org/reportcard/

11228 Thompson Avenue Lenexa, Kansas 66219
Phone: 913-227-0603
The information contained in this paper is copyrighted by Rhythm Engineering.