RADAR INTERFEROMETRY FOR MONITORING LAND SUBSIDENCE …
138
RADAR INTERFEROMETRY FOR MONITORING LAND SUBSIDENCE AND COASTAL CHANGE IN THE NILE DELTA, EGYPT A Dissertation by MOHAMED HASSAN ALY Submitted to the Office of Graduate Studies of Texas A&M University in partial fulfillment of the requirements for the degree of DOCTOR OF PHILOSOPHY August 2006 Major Subject: Geology
Transcript of RADAR INTERFEROMETRY FOR MONITORING LAND SUBSIDENCE …

RADAR INTERFEROMETRY FOR MONITORING LAND SUBSIDENCE
AND COASTAL CHANGE IN THE NILE DELTA, EGYPT
A Dissertation
by
MOHAMED HASSAN ALY
Submitted to the Office of Graduate Studies of Texas A&M University
in partial fulfillment of the requirements for the degree of
DOCTOR OF PHILOSOPHY
August 2006
Major Subject: Geology

RADAR INTERFEROMETRY FOR MONITORING LAND SUBSIDENCE
AND COASTAL CHANGE IN THE NILE DELTA, EGYPT
A Dissertation
by
MOHAMED HASSAN ALY
Submitted to the Office of Graduate Studies of Texas A&M University
in partial fulfillment of the requirements for the degree of
DOCTOR OF PHILOSOPHY
Approved by:
Co-Chairs of Committee, John R. Giardino Andrew G. Klein Committee Members, Howard A. Zebker
Vatche P. Tchakerian Christopher C. Mathewson Head of Department, Richard L. Carlson
August 2006
Major Subject: Geology

iii
ABSTRACT
Radar Interferometry for Monitoring Land Subsidence and Coastal Change in the Nile
Delta, Egypt. (August 2006)
Mohamed Hassan Aly, B.S., Zagazig University;
M.S., Zagazig University
Co-Chairs of Advisory Committee: Dr. John R. Giardino Dr. Andrew G. Klein
Land subsidence and coastal erosion are worldwide problems, particularly in
densely populated deltas. The Nile Delta is no exception. Currently, it is undergoing land
subsidence and is simultaneously experiencing retreat of its coastline. The impacts of
these long-term interrelated geomorphic problems are heightened by the economic,
social and historical importance of the delta to Egypt. Unfortunately, the current
measures of the rates of subsidence and coastal erosion in the delta are rough estimates
at best. Sustainable development of the delta requires accurate and detailed spatial and
temporal measures of subsidence and coastal retreat rates.
Radar interferometry is a unique remote sensing approach that can be used to
map topography with 1 m vertical accuracy and measure surface deformation with 1 mm
level accuracy. Radar interferometry has been employed in this dissertation to measure
urban subsidence and coastal change in the Nile Delta. Synthetic Aperture Radar (SAR)
data of 5.66 cm wavelength acquired by the European Radar Satellites (ERS-1 and ERS-
2) spanning eight years (1993-2000) have been used in this investigation. The ERS data

iv
have been selected because the spatial and temporal coverage, as well as the short
wavelength, are appropriate to measure the slow rate of subsidence in the delta. The ERS
tandem coherence images are also appropriate for coastal change detection.
The magnitude and pattern of subsidence are detected and measured using
Permanent Scatterer interferometry. The measured rates of subsidence in greater Cairo,
Mansura, and Mahala are 7, 9, and 5 mm yr-1, respectively. Areas of erosion and
accretion in the eastern side of the delta are detected using the ERS tandem coherence
and the ERS amplitude images. The average measured rates of erosion and accretion are
-9.57 and +5.44 m yr-1, respectively. These measured rates pose an urgent need of
regular monitoring of subsidence and coastline retreat in the delta.
This study highlighted the feasibility of applying Permanent Scatterer
interferometry in inappropriate environment for conventional SAR interferometry. The
study addressed possibilities and limitations for successful use of SAR interferometry
within the densely vegetated delta and introduced alternative strategies for further
improvement of SAR interferometric measurements in the delta.

v
ACKNOWLEDGEMENTS
This work has been made possible through the generous support of several
organizations. It was supported financially by the Egyptian Ministry of Higher
Education and by the National Aeronautics and Space Administration (NASA). The ERS
InSAR data were provided by the European Space Agency (ESA), the SRTM data were
provided by the Jet Propulsion Laboratory (JPL), and the precise ERS orbital data were
provided by the Delft Institute for Earth-Oriented Space Research (DEOS), Delft
University of Technology.
Special thanks go to Rick Giardino and Andrew Klein, Texas A&M University,
for their tireless advice, constructive comments and great support throughout the five
years in which I have had the privilege of being their student. Thanks also to Vatche
Tchakerian and Christopher Mathewson, Texas A&M University, for serving on my
committee and reviewing my dissertation.
I am also grateful to Howard Zebker, Stanford University, for reviewing my
dissertation and my proposals to NASA and ESA. I am proud to have had the
opportunity to have Howard in my advisory committee. His encouragement and
insightful suggestions contributed a lot to my work.
Finally, I reserve the utmost appreciation and gratitude to my family. I eternally
thank my parents for their guidance, encouragement, and support, and I am grateful to
my wife and daughter for their unique contribution to my work. Words can not express
my sincere gratitude for the support they have given me.

vi
TABLE OF CONTENTS
Page
ABSTRACT ................................................................................................................. iii
ACKNOWLEDGEMENTS ......................................................................................... v
TABLE OF CONTENTS ............................................................................................. vi
LIST OF TABLES ....................................................................................................... ix
LIST OF FIGURES...................................................................................................... x
CHAPTER
I INTRODUCTION...................................................................................... 1
1. Background ................................................................................... 1 2. Research Motivation ..................................................................... 3 3. Problem Statement ........................................................................ 3 4. Study Objectives ........................................................................... 4 5. Study Approach............................................................................. 4 6. Study Area..................................................................................... 5 7. Synopsis ........................................................................................ 10 II SAR INTERFEROMETRY FOR MEASURING TOPOGRAPHY AND
CRUSTAL DEFORMATION.................................................................... 11
1. Introduction ................................................................................... 11 2. Historical Review.......................................................................... 12 3. System Design and Implementation.............................................. 14 3.1. Along-track interferometry ............................................... 15 3.2. Across-track interferometry .............................................. 15 3.3. Repeat-pass interferometry ............................................... 16 4. InSAR Theory ............................................................................... 16 5. Common Processing Approaches.................................................. 21 5.1. Two-pass interferometry ................................................... 21 5.2. Three-pass interferometry ................................................. 22 5.3. Four-pass interferometry ................................................... 22 5.4. Permanent scatterer interferometry ................................... 23

vii
CHAPTER Page 6. Basic Processing Steps .................................................................. 24 6.1. Image formation ................................................................ 25 6.2. Interferogram generation................................................... 26 6.3. Phase unwrapping ............................................................. 26 7. Interferometric Decorrelations and Limitations ............................ 29 8. Applications .................................................................................. 30 8.1. Topographic mapping ....................................................... 30 8.2. Crustal deformation studies............................................... 31 8.2.1. Earthquakes ........................................................... 31 8.2.2. Volcanoes .............................................................. 32 8.2.3. Landslides.............................................................. 32 8.2.4. Land subsidence .................................................... 33 III LAND SUBSIDENCE IN GREATER CAIRO ......................................... 34
1. Introduction ................................................................................... 34 2. Data Acquisition............................................................................ 40 3. Permanent Scatterer Interferometry .............................................. 40 3.1. Single look complex image formation and coregistration 45 3.2. Selection of permanent scatterers...................................... 48 3.3. Generation of the complex interferograms........................ 50 3.4. Topographic phase removal and phase unwrapping ......... 50 4. Results and Discussion.................................................................. 52 IV LAND SUBSIDENCE IN MANSURA AND MAHALA......................... 71
1. Introduction ................................................................................... 71 2. Data Acquisition............................................................................ 72 3. Permanent Scatterer Interferometry .............................................. 72 4. Results and Discussion.................................................................. 77 V COASTAL CHANGE AT DAMIETTA PROMONTORY....................... 91
1. Introduction ................................................................................... 91 2. Methodology ................................................................................. 94 3. Results and Discussion.................................................................. 97 VI CONCLUSIONS AND FUTURE DIRECTIONS..................................... 102
1. Conclusions ................................................................................... 102 2. Future Directions........................................................................... 106

viii
Page
REFERENCES ............................................................................................................ 108
VITA ............................................................................................................................ 125

ix
LIST OF TABLES
TABLE Page
2.1 Important technical parameters of ERS SAR satellites.................................... 27
3.1 ERS dataset for greater Cairo........................................................................... 42
4.1 ERS dataset for Mansura and Mahala .............................................................. 74
5.1 Measured values of erosion and accretion ....................................................... 99

x
LIST OF FIGURES
FIGURE Page
1.1 The Nile Delta as seen by MODerate resolution Imaging Spectrometer
(MODIS), acquired on February 05, 2003 .................................................... 6
2.1 General geometry of across-track interferometry ......................................... 18
3.1 (A) Locations of sediment borings and land subsidence rates in the Nile
Delta, (B) simplified stratigraphic logs depicting late Quaternary
sequences in the Nile Delta ........................................................................... 36
3.2 ERS coverage of greater Cairo (Track: 436, Frame: 2997) is highlighted in
red.................................................................................................................. 39
3.3 Coherence image created from InSAR scenes dated 01/20/2000, and
05/17/1993, superimposed on the amplitude image of 01/20/2000 .............. 41
3.4 Topographically corrected interferogram created from InSAR scenes dated
01/20/2000, and 05/17/1993, superimposed on the amplitude image of
01/20/2000..................................................................................................... 44
3.5 Average amplitude image for greater Cairo .................................................. 46
3.6 Mean LOS surface displacement in the 1993-2000 period, superimposed
on the average amplitude image of greater Cairo.......................................... 53
3.7 Deformation phase history of point A in greater Cairo during the 1993-
2000 period.................................................................................................... 55

xi
FIGURE Page
3.8 Deformation phase history of point B in greater Cairo during the 1993-
2000 period.................................................................................................... 56
3.9 Deformation phase history of point C in greater Cairo during the 1993-
2000 period.................................................................................................... 57
3.10 Estimated LOS surface displacement for July 1, 1993, superimposed on
the average amplitude image of greater Cairo............................................... 59
3.11 Estimated LOS surface displacement for July 1, 1995, superimposed on
the average amplitude image of greater Cairo............................................... 60
3.12 Estimated LOS surface displacement for July 1, 1996, superimposed on
the average amplitude image of greater Cairo............................................... 61
3.13 Estimated LOS surface displacement for July 1, 1997, superimposed on
the average amplitude image of greater Cairo............................................... 62
3.14 Estimated LOS surface displacement for July 1, 1998, superimposed on
the average amplitude image of greater Cairo............................................... 63
3.15 Estimated LOS surface displacement for July 1, 1999, superimposed on
the average amplitude image of greater Cairo............................................... 64
3.16 Estimated LOS surface displacement for July 1, 2000, superimposed on
the average amplitude image of greater Cairo............................................... 65
3.17 Mean velocity in LOS superimposed on the average amplitude image of
greater Cairo with major faults...................................................................... 67
3.18 Seismicity of Egypt for the period 1900–2001 ............................................. 68

xii
FIGURE Page
3.19 Mean velocity in LOS superimposed on the average amplitude image of
greater Cairo with subway stations ............................................................... 69
4.1 ERS coverage of Mansura and Mahala (Track: 436, Frame: 2979) is
highlighted in red .......................................................................................... 73
4.2 Average amplitude image of Mansura and Mahala....................................... 75
4.3 Mean LOS velocity in the 1993-2000 period, superimposed on the average
amplitude image of Mansura......................................................................... 78
4.4 Deformation phase history of point A in Mansura during the 1993-2000
period............................................................................................................. 79
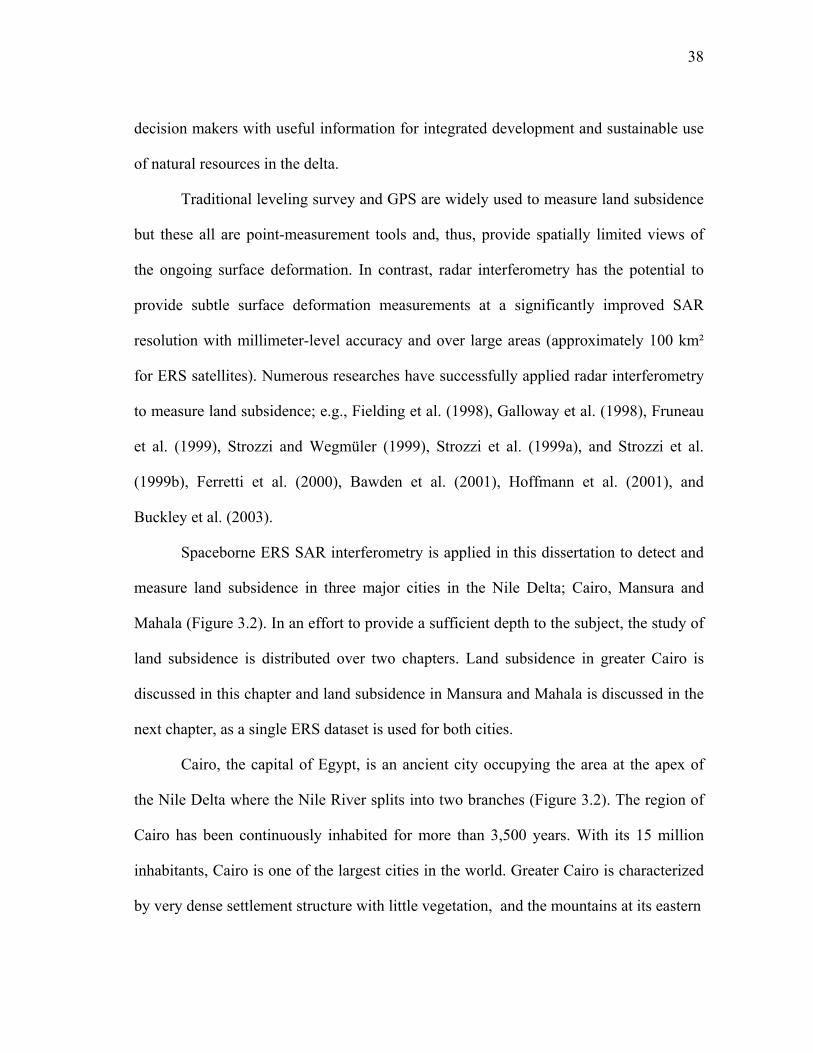
4.5 Deformation phase history of point B in Mansura during the 1993-2000
period............................................................................................................. 80
4.6 Deformation phase history of point C in Mansura during the 1993-2000
period............................................................................................................. 81
4.7 Mean LOS velocity in the 1993-2000 period, superimposed on the average
amplitude image of Mahala........................................................................... 83
4.8 Deformation phase history of point A in Mahala during the 1993-2000
period............................................................................................................. 84
4.9 Deformation phase history of point B in Mahala during the 1993-2000
period............................................................................................................. 85
4.10 Deformation phase history of point C in Mahala during the 1993-2000
period............................................................................................................. 86

xiii
FIGURE Page
4.11 Estimated LOS surface displacement (1993-2000), superimposed on the
average amplitude image of Mansura ........................................................... 88
4.12 Estimated LOS surface displacement (1993-2000), superimposed on the
average amplitude image of Mahala ............................................................. 89
5.1 Damietta Promontory along the coast of the Nile Delta as seen by MODIS
acquired on February 05, 2003...................................................................... 92
5.2 ERS tandem coherence and classified amplitude images, showing the
water/land boundary at Damietta Promontory .............................................. 95
5.3 Coastline positions at Damietta Promontory detected by ERS SAR data
acquired in the 1993-2000 period.................................................................. 99
5.4 Measured erosion and accretion at locations A, B and C.............................. 99

1
CHAPTER I
INTRODUCTION
1
1. Background
Land subsidence is a major worldwide problem, particularly in vulnerable coastal
areas such as the Nile Delta. Currently, the delta is undergoing land subsidence and is
simultaneously experiencing coastline retreat. The impacts of these long-term
interrelated geomorphic problems are heightened by the economic, social and historical
importance of the delta to Egypt. A major debate has evolved in the last decade
concerning whether or not the land surface of the Nile Delta is subsiding. The debate is
certainly problematic in light of the fact that current measures of subsidence in the delta
are rough estimates at best. To date, no precise geodetic measurements have been
conducted within the Nile Delta to capture present-day subsidence. Prior to this study,
knowledge of subsidence rates in the delta was limited to long-term geologic averages
that assumed spatial and temporal uniformity.
Stanley (1988 and 1990) estimated the subsidence rates near the coast of the delta
to be between 1.00 and 2.50 mm yr-1 in the west and 5.00 mm yr-1 in the east based on
radiocarbon dating of Holocene deltaic sediments. Warne and Stanley (1993) reassessed
these estimates and suggested that they were minimum rates because sediment
reworking can cause radiocarbon dated cores to be older than the burial age. Subsidence
rates estimated based on this geologic process assume uniform extension across the
eastern and western parts of the delta, thus, yielding spatial and temporal averages that
This dissertation follows the style of the Journal of Geophysical Research.

2
can not assign unique rates to any particular region.
In the fifth century BC, Herodotus observed the annual growth of the Nile Delta
from annual flooding (Bloom, 1998). Today, it can be argued that human alteration of
the Nile River system through damming and irrigation, which has stopped sediment
supply, has turned the delta into a relic coastal plain and has lead to high rates of land
subsidence and coastal erosion (Stanley and Warne, 1993; Stanley, 1996). Tectonic
setting, aquifer system compaction, and natural compaction of deeply buried strata all
contribute to the rate of land subsidence in the Nile Delta (Stanley, 1988).
Acting together, subsidence, eustatic sea-level rise, and reduced sediment supply
since closure of the High Aswan Dam in 1964 could cause a relative rise in the sea level
over the northeastern delta plain of approximately 1 m by the year 2100 (Stanley, 1990).
This incursion would submerge much of the delta in the eastern part to as far south as 30
km from the present coast. For example, in only three coastal cities, Alexandria, Rosetta
and Port Said, over two million people would be forced to abandon their homes, 214,000
jobs would be lost and over US $35 billion in land value, property, and tourism income
would also be lost as a direct result of a sea level rise of 50 cm (El Raey, 1997). The loss
of world famous historic, cultural and archeological sites, thousands of acres of fertile
agricultural land, and the vulnerability of other low land cities in the delta outside these
three cities are not counted (El Raey, 1997). Thus, the Nile Delta sinking threatens the
existence of the coastal zone cities and sustainable urban development across the entire
delta. Therefore, there is an urgent need to update maps of the delta coastline position on
a regular basis.

3
2. Research Motivation
Land subsidence in the Nile Delta has induced marked environmental changes
particularly with respect to coastline retreat and sea-level rise in the Mediterranean Sea.
The Nile Delta has witnessed a significant urban development over the past century.
Groundwater pumping is the primary water supply for drinking water and industrial
projects. Oil exploitation and natural gas extraction in the northern part of the delta have
been also dramatically increased in the last decade. Groundwater, oil and gas pumping in
addition to sediment natural compaction, as well as seismic activities directly have
resulted in an increased compaction of the aquifer system in the delta.
There is an increasing demand for regular monitoring and accurate measuring of
subsidence and coastline retreat in the Nile Delta to gain a broad understanding of these
two phenomena and to provide decision-makers with useful information for integrated
development and sustainable use of the natural resources in the delta. Several tools such
as terrestrial leveling survey and Global Positioning System (GPS) can be used to
measure rates of coastal change and land subsidence in the delta; however, these tools
provide point measurements that are spatially and/or temporally limited. Radar
interferometry, in contrast, is employed in this study to provide subtle measurements of
surface changes in the delta at a significantly improved spatial resolution with
millimeter-level accuracy and over large areas (100 km²).
3. Problem Statement
Integrated sustainable development of the Nile Delta requires accurate and
detailed spatial and temporal measures of subsidence and coastline retreat rates that this

4
research attempts to provide using radar interferometry. The main focus of this study
addresses the research question “is the land surface of the Nile Delta experiencing
subsidence?” If so, what are the magnitudes and patterns of spatial and temporal
deformation? Coastal changes, including erosion and accretion will also be addressed
using Synthetic Aperture Radar (SAR) interferometric coherence images.
4. Study Objectives
This study employs SAR Interferometry (InSAR) techniques to detect and
measure rates of land subsidence and coastal change in the Nile Delta. The specific
objectives of this research are four-fold: (1) measure and accurately map subsidence
across broad regions in the delta; (2) measure and map coastline retreat rates in the
eastern side delta; (3) determine the spatial and temporal patterns of deformation in the
selected study sites; and (4) address the potential and limitations for successful use of
various InSAR approaches to study crustal deformation within problematic, non-ideal
areas of slow rate of deformation, such as the Nile Delta, for InSAR application.
It is also the objective of this study to make a recommendation to the European
Space Agency (ESA) either to continue or to stop regular SAR acquisitions over the Nile
Delta and areas of similar conditions by ERS-2 and ENVISAT satellites. This, in turn,
will help in development and preparation for future operational use of SAR satellites.
5. Study Approach
The Permanent Scatterer (PS) approach is applied to detect and measure urban
subsidence in three selected cities in the Nile Delta. Additionally, the tandem coherence

5
images are employed to detect and measure coastal change in the eastern side of the
delta in the 1993-2000 period.
Data from several spaceborne radar missions were considered and evaluated and
only the European ERS-1/2 C-band radar instruments were found to provide the required
spatial and temporal data coverage. From the large number of archived ERS-1/2 InSAR
pairs, 73 ERS InSAR scenes were selected on a time-scale of eight years (1993-2000).
Thirty nine ERS scenes were selected for the eastern part of the delta (Track: 436,
Frame: 2979), and thirty four ERS scenes were selected for the Cairo area (Track: 436,
Frame: 2997).
Several InSAR pairs with short baselines (<200 m) have been selected to test the
feasibility of applying the conventional SAR Interferomtery (InSAR) in the Nile Delta.
Low baseline values limit the potential for geometric decorrelation in InSAR. Several
ERS Tandem pairs were also selected to generate reference DEMs and to create tandem
coherence images for accurate detection of the coastline positions. Furthermore, low
Doppler Centroid differences were ensured for all selected raw data.
6. Study Area
The Nile River Delta is located in northern Egypt and has an area of about 22,000
km². Its 225 km long, smooth coastline is located approximately 160 km north of Cairo,
which resides at the apex of the delta (Figure 1.1). Elevations decrease gently in the delta
from south to north, with an 18 m elevation near Cairo decreasing to sea level along the
coast. Elevations decrease across the delta at approximately 0.1 m km-1, but the average
gradient is considerably lower in the northern delta plain near the Mediterranean Sea.

6
Figure 1.1. The Nile Delta as seen by MODerate resolution Imaging Spectrometer (MODIS), acquired on February 05, 2003. Major cities appear in grayish color and vegetated areas appear in green color
Mediterranean Sea
Damietta Promontory Rosetta Promontory
Alexandria
Cairo
Mansura Mahala
Eastern Desert Western Desert
Sinai
Port Said
Gulf of
Suez
N
50 Km

7
With 50 million people occupying its 22,000-km2 area, the Nile Delta is one of
the most densely populated areas on Earth (average population density of 2,300 people
km-2). About 97% of the Egyptian population lives on the Nile River banks and its delta,
which compose approximately 4% of the total land area of Egypt. This densely
populated coastal delta houses a multitude of significant archeological sites and has
many strategic natural resources including natural gas, oil, groundwater, and black
sands. In addition, the fertile soils in the delta account for two-thirds of the agricultural
land in Egypt and the region supports numerous fisheries (Stanley, 1996). It is also a
vibrant tourist destination and an essential recreation outlet for the residents of congested
interior cities of Egypt. Thus, the Nile Delta is strategically and economically the most
important region in Egypt.
The delta has an arid climate with temperatures exceeding 30º C in July, and
mean annual precipitation approximately 200 mm at the coast and less than 100 mm on
the delta. Mean potential evapotranspiration rates are approximately 600 - 1100 mm yr-1.
Potential evapotranspiration is the maximum amount of evaporation and transpiration
from a vegetated surface when an abundant and continuous supply of soil moisture
content is available (Beaumont et al., 1976; Stanley and Warne, 1993).
The aquifer system in the Nile Delta consists of alluvial sediments containing
two water-bearing layers. The lower layer is highly permeable Pleistocene graded sand
and gravel. The upper layer is a Holocene clay-silt layer of relatively low horizontal
hydraulic conductivity and very low vertical permeability. The base of the system is the
Pliocene clay (Idris and Nour, 1990).

8
The delta aquifer is bounded by the Mediterranean Sea in the north and the Suez
Canal in the east. The thickness of the aquifer is diminished and seems to be isolated
from the aquifer of Upper Egypt Nile Valley by thick layers of Pliocene and/or Miocene
clay approaching the clay cap near Cairo in the south. The aquifer is in direct contact
with that of the Western Desert in the west (Idris and Nour, 1990). The thickness of the
Pleistocene aquifer is 100-900 m, with thickness decreasing towards the delta fringes
and southward to Cairo. The saturated zone of fresh water attains a maximum thickness
of 300 m with less than 1000 ppm. Main recharge of the delta aquifer system is through
infiltration from irrigation systems and irrigation water through the clay cap. The total
annual amount of water pumped from the delta aquifer is estimated to be 1.6 x 10⁹ m3
(Idris and Nour, 1990).
The Nile Delta began to develop in the Messinian time. During the Messinian
lowering of sea level, the Nile River deposited its sediment load on a broad, subareal-
exposed continental margin. The early Pliocene transgression resulted in invading and
filling the down-faulted Nile valley to the Middle Egypt (Sestini, 1989).
Tectonic activities in the eastern part of Egypt impacted the Nile system during
the Pliocene and Pleistocene (Sestini, 1989). Field mapping, seismic exploration, and
well logs suggest a thick accumulation exceeded 3,000 m of superposed and partially
overlapping terrigenous sediments underlying the Holocene delta plain (Zaghloul et al.,
1977a,b; Rizzini et al., 1978; Zaghloul et al., 1979; Shawky Abdine, 1981;
Schlumberger, 1984; Stanley and Warne, 1998). Late Quaternary subsurface stratigraphy
of the delta consists of alluvial sand and stiff mud of about 12 Ka age. It is
unconformably overlain by shallow marine to coastal transgressive sands with ages of

9
about 12 - 8 Ka. These sands are unconformably overlain by a variable sequence of
Holocene deltaic sands, silts and muds of about 7.5 Ka age (Stanley and Warne, 1998).
Northern Egypt, including the Nile Delta, has been affected by three major
tectonic phases from the early Mesozoic to the Recent (Abdel-Aal et al., 1994; Mosconi
et al., 1996). The first tectonic phase involved a left lateral oblique extension as a result
of the westward movement of Eurasia relative to Africa during the Triassic and the
Jurassic. This movement created NE-SW and ENE-WSW fault systems either as normal
faults or strike-slip faults with left lateral motions (Meshref, 1990; Abdel-Aal et al.,
1994). The second major phase of tectonic activities was a NW-SE oblique contraction
related to the closing of the Tethys Sea during the late Cretaceous - early Tertiary. The
second phase resulted in a fold system trending ENE associated with the thrust faults of
the Syrian Arc System and a fault system trending NW-NNW (Meshref, 1990). The final
tectonic phase began in the late Eocene and continued to the Recent and created three
major fault systems: (1) the NNW normal fault system, parallel to the Gulf of Suez,
developed in the late Eocene and continued to the Miocene, (2) the NNE fault system,
parallel to the Gulf of Aqaba, formed by a left lateral oblique slip in the Miocene and
continued to the Recent, and (3) the NS fault system formed by rejuvenating and
reactivating the older pre-Tertiary structures during the early Miocene (Orwig, 1982;
Meshref, 1990).
The previous geologic studies revealed that tectonic activities occurred in north
Egypt impacted the eastern side of the Nile Delta and the region of greater Cairo more
than the western side of the delta. This implies a major contribution of the tectonic factor
to the long-term subsidence rates in the eastern side of the delta and in greater Cairo.

10
7. Synopsis
This investigation employed Synthetic Aperture Radar Interferometry (InSAR) to
study urban subsidence and coastal change in the densely vegetated Nile Delta. A review
of SAR interferometry for measuring topography and crustal deformation is presented in
Chapter II with a short discussion of radar interferometry principles. Chapter III and
Chapter IV present the results of the land subsidence investigations using InSAR.
Chapter III discusses land subsidence in greater Cairo in the southern part of the delta.
Land subsidence in two other cities, Mansura and Mahala in the middle of the Nile
Delta, is presented in Chapter IV. Chapter V discusses the use of SAR tandem coherence
images to detect and measure coastal change at Damietta Promontory in the eastern side
of the Nile Delta. The last chapter, Chapter VI, discusses the potential and limitations for
successful use of InSAR approaches to study crustal deformation, particularly in densely
vegetated areas such as the Nile Delta. This chapter also summarizes the conclusions of
this study and suggests avenues for future work.

11
CHAPTER II
SAR INTERFEROMETRY FOR MEASURING TOPOGRAPHY
AND CRUSTAL DEFORMATION
1. Introduction
Synthetic Aperture Radar Interferometry (InSAR) is a revolutionary remote
sensing approach capable of mapping terrain heights with 1 m vertical accuracy and
detecting subtle surface deformation with 1 mm level accuracy. InSAR data can be
acquired both day and night, in all-weather conditions, with SAR spatial resolutions, on
a global scale, and over day to year periods. InSAR has been used worldwide for a wide
variety of applications, including, but are not limited to, mapping terrain heights and
monitoring active volcanoes, active tectonics, land subsidence, landslides, and
earthquake activities, as well as studying glacier dynamics.
Active radar systems illuminate the surface of Earth and detect radar
backscatters; thus, radar images can be acquired independent of the solar illumination.
Generally, imaging radar systems include Real Aperture Radar (RAR) and Synthetic
Aperture Radar (SAR). The RAR system requires a long antenna and a high power
output to achieve an acceptable resolution and a dynamic range, as the resolution is
proportional to the antenna length and inversely proportional to the range. SAR systems
overcome the limitation of the antenna length by synthesizing an antenna that receives a
series of reflected radar signals and electronically combines them with reference

12
wavelengths. The resolution of SAR images remains the same over all ranges (Elachi,
1988; Curlander and McDonough, 1991).
2. Historical Review
Numerous studies have been published demonstrating the unique contribution of
InSAR to the science community. The first use of InSAR dates from the 1960s when
observations of the surface of Venus using Earth-based antennas were conducted by
Rogers and Ingalls (1969) and Rumsey et al. (1974). Zisk (1972a,b) applied the same
technique to measure the topography of Moon. Graham (1974) was the first to introduce
InSAR for Earth topographic mapping using a military airborne SAR system.
The first civilian InSAR application was accomplished by NASA scientists at the
Jet Propulsion Laboratory (JPL) in Pasadena, California. Zebker and Goldstein (1986)
presented the first practical results of InSAR topographic measurements utilizing a side-
looking airborne system. They mounted two SAR antennas on an aircraft with a baseline
of 11.1 m length. One antenna transmitted the radar signals, and the backscattered
signals were received by the two antennas.
The produced complex images from this experiment had approximately 10 m
resolution and were not corrected for the aircraft roll as a result of the lack of
information about the aircraft attitude. The achieved accuracy was quite limited, with
elevation deviations of 2-10 m Root Mean Square (RMS) error over the ocean and with
larger RMS values over the land. Nevertheless, the experiment showed the promise of
the interferometric approach. Gabriel and Goldstein (1988) adapted the existing

13
interferometric technique to crossed orbits using SIR-B repeat-pass data acquired over
the Rocky Mountains, British Columbia, Canada, in October 1984. This applied
technique was computationally complicated and required precise knowledge of orbit
parameters, as the orbits were not parallel.
A remarkable improvement occurred when Gabriel et al. (1989) introduced the
differential interferometric approach. They produced a double difference interferogram
using two interferograms generated from repeat-pass SEASAT observations. It was
demonstrated that SAR interferometry could detect elevation differences on the order of
sub-centimeter. The multi-baseline approach was first presented by Li and Goldstein
(1990). They studied the effect of using various baselines to detect topography. Their
study showed that the sensitivity of height measurements is proportional to the baseline
length, but the phase error also increases as the baseline increases.
Since the launch of the ERS-1 satellite by the European Space Agency (ESA) in
July 1991, a huge archive of C-band InSAR data has become available, and numerous
papers covering InSAR limitations and its potential applications have been published.
Applications of spaceborne InSAR were greatly extended after the launch of the ERS-2
satellite by ESA in April 1995. The tandem mode of the ERS-1 and ERS-2 satellites
acquired InSAR data with only one-day separation. This, in turn, allowed comprehensive
investigations of slight change in terrain heights, atmospheric effects, and temporal
decorrelations in InSAR data.

14
Currently, SAR data appropriate for InSAR applications are available from
several spaceborne and airborne missions, including ERS-1, ERS-2 and ENVISAT
satellites operated by the European Space Agency, JERS-1 and ALOS operated by the
National Space Development Agency of Japan, RADARSAT-1 and RADARSAT-2
operated by the Canadian Space Agency, and SIR-C/X-SAR operated by the National
Aeronautics and Space Administration (NASA), the German Space Agency (DARA),
and the Italian Space Agency (ASI). A wide variety of InSAR data acquired by airborne
interferometers are also available throughout the world. The availability of various kinds
of InSAR data, open-source InSAR processors as well as commercial InSAR processing
packages, in addition to InSAR expertise led to numerous publications in various fields.
3. System Design and Implementation
Whereas conventional SAR systems utilize a single antenna to acquire data,
InSAR systems acquire data using two antennas separated by a known baseline. SAR
interferometric data can be acquired by systems of three different designs: along-track,
across-tack, and repeat-pass interferometric systems. Those system names refer to the
relative positions of the antennas with respect to each other. In along-track systems, the
baseline is parallel to the flight path. In across-track systems, the baseline is
perpendicular to the flight path. However, in repeat-pass systems, only one antenna is
mounted on the system and the second antenna is simulated by repeating the pass at a
later time. It is actually a way of conducting across-track interferometry utilizing a single
antenna.

15
3.1. Along-track interferometry
In along-track interferometry, two SAR antennas are placed parallel to the flight
path. Both SAR antennas transmit and receive the microwave signals in a single pass.
Currently, the along-track interferometry is limited to airborne SAR platforms. Feasible
applications are the detection of moving objects such as glaciers and ice sheets, the
mapping of ocean currents, and the measurement of the directional wave spectra (e.g.,
Goldstein and Zebker, 1987; Goldstein et al., 1989; Marom et al., 1991; Orwig and Held,
1992).
3.2. Across-track interferometry
In across-track interferometry, two SAR antennas are placed perpendicular to the
flight direction. In across-track interferometry, one antenna transmits the radar signals
and the radar backscatter is received by the two SAR antennas simultaneously in a single
pass. The system captures information on the terrain heights. The problem with the
system geometry is that errors caused by the aircraft roll can not be distinguished from
the influence of terrain slope. The across-track interferometry is suitable for topographic
mapping.
The Shuttle Radar Topography Mission (SRTM) is a good example for cross-
track interferometry utilizing dual antennas to acquire InSAR data in a single pass.
SRTM acquired InSAR data over approximately 80% of the entire landmass of Earth in
eleven days during February 2000. SRTM data are acquired in C- and X-bands and
processed into a global DEM by NASA-JPL and the German aerospace center (DLR),

16
respectively. SRTM DEMs are publicly available at resolution levels of one and three-
arc sec (Rabus et al., 2003).
3.3 Repeat-pass interferometry
In repeat-pass interferometry, a single antenna is used to acquire InSAR data by
imaging the same area at different times and with a slightly different viewing geometry.
The baseline in this case is determined by the separation between the platform passes.
The repeat-pass approach requires precise orbital parameters. Thus, it is most suited to
spaceborne platforms. ERS, ENVISAT, RADARSAT, JERS, and ALOS satellites are
repeat-pass spaceborne systems.
Numerous studies applied the repeat-pass approach using InSAR data from
various SAR systems such as SIR-B (Gabriel and Goldstein, 1988), SEASAT (Li and
Goldstein, 1990), and ERS-1 (Prati and Rocca, 1992). Gray and Farris-Manning (1993)
applied the repeat-pass approach using an aircraft of the Canadian Center for Remote
Sensing (CCRS) operated with one SAR antenna.
4. InSAR Theory
Synthetic Aperture Radar Interferometry (InSAR) is an active radar system that
transmits and receives microwave signals using two SAR antennas. It works by
accurately measuring the distance between the sensor and a point on the surface of Earth.
The interferometric data acquired by the two SAR antennas are representations of both
amplitudes and phases of the radar backscatter. A phase preserving SAR processor can

17
be used to transform these data into two separate complex SAR images for the same
area. The two complex SAR images will be quite similar; however, the phase of the
corresponding pixels will be slightly different. In across-track interferometry, this phase
difference can be interpreted as the pixel height (Figure 2.1).
In an InSAR image, the phase difference and the pixel height are related by:
)(222121 ρρ
λπρ
λπφφφ −=∆=−= (2.1)
θρ cos1−= hz (2.2)
where φ is the phase difference between the phases (φ 1 and φ 2) of the radar backscatters
at the two SAR antennas, λ is the radar wavelength, ρ1 and ρ2 are the ranges respectively
from the two successive SAR antennas S1 and S2, z is the height to be calculated, h is the
height of the reference orbital antenna S1 above the datum, and θ is the look angle of the
reference interferometer S1.
Equation (2.1) represents the case of a single-pass InSAR system where one of
the two SAR antennas mounted on the platform transmits the radar signals and both
antennas receive the radar backscatter simultaneously. In repeat-pass interferometry, the
relationship demonstrated in equation (2.1) can be expressed as:

18
Figure 2.1. General geometry of across-track interferometry. The two SAR interferometers, S1 and S2, are flying parallel to the X-axis (azimuth direction) with a perpendicular baseline B┴ and a parallel baseline B║. ρ1 and ρ2 are the ranges respectively from the two successive SAR antennas S1 and S2, z is the height to be calculated, h is the height of the reference orbital antenna S1 above the datum, θ is the look angle of the reference interferometer S1, ρg and ρs are the ground range and the slant range, respectively, and β is the incident angle
X
Y
Z
z
B┴
B║
ρ1
ρ2
S2
S1
θ
h
B
ρg
ρs
θ
β

19
)(442121 ρρ
λπρ
λπφφφ −=∆=−= (2.3)
where φ is the phase difference between the phases (φ 1 and φ 2) of the radar backscatters
at the two SAR antennas, λ is the radar wavelength, and ρ1 and ρ2 are the ranges
respectively from the two successive SAR antennas S1 and S2.
In surface deformation studies, the topographic phase contribution has to be
estimated and removed from the interferometric signals. The topographic phase can be
expressed as:
θλρ
πφsin
4 zBtopo
⊥−= (2.4)
where topoφ is the topographic phase, ⊥B is the perpendicular baseline between the two
SAR antennas, z is the topographic height, λ is the radar wavelength, ρ is the range (the
distance between the radar and a point on the ground), and θ is the look angle of the
reference interferometer.
In along-track interferometry where two SAR antennas are positioned
horizontally along the flight path, the phase difference can be interpreted as the target
motion proportional to the radial distance moved in the time required for the rear
antenna to occupy the position of the forward antenna (Goldstein and Zebker, 1987). The

20
relationship of the phase difference and the radial velocity of the target can be
represented as:
vuBλπφ 4
= (2.5)
where u is the radial velocity of the target, B is the baseline between the two SAR
antennas, and v is the velocity of the radar platform.
The basic task in processing InSAR data is to extract information about three-
dimensional objects from the complex InSAR data. The real (Re) and the imaginary (Im)
components of the complex signals contain information about the interferometric phase
(φ ) and the amplitude (A) of the radar backscatters.
ReImarctan=φ (2.6)
22 ReIm +=A (2.7)
With pairs of complex values (C1 and C2), equation (2.6) can be re-written as:
⎥⎥⎥⎥
⎦
⎤
⎢⎢⎢⎢
⎣
⎡
⎥⎦
⎤⎢⎣
⎡
⎥⎦
⎤⎢⎣
⎡
=
∑
∑
=
=
)(*2
1
)(1
1
)(*2
)(1
Re
Imarctan
iN
i
i
N
i
ii
CC
CCφ (2.8)

21
This maximum likelihood estimator provides the phase difference for
homogenous distributed targets (Allen, 1995), where N is the number of looks to be
averaged (Rodriguez and Martin, 1992) and * denotes the complex conjugate.
5. Common Processing Approaches
5.1. Two-pass interferometry
In two-pass interferometry, two SAR images acquired at different times for the
same area are needed to create an interferogram containing both topography and surface
deformation. The approach requires an external Digital Elevation Model (DEM) for the
same area be geocoded to the SAR geometry for topographic phase removal.
The advantages of the two-pass approach are: (1) only one pair of SAR images is
required, which saves money, time, effort, and complication in processing, (2) no need
for phase unwrapping of a topographic interferogram, avoiding errors in phase
unwrapping and computation load, and (3) the geolocation process is not affected by the
quality of an unwrapped topographic interferogram.
The disadvantages of the two-pass approach are mostly associated with the use of
an external DEM. The external DEM may contain significant errors, the datum of the
DEM may be not known, or most importantly the DEM itself may be unavailable or
available but inappropriate with regard to accuracy and spatial resolution.

22
5.2. Three-pass interferometry
Three-pass interferometry requires three SAR images taken for the same area at
different times. Two of them should be acquired within a very limited time period to
create a topographic interferogram that can be used later for topographic correction. The
tandem mode of the ERS satellites, in which images are acquired with only one day
apart, is appropriate for this purpose. The reference image used for the creation of the
topographic interferogram is used with the third image to produce another interferogram
containing both topographic and surface deformation contributions.
Three-pass interferometry has the advantages that the three radar images are all
in SAR coordinates. It does not require an external DEM, thus avoiding errors associated
with external DEMs and interpolation errors associated with topographic phase
simulation and geocoding. The disadvantages of the three-pass interferometry include
difficulty in finding an appropriate SAR triplet, and errors in phase unwrapping of the
topographic interferogram can produce errors in the deformation estimation and the
geolocation process.
5.3. Four-pass interferometry
Four-pass interferometry requires four SAR images taken for the same area at
different times; two of them are used to construct an interferogram containing both
topography and deformation. The other two images are used to create a topographic
interferogram for topographic correction. The four-pass approach is quite similar to the
three-pass approach. However, in the four-pass approach, the two interferograms are

23
processed independently using two different reference images. Therefore, one of the
interferograms has to be resampled to the other for topographic phase removal.
Critical limitations for applying conventional SAR interferometry, including,
two-, three- and four-pass interferometric approaches, are basically related to temporal
decorrelation, geometric decorrelation, and atmospheric path delay. A detailed
discussion of these limitations is provided in Chapter VI.
5.4. Permanent scatterer interferometry
The Permanent Scatterer interferometric approach has been recently introduced
by Ferretti et al. (2000) as a new approach to monitor surface deformation. This pixel-
by-pixel approach uses Permanent Scatterers of sufficient spatial density that exhibit
coherence over long time periods, such as man-made features and bare rocks, to capture
motion of the scatterers. The approach enables the exploitation of the individual phases
of the Permanent Scatterers in areas of low coherence where conventional InSAR fails as
a result of temporal and geometrical decorrelations, as well as atmospheric
heterogeneities.
Over conventional InSAR, the advantages of the Permanent Scatterer
interferometry are: (1) the critical baseline and the Doppler Centroid difference defined
as critical limitations for conventional InSAR approaches are no longer limitations for
the Permanent Scatterer interferometry, (2) target motion can be accurately tracked on a
pixel-by-pixel basis over long time periods, (3) elevations of the Permanent Scatterers
(PSs) can be estimated with good accuracy by combining very long perpendicular

24
baselines, (4) atmospheric artifacts can be accurately estimated and eliminated by using
a long time series, and (5) isolated coherent scatterers, such as urban areas and bare
rocks, can be detected and tracked among incoherent scatterers, such as densely
vegetated areas.
The disadvantages of Permanent Scatterer interferometry are: (1) it requires a
large number of SAR acquisitions of the same area (at least 20 scenes), (2) data are
expensive and it is difficult to find the appropriate time series needed, (3) stable
reflectors need to be of sufficient spatial density, and (4) it does not work properly over
low reflectivity areas of smooth surfaces. More details on the approach can be found in
Ferretti et al. (2000 and 2001).
6. Basic Processing Steps
There are significant differences in the degree to which processing facilities
prepare the raw signal of the InSAR data for distribution. ERS SAR raw data, which are
used in this research, are delivered in the CEOS format. CEOS stands for the Committee
on Earth Observation Satellites. The CEOS format consists mainly of four files: a
volume directly file, a leader file, a data file, and a null volume file. The volume
directory file contains general information on the arrangement of the data on the
distributed media. The leader file contains specific information about the distributed
data, such as raw data file size, spacecraft state vectors, scene center latitude and
longitude, and time of acquisition. The data file contains the raw signal product. It
consists of a header record and the raw data usually stored as one data line per record.

25
Each record consists of a prefix, raw data and a suffix. Finally, the null volume file
contains information about ending the medium of storage.
6.1. Image formation
All SAR interferometric approaches require that SAR acquisitions for the same
area be processed consistently relative to each other before the coregistration process. To
produce Single Look Complex (SLC) images appropriate for InSAR processing, InSAR
raw data have to be subject to a series of processing steps, including range spectrum
estimation, missing line correction, estimation of the Doppler ambiguity, Doppler
Centroid estimation, range compression, azimuth prefilter, azimuth auto-focus, and
azimuth compression. Several technical parameters are needed for the process of image
formation. The important parameters of the ERS satellites are given in Table 2.1.
The orbital information provided with the CEOS raw data is a rough estimate and
can dramatically affect the results. Precision state vectors are essential for accurate
estimation of the interferometric baselines. Precise state vectors of the ERS satellites are
available at the European Space Agency (ESA) and the Delft Institute for Earth-Oriented
Space Research (DEOS). The quality of the DEOS orbital state vectors exceeds that of
the ESA precision state vectors (PRC). For ERS satellites, DEOS orbital data are of
about 5 cm vertical accuracy and of about 13 cm horizontal accuracy in along- and
across-track directions. The several centimeters error in orbital estimations is repeatable
in each cycle and it is the same for ERS-1 and ERS-2 along the same track and, thus, its
effect is eliminated in InSAR processing.

26
6.2. Interferogram generation
A focused complex SAR image is a representation of amplitudes and phases of
the radar backscatters in a two-dimensional record. Interferogram generation requires
that complex SAR images be correctly focused and calibrated and be precisely
coregistered to sub-pixel accuracy, 0.1 pixel. Phase value differences are calculated
using the amplitude values of corresponding pixels in two precisely coregistered SAR
images. The complex interferogram is produced by pointwise multiplication of the
corresponding pixels in the two complex coregistered SAR images as follows:
φφφφφ iiii eAeAAeAeACCI .... )(2121
*21
2121 ==== −− (2.8)
where C1 is the complex value, amplitude and phase, of the reference image, C2 is the
complex values of the resampled image, the * denotes the complex conjugate, A is the
amplitude of the interferogram, and φ is the phase of the interferogram.
6.3. Phase unwrapping
The measured interferometric phase is given modulo 2π, i.e. it is wrapped. The
wrapped phase does not infer range differences, as it is limited to –π and +π; therefore,
phase unwrapping is needed to convert the cyclic phase values into continuous values.
To solve the interferometric phase ambiguity, it is necessary to add the correct integer
number of phase cycles (n2π) to every phase measurement. A wide variety of algorithms

27
Table 2.1. Important technical parameters of ERS SAR satellites Parameter Value Carrier frequency 5.3 GHz Wavelength 5.656 cm Pulse bandwidth 15.55 MHz Pulse repetition interval 595.27 µs Pulse repetition frequency 1679.9 Hz Pulse length 37.1 µs Sampling frequency 18.96 MHz Chirp slope 419 GHz s-1 Receiver noise temperature 3700 K Range to first pixel 832 km Orbital elevation 790 km Orbital interval time 1, 3, 35 days Look angle 20.5° – 25.9° Incidence angle 23° Swath width 100 km Ground range resolution 25 m Slant range resolution 10 m Azimuth resolution 5 m One look range pixel size 20 m One look azimuth pixel size 4 m Ground coverage of one scene ~100 km² Nominal critical baseline ~ 1200 m

28
has been developed for phase unwrapping. A thorough discussion and review of the
existing algorithms can be found in Chen (2001). The unwrapped interferometric phase
( unwφ ) is a function of the topography ( topoφ ), the surface deformation ( defφ ) in the Line-
Of-Sight (LOS), the atmospheric artifacts ( atmφ ), and the phase noise ( noiseφ ). It can be
expressed as the sum of these contributions:
noiseatmdeftopounw φφφφφ +++= (2.9)
Once the measured interferometric phase is unwrapped correctly, the absolute
phase can be computed using a point of a known elevation within the SAR scene as an
absolute elevation reference. Then, the unwrapped phase values in the topographic
interferogram can be converted into height values, and the unwrapped phase values in
the topographically corrected interferogram can be converted into displacement values.
This is usually followed by a geocoding step in which the interferometric
products are projected to a common refernce system. Geocoding enables combination of
the InSAR products with products from other sources.
For Permanent Scatterer interferometry, there is no single processing procedure
to follow, as each dataset has its own characteristics and problems; however, a complete
description of the procedures applied in this dissertation is given in chapter III.

29
7. Interferometric Decorrelations and Limitations
Coherency between SAR acquisitions is by far the most important requirement
for successful use in SAR interferometry (Hanssen, 2001). Temporal and geometrical
decorrelations (Zebker and Villasenor, 1992) and atmospheric heterogeneities
(Goldstein, 1995; Massonnet and Feigl, 1995; Zebker et al., 1997) between SAR
acquisitions are three major contributors to phase ambiguity in SAR interferometry.
Temporal decorrelation hampers SAR interferometric measurements where positions of
the scatterers change with time within the resolution cell.
Geometric decorrelation limits the utility of SAR interferometry to InSAR pairs
of perpendicular baselines smaller than the critical one, ~1200 m for ERS (Zebker and
Villasenor, 1992; Massonnet and Feigl, 1998). For surface deformation measurements,
the phase gradient should be within one fringe per pixel (Massonnet and Feigl, 1998).
Atmospheric heterogeneities superimpose an Atmospheric Phase Screen (APS) in SAR
images, which seriously affect the accuracy of deformation measurements (Massonnet
and Feigl, 1995 and 1998; Colesanti et al., 2003). Cycle ambiguity problems in
conventional InSAR can be overcome by carrying out InSAR measurements on
Permanent Scatterers (PSs), exploring a long temporal series of SAR acquisitions for the
same area (Ferretti et al., 2000 and 2001; Colesanti et al., 2003).
Surface deformation studies are also limited by the swath width, 100 km for
ERS, and the range pixel size, 20 m for ERS, of the SAR platform (Massonnet and Feigl,
1998). Additionally, rough topography in mountainous areas may lead to interferometric

30
decorrelation, but the effect of topography depends on the platform acquired the InSAR
data.
In most cases, uncertainties in InSAR measurements are quantifiable and their
effect can be eliminated. Uncertainties, in InSAR pairs that can be combined to construct
interferograms, related to system errors are repeatable and comparable in all SAR
acquisitions. Therefore, they have a slight effect on InSAR measurements, as all InSAR
measurements are relative to a reference acquisition. Furthermore, InSAR acquisitions
that are dramatically affected by errors and decorrelations or are not within the InSAR
system limitations can not be combined originally in processing to produce
interferograms.
8. Applications
8.1. Topographic mapping
Spaceborne SAR systems have been proven capable of acquiring images to
produce global DEMs of high quality in few days. However, airborne SAR systems can
produce DEMs of higher resolution, similar to optical streogrammetry, because they fly
closer to the ground (Bürgmann et al., 2000). Unlike stereo-pair radar techniques, where
the observable terrain height is the order of the resolution cell size, the measured terrain
height with InSAR techniques is of the order of the radar system wavelength (Zebker et
al., 1992).
Single-pass interferometry has many advantages for DEM generation over the
repeat-pass systems utilizing a single antenna because the two SAR images are taken

31
simultaneously and the length and orientation of the baseline can be accurately
determined. The simultaneous acquisition prevents interferometric decorrelations and
neglects the effects of the atmospheric path delay. SRTM is a good example of this
approach.
The InSAR data collected with the tandem mode of the ERS satellites are
appropriate for DEM generation, as they are acquired with only one day apart. Zebker et
al. (1994b) estimated the accuracy of DEMs derived from ERS-1 images. Their study
indicated that there are two main errors in generating DEMs using this approach, which
are the height estimation error, and the baseline error. The height estimation error is a
function of the error in the phase estimation. Ferretti et al. (1996) introduced the multi-
baseline approach for the automatic generation of high quality DEMs using InSAR data.
8.2. Crustal deformation studies
InSAR has a unique capability of detecting active processes that are not
accessible with other geodetic tools. SAR interferometry is capable of detecting surface
changes of the order of the radar wavelength. For the C-band, wavelength = 5.66 cm,
radar systems, e.g., ERS and RADARSAT, one color cycle in a topographically
corrected interferogram marks 2.83 cm of surface deformation in LOS.
8.2.1. Earthquakes
The Landers earthquake of 1992 was the first seismic event captured with InSAR
(Massonnet et al., 1993 and 1994; Zebker et al., 1994a; Massonnet and Feigl, 1995a;

32
Hernandez et al., 1997; Price and Sandwell, 1998). Results from these studies to measure
the co-seismic displacements agreed well with the conventional measurements. Some
InSAR studies provided more insights into modeling of the earthquake motion (Pletzer
et al., 1994; Massonnet and Feigl, 1995b).
8.2.2. Volcanoes
Monitoring active volcanoes is not feasible with traditional surveying methods.
The first use of InSAR to study volcanoes was reported by Evans et al. (1992). They
used TOPSAR airborne data to assess damage caused by lava flaws and the
intercomparison of the volcano morphology. Massonnet et al. (1995) used ERS data to
investigate volcanic deformation of Mount Etna. Several volcanoes across the world
have been studied using InSAR such as Hawaiian volcanoes (Rosen et al., 1996),
Alaskan volcanoes (Lu et al., 1997), localized inflation on Izu Peninsula, Japan
(Fujiwara et al., 1998a), deformation of the active Yellowstone Caldera (Wicks et al.,
1998), and volcanic deformation in the Long Valley (Thatcher and Massonnet, 1997).
Zebker et al. (2000) reported sixteen active volcanoes detected with SAR interferometry.
More recently, Hooper et al. (2004) introduced a new method for measuring deformation
on volcanoes and other natural terrains using InSAR Persistent Scatterers.
8.2.3. Landslides
Landslides usually degrade the ground surface quickly reducing the
interferometric coherence, as they commonly deform the ground surface in excess of the

33
high gradient limit. Studying landslides requires a very accurate DEM, as they usually
occur in areas of rough topography (Massonnet and Feigl, 1998). All these factors limit
the use of InSAR to study most of landslides across the world. Singhroy et al. (1998)
studied landslide characterization in Canada using InSAR. Rott et al. (2003) investigated
the InSAR techniques and applications for monitoring landslides. Another study for
landslide monitoring using ground-based SAR interferometry was reported by Tarchi et
al. (2003). Colesanti et al. (2003) applied the Permanent Scatterer interferometric
technique to monitor landslides and tectonic motions. Hilley et al. (2004) addressed the
dynamics of slow-moving landslides using the Permanent Scatterer analysis.
8.2.4. Land subsidence
Several recent studies have measured land subsidence using ERS interferometry.
Carnec et al. (1996) detected land subsidence of coal mining near Gardanne, France.
Massonnet et al. (1997) observed subsidence over a geothermal field in California.
Fielding et al. (1998) mapped subsidence at the Lost Hills and Belridge oil fields as a
result of oil and gas extraction. Galloway et al. (1998) studied land subsidence in the
Lancaster area, California. Amelung et al. (1999) mapped subsidence in Las Vegas,
Nevada. Hoffmann et al. (2001) studied seasonal subsidence and rebound in Las Vegas
Valley, Nevada, using synthetic aperture radar interferometry. Buckley et al. (2003)
measured successfully urban land subsidence in Houston, Texas, using conventional
SAR interferometry. More recently, Dixon et al. (2006) studied land subsidence in New
Orleans using the Permanent Scatterer technique.

34
CHAPTER III
LAND SUBSIDENCE IN GREATER CAIRO
1. Introduction
Land subsidence is a major global geomorphic problem, particularly in densely
populated deltas. The Nile Delta (Figure 1.1) is no exception. However, to date, the
magnitude and temporal and spatial patterns of land subsidence in the delta are not well
known. Several factors contribute to the rate and patterns of subsidence in the Nile
Delta. These factors are natural sediment compaction, tectonic setting of the region,
groundwater pumping, and oil and gas extraction. Extraction of oil and gas is the major
contributing factor in the northern coastal zone, particularly in the western side of the
delta. However, groundwater pumping is the major contributing factor in the middle and
the southern parts of the delta, especially in big cities such as Cairo, Mansura, and
Mahala (Figure 1.1).
Over the past 100 years, the population of Egypt has increased from 10 million to
approximately 65 million, with a growth rate of about one million people per year
(World Bank, 1990). Currently, the approximate population of Egypt is 77 million; 50
million of them inhabit the Nile Delta.
Groundwater has been a major source of municipal and domestic water supply in
the Nile Delta during the last few decades. The dramatic change in the population
density in the delta has led to a significant increase in the rate of groundwater pumping,
especially in the metropolitan areas. This, in turn, accelerated the rate of urban
subsidence in the delta. Declining groundwater in the aquifer system in the delta

35
contributed also to the rate of the long-term subsidence as a result of the compaction of
the aquifer system that consists mainly of unconsolidated sediments composed of a
significant fraction of silts, clays and sands.
Stanley (1990) studied sediment borings collected from the Nile Delta and
radiocarbon dated many of them. He investigated 65 sediment borings (Figure 3.1A)
with depth ranging from 10 to 60 m obtained from Smithsonian Institution drilling
expeditions. In addition, he consulted approximately 100 core lithologic logs to improve
subsurface correlations. Figure 3.1B shows a summery of the late Quaternary
stratigraphy in the Nile Delta. The study by Stanley (1990) revealed that the entire
northern zone, where samples were collected, is presently subsiding.
Stanley (1990) speculated that mapping the base of the Holocene deltaic facies,
dated at approximately 8000-6500 yr BP, indicates differential subsidence of the
northern part of the delta. According to Stanley (1990), the average of long-term
subsidence rates near the coast for the mid to upper Holocene ranges from approximately
1.0-2.5 mm yr-1 in the west to 5.0 mm yr-1 in the east (Figure 3.1A). Zaghloul et al.
(1977b), Said (1981), Stanley (1988 and 1990), and Stanley and Warne (1993) attributed
the rapid rate of subsidence in the eastern side of the delta to stratigraphic and tectonic
factors.
Warne and Stanley (1993) studied archeological sites along the Nile Delta margin
to re-assess and refine rates of subsidence in the delta. Their study indicated that
subsidence rates estimated by Stanley (1990) for the northern part of the delta are
minimum rates because sediment reworking generally produces radiocarbon dated core

36
Figure 3.1. (A) Locations of sediment borings and land subsidence rates in the Nile Delta, (B) simplified stratigraphic logs depicting late Quaternary sequences in the Nile Delta from Stanley and Warne (1998)
Mediterranean Sea
Nile Delta
25 km
N A
B
mm
I II III
I
II III Nile Delta

37
ages being older than the ages of final burial. Zaghloul et al. (1990) studied the
geomorphologic and geologic evolution, as well as subsidence in the Nile Delta, and
reported similar rates of long-term subsidence during the Quaternary. A recent attempt
has been made by Stabel and Fischer (2001) to measure urban subsidence in Cairo using
satellite radar interferometry, but the study was not successful because they could not
construct or even find a suitable DEM for the purpose of topographic correction.
To date, the actual rates of subsidence and its spatial and temporal variations
across the Nile Delta are not well known, as the measures from the aforementioned
studies are just rough estimates. Unfortunately, no research has been conducted so far to
measure land subsidence in the delta using the traditional leveling survey methods.
Recently, several GPS networks have been established in Egypt. One of these consists of
eleven permanent GPS stations around greater Cairo established in 1995. The GPS
network should be suitable for detecting and measuring both vertical and horizontal
crustal deformations; however, only horizontal velocity vectors have been reported; e.g.,
Badawy et al. (2003) and El-Fiky et al., (2004). Several attempts have been made to
obtain GPS data for the Nile Delta region from the Egyptian Organizations but,
unfortunately, none of them has been successful.
Potential consequences of land subsidence in the Nile Delta include, but are not
limited to, reduction of the aquifer system storage, sinking of the coastal zone cities, and
damage of the utility infrastructure, wells, railroads, highways, and bridges, as well as
buildings. Therefore, there is an increasing demand for regular monitoring and accurate
measuring of the rates and patterns of land subsidence in the Nile Delta region. This
particularly important to gain a broad understanding of the phenomenon and to provide
38
decision makers with useful information for integrated development and sustainable use
of natural resources in the delta.
Traditional leveling survey and GPS are widely used to measure land subsidence
but these all are point-measurement tools and, thus, provide spatially limited views of
the ongoing surface deformation. In contrast, radar interferometry has the potential to
provide subtle surface deformation measurements at a significantly improved SAR
resolution with millimeter-level accuracy and over large areas (approximately 100 km²
for ERS satellites). Numerous researches have successfully applied radar interferometry
to measure land subsidence; e.g., Fielding et al. (1998), Galloway et al. (1998), Fruneau
et al. (1999), Strozzi and Wegmüler (1999), Strozzi et al. (1999a), and Strozzi et al.
(1999b), Ferretti et al. (2000), Bawden et al. (2001), Hoffmann et al. (2001), and
Buckley et al. (2003).
Spaceborne ERS SAR interferometry is applied in this dissertation to detect and
measure land subsidence in three major cities in the Nile Delta; Cairo, Mansura and
Mahala (Figure 3.2). In an effort to provide a sufficient depth to the subject, the study of
land subsidence is distributed over two chapters. Land subsidence in greater Cairo is
discussed in this chapter and land subsidence in Mansura and Mahala is discussed in the
next chapter, as a single ERS dataset is used for both cities.
Cairo, the capital of Egypt, is an ancient city occupying the area at the apex of
the Nile Delta where the Nile River splits into two branches (Figure 3.2). The region of
Cairo has been continuously inhabited for more than 3,500 years. With its 15 million
inhabitants, Cairo is one of the largest cities in the world. Greater Cairo is characterized
by very dense settlement structure with little vegetation, and the mountains at its eastern

39
Figure 3.2. ERS coverage of greater Cairo (Track: 436, Frame: 2997) is highlighted in red
Western Desert
Mediterranean Sea
Nile Delta
.Cairo
Sinai
Eastern Desert
Gulf of Suez

40
border are very dry. Because of these characteristics, greater Cairo is considered suitable
for applying SAR interferometry and, therefore, has been selected for this study. The
spatial density of the urban area is also sufficient to witness spatial variations in land
subsidence. Figure 3.3 shows a coherence image for greater Cairo and its surroundings.
2. Data Acquisition
Thirty-four ERS-1/2 descending scenes (Track: 436, Frame: 2997) spanning
eight years from 1993 to 2000 (Table 3.1) have been acquired taking into consideration
the temporal and the spatial coverage of ERS archived data for the area of greater Cairo
(Figure 3.2). Several ERS pairs of short perpendicular baseline, less than 200 m, were
selected to limit the potential for geometric decorrelation in conventional InSAR
processing, and several ERS tandem pairs were selected for tandem Digital Elevation
Model (DEM) generation. Additionally, DEMs of 3-arc sec spatial resolution acquired
by the Shuttle Radar Topography Mission (SRTM) have been collected and used as
external DEMs for topographic corrections.
3. Permanent Scatterer Interferometry
Decorrelation of the interferometric phase in the densely vegetated Nile Delta
occurs primarily because of seasonal cultivation, flood irrigation, and vegetation growth.
The vegetation cover in the delta is seasonal crops and, thus, it is dynamically changing.
Land use classes change approximately every four months. This situation hampers the
application of SAR interferometry. But the Nile Delta also has urban areas that can
preserve the phase coherence over relatively long time spans. However, construction

41
Figure 3.3. Coherence image created from InSAR scenes dated 01/20/2000, and 05/17/1993, superimposed on the amplitude image of 01/20/2000
N
10 km
0 1

42
Table 3.1. ERS dataset for greater Cairo # Datea B⊥ (m)b BT (day)c ERS 1 19930412 617.0048 -1004 1 2 19930517 -77.6699 -969 1 3 19930726 249.5015 -899 1 4 19931004 -50.3564 -829 1 5 19950614 -87.0998 -211 1 6 19950823 -22.3913 -141 1 7 19950824 -122.5054 -140 2 8 19950927 150.3387 -106 1 9 19950928 567.0938 -105 2 10 19951206 169.0418 -36 1 11 19960110 125.4489 -1 1 12 19960111 0.0000 0 2 13 19960214 655.5337 34 1 14 19960215 663.9315 35 2 15 19960424 872.8420 104 1 16 19960529 -354.5767 139 1 17 19960530 -463.0765 140 2 18 19970515 35.2625 490 2 19 19980709 -438.0561 910 2 20 19980917 -770.1791 980 2 21 19981231 -783.9076 1085 2 22 19990311 -64.2046 1155 2 23 19990415 749.9412 1190 2 24 19990520 -187.5423 1225 2 25 19991007 -302.3993 1365 2 26 19991216 552.6185 1435 2 27 20000120 -126.4835 1470 2 28 20000223 -897.5716 1504 1 29 20000224 -728.0547 1505 2 30 20000330 -300.7856 1540 2 31 20000504 -224.0248 1575 2 32 20000608 -140.1180 1610 2 33 20001026 -310.1321 1750 2 34 20001130 -234.8034 1785 2
aDate is YYYYMMDD. bB⊥ is the Perpendicular baseline. cBT is the temporal baseline.

43
activities may cause a local loss of the phase coherence.
With an approximate 5 mm yr-1 subsidence in the delta, approximately 1.12
radians of slant range phase change per year are expected in the topographically
corrected interferograms generated from ERS images. Considering the slow rate of land
subsidence in the densely vegetated delta and phase ambiguity problems related to
temporal and geometrical decorrelations, as well as tropospheric effects, obtaining
reliable measurements of subsidence using conventional SAR interferometric
approaches is difficult.
All possible combinations of collected ERS InSAR pairs with baselines of less
than 200 m were processed and topographically corrected interferograms were produced
using two-, three- and four-pass interferometric approaches. All interferograms created
from summer and winter acquisitions were found dramatically affected by atmospheric
artifacts. Additionally, complete phase decorrelation occurred over vegetated areas and
most of the urban areas. Figure 3.4 shows a topographically corrected interferogram
created for greater Cairo and its adjacent mountains using the two-pass interferometric
approach. ERS InSAR pairs dated January 20, 2000, and May 17, 1993, were used to
create the interferogram. Each color fringe represents 28 mm of surface deformation in
the Line-Of-Sight direction. However, most of the color change close to the Nile River is
basically related to the effect of atmospheric artifacts. The topographic phase was
removed using an external SRTM DEM of 3-arc sec spatial resolution.
To overcome cycle ambiguity problems and detect the slow rate of deformation
and its temporal and spatial patterns in greater Cairo, the Permanent Scatterer
interferometric approach is applied in this study using thirty-four descending ERS scenes

44
Figure 3.4. Topographically corrected interferogram created from InSAR scenes dated 01/20/2000, and 05/17/1993, superimposed on the amplitude image of 01/20/2000
-π +π radians
N
10 km

45
spanning eight years from 1993 to 2000 (Table 3.1). Since it has been introduced by
Ferretti et al. (2000), the Permanent Scatterer interferometric approach has been
successfully applied in several crustal deformation studies such as estimation of the
nonlinear subsidence rate (Ferretti et al., 2000), monitoring landslides and tectonic
motions (Colesanti et al., 2003), and detection of mining related ground instabilities
(Colesanti et al., 2005). Since then, several approaches with further improvements and
some deviations in the processing procedure have also been developed; e.g., Dehls et al.
(2002), Adam et al. (2003), Crosetto et al. (2003), and Hooper et al. (2004).
The Permanent Scatterer approach can be accomplished in various ways
depending on the cultural characteristics and problems in each InSAR dataset. The major
processing steps applied in this research included SLC image formation, coregistration
of all selected SAR acquisitions to a unique reference image, Permanent Scatterers (PSs)
selection, generation of the complex interferograms for the selected PSs, topographic
phase removal, phase noise reduction, spatial and temporal phase unwrapping,
estimation and removal of atmospheric artifacts, calculation of the LOS surface
displacements, and geocoding.
3.1. Single look complex image formation and coregistration
The thirty-four selected ERS descending scenes (Table 3.1) were automatically
checked and corrected for missing lines. Then, they were processed to a Doppler
Centroid independent of range sample to generate Single Look Complex (SLC) images.
A small subset of the ERS scenes covering greater Cairo has been used for applying the
PS technique to avoid the densely vegetated areas of very low coherence. Figure 3.5

46
Figure 3.5. Average amplitude image for greater Cairo
N
5 km
Greater Cairo
Nile River
Cairo International Airport
Cultivated land
Giza Pyramids
Mountains
Imbaba
Ataba
RamsisTahrir
Maadi
Al-Monira

47
shows the average amplitude image of the thirty-four ERS sub-scenes for the area of
interest. The average amplitude image shows the mean intensities of the radar
backscatters for the selected ERS images. It reveals features of the surface of Earth of
the area of interest. Built up areas in greater Cairo have a bright radar response, whereas
cultivated areas appear in a light grey color, and major roads as well as the Nile River
appear in a dark grey color. Cairo International Airport appears also in a dark grey color
in the northeastern part of greater Cairo.
As ERS SAR images are taken from slightly different angles at different times,
offsets do occur among them. Consequently, all SLC images have to be resampled to a
reference image. This is done by determining the offsets between corresponding pixels
in the two SLCs (reference and resampled images) and by calculating a rotation and
skew matrix that registers the resampled SLC image to the reference image.
To select a unique reference image, interferometric pairs with limited
atmospheric artifacts have to be determined. The approach of pairwise comparison of
interferograms developed by Massonnet and Feigl (1995) was applied for this purpose.
The approach provides an assessment of initial interferograms without requiring
statistical analysis of higher-level products and does not require ancillary data spatially
and temporally coincident with the SAR acquisitions.
Interferograms with high correlation were generated using several ERS tandem
pairs (Table 3.1). These tandem interferograms were compared using the pairwise
comparison approach to assess the degree to which atmospheric variations are present in
each selected ERS pair. The comparison revealed that interferograms generated from the
summer acquisitions during August and September were affected highly by large

48
amplitude, high frequency atmospheric artifacts as a result of significant summer
heating. Interferograms generated from the winter acquisitions were less affected by
atmospheric artifacts.
Based on these comparisons, the ERS-2 scene acquired on January 11, 1996, has
been selected as the reference, as it has low atmospheric distortions, and it minimizes
both perpendicular and temporal baselines. It has also a Doppler Centroid near the
average Doppler Centroid of other SAR acquisitions.
The coregistration accuracy assessment revealed that all ERS SLCs were
precisely coregistered to the selected reference, as the standard deviations of the
individual range and azimuth offset estimates from the regression fit were less than 0.15
pixel. The ERS scenes were oversampled by a factor of two to avoid aliasing in the
coregistration process using amplitude values.
The initial spatial resolution of the ERS images is approximately 4x20 m in
azimuth and range directions, respectively. They were multi-looked, ten looks in the
azimuth direction and two looks in the range direction, to produce interferograms with
40 m resolution in both azimuth and range directions. The multi looking is an averaging
process that reduces the phase noise.
3.2. Selection of permanent scatterers
The selection of Permanent Scatterers (PSs) is one of two major important
processes in any Permanent Scatterer approach, as all the processing is conducted on the
only selected PSs. The other critical process is to correctly unwrap the interferometric
interferograms and correct them for potential errors. Ferretti et al. (2001) used the

49
amplitude dispersion index (DA), which is the ratio of the standard deviation of the
amplitude (σA) to its mean (µA), to identify PSs.
A
AAD µ
σ= (3.1)
According to Ferretti et al. (2001), all images in the dataset have to be
radiometrically calibrated to make them comparable before conducting the statistical
analysis on the amplitude values. They scaled the amplitude images using calibration
factors provided by the European Space Agency (ESA). Then they averaged the
amplitude images and calculated the mean of the stack and the standard deviation from
the mean. Points of low amplitude dispersion, DA<0.25, were selected as Permanent
Scatterers. The amplitude dispersion index is used as a measure of phase stability and is
practically proved to be powerful in detecting PSs over bare rocks and man-made
structures such as buildings. The lower the amplitude dispersion index, the higher the
phase stability.
The amplitude dispersion index is applied in this present study to identify
Permanent Scatterers over greater Cairo; however, calculated calibration factors from the
processed ERS dataset were used rather than using calibration factors from ESA. The
average calibration factor for each image in the stack is calculated using the ratio of the
amplitude of each image to the mean amplitude of the entire stack. An average density
of 157 PS Km-2 has been identified, which is sufficient for aliasing any spatial variations
of land subsidence in greater Cairo.

50
3.3. Generation of the complex interferograms
Single Look Complex (SLC) values were extracted for only selected PSs, and the
interferometric complex interferograms were calculated from these values by
multiplying the reference image with the complex conjugate of the resampled image
according to equation (2.7), yielding the phase difference between the two SAR
acquisitions for each selected PS. The complex interferometric phase )(φ at pixel (p) in
interferogram (i) is nominally a summation of five phase components, which are:
ipnoiseipatmiporbiptopoipdefip ,,,,,,,,,,, φφφφφφ ++++= (3.2)
where defφ is the deformation phase, topoφ is the topographic phase, orbφ is the orbital
phase, atmφ is the atmospheric phase, and noiseφ is the phase noise.
3.4. Topographic phase removal and phase unwrapping
The basic strategy in Permanent Scatterer processing is to separate these phase
components from the phase resulting from the surface deformation for each selected PS.
The topographic phases were removed using SRTM DEMs, and the produced
interferograms were then filtered using the nonlinear adaptive filter developed by
Goldstein and Werner (1998) to reduce the amount of phase noise, which is always
present in SAR images. The DEOS precise ERS-1/2 state vectors (Scharroo and Visser,
1998) were used in this dissertation to compensate for orbital inaccuracies. For more
information about DEOS orbital accuracies, the reader is directed to section (6.1) in

51
Chapter II.
The calculated interferograms are still wrapped at this level. Both spatial and
temporal phase unwrapping were conducted on the topographically corrected
interferograms for the selected PSs. The filtered interferograms were first spatially
unwrapped with the minimum coast network flow (MCF) algorithm developed by
Costantini (1998). The spatially unwrapped values of PSs were then integrated in time to
produce the unwrapped phase time series for each selected PS.
Careful inspection of interferograms is a first-order approximation of phase
errors. Temporal and spatial consistencies of features in the topographically corrected
interferograms are good indicators for discriminating deformation features. Persistent
phase signals are most likely related to real surface deformation as deformation patterns
usually occur at the same location in several interferograms over considerable time
spans. In contrast, atmospheric artifacts because of their dynamic nature are expected not
to occur exactly at the same location in a time series of interferograms.
Taking into consideration the information mentioned above, all patterns that were
observable in several interferograms at the same locations were considered true
deformation, and sparse features lacking temporal and spatial consistency were assumed
atmospheric artifacts rather than real surface deformation and, thus, filtered out.
Furthermore, phase signals in the topographically corrected interferograms of very short
time spans (e.g., 1, 34, 35, and 36 days in Table 3.1) were assumed topographic residuals
and/or tropospheric effects and, thus, were eliminated, as no surface deformation is
expected to occur in greater Cairo within these few days.

52
Topographic-induced artifacts and effects of soil moisture content may be
misinterpreted in SAR interferometry. Phase signals may be affected by tropospheric
variations as a function of altitude. Tropospheric variations may cause errors similar to
topographic residuals (Delacourt et al., 1998). However, topographic-induced effects are
not expected in greater Cairo because the area is relatively flat. Soil moisture content is a
major concern in the densely vegetated, humid Nile Delta especially in the cultivated
areas because of crop watering. But the Permanent Scatterer processing is conducted
basically for the urbanized areas in greater Cairo; therefore, the effect of soil moisture
content is not believed to be a considerable source of error.
Estimations of the phase components were undertaken iteratively to remove
perfectly the residual topographic phase, the atmospheric phase, the phase noise, and the
phase related to inaccuracies in calculations of the satellite orbits from the
interferometric phase, leaving only the phase change related to the surface movements.
Ultimately, the Line-Of-Sight (LOS) surface displacements were calculated from the
corrected, unwrapped interferograms and the outputs were geocoded.
4. Results and Discussion
Surface movements in the Line-Of-Sight direction were calculated by converting
the measured phase into displacement values. Thirty-four surface displacement maps
referenced to the ERS acquisition dated January 11, 1996, were generated. In this
research, all deformation associated with land subsidence is assumed to be vertical.
Figure 3.6 shows the average surface displacement calculated from the 34 displacement
maps over eight years (1993-2000) in the LOS direction. The mean displacement in LOS

53
Figure 3.6. Mean LOS surface displacement in the 1993-2000 period, superimposed on the average amplitude image of greater Cairo
. A . B
. C
N
5 km
+7 mm yr-1
-7
0

54
has a minimum negative (subsidence) value -7 mm yr-1, and a maximum positive (uplift)
value +7 mm yr-1.
Deformation phase histories of three selected pints A, B and C are shown in
Figures 3.7, 3.8 and 3.9, respectively to demonstrate the various behavior of PSs during
the 1993-2000 period. Locations of the selected points are shown in Figure 3.6. The
deformation phase history of point A (Figure 3.7) demonstrates about 37 mm of surface
displacement in the Line-Of-Sight (LOS) between 1993 and 2000. All deformation
occurred away from the satellite (subsidence) with an approximate constant rate over
time. The deformation phase history of point B (Figure 3.8) shows the non-linear
behavior of deformation during the 1993-2000 period. About 10 mm of surface
displacement away from the satellite in LOS occurred; however, local displacement
towards the satellite (uplift) occurred during 1995-1997 (Figure 3.8). The deformation
phase history of point C demonstrates about 13 mm of non-linear surface displacement
towards the sensor in LOS between 1993 and 2000. It is obvious that the deformation
rate was not constant over time (Figure 3.9).
To demonstrate the progression of land subsidence in greater Cairo over time, a
time series of LOS surface displacement maps interpolated spatially from the selected
PSs and referenced temporally to the earliest ERS acquisition dated April 12, 1993, was
created. Eight snapshots with approximately 1-year sampling time interval were then
taken referenced temporally to July 1, 1993. No ERS SAR acquisitions are available for
the area of interest during 1994. Therefore, no record is generated for that year.

55
Figure 3.7. Deformation phase history of point A in greater Cairo during the 1993-2000 period

56
Figure 3.8. Deformation phase history of point B in greater Cairo during the 1993-2000 period

57
Figure 3.9. Deformation phase history of point C in greater Cairo during the 1993-2000 period

58
The signals of subsidence shown in Figures 3.10-3.16 coincide mainly with the
highly urbanized areas. Despite the fact that historical records and locations of
groundwater pumping are not available for this research, the coincidence of the signals
with the highly populated districts implies that the detected signals are mainly of a
pumping-induced subsidence. The highest subsidence rates are observable over the
congested, highly populated districts in greater Cairo such as Imbaba, Al-Monira,
Ramsis, Ataba, Tahrir, and Maadi (Figure 3.5). The slight positive values are of limited
spatial extent and are most likely related to groundwater level recovery and local
rebound of the aquifer system rather than gradual uplift that may be caused by a slow
tectonic movement.
The pumping-induced subsidence rates may be recoverable or permanent based
upon whether the effective stresses are less or greater than the pre-consolidation stresses
(Sneed et al., 2001). From my past experience of living in this area, I can say there is no
doubt that the rate of groundwater pumping in greater Cairo changes seasonally. For
greater Cairo, pumping is higher in the summer time than other seasons in the year
period. The non-linear deformation histories demonstrated in Figures 3.7, 3.8, and 3.9
imply that the pumping-induced subsidence in greater Cairo might be at least partially
recoverable. But the petrophysical and hydrological characteristics of the aquifer system
still have to be addressed. More research has to be undertaken to study the nature and
magnitude of seasonal subsidence in greater Cairo, as this is not addressed in any
previous work. This point is discussed in more depth in Chapter VI.

59
Figure 3.10. Estimated LOS surface displacement for July 1, 1993, superimposed on the average amplitude image of greater Cairo
N
5 km
+60 mm
-60
0

60
Figure 3.11. Estimated LOS surface displacement for July 1, 1995, superimposed on the average amplitude image of greater Cairo
N
5 km
+60 mm
-60
0

61
Figure 3.12. Estimated LOS surface displacement for July 1, 1996, superimposed on the average amplitude image of greater Cairo
N
5 km
+60 mm
-60
0

62
Figure 3.13. Estimated LOS surface displacement for July 1, 1997, superimposed on the average amplitude image of greater Cairo
N
5 km
+60 mm
-60
0

63
Figure 3.14. Estimated LOS surface displacement for July 1, 1998, superimposed on the average amplitude image of greater Cairo
N
5 km
+60 mm
-60
0

64
Figure 3.15. Estimated LOS surface displacement for July 1999, superimposed on the average amplitude image of greater Cairo
N
5 km
+60 mm
-60
0

65
Figure 3.16. Estimated LOS surface displacement for July 1, 2000, superimposed on the average amplitude image of greater Cairo
N
5 km
+60 mm
-60
0

66
The tectonic setting of greater Cairo is also believed to make a considerable
contribution to the measured subsidence rate. Differential subsidence is observable along
the major subsurface fault, no. 1, trending NE-SW (Figure 3.17). The average rate of
differential subsidence along the fault is 4 mm yr-1. Differential subsidence also occurred
along several surface faults, including faults no. 2, 3, 4, 5, and 6, with average rates of 3,
4, 3, 3, and 5 mm yr-1, respectively. Subsidence occurred on both sides of the historic
surface faults no. 7 and 8, and the subsurface fault no 9.
Several studies, such as Badawy and Monus (1995), Badawy and Abdel-Fattah
(2002), and Korrat et al. (2005), showed that north Egypt especially the area to the south
of Cairo is tectonically active (Figure 3.18). During the last 15 years, several
earthquakes have been recorded in northern Egypt, e.g., October 12, 1992; July 30,
1993; August 3, 1993; November 22, 1995; October 11, 1999; December 28, 1999; June
12, 2001 (Badawy and Abdel-Fattah 2001). Seismic activities in and around Cairo along
with the ongoing land subsidence may cause a disaster in the future by activating
inactive faults.
There is one more potential contributing factor to the rate of land subsidence in
greater Cairo that has never been reported. This potential factor is the subway network
that commenced in Cairo in 1982. The location, extent and magnitude of land subsidence
in greater Cairo match very well with the subway lines and stations (Figure 3.19). The
subway in greater Cairo consists of three major lines and approximately 86 stations. It
passes through the most important residential and business districts in Cairo. Lines no. 1
and no. 2 have been used for several years, but line no. 3 is still under construction.
About six million passengers per day are using the subway network (Egyptian Tunneling

67
Figure 3.17. Mean velocity in LOS superimposed on the average amplitude image of greater Cairo with major faults. Dotted white lines are subsurface faults; solid white lines are surface faults from El Araby and Sultan (2000)
1
2
3
4
5
6
7
8
9
+7 mm yr-1
-7
0
N
5 km

68
Figure 3.18. Seismicity of Egypt for the period 1900–2001 (Korrat et al., 2005)

69
Figure 3.19. Mean velocity in LOS superimposed on the average amplitude image of greater Cairo with subway stations
1
2
3
+7 mm yr-1
-7
0
N
5 km

70
Society, 2005).
Excavation and construction of tunnels, as well as the load of trains and millions
of passengers every day might be potential causes of slight subsidence on the long run,
particularly because the stratigraphic sequence in greater Cairo consists mainly of
unconsolidated clays, silts and sands. It is remarkable that areas hosting extensive
subway stations such as Ramsis, Ataba, and Tahrir are experiencing the highest rate of
land subsidence. These areas also have the highest population densities in Cairo. It is
also noticeable that a long section of the subway network line no. 1 passes in the
subsiding side parallel to the major subsurface fault no. 1, trending NE-SW. The subway
line no. 1 started in 1989 and since then it is always overloaded. This might be one of the
potential causes of subsidence in this side.
It is not the objective of this research to find a remediation to the land subsidence
problem in greater Cairo. However, it is recommended that the contribution of the
anthropogenic factors, including the subway network and groundwater pumping be
comprehensively re-assessed and differentiated from the contribution of the natural
factors. In contrast with the natural factors, such as the tectonic setting and natural
sediment compaction that are not controllable, anthropogenic factors can be stopped or
at least mitigated. For example, subway stations in areas that experienced a high rate of
land subsidence can be closed. The effect of groundwater pumping can also be mitigated
by closing pumping stations in sensitive areas or it can be compensated by injecting
water into the aquifer system. The city planers and decision makers may also consider
moving ministries and public-related organizations out of Cairo, as it was proposed
several years ago to relieve the pressure on the very congested ancient city.

71
CHAPTER IV
LAND SUBSIDENCE IN MANSURA AND MAHALA
1. Introduction
Urban subsidence can be expected in all cities in the Nile Delta because
groundwater is main source of utility water and because the stratigraphic sequence is
relatively the same in the entire delta, which consists basically of clays, silts and sands.
Possible causes of land subsidence in Mansura and Mahala are believed to be limited to
natural sediment compaction and groundwater pumping. The tectonic setting has no role
to play, and there is no subway network in the two cities.
Studying land subsidence in the Nile Delta is very challenging because of the
significant content of water vapor, soil moisture content, and dense vegetation cover.
Even the urban areas in the Nile Delta are of limited spatial extent (Figure 1.1). Acting
together the characteristics of the Nile Delta mentioned above with the very slow rate of
surface deformation impede the application of conventional SAR interferometric
approaches to obtain reliable subsidence measurements.
To overcome phase decorrelation problems with conventional SAR
interferometry, the Permanent Sactterers interferometric approach is employed to detect
subsidence patterns and measure its magnitude in the two largest cities in the central part
of the Nile Delta; namely Mansura, which is home to approximately 450,000 people and
Mahala, which is home to approximately 525,000 people. The two cities were selected
away from the Mediterranean coast to reduce the amount of water vapor in the air and,

72
thus, minimize the atmospheric artifacts in SAR acquisitions. Land subsidence
measurements in Mansura and Mahala, as well as in other cities in the delta can provide
a broad understanding of the subsidence phenomenon and an estimation of the
associated hazards with subsidence in the delta.
2. Data Acquisition
The short wavelength of the C-band (5.66 cm) and the temporal coverage of the
ERS SAR interferometric data are well suited for studying the slow rate of surface
deformation in the Nile Delta. Thirty-nine ERS descending scenes (Track: 436, Frame:
2979, Figure 4.1) were acquired over an eight year period from 1993 to 2000 (Table
4.1). Five ERS tandem pairs were collected for topographic and tropospheric
estimations. SAR interferometric DEMs of 3-arc sec created from data acquired by the
Shuttle Radar Topographic Mission (SRTM) were also obtained for topographic phase
removal. Although SRTM DEMs are of coarse spatial resolution, this is not a real
constraint as the study area has hyper flat terrain.
3. Permanent Scatterer Interferometry
Processing ERS InSAR data for Mansura and Mahala followed the same
procedure applied in processing the ERS dataset for greater Cairo in Chapter III. Single
Look Complex (SLC) images were generated and coregistered to the ERS-2 scene
acquired on January 11, 1996.

73
Figure 4.1. ERS coverage of Mansura and Mahala (Track: 436, Frame: 2979) is highlighted in red
Western Desert
Mediterranean Sea
Nile Delta
.Cairo
Sinai
Eastern Desert
. Mansura . Mahala
Gulf of Suez

74
Table 4.1. ERS dataset for Mansura and Mahala # Datea B⊥ (m)b BT (day)c ERS 1 19930201 -698.4072 -1074 1 2 19930412 613.3302 -1004 1 3 19930517 -94.7692 -969 1 4 19930726 231.6942 -899 1 5 19930830 -400.5836 -864 1 6 19931004 -51.6256 -829 1 7 19931108 165.0499 -794 1 8 19950720 42.9351 -175 2 9 19950823 -27.9726 -141 1 10 19950824 -126.1882 -140 2 11 19950927 139.3528 -106 1 12 19950928 549.8912 -105 2 13 19960111 0.0000 0 2 14 19960214 638.1264 34 1 15 19960215 648.0047 35 2 16 19960529 -357.2229 139 1 17 19960530 -463.6777 140 2 18 19970515 24.4539 490 2 19 19980917 -764.5666 980 2 20 19981231 -782.0326 1085 2 21 19990311 -77.6046 1155 2 22 19990415 726.9202 1190 2 23 19990520 -188.5021 1225 2 24 19991007 -309.1264 1365 2 25 19991111 318.2996 1400 2 26 19991216 531.7678 1435 2 27 20000120 -131.4232 1470 2 28 20000223 -891.4721 1504 2 29 20000224 -725.9152 1505 2 30 20000330 -297.6116 1540 1 31 20000504 -217.8680 1575 2 32 20000608 -158.1932 1610 2 33 20000713 -985.9117 1645 2 34 20000817 -35.7963 1680 2 35 20000921 690.2563 1715 2 36 20001026 -305.6683 1750 2 37 20001130 -223.2472 1785 2 aDate is YYYYMMDD. bB⊥ is the Perpendicular baseline. cBT is the temporal baseline.

75
Figure 4.2. Average amplitude image of Mansura and Mahala
Mansura
Mahala
Nile River
N
5 km
Mansura Airport

76
The average amplitude image of the processed 37 ERS subscenes for the two
cities is shown in Figure 4.2. Mansura and Mahala metropolitan areas appear as bright
radar responses in Figure 4.2. The Mansura Airport and the Nile River are also visible in
the image. The fine dark lines correspond to irrigation channels and major roads. Some
crop fields appear in light grey color. The general lack of contrast over much of the land
area is related to various kinds of cultivated crops, which change seasonally.
Permanent Scatterers were selected and processed independently for each city.
An average of 64 PS km-2 and 51 PS km-2 has been identified for Mansura and Mahala,
respectively using the amplitude dispersion index, as explained in Chapter III. The
preliminary inspection of interferograms revealed that winter acquisitions were generally
less affected by atmospheric artifacts than summer acquisitions. The ERS acquisitions
dated July 9, 1998, and August 13, 1998, were found plagued by atmospheric artifacts
and, thus, were excluded from further processing.
The interferograms created for Mansura and Mahala were generally very noisy
compared to those created for greater Cairo. The PS density in the two cities is less by a
factor of three over greater Cairo as well. One explanation might be that Mansura and
Mahala are surrounded by cultivated land from all directions and their spatial extents are
significantly limited compared to Cairo. The location of Mansura and Mahala in the
center of the densely vegetated delta, in addition to their limited spatial extents make the
local troposphere over the two cities be significantly saturated by the water vapor.
Local interferometric decorrelations are also expected because of construction
activities in Mansura and Mahala. The two cities are known of their fast rate of urban

77
sprawl during the last decade. The vertical extent of urban development is generally
faster than the spatial extent because of the rigid constraints established by the Egyptian
Government to preserve the fertilized cultivated land in the Nile Delta. Increasing the
heights of buildings leads to local phase decorrelation.
The ERS interferograms created independently for the two cities were
unwrapped and corrected as explained in Chapter III. Topographic phase residuals,
atmospheric artifacts, and phase error caused by orbital inaccuracies, as well as phase
noise were assessed and carefully removed. The iteration concept was applied to refine
the estimated interferometric phase components. The Line-Of-Sight (LOS) surface
displacement maps were created from the corrected interferograms and ultimately the
final outputs were geocoded.
4. Results and Discussion
All deformation associated with land subsidence in Mansura and Mahala is
assumed to be vertical. Thirty-seven LOS displacement maps were generated to
demonstrate the deformation phase history for the two cities. The average measured
velocity away from (subsidence) the satellite in LOS is -9 mm yr-1 in Mansura and -5
mm yr-1 in Mahala.
The calculated mean velocity in LOS superimposed on the average amplitude
image of Mansura is shown in Figure 4.3. Three PSs were selected to demonstrate
deformation behavior in sensitive areas in Mansura. Locations of the selected PSs are
shown in Figure 4.3, and their deformation phase histories are shown in Figures 4.4-4.6.

78
Figure 4.3. Mean LOS velocity in the 1993-2000 period, superimposed on the average amplitude image of Mansura
. A
. B
. C
+9 mm yr-1
-9
0
N
2.5 km

79
Figure 4.4. Deformation phase history of point A in Mansura during the 1993-2000 period
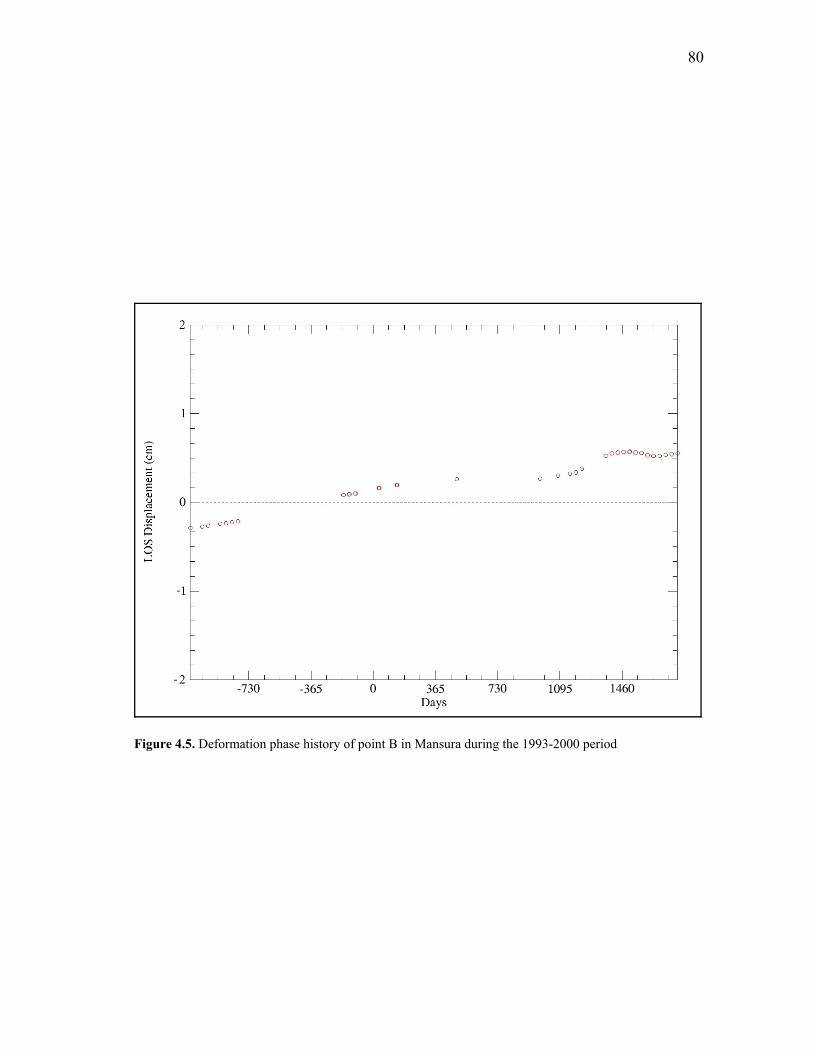
80
Figure 4.5. Deformation phase history of point B in Mansura during the 1993-2000 period
81
Figure 4.6. Deformation phase history of point C in Mansura during the 1993-2000 period

82
The deformation phase history of point A (Figure 4.4) demonstrates about 14 mm
of non-linear surface displacement away from the satellite in the Line-Of-Sight (LOS)
between 1993 and 2000. The rate of deformation during the 1998-2000 period was
slower than the rate of deformation between 1993 and 1997. The deformation phase
history of point B (Figure 4.5) shows the non-linear behavior of deformation during the
1993-2000 period. About 9 mm of surface displacement towards the satellite in LOS
occurred. The deformation phase history of point C demonstrates about 5 mm of non-
linear surface displacement towards the sensor in LOS between 1993 and 1999 and
about 4 mm away from the satellite during 1999 and the first 6 months of 2000. During
the last 6 months of 2000 the point was almost stable (Figure 4.6).
The calculated mean LOS velocity superimposed on the average amplitude
image of Mahala is shown in Figure 4.7. Three points A, B and C were selected to
demonstrate deformation behavior in sensitive areas in Mahala. Locations of the selected
PSs are shown in Figure 4.7, and their deformation phase histories are shown in Figures
4.8-4.10.
The deformation phase history of point A (Figure 4.8) demonstrates about 23 mm
of surface displacement in the Line-Of-Sight (LOS) between 1993 and 2000. Linear
deformation occurred away from the satellite (subsidence) with an approximate constant
rate over time from 1993 to 1999. Non-linear deformation was observable with a slower
rate through 1999-2000. The deformation phase history of point B (Figure 4.9) shows
the non-linear behavior of deformation during the 1993-2000 period. About 4 mm of
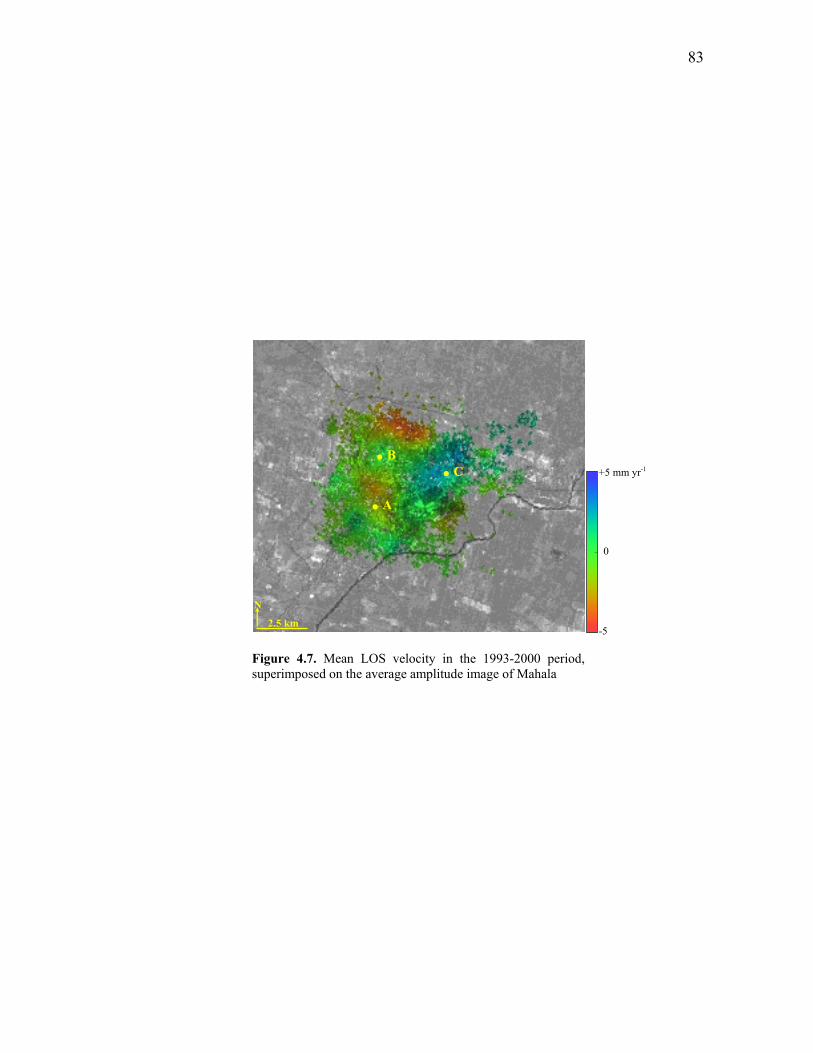
83
Figure 4.7. Mean LOS velocity in the 1993-2000 period, superimposed on the average amplitude image of Mahala
. A
. B . C +5 mm yr-1
-5
0
N
2.5 km

84
Figure 4.8. Deformation phase history of point A in Mahala during the 1993-2000 period

85
Figure 4.9. Deformation phase history of point B in Mahala during the 1993-2000 period

86
Figure 4.10. Deformation phase history of point C in Mahala during the 1993-2000 period

87
surface displacement towards and away from the satellite in LOS occurred. The
deformation phase history of point C demonstrates about 9 mm of non-linear surface
displacement towards the sensor in LOS between 1993 and 2000. It is obvious that the
deformation rate in 2000 was slower than the deformation rate before 2000 (Figure
4.10).
A time series of 37 LOS displacement maps interpolated spatially from the
selected PSs and referenced temporally to the earliest ERS acquisition on April 12, 1993,
was created. Eight snapshots referenced to July 1, 1993, with approximately a 1-year
sampling time interval were than taken to show progression of land subsidence in space
and time for Mansura and Mahala (Figures 4.11 and 4.12, respectively). As no ERS
acquisitions are available for 1994, no deformation record was created for that year.
The signal of land subsidence coincides with the highly populated districts in
both Mansura and Mahala but with varying rates. The highest rate of land subsidence is
observable in the southern part only of Mansura, whereas it is noticeable in the center
and the northern part of Mahala. The time-series for Mahala shows that the subsidence
bowl in the center of the city is decreasing over time. The positive values in the surface
displacement maps created for the two cities suggest a local system rebound as a result
of groundwater level recovery. Unfortunately, historical records of groundwater
pumping and census data are not available for this research. Therefore, the suggestion
can not be verified. Furthermore, no in situ measurement of land subsidence has been
conducted in either Mansura or Mahala.

88
Figure 4.11. Estimated LOS surface displacement (1993-2000), superimposed on the average amplitude image of Mansura
+70 mm
-70
0
July 1, 1993 July 1, 1995
July 1, 1996 July 1, 1997
July 1, 1998 July 1, 1999
July 1, 2000
N
5 km

89
Figure 4.12. Estimated LOS surface displacement (1993-2000), superimposed on the average amplitude image of Mahala
+40 mm
-40
0
July 1, 1993 July 1, 1995
July 1, 1996 July 1, 1997
July 1, 1998 July 1, 1999
July 1, 2000
N
5 km

90
As the spatial extents of both Mansura and Mahala are limited, the long-term
subsidence resulting from natural sediment compaction can be assumed mainly affected
by the seasonal variations in the rate of groundwater pumping in the two cities. Problems
associated with pumping-induced subsidence can be handled by controlling the rate of
groundwater pumping, by injecting water into the aquifer system, or even by eliminating
pumping stations in the sensitive areas of high rates of land subsidence.

91
CHAPTER V
COASTAL CHANGE AT DAMIETTA PROMONTORY
1. Introduction
Coastal erosion is a major geomorphic problem along the coastal zone of the Nile
Delta. Significant erosion has been observed along various segments of the coastline of
the Nile Delta since the beginning of the 20th century. Promontories formed at the two
Nile branch mouths (Figure. 5.1) have experienced the greatest amount of coastline
retreat. Since the 1960s, shoreline retreat in some years has exceeded 100 m yr-1 at
Rosetta Promontory and 50 m yr-1 at Damietta Promontory (Inman and Jenkins, 1980;
Smith and Abdel-Kader, 1988; Frihy, 1992).
The accelerated erosion in the delta coast is attributed to the construction of two
large dams at Aswan (the Low Dam in 1902 and the High Dam in 1964), and the
subsequent entrapment of sediments in Lake Nasser behind the High Dam, as well as the
effects of river control structures on the Nile River. Natural factors, including the delta
subsidence, the sea level rise, and the pronounced coastal processes are also important
contributors to the coastal retreat (UNDP/UNESCO, 1978; Sestini, 1992; Stanley, 1996).
Beaches are an important coastal environment along the Nile Delta, as most
human settlements and economic activities are located on low-lying land directly behind
beaches. Erosion can seriously damage and threaten communities, settlements, coastal
roads, recreational resorts, valuable agricultural land, and development of the coast,

92
Figure 5.1. Damietta Promontory along the coast of the Nile Delta as seen by MODIS acquired on February 05, 2003
Mediterranean Sea
Damietta Promontory Rosetta Promontory
Alexandria
Cairo
Mansura Mahala
Eastern Desert Western Desert
Sinai
Port Said
Gulf of
Suez
N
50 Km

93
which poses a considerable hazard and an urgent management issue in the delta (Frihy,
1996; Stanley, 1996). Additionally, coastal erosion in the delta increases salination of
groundwater and incursion of salt water (El kashef, 1983).
Coastal erosion is predicted to continue into the 21st century, with serious
consequences for coastal developments (Stanley and Warne, 1993). Therefore, there is
an increasing demand for regular monitoring, accurate measuring of coastal change for
coastal zone management and integrated sustainable developmental of the Nile Delta.
Traditional survey tools and various remote sensing techniques have been widely
used to monitor coastal changes. However, terrestrial survey tools are point
measurements and, thus, provide a spatially limited view of the ongoing coastal changes.
Remote sensing techniques provide more cost-effective and higher spatial coverage for
coastal monitoring.
Numerous studies have been conducted to measure coastal change across the
Nile Delta using optical remote sensing data; e.g., Klemas and Abdel-Kader (1982),
Frihy et al. (1990), El Raey et al. (1995), and Ahmed et al. (2000a,b). Most of these
studies have been accomplished using Landsat Thematic Mapper images. However, the
low spatial resolution of the Landsat TM images (28.5 m) restricts their use in coastal
erosion studies to situations where changes are greater than the pixel size. Using optical
remote sensing data for coastal monitoring is also limited by the data availability and
clear weather conditions.
Spatial and temporal resolutions should be carefully considered when exploiting
remote sensing data for monitoring coastal change along the Nile Delta because of the

94
dynamic nature of its coastline. Radar interferometric data that can be acquired in all-
weather conditions, both day and night, can provide subtle measurements of coastal
change at a significantly improved spatial resolution and over large areas (100 km2). In
the study, ERS SAR interferometric data of approximately 20 m resolution are used to
address coastal change at Damietta Promontory in the Eastern side of the Nile Delta
(Figure 5.1). Using data collected by the ERS satellites, monitoring can be accomplished
as frequently as every 35 days, the orbital period of the satellites.
2. Methodology
ERS SAR data acquired on February 1, 1993, May 29 and 30, 1996, and
February 23 and 24, 2000, have been used in this study to identify coastline positions at
Damietta Promontory during the 1993-2000 period. The selected ERS raw data (Track:
436, Frame: 2979, Figure 4.1) were checked and corrected for missing lines. They were
then processed to a Doppler Centroid independent of range to generate Single Look
Complex (SLC) images. The four ERS images acquired in 1996 and 2000 were precisely
coregistered with a sub-pixel accuracy (~0.10 pixel) to produce two tandem coherence
images (Figure 5.2). The produced images were multi looked to reduce speckle density.
One look was taken in the range direction and five looks were taken in the azimuth
direction to produce images of 20 m resolution in both directions. All products were then
geocoded.

95
Figure 5.2. ERS tandem coherence and classified amplitude images, showing the water/land boundary at Damietta Promontory. (A) is the tandem coherence of February 23 and 24, 2000, (B) is the tandem coherence of May 29 and 30, 1996, and (C) is the classified amplitude image of February 1, 1993
A
B
C
N
2.5 km
N
2.5 km
N
2.5 km

96
The complex coherence is the degree of correlation between the two complex
interferometric signals. Coherence values vary from zero to one as a quality measure of
the stability of the scatterers between the two ERS SAR acquisitions. The complex
coherence can be expressed as:
2
1
)(2
2
1
)(1
)(*2
1
)(1
∑∑
∑
==
==N
i
iN
i
i
iN
i
i
CC
CCγ (5.1)
where γ is the complex coherence, C1 and C2 are the phases of the two complex
images, and *21CC is the complex interferogram.
Askne and Hagberg (1993) demonstrated the use of the InSAR phase coherence
as both a classification tool and a change detection tool. Coherence magnitudes can be
used to distinguish between land use/cover types. As the water surface is highly dynamic
as opposed to the land surface, the coherence images (Figure 5.2) were used to
accurately detect the water/land boundary at Damietta Promontory.
Several remote sensing techniques can be used to detect coastline positions,
including digitization, supervised classification, and image segmentation (Wilson, 1997;
White and El-Asmar, 1999). Two different approaches can be used for image
segmentation: edge detection and growing homogenous regions. In edge detection,
spatial convolution filters are passed over the image to find and link high frequency
edges around regions. In the second approach, pixels are merged based on a specific

97
similarity criterion (Lemoigne and Tilton, 1995). In addition, wave spectra information
can be used to model coastline changes by investigating the wave refraction patterns.
TOPSAR wave spectra model was applied to detect coastline changes along the
Terengganu coast, Malaysia (Marghany, 2001).
Supervised classification and edge detection techniques were applied in this
research to detect coastline positions from the ERS interferometric data. Because of the
lack of ERS tandem data before 1995, the amplitude image generated from the ERS
scene acquired on February 1, 1993, was used to determine the coastline position in
1993. The amplitude image was filtered for speckle reduction and linearly stretched for
visualization enhancement to overcome the poor contrast between water and land in
SAR amplitude images. The filtering and linear stretching enhanced the contrast
between water and land and, thus, enabled accurate detection of the coastline position by
classifying the image into two major classes; water and land (Figure 5.2).
The edge detection technique has been accomplished by passing spatial
convolution filters through the coherence images to accurately detect coastline positions
in 1996 and 2000. The detected coastlines in 1993, 1996 and 2000 were then processed
and analyzed via a Geographical Information System (GIS) to determine the pattern and
magnitude of erosion and accretion at Damietta Promontory.
3. Results and Discussion
Areas of erosion and accretion were detected and identified at Damietta
Promontory using ERS SAR interferometric data during the 1993-2000 period (Figures

98
5.3 and 5.4). Three locations (A, B and C) of erosion and accretion were identified and
detected (Figures 5.3 and 5.4; Table 5.1). The average rate of measured erosion at
location (A) is -5.98 m yr-1 and at location (B) is -13.17 m yr-1. The average measured
rate of accretion at location (C) is +5.44 m yr-1. Based on results from this SAR
interferometric study, the measured rate of erosion averaged for locations (A) and (B)
together is -9.57 m yr-1. The average is very close to the rate obtained from a field survey
study by Frihy and Komar (1993), -10.40 m yr-1, which adds confidence to the results.
Recognition of patterns and long-term trends of changes in the coastline along
the Nile Delta is crucial for coastal zone management. Therefore, changes between
different dates of acquisition were calculated separately (Table 5.1). This enabled the
identification of areas of accelerating coastal change in the 1993-2000 period and, thus,
the determination of which areas are likely to be most problematic in the future. Based
on the average of measurements of coastal retreat at Damietta Promontory, location (B)
(Figures 5.3 and 5.4) is experiencing an accelerating rate of erosion.
The Mediterranean Sea at the coast of the Nile Delta is almost microtidal (25-30
cm), and the coastline of the delta is affected mainly by waves and littoral currents. The
prevailing wave and wind direction is southeast, which drives littoral currents to the east
(UNDP/UNESCO, 1978; Manohar, 1981; Frihy, 1996). This clearly explains why areas
of accretion are mostly located east of areas of erosion and points of sediment discharge
(Smith and Abdel-Kader, 1988; Frihy and khafagy, 1991).

99
Table 5.1. Measured values of erosion and accretion Erosion (m) Accretion (m)
Location A Location B Location C 1993-1996 -21.56 -43.15 +20.91 1996-2000 -26.24 -62.17 +22.60 1993-2000 -47.80 -105.32 +43.51
Figure 5.3. Coastline positions at Damietta Promontory detected by ERS SAR data acquired in the 1993-2000 period
-21.56
-43.15
20.91
-26.24
-62.17
22.6
-47.8
-105.32
43.51
-120
-100
-80
-60
-40
-20
0
20
40
60
Figure 5.4. Measured erosion and accretion at locations A, B and C
Coa
stal
Cha
nge
(m) 1993-1996 1996-2000 1993-2000 1993-1996 1996-2000 1993-2000
1993-1996 1996-2000 1993-2000
A B
C
31º29'56"N
31º31'6"N
31º57'0"E 31º54'0"E 1.5 km
N
A B
C
1996 2000
1993

100
In remote sensing studies for coastline detection, diurnal and long-term changes
in sea level should be considered as a potential source of error, especially where the
intertidal zone has a very shallow gradient (Mason et al., 1995). At the coast of the delta,
effects of tides and changes in sea level are minimal. Therefore, they were not
considered a significant source of error in locating the coastline at Damietta Promontory.
Potential sources of errors in coastline detection using remote sensing techniques
include errors in the process of coregistration of the remotely sensed images, errors
related to the applied technique for detecting coastline positions, and errors in
measurements of the rate of coastal change, as well as errors related to effects of tides
and changes in sea level. The spatial and temporal resolutions of the remotely sensed
data should be appropriate to the measured rate of coastal change.
As most dramatic coastal changes occur in bad weather conditions, Synthetic
Aperture Radar (SAR) data are very useful in coastal geomorphic studies because they
can be acquired in all weather conditions. Furthermore, complex coherence images
contain valuable information about the water/land boundary and thus, they can be used
to accurately detect coastline positions. But only tandem coherence can be used, as no
significant coastal change expected to occur within one day, the time period between the
SAR acquisitions.
COnstellation of Small Satellites for Mediterranean basin Observation (COSMO-
SkyMed) is one of the planned remote sensing missions in the near future. COSMO-
SkyMed is an Earth observation program financed and managed by the Italian Space
Agency (ASI). The system will be focused on the Mediterranean area, but it will be

101
capable of offering global services. The system will be equipped with four radar (X-
band, metric resolution), hyperspectral, and optical satellites, providing images of high
resolution with reduced revisit time over the observed sites (<8 hrs for Europe and 12 hrs
for Equator). The first satellite will be launched in late 2006 and the constellation will be
completed in 2007. COSMO-SkyMed data will enable comprehensive monitoring of
coastlines in all weather conditions in the Mediterranean area. SAR, hyperspectral and
optical data that will be provided by the COSMO-SkyMed satellite can be integrated for
comprehensive monitoring and accurate measuring of the coastal change in the Nile
Delta.
All coastal studies conducted on the Nile Delta revealed that the coastline of the
delta is dynamic, particularly at Damietta Promontory, and requires regular monitoring.
Coastal defense structures are needed to protect areas that are affected by significant
coastal erosion. Results from this SAR interferometric study as well as results from
previous coastal studies should be considered in the future for coastal zone management
and sustainable development of the Nile Delta.

102
CHAPTER VI
CONCLUSIONS AND FUTURE DIRECTIONS
1. Conclusions
Land subsidence and coastal erosion are two interrelated long-term geomorphic
problems in the Nile Delta. The rates of the ongoing land subsidence and coastline
retreat require accurate measuring and regular monitoring. Current measures of land
subsidence in the delta are rough estimates and assume uniformity over space and time.
Current techniques used to measure coastal change in the Nile Delta are point
measurements and, thus, provide a spatially limited view of the ongoing change. The
overall objective of this interferometric study was to detect the spatial and temporal
patterns, as well as the magnitudes of urban land subsidence and coastal change in the
Nile Delta.
Synthetic Aperture Radar Interferometry (InSAR) has been successfully applied
in this research to detect and measure land subsidence in greater Cairo, Mansura, and
Mahala, as well as to detect and measure coastal change at Damietta Promontory in the
eastern part of the Nile Delta in the 1993-2000 period. The average measured rates of
land subsidence in greater Cairo, Mansura, and Mahala are 7, 9, and 5 mm yr-1,
respectively, and the average measured rates of erosion and accretion at Damietta
Promontory are -9.57 and +5.44 m yr-1, respectively. These measured rates indicate the
pressing need for regular monitoring of land subsidence and coastline retreat in the Nile
Delta.
103
The environment of the Nile Delta is not ideal for SAR interferometry because of
the dense vegetation cover, high moisture content, and high humidity. The very slow rate
of deformation in the delta is also a major constraint because it requires a long-time
period to be measured. This, in turn, leads to interferometric phase decorrelation.
Phase decorrelation is a common interferometric problem in areas like the Nile
Delta. Interferograms created for Cairo, Mansura, and Mahala were completely
decorrelated over cultivated areas and even noisy over urban areas. Regardless of the
very slow rate of deformation, the cultivation, flood irrigation, and crop growth make the
application of SAR interferometry unfeasible over cultivated land. The vegetation cover
in the delta is very dynamic. It is changing approximately every four months.
As expected, all interferograms created for any part of the delta have been
affected by troposphere effects. However, interferograms created from winter
acquisitions were found less affected by atmospheric artifacts than those created from
summer acquisitions. Moreover, interferograms created for Mansura and Mahala were
significantly impacted by troposphere effects compared to interferograms created for
Cairo. Perhaps this occurred because of the limited spatial extent of urban areas in
Mansura and Mahala and both of them are completely surrounded by cultivated land.
Construction activities are also a potential source of local phase decorrelation over urban
areas. This problem was noticeable in Mansura and Mahala more than Cairo because
Mansura and Mahala have faster rate of construction activities.
To overcome phase decorrelation problems and detect the slow rate of land
subsidence in the Nile Delta, the Permanent Scatterer approach has been applied to

104
measure urban land subsidence as the interferometric phase remains well correlated in
urban areas over long time periods. SAR interferometric data acquired by the European
Radar Satellites (ERS-1 and ERS-2) were used in this study because of their spatial and
temporal coverage and, more importantly, because of their short wavelength, 5.66 cm,
that can detect slight changes in the surface of Earth.
The amplitude dispersion index has been used to identify Permanent Scatterers
(PSs) in greater Cairo, Mansura, and Mahala over the 1993-2000 period. The identified
PSs for each city have been found of sufficient density to conduct the interferometric
analysis and to produce reliable results. The Permanent Scatterer technique has been
applied independently for each city on the selected PSs.
The Permanent Scatterer interferometric approach was capable of detecting the
non-linear behavior of land subsidence in the selected sites. Additionally, the created
surface displacement maps for greater Cairo, Mansura, and Mahala show the pattern and
magnitude of land subsidence in each city. The main contributors to the rate of
subsidence in greater Cairo are the natural sediment compaction, tectonic setting, and
groundwater pumping. The deformation maps created for Cairo imply that the subway
network in Cairo is a potential contributor to the rate of recent subsidence as well. In
Mansura and Mahala, the major causes of land subsidence are limited to the natural
sediment compaction and groundwater pumping. The bowl shape that appears in the
deformation maps is common where pumping-induced subsidence exists.
Subsidence measurements in greater Cairo, Mansura and Mahala are still relative
at this level and need to be validated against in situ measurements. However, the

105
accuracy of the Permanent Scatterer techniques has been tested previously in numerous
studies. On average, it is approximately ±2 mm; whereas the approximate accuracy of
conventional InSAR techniques is ±5 mm. Unfortunately, There are no GPS
measurements or any other in situ measurements available to validate the findings from
this interferometric study. The measured subsidence rates are comparable with the
subsidence rates reported in previous works based on sedimentlogical studies and
thickness correlations of stratigraphic units in the delta. However, the InSAR
measurements are believed to be highly impacted by several anthropogenic factors.
Despite phase decorrelation problems over the cultivated land in the Nile Delta,
this study highlighted the feasibility of applying Permanent Scatterer interferometry to
detect urban subsidence in the densely vegetated delta. The need of continued InSAR
monitoring is evident from the localized urban subsidence in each of the three study
sites. The slow rate of deformation can be accurately detected by exploiting long-time
period of InSAR data of short wavelength. Therefore, it is recommended that regular
SAR acquisitions by ERS-2 and ENVISAT, as well as by other C-band platforms be
continued over the Nile Delta.
The synoptic view of remote sensing in coastal studies is unsurpassed. However,
the application of optical remote sensing data in such studies is limited by the resolution
cell, data availability, and clear weather. In contrast, SAR interferometric data can be
acquired in all weather conditions, day and night. Furthermore, the unprecedented
interferometric coherence is a powerful tool for detecting land/water boundaries.

106
ERS InSAR data have been also employed in this study to detect the patterns and
magnitude of coastal change at Damietta Promontory. Areas of erosions and accretion
have been accurately identified using the ERS complex coherence and amplitude
images. The tandem mode of the ERS satellites is appropriate for this purpose, as no
significant coastal change is expected to occur within 24 hours. The measured rate of
coastal erosion at Damietta Promontory using ERS InSAR data is very close the
measured rate of erosion using terrestrial survey reported in previous work, which adds
confidence to the obtained results.
2. Future Directions
Urban subsidence is expected in all cities in the Nile Delta. Further
interferometric studies for urban subsidence in other major cities in the delta such as
Alexandria in the west and Port Said in the east will give a broad understanding of the
ongoing deformation in the delta. However, the measured localized urban subsidence
can not be interpolated to witness the regional land subsidence in the entire delta. The
wide separation between urban areas can introduce intolerable uncertainty to the
interpolation process.
To observe regional subsidence across the entire delta, subsidence over the
cultivated land has to be measured. Of course, this can be accomplished locally using
traditional terrestrial survey tools. However, to detect the very slow rate of subsidence in
the delta using InSAR, monitoring has to be continued for many years. This is unfeasible
over cultivated land for the reasons explained before. Natural reflectors will decorrelate
107
with time and, thus, they are not appropriate for InSAR measurements. The alternative is
to conduct the interferometric measurements using artificial stable reflectors.
Based on feasibility and limitations addressed in this chapter for InSAR use over
the Nile Delta, artificial scatterers have to be used across wide areas in the delta over a
long time period to measure regional subsidence. The artificial reflectors must be fixed
at well known elevation points on the bedrock after removing the soil layer to avoid
potential errors that may arise from soil swelling and/or contraction.
All SAR data used in this study are ERS descending; i.e., acquired during the day
light. It is expected that ERS ascending data acquired at night will be less affected by
atmospheric artifacts, which may permit better results from conventional SAR
interferometry over large cities in the Delta such as greater Cairo. As ERS SAR and
ENVISAT ASAR data are acquired by similar sensors, they can be integrated to enable
long-term subsidence monitoring in the Nile Delta over approximately 15 years.
Seasonal InSAR data are needed to address the impact of pumping-induced
subsidence on the long-term subsidence and to determine whether the pumping-induced
subsidence is permanent or recoverable. Seasonal data at least for the winter and summer
seasons need to be exploited over approximately 10 years to detect the slight seasonal
subsidence in major cities.

108
REFERENCES
Abdel-Aal, M., J. Price, D. Vaitl, and A. Shrallow, Tectonic evolution of the Nile Delta,
its impacts on sedimentation and hydrocarbon, in: Twelfth Petroleum Exploration
and Production Conference, November 3-5, 19-34, 1994.
Adam, N., B. Kampes, M. Eineder, J. Worawattanamateekul, and M. Kircher, The
development of a scientific Permanent Scatterer system, High Resolution
Mapping from Space, ISPRS/EARSeL Workshop Proceedings, Hanover,
Germany, October 6-8, http://www.ipi.uni-hannover.de/html/publikationen/2003/
workshop/adam.pdf, 2003.
Ahmed, M., A. Hassan, and O. Frihy, Absence of environmental impact assessment
legislations for project decommissioning phase: environmental consequences,
Proceedings of the 10th International Conference “Environmental Protection Is a
Must”, Alexandria, Egypt, May 9-11, 7-19, 2000a.
Ahmed, M., J. Robert, and M. Yehia, Monitoring the Nile Delta: a key step in adaptation
to long-term coastal change, Proceedings of the 2nd International Conference, on
Earth Observations and Environmental Information (EOEI), Cairo, Egypt,
November 11-14, 3-17, 2000b.
Allen, C., Interferometric synthetic aperture radar, IEEE Geoscience and Remote
Sensing Society Newsletter, September, 96, 6-13, 1995.

109
Amelung, F., D. Galloway, J. Bell, H. Zebker, and R. Laczniak, Sensing the ups and
downs of Las Vegas: InSAR reveals structural control of land subsidence and
aquifer system deformation, Geology, 27(6), 483-486, 1999.
Askne, J., and J. Hagberg, Potential of interferometric SAR for classification of land
surfaces, Proceedings of the Int. Geosci. and Remote Sensing Symposium, Tokyo,
Japan, August 18-21, 985-987, 1993.
Badawy, A., and A. Abdel-Fattah, Source parameters and fault plane determinations of
the 28 December 1999 northeastern Cairo earthquakes, Tectonophysics, 343(1-2),
63-77, 2001.
Badawy, A., and A. Abdel-Fattah, Analysis of the southeast Beni-Suef, northern Egypt
earthquake sequence, J. of Geodyn., 33, 219-234, 2002.
Badawy, A., E. Issawy, G. Hassan, and A. Tealeb, Kinematics engine of the ongoing
deformation field around Cairo, Egypt, ACTA Geophysica Polonica, 51(4), 447-
458, 2003.
Badawy, A., and P. Monus, Dynamic source parameters of the 12th October 1992
Earthquake, Cairo, Egypt, J. Geodyn., 20, 99-109, 1995.
Bawden, G., W. Thatcher, R. Stein, K. Hudnut, and G. Peltzer, Tectonic contraction
across Los Angeles after removal of groundwater pumping effects, Nature, 412,
812-815, 2001.
Beaumont, P., G. Blake, and J. Wagstaff, The Middle East: a geographical study,
London, Wiley, 572 p., 1976.

110
Bloom, A., Geomorphology: a systematic analysis of late Cenozoic landforms, Upper
Saddle River, N.J., Prentice Hall, 482 p., 1998.
Buckley, S., P. Rosen, S. Hensley, and B. Tapley, Land subsidence in Houston, Texas
measured by radar interferometry and constrained by extensometers, J. Geophys.
Res., 108(B11), 2542, 2003.
Bürgmann, R., P. Rosen, and E. Fielding, Synthetic aperture radar interferometry to
measure Earth’s surface topography and its deformation, Annu. Rev. Earth
Plannet. Sci., 28, 169-209, 2000.
Carnec, C., D. Massonnet, and C. King, Two examples of the application of SAR
interferometry to sites of small extent, Geophys. Res. Lett., 23, 3579-3582, 1996.
Chen, C., Statistical-cost network-flow approaches to two dimensional phase
unwrapping for radar interferometry, PhD thesis, Stanford University, Stanford,
California, June, 2001.
Colesanti, C., A. Ferretti, C. Prati, and F. Rocca, Monitoring landslides and tectonic
motions with the Permanent Scatterers technique, Engineering Geology, 68, 3-
14, 2003.
Colesanti, C., S. Le Mouelic, M. Bennani, D. Raucoules, C. Carnec, and A. Ferretti,
Detection of mining related ground instabilities using the Permanent Scatterers
technique - a case study in the east of France, International J. of Remote Sensing,
26(1), 201-207, 2005.
Costantini, M., A novel phase unwrapping method based on network programming,
IEEE Transactions on Geoscience and Remote Sensing, 36(3), 813-821, 1998.

111
Crosetto, M., A. Arnaud, J. Duro, E. Biescas, and M. Agudo, Deformation monitoring
using remotely sensed radar interferometric data, Proceedings of the 11th FIG
Symposium on Deformation Measurements, Santorini, Greece, 2003.
Curlander, J., and R. McDonough, Synthetic aperture radar: systems and signal
processing, New York, Wiley-Intersci., 647 p., 1991.
Dehls, J., M. Basilio, and C. Colesanti, Ground deformation monitoring in the Ranafjord
area of Norway by means of the permanent scatterer technique, IEEE Int.,
Geosci. and Remote Sensing Symposium, IGARSS, 203-207, 2002.
Delacourt, C., P. Briole, and J. Achache, Tropospheric corrections of SAR
interferograms with strong topography, Application to Etna, Geophys. Res. Lett.,
25, 2849-52, 1998.
Dixon, T., F. Amelung, A. Ferretti, F. Novali, F. Rocca, R. Dokka, G. Sella, S. Kim, S.
Wdowinski, and D. Whitman, New Orleans subsidence: space geodesy and
Hurricane Katrina Flooding, Nature, 441, 587-588, 2006.
Egyptian Tunneling Society (ETS), Greater Cairo metro network:
http://www.egypts.com/index.htm, 2005.
Elachi, C., Spaceborne radar remote sensing: applications and techniques, New York,
IEEE, 255 p., 1988.
El Araby, H., and M. Sultan, Integrated seismic risk map of Egypt, Seismological
Research Letters, 71, 52-65, 2000.
El-Fiky, G., C. Reddy, and A. Tealeb, GPS derived velocity and crustal strain field in the
vicinity of Cairo city, Egypt, J. Soc. India, 63, 449-452, 2004.

112
El Kashef, A., Salt water intrusion in the Nile delta, Ground Water, 21, 160-167, 1983.
El Raey, M., Vulnerability assessment of the coastal zone of the Nile Delta of Egypt, to
the impacts of sea level rise, Ocean & Coastal Management, 37(1), 22-40, 1997.
El Raey, M., S. Nasr, O. Frihy, and M. El Hattab, Change detection of Rosetta
promontory over the last forty years, International J. of Remote Sensing, 16, 825-
834, 1995.
Evans, D., T. Farr, H. Zebker, and P. Mouginis-Mark, Radar interferometry studies of
the Earth’s topography, EOS, Trans. American Geophysical Union, 73(553),
557-558, 1992.
Ferretti, A., A. Monti-Guarnieri, C. Prati, and F. Rocca, Multi-baseline interferometric
techniques and applications, in: Proceedings of FRINGE '96 Workshop, Zurich,
Switzerland, September 30 - October 2, 243-253, 1996.
Ferretti, A., C. Prati, and F. Rocca, Nonlinear subsidence rate estimation using
Permanent Scatterers in differential SAR interferometry, IEEE Trans. Geosci.
Remote Sensing, 38(5), 2202-2212, 2000.
Ferretti, A., C. Prati, and F. Rocca, Permanent Scatterers in SAR interferometry, IEEE
Trans. Geosci. Remote Sensing, 39(1), 8-20, 2001.
Fielding, E., R. Bloom, and R. Goldstein, Rapid subsidence over oil fields measured by
SAR interferometry, Geophys. Res. Lett., 27, 3215-3218, 1998.
Frihy, O., Sea-level rise and shoreline retreat of the Nile Delta promontories, Egypt,
Natural Hazards, 5, 65-81, 1992.

113
Frihy, O., Some proposals for coastal management of the Nile Delta coast, Ocean and
Coastal Management, 30, 43-59, 1996.
Frihy, O., and A. Khafagy, Climate and human induced changes in relation to shoreline
migration trends at the Nile Delta promontories, Egypt, Catena, 18, 197-211,
1991.
Frihy, O. and P. Komar, Long-term shoreline changes and the concentration of heavy
minerals in beach sands of the Nile Delta, Egypt, Marine Geology, 115, 253-261,
1983.
Frihy, O., S. Nasr, M. Ahmed, and M. El Raey, Temporal shoreline and bottom changes
of the inner continental shelf of the Nile Delta, Egypt, Egypt, J. Coastal
Research, 7(2), 465-476, 1990.
Fruneau, B., J. Rudent, D. Obert, and D. Raymond, Small displacements detected by
SAR interferometry on the City of Paris (France), Proceedings of IGARSS ′99,
Hamburg, Germany, June 28 - July 2, (CD ROM), 1999.
Fujiwara, S., P. Rosen, M. Tobita, and M. Murakami, Crustal deformation measurements
using repeat-pass JERS-1 synthetic aperture radar interferometry near the Izu
Peninsula, Japan, J. Geophys. Res., 103, 2411-26, 1998a.
Gabriel, A., and R. Goldstein, Crossed orbit interferometry: Theory and experimental
results from SIR-B, International J. of Remote Sensing, 9, 857-872, 1988.
Gabriel, A., R. Goldstein, and H. Zebker, Mapping small elevation changes over large
areas-differential radar interferometry, J. Geophys. Res., 94, 9183-9191, 1989.

114
Galloway, D., K. Hudnut, S. Ingebritsen, S. Phillips, G. Peltzer, F. Rogez, and P. Rosen,
Detection of aquifer system compaction and land subsidence using
interferometric synthetic aperture radar, Antelope Valley, Mojave Desert,
California, Water Resour. Res., 34, 2573-2585, 1998.
Goldstein, R., Atmospheric limitations to repeat-pass radar interferometry, Geophys.
Res. Lett., 22, 2517-2520, 1995.
Goldstein, R., T. Barnett, and H. Zebker, Remote sensing of ocean currents, Science,
246, 1282-1285, 1989.
Goldstein, R., and C. Werner, Radar interferogram filtering for geophysical applications,
Geophys. Res. Lett., 25(21), 4035-4038, 1998.
Goldstein, R., and H. Zebker, Interferometric radar measurement of ocean surface
currents, Nature, 328, 707-709, 1987.
Graham, L., Synthetic interferometric radar for topographic mapping, Proceedings of the
IEEE 62(2), 763-768, 1974.
Gray, A., and P. Farris-Manning, Repeat-pass interferometry with airborne synthetic
aperture radar, IEEE Trans. on Geosci. and Remote Sensing, 31(1), 180-191,
1993.
Hanssen, R., Radar interferometry: data interpretation and error analysis, Kluwer
Academic Publishers, Boston, 308 p., 2001.
Hernandez, B., F. Cotton, M. Campillo, and D. Massonnet, A comparison between short
term (co-seismic) and long term (one year) slip for the Landers earthquake:

115
measurements from strong motion and SAR interferometry, Geophys. Res. Lett.,
24, 1579-82, 1997.
Hilley, G., R. Bürgmann, A. Ferretti, F. Novali, and F. Rocca, Dynamics of slow-
moving landslides from Permanent Scatterer Analysis, Science, 304, 1952-1955,
2004.
Hoffmann, J., H. Zebker, D. Galloway, and F. Amelung, Seasonal subsidence and
rebound in Las Vegas Valley, Nevada, observed by synthetic aperture radar
interferometry, Water Resour. Res., 37(6), 1551-1566, 2001.
Hooper, A., H. Zebker, P. Segall, and B. Kampes, A new method for measuring
deformation on Volcanoes and other natural terrains using InSAR Persistent
Scatterers, Geophys. Res. Lett., 31, L23611, doi:10.1029/2004GL021737, 2004.
Idris, H., and S. Nour, Present groundwater status in Egypt and the environmental
impacts, Environmental Geology and Water Sciences, 16(3), 171-177, 1990.
Inman, D., and S. Jenkins, The Nile littoral cell and man’s impact on the coastal littoral
zone in SE Mediterranean, in: Proceedings of the 17th International Coastal
Engineering Conference, ASCE, Sydney, Australia, March 23-28, 1600-1617,
1980.
Klemas, V., and A. Abdel-Kader, Remote sensing of coastal processes with emphasis on
the Nile Delta, in: International Symposium on Remote Sensing of Environments,
Cairo, 27 p., 1982.

116
Korrat, I., N. El Agami, H. Hussein, and M. El-Gabry, Seismotectonics of the passive
continental margin of Egypt, J. of African Earth Sciences, 41(1-2), 145-150,
2005.
Lemoigne, J., and J. Tilton, Refining image segmentation by integration of edge and
region data, IEEE Trans. on Geosci. and Remote Sensing, 33(3), 605-615, 1995.
Li, F., and R. Goldstein, Studies of multi-baseline spaceborne interferometric synthetic
aperture radars, IEEE Trans. Geosci. Remote Sensing, 28(1), 88-96, 1990.
Lu, Z., R. Fatland, M. Wyss, S. Li, and J. Eichelberer, Deformation of New Trident
volcano measured by ERS-1 SAR interferometry, Kalmia National Park, Alaska,
Geophys. Res. Lett., 24, 695-98, 1997.
Manohar, M., Coastal processes at the Nile Delta coast, Shore and Beach, 49, 8-15,
1981.
Marghany, M., TOPSAR wave spectra model and coastal erosion detection,
International J. of Applied Earth Observation and Geoinformation, 3(4), 357-
385, 2001.
Marom, M., L. Shemer, and E. Thornton, Energy density directional spectra of a
nearshore wave field measured by interferometric synthetic aperture radar, J.
Geophys. Res., 96, 22125-22134, 1991.
Mason, D., I. Davenport, R. Flather, B. McCartney, and G. Robinson, Construction of an
inter-tidal digital elevation model by the water-line method, Geophys. Res. Lett.,
22, 3187-3190, 1995.

117
Massonnet, D., P. Briole, and A. Arnaud, Deflation of Mount Etna monitored by
spaceborne radar interferometry, Nature, 375, 567-570, 1995.
Massonnet, D., and K. Feigl, Discrimination of geophysical phenomena in satellite radar
interferograms, Geophys. Res. Lett., 22(12), 1537-1540, 1995a.
Massonnet, D., and K. Feigl, Satellite radar interferometric map of the coseismic
deformation field of the M = 6.1 Eureka Valley, California, earthquake of May
17, 1993, Geophys. Res. Lett., 22(12), 1541-1544, 1995b.
Massonnet, D., and K. Feigl, Radar interferometry and its application to changes in the
Earth’s surface, Reviews of Geophysics, 36, 441-500, 1998.
Massonnet, D., K. Feigle, M. Rossi, and F. Adragna, Radar interferometric mapping of
deformation in the year after the Landers earthquake, Nature, 369, 227-230,
1994.
Massonnet, D., T. Holzer, and H. Vadon, Land subsidence caused by the East Mesa
geothermal field, California, observed using SAR interferometry, Geophys. Res.
Lett., 24, 901-904, 1997.
Massonnet, D., M. Rossi, C. Carmona, F. Adragna, G. Pletzer, K. Feigle, and T.
Rabaute, The displacement field of the Landers earthquake mapped by radar
interferometry, Nature, 364, 138-142, 1993.
Meshref, W., Tectonic framework of Egypt, in: R. Said (ed.), Geology of Egypt, A.A.
Balkema Publisher, Rotterdam, Netherlands, 113-153, 1990.
Mosconi, A., A. Rebora, G. Venturino, P. Bocc, and M. Khalil, Egypt-Nile Delta and
North Sinai Cenozoic tectonic evolutionary model: a proposal, Proceedings of

118
the 13th Egypt Gen. Petrol. Corp. Explor. and Prod. Conference, Cairo, Egypt,
February 21-25, 1, 203-223, 1996.
Orwig, E., Tectonic framework of northern Egypt and the eastern Mediterranean, EGPC,
5th Exploration Seminar, Cairo, Egypt, March 16-20, 20 p., 1982.
Orwig, L., and D. Held, Interferometric ocean surface mapping and moving object
relocation with a Norden Systems Ku-band SAR, Proc. of the International
Geoscience and Remote Sensing Symposium (IGARSS '92), Houston, Texas, May
26-29, (Piscataway, N.J., IEEE) 1598-1600, 1990.
Pletzer, G., K. Hudnut, and K. Feigl, Analysis of coseismic surface displacement
gradients using radar interferometry: new insights into the Landers earthquake, J.
Geophys. Res., 99(B11), 21971-21981, 1994.
Prati, C., and F. Rocca, Limits to the resolution of elevation maps from stereo SAR
images, International J. of Remote Sensing, 11(12), 2215-2235, 1990.
Prati, C., and F. Rocca, Focusing SAR data with time varying Doppler cenroid, IEEE
Trans. on Geoscience and Remote Sensing, 30(3), 550-559, 1992.
Price, E., and D. Sandwell, Small-scale deformations associated with the 1992 Landers,
California, earthquake mapped by synthetic aperture radar interferometry phase
gradients, J. Geophys. Res., 103, 27001-27016, 1998.
Rabus, B., M. Eineder, A. Roth, and R. Bamler, The shuttle radar topography mission - a
new class of digital elevation models acquired by spaceborne radar,
Photogrammetry & Remote Sensing, 57, 241-262, 2003.

119
Rizzini, A., F. Wezzani, V. Cococcetta, and G. Milad, Stratigraphy and sedimentation of
the Neogene Quaternary section in the Nile Delta area, Marine Geology, 27, 327-
348, 1978.
Rodriguez, E., and J. Martin, Theory and design of interferometric synthetic-aperture
radars, Proc. of the IEEE, 139(2), 147-59, 1992.
Rogers, A., and R. Ingalls, Venus: mapping the surface reflectivity by radar
interferometry, Science, 165, 797-799, 1969.
Rosen, P., S. Hensley, H. Zebker, F. Webb, and E. Fielding, Surface deformation and
coherence measurements of Kilauea Volcano, Hawaii, from SIR-C radar
interferometry, J. Geophys. Res., 101, 23109-23125, 1996.
Rott, H., T. Nagler, and F. Rocca, InSAR techniques and applications for monitoring
landslides and subsidence, in: T. Benes (ed.), Proceedings of EARSeL Assembly
Geoinformation for European-wide Integration, Prague, June 2002, Millpress,
Rotterdam 25-31, 2003.
Rumsey, H., G. Morris, R. Green, and R. Goldstein, A radar brightness and altitude
image of a portion of Venus, Icarus, 23, 1-7, 1974.
Said, R., The River Nile, Berlin: Springer-Verlag, 151 p., 1981.
Scharroo, R., and P. Visser, Precise orbit determination and gravity field improvement
for the ERS satellites, J. Geophys. Res., 103(C4), 8113-8127, 1998.
Schlumberger, Well Evaluation Conference Egypt, Paris: Schlumberger Middle East,
Editions Galilee, 248 p., 1984.

120
Sestini, G., Nile Delta: a review of depositional environments and geological history, in:
Whateley, M., and K. Pickerring, (eds.), Deltas sites and traps for fossil fuels,
London, Geological Society Spatial Publication, 41, 99-127, 1989.
Sestini, G., Implications of climatic changes for the Nile Delta, in: Jeftic, L., J. Milliman,
and G. Sestini, (eds.), Climatic change and the Mediterranean, Edward Arnold,
New York, 535-601, 1992.
Shawky Abdine, A., Egypt’s petroleum geology: good grounds for optimisim, World
Oil, December, 99-112, 1981.
Singhroy, V., K. Mattar, and L. Gray, Landslide characterization in Canada using
interferometric SAR and combined SAR and TM images, Advances in Space
Research, 2(3), 465-476, 1998.
Smith, E., and A. Abdel-Kader, Coastal erosion along the Egyptian Delta, J. of Coastal
Res., 4, 245-255, 1988.
Sneed, M., M. Ikehara, D. Galloway, and F. Amelung, Detection and measuring of land
subsidence using Global Positioning System and interferometric synthetic
aperture radar, Coachella Valley, California, 1996-1998, U.S. Geological Survey,
Water-Resources Investigations Report, 01-4193, 2001.
Stabel, E., and P. Fischer, Satellite radar interferometry products for the urban
application domain, Advances in Environmental Research, 5, 425-433, 2001.
Stanley, D., Subsidence in the northeastern Nile Delta: rapid rates, possible causes, and
consequences, Science, 240, 497-500, 1988.

121
Stanley, D., Recent subsidence and northeast tilting of the Nile delta, Egypt, Marine
Geology, 94, 147-154, 1990.
Stanley, D., Nile Delta: extreme case of sediment entrapment on a delta plain and
consequent coastal land loss, Marine Geology, 129, 189-195, 1996.
Stanley, D., and A. Warne, Nile Delta, recent geological evolution and human impact,
Science, 260, 628-634, 1993.
Stanley, D., and A. Warne, Nile Delta in its destruction phase, the world deltas
conference; a tribute to James Plummer Morgan (1919-1995), J. of Coastal
Research, 14(3), 794-825, 1998.
Strozzi, T., L. Tosi, L. Carbognin, U. Wegmüler, and A. Galgaro, Monitoring land
subsidence in the Euganean Geothermal Basin with differential SAR
interferometry, Proceedings of FRINGE ′99, Liège, Belgium, 10-12 November,
http://earth.esa.int/services/esa_doc/doc_int.html, 1999a.
Strozzi, T., U. Wegmüler, and A. Luckman, and H. Balzter, Mapping deformation in
Amazon with ERS SAR interferometry, Proceedings of FRINGE ′99, Liège,
Belgium, 10-12 November, http://earth.esa.int/services/esa_doc/doc_int.html,
1999b.
Strozzi, T., U. Wegmüler, Land subsidence in Mexico City mapped by ERS differential
SAR interferometry, Proceedings of IGARSS ′99, Hamburg, Germany, June 28 -
July 2, 1940-1942, 1999.
122
Tarchi, D., N. Casagli, R. Fanti, D. Leva, G. Luzi, and A. Pasuto, Landslide monitoring
by using ground-based SAR interferometry: an example of application to the
Tessina landslide in Italy, Engineering Geology, 68, 15-30, 2003.
Thatcher, W., and D. Massonnet, Crustal deformation at Long Valley Caldera, eastern
California, 1992-1996 inferred from satellite radar interferometry, Geophys. Res.
Lett., 24, 2519-22, 1997.
UNDP/UNESCO, Arab Republic of Egypt: coastal protection studies, project findings
and recommendations, UNDP/EGY/73/063, Final Report, FNR/SC/OSP/78/230,
Paris, UNDP/UNESCO, 483 p., 1978.
Warne, A., and D. Stanley, Late quaternary evolution of the Northwest Nile Delta and
adjacent coast in the Alexandria region, Egypt, J. of Coastal Research, 9(1), 26-
64, 1993.
White, K., and H. El-Asmar, Monitoring changing position of the coastline using
Thematic Mapper imagery, an example from the Nile Delta, Geomorphology, 29,
93-105, 1999.
Wicks, C., W. Thatcher, and D. Dzurisin, Migration of fluids beneath Yellowstone
caldera inferred from satellite radar interferometry, Science, 282(5388), 458-462,
1998.
Wilson, P., Rule-based classification of water in Landsat MSS images using the variance
filter, Photogrammetric Engineering and Remote Sensing, 63, 485-491, 1997.

123
World Bank, Arab Republic of Egypt: country economic memorandum, economic
readjustment with growth, in: World Bank Report no. 7447-EGT, 2, 72 p.,
Washington, DC, 1990.
Zaghloul, Z., A. Abdel-Daiem, and A. Taha, Geomorphology, geologic evolution and
subsidence of the Nile Delta during the Quaternary, Bulletin of the Faculty of
Science, Mansura, Egypt, 17(1), 471-495, 1990.
Zaghloul, Z., S. Andrawis, and S. Ayad, New contribution to the stratigraphy of Tertiary
sediments of Kafr El Dawar well no. 1, NW Nile Delta, Egypt, Annals of the
Geological Survey of Egypt, 9, 292-307, 1979.
Zaghloul, Z., A. Taha, O. Hegab, and F. El-Fawal, The Neogene Quaternery sedimentary
basins of the Nile Delta, Egyptian J. of Geology, 21, 143-161, 1977a.
Zaghloul, Z., A. Taha, O. Hegab, and F. El-Fawal, The Plio-Pleistocene Nile Delta: sub-
environments, stratigraphic section and genetic classification, Annals of the
Geological Survey of Egypt, 9, 283-291, 1977b.
Zebker, H., F. Amelung, and S. Jonsson, Remote sensing of volcano surface and internal
processes using radar interferometry, AGU Geophysical Monograph, 116, 179-
205, 2000.
Zebker, H., and R. Goldstein, Topographic mapping from interferometric SAR
observations, J. Geophys. Res., 91, 4993-4999, 1986.
Zebker, H., S. Madsen, J. Martin, K. Wheeler, and T. Miller, The TOPSAR
interferometric radar topographic mapping instrument, IEEE Trans. Geosci.
Remote Sensing, 30, 933-40, 1992.

124
Zebker, H., P. Rosen, R. Goldstein, A. Gabriel, and C. Werner, On the derivation of
coseismic displacement fields using differential interferometery: the Landers
earthquake, J. Geophys. Res., 99, 19617-19634, 1994a.
Zebker, H., P. Rosen, and S. Hensley, Atmospheric effects in interferometric synthetic
aperture radar surface deformation and topographic maps, J. Geophys. Res.,
102(B4), 7547-7563, 1997.
Zebker, H., and J. Villasenor, Decorrelation in interferometric radar echoes, IEEE Trans.
Geosci. Remote Sensing, 30, 950-959, 1992.
Zebker, H., C. Werner, P. Rosen, and S. Hensley, Accuracy of topographic maps derived
from ERS-1 interferomteric radar, IEEE Trans. Geosci. Remote Sensing, 32, 823-
836, 1994b.
Zisk, S., Lunar topography: first radar-interferometer measurements of the Alphonsus-
Ptolemaeus-Arzachel region, Science, 178, 977-980, 1972a.
Zisk, S., A new Earth-based radar technique for the measurement of lunar topography,
Moon, 4, 296-306, 1972b.

125
VITA
Name: Mohamed Hassan Aly
Address: Texas A&M University
Department of Geology & Geophysics
College Station, Texas 77843-3115
Email: [email protected]
Education: B.S., 1992, Geology, Zagazig University, Egypt
M.S., 1997, Geology, Zagazig University, Egypt
Research Interests: Integrating SAR Interferometry (InSAR) and Global Positioning
System (GPS), as well as Geographic Information System (GIS) to
study crustal deformation and geomorphic hazards.