RACIAL DIVERSITY, BUSINESS STRATEGY, AND FIRM … of Management Journal 2000, Vol. 43, No. 2,...
14
? Academy of Management Journal 2000, Vol. 43, No. 2, 164-177. RACIALDIVERSITY, BUSINESS STRATEGY, AND FIRM PERFORMANCE: A RESOURCE-BASED VIEW ORLANDO C. RICHARD Louisiana Tech University Although "valuing diversity" has become a watchword, field research on the impact of a culturally diverse workforce on organizational performance has not been forthcom- ing. Invoking a resource-based framework, in this study I examined the relationships among cultural (racial) diversity, business strategy, and firm performance in the banking industry. Racial diversity interacted with business strategy in determining firm performance measured in three different ways, as productivity, return on equity, and market performance. The results demonstrate that cultural diversity does in fact add value and, within the proper context, contributes to firm competitive advantage. Increasing cultural diversity in the workforce poses one of the most challenging human resource and organizational issues of our time. Academi- cians and practitioners have sought to understand the impact of both cultural diversity and diversity management on organizational effectiveness. Al- though most academic research has been primarily concerned with the impact on individual and group outcomes of diversity in dyadic relationships and groups (Dwyer, Richard, & Shepherd, 1998; O'Reilly, Caldwell, & Barnett, 1989; O'Reilly, Wil- liams, & Barsade, 1997; Pelled, 1996; Pelled, Eisen- hardt, & Xin, 1999; Thomas, 1993; Tsui, Egan, & O'Reilly, 1992; Tsui & O'Reilly, 1989), most ap- plied research has been more concerned with the management of an increasingly culturally diverse workforce. There are a variety of management is- sues and activities related to recruiting, selecting, and using diverse human resources. Consistent with most academic research, this ar- ticle focuses on the effects of cultural diversity, distinct from its management. The reported re- search does depart from other research studying diversity at the individual and group level in that it investigated the impact of diversity at the firm level. "Evidence of diversity's impact on the bot- tom line has not been systematically measured and An earlier version of this article received the Best Paper Based on a Dissertation Award from the Gender and Diversity Division of the Academy of Management. I wish to thank Timothy Barnett, James Baron,WalterFer- rier, Nancy Johnson, Susan Kirby, and Thomas Kochan for their helpful suggestions. The researchwas funded by the Society for Human Resource Management Founda- tion, Carol Martin Gatton College of Business and Eco- nomics at the University of Kentucky, and the Graduate School of the University of Kentucky. documented for easy retrieval and use" (Robinson & Dechant, 1997: 21). The current study addresses this omission from the literature by (1) providing an analytical foundation and theoretical framework for understanding the impact of cultural diversity on firm performance and (2) supporting the idea that diversity, within the proper context, relates positively to performance. Cultural diversity is taken to mean the represen- tation, in one social system, of people with differ- ent group affiliations of cultural significance (Cox, 1994). It is identified by particular surface-level characteristics (Harrison, Price, & Bell, 1998) or observable attributes (Milliken & Martins, 1996): racial diversity, which some scholars have labeled "racioethnicity" (racial and/or ethnic distinction within a nationality; Kossek & Zonia, 1993; McLeod, Lobel, & Cox, 1996), gender, nationality, and age. In this article, the term "cultural diversity" refers to racial diversity. Consistent with almost all prior research on top management teams and organizational demography (Hambrick, 1994; Hambrick, Cho, & Chen, 1996; Jackson, 1992; Jackson, Stone, & Alvarez, 1993; Pfeffer, 1983), this research relies on demographic conceptions of organization members, with racio- ethnicity serving as a proxy for their perspectives, belief systems, networks, and affiliations (Cox, Lobel, & McLeod, 1991; McLeod et al., 1996). This approach appears to be a very practical one for the study of teams or large groups (Bantel & Jackson, 1989) and seems even more appropriate when applied at the firm level. Because race has been cited as the most fre- quently picked component of diversity by human resource (HR) managers and CEOs (Carrell & Mann, 1995), and because past findings validate race as a dimension of cultural diversity (Cox, 1994; Cox et 164 This content downloaded from 69.85.215.194 on Wed, 26 Aug 2015 21:34:03 UTC All use subject to JSTOR Terms and Conditions
Transcript of RACIAL DIVERSITY, BUSINESS STRATEGY, AND FIRM … of Management Journal 2000, Vol. 43, No. 2,...
? Academy of Management Journal 2000, Vol. 43, No. 2, 164-177.
RACIAL DIVERSITY, BUSINESS STRATEGY, AND FIRM PERFORMANCE: A RESOURCE-BASED VIEW
ORLANDO C. RICHARD Louisiana Tech University
Although "valuing diversity" has become a watchword, field research on the impact of a culturally diverse workforce on organizational performance has not been forthcom- ing. Invoking a resource-based framework, in this study I examined the relationships among cultural (racial) diversity, business strategy, and firm performance in the banking industry. Racial diversity interacted with business strategy in determining firm performance measured in three different ways, as productivity, return on equity, and market performance. The results demonstrate that cultural diversity does in fact add value and, within the proper context, contributes to firm competitive advantage.
Increasing cultural diversity in the workforce poses one of the most challenging human resource and organizational issues of our time. Academi- cians and practitioners have sought to understand the impact of both cultural diversity and diversity management on organizational effectiveness. Al- though most academic research has been primarily concerned with the impact on individual and group outcomes of diversity in dyadic relationships and groups (Dwyer, Richard, & Shepherd, 1998; O'Reilly, Caldwell, & Barnett, 1989; O'Reilly, Wil- liams, & Barsade, 1997; Pelled, 1996; Pelled, Eisen- hardt, & Xin, 1999; Thomas, 1993; Tsui, Egan, & O'Reilly, 1992; Tsui & O'Reilly, 1989), most ap- plied research has been more concerned with the management of an increasingly culturally diverse workforce. There are a variety of management is- sues and activities related to recruiting, selecting, and using diverse human resources.
Consistent with most academic research, this ar- ticle focuses on the effects of cultural diversity, distinct from its management. The reported re- search does depart from other research studying diversity at the individual and group level in that it investigated the impact of diversity at the firm level. "Evidence of diversity's impact on the bot- tom line has not been systematically measured and
An earlier version of this article received the Best Paper Based on a Dissertation Award from the Gender and Diversity Division of the Academy of Management. I wish to thank Timothy Barnett, James Baron, Walter Fer- rier, Nancy Johnson, Susan Kirby, and Thomas Kochan for their helpful suggestions. The research was funded by the Society for Human Resource Management Founda- tion, Carol Martin Gatton College of Business and Eco- nomics at the University of Kentucky, and the Graduate School of the University of Kentucky.
documented for easy retrieval and use" (Robinson & Dechant, 1997: 21). The current study addresses this omission from the literature by (1) providing an analytical foundation and theoretical framework for understanding the impact of cultural diversity on firm performance and (2) supporting the idea that diversity, within the proper context, relates positively to performance.
Cultural diversity is taken to mean the represen- tation, in one social system, of people with differ- ent group affiliations of cultural significance (Cox, 1994). It is identified by particular surface-level characteristics (Harrison, Price, & Bell, 1998) or observable attributes (Milliken & Martins, 1996): racial diversity, which some scholars have labeled "racioethnicity" (racial and/or ethnic distinction within a nationality; Kossek & Zonia, 1993; McLeod, Lobel, & Cox, 1996), gender, nationality, and age. In this article, the term "cultural diversity" refers to racial diversity.
Consistent with almost all prior research on top management teams and organizational demography (Hambrick, 1994; Hambrick, Cho, & Chen, 1996; Jackson, 1992; Jackson, Stone, & Alvarez, 1993; Pfeffer, 1983), this research relies on demographic conceptions of organization members, with racio- ethnicity serving as a proxy for their perspectives, belief systems, networks, and affiliations (Cox, Lobel, & McLeod, 1991; McLeod et al., 1996). This approach appears to be a very practical one for the study of teams or large groups (Bantel & Jackson, 1989) and seems even more appropriate when applied at the firm level.
Because race has been cited as the most fre- quently picked component of diversity by human resource (HR) managers and CEOs (Carrell & Mann, 1995), and because past findings validate race as a dimension of cultural diversity (Cox, 1994; Cox et
164
This content downloaded from 69.85.215.194 on Wed, 26 Aug 2015 21:34:03 UTCAll use subject to JSTOR Terms and Conditions

Richard
al., 1991), few would argue that it is not a major dimension of diversity. In addition, "research has tended to study organization populations as homo- geneous entities in which distinctions of race and ethnicity are either 'unstated' or considered irrele- vant" (Nkomo, 1992: 488). I used the resource- based view of the firm (e.g., Barney, 1991; Wright, 1998) as an economic foundation to examine cul- tural diversity's role in helping firms obtain com- petitive advantage.
CONCEP'TUAL BACKGROUND AND THEORY
Proponents of diversity maintain that different opinions provided by culturally diverse groups make for better-quality decisions (Cox, 1994; McLeod et al., 1996). Minority views stimulate con- sideration of nonobvious alternatives in work set- tings (McLeod & Lobel, 1992; Nemeth, 1992) and appear useful for making valuable judgments in novel situations. Heterogeneity in decision-making and problem-solving styles produces better deci- sions through the operation of a wider range of perspectives and a more thorough critical analysis of issues (Jackson, 1992).
A few laboratory studies have provided support for the idea that racial diversity benefits decision making; this is usually termed the "value-in-diver- sity hypothesis," or the "information/decision- making notion." For example, Watson, Kumar, and Michaelsen (1993) studied the interaction and per- formance of culturally homogeneous and culturally diverse groups for 17 weeks. They reported that homogeneous groups initially scored higher on both process and performance effectiveness. Over time, both types of groups showed improvement on process and performance, and the between-groups differences lessened. By week 17, there were no differences in process or overall performance, but the heterogeneous groups scored higher on two task measures (range of perspectives and alternatives generated). More recently, results from a controlled experimental brainstorming study (McLeod et al., 1996) showed that the ideas produced by ethnically diverse groups were judged to be of higher quality than the ideas produced by homogeneous groups. In general, these few studies indicate the value obtained from cultural diversity.
Examining human capital in groups (Cox et al., 1991; McLeod et al., 1996; Pelled, 1996) or in firms' upper echelons (Hambrick & Mason, 1984; O'Reilly & Flatt, 1989) does not, however, capture the larger human capital pool that ultimately determines an organization's success (Wright & McMahan, 1992). I used a resource-based view of the firm covering
diversity at the firm level, following previous re- search employing this theory (Wright, Smart, & Mc- Mahan, 1995).
Racial Diversity: A Resource-Based View
Strategic human resource management (SHRM) is a means of gaining competitive advantage through one of a company's most important assets: its people. Resources confer enduring competitive advantages on a firm to the extent that they remain scarce or hard to duplicate, have no direct substi- tutes, and enable companies to pursue opportuni- ties (Barney, 1991; Lado, Boyd, & Wright, 1992).
As other sources of competitive advantage, such as technological and physical resources, have be- come easier to emulate, the crucial differentiating factor between firms can be how human resources work within an organization (Pfeffer, 1994). The concept of human capital is that people have skills, experience, and knowledge that provide economic value to firms. Barney and Wright (1998) noted that in order for human capital to contribute to sustain- able competitive advantage, it must create value, remain hard to imitate, and appear rare. Cultural diversity in human capital serves as a source of sustained competitive advantage because it creates value that is both difficult to imitate and rare.
Value. Organizations may increase their num- bers of women and racioethnic minorities to better match the demographic characteristics of their sig- nificant customers in order to achieve a competi- tive edge in the market (Cox, 1994). As racioethnic populations increase as a proportion of the total population, it behooves companies to adjust their human resource mix to reflect the target market they are attempting to reach. Moreover, as firms reach out to a broader customer base, they need employees who understand particular customer preferences and requirements (Morrison, 1992). The insights and cultural sensitivity that women and racioethnic minority employees bring to a mar- keting effort improve an organization's ability to reach different market segments (Cox & Blake, 1991).
Organizations may also select women and minor- ities to gain alternative perspectives necessary in a changing or turbulent environment (Cox, 1991; Cox & Blake, 1991). Nemeth (1992) maintained that air- ing minority viewpoints improves the quality of thought, performance, and decision making. If an organization overcomes resistance to change in the area of accepting diversity, it may be positioned well to handle other types of change (Iles & Hayers, 1997). For example, cultural diversity within deci-
the entire human capital pool to assess cultural
2000 165
sion-making teams may lead to changes in corpo-
This content downloaded from 69.85.215.194 on Wed, 26 Aug 2015 21:34:03 UTCAll use subject to JSTOR Terms and Conditions

Academy of Management Journal
rate strategy or organizational flexibility that may be advantageous in a particular market context (Amason, 1996).
Imitability. Many valuable resources are pro- tected from imitation not by property rights, but by knowledge barriers (that is, human capital). Propo- nents of the resource-based view recognize the na- ture of human resources by focusing on their sub- jectivity, ambiguity, and creativity (Kamoche, 1994; Pfeffer, 1994). Human resources, particularly diverse resources, are protected by knowledge bar- riers and appear socially complex because they in- volve a mix of talents that are elusive and hard to understand (Lippman & Rumelt, 1982). Knowl- edge-based resources depend upon large numbers of people or teams engaged in coordinated, creative action providing a firm a competitive advantage (Barney, 1991; Hart, 1995). Therefore, an organiza- tion with a diversity of perspectives should have more resources to draw on and should be more creative and innovative. For example, knowledge- based resources such as cultural diversity allow firms to succeed by giving them the skills needed to adapt products or services to market needs and meet competitive challenges. Advanced capabili- ties accumulate from skills in part because rivals do not know that cultural diversity contributes to suc- cess. It is difficult to discern what in a rival's hu- man resource mix makes it effective; therefore, an effective mix is difficult to imitate. Miller and Shamsie (1996) noted that knowledge-based re- sources may eventually be imitated but that this normally takes time, and by then, the imitated firm may have developed its skills further.
In sum, the value obtainable from a large number of diverse individuals who work together is quite high, and in most cases a given firm's mix is im- possible for competitors to imitate. In addition, the socially complex dynamics in firms with diverse human resources are not transferable across orga- nizations, benefiting only the organization in which the relationships develop. Hence, the value obtained from cultural diversity seems hard to im- itate.
Rarity. A strategic asset must be rare in order to offer sustained competitive advantage (Barney & Wright, 1998; Russo & Fouts, 1997). If it is assumed across firms that cultural diversity as a human cap- ital resource does not create value, when in fact it does, there is tremendous potential for a firm to exploit the rare characteristics of a diverse em- ployee base for competitive advantage. In fact, the typical firm in the 1990s did not address diversity beyond what the Equal Employment Opportunity Commission required (Cox, 1991). Furthermore,
human resource cost to be managed instead of a human resource asset to be fostered. Additionally, since cultural diversity has not been shown to im- pact the bottom line, many companies' top manag- ers do not see the value in it (Robinson & Dechant, 1997; Wright, Ferris, Hiller, & Kroll, 1995).
Not only are firms with diverse employees rare, but also, the representation of racial minorities in the labor market remains sparse. Although the rate of population increase among most racial groups is rapid, in the United States whites still represent about 75 percent of the population (Shinagawa & Jang, 1998). Contributing further to the issue of rarity is that organizations must compete for the individuals within the small, 25 percent minority population with the skills, qualifications, and char- acteristics that add firm value. The resource-based view of the firm gives rise to the following hypoth- esis:
Hypothesis 1. Racial diversity will be positively associated with firm performance.
Hence, those who recognize its benefits have an opportunity to exploit cultural diversity. At the same time, in line with recent resource-based argu- ments (Barney & Wright, 1998; Oliver, 1997), I con- tend that cultural diversity will provide a compet- itive advantage through social complexity at the firm level when it is positioned within the proper context.
Racial Diversity: A Contingency Approach
Recent research suggests the importance of ac- counting for additional contextual variables when investigating the effects of cultural diversity (Chat- man, Polzer, Barsade, & Neale, 1997; Williams & O'Reilly, 1998). Similar arguments have been brought forth concerning the resource-based view. For example, Miller and Shamsie (1996) noted that scholars taking this view should consider the con- texts within which various kinds of resources will have the best influence on performance-for in- stance, comparing predictable and uncertain envi- ronments. The resource-based view does not con- sistently take into account the social context within which resources are embedded (strategy, structure, and environment, for instance) and how context might affect sustainable firm differences (Ginsberg, 1994; Jackson & Schuler, 1995; Oliver, 1997). Bar- ney and Wright (1998) argued that in order for any characteristic of a firm's human resources to be a source of sustained competitive advantage in terms of value, imitability, and rareness, the firm must be positioned to exploit and benefit from the resource.
many organizations have interpreted diversity as a
166 April
Business strategy constitutes one factor that war-
This content downloaded from 69.85.215.194 on Wed, 26 Aug 2015 21:34:03 UTCAll use subject to JSTOR Terms and Conditions

Richard
rants consideration. We can examine the perfor- mance impact that cultural diversity has on firms employing a given business strategy. Companies adopting a growth strategy seek to gain the benefits of transfers of skills such as technical expertise or managerial know-how while spreading risks over a broader base. Internal growth may involve invest- ing in expansion that calls for selling current prod- ucts in additional geographic markets (Pearce, 1982; Suresh & Orna, 1989). Firms that grow in this fashion can benefit from market-related advantages obtained from cultural diversity. Women and racio- ethnic minorities bring insight and cultural sensi- tivity that is pertinent to reaching different market segments as companies enter new markets (Cox, 1994).
A growth strategy can also consist of acquiring additional business divisions. In this case, growth typically involves diversification, which can be de- fined as the acquisition of businesses that are re- lated to current product lines or that offer new products (Pearce, 1982; Suresh & Orna, 1989). A growth strategy should be pursued when an orga- nization has both the capital and the human talent needed to successfully manage an expanded orga- nization. A business pursuing a growth strategy needs employees who are flexible in their thinking and who are not likely to be concerned about de- parting from the status quo (Schuler & Jackson, 1987). McLeod and Lobel's (1992) findings indicate that bicultural individuals possess flexibility in thinking and more ability to use innovative think- ing.
Cultural diversity can provide firms with diverse experience and knowledge (Cox, 1994; McLeod et al., 1996; Priem, Harrison, & Muir, 1995), qualities that seem beneficial for firms with an orientation toward growth. Also, if an organization overcomes resistance to change in the area of accepting diver- sity, it should be well positioned to handle other types of change enabling improved flexibility (Iles & Hayers, 1997). Drawing from the resource-based view of the firm, I posited that the value-in-diver- sity hypothesis holds true for firms employing a growth strategy.
In the financial services industry, for example- particularly banking-rapid growth through merg- ers and acquisitions has resulted in less efficient operations, which have negatively affected firm performance (Hopkins & Hopkins, 1997). Since firms that are growth-oriented face these opera- tional efficiency problems, other firm resources must be exploited. A firm's human capital (which includes the diverse skills, judgment, and abilities of its employees), particularly in a culturally di-
growth-focused firms can exploit. In fact, Wright and colleagues (1995) stated, taking a resource- based view, that certain attributes might benefit one strategy more than another strategy. That is, creativity or flexibility may be of more benefit to a growth strategy than to a downsizing strategy.
For example, pursuit of a downsizing (no or neg- ative growth) strategy promotes efficiency (Cascio, Young, & Morris, 1997; Morris, Cascio, & Young, 1999) and focuses a company on staying lean and mean (Lowe, 1998). Research has shown that al- though diversity in human resources may contrib- ute to the quality of ideas, it also creates additional costs stemming from increased coordination and control (Jehn, 1995; Milliken & Martins, 1996; Wil- liams & O'Reilly, 1998). The additional costs asso- ciated with diversity would be detrimental for downsizing firms. In sum, although diversity may appear appealing for firms with a growth strategy, it does not appear to be beneficial for firms with a downsizing strategy emphasizing cost effective- ness. The following hypothesis emanates from the previous discussion:
Hypothesis 2. The relationship between racial diversity and a firm's performance will be moderated by business strategy: Higher racial diversity will be positively related to firm per- formance when the firm pursues a growth strategy and negatively related to firm perfor- mance when the firm pursues a downsizing strategy.
METHODS
Data
This study was conducted at the firm level in the banking industry. This industry was chosen for several reasons. The industry has undergone tre- mendous changes in recent years in the form of deregulation and technological developments, both providing a much greater opportunity for variety in competitive strategy (Delery & Doty, 1996; Mehra, 1996; Ramaswamy, 1997). Many firms in the bank- ing industry have diversified into new markets to promote growth (Hopkins & Hopkins, 1997). Mar- ket participants have noted that valuable resources, such as human capital, are the most durable source of competitive advantage in the banking industry (Mehra, 1996: 310). An advantage of this industry as a context for study is that government regulators require all banks to submit financial data in a con- sistent manner. I drew a sample of 574 banks from California, Kentucky, and North Carolina, choosing California because of its high racial diversity, Ken-
verse workforce, represents a tangible resource that
2000 167
tucky because of its low racial diversity and asset
This content downloaded from 69.85.215.194 on Wed, 26 Aug 2015 21:34:03 UTCAll use subject to JSTOR Terms and Conditions

Academy of Management Journal
growth, and North Carolina because of its banks' financial prosperity and asset size. The mean num- ber of employees in the banks in the sample was 191, and 30 percent of the companies had over 100 employees.
Financial information was obtained from the Sheshunoff Bank Search database, which contains information from quarterly call reports to the Fed- eral Reserve. I used a questionnaire to solicit hu- man resource information on topics like workforce racial composition and firm attitude toward diver- sity. The questionnaire was pretested and revised according to the comments of ten bank human re- source directors.
Prior to mailing the survey, I obtained the name of the human resource director of each of the 574 banks, and when possible, contacted that person directly. Two rounds, each consisting of a tele- phone contact followed by mailing a survey, a re- minder card, and a follow-up survey if necessary, were initiated.
A response rate of 16 percent of the sampling frame (574 banks) and 20 percent (79) of the 494 surveys initially mailed during round one was ob- tained. By state, the response rate was 76 percent from California, 15 percent from Kentucky, and 9 percent from North Carolina. The overall response rate is similar to those reported in other recent empirical work in the HR management literature (e.g., Delery & Doty, 1996; Youndt, Snell, Dean, & Lepak, 1996). The final sample for the study was 63 banks (47 from California, 10 from Kentucky, and 6 from North Carolina).
Independent Variables
Level of racial diversity. A financial institution that serves as a depository for government funds in any amount, acts as an issuing or redeeming agent for U.S. savings bonds and savings notes in any amount, or subscribes to federal deposit insurance must annually file an EEO-1 Standard Form 100 to demonstrate that certain workers (women and ra- cial minorities) are employed in proportion to their representation in the firm's labor market. Data from these forms can be used to identify possible pat- terns of discrimination in particular organizations or segments of the workforce. The form reports the sex of employees by race (white, black, Hispanic, Asian, and American Indian) across nine hierarchi- cal categories: officials and managers, profession- als, technicians, sales workers, office and clerical workers, craft workers, operatives, laborers, and service workers.
A blank 1995 EEO-1 Standard Form 100 was
and to make sure respondents would report data in the same format. Following previous practice in measuring categorical data (Bantel & Jackson, 1989; Harrison et al., 1998; Murray, 1989), I used Blau's (1977) index of heterogeneity (Herfindahl-Hirsh- man index; Hambrick et al., 1996) to assess the level of homogeneity-heterogeneity: (1 - EPi2), where P is the proportion of group members in a category and i is the number of different categories represented in a firm. For example, the index would have a value of .50 when there are two groups and maximum heterogeneity (50 percent in each group). The index would have a value of .80 when there is maximum heterogeneity with five groups, as in this study (white, black, Hispanic, Asian, and American Indian).
Growth strategy. Asset growth for the fiscal years 1994 and 1995 was taken directly from the Sheshunoff Bank Search database. Asset growth for 1994 was the percentage growth in total assets from year-end 1993 through year-end 1994, and asset growth for 1995 covers year-end 1994 through year- end 1995. This measurement is consistent with pre- vious measurements of a bank's orientation toward growth (Hunter, 1996; Mehra, 1996). Higher per- centages reflect a growth strategy, and negative per- centages reflect asset reduction or a downsizing strategy. To smooth the annual fluctuations for the growth strategy measure produced by the above- normal number of mergers and acquisitions occur- ring in the banking industry, I used a two-year average.
Controls. Eight control variables were used and are discussed below. Firm size was assumed to have a direct effect on financial performance be- cause of economies of scale and market power (Shepherd, 1975; Winn, 1977). Firm size was the logarithmic transformation of the total dollar value of assets. This measure is an established way of accounting for differences in organizational out- comes and has been used in previous bank-related studies (Delery & Doty, 1996; Hopkins & Hopkins, 1997). I transformed the variable to its natural log- arithmic form, following Osterman (1995), to com- bat skewness.
As did Delery and Doty (1996), I added a dummy variable to indicate whether a bank was part of a holding company (1, yes; 0, otherwise). Two dummy variables controlling for state differences were also used (1, California, or 0, other, and 1, Kentucky, or 0, other).
Four other control measures were employed that might be related to the racial diversity index as well as to performance. Previous research has indicated that other demographic variables, particularly gen-
included in the questionnaire to simplify reporting
168 April
der diversity, correlate with racial diversity (Pelled
This content downloaded from 69.85.215.194 on Wed, 26 Aug 2015 21:34:03 UTCAll use subject to JSTOR Terms and Conditions
Richard
et al., 1999). Thus, I controlled for gender diversity, which was also measured by Blau's (1977) index.
Another control variable, the degree of loan port- folio diversity, was used to demonstrate whether a bank was more or less diverse in the range of prod- ucts (or lines of business) it pursued. I calculated this variable as loan portfolio focus index = SPi2, where Pi is the proportion of total loan assets at- tributed to the ith loan category. The Herfindahl- type quantitative index used had a theoretical range of 0 to 1, with a value close to 1 indicating that a bank primarily focused on one type of loan. Banks that operate in diverse product markets might be expected to have more diversity in their employee base.
Additionally, geographic scope might be ex- pected to relate to level of racial diversity. For example, banks that are expanding rapidly into var- ious regions are likely to be more diverse. As a control measure for geographic scope, the branch intensity index was computed as the logarithm of the number of branches divided by total assets; the higher the index, the greater the asset dispersion across the bank's network of branches, and the lower the index, the greater the asset concentration.
The last control was an attitudinal measure con- cerning diversity. I gave the HR directors Carrell and Mann's (1995) survey, Likelihood of Effects of Diversity, in which the question "To what extent do you believe that workforce diversity has had the following effects within your organization?" is fol- lowed by statements like "enhance creativity," "better-decision making," "communication prob- lems," and "personnel turnover." Higher values on this scale are likely to positively correlate with racial diversity.
Dependent Measures
I used three measures to derive a more compre- hensive picture of the impact of cultural diversity on financial performance. Employee productivity is an intermediate output measure. Productivity per employee is an important performance crite- rion in a service organization like a bank because human labor costs are high (Mehra, 1996). Produc- tivity was calculated as the logarithm of net income per employee for year-end 1995. This measure re- flects employee efforts disassociated from varia- tions in product and capital markets (Huselid, 1995; Huselid, Jackson, & Schuler, 1997). Bartel (1994) derived the labor productivity equation em- ployed in this study, which has been used in vari- ous settings (Huselid, 1995; Koch & McGrath, 1996).
Roomkin, and Salsburg (1987) termed outputs, in- cluded return on equity (ROE) for year-end 1996, obtained from the Sheshunoff bank database, and a perceptual measure of market performance. Return on equity, the ultimate measure of the strength of any financial institution (Earle & Mendelson, 1991), is preferred as a measure of a bank's finan- cial performance (Bird, 1991; Hopkins & Hopkins, 1997).
Following Delaney and Huselid (1996), I asked the respondents the following at year-end 1996: "Compared to other organizations that do the same kind of work, how would you compare the organi- zation's performance over the last 3 years in terms of (1) marketing, (2) growth in sales, (3) profitabil- ity, and (4) market share?" This measure allowed a respondent to compare his or her bank's perfor- mance not just to the performance of other banks in the industry but also to the entire group of financial services institutions collectively called depository intermediaries (including, for instance, savings and loans associations and credit unions). Hence, this measure captured something distinct from what the two objective measures captured. Responses were measured on a four-point Likert scale ranging from 1, "worse," to 4, "much better." The scale alpha was .81. This perceptual bottom-line measure was associated with both objective measures, return on equity (r = .40, p < .01) and employee productivity (r = .37, p < .01).
Analyses
The analyses used to test the hypotheses in the current study relied on data from two sources and thus were based on different sample sizes. First, I conducted an analysis to check for response bias. The objective was to assess whether characteristics of individual banks made their HR managers less likely to complete and return the survey.
Following the work of Osterman (1994) and of Delery and Doty (1996), I employed logistic regres- sion analysis, with the dependent variable defined as a dummy variable coded 1 if the HR director responded and 0 if he or she did not. The indepen- dent variables included the two state controls, growth strategy (asset growth), total assets, produc- tivity, net income, and ROE.
Only one of the dummy variables for state was significant. Banks in California were more likely to have responded than banks in Kentucky and North Carolina. I then used two procedures to assess the extent of state-driven response bias. First, the Cal- ifornia data only were analyzed. This analysis re- vealed that the form and strength of the hypothe- sized effects were similar to those for the full
2000 169
Bottom-line measures, or what Block, Kleiner,
This content downloaded from 69.85.215.194 on Wed, 26 Aug 2015 21:34:03 UTCAll use subject to JSTOR Terms and Conditions

Academy of Management Journal
sample but were not statistically significant for pro- ductivity (adjusted R2 = .20; diversity, X3 = -0.14, t = -0.98, p = .33; diversity x strategy, 3 = 0.43, t = 1.08, p = .29) and return on equity (adjusted R2 = .08; diversity, 3 = -0.06, t = -0.39, p = .69; diversity X strategy, j3 = 0.26, t = .60, p = .55). For market performance, the result for California was marginally significant but not as significant as the full sample result (adjusted R2 = .14; diversity, f3 = -0.17, t = -1.05, p = .30; diversity X strategy, f = 0.92, t = 1.97, p = .06). Second, I estimated the model using the full sample with interaction terms for the two state dummies (for instance, California by growth), rather than racial diversity by growth, for the following: productivity (California x strat- egy, /3 = 1.33, t = 1.38, p = .17; Kentucky x strategy, (3 = 1.45, t = 0.92, p = .36); return on equity (California X strategy, f = 0.30, t = 0.28, p = .78; Kentucky x strategy, f = -0.11, t = -0.07, p = .95); and market performance (California x strat- egy, 3 = -0.24, t = -0.22, p = .82; Kentucky x strategy, 3 = -0.91, t = -0.51, p = .61). Neither interaction term was significant. Taken together, the results of these two procedures provide con- vincing evidence that there was no significant response bias by state. Nevertheless, to account
for any state-driven results stemming from re- sponse bias, I used the two state dummies in all statistical analyses. No response bias was found for the remaining variables. Table 1 summarizes the descriptive statistics for all study variables for each state.
Descriptive statistics and results from one-way analyses of variance (ANOVAs) by state across level of racial diversity and asset size reveal that the sampling reflected these differences among states. The table also shows that Kentucky banks were more likely to belong to holding companies and to offer wider varieties of loans than California and North Carolina banks and that banks in Cali- fornia provided more favorable assessments of di- versity effects than the other states' banks. These findings provide more support for the use of these variables as controls.
As in recent strategic human resource manage- ment research (Delery & Doty, 1996; Wright et al., 1995; Youndt et al., 1996), the hypotheses were tested with hierarchical regression analyses. First, I entered all the control variables. Racial diversity was entered in the second step as a test of Hypoth- esis 1. Business strategy, the moderating variable, was entered in the third step, and the interaction
TABLE 1 Descriptive Statistics by Statea
North ANOVA Variable California Kentucky Carolina Total Sample F
Asset size 11.68 12.06 12.28 11.80 0.84 1.17 1.66 2.27 1.38
Holding company 0.35 0.75 0.57 0.44 3.64* 0.48 0.45 0.53 0.50
Gender diversity 0.36 0.35 0.33 0.36 0.58 8.44 (E-.02) 6.07 (E-.02) 7.76 (E-.02) 8.01 (E-.02)
Loan focus 0.80 0.44 0.75 0.74 4.43* 0.43 9.84 (E-.02) 0.22 0.40
Branch intensity 2.65 (E-.05) 2.31 (E-.05) 2.82 (E-.05) 2.61 (E-.05) 0.04 4.63 (E-.05) 1.26 (E-.05) 1.97 (E-.05) 4.05 (E-.05)
Likelihood of 32.63 19.12 17.00 26.92 19.84** diversity effects
9.64 2.98 3.11 10.51 Growth 7.87 23.34 5.58 10.01 3.06'
12.82 41.88 4.70 20.12 Racial diversity 0.37 8.09 (E-.02) 9.96 (E-.02) 0.30 20.77**
0.16 0.10 0.11 0.19 Productivity 17.00 29.29 28.14 20.07 1.94
24.41 17.35 11.69 22.88 Return on equity 8.94 15.94 10.97 10.21 1.14
15.70 7.12 4.50 14.12 Market performance 2.90 3.30 3.21 2.99 2.25
0.68 0.47 0.42 0.65
a From left, Ns = 47, 10, 6, and 63. Values are means (above) and standard deviations (below). X(E-y) = X(10-Y). +p < .10 * p < .05
** p < .01
April 170
This content downloaded from 69.85.215.194 on Wed, 26 Aug 2015 21:34:03 UTCAll use subject to JSTOR Terms and Conditions
Richard
between racial diversity and strategy was entered in the fourth step, as a test of Hypothesis 2. This procedure measured change in the level of ex- plained variation before and after the variables of interest were added to the control variables.
RESULTS
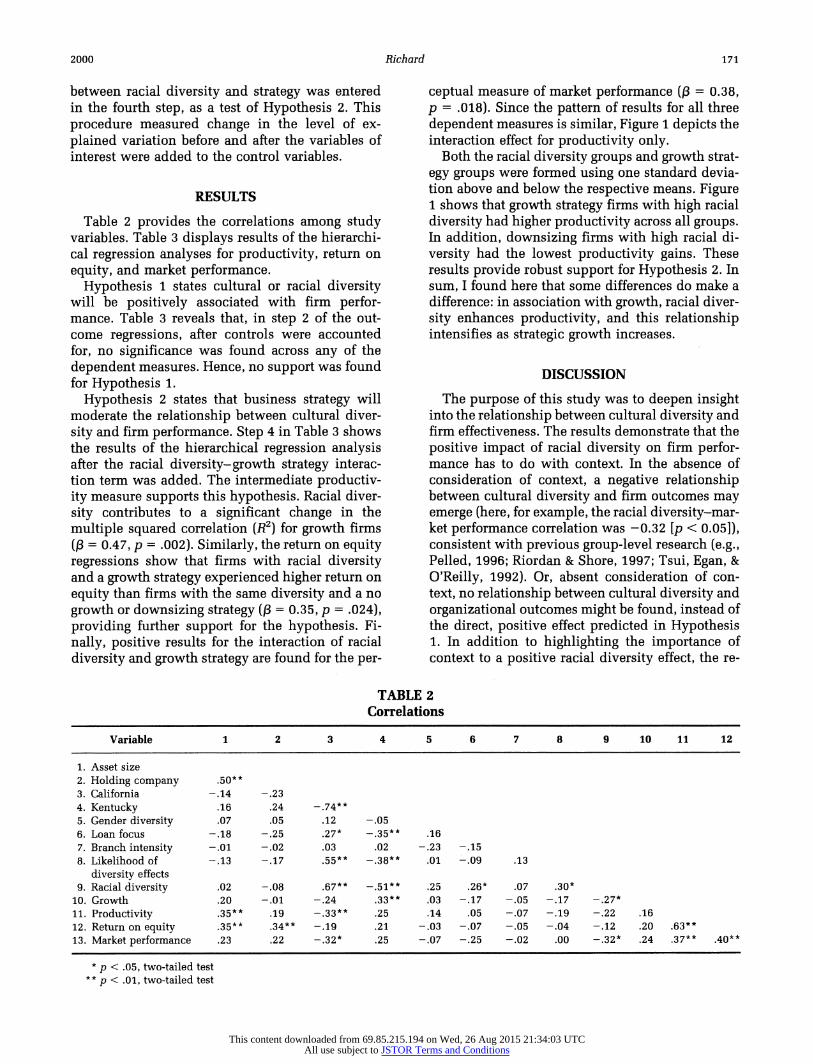
Table 2 provides the correlations among study variables. Table 3 displays results of the hierarchi- cal regression analyses for productivity, return on equity, and market performance.
Hypothesis 1 states cultural or racial diversity will be positively associated with firm perfor- mance. Table 3 reveals that, in step 2 of the out- come regressions, after controls were accounted for, no significance was found across any of the dependent measures. Hence, no support was found for Hypothesis 1.
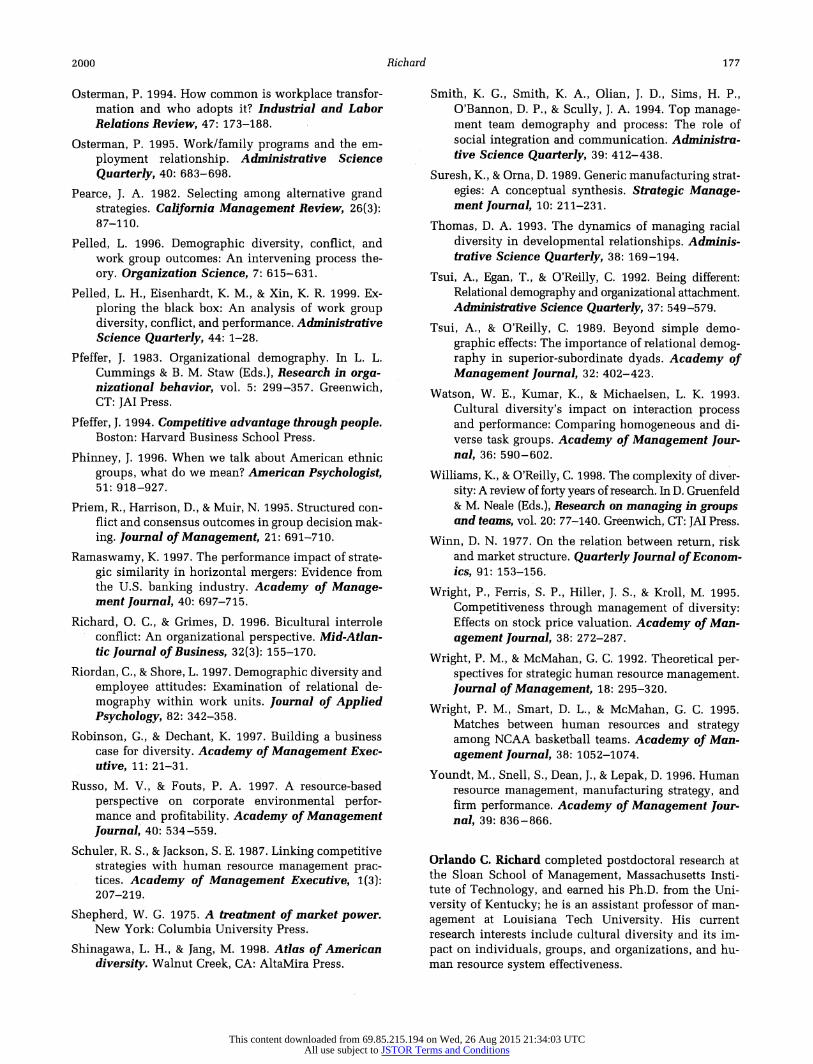
Hypothesis 2 states that business strategy will moderate the relationship between cultural diver- sity and firm performance. Step 4 in Table 3 shows the results of the hierarchical regression analysis after the racial diversity-growth strategy interac- tion term was added. The intermediate productiv- ity measure supports this hypothesis. Racial diver- sity contributes to a significant change in the multiple squared correlation (R2) for growth firms (,3 = 0.47, p = .002). Similarly, the return on equity regressions show that firms with racial diversity and a growth strategy experienced higher return on equity than firms with the same diversity and a no growth or downsizing strategy (,3 = 0.35, p = .024), providing further support for the hypothesis. Fi- nally, positive results for the interaction of racial diversity and growth strategy are found for the per-
ceptual measure of market performance ((3 = 0.38, p = .018). Since the pattern of results for all three dependent measures is similar, Figure 1 depicts the interaction effect for productivity only.
Both the racial diversity groups and growth strat- egy groups were formed using one standard devia- tion above and below the respective means. Figure 1 shows that growth strategy firms with high racial diversity had higher productivity across all groups. In addition, downsizing firms with high racial di- versity had the lowest productivity gains. These results provide robust support for Hypothesis 2. In sum, I found here that some differences do make a difference: in association with growth, racial diver- sity enhances productivity, and this relationship intensifies as strategic growth increases.
DISCUSSION
The purpose of this study was to deepen insight into the relationship between cultural diversity and firm effectiveness. The results demonstrate that the positive impact of racial diversity on firm perfor- mance has to do with context. In the absence of consideration of context, a negative relationship between cultural diversity and firm outcomes may emerge (here, for example, the racial diversity-mar- ket performance correlation was -0.32 [p < 0.05]), consistent with previous group-level research (e.g., Pelled, 1996; Riordan & Shore, 1997; Tsui, Egan, & O'Reilly, 1992). Or, absent consideration of con- text, no relationship between cultural diversity and organizational outcomes might be found, instead of the direct, positive effect predicted in Hypothesis 1. In addition to highlighting the importance of context to a positive racial diversity effect, the re-
TABLE 2 Correlations
Variable 1 2 3 4 5 6 7 8 9 10 11 12
1. Asset size 2. Holding company .50** 3. California -.14 -.23 4. Kentucky .16 .24 -.74** 5. Gender diversity .07 .05 .12 -.05 6. Loan focus -.18 -.25 .27* -.35** .16 7. Branch intensity -.01 -.02 .03 .02 -.23 -.15 8. Likelihood of -.13 -.17 .55** -.38** .01 -.09 .13
diversity effects 9. Racial diversity .02 -.08 .67** -.51** .25 .26* .07 .30*
10. Growth .20 -.01 -.24 .33** .03 -.17 -.05 -.17 -.27* 11. Productivity .35** .19 -.33** .25 .14 .05 -.07 -.19 -.22 .16 12. Return on equity .35** .34** -.19 .21 -.03 -.07 -.05 -.04 -.12 .20 .63** 13. Market performance .23 .22 -.32* .25 -.07 -.25 -.02 .00 -.32* .24 .37** .40**
* p < .05, two-tailed test ** p < .01, two-tailed test
2000 171
This content downloaded from 69.85.215.194 on Wed, 26 Aug 2015 21:34:03 UTCAll use subject to JSTOR Terms and Conditions

Academy of Management Journal
TABLE 3 Results of Simultaneous Hierarchical Regression Analysis for Outcomes
Productivity Return on Equity Market Performance
Variable (3 b s.e. (3 b s.e. (3 b s.e.
Step 1 AR2 .26* .20t .20t
Control Asset size 0.36** 6.66** 2.52 0.26* 3.00* 1.63 0.16 0.01 0.08 Holding company -0.04 -1.77 6.71 0.21t 6.13t 4.33 0.07 0.01 0.20 California -0.36* -19.95* 10.69 -0.11 -3.58 6.90 -0.40* -0.60* 0.32 Kentucky 0.04 2.56 11.85 0.12 4.75 7.65 -0.03 -0.01 0.35 Gender diversity 0.11 33.59 36.81 -0.06 -10.37 23.76 -0.04 -0.36 1.10 Loan focus 0.26* 14.78* 7.90 0.13 4.56 5.10 -0.09 -0.14 0.24 Branch intensity -0.02 -10,171.83 68,930.58 -0.06 -21,251.42 44,498.28 -0.06 -932.28 2,051.17 Likelihood of 0.13 0.28 0.31 0.14 0.19 0.20 0.25' 0.00 0.01
diversity effects
Step 2 AR2 .02 .01 .02
Main effect Racial diversity -0.16 -20.08 19.16 -0.09 -7.12 12.46 -0.21 -0.70 0.62
Step 3 AR2 .00 .02 .02
Moderator Growth strategy 0.06 0.01 0.15 0.14 0.10 0.10 0.15 0.00 0.00
Step 4 AR2 .13** .07* .09**
Interaction Diversity x 0.47** 2.48** 0.74 0.35* 1.16* 0.50 0.38** 0.06** 0.02
strategy
Model F 3.15** 1.92t 2.05* Constant -50.83 32.63 -16.03 22.10 2.09 0.99 Adjusted R2 .28 .14 .17 n 63 63 59
+ p < .10, two-tailed test *
p < .05, two-tailed test ** p < .01, two-tailed test
sults also shed light on the organizational contexts in which human resource diversity may impede firm performance. Diversity can increase coordina- tion costs, and the leaders of no growth or negative growth firms should be particularly aware of the performance implications of a clash between diver- sity and downsizing. In sum, the same resources that offer some firms competitive advantage can be a performance detriment to others.
The findings from this study make several con- tributions to the literature. First, this was a field study that supplements the few laboratory stud- ies that have also shown benefits of cultural di- versity. Although most research has measured diversity at the group level, this study extended the level of analysis to the organizational level. Second, past research has been unable to opera- tionally define race to the extent achieved in this study. Many studies have put racial minorities in one group and whites in the other group, a divi- sion that does not fully capture the diversity of racial groups (Kim, Park, & Suzuki, 1990; Phin-
ney, 1996; Riordan & Shore, 1997). There are similarities of experience across minority groups, but there are also important differences, and these need to be recognized. Third, multiple mea- sures taken at both the intermediate and bottom- line levels enhance confidence in findings of causal direction between cultural diversity and organizational effectiveness (Becker & Gerhart, 1996). Given only one measure of performance, one could argue that the high-profit effect led to increased racial diversity instead of racial diver- sity's leading to higher profits. Since these find- ings show some consistency as well as differen- tiation among multiple performance measures, the results are more credible. Nevertheless, fu- ture work should include longitudinal data to obtain a more direct assessment of causality.
Research Implications
The opportunity remains to investigate the rela- tionship between firm performance and other di-
April 172
This content downloaded from 69.85.215.194 on Wed, 26 Aug 2015 21:34:03 UTCAll use subject to JSTOR Terms and Conditions

Richard
FIGURE 1 Interaction Results
Hi
Growth Strategy
Downsizing Strategy
igh
Racial Diversity
mensions of cultural diversity, such as gender and age. This study specifically addressed racial diver- sity within the United States; research on how cul- tural diversity might impact organizations in a global context is still needed.
Future research could benefit not only from ar- ticulating but also from measuring the processes or intervening variables (for instance, creativity, flex- ibility) that are posited to mediate the relationship between diversity and firm performance. Although several scholars have offered demographic process theories, very few empirical studies have been con- ducted (Pelled, 1996; Smith, Smith, Olian, Sims, O'Bannon, & Scully, 1994; Williams & O'Reilly, 1997).
In future work, researchers should also extend the resource-based view by seeking to explain un- der what conditions racial diversity may improve or weaken firm performance. Gaertner, Mann, Dovidio, Murrell, and Pomare (1990) noted that a sense of cooperation and teamwork within a larger group (an organization) reduces intergroup bias on such dimensions as race and gender. Chatman and Barsade (1995) discussed how organizational cul- tures that foster cooperation and commitment can be created. Using a business simulation, Chatman and her coauthors (1997) found that organizational culture moderated the effects of diversity; conflict arising from group heterogeneity appeared to be seen as more beneficial in groups with a collectiv- istic organizational culture. O'Reilly and his col-
leagues (1997) also found that an organizational culture supporting racial diversity improved group performance. Future research should explore these relationships at the firm level.
Also, Kossek, Zonia, and Young (1996) found that organizational demographic approaches fo- cused on increasing diversity were necessary but insufficient strategies for firms to employ to reap some of the benefits of diversity, such as creativity and flexibility. They noted that cultural diversity will likely be beneficial if systems are devised that alter the design of jobs and the structure of work- places and foster intergroup teamwork. Thus, the nature of a firm's human resource system repre- sents another critical contextual factor that should be considered.
In addition, as companies become more cultur- ally diverse, they can socialize newcomers through diversity initiatives to identify with positive, dis- tinctive, and enduring characteristics of an organi- zation or organizational subunit (Richard & Grimes, 1996). Identification enables new employees to de- velop loyalty to an organization and support it (Ashforth & Mael, 1989). Cox (1991) suggested that firms, particularly multicultural organizations, need new employee diversity orientation programs that create a two-way socialization process, ensur- ing that (1) bias is reduced and (2) minority per- spectives influence organizational norms and val- ues. Thus, the contingent role of diversity practices warrants attention.
40-
30-
20-
Estimated Marginal
Mean Productivity
10-
0-
-10-
-20 -
Low
5u
- 'it)
2000 173
This content downloaded from 69.85.215.194 on Wed, 26 Aug 2015 21:34:03 UTCAll use subject to JSTOR Terms and Conditions

Academy of Management Journal
The arguments made in this work can be ex- tended to broader considerations, such as industry, environment, and political/legal influences. For ex- ample, do service organizations tend to benefit more from diversity than manufacturing firms, given that a range of insights and cultural sensitiv- ity are likely needed in service marketing? Do firms operating in turbulent environments rather than stable ones benefit more from the flexibility of a diverse workforce? Other interesting research ques- tions will undoubtedly emerge as diversity theory is extended.
Limitations
Because of the sample size in this research, the level of diversity-firm performance contingency re- lations could only be tested for entire organiza- tions. A larger sample would allow for an individ- ual test for each occupation shown on the EEO-1 form (technical worker, official, manager, and so forth). Research investigating top management group heterogeneity could benefit from such data. In addition, sampling from larger organizations (firms employing more than 100 employees) in- creases the probability of finding individuals in each job class. Although firms of this size com- posed part of my sample, many of the studied firms were smaller. Nevertheless, even with the big sam- pling pool larger organizations provide, it will be a challenge for researchers to obtain high response rates for sensitive information concerning cultural diversity. Secondly, sample bias by state was evi- dent in this study. Although California banks com- prised the majority of the sample, their preponder- ance did not appear to bias the results considerably. I conclude that companies that do not have much workforce cultural diversity are not likely to make diversity a high priority and may therefore not respond to such surveys. This situa- tion is problematic because there is a need to in- clude firms with low diversity to achieve variance within samples. Researchers conducting future studies should consider this potential problem dur- ing the data collection phase. Third, future research should include as many demographic variables as possible. Although I did control for gender effects, other diversity dimensions that could account for additional variance, such as age and education, need to be isolated. Lastly, the results from this study cannot be generalized to other industries. The current findings need to be validated in other settings to rule out industry as an important con- tingency factor. However, I argue that in the early stages of diversity theory testing, within-industry
key relationships can be identified with a limited number of potential confounds.
CONCLUSION
The results of this study have implications for human resource management and diversity prac- tice. From a practical standpoint, the findings begin to answer a meaningful question for both academi- cians and executives: How does diversity affect the bottom line? The results of this study suggest that neither interest group is likely to see a direct, pos- itive relationship between cultural diversity and firm performance. Instead, the effects are likely to be determined by the strategies a firm pursues and by how organization leaders and participants re- spond to and manage diversity.
The results also highlight the importance of hu- man capital as a strategic asset and reflect the value of people in firms and their role in obtaining com- petitive advantage for organizations. Hence, human resource practitioners can add value not only through the implementation of particular human resource management practices (e.g., Delery & Doty, 1996; Huselid, 1995), but also by generating a cultural mix in the human resource base.
Human resource managers also need a better knowledge of business strategy and other areas tra- ditionally beyond the HR domain in order to make cultural diversity deliver. If they meet this chal- lenge, they can take advantage of what cultural diversity and its management offer their organiza- tions. Given present-day reductions in formal ex- ternal pressures like equal opportunity opportunity and affirmative action mandates, it is up to the human resource executives and other top-level of- ficials of U.S. organizations to take a proactive stance toward promoting cultural diversity-not only for the sake of corporate social performance, but also in the interests of corporate financial per- formance.
REIERENCES
Amason, A. 1996. Distinguishing the effects of functional and dysfunctional conflict on strategic decision making: Resolving a paradox for top management teams. Academy of Management Journal, 39: 123- 148.
Ashforth, B. E., & Mael, F. 1989. Social identity theory and the organization. Academy of Management Re- view, 14: 20-39.
Bantel, K., & Jackson, S. E. 1989. Top management and innovations in banking: Does the composition of the top management team make a difference? Strategic
studies should continue as the starting point so that
174 April
Management Journal, 10: 107-124.
This content downloaded from 69.85.215.194 on Wed, 26 Aug 2015 21:34:03 UTCAll use subject to JSTOR Terms and Conditions

Richard
Barney, J. B. 1991. Firm resources and sustained compet- itive advantage. Journal of Management, 17: 99- 120.
Barney, J. B., & Wright, P. M. 1998. On becoming a strategic partner: The role of human resources in gaining competitive advantage. Human Resource Management, 37: 31-46.
Bartel, A. P. 1994. Productivity gains from the implemen- tation of employee training programs. Industrial Re- lations, 33: 411-422.
Becker, B., & Gerhart, B. 1996. The impact of human resource management on organizational perfor- mance: Progress and prospects. Academy of Man- agement Journal, 39: 779-801.
Bird, A. 1991. A 1990s twist on strategic planning. Bank- ers Magazine, 174(2): 66-69.
Blau, P. M. 1977. Inequality and heterogeneity. New York: Free Press.
Block, R. N., Kleiner, M. M., Roomkin, M., & Salsburg, S. W. 1987. Industrial relations and the performance of the firm: An overview. Industrial Relations: 319- 343.
Carrell, M. R., & Mann, E. E. 1995. Defining workforce diversity in public sector organizations. Public Per- sonnel Management, 24(1): 99-113.
Cascio, W. F., Young, C. E., & Morris, J. R. 1997. Financial consequences of employment-change decisions in major U.S. corporations. Academy of Management Journal, 40: 1175-1189.
Chatman, J., & Barsade, S. 1995. Personality, organiza- tional culture, and cooperation: Evidence from a business simulation. Administrative Science Quar- terly, 40: 423-443.
Chatman, J., Polzer, J., Barsade, S., & Neale, M. 1997. The influence of demographic composition and organi- zational culture on work processes and outcomes in a business simulation. Working paper, Haas School of Business, University of California, Berke- ley.
Cox, T. 1991. The multicultural organization. Academy of Management Executive, 5(2): 34-47.
Cox, T. 1994. Cultural diversity in organizations: The- ory, research, and practice. San Francisco: Berrett- Koehler.
Cox, T., & Blake, S. 1991. Managing cultural diversity: Implications for organizational competitiveness. Academy of Management Executive, 5(3): 45-56.
Cox, T., Lobel, S. A., & McLeod, P. L. 1991. Effects of ethnic group cultural differences on cooperative and competitive behavior on a group task. Academy of Management Journal, 4: 827-847.
Delaney, J. T., & Huselid, M. A. 1996. The impact of human resource management practices on percep- tions of organizational performance. Academy of
Delery, J. E., & Doty, D. H. 1996. Theoretical frameworks in strategic human resource management: Universal- istic, contingency, and configurational perspectives. Academy of Management Journal, 39: 802-835.
Dwyer, S., Richard, O., & Shepherd, D. 1998. An explor- atory study of gender and age matching in the sales- person-prospective customer dyad: Testing similari- ty-performance predictions. Journal of Personal Selling and Sales Management, 18(4): 55-71.
Earle, D. M., & Mendelson, M. 1991. The critical mesh in strategic planning. Bankers Magazine, 174(3): 48- 53.
Gaertner, S., Mann, J., Dovidio, J., Murrell, A., & Pomare, M. 1990. How does cooperation reduce intergroup bias? Journal of Personality and Social Psychology, 59: 692-704.
Ginsberg, A. 1994. Minding the competition: From map- ping to mastery. Strategic Management Journal, 15: 153-174.
Hambrick, D. C. 1994. Top management team groups: A conceptual integration and reconsideration of the "team" label. In B. M. Staw & L. L. Cummings (Eds.), Research in organizational behavior, vol. 16: 171- 214. Greenwich, CT: JAI Press.
Hambrick, D. C., Cho, T. S., & Chen, M. 1996. The influ- ence of top management team heterogeneity on firms' competitive moves. Administrative Science Quarterly, 41: 659-684.
Hambrick, D. C., & Mason, P. A. 1984. Upper echelons: The organization as a reflection of its top managers. Academy of Management Review, 9: 193-206.
Harrison, D. A., Price, K. H., & Bell, M. P. 1998. Beyond relational demography: Time and the effects of sur- face- and deep-level diversity on work group cohe- sion. Academy of Management Journal, 41: 96- 107.
Hart, S. L. 1995. The natural-resource-based view of the firm. Academy of Management Review, 20: 986- 1014.
Hopkins, W. E., & Hopkins, S. A. 1997. Strategic plan- ning-financial performance relationships in banks: A causal examination. Strategic Management Jour- nal, 18: 635-652.
Hunter, L. W. 1996. When fit doesn't happen: The limits of business strategy as an explanation for varia- tion in human resource practices. Paper presented at the 56th Annual Meeting of the Academy of Man- agement, Cincinnati.
Huselid, M. A. 1995. The impact of human resource management on turnover, productivity, and corpo- rate performance. Academy of Management Jour- nal, 38: 635-672.
Huselid, M. A., Jackson, S. E., & Schuler, R. S. 1997. Technical and strategic human resource manage- ment effectiveness as determinants of firm perfor-
2000 175
Management Journal, 39: 749-770.
This content downloaded from 69.85.215.194 on Wed, 26 Aug 2015 21:34:03 UTCAll use subject to JSTOR Terms and Conditions

Academy of Management Journal
mance. Academy of Management Journal, 40: 171- 188.
Iles, P., & Hayers, P. K. 1997. Managing diversity in transnational project teams: A tentative model and case study. Journal of Managerial Psychology, 12(2): 95-117.
Jackson, S. 1992. Consequences of group composition for the interpersonal dynamics of strategic issue pro- cessing. In P. Shrivastava, A. Huff, & J. Dutton (Eds.), Advances in strategic management, vol. 8: 345- 382. Greenwich, CT: JAI Press.
Jackson, S., & Schuler, R. S. 1995. Understanding human resource management in the context of organizations and their environments. In J. T. Spence, J. M. Darley, & D. J. Foss (Eds.), Annual review of psychology, vol. 46: 237-264. Palo Alto, CA: Annual Reviews.
Jackson, S., Stone, V., & Alvarez, E. 1993. Socialization amidst diversity: The impact of demographics on work team oldtimers and newcomers. In L. L. Cum-
mings & B. M. Staw (Eds.), Research in organiza- tional behavior, vol. 15: 45-109. Greenwich, CT: JAI Press.
Jehn, K. 1995. A multimethod examination of the bene- fits and detriments of intragroup conflict. Adminis- trative Science Quarterly, 40: 256-282.
Kamoche, K. 1994. A critique and a proposed reformula- tion of strategic human resource management. Hu- man Resource Management Journal, 4(4):29-43.
Kim, K., Park, H., & Suzuki, N. 1990. Reward allocations in the United States, Japan, and Korea: A comparison of individualistic and collectivistic cultures. Acad-
emy of Management Journal, 33: 188-198.
Koch, M. J., & McGrath, R. G. 1996. Improving labor
productivity: Human resource management policies do matter. Strategic Management Journal, 17: 335- 354.
Kossek, E. E., & Zonia, S. C. 1993. Assessing diversity climate: A field study of reactions to employer ef- forts to promote diversity. Journal of Organiza- tional Behavior, 14: 61-81.
Kossek, E. E., Zonia, S. C., & Young, W. 1995. The limi- tations of organizational demography. Paper pre- sented at the conference "Work Team Dynamics and
Productivity in the Context of Diversity," Center for Creative Leadership and the American Psychological Association, Greensboro, NC.
Lado, A. A., Boyd, N. G., & Wright, P. 1992. A competen- cy-based model of sustainable competitive advan- tage: Toward a conceptual integration. Journal of Management, 18: 77-91.
Linville, P., & Jones, E. 1980. Polarized appraisals of outgroup members. Journal of Personality and So- cial Psychology, 38: 689-703.
Lippman, S. A., & Rumelt, R. 1982. Uncertain imitability:
der competition. Bell Journal of Economics, 13: 418-438.
Lowe, K. B. 1998. Downsizing and firm performance: Panacea or paradise lost? Academy of Management Executive, 12(4): 130-131.
McLeod, P., & Lobel, S. 1992. The effects of ethnic diversity on idea generation in small groups. Paper presented at the annual meeting of the Academy of Management, Las Vegas.
McLeod, P. L., Lobel, S. A., & Cox, T. H., Jr. 1996. Ethnic diversity and creativity in small groups. Small Group Research, 27: 246-264.
Mehra, A. 1996. Resource and market based determi- nants of performance in the U.S. banking industry. Strategic Management Journal, 17: 307-322.
Miller, D., & Shamsie, J. 1996. The resource-based view of the firm in two environments: The Hollywood film studios from 1936 to 1965. Academy of Man- agement Journal, 39: 519-543.
Milliken, F., & Martins, L. 1996. Searching for common threads: Understanding the multiple effects of diver- sity in organizational groups. Academy of Manage- ment Review, 21: 402-433.
Morris, J. R., Cascio, W. F., & Young, C. E. 1999. Down- sizing after all these years: Questions and answers about who did it, how many did it, and who bene- fited from it. Organizational Dynamics, 27(3): 78- 87.
Morrison, A. M. 1992. The new leaders: Guidelines on leadership diversity in America. San Francisco:
Jossey-Bass.
Murray, A. 1989. Top management group heterogeneity and firm performance. Strategic Management Jour- nal, 10: 125-141.
Nemeth, C. J. 1992. Minority dissent as a stimulant to group performance. In S. Worchel, W. Wood, & J. A. Simpson (Eds.), Group process and productivity: 95-111. Newbury Park, CA: Sage.
Nkomo, S. M. 1992. The emperor has no clothes: Rewrit-
ing "race in organization." Academy of Manage- ment Review, 17: 487-513.
'
Oliver, C. 1997. Sustainable competitive advantage: Combining institutional and resource-based views. Strategic Management Journal, 18: 697-713.
O'Reilly, C., Caldwell, D., & Barnett, W. 1989. Work group demography, social integration, and turnover. Administrative Science Quarterly, 34: 21-37.
O'Reilly, C., & Flatt, S. 1989. Executive team demogra- phy, organizational innovation, and firm perfor- mance. Paper presented at the 49th Annual Meeting of the Academy of Management, Washington, DC.
O'Reilly, C., Williams, K., & Barsade, S. 1997. Demogra- phy and group performance: Does diversity help? Paper presented at the annual meeting of the Acad-
An analysis of interfirm differences in efficiency un-
April 176
emy of Management, Boston.
This content downloaded from 69.85.215.194 on Wed, 26 Aug 2015 21:34:03 UTCAll use subject to JSTOR Terms and Conditions
Richard
Osterman, P. 1994. How common is workplace transfor- mation and who adopts it? Industrial and Labor Relations Review, 47: 173-188.
Osterman, P. 1995. Work/family programs and the em- ployment relationship. Administrative Science Quarterly, 40: 683-698.
Pearce, J. A. 1982. Selecting among alternative grand strategies. California Management Review, 26(3): 87-110.
Pelled, L. 1996. Demographic diversity, conflict, and work group outcomes: An intervening process the- ory. Organization Science, 7: 615-631.
Pelled, L. H., Eisenhardt, K. M., & Xin, K. R. 1999. Ex- ploring the black box: An analysis of work group diversity, conflict, and performance. Administrative Science Quarterly, 44: 1-28.
Pfeffer, J. 1983. Organizational demography. In L. L. Cummings & B. M. Staw (Eds.), Research in orga- nizational behavior, vol. 5: 299-357. Greenwich, CT: JAI Press.
Pfeffer, J. 1994. Competitive advantage through people. Boston: Harvard Business School Press.
Phinney, J. 1996. When we talk about American ethnic groups, what do we mean? American Psychologist, 51: 918-927.
Priem, R., Harrison, D., & Muir, N. 1995. Structured con- flict and consensus outcomes in group decision mak- ing. Journal of Management, 21: 691-710.
Ramaswamy, K. 1997. The performance impact of strate- gic similarity in horizontal mergers: Evidence from the U.S. banking industry. Academy of Manage- ment Journal, 40: 697-715.
Richard, 0. C., & Grimes, D. 1996. Bicultural interrole conflict: An organizational perspective. Mid-Atlan- tic Journal of Business, 32(3): 155-170.
Riordan, C., & Shore, L. 1997. Demographic diversity and employee attitudes: Examination of relational de- mography within work units. Journal of Applied Psychology, 82: 342-358.
Robinson, G., & Dechant, K. 1997. Building a business case for diversity. Academy of Management Exec- utive, 11: 21-31.
Russo, M. V., & Fouts, P. A. 1997. A resource-based perspective on corporate environmental perfor- mance and profitability. Academy of Management Journal, 40: 534-559.
Schuler, R. S., & Jackson, S. E. 1987. Linking competitive strategies with human resource management prac- tices. Academy of Management Executive, 1(3): 207-219.
Shepherd, W. G. 1975. A treatment of market power. New York: Columbia University Press.
Shinagawa, L. H., & Jang, M. 1998. Atlas of American diversity. Walnut Creek, CA: AltaMira Press.
Smith, K. G., Smith, K. A., Olian, J. D., Sims, H. P., O'Bannon, D. P., & Scully, J. A. 1994. Top manage- ment team demography and process: The role of social integration and communication. Administra- tive Science Quarterly, 39: 412-438.
Suresh, K., & Orna, D. 1989. Generic manufacturing strat- egies: A conceptual synthesis. Strategic Manage- ment Journal, 10: 211-231.
Thomas, D. A. 1993. The dynamics of managing racial diversity in developmental relationships. Adminis- trative Science Quarterly, 38: 169-194.
Tsui, A., Egan, T., & O'Reilly, C. 1992. Being different: Relational demography and organizational attachment. Administrative Science Quarterly, 37: 549-579.
Tsui, A., & O'Reilly, C. 1989. Beyond simple demo- graphic effects: The importance of relational demog- raphy in superior-subordinate dyads. Academy of Management Journal, 32: 402-423.
Watson, W. E., Kumar, K., & Michaelsen, L. K. 1993. Cultural diversity's impact on interaction process and performance: Comparing homogeneous and di- verse task groups. Academy of Management Jour- nal, 36: 590-602.
Williams, K., & O'Reilly, C. 1998. The complexity of diver- sity: A review of forty years of research. In D. Gruenfeld & M. Neale (Eds.), Research on managing in groups and teams, vol. 20: 77-140. Greenwich, CT: JAI Press.
Winn, D. N. 1977. On the relation between return, risk and market structure. Quarterly Journal of Econom- ics, 91: 153-156.
Wright, P., Ferris, S. P., Hiller, J. S., & Kroll, M. 1995. Competitiveness through management of diversity: Effects on stock price valuation. Academy of Man- agement Journal, 38: 272-287.
Wright, P. M., & McMahan, G. C. 1992. Theoretical per- spectives for strategic human resource management. Journal of Management, 18: 295-320.
Wright, P. M., Smart, D. L., & McMahan, G. C. 1995. Matches between human resources and strategy among NCAA basketball teams. Academy of Man- agement Journal, 38: 1052-1074.
Youndt, M., Snell, S., Dean, J., & Lepak, D. 1996. Human resource management, manufacturing strategy, and firm performance. Academy of Management Jour- nal, 39: 836-866.
Orlando C. Richard completed postdoctoral research at the Sloan School of Management, Massachusetts Insti- tute of Technology, and earned his Ph.D. from the Uni- versity of Kentucky; he is an assistant professor of man- agement at Louisiana Tech University. His current research interests include cultural diversity and its im- pact on individuals, groups, and organizations, and hu- man resource system effectiveness.
2000 177
This content downloaded from 69.85.215.194 on Wed, 26 Aug 2015 21:34:03 UTCAll use subject to JSTOR Terms and Conditions