Race, Risk, and Resilience - Destabyn
39
Transcript of Race, Risk, and Resilience - Destabyn


Race, Risk, and Resilience
2
Report Researchers Gale Seiler, Ph.D.
Faith Shamonda, B.A.
Kelly Thompson, B.S.W.
Participating Project Partners
Research Steering Committee: Howard Nadler (Batshaw), Marie-Josée Roy (Batshaw), Leith Hamilton
(ACDPN), Kevin George (ACDPN), Frances Waithe (DESTA), Dr. Gale Seiler (McGill Faculty of Education),
Kim Kidder M.S.W (Consultant).
Westhaven Community Centre: Roxanne Brown
Côte- des- Neiges Black Community Association : David Pyram
Carrefour Jeunesse-Emploi NDG : Lynn Worell
Funders
DESTA
Community Health and Social Service Network (CHSSN)
African Canadian Development Prevention Network (ACDPN)
Human Resources and Skills Development Canada - Canada Summer Jobs (CSJ)
Graphics & Printing
Graphics by: Isabel Gabarro – Concordia University
Printing by: Typoscript
Reproduction or use of materials in this study may be used without the author’s consent, provided
DESTA is recognized as the author and owner of the study.
The opinions and interpretations in this publication are those of the authors and do not necessarily
reflect those of the Government of Canada.

Race, Risk, and Resilience
3
What started out initially as a needs assessment, quickly turned into a research project that would look
at the risks and resilience within Black-Anglophone Youth aged 17 to 26. Over the past 4 years, DESTA
has worked with many inspiring and committed young adults. Despite all the challenges they face -
internal struggles, systemic barriers, and racism - our youth continue to try and make a place for
themselves in our society. They continue to aspire to achieve and live worthwhile, productive lives. The
question then becomes: how come all try but only a few succeed? What are some of the coping
strategies they use to address their daily challenges? What are the ways that DESTA and other non-
governmental and governmental agencies can support their efforts? How can we collectively give voice
and opportunity to a very vulnerable, alienated, and ignored group within Quebec’s society?
These questions and many more have arisen out of the study and the work being done on the front-line.
It is our hope that with this study DESTA is able to bring to the forefront the triumphs and challenges it
has faced since its inception. Our young people need a hand up, not a hand out. They need to be
afforded the same respect and resources as their peers, regardless of race. The DESTA difference aims
to promote and enhance the capacities of each of our participants. Each member is an individual as well
as part of a collective; we invest the time and resources needed to celebrate their individual reality and
highlight its worth within the collective.
The study is a snap-shot view into their reality; we explore their socio-demographic, educational, and
economic situations. We take this picture a little further by looking specifically at what it means to be a
Black Anglophone youth in Quebec. How are they coping as they dare to achieve?
This study could not have taken place without the over 100 youth who participated; thank you for
trusting in us and sharing your reality. Special thanks go out to the wonderful DESTA team and the
research steering committee for sharing their time and talents. We would also like to thank CHSSN,
DESTA, and Human Resources Canada for their financial support, without which this project would not
have been possible. It is important to highlight the exceptional work of our researchers, Dr. Gale Seiler,
Faith Shamonda, Kelly Thompson and the editing team, Louise Barbeau and Kim Kidder. Their devotion
to this initiative and willingness to do whatever it takes to make this document more than a report has
been nothing less than inspiring.
They have captured very interesting data that needs to be further explored and brought to the table, as
it highlights the need for more in-depth research and resources to be invested in Black Anglophone
youth.
Executive Director

Race, Risk, and Resilience
4
Table of Contents
1. Introduction ................................................................................................................... 5 1.1 The Need for this Research .......................................................................................................5 1.2 Theoretical Approach ................................................................................................................6
1.2.1 From Risk Factors to Resilience ................................................................................................... 7
2. Methodology ..................................................................................................................... 8 2.1 Timeline for the Project ............................................................................................................8 2.2 Outreach to Youth ....................................................................................................................9 2.3 Measures, Subjects and Procedures ..........................................................................................9
3. Demographic Survey Results ............................................................................................ 10 3.1 Participants ............................................................................................................................ 10 3.2 Neighbourhoods ..................................................................................................................... 10 3.3 Parents’ Place of Birth ............................................................................................................. 11 3.4 Identity .................................................................................................................................. 13 3.5 Living Situation ....................................................................................................................... 14 3.6 Children.................................................................................................................................. 15
3.6.1 Children and Living Situation ..................................................................................................... 15 3.7 Income ................................................................................................................................... 16 3.8 Employment ........................................................................................................................... 17
3.8.1 Employment and Gender ........................................................................................................... 17 3.9 Education ............................................................................................................................... 19
3.9.1 Education and Employment ....................................................................................................... 20 3.9.2 Education, Living Situation, and Employment ........................................................................... 21
3.10 Language Skills...................................................................................................................... 24 3.10.1 Language Skills and Employment ............................................................................................. 24
3.11 Health Issues ........................................................................................................................ 26
4. Resilience ........................................................................................................................ 27
5. Anger and Coping ............................................................................................................ 29
6. Racial Socialization .......................................................................................................... 31
7. Conclusions and Implications ........................................................................................... 33 7.1 Education ............................................................................................................................... 33 7.2 Living Situation ....................................................................................................................... 34 7.3 Identity .................................................................................................................................. 34 7.4 Racism and Discrimination ...................................................................................................... 34 7.5 Physical Health, Mental Health and Drug Use .......................................................................... 35 7.6 Violence ................................................................................................................................. 35 7.7 Resilience ............................................................................................................................... 36 7.8 Neighbourhood ...................................................................................................................... 36 7.9 Summary ................................................................................................................................ 36
8. The DESTA Difference ...................................................................................................... 37
9. References ....................................................................................................................... 38

Race, Risk, and Resilience
5
1. Introduction DESTA (Dare Every Soul to Achieve),derived from the Ethiopian language Amharic, means Happiness. We are a not-for-profit, community-based organization serving marginalized youth, aged 18 to 25, primarily from the English speaking Black community in the Greater Montreal area. Our mission is to mentor marginalized youth in the areas of education, employment, and health & personal development. Through our programs and services, DESTA aims to support the process of empowerment, strengthen authentic identity, and promote excellence. In 2006, several community workers came together to discuss the needs of marginalized Black youth. A year later, the Padua Center received a seed grant from Human Resources and Skills Development Canada (HRSDC) and launched a six-month pilot project in partnership with several community-based organizations. Twelve youth participated in this six-month, employment-focused initiative. The pilot project came to an end, but the needs of its participants did not. To continue this vital work with disadvantaged young adults, DESTA Black Youth Network was born.
1.1 The Need for this Research Since DESTA’s inception, we have been privileged to work with hundreds of dynamic, deserving, and courageous young people in their quest to achieve educational, economical, and emotional success; we have witnessed their struggles as they try to play full and productive roles within our society. In order for us to realize our mission, we needed to further understand their realities, more specifically, how they are coping in the face of such challenges. This research was conducted by DESTA for the purpose of gathering information on the challenges and difficulties facing Black youth in Montreal, and the strategies they use to cope with them. By better understanding the issues and factors that impact the lives of Black youth, and how they cope with them, we will be better able to assess their needs and respond by offering resources and support services tailored to these. This research also sought to find out why interventions that have been put into place to support Black youth have little long-term effect. For example, youth participating in these programs seem to thrive for the duration of the program, but in the long term, some of these same youth engage in illegal activities, turn to the underground labour market, or choose to disengage from mainstream society. In short, the research sought to discover why it is that given two youth with similar backgrounds and possibilities, one of them manages to be successful while the other seems to slip through the cracks. The difference, it seems, is resilience, which is defined as a person’s ability to cope with stress. Black Anglophone youth living in predominantly French-speaking Montreal face particular challenges and stressors. More specifically, unilingual Anglophones, and those whose French language skills are poor or limited, are particularly vulnerable to discrimination in addition to facing barriers to employment. As the vast majority of the research on coping and resilience in Black youth has been done in the United States, this linguistic aspect is not addressed. Moreover, although a relatively large amount of data exists on risk factors for Black youth in Montreal (e.g., income level, employment, and racial profiling), less information is available on the degree of resilience and coping mechanisms. After an exhaustive review of peer-reviewed journals, only one article was found that discussed resilience and coping amongst Blacks in Canada, and that was with youth living in Southwestern Ontario (Joseph & Kuo, 2009). As the scope of this single Canadian study does not take into account the experiences of

Race, Risk, and Resilience
6
minority-language speakers, this new study focusing on Black Anglophone youth living in Montreal begins to fill this gap in the research data. According to census data published by Statistics Canada, in 2006, there were approximately 188,100 Blacks in Quebec, 43% of which were under the age of 25. For the non-black population, 29% of the population is under the age of 25.The challenges facing these Black youth are daunting:
38% of Black youth have not completed high school (versus 12% of the general population in the province of Quebec)
The unemployment rate for Black youth living in Montreal is 19%, (versus 10.7% for all Montreal youth ages 16-35, including Blacks)
The unemployment rate for Black university graduates is 10.9%, (versus 5.4% for non-Blacks)
43% of Blacks with an income of less than $10,000 per year have completed high school (versus 27.6%in the non-Black population)1
In light of the murder of one of the youth participants on 30 August 2011, it is clear that there is a need for immediate interventions and long-term programs that support young Black youth and promote their resilience so that they are better able to make decisions that will have a positive impact on their futures.
1.2 Theoretical Approach The authors of this report take a view that development of youth is not an individual, psychological endeavour. Rather, it is a multidimensional process that occurs in particular contexts and is influenced by the social, cultural, and historical context in which the youth develop. In taking this position, we draw on the work of Margaret Beale Spencer and Howard Stevenson, at the University of Pennsylvania in Philadelphia. Spencer and Stevenson, both Black psychologists working with Black youth in the United States, have challenged traditional psychological views of Black youth that pathologize their behaviours. Instead, they offer a cultural-ecological model based on Bronfenbrenner’s (1979) ecological framework and Africentric theory (Ak’bar, 1984; Asante, 1988) to facilitate a greater understanding of how environmental forces affect adverse psychological outcomes.The risks that youth face, along with the successful and unsuccessful strategies they employ to cope with these risks, need to be understood in relation to their maturation, their identity development, and the interactive effects of structural conditions and social, economic and historical forces. While acknowledging that the American context, from which this research comes, is different from the Montreal and Canadian context, this exploratory study begins to understand the structural and historical conditions that are relevant to Black youth here and to suggest prevention and intervention strategies based on a cultural-ecological model. We use the construct of Resilience to frame the study.2 Resilience enables us to look at youth development as a process that links culture and context with individuals’ meaning-making processes and resultant identity formation.
1All of this data is from a report prepared by the McGill School of Social Work in 2010, Demographic Challenges Facing the Black
Community of Montreal in the 21st Century. Volume Three: The Emerging Agenda and Executive Summaries. Montréal; except the second item, which is from a report prepared by Carrefour Jeunesse Emploi du Sud-Ouest de Montréal in 2004, Portrait sociodémographique des jeunes adultes de 16 à 25 ans du Sud-Ouest de Montréal. 2A review of the literature on resilience among similar populations of Black youth was conducted. Most of this research has
been done in the United States.

Race, Risk, and Resilience
7
1.2.1 From Risk Factors to Resilience Resilience involves the ability to form a successful adaptation in the face of obstacles and adversity (called stressors or risk factors). Simply put, youth who have experiences that provide protective factors often acquire adaptive coping mechanisms, are more resilient, and experience more positive life outcomes. Conversely, youth who experience minimal protective factors, or for whom the stressors outweigh the protective factors, develop maladaptive coping mechanisms, are less resilient, and experience less positive life outcomes. Details and examples are provided below, and the development of resilience is illustrated on the next page.
Risk factors are aspects of the surroundings, events, or experiences in a person’s life that have potential for causing stress. Risk factors may predispose individuals for adverse outcomes, depending on the protective factors present and coping mechanisms developed.The following risk factors or stressors have been identified in the literature as impacting Black youth in particular:
Racial stereotypes Low income, poverty Lack of jobs Gender stereotypes Exposure to violence Fear/expectation of violence Biased, stereotypic, racist experiences Exaggerated, negative images of Black youth
Risk factors, such as those listed above, can be mediated by protective factors which make it possible for people to overcome adversity and risk factors that exist in their environments. Examples of protective factors for Black youth include:
Family support (formal kinship networks) Other forms of social support (informal kinship networks) Adult role models Adaptive racial identity Spirituality Access to resources available in the community
Depending on the risk factors and the protective factors, youth acquire various coping mechanisms. Adaptive coping mechanisms can enable adolescents to make sense of stressful experiences in positive ways and can lead to positive future expectations despite being confronted with risk factors. Protective factors, however, are sometimes missing from the lives of Black youth as they grow up, or the stressors are so great that the protective factors do not suffice, and Black youth often develop maladaptive coping methods. Resilience refers to how people cope with stressors, that is, how they make sense of negative experiences and events. The meaning that one makes of an experience is key to resilience. The perception of an experience is just as powerful, and for many adolescents more powerful, than an objective observation (Spencer, Fegley & Harpalani, 2003). Thus, the key component to resilience is an individual’s perception of challenges and supports, that is, how they make sense of their world.

Race, Risk, and Resilience
8
2. Methodology
2.1 Timeline for the Project Seed money for this project was provided by Community Health and Social Services Network (CHSSN), with the African Canadian Development Prevention Network (ACDPN) providing the fiduciary function and supporting DESTA's goal of gathering baseline data on the issues and needs of its target population. It should be noted that DESTA serves youth aged 18 to 25, but, for the purposes of this study, 17 and 26 year-olds were included in the surveys. Additional funding, provided by Human Resources and Skills Development Canada (HRSDC), enabled the organization to hire a graduate student, Faith Shamonda, for a period of eight weeks during the summer of 2011. Others involved in the conceptualization and implementation of the research were Kim Kidder, Gale Seiler, and Kelly Thompson. The project was carried out as follows:
Weeks 1 and 2: Discussions of theories of resilience; developed, selected, and adapted survey instruments; contacted partner organisations; began outreach to youth.
Weeks 3 and 4: Contacted youth and partner organisations; recruited and surveyed youth. Weeks 5 and 6: Coded and analysed data collected from the surveys; interviewed eight youth
selected for in-depth, face-to-face interviews. Weeks 7 and 8: Began analysis of data and writing of report.
The eight week timeline initially allotted for this research proved to be insufficient. An additional seven weeks were invested in the analysing and writing of this report. During this extended period, Frances Waithe, Kim Kidder, and Louise Barbeau joined the research team to help complete the report.
Positive life outcomes Less positive life outcomes
Resilience Lack of Resilience
Coping Mechanisms Adaptive Maladaptive
Protective factors Lack of Protective Factors
Stressors

Race, Risk, and Resilience
9
2.2 Outreach to Youth Due to financial and human resource constraints, the initial timeline for the project was delayed. Surveys were held in July, resulting in challenges recruiting youth during the summer months. For example, we were not able to recruit youth directly through contact with Adult Education programs, high schools, CEGEPs, or universities. Because of the summer time period, our partner at Batshaw Youth and Family Services indicated that all of the youth that we could have potentially reached through them were away at camp and would not be available to participate in the surveys. In spite of these difficulties, we surpassed our goal of 100 youth. We successfully recruited and surveyed 105 Black youth, from various neighbourhoods across the island of Montreal, within a two-week time period. Despite having reached these 105 youth, not all of them filled out each of the four surveys to completion. For example, while all 105 youth completed the questionnaire surveying their resilience, only 72 participants completed the questionnaire covering their experience of racial socialization. A much higher completion rate was seen for both the coping methods and the demographic profile surveys, each with 102 surveys completed.
2.3 Measures, Subjects, and Procedures The goal of the project was to assess the resilience of Black Anglophone youth living in Montreal. We wanted to know how they coped with stressors such as racism and if their coping mechanisms were adaptive (promoting resilience) or maladaptive (promoting short-term survival, but not necessarily long-term success). We also wanted to assess the extent to which the youth were succeeding in their lives. Because there is already data available on the stressors and risk factors experienced by the target population (such as lack of employment and low income levels), we were interested in collecting data to shed light on the other aspects of the process illustrated on page 3, namely resilience, coping mechanisms, and protective factors. Where possible, we identified measures that had been specifically developed for these constructs and had been validated and tested with similar populations of youth. The use of such instruments allowed for more efficient collection of data and reliable analysis of the information. Due to funding constraints, we only selected measures that could be used free of charge. The measures selected were the Connor-Davidson Resilience Scale (CD-RISC) (Connor & Davidson, 2003), the Teenager Experience of Racial Socialization (TERS) (Stevenson, Cameron, Herrero-Taylor, & Davis, 2002), as well as a modified version of the Self-Report Coping Measure (Causey & Dubow, 1992). A demographic questionnaire was created to have a more informed portrait of the youth who participated. A variety of processes were used to recruit youth and administer the survey instruments. In July, four group survey sessions were held at DESTA Black Youth Network over the course of two weeks. In collaboration with our community partners, survey sessions were also held outside of DESTA at the Notre-Dame-de-Grâce CarrefourJeunesse-Emploi (NDG-CJE), the Côte-des-Neiges Black Community Association (CDN BCA) and the Westhaven Community Centre in NDG. Community workers at DESTA also reached out to youth living in their neighbourhoods and delivered surveys on a one-on-one basis. In general, the youth were asked to read and respond to the questionnaires independently, but in six cases, a worker read the questionnaires aloud and the youth responded orally to each of the questions. The average amount of time required to complete the surveys was 30 minutes. Incentives for participants included meals or light snacks and the chance to win one of two prizes: a digital recorder or a $100 gift certificate to Foot Locker.
Race, Risk, and Resilience
10
The results of the four instruments are summarized in the following sections. We were unable to correlate information from the demographic questionnaire with scores on the psycho-social measures (TERS, CD-RISC, and Coping Measure) due to limitations in time and funding. Additional funding is needed to carry out the level of data analysis needed to explore correlations of this type.
3. Demographic Survey Results
3.1 Participants One hundred two Black Anglophone youth between the ages of 17 and 26 filled out the surveys. Fifty-three were male and 49 were female. The average age of the participants was 20.6 years, while the median age was 20 (half the participants were 20 years of age and under). The most common age (the modal age) of the participants we surveyed was 17. Approximately one-quarter of the youth surveyed (24.5% or 25 youth) were regular DESTA participants; however, approximately 50% of the youth filling out surveys were known to DESTA staff because of their presence within the community (several of the youth had attended one or more of DESTA’s events).
3.2 Neighbourhoods The youth who participated in the surveys come from across the Island of Montreal; a few reported living in the suburbs of Montreal. Ninety-five of the 102 people responded to this question:
I live in _______________________________ neighbourhood
The most commonly reported neighbourhood was the Little Burgundy community of Southwest Montreal. We took the added precaution of asking participants to provide their postal code. This information indicated that youth lived in other neighbourhoods across the Island of Montreal or off the Island completely. For example, 5 youth claiming residency in Little Burgundy reported postal codes in other neighbourhoods, including from as far afield as the South Shore cities of Longueuil, Brossard, and Châteauguay. This may be due to parents moving to new locations3 and the youth retaining an affiliation with their original neighbourhood. On the other hand, in three instances where the people stated that they lived “Downtown,” their postal code indicated that they lived in Little Burgundy.4 Moreover, living situations of many of the youth are fluid. Postal codes and living situation do not necessarily reflect where they collect their mail or where they sleep. The following is the reported distribution of the participants in the neighbourhoods of Montreal:
26.3% live in Little Burgundy
17.9% live in Notre-Dame-de-Grâce
11.6% live in communities farther west on the Island of Montreal (Dollard-des-Ormeaux, Dorval, Roxboro, Pierrefonds, Lachine)
9.5% live in Côte-des-Neiges
8.4% live in Centre-Ville (Downtown)
7.4% live in LaSalle
5.2% live on the South Shore (Brossard, Longueuil and Châteauguay)
3In a face-to-face interview, one of the youth mentioned that although he sleeps at his mother’s house on the South Shore, he
considers NDG to be the neighbourhood where he lives, because he grew up there, despite the fact that he no longer has a mailing address in that neighbourhood. 4 Little Burgundy is situated in Southwest Montreal, but is commonly mistaken to be part of downtown.

Race, Risk, and Resilience
11
3% live in St-Henri
2% live in Mile End
Key Point: The most common neighbourhood affiliation reported by the youth is Little Burgundy, even though 74% of the population live in different neighbourhoods on and off the island of Montreal.
3.3 Parents’ Place of Birth5 The following questions were asked on the demographic survey:
My mother was born in ____________________ My father was born in____________________
Of the 102 people who completed the survey, 6 people declined to disclose their parents’ birthplace.6Of the 96 who disclosed their origins, the vast majority, 72 (75% of the 96, or 70% of the total population) reported that one or both of their parents were born in the West Indies.7
5In retrospect, it might have been useful to ask the participants where they themselves were born.
6This may be due, in part, to the wording of the question; in four of these instances, participants indicated the year of their
parent’s birth. 7 Note that for the purposes of this research, Guyana is not considered to be part of the West Indies because it is situated on
the continent of South America. It is, however, often considered to be part of the Caribbean Community. If Guyana is included, then the number of people with one or both parents born in the Caribbean is increased by 3 to 75 (73.5%), the number of people with two parents born in the Caribbean is increased from 46 to 50 (49%), and the number of people who have one parent born in the Caribbean is increased by 3 to 29 (28.4%).
Little Burgundy 26%
NDG 18%
Farther west on island 12%
CDN 10% Centre-Ville
8%
Lasalle 7%
South Shore 5%
St-Henri 3%
Mile End 2% Other
3% Undisclosed 6%
Neighbourhood

Race, Risk, and Resilience
12
North American Origins Only 6 participants reported that both of their parents were born in Canada, while 23 had one parent born in Canada and another parent born elsewhere. Four youth stated that they had one parent born in Canada and one parent born in the United States. One youth indicated that both parents were born in the US; 1 youth specified having one American and one Haitian parent. West Indian Origins Of the participants with parents from the West Indies, 46 people indicated that both their parents were born in the West Indies, while 26 noted that one parent was born there and the other born elsewhere. Jamaica was the country from which the majority of the parents came, with approximately one quarter of the population (23 people or 22.5%) having both of their parents hailing from Jamaica and 15 people (14.7%) reporting one Jamaican parent. Of these 15 participants, 9 listed Canada or Montreal as the second parent’s birthplace. The next most commonly reported country of origin was St. Vincent. Seven participants have both parents born there and 5 have one Vincentian parent and the other born elsewhere. For the rest of the youth, their origins are summarised as follows: 3 participants, both parents born in Trinidad; 10 participants, one Trinidadian parent and the other born elsewhere. 5 participants, both parents born on the continent of Africa (Ghana, Cameroon, Kenya, and “Africa”) 5 participants, one parent born in Africa (Nigeria (3), Ghana, and Gambia) 7 participants, one parent born in Guyana 4 participants, one parent born in Haiti 4 participants, both parents born in the West Indies/Other (Barbados, Antigua, Grenada, or St-Kitts) 9 participants, one parent born in the West Indies/Other (Grenada, Barbados, Dominica, the Dominican Republic, or Montserrat)
Both parents born in Canada
6%
One parent born in Canada and one parent born elsewhere (not Caribbean)
12%
One or both parents born in the Caribbean
70%
Undisclosed 6%
Both parents born in USA
1% Both parents born in Africa
5%
Parental Origins

Race, Risk, and Resilience
13
3 participants, the origin of one parent is unknown 3 participants, one parent born in England 1 participant, both parents born in Haiti 1 participant, one parent born in France
KEY POINT: 70% of the participants report one or both parents born in the Caribbean; of this group, the most common country of origin is Jamaica. Only 6% of the population have both parents born in Canada. 22.5% have one parent born in Canada.
3.4 Identity Participants were asked to identify the cultural community to which they belong:
I identify with _________________________ cultural community
Participants were not given a selection of identities to choose from, nor was an example provided. Forty participants did not answer this question. This may have been because participants did not understand the question or it may be a result of youth not identifying themselves as belonging to a specific cultural community. Difficulty answering this question may be related to the participants’ complex histories and affiliations with multiple cultural groups. Nineteen participants identified themselves as being “Black”, while 2 participants indicated either “Black-Canadian” or “Afro-Canadian.” Only 2 participants stated that they were Canadian. One participant indicated that he was both Canadian and a Montrealer. No one identified themselves as being a Quebecer.
Black 19%
Canadian 2%
Black Canadian
2%
African 3%
Jamaican 6%
Jamaican-Canadian 6%
African-American 6%
Other 15%
Undisclosed 41%
Identity

Race, Risk, and Resilience
14
Three participants stated that they identified themselves as being West Indian (1 of whom had a parent born in Guyana and the other in Canada. See footnote 3). Three participants identified themselves as African, 1 as Black African, another as African and Black, and one as Ghanaian.8 Four described themselves as African-American. Four classified themselves as Jamaican, 4 as Jamaican-Canadian, 1 as Nova Scotian-Black Canadian, 1 as Multicultural Anglophone, 1 as Haitian, 1 as Haitian-American, 2 as Trinidadian, 1 as Trinidadian-Italian, 1 as Trimaican (having parents from Trinidad and Jamaica), and 1 as Bajan. Two people (a third person in interview) identified themselves with their neighbourhoods and, finally, 2 people identified their native and Black origins. KEY POINT: 5% of those surveyed identified themselves as Canadian in some way (Canadian, Black Canadian, Canadian and Montrealer). 19% identified themselves as being Black. 41% chose not to answer or do not identify with any particular group of people. No one identified themselves as being a Quebecer.
3.5 Living Situation Participants were asked to respond to these questions pertaining to their living situation:
I live on my own (alone or with roommates) _____ I live with my biological parents (mother and/or father) _____ I live with my partner (husband/boyfriend, wife/girlfriend) _____ I live with my extended biological family (grandparents, siblings, aunt/uncle cousin) _____ I live with my adoptive family _____ I live with a friend’s family (not foster care) _____ I live in a group home or residential facility ______ I live in a shelter or emergency housing _____ I am homeless _____ Other (please indicate)________________________________
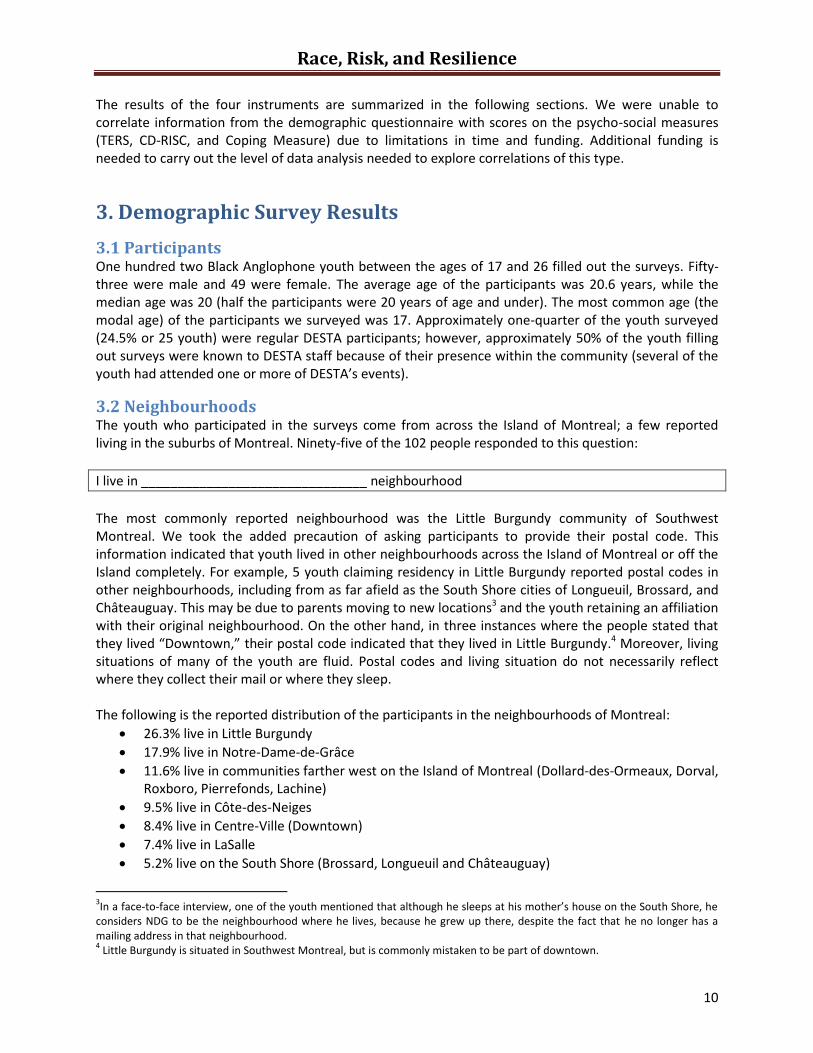
The majority of respondents (54 or 52.9%) indicated that they lived with one or both of their parents, of which 22 (40.7%) were females and 32 were males (59.3%). Eighteen participants noted that they lived on their own or with roommate(s). Nine participants live with their partner/spouse/boyfriend/girlfriend and 9 others live with their siblings and/or other family members. Two participants reported they were living with their parent(s) and their partner, 1 participant lives with grandparents9 and 1 with a guardian. Eighteen of the 54 people (33%) who live at home have incomes below $9,999 (of these people, 8 were 17 years of age). Thirteen respondents (24%) have incomes between $10,000 and $19,999. Only 5 people have incomes of $20,000 or higher and 3 people have no income. Fifteen people who live with their parents did not declare their income levels; three of these people were 17 years old. The phenomenon of adult children living with their parents is very common within the Black community. It is not necessarily linked to these adults being enrolled in school: of the 14 people aged 22 and over who are living with their parent(s), only 3 claimed that they are currently enrolled in school or returning
8Four of these people indicated that they were born in Africa.
9This person is included in the number of people who live with family members. Grandparent(s) was not a separate category.
One participant selected mother and grandmother, another wrote in parents and boyfriend.
Race, Risk, and Resilience
15
to school in the fall. It is more likely that the majority of them are living at home for financial reasons, as only one person over the age of 22 has an income of $20,000-$29,999.
Key Point: More than half of the youth (52.9%) live with parents. 25.9% of these are 17 years old. 25.9% are aged 22 and older.
3.6 Children The following question was asked about children:
I have_____ child(ren) My child(ren) live with me _____
Sixteen participants indicated that they have 1 or more children, for a total of 22 children (1 participant is also pregnant with her second child). Twelve of these participants live with their child or children. This number includes the only person who lives with 1 of his 2 children.
3.6.1 Children and Living Situation Of the 12 participants who live with their children, 4 live with their parent(s) and 1 lives with both his partner and his parent(s). Of the remaining 7 participants, 3 live with their partner and 4 live on their own or with roommates. Three of the 4 participants who do not live with their children are male. All the males who live with their children also live with their partners.
With Parent(s) 53%
Alone/with Roommate(s)
18%
Partner/spouse 9%
With Family 9%
With Parents and Partner
2% With Guardian 1%
Undisclosed 8%
Living Situation

Race, Risk, and Resilience
16
* This graph represents the 16 participants who have children.
KEY POINT: 45% of the participants who have children, and live with their children, also live with their parents.
3.7 Income The following question asked the youth about their personal income:
My income is: Less than $10,000 ______ $10,000-19,999 _______ $20,000-29-999_______ $30,000-39,000________ $40,000-54,999 _______ Above $55,000 _______
35% of people (36) declared an annual income below $9,999. Twenty-one people, or 20.5%, declared an income between $10,000 and $19,999. Five people, or 4.9%, stated that their income was between $20,000 and $29,999. Four people had an income between $30,000 and $39,999. One person declared an income between $40,000 and $54,999.10 One person said they earned $55,00011or higher. Six people (5.8%) declared having no income and 28 people (27.4%) declined to answer this question.
10
Female, 26, has CEGEP degree and working full time as a nurse. 11
Male, 18, with high school diploma, working full time in an undisclosed field.
Live with children and
parents 31%
Live with children alone
or with children and roommates
19%
Live with children
and partner 19% Do not live with
children 31%
Children and Living Situation
0-$9,999 35%
$10,000-$19,999
21%
$20,000-$29,999
5% $30,000-$39,999
4% $40,000-$54,000
1% $55,000 +
1%
Undisclosed 27%
No Income 6%
Income

Race, Risk, and Resilience
17
Key Point: In 2005, the Low Income Cut-Off (LICO) for one person living in an urban area of more than 500,000 people was $20,778. Eighty-eight percent of the youth who are not in school have incomes below this cut-off.
3.8 Employment The following questions asked the youth about employment:
I am: Employed full time_____ Employed part time_____ Self employed_____ Seeking employment______ Receiving EI_____ Receiving Social Assistance_____ I have no income_____ Indicate length of time (working/looking for work) and sector of employment____________________
*This graph represents 69 people. The category “Other” refers to people who reported being self-employed, seeking employment, receiving benefits, or otherwise unemployed.
KEY POINT: 81% of the youth who are not in school are either unemployed or underemployed.
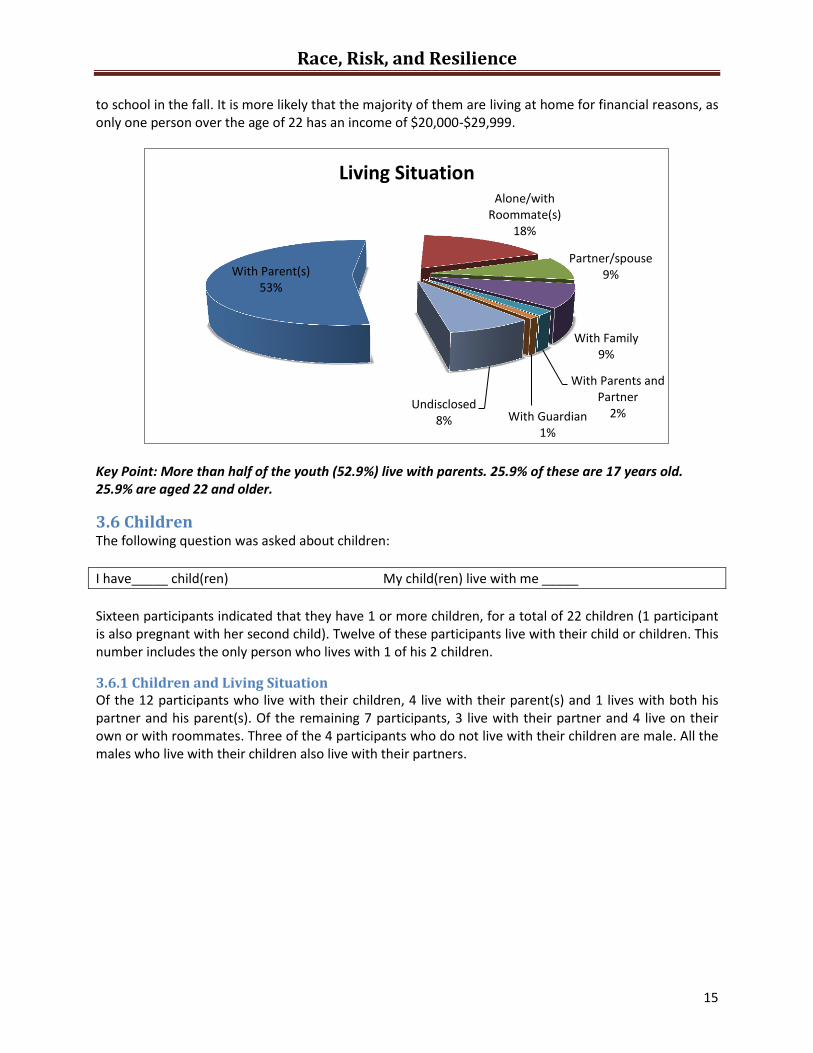
3.8.1 Employment and Gender For the 49 females, 18% of the population were employed full time, while 36% were employed part time. 4% of the women were receiving social assistance and 4% were receiving Employment Insurance. 6% of the population of women have no income and 18% are seeking employment. One person (2%) indicated that she is self employed. Five people (10%) did not disclose their employment situation.
Full-Time 18%
Part-Time 28%
Other 54%
Employment
Race, Risk, and Resilience
18
*This graph represents the 49 female participants.
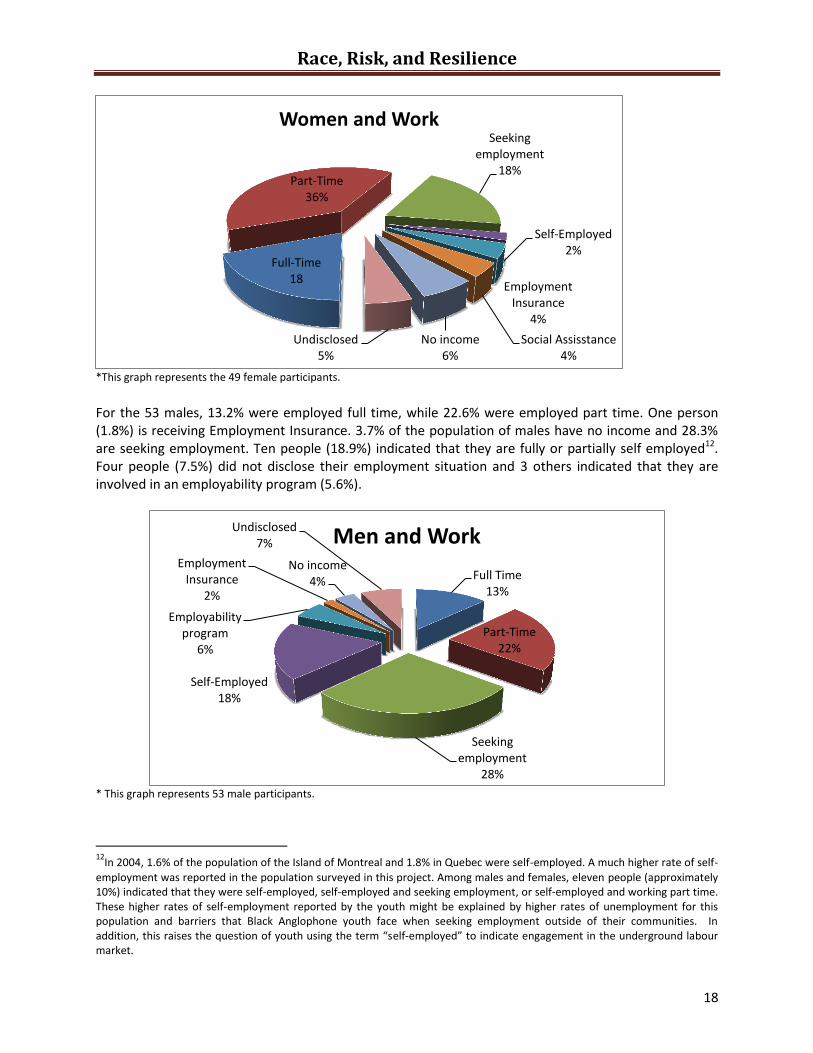
For the 53 males, 13.2% were employed full time, while 22.6% were employed part time. One person (1.8%) is receiving Employment Insurance. 3.7% of the population of males have no income and 28.3% are seeking employment. Ten people (18.9%) indicated that they are fully or partially self employed12. Four people (7.5%) did not disclose their employment situation and 3 others indicated that they are involved in an employability program (5.6%).
* This graph represents 53 male participants.
12
In 2004, 1.6% of the population of the Island of Montreal and 1.8% in Quebec were self-employed. A much higher rate of self-
employment was reported in the population surveyed in this project. Among males and females, eleven people (approximately 10%) indicated that they were self-employed, self-employed and seeking employment, or self-employed and working part time. These higher rates of self-employment reported by the youth might be explained by higher rates of unemployment for this population and barriers that Black Anglophone youth face when seeking employment outside of their communities. In addition, this raises the question of youth using the term “self-employed” to indicate engagement in the underground labour market.
Full-Time 18
Part-Time 36%
Seeking employment
18%
Self-Employed 2%
Employment Insurance
4%
Social Assisstance 4%
No income 6%
Undisclosed 5%
Women and Work
Full Time 13%
Part-Time 22%
Seeking employment
28%
Self-Employed 18%
Employability program
6%
Employment Insurance
2%
No income 4%
Undisclosed 7% Men and Work

Race, Risk, and Resilience
19
Key Point: More females than males are working full time and part time. More males than females are seeking employment.
3.9 Education The following question was asked about their education level:
The highest level of education I have completed is: Elementary school_____ SEC.I_____ SEC.II_____ SEC.III_____ SEC.IV_____ SEC.V_____ High School ____ Trade school _____ CEGEP_____ University certificate____ Bachelor’s____ Master’s_____ Other:_____________
Of the 102 respondents, only 2 people did not disclose the highest level of education they had achieved. Forty-six youth who completed the survey have completed high school (45%); 13 participants have completed CEGEP, 6 participants have finished trade school, and 4 participants have obtained bachelor’s degrees. Thirty participants do not have a high school diploma (29.4%); of these, 6 are 17 years of age.13 One participant has completed only elementary school.14 Of 46 youth who have their high school diploma, 15 are currently enrolled in another academic program (e.g., CEGEP or university) and 15 indicated they would be returning to school in the fall. The two graphs below represent the highest level of academic achievement of the 102 respondents, grouped together and then separated by gender. It is assumed that those who have completed their university bachelor’s degree, CEGEP, trade school, or university certificate have also obtained a high school leaving certificate.
13
In Quebec, youth finish high school by the age of 16 or 17. 14
Eighteen of the participants we surveyed were aged 17, and of these, 12 have completed high school. Of the 6 people who
had not completed their studies, 4 were currently enrolled in school or reported returning to school in the fall. Only 2 of these 17 year olds fit our criteria of having dropped out (i.e., did not finish and are not planning on returning to school in the fall.)
0%
5%
10%
15%
20%
25%
30%
35%
40%
19%
39%
18%
2% 0% 0%
4% 2%
6% 10%
0%
13%
23%
28%
11%
2% 4% 2% 0% 4%
8% 6%
Employment Situation: Females and Males
Females
Males

Race, Risk, and Resilience
20
KEY POINT: 70% of the youth have obtained their high school leaving certificate (38 females and 32 males). More males than females finish their formal education at the high school level and more females than males go on to higher education institutions.
3.9.1 Education and Employment Information from the question on education level was correlated with the information provided on employment.
Bachelor's 4% University Certificate
1% Trade School
6%
CEGEP 12%
High School 45%
Sec V 5%
Sec IV 17%
Sec III 6%
Sec II 1%
Elementary School
1%
Undisclosed 2%
Highest Level of Education Attained
0
5
10
15
20
25
4
9
1 3
21
1 2
6
2 4 3
25
4
11
3 1
Highest Level of Educational Acheivement: Females and Males
Females Males

Race, Risk, and Resilience
21
Of the high school graduates, 6 (13%) are working full time (including summer employment), 17 (36.9%) are working part time, 12 (26%) are seeking employment, 2 have no income, 2 are receiving Employment Insurance, 1 is receiving social assistance, 3 are self-employed, and 2 did not indicate their employment situation.
Of the 13 participants who have completed CEGEP, all but 4 are working full time. Two are working part time and 2 have no income. Only 1 of the 6 youth who finished trade school is working full time. Of the others, 1 is working part time, 1 is self-employed and working as a personal trainer, 1 person is receiving Employment Insurance, 1 is seeking employment, and 1 did not indicate their employment situation. Of the 4 respondents holding bachelor’s degrees (all of whom are female), 3 are employed part time and 1 has no income. The 1 person who completed only elementary school (male) stated he was self-employed and also seeking employment. Of the 29 people without a high school diploma:
Five have mostly completed Secondary V. Of these, 2 are seeking employment and 3 did not indicate their employment situation.
Of the 17 respondents who completed only Secondary IV, none are working full time. Three are working part time, 2 are participating in a Skills Link program, 3 are seeking employment, 2 are self-employed and working part time, 2 are self-employed, 1 is living on social assistance, and 3 did not indicate their employment situation.
Six people completed Secondary III. Of these, 3 are seeking employment, 1 is working part time, 1 is self-employed, and the last person is self employed and seeking work.
One person completed Secondary II and is currently working part time
Of the 2 people who did not disclose the highest level of education achieved, 1 is working part time and 1 is seeking employment. The sole respondent holding a university certificate (female) is working part time. Key Point: Thirty people have not finished high school. Of these, none of them (0%) are working full time, and 5 people (16%) are working part time.
3.9.2 Education, Living Situation, and Employment Information from the question on education level was also correlated with the information provided on living situation and employment status. On their own/with roommates Eighteen people, two thirds of which were female, reported that they live on their own, (12 females lived on their own, versus 6 males). Of these 18 youth, only 3 people (2 males and 1 female) had not completed high school. All of these youth were 21 or older. Seven people 21 and under live on their own. Five of these are females and they are all pursuing post-secondary studies. The sixth female has completed high school and has been working full time for the last three years and is making an excellent wage. The lone male has completed high school.

Race, Risk, and Resilience
22
Five people have children and 4 of them (females) live with them. Seven of the 18 people who live on their own had completed or were enrolled in post-secondary studies or trade school. With family members (other than parents) Of the 9 people living with family members, 3 people had competed high school and 2 had completed CEGEP. Two males and 2 females, 18 and over, had not completed high school and the highest level of education they attained was Secondary IV. The 2 males indicated that they were not returning to school, while the 2 females were either pursuing their studies or returning to school in the fall. With partner Of the 9 participants living with their partners, 4 of them have children, 2 of them live with their children, and 1 participant lives with 1 of his 2 children. Six of these people were 23 and over, and of those, only one has not completed high school, but is intending to return to school in the fall. Three of the 9 have yet to complete high school. Three are employed full time, 1 part time, and 2 are involved in Skills Link programs. The remaining 3 participants have been seeking employment for an undisclosed amount of time. With parents Age 17 Fourteen people who are 17 years old live with their parents, with equal numbers of males and females. Of the 7 females, only 1 has yet to complete high school and she reported that she was returning to school in the fall. Three of the 7 are employed part time, 1 full time, and 2 are seeking employment. The last participant did not indicate her employment situation. Of the 7 males, 1 is employed part time, 1 had summer employment, one indicated he was self-employed, and the remaining 4 are seeking employment. Five of the 7 have completed high school, 1 is still enrolled in high school and has completed Secondary IV, while the other has dropped out after Secondary III and reported he is planning to return to school in the fall. Age 18 Again, equal numbers of male and female respondents live with their parents, with a total of 8 participants aged 18. Three of the 4 females are returning to school in the fall, with 2 having finished CEGEP; 1 student is still completing her high school leaving certificate. One female indicated that she had no income, 1 is employed part time, 1 full time, and 1 did not disclose her employment situation. Of the males, 2 have completed high school and 1 CEGEP. One person has dropped out of school, is not returning, but is enrolled in a Skills Link program. Age 19
Three females and 1 male aged 19 filled out the surveys and specified that they live with their parents, for a total of 4 participants. Two of the females have completed high school and one has completed Secondary II. The lone male has dropped out of school, completing most of Secondary V and intending

Race, Risk, and Resilience
23
to return in the fall. Two of the 4 are employed part time (females), while the other 2 are seeking employment. Age 20 Six people, aged 20, filled out the survey, 1 of whom was female. Of the 6 participants, 2 have completed high school, 1 is currently enrolled in high school, and 1 is returning to high school in the fall. The lone female has completed Secondary IV, and 2 of the 3 remaining males have completed Secondary III and IV respectively. The last male did not indicate the highest level of education attained. Four of the 6 are working part time, 1 person is seeking employment, and another is self-employed. Age 21 Seven people aged 21 filled out the survey, 1 of whom was female. Of the 7, 2 have completed CEGEP, including the only female. Two of the 5 remaining participants have finished high school. One of the high school drop outs is currently enrolled in school again and has completed Secondary IV. The 2 people who have completed CEGEP are both working full time. Of the 3 people who are seeking employment, 2 have completed high school and 1 has dropped out of school and is not returning. Two participants have indicated that they are self-employed.
Age 22 One female and 2 males, 22 years of age and living with their parent(s), have completed high school and 1 has completed CEGEP. One is seeking employment, 1 is employed full time, and the last (CEGEP) has no income. Age 23 Only 1 person (male) aged 23 and living at home filled out the survey. He has completed high school and is returning to school in the fall. He is self employed. Age 24 Three females and 2 males fall into this category, and every one of them has finished high school. Of the 3 females, 1 has completed trade school and 1 has earned her bachelor’s degree; both are working part time. The last female is receiving Employment Insurance. Of the 2 males, 1 is seeking employment while the other has no income. Age 25 Three males and 1 female fall into this category. Only one of the youth has not finished high school. Of the 3 remaining youth, 1 female has finished high school and is living on social assistance with her parent(s) and 2 children. The 1 CEGEP graduate is working full time, and the 1 trade school graduate is also working full time. Age 26 One male and 1 female aged 26 still live with their parents. The female has completed her bachelor’s degree and is returning to school in the fall while working part time. The male has completed high school, is working part time, and has no plans to return to school. KEY POINT: Fifty-four people (52.9%) live with their parents; the majority of them are unemployed or underemployed (52.7%) and 5.5% have no income. Eighteen of these 54 people (33.3%) are currently enrolled in school or are returning to school in the fall. Twenty-five people are unemployed, not in school, and living at home.

Race, Risk, and Resilience
24
3.10 Language Skills Of the 102 respondents, only 1 person declined to describe their French language skills and their English writing skills, as indicated in the following questions:
My French language skills are: weak____ mediocre_____ very good_____ excellent_____ My English writing skills are: weak____ mediocre_____ very good_____ excellent_____
For French language skills, 14% rated their proficiency as being Excellent, 34% as Very Good, 38% as Mediocre, and 15% as Weak.
For English writing skills, 65% rated their proficiency as being Excellent, 28% as Very Good, 3% as Mediocre, and 1% as Weak.
Key Point: Only 50% of the participants said that their French language skills were Very Good or Excellent.
3.10.1 Language Skills and Employment Information from the question on language skills was correlated with the information provided on employment status. Of the 14 people stating that they had Excellent proficiency in French, 4 people (28.5%) are employed full time; 5 people (38.7%) are employed part time; 1 person (7%) has no income; 1 person (7%) is
Excellent 14%
Very Good 36%
Mediocre 36%
Weak 14%
French Language Skills
Excellent 67%
Very Good 29%
Mediocre 3%
Weak 1%
English Writing Skills
Race, Risk, and Resilience
25
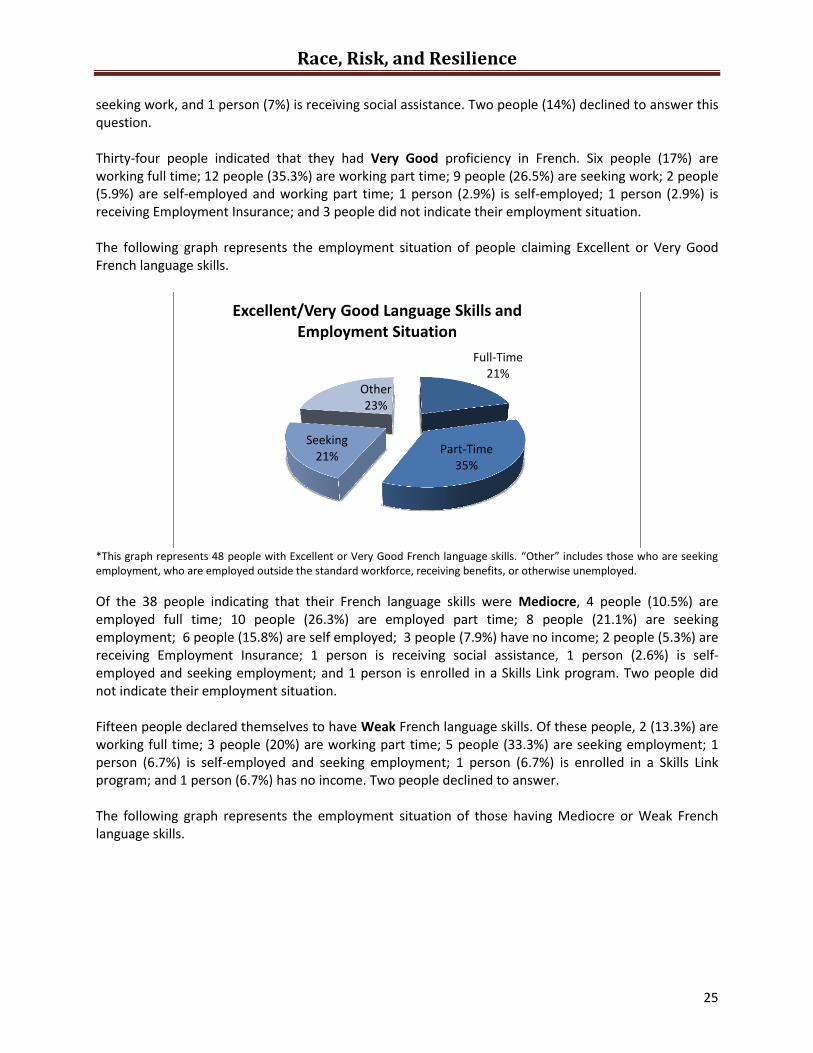
seeking work, and 1 person (7%) is receiving social assistance. Two people (14%) declined to answer this question. Thirty-four people indicated that they had Very Good proficiency in French. Six people (17%) are working full time; 12 people (35.3%) are working part time; 9 people (26.5%) are seeking work; 2 people (5.9%) are self-employed and working part time; 1 person (2.9%) is self-employed; 1 person (2.9%) is receiving Employment Insurance; and 3 people did not indicate their employment situation. The following graph represents the employment situation of people claiming Excellent or Very Good French language skills.
*This graph represents 48 people with Excellent or Very Good French language skills. “Other” includes those who are seeking employment, who are employed outside the standard workforce, receiving benefits, or otherwise unemployed.
Of the 38 people indicating that their French language skills were Mediocre, 4 people (10.5%) are employed full time; 10 people (26.3%) are employed part time; 8 people (21.1%) are seeking employment; 6 people (15.8%) are self employed; 3 people (7.9%) have no income; 2 people (5.3%) are receiving Employment Insurance; 1 person is receiving social assistance, 1 person (2.6%) is self-employed and seeking employment; and 1 person is enrolled in a Skills Link program. Two people did not indicate their employment situation. Fifteen people declared themselves to have Weak French language skills. Of these people, 2 (13.3%) are working full time; 3 people (20%) are working part time; 5 people (33.3%) are seeking employment; 1 person (6.7%) is self-employed and seeking employment; 1 person (6.7%) is enrolled in a Skills Link program; and 1 person (6.7%) has no income. Two people declined to answer. The following graph represents the employment situation of those having Mediocre or Weak French language skills.
Full-Time 21%
Part-Time 35%
Seeking 21%
Other 23%
Excellent/Very Good Language Skills and Employment Situation

Race, Risk, and Resilience
26
*This graph represents 54 people who have Mediocre and Weak French language skills. “Other” includes those who are seeking employment, who are employed outside the standard workforce, receiving benefits, or otherwise unemployed.
Key Point: Fifty-six percent of participants with Excellent and Very Good French language skills are working full or part time, in comparison to 35% of participants with Mediocre or Weak language skills.
3.11 Health Issues Participants were asked the following question about health issues they have experienced:
I suffer from the following health problems (check all that apply): Asthma _______ Diabetes ________ Overweight_________ Underweight__________ Blood disorders (sickle cell anemia, HIV/AIDS, hepatitis, etc.) ________ Chronic illnesses (multiple sclerosis, chronic fatigue etc.)_______ Physical mobility issues ________ Substance abuse (alcohol, tobacco, and/or other drugs) (please indicate) _________________________ I have been diagnosed with the following (check all that apply): Depression ________ Anxiety issues________ Schizophrenia________ Bi-polar disorder _____ ADD/ADHD________ Dyslexia__________ Other (please indicate) ______________________________
Thirty-eight of the 102 participants (37%) disclosed one or several health issues. 56% of the population reported having no health issues or chose not to disclose their health concerns. If the former is true, then this indicates that they may not be aware of health problems and, thus, would not seek help in these areas. For the remaining 44%, approximately 10% have asthma and 6% are overweight. A further 5% suffer from anxiety, 4% from depression, and 4% are underweight. Two people reported having dyslexia, 2 have ADD, and 2 suffer from migraines. Anaemia, sickle cell anaemia, Crohn’s disease, trichotillomania, bi-polar disorder, chronic illness, anger issues, and epilepsy were each reported by a different respondent. Nine of the people (24%) who disclosed health issues, including drug use, have 2 or more of these illnesses or disorders.
Full-Time 11%
Part-Time 24%
Seeking 26%
Other 39%
Mediocre/Weak language skills and Employment

Race, Risk, and Resilience
27
Twenty of the 102 participants filling out the Demographic Survey revealed drug, alcohol, or tobacco usage; marijuana was the most commonly cited drug used, with 15 participants admitting consumption.15 The second most commonly used drug was alcohol, with 8 participants, closely followed by tobacco, with 5 people indicating that they smoked cigarettes. Combinations of alcohol and marijuana were noted in 5 participants. Three of the 4 people who divulged that they were diagnosed with depression also admitted using marijuana. It is interesting to note that despite the promise of confidentiality an anonymous survey provides, we noticed some discrepancies between the results of the Demographic Survey and statements made by the youth who were asked to participate in the face-to-face interviews.16 This seems to indicate that the data underestimates the health issues faced by the youth.
Key Point: Discrepancies were seen between the reporting of health issues and drug use in the anonymous surveys and what was revealed in face-to-face interviews as well as anecdotal evidence collected by DESTA front-line workers.
4. Resilience Resilience can be viewed as “a measure of stress-coping ability” (Connor & Davidson 2003, p.77). “Resilience is a multidimensional characteristic that varies with context, time, age, gender, and cultural origin, as well as within an individual subjected to different life circumstances” (Connor & Davidson 2003, p.76). The Connor-Davidson Resilience Scale (CD-RISC) has been used to assess resilience in a number of population groups, including African American youth in the United States.
15
Anecdotal information leads us to believe that marijuana consumption is actually higher than indicated by these results. 16
In three of these interviews, the youth disclosed health issues and/or drug use that were not indicated on the Demographic Survey.
Asthma 10%
Overweight 6%
Underweight 4%
Anxiety 5%
Depression 4%
Dyslexia 2%
Other 13%
None/Undisclosed 56%
0%
Health Issues

Race, Risk, and Resilience
28
The CD-RISC contains 25 items, all of which carry a 5-point range of responses, as follows: not true at all (0), rarely true (1), sometimes true (2), often true (3), and true nearly all of the time (4). The scale is rated based on how the subject has felt over the past month. The total score ranges from 0–100, with higher scores reflecting greater resilience (Connor & Davidson, 2003, p.78).
105 people17 between the ages of 17 and 26 (50 females, 55 males) filled out the CD-RISC. As a whole, the scores of the youth ranged from 12 to 95, with a mean (average) score of 70.22 and a median score of 72. The average reported for the general population is 80. The CD-RISC has been utilized with a number of groups and comparison with these groups provides a useful sense of resilience in the population of concern in this study. The following summary provides a comparison between the Black Anglophone youth surveyed in this study and groups surveyed by Connor and Davison in their 2003 study. It is important to note that despite frequent encounters with stressors, almost one quarter, or 23%, of the youth surveyed showed resilience levels that are greater than or equal to the average for non-help seeking population. Many of the youth, however, showed very low levels of resilience when faced with stressful situations. Ten percent of the youth showed coping levels that were equal to or lower than people with Post Traumatic Stress Disorder (PTSD), and 13% reported handling stress at similar levels to those suffering from General Anxiety Disorder (GAD). A further 14% of the population reported coping skills comparable to psychiatric out-patients. In making these comparisons, we are not saying that our youth suffer from PTSD or GAD; only trained clinicians can diagnose such disorders. The results, however, do enable us to see that, in many cases, the youth do not appear to cope well with stress. Rather, many appear to cope only as well as people who have disorders related to stress and coping. The frequency of youth who demonstrate coping capacities that are akin to people who are obtaining help from specialized services or primary care providers, such as family doctors and social workers, is significant when we also consider that certain cultural groups (including Black Anglophone youth) do not regularly access services that may assist them in coping with stress and improving resilience. What does this mean for the long-term success of youth who demonstrate low resilience? Resilience shapes people’s ability to positively adapt to stressors in their lives. When resilience is low, one is more likely to resort to short term measures to relieve stress and anxiety than to do long term planning and problem solving.18In short, what one does to survive is not necessarily what one needs to do to thrive. Connor and Davidson (2003) believe that “resilience is modifiable” (p.76). Targeted interventions that improve people’s ability to deal with and make sense of stressors in productive ways can improve resilience and long-term success. This highlights the need for interventions that target the development of resilience in young adults who have not, thus far, developed such resources.
17
105 youth actually filled out the four surveys, and in the case of the CD-RISC, all 105 surveys were kept. With the
Demographic Survey, for example, some people did not fill it to our satisfaction and so at least three were thrown out. 18
Characteristics of resilient people include the capacity to make a realistic appraisal of one’s environment, to have a sense of direction or mission, and developed social problem solving skills (Newman, 2004).

Race, Risk, and Resilience
29
Connor & Davidson (2003) discuss five factors that they believe have an impact on a person’s resilience. These five factors are:
1. The notion of personal competence, tenacity, and having high standards 2. The strengthening effects of stress, trust in one’s instincts, and the tolerance of negative affect 3. Secure relationships, as well as the positive acceptance of change 4. The feeling of having control 5. Spiritual influences
These five factors are related to socialization of youth, in particular, the frequency of the messages about race and racism that have been received from families, caregivers, or others (Stevenson et al., 2002). For Black youth, these messages (referred to as racial socialisation) have been found to lead to the development of adaptive coping mechanisms and greater resilience. Racial socialization will be discussed in section 6 that looks at the results of the Teenager Experience of Racial Socialisation (TERS). KEY POINT: Over three-quarters of the youth surveyed have resilience scores below the average reported for the general, non-help seeking population.
5. Anger and Coping Adaptive coping mechanisms are associated with responses that can lead to positive life outcomes, despite being confronted with risk factors and stressors such as those experienced by Black Anglophone youth in Montreal. While recognizing the many positive attributes seen in the young people at DESTA, and others within the population of interest, we were interested in understanding more about how the youth cope with stressors, particularly those related to discrimination. A modified version of the Self-Report Coping Scale (Causey & Dubow, 1992) was used to assess the coping strategies used by the young people responding to the surveys. The standard items were modified to suit the language and common behaviours of this target population. Participants were asked to indicate the extent to which they use each coping strategy when they perceive discrimination or unfair treatment because of their race. Participants rated their use of each coping mechanism using a Likert scale from 1 (almost never) to 4 (almost always). Coping mechanisms or behaviours can be classified in a number of ways. Most classification systems are based on two broad categories. Approach coping strategies, such as seeking social support and problem solving, are generally considered healthy and adaptive responses. Avoidance coping strategies, such as externalizing or internalizing anger and distancing behaviours, are generally considered unhealthy and maladaptive responses. Coping mechanisms can also be classified as focused on solving the problem, which is considered more adaptive, or emotion focused. The youth who responded to this survey indicated an array of coping mechanisms. Surprisingly, the eight most commonly used coping mechanisms can be considered potentially positive and adaptive, in that they illustrate seeking social support or responding in a way that reduces a purely emotional response. These are illustrated in the table below.

Race, Risk, and Resilience
30
Response Number who indicated using this response almost always or often
Percent
Tell a friend or family member what happened 61 60%
Do something to take my mind off of it 53 52%
Try to keep this from happening again 52 51%
Go over in my mind what to do or say 48 48%
Calm down and think about what I can do to handle the problem
47 47%
Decide on one way to deal with the problem and do it
45 45%
Ask a friend for advice 40 40%
Ask a family member for advice 36 36%
Tell a friend or family member what happened, Ask a friend for advice, and Ask a family member for advice were reported to be frequently used strategies. While on the surface these strategies might appear to be adaptive coping mechanisms, they may not have a positive effect in this context. Family members or peers may themselves have difficulty coping with stressors in positive or adaptive ways, so their advice may not direct the youth toward productive decisions. Another possible explanation might be related to the high percentage of parents born outside of Canada. (Ninety-four percent of the youth have one or both parents born outside of Canada; only 5.8% have both parents born in Canada.) This means that the majority of parents’ frames of reference are influenced by a culture other than Canadian, and this can have far-reaching consequences in providing advice for navigating the institutions and culture of Quebec. Several of the strategies listed above, when considered in the context of the lives of Black Anglophone youth in Montreal, are open to interpretations that may reveal maladaptive consequences. For example, when youth Do something to take my mind off of it, that may result in a choice that has a negative outcome, such as using alcohol or drugs. Despite the high frequencies shown above of coping strategies that are generally considered adaptive, high frequencies were also reported for maladaptive coping strategies. Twenty-nine youth reported using four or more of these maladaptive coping mechanisms almost always or often.
Response Number who indicated using this response almost always or
often
Percent
Argue 41 40%
Swear out loud 35 34%
Lose my temper 33 32%
Become so upset I can’t talk anymore 30 29%
Say I don’t care 28 27%
Go out looking for trouble 18 18%
Drink alcohol 18 18%
Use drugs 14 14%
Take it out on others 12 12%
Attack someone 8 8%

Race, Risk, and Resilience
31
While many of these items represent behaviours in which anger is externalized (e.g., Argue and Take it out on others), several indicate the internalization or repression of anger (e.g., Say I don’t care), neither of which is considered an adaptive response. It is also important to note that many youth did not report frequent use of any of these maladaptive behaviours; there were a few youth who reported using almost none of the 42 coping mechanisms, raising the question of how they handle and respond to stressors. Key Point: The available adaptive coping mechanisms and the relationship between resilience and coping mechanisms in Black Anglophone youth in Montreal appears to be quite complicated and warrants further study.
6. Racial Socialization Racial socialization is defined as a “set of communications, interactions, and behaviours between parents and youth regarding how African Americans ought to decide about their cultural heritage as well as how to respond to the racial hostility, empowerment, or confusion of American society” (Stevenson, et al., 2002, p.85). While racial discrimination “contributes negatively to one’s mental health” (p.85), racial socialization protects Black youth from environments that are psychologically antagonistic and discriminatory and helps to mediate stress resulting from racism. Numerous research studies have reported that racial socialization of Black children by families helps buffer the negative effects of discrimination and weakens the link between perceived injustice, anger, and coping difficulties.
The Teenager Experience of Racial Socialization scale (TERS) is a 40-item scale designed to measure actual racial socialization messages that participants have heard and the frequency of such messages. This instrument was developed for use specifically with Black youth. The TERS uses a 3-point Likert scale response, ranging from Never (1) to Lots of times (3). It measures five specific areas (sub-scales) of racial socialisation that Stevenson has identified as serving as strong protective factors for Black youth (Stevenson, et al., 2002 p 92).
Cultural Coping with Antagonism (CCA) refers to messages that youth receive “about the importance of struggling successfully through racial hostilities and the role of spirituality and religion in that coping.” One example is “Black children should be taught early that God can protect them from racial hatred.” Cultural Pride Reinforcement (CPR) covers the teaching of pride and knowledge of African American culture to children. Examples include “Be proud of who you are” and “Never be ashamed of your colour.” Cultural Appreciation of Legacy (CLA) includes the importance of knowing about cultural heritage issues such as enslavement and other historical issues for African Americans. An example is “You are connected to a history that goes back to African royalty.” Cultural Alertness to Discrimination (CAD) includes messages that teach youth to be aware of the barriers of racism in society and the multiple race relation challenges between Blacks and Whites. An example includes “Whites make it hard for people to get ahead in this world.”

Race, Risk, and Resilience
32
Cultural Endorsement of the Mainstream (CEM) represents messages about the relative importance of majority culture institutions and values, and the affective and educational benefits that African Americans can receive by being involved in those institutions. An item within this factor includes “Society is fair to African Americans.”
Of the 102 people who filled out this survey, only 76 people (74.4%) filled it out to completion; those results are summarized below.
Teenager Experience of Racial Socialization Average score among youth surveyed
Average score reported for university
undergrads
Cultural Coping with Antagonism (CCA) 26.64 28.84
Cultural Pride Reinforcement (CPR) 23.17 16.97
Cultural Appreciation of Legacy (CAL) 11.57 11.78
Cultural Alertness of Discrimination (CAD) 13.62 13.34
Cultural Endorsement of the Mainstream (CEM) 11.37 8.98
Total score 86.37 89.31
The table above shows the average score in each sub-scale for the youth surveyed in Montreal. These scores are compared with average scores that have been reported for African American youth who are enrolled in first or second year at university in the United States (Brown, 2008). This comparison population can be considered to have attained relative success in terms of life outcomes, as seen in their level of educational attainment, when compared with the participants in Montreal, of which only 12.6% have completed CEGEP and 4% have obtained bachelor’s degrees. The Montreal youth, however, reported racial socialization levels that are similar to Black American university students, with averages within a standard deviation in all sub-scales except Cultural Pride Reinforcement, in which the Montreal score was over 6 points higher. A population of Black youth in the United States, which was more similar in education and employment levels to the Montreal Black youth, attained an average total score of 77, while the average Montreal total score was 86.37, closer to the score reported for Black university students in the United States (89.31). Overall, the surveyed youth reported higher levels of racial socialization than might be expected from other measures, for example, their educational and employment levels, and low levels of resilience on the Connor-Davidson Resilience Scale described in a previous section. Evidence in the literature coming from the United States indicates that racial socialization by families, peers, and local communities can prepare youth for the psychological assault of racist experiences and reduce the negative outcomes associated with these experiences. However, relatively high levels of reported racial socialization does not seem to have provided this type of buffering capacity for the Black youth surveyed in Montreal, at least not in ways that can be seen in substantially improved life outcomes. Several explanations can be suggested. The timing of such messages has been reported in the literature to be significant. This indicates that perhaps there are critical times for racial socialization messages. These periods may be linked with important developmental phases or periods of significant race-related episodes in children's lives. The TERS measures reports of racial socialization messages that have been received, but does not

Race, Risk, and Resilience
33
measure how these messages have translated into personal beliefs that are held by youth. There may be mitigating factors in the Montreal context that impact how these messages are taken up and used by youth. It may be the case that the Montreal context is sufficiently different from the American context, such that even high levels of positive racial socialization are not sufficient to combat negative life experiences, lack of opportunity, and other stress factors experienced by Black Anglophone youth here. For example, Eurocentric education, an abundance of stereotypical racist beliefs in the media, and insufficient employment equity programs may have a stronger influence than socialization messages on how the youth ultimately see themselves and what they can accomplish. The small size of the Black Anglophone community in Quebec may itself be a contributing factor. This community visibly stands apart from the larger Quebec society, and its small size and heterogeneity reduce the sense of solidarity that exists within this population base. In turn, the lack of solidarity reduces the potential political power that can be brought to bear on the important issues facing Black youth. It also leads to a situation in which youth must try to achieve mainstream societal goals without societal supports and structures. This draws attention to the underground networks and sub-cultures that play important roles for youth in meeting short-term goals, but not necessarily with positive long-term outcomes. Key Point: It appears that Black Anglophone youth in Montreal may be racially socialized in positive ways at the micro-level, however, the youth are destabilized at the macro level and respond by developing strong identities that include maladaptive coping mechanisms and low resilience.
7. Conclusions and Implications In this section, we will summarize the most salient findings related to stressors and resilience, and describe prevention and intervention strategies that are suggested by the information we obtained. While recognizing that this was a short-term study done with minimal support, we believe that the findings are informative and, in some cases, surprising, and provide indications of next steps that are needed, both for particular types of programs and for further study of this population.
7.1 Education Stressors commonly reported elsewhere, for similar populations, were found to exist among Black Anglophone youth in Montreal. For example, this population is experiencing low levels of educational attainment, employment, and income. Not unexpectedly, there was a strong link between high school completion and employment. In addition, low proficiency in French, the primary language of employment in Quebec, was linked with unemployment or under-employment and can be attributed in part to the youth’s educational achievements. When considering educational levels and employment, the impact of stressors appears to be greater for males than for females, as evidenced by lower levels of employment and education for males. It was clear from the study that several other factors are related to youth’s educational successes and the likelihood that those who are missing course credits will successfully obtain them. Issues such as child care, financial difficulties, housing needs, as well as health issues and coping mechanisms, all impact young peoples’ ability to makeup missing credits and obtain a high school diploma. Implications: Need for programs to assist Black Anglophone youth to further their education and, at a minimum, obtain a high school diploma and competency in French.

Race, Risk, and Resilience
34
Need for a program like DESTA that takes an integrated approach to the educational needs of Black Anglophone youth, including one-on-one tutoring and support for other needs that might detract from their ability to succeed in courses.
7.2 Living Situation Two features of the young people’s living situations emerged. The first is that many of their living situations are precarious and changing. The second is that many of the youth live at home, especially those with children of their own. We were unable to answer the question of why the youth are living at home. Is it for economic or cultural reasons? Does living at home provide important forms of support (financial, emotional, or childcare)? Are these benefits and protective factors outweighed by the increased burden on a family with already strained resources? These are questions of interest that warrant further study. Implications: Need for assistance for Black Anglophone youth with housing and childcare issues. Need to further understand the positive and negative aspects, and associated needs, of living at home.
7.3 Identity The complexity of Black Anglophone youth identity is exemplified by the fact that many come from multi-generational Canadian families, while many more are first-generation Canadians; however, the commonly held belief is that all are recent immigrants. This further compounds the already-complicated issue of self-identity of Black Anglophone youth. While much attention is devoted to Francophone immigrants in Quebec, the immigrant aspect of the Black Anglophone community is perhaps under-recognized Answers to the question of what cultural community the youth identify with revealed the complexity of cultural identification among this population. Forty-one percent did not answer this question, seemingly unable or unwilling to associate themselves with a cultural group. Few youth reported seeing themselves as Canadian (5%) and none made reference to Quebec as part of their cultural group. Thus, a Black Quebecer identity does not appear to be prominent among Black Anglophone youth. In addition, only 19% reported identifying with a Black cultural group. There is a preponderance of literature about the importance of positive group affiliations for young people in general and for Black youth in particular, because they are bombarded by violent images and stereotypes of youth like them. Implications: Need for opportunities for youth to explore the complex issues related to their racial and ethnic identities. Need for the promotion of strong, positive, collective identities. Need for culturally sensitive programs and services that promote and foster positive self-identity
7.4 Racism and Discrimination While our surveys did not ask specific questions about experiences of racial stereotyping, racism, or discrimination, there is ample evidence elsewhere to verify the existence of these stressors for Black Anglophone youth in Montreal. For example, recent news coverage and legal action drew attention to the extent of racial profiling by Montreal police and Metro security personnel.

Race, Risk, and Resilience
35
Thirty eight percent of the youth reported that one or both of their parents were born in Jamaica. This fall, students appeared in blackface at a frosh event at the University de Montréal, ridiculing Black people in general and Jamaicans in particular. Such occurrences serve as examples of racist messages, stereotypes, and events in the lives of Black youth in Montreal, particularly those with affiliations to Jamaica. Implications: Need for training on how to effectively deal with racist and discriminatory encounters. Need for programs and services that address the psychological impact on Black youth of racist practices and experiences. Need for opportunities for youth to interrogate and critique negative images of youth like them perpetuated in society. Need for opportunities for youth to portray a more favourable picture of youth like them, including their capacities and accomplishments. Need for opportunities that assist youth in engaging in active roles in mainstream institutions and political spheres. Need for accessibility to culturally relevant services and cross-culturally trained professionals.
7.5 Physical Health, Mental Health, and Drug Use Gathering data in this area was the most challenging, with only 20 of the 102 participants responding to questions about physical health, mental health, and drug use. Of those that did respond, 44% reported suffering from either physical and/or mental health issues. An alarming 15 of the 20 respondents to these questions reported using marijuana. Implications: Need for a more extensive understanding of the physical and mental health issues of Black Anglophone youth and their access to and use of existing health services. Need for programs to address addiction and drug use. Need for accessibility to culturally relevant services and cross-culturally trained professionals.
7.6 Violence We did not ask questions about the frequency and impact of violence in the lives of the youth who were surveyed. We did, however, witness the impact of violence during the course of this research. Over the short span of 4 weeks, in two separate incidences, 2 youth, aged 18 and 23, were murdered and another youth, aged 24, survived an attack and now lives with a bullet lodged in his chest. Black Anglophone youth in Montreal are frequently victims of violence themselves, or are friends or relatives of victims, and they are sometimes participants in violent acts. Thus, they are impacted directly and indirectly by violence and, most importantly, there is a lack of support for them in coping with these losses and emotions. This may be related to low resilience levels that are, in some cases, similar to people with PTSD. (See next section.) Implications: Need for individual and group support for youth whose lives have been impacted by violence. Need to explore the notion of self-violence which can be seen in the self-defeating behaviours utilized by some youth. Need to provide positive outlets where youth can learn to cope with stress and handle anger productively.

Race, Risk, and Resilience
36
7.7 Resilience Three-quarters of the youth exhibit low levels of resilience. This is despite TERS scores that indicate they have received high levels of positive racial socialization messages. In studies done with Black populations elsewhere, high levels of racial socialization are associated with greater resilience and adaptive coping mechanisms. However this does not seem to be the case in Montreal. Most of the surveyed youth reported using an array of coping mechanisms. Some of the most frequently used coping mechanisms are among those commonly identified as adaptive mechanisms. They do not, however, seem to have resulted in positive outcomes for the youth. In addition, many youth reported using maladaptive, anger externalization and internalization strategies with great frequency. Implications: Need for additional studies to understand the relationship between racial socialization, resilience, and coping mechanisms among this population. Need for programs aimed at assisting youth in developing adaptive coping mechanisms and resilience while recognizing the importance of their current strategies to their identities.
7.8 Neighbourhood The demographic survey revealed that Black Anglophone youth are not centralized in any particular area of Montreal, but, instead, live both on and off the island. This highlights the fact that DESTA serves youth beyond the local area of Little Burgundy. However, Little Burgundy, where DESTA is located, was the most commonly cited neighbourhood. We believe it is significant that in the short span of four weeks, DESTA was able to successfully recruit over 100 youth from throughout the city to complete the surveys. Implications: Need for an organization, such as DESTA, that is centrally located, easily accessible by public transportation, with name recognition and credibility among this population.
7.9 Summary Many in the population of interest, Black Anglophone youth aged 17 to 26, have already experienced an array of challenges such as alienation in the education system, great adversity, calamity, and trauma in their lives. They have had encounters with racism and discrimination and are bombarded by negative images of youth like them. Violence has played a role in their lives and many demonstrate resilience levels comparable to people with Post Traumatic Stress Disorder. Despite some evidence of having received positive racial socialization messages, many have already developed maladaptive coping mechanisms leading to low levels of resilience. Such maladaptive strategies often work against positive life outcomes for these young adults, yet these behaviours are important parts of their identities and, in some cases, serve protective functions. To assist youth in changing these behaviours, in ways that value their identities and recognize their strengths, is not a trivial task. The majority of support programs that serve this population work at the level of reducing risk factors and providing additional protective factors. Recognizing what the data reveals about coping mechanisms and resilience in the Black Anglophone youth we surveyed, it is clear that we also need to consider interventions that may lead to more adaptive coping mechanisms and higher levels of resilience, as well as provide support for dealing with the trauma and violence they experience.

Race, Risk, and Resilience
37
An unstated need underlying all the suggested programs is the need for professionals and staff to be adequately prepared to work with this particular population. Black Anglophone experiences are certainly diverse, yet they share many common themes. The youth’s experiences are culturally, socially, and historically shaped, and this must be taken into account not only in program design but also in day-to-day interactions between program staff and the youth. Thus, staff must be adequately prepared to work with these youth, whose experiences are different from others. Two conclusions stand out from this exploratory study of Black Anglophone youth in Montreal. The first is the need for more research to learn about the experiences of this particular population. The second is a validation of what DESTA has been doing and the need for it to continue and expand.
8. The DESTA Difference The information obtained from this study indicates that Black Anglophone youth in Montreal are barely surviving. DESTA’s goal is to enable them to thrive as opposed to survive. A few of DESTA’s recent efforts show how this organization attempts not only to meet the obvious needs of the youth for employment and schooling, but also to meet their individual and collective needs for identity development, resilience, and more adaptive coping mechanisms. * DESTA Café is an entrepreneurial effort intended to teach skills related to business and work. By focusing on long-term goals related to the workplace, it enables the youth to see employment as less of a dream and more of a reality. At its heart, however, it creates a peer support group focused on positive things; develops a sense of attachment, civic participation, and giving back; and helps to build positive identities. * Road to Success: A Black Man’s Journey was a participatory workshop. Such workshops are DESTA’s attempt to provide safe forums where young adults can enter into culturally relevant exchanges with positive role models and peers. Under the guiding principle of “each one teach one,” these workshops and discussions focus on the Black experience and contribute to racial socialization. *Lead-The-Ship is a program that aims to develop leadership skills through civic awareness and participation. To date, our young adults have engaged in over 20 community service endeavours touching the lives of over 300 younger and older members of our society. * DESTA’s involvement in mobilizing against racial profiling in Montreal illustrates the importance of education for leadership and political action among Black youth. In as much as Black Anglophone youth in Montreal often feel powerless, this recent political involvement created some sense of power and the youth saw that they could effectively connect with other people and resources to create a stronger coalition and bring about change. * Since its inception, DESTA has recognized the great need among Black Anglophone youth to obtain a high school diploma or equivalent, and this is supported by the data reported here. The Lion Wolf School, which follows a distance education model, takes a unique approach by focusing on each individual’s needs, assessing students’ academic situations, and collaboratively developing individualized plans for students to fulfill their academic pursuits (typically to achieve high school equivalency and the foundation for further education). This present system, however, demands extensive commitment on the part of the young person. The allotted time to complete a 3 credit course is 90 hours. Thus, a student requiring 5 courses to graduate has to be able to invest at least 450 hours of study. Our

Race, Risk, and Resilience
38
students’ realities are such that they are usually able to invest a maximum of 10 hours weekly in their studies, because the bulk of their time is spent trying to meet their basic needs and dealing with their daily challenges. Although this model was chosen due to the flexibility and individual support it offers, there is a need to investigate ways to enable the youth to make better progress in their courses. In summary, DESTA’s mission is to:
Mentor marginalized youth in the areas of education, employment, health & personal development
Guide each individual in the actualization of positive potential
Offer intervention and advocacy support
Empower vision, strengthen authentic identity, and promote excellence The importance of these original goals, laid out at DESTA’s inception, is supported by the information obtained from the surveyed youth. With this project, further study, and increased financial resources, DESTA can incorporate ways to meet these goals even more effectively. The findings confirm what DESTA has known from the start: the youth have numerous unmet needs and they face countless obstacles in their road to success. These young men and women are our future; we all win when we help them succeed.
9. References Bronfenbrenner, U. (1979). The ecology of human development: Experiments by nature and design.
Cambridge, MA: Harvard University Press. Brown, D. (2008). African American resiliency: Examining racial socialization and social support as
protective factors.Journal of Black Psychology, 34, 32-48. Ak’bar, N. (1984). Afrocentric social services for human liberation. Journal of Black Studies, 14, 395-413. Asante, M. K. (1988). Afrocentricity. Trenton, NJ: Africa World. Carrefour Jeunesse Emploi du Sud-Ouest de Montréal. (2004). Portrait sociodémographique des jeunes
adultes de 16 à 25 ans du Sud-Ouest de Montréal. Causey, D. L., & Dubow, E. F. (1992). Development of a self-report coping measure for elementary school
children. Journal of Clinical Child Psychology, 21(1), 47-59. Commission des droits de la personne et des droits de la jeunesse. (2011). Racial Profiling and
Systematic Discrimination of Racialized Youth: Report of the Consultation of Racial Profiling and its Consequences.
Connor, K. & Davidson, J. (2003). Development of a new resilience scale: The Connor-Davidson
Resilience Scale (CD-RISC). Depression and Anxiety, 18, 76-82. Fortin, P. (2008). Les sans-diplômes au Québec : Portrait d’ensemble.
Race, Risk, and Resilience
39
Joseph, J. & Kuo, B.C.H. (2009). Black Canadians’ Coping Responses to Racial Discrimination. Journal of Black Psychology, 35 (1), 78-101
McGill School of Social Work. (2010). Demographic Challenges Facing the Black Community of Montreal
in the 21st Century. Volume Three: The Emerging Agenda and Executive Summaries. Newman, T. (2004). What Works in Building Resilience? Essex, UK: Barnardo’s. Spencer, M. B., Fegley, S. G., & Harpalani, V. (2003). A theoretical and empirical examination of identity
as coping: Linking coping resources to the self processes of African American youth. Applied Developmental Science, 7, 181–188.
Statistics Canada. (2006). Canada's Ethnocultural Mosaic, 2006 Census: Provinces and territories. http://www12.statcan.ca/census-recensement/2006/as-sa/97-562/p12-eng.cfm.
Accessed 8 August 2011. Statistics Canada. Income Research Paper Series, Low Income Cut-offs for 2006 and Low Income
Measures for 2005. Statistics Canada Catalogue, no. 75F0002MIE, no. 004. http://www12.statcan.ca/census-recensement/2006/ref/dict/tables/table-tableau-18-eng.cfm.Accessed 9 September 2011.
Stevenson, H. C., Cameron, R., Herrero-Taylor, T., & Davis, G. Y. (2002). Development of the Teenage
Experience of Racial Socialization Scale: Correlates of race-related socialization frequency from the perspective of Black youth. Journal of Black Psychology, 28, 84-106.