Northwestern Oklahoma State University Northwestern Oklahoma State University Self-Study 2004.

Conflict theory historically has stressed theroles of group threat, subordination, and
powerlessness in explaining crime and its con-trol in America (Turk 1969; Quinney 1970;Chambliss and Seidman 1971). Subsequentstatements of conflict theory have more specif-ically emphasized the salience of race in ground-ing these group relationships (Liska et al. 1985;
Hawkins 1987; Mitchell and Sidanius 1995;Walker, Spohn, and DeLone 2000). Racial dis-proportionalities in American rates of arrest,imprisonment, and capital punishment are indis-putable (Blumstein 1982; Tonry 1995; Mauer1999; Kennedy 1997), although debate persistsabout the sources of these disproportionalities(Wilbanks 1987; Mann 1993; Chambliss 1999).
RRaaccee,, EEtthhnniicciittyy,, aanndd YYoouutthh PPeerrcceeppttiioonnssooff CCrriimmiinnaall IInnjjuussttiiccee
John Hagan Carla SheddNorthwestern University Northwestern University
American Bar Foundation American Bar Foundation
Monique R. PayneDePaul University
This paper advances a comparative conflict theory of racial and ethnic similarities and
differences in youth perceptions of criminal injustice. We use HLM models to test six
conflict hypotheses with data from more than 18,000 Chicago public school students. At
the micro-level African American youth are more vulnerable to police contacts than are
Latinos, who are more at risk than whites, and there is a corresponding gradient in
minority group perceptions of injustice. When structural sources of variation in
adolescents’ experiences are taken into account, however, minority youth perceptions of
criminal injustice appear more similar to one another, while remaining distinct from
those of white youth. At the micro-level, Latino youth respond more strongly and
negatively to police contacts, even though they experience fewer of them. At the macro-
level, as white students in schools increase cross-sectionally, perceptions of injustice
among both African American and Latino youth at first intensify and then ultimately
abate. Although there are again signs of a gradient, African American and Latino
responses to school integration also are as notable in their similarities as in their
differences. Reduced police contacts and meaningful school integration are promising
mechanisms for diminishing both adolescent African American and Latino perceptions of
criminal injustice.
AAMMEERRIICCAANN SSOOCCIIOOLLOOGGIICCAALL RREEVVIIEEWW,, 22000055,, VVOOLL.. 7700 ((JJuunnee::338811––440077))
#2322-ASR 70:3 filename:70302-hagan
Direct all correspondence to John Hagan,Department of Sociology, Northwestern University,1810 Chicago Avenue, Evanston, IL 60208([email protected]). Earlier versions of this paperwere presented at the annual meeting of the AmericanSociety of Criminology in Denver, CO, November2003, and the Conference on Crime, Justice, andInequality at The Ohio State University, July 2004.This material is based upon work supported by the
American Bar Foundation (Chicago, IL) and theNational Science Foundation under Grant No. SES-0215551 to the National Consortium on ViolenceResearch. Any opinions, findings, and conclusions orrecommendations expressed in this material are thoseof the authors and do not necessarily reflect the viewsof the National Science Foundation. We thank JerryJacobs, the anonymous reviewers for the AmericanSociological Review, and Professor Mary Pattillo.

African Americans overwhelmingly perceivethese differences as unjustifiable (Hagan andAlbonetti 1982; Wortley, Hagan, and Macmillan1997; Weitzer 1999; Brooks 2000; Brooks andJeon-Slaughter 2001; Bobo and Johnson 2004).Yet despite the massive numbers of AfricanAmerican youth who come into conflict with thecriminal law and perceive it as unjust, we knowrelatively little about how this conflict is social-ly structured and extends to other ethnic groups.
There is growing concern that perceivedinjustice itself causes criminal behavior (Tyler1990; Mann 1993; Russell 1998; LaFree 1998),which adds urgency to developing a betterunderstanding of racial and ethnic differencesin perceptions of criminal injustice. We useChicago public-high school survey data toexplore how perceptions of criminal injusticevary across Latino, African American, and whiteyouth, and how these perceptions may be linkedto variation in the racial integration of Americanschools. Our goal is to identify comparativeprocesses of similarity and difference in racialand ethnic perceptions of criminal injusticeamong adolescents in American society.
RRAACCEE,, DDIISSAADDVVAANNTTAAGGEE,, AANNDDPPEERRCCEEIIVVEEDD IINNJJUUSSTTIICCEE
Perceptions of injustice are systematic and wide-spread in American society: for example,African Americans perceive inequality and dis-crimination in education, employment, healthcare, and housing (Feagin and Sikes 1994;Dawson 1994; Hochschild 1995; Schuman,Steeh, Bobo, and Krysan 1997). The majorityof white Americans believe that AfricanAmerican economic inequality results frommotivational weaknesses, while most AfricanAmericans believe that this inequality is theresult of white racism (Bobo and Kluegel 1997).Orlando Patterson (1997:15) emphasizes that along history of public dishonor and ritualizedhumiliation of African Americans by Euro-Americans has generated deep distrust, but aswe discuss later in greater detail, Patterson alsoargues that the American racial divide is morecomplicated than this.
There is compelling evidence that race isconsiderably more important than social classfor explaining variation in urban Americanarrest rates (Liska et al. 1985), and this supportsthe importance recently attached to race in a
conflict theory of crime. Still there are sugges-tions that micro- and macro-level economic dis-advantages can be further root causes ofperceived criminal injustice. For example, usinga national sample, Hagan and Albonetti (1982)find that unemployed members of the “surpluspopulation” and African Americans perceivehigher levels of criminal injustice. In an inno-vative study with micro- and macro-measures,Sampson and Bartusch (1998) find that indi-vidual-level socioeconomic status is positivelylinked to satisfaction with the police; that con-centrated neighborhood disadvantage increas-es dissatisfaction with the police; and that thelatter concentration of poverty further accountsfor racial differences at the individual level indissatisfaction with the police.
Sampson and his collaborators’ unique con-tributions to the research literature on perceivedinjustice are especially noteworthy. First,Sampson and Lauritsen (1997:364) observe thatit is potentially misleading to think of differ-ences in perceived injustice as neatly divided inbinary, black/white terms. They emphasize thatimmigration from Mexico and Cuba in partic-ular is reshaping many American cities. Theimplication is that the future picture of crimi-nal justice processing may be closely tied tothe experiences of racial and ethnic groups thatare largely absent from criminological research.The broad sociological implications of this pointare underlined, for example, in intergenerationalresearch by Portes and Rumbaut (2001) onchanges in American immigration and socialstratification.
Second, in moving beyond the individuallevel to contextualize issues of racial disparity,Sampson and Bartusch (1998:871) suggest thatwe conceptualize differences in racial orienta-tions in terms of macro-level “cognitive land-scapes” at the neighborhood and communitylevel (see also Sampson, Raudenbush, and Earls1997). A similar point is made in post–Brownvs. Board of Education educational research onthe macro-level effects of school integration onstudent attitudes (Johnson, Crosnoe, and Elder2001). We pursue these points later in the paper.
Meanwhile, Collins (1997) and Cose (1994)provide compelling accounts of feelings of dis-content and distrust among middle-class AfricanAmerican professionals. These accounts stressthat affluent and better-educated blacks viewAfrican Americans as much worse off than
338822——––AAMMEERRIICCAANN SSOOCCIIOOLLOOGGIICCAALL RREEVVIIEEWW
#2322-ASR 70:3 filename:70302-hagan

white Americans (Dawson 1994; see alsoHochschild 1995). Middle-class AfricanAmericans are especially impatient with civilrights reform and enforcement (Schuman, Steeh,Bobo, and Krysan 1997). Brooks and Jeon-Slaughter (2001:2) observe that this class oreducation-by-race interaction is further reflect-ed in the widespread suspicions of economicallyand educationally advantaged AfricanAmericans about the American legal system(see also, e.g., Peek, Lowe, and Alston 1981;Weitzer and Tuch 1999).
Yet when studies of perceived criminal injus-tice separate respondents by race, the resultingfindings with regard to economic disadvantageare inconsistent. Some studies indicate thatincome reduces perceived injustice amongAfrican Americans, other studies report thatclass position increases this sense of injusticeamong African Americans, and still otherresearch finds no income effects at all, regard-less of race (cf. Hagan and Albonetti 1982;Henderson et al. 1997; Wortley, Hagan, andMacmillan 1997; Weitzer and Tuch 1999;Brooks and Jeon-Slaughter 2001; Tuch andWeitzer 1997). The possibility that better- ratherthan less-well-off African Americans perceivegreater injustice is an apparent exception to theconflict theory prediction that economic dis-advantage should heighten perceptions of injus-tice. The variation in the fore-going findingssuggests that something more than simple,absolute economic deprivation is involved inracial perceptions of criminal injustice, and weargue that this involves variation in frames ofreference and comparison that a more nuancedconflict theory can incorporate.
TTOOWWAARRDD AA CCOOMMPPAARRAATTIIVVEE CCOONNFFLLIICCTTTTHHEEOORRYY OOFF PPEERRCCEEIIVVEEDD CCRRIIMMIINNAALLIINNJJUUSSTTIICCEE
Although leading conflict theorists of crimesuch as Chambliss and Seidman (1971:475)framed their foundational hypotheses in classterms, more recently Chambliss (1999:75)emphasizes that intense surveillance of blackneighborhoods, the relative absence of surveil-lance of white neighborhoods, and differencesin punishments for white and black offendersreinforce perceptions that the system is racist inways designed to more specifically oppressblack people. Bobo and Johnson’s (2004:152)
survey of the literature similarly concludes thatan increasing number of scholars see U.S. crim-inal justice policies as deliberate (albeit decen-tralized and loosely coordinated) efforts toreassert control and dominance over AfricanAmericans.
Although there is continuing debate in lifecourse research about when or even whethersuch politically sensitive beliefs (in this caseabout criminal justice) ever fully crystallize,there nonetheless is agreement that adolescenceis a critical formative period for such develop-ment (Flanagan and Sherrod 1998; Niemi andHepburn 1995). Bobo and Johnson (2004:155)emphasize that political and social valuesemerge early in life and are persistent; and theymore specifically conclude that views aboutthe criminal justice system are rigid and resist-ant to change in adulthood. We will see belowthat middle adolescence is for minority youth asignificant time of change in these perceptions.It is appropriate, therefore, that conflict theoryand related research on race and crime focus onthe formative teenage years.
Our conflict theory of perceived criminalinjustice thus begins with the hypothesis thatduring the teen years race is a salient compar-ative point of reference for understanding per-ceptions of criminal injustice in America, sothat
Hypothesis 1: African American racial status hasa net direct effect on adolescent perceptionsof criminal injustice.
Davis (1959) places this hypothesis within acomparatively framed conflict theory by notingthat when a deprived person contrasts him orherself with a non-deprived person, the result-ing attitude can be called “relative subordina-tion.” The concept of relative subordinationimplies reference groups, a concept Runciman(1966:9) sees as derived from the truism thatpeople’s attitudes, aspirations, and grievanceslargely depend on the frame of reference with-in which they are conceived (see also Mertonand Rossi 1957; Stouffer 1949).
Portes and Rumbaut (2001:47) recently havehighlighted the racial framing of this issue bynoting that skin tone is a paramount criterion ofsocial acceptance in America, and that raceoften supersedes the influence of class back-ground, religion, or language. They make thefurther comparative argument that there is a
PPEERRCCEEPPTTIIOONNSS OOFF CCRRIIMMIINNAALL IINNJJUUSSTTIICCEE——––338833
#2322-ASR 70:3 filename:70302-hagan

racial gradient in U.S. culture, so that the dark-er a person’s skin is, the greater his or her socialdistance from dominant groups, and the moredifficult it is to make personal qualificationscount. For conflict theorists of race and crime(Hawkins 1987:736), social dissimilarity anddistance are associated with powerlessness andthreat, with African Americans seen by domi-nant groups as less powerful and more threat-ening to whites than Latinos. This sense ofdifferential threat may further derive from thelonger history involving slavery of blacks inthe United States, as contrasted with the morerecent and growing presence of Latinos inAmerican cities such as Chicago.
The implication for a comparative conflicttheory of crime is that Latinos occupy a disad-vantaged middle ground where they are a lesscomprehensive and intensive focus of crimi-nalization efforts than African Americans, butmore at risk than whites. This leads to a secondhypothesis that
Hypothesis 2: There is a racial gradient to theeffect of race/ethnicity on adolescent per-ceptions of criminal injustice, with AfricanAmerican racial status having a more pro-nounced comparative effect than Latinoethnic status on perceptions of criminalinjustice, but with Latino ethnic status stillleading to perceived injustice.
However, there is little prior research on Latinoperceptions of the criminal justice system, andthe few surveys that have considered views ofLatinos have produced equivocal findings (seeBrooks and Jeon-Slaughter 2001:2n.).
Given the dearth of comparative researchthat includes African Americans and Latinosalong with whites, it may be important to takeour investigation beyond the main effect of theracial/ethnic gradient just hypothesized. Whilepolice attention to African American youth isfrequent and therefore familiar (Anderson 1999;Young 2004), little is known about how Latinoyouth respond to their experiences with thepolice—perhaps in part because their experi-ences with the police are assumed to be lesscommon. A study sampling Hispanics (Carter1985) reports that respondents’attitudes towardthe police are good until they have experiencewith them (494–95), but that as contact with thepolice increases, expectations for them decrease(498; see also Skogan et al. 2002). There may
be nonadditive differences as well as similari-ties in Latino and African American experi-ences with the police that should be taken intoaccount in making comparisons. Taking differ-ences into account may actually prove to be akey to uncovering more fundamental common-alities, so that
Hypothesis 3: The difference in Latino andAfrican American perceptions of criminalinjustice will be reduced when relative dif-ferences in experiences of police contactsare taken into account.
The implication of this hypothesis is that it maybe important to develop a more nuanced under-standing of similarities as well as differences inadolescent African American and Latino per-ceptions of criminal injustice.
Neighborhood, school, and workplace expe-riences provide further contexts of compara-tive racial and ethnic subordination. The rangeand focus of such comparative experiences canbe crucial (Hagan and Bernstein 1979; Petersonand Hagan 1984). Brooks (2000) uses a com-parative perspective to explain the unexpectedoutrage among more advantaged AfricanAmericans on the topic of discrimination. Hesuggests (1218–19) that low-income AfricanAmericans are more inclined to restrict theirframe of reference to their immediate commu-nity when evaluating their experiences. Theconcentrated separateness of the AfricanAmerican urban experience may actually makethe experience of police harassment so famil-iar that it becomes an “experience of the expect-ed” and produces less outrage than wouldotherwise be predicted. Massey and Denton(1993) describe the physical separation of thegreat majority of the African American poor asthe “forgotten factor” in American race rela-tions.
Self-categorization theorists (Turner et al.1987) see actors as locating themselves alonga range from individual to group membership.Brooks (2000:1219) similarly suggests that suc-cessful blacks develop multiple referencegroups, and that this allows them to comparemore easily their outcomes to whites and otherracial groups, so that notwithstanding their ownsuccessful outcomes, they may be even moreinclined to perceive injustice as long as blacksas a group fare poorly. An awareness of thepossibility of improved outcomes may lead
338844——––AAMMEERRIICCAANN SSOOCCIIOOLLOOGGIICCAALL RREEVVIIEEWW
#2322-ASR 70:3 filename:70302-hagan
familiar and even expected experiences to beunderstood and perceived as more outrageous.
Thus these feelings of deprivation may alsobe influenced by the level of exposure to otherand more advantaged groups in a surroundingneighborhood, at work, or in school. Educationalresearch emphasizes the likely significance ofthe racial/ethnic composition of schools on notonly the academic but also the social lives of stu-dents. Although there is evidence that interra-cial contact in schools can improve racialattitudes (e.g., Ellison and Powers 1994), therealso is evidence of in-group preferences sug-gesting that going to school with other racial andethnic groups can result in isolation, suspicion,and hostility (see Hallinan and Williams 1987,1989; Schofield 1979). Recent work (Johnson,Crosnoe, and Elder 2001) indicates that same-race/ethnicity school composition enhanceseducational attachment, while increased expo-sure to other racial and ethnic groups weakensthis attachment. The implication is that increasedcross-group contact can be a source of conflict.
The role of a broadening frame of compara-tive reference in understanding AfricanAmerican perceptions is highlighted in OrlandoPatterson’s (1997) analysis of The Ordeal ofIntegration. Patterson observes that in earliereras of racial segregation, African Americanswere separated—physically, occupationally, andculturally—and that this allowed little oppor-tunity for conflict (51). When limited stepstoward integration began to break down barri-ers, however, Patterson argues that the conse-quences of separation became more apparent forthose who were kept apart and that the frustra-tions of these experiences could now be morefreely perceived and expressed. This can explainhow even though academic achievement ofminority students might improve in integratedschools (Entwisle and Alexander 1992;Roscigno 1998), interracial attitudes mightsimultaneously worsen.
“Put briefly,” Patterson writes, “as the rela-tions between the previously segregated groupschange, becoming objectively better for Afro-Americans, they will be experienced by Afro-Americans as getting much worse even as theyare genuinely seen by Euro-Americans to beimproving” (54). It is not the experience of dis-crimination that is changing so much as thecontext in which it is perceived. Patterson refersto this contemporary condition as “the objective
paradox of integration” and to its hostile con-sequences as “the outrage of liberation.”
Brooks (2000) places the general linear rela-tionship between opportunity and grievancewithin the numerically measurable context ofresidential and occupational segregation. Hesuggests that middle-class African Americansmoving more widely in the mainstream ofAmerican life may be caught off guard whentheir status does not protect them from policeharassment, while their peers living and work-ing in measurably more homogeneous racialenvironments may be conditioned to expectless. The latter can result in the “experience ofthe expected” we noted earlier. Alternatively,Brooks indicates that African Americans in inte-grated (or mostly white) settings may have moreoccasions to observe racial bias, and he furthernotes that this can place middle-class and upper-class blacks in a heightened state of sensitivityto differential treatment (1256–57). This is con-sistent with Patterson’s (1997:51) observationthat as Afro- and Euro-Americans come intomore frequent contact, the possibility for con-flict is bound to increase.
Schools are a likely comparative context inwhich adolescent perceptions are formed.Runciman (1966:25) suggests that there aresubversive potentialities of knowledge thatderive from the capacity of schooling to act asan independent influence on reference groupsand thereby create relative deprivations wherenone existed before. The implication is that theexperience of integration with whites may be akey macro-level mechanism driving perceivedinjustice, leading to a fourth comparative con-flict theory hypothesis for adolescents that
Hypothesis 4: The comparative effect of AfricanAmerican racial status on adolescent per-ceptions of criminal injustice increaseswith the proportion of white youth presentas comparative points of reference in theschools.
Yet there may be more to this hypothesis thana simple linear, black-and-white formulationimplies. In reviewing the writings of AfricanAmericans on race relations, Brooks(2000:1256) notes that scholars speculate thatbetter-off blacks are more concerned about thestatus of blacks compared to other groups asopposed to maintaining a specifically black ref-erence group. This pluralization of reference
PPEERRCCEEPPTTIIOONNSS OOFF CCRRIIMMIINNAALL IINNJJUUSSTTIICCEE——––338855
#2322-ASR 70:3 filename:70302-hagan

groups invites an inclusion of Latinos and amacro-level racial gradient into our comparativeconflict analysis, and thus may imply the fol-lowing added hypothesis:
Hypothesis 5: The racial gradient of racial/eth-nic effects on perceived adolescent crimi-nal injustice results in African Americanyouth being comparatively more affectedthan Latino youth by the proportion ofwhite youth in their schools.
The point, of course, is that both African andLatino American students are involved in com-paring their treatment to that of white students.Again, it will be important in assessing thishypothesis to take into account differences inresponses to police contacts; but the implicationof this hypothesis is that especially for AfricanAmerican youth, it may be the novelty of thereduction in separateness and isolation that is asmuch or more salient than the familiar problemof police harassment.
Finally, Runciman (1966:19) makes the poten-tially important assertion that in a pure com-parative model of perceived social and economicoutcomes, there will be observable points wherethe likelihood of dissatisfaction will reach max-imum and minimum levels. He further notesthat Merton and Rossi (1957:7) expect the racial-ly poignant relationship between occupationalopportunity and satisfaction to be curvilinear,and that this requires the sociologist to work outtoward the conditions under which the observedlinear relationship fails to hold.
Merton and Rossi’s prediction bears an inter-esting connection to the idea that there are tip-ping points in processes of residentialintegration and segregation. While the notion oftipping points usually is used pessimisticallyto predict the boundary of unsuccessful minor-ity representation in previously non-minoritycommunities (Schelling 1971), a more opti-mistic hope is that the impact of integration onperceived injustice eventually can reach a pointwhere inclusion with the majority group beginsto become more benign for perceptions of injus-tice. Thus our last and perhaps most policyrelevant hypothesis is that
Hypothesis 6: There is a tipping point to theincremental comparative effect of propor-tion of white youth in schools on racial/eth-nic perceptions of criminal injustice, so thata point may ultimately be reached where
minority-group member perceptions ofinjustice begin to abate.
We cannot estimate in advance what this spe-cific tipping point might be, and there is the fur-ther concern that the public schools’ generalfailure to prevent white flight and to be mean-ingfully integrated place an upper bound on thepossibilities of reaching such a tipping point.Nonetheless, if a tipping point can be estab-lished, it would have obvious policy relevance.It would suggest that there is a point at whichthe ordeal of integration that Patterson describesbegins to become more benign. Patterson’s com-mitment to the ideal of integration implies hisbelief that such a tipping or turning point exists.
TTHHEE CCHHIICCAAGGOO PPUUBBLLIICC SSCCHHOOOOLLSSEETTTTIINNGG
Our test of the above conflict hypotheses isbased on a survey undertaken in the fall of 2001by the Consortium on Chicago School Research(2002). It is important to consider why a surveyat this historical juncture in a large Americancity is timely for the purposes of assessing acomparative conflict perspective. It is now ahalf-century since Brown v. Board of Education1
declared that segregated schools for black andwhite students must be eliminated, and just overa quarter century since Milliken v. Bradley2
marked a reversal in court mandated efforts atcity/suburban desegregation that might havemade real integration a growing reality in majorAmerican cities. Increasingly, the U.S. SupremeCourt has authorized termination of desegre-gation orders.
In January, 2003, a Northern District ofIllinois federal district judge threatened to vacatea 1980 consent decree3 aimed at desegregatingthe Chicago public schools, saying that “theidea that we have a decree . . . seems to me tobe chasing good money after an issue that is nolonger viable or necessary for anybody’s con-sideration.”4 This view was grounded in a
338866——––AAMMEERRIICCAANN SSOOCCIIOOLLOOGGIICCAALL RREEVVIIEEWW
#2322-ASR 70:3 filename:70302-hagan
1 Brown v. Board of Education of Topeka, 347 U.S.483 (1954).
2 Milliken v. Bradley, 418 U.S. 717 (1974).3 Student Desegregation Plan for the Chicago
Public Schools, 2 (1981).4 United States of America v. Board of Education
of Chicago, 80 U.S. 5124 (2003).

supreme court decision that desegregation isnot mandated when the racial composition ofschools is a result of demographic shifts ratherthan segregative acts.5 Opponents of the moveto vacate the 1980 decree, which involved thecreation of magnet schools and other innovativeremedies, argue that the issue is more one of theefficacy of the decree, and that time is requiredto make a factually informed assessment of thelikely benefits of the consent decree.6 The courthas now set the end of the 2005–06 school yearfor reconsideration of the Chicago consentdecree (see Olszewski and Little 2004).
School segregation has been increasing inthe United States since the 1980s (Frankenbergand Lee 2002; Frankenberg, Lee, and Orfield2003). Chicago has the smallest percentage ofwhite students and the largest percentage ofstudents living in poverty among the nation’sfive largest school districts. The proportion ofwhite students in Chicago public schools hasdecreased from 19 percent in 1980 to 9.2 per-cent in 2003. During this same period the pro-portion of black students also has decreasedfrom just over 60 percent (60.6%) to about 50percent (50.9%), while with immigration and ahigher bir th rate, the proportion ofLatino/Hispanic students is now more than onethird (36.4%).
The conflicts accompanying changes in edu-cational and residential segregation in Chicagoare played out through the lives of young peo-ple and prominently feature encounters withthe law, often in ways that link the schools withthe police and justice system. Nearly everyChicago public school has one or more policeofficers stationed in and patrolling its hallways,and in 1992 the Chicago City Council passed a“gang loitering” law, which permitted police toarrest anyone whom they suspected of being agang member for congregating with no appar-
ent legal purpose. The crackdown resulted inmore than 42,000 arrests before a string of courtdecisions ruled the law unconstitutional(Hirschfield 2003). The sheer volume of thesearrests attests to the “experience of the expect-ed” noted earlier. In 1997, Chicago enacted a“reciprocal records agreement,” which requiresthe city police department to release to eachschool’s administrators on a daily basis thenames of youth arrested off campus (ChicagoPublic Schools 1997). These arrests can be usedto justify school suspension and expulsion deci-sions. So there is reason to expect an intercon-nection of school and justice systemexperiences.
By the 1960s, Gerald Suttles (1968) was writ-ing about the racially and ethnically segment-ed neighborhoods of Chicago and resultantconflicts among groups of youth and oftenbetween youth and the police. One notoriouspractice in white neighborhoods involved thepolice picking up African American youthwhom they suspected but could not charge withcrimes. The police dropped these youth off inlocations where they knew they were likely tobe beaten by local residents. A quarter-centurylater this practice again came to light when theChicago Police Board fired several officers wholeft two African American youth in a formerBack of the Yards white neighborhood, wherethey were assaulted by a gang of white youth(Chicago Sun-Times 1992:4). Such incidentspersist as familiar topics of discussion inChicago public schools (see Hagan, Hirschfield,and Shedd 2002:242–43).
TTHHEE DDAATTAA AANNDD TTHHEE VVAARRIIAABBLLEESS
The Chicago Consortium sample of ninth- andtenth-grade students parallels the previousaccount. The sample of schools was stratifiedby geographic location and income to be rep-resentative of the city. Ten of the 101 publichigh schools surveyed were eliminated fromthis analysis because less than 50 students ineach of these schools participated. The responserate is 63 percent in the schools considered inthis research, and our resulting sample contains18,251 students without missing data on thevariables considered. African American stu-dents make up nearly half of the sample,Latino/Hispanic youth form more than a third,white adolescents just over 10 percent, with
PPEERRCCEEPPTTIIOONNSS OOFF CCRRIIMMIINNAALL IINNJJUUSSTTIICCEE——––338877
#2322-ASR 70:3 filename:70302-hagan
5 Pasadena City Board of Education v. Spangler,427 (1976) 424.
6 Memorandum of Amici Curiae–American CivilLiberties Union of Illinois, Chicago LawyersCommittee for Civil Rights Under Law, Inc.,Mexican-American Legal Defense and EducationFund, National Association for the Advancement ofColored People–Chicago Southside Branch, andNational Lawyers Guild–Chicago Chapter, March20, 2003.
Asian American and Native American studentsforming the remaining parts of the sample. Atthe extremes of racial and ethnic educationalsegregation, more than a quarter of the sampledschools are more than 85 percent AfricanAmerican, another 10 percent are more than85 percent Latino/Hispanic, and less than 10percent are more than 30 percent white. The fivemost highly integrated schools in our sample arefrom about one-third to less than one-half white,suggesting that only these few schools are evenconceivably on the cusp of significant racialintegration.
There is by now no doubt that the perceptionof criminal injustice is a scalable contempo-rary phenomenon (e.g., Hagan and Albonetti1982; Wortley, Hagan, and Macmillan 1997;Brooks 2000). The Consortium survey includ-ed five measures of this perceived injustice ina four-point Likert scale ranging from strong-ly disagree to strongly agree responses to the fol-lowing statements:
• People from my racial group are more likely to beunfairly stopped and questioned by the police.
• Police treat young people worse than old people.• Police treat rich people better than poor people.• Police treat people from my racial group worse thanpeople from other racial groups.
• Police treat males worse than females.
The alpha reliability of this construct is .73.The modal response category for all items isagreement, with the exceptions that the modalAfrican American and Latino youth stronglyagree that his or her racial group is more like-ly to be unfairly stopped and questioned by thepolice, while the modal white youth disagreeswith this statement. With strong agreementassigned the highest value and the scale scoresranging from five to 20, ninth- and tenth-gradeChicago youth score an average of 14.16 onthis scale. The results also reflect the predictedracial/ethnic gradient of scores ranging fromAfrican American youth at 14.94, throughLatino youth at 14.20, to white youth at 12.74,and Asian youth at 12.58. At the bivariate level,the difference in scores between AfricanAmerican and white (t = 33.55) youth andAfrican American and Latino (t = 16.48) youthwere highly significant (p < .001).7
Our comparative conflict perspective impliesthat racial and ethnic group membership hasboth individual- and school-contextual-leveleffects on perceptions of injustice. The full setof racial/ethnic, individual level dummy vari-ables presented in Table 1 approximates theschool population described earlier and includesAfrican American (44.7%), white (13%), Asian(4.8%), Latino/Hispanic (37.3%), and AmericanIndian/Alaskan Native (.002%) categories.These categorizations are based on student self-reports of their group membership. The con-textual-level comparative effect of school racialsegregation is measured with the percent whitestudent composition of the schools, whichranges from zero to 45 percent in Chicago. Thispercent white variable is a parsimonious expo-sure measure (Massey and Denton 1988; Orfieldand Lee 2004:9–10) of segregation/integrationthat produces robust and replicable results forthe African American and Latino subsamplesthat form the key groups for our next analysis.A percent white-squared term is included tocapture the nonlinearity (see Jaccard, Turrisi, andWan 1990:50) of the exposure effect indicatedin the tipping point discussion earlier. Forty-oneChicago public high schools have no white stu-dents.
We have noted that socioeconomic status isalso a potential parallel or rival factor in explain-ing perceptions of criminal injustice. TheConsortium survey does not measure studentfamily socioeconomic status directly, but moth-er’s educational attainment is included, withdummy variables ranging from less than highschool graduation (26.1%) to college (19%)and advanced (10.7%) degrees. In addition, wehave included a contextual measure of the per-centage of the school whose families is belowthe poverty level. On the three-point scale sum-marizing the proportion of the school whose stu-dents are low income and qualify forreduced/free lunch programs, the average schoolranks 2.52, indicating that the majority of stu-dents in the average public school is from apoor family.
338888——––AAMMEERRIICCAANN SSOOCCIIOOLLOOGGIICCAALL RREEVVIIEEWW
#2322-ASR 70:3 filename:70302-hagan
explicitly racial items or by including and excludingthe rich/poor people measure, the results were sub-stantively unchanged. See Tables A to D on our ASRonline supplement (http://www.asanet.org/journals/asr/2005/toc045.html).
7 When we varied the measurement of percep-tions of criminal injustice by using only the two

As noted before, the comparative conflictperspective proposed in this paper must furtherconsider the possibilities that African Americanand Latino youth are more involved in non-normative behavior and are in more frequentconflict with the police. It is again important to
acknowledge that this process may occur atboth micro- and macro-levels, influencing notonly the youth involved in non-normative behav-ior and in conflict with the law, but also thosearound them through vicarious peer and groupprocesses.
PPEERRCCEEPPTTIIOONNSS OOFF CCRRIIMMIINNAALL IINNJJUUSSTTIICCEE——––338899
#2322-ASR 70:3 filename:70302-hagan
Table 1. Descriptive Statistics and Descriptions of Variables Used in the Analysis
Variable Mean SD Score Range
Level One: Student Self-Report Data—Male .458 (.498) 0 to 1—Ninth grader .561 (.496) 0 to 1—Blacka .447 (.497) 0 to 1—White .130 (.336) 0 to 1—Asian .048 (.213) 0 to 1—Latino .373 (.484) 0 to 1—American Indian/Alaskan Native .002 (.047) 0 to 1—Mom’s education——Less than high school graduateb .261 (.398) 0 to 1——High school graduate .235 (.424) 0 to 1——Vocational/trade school education .024 (.154) 0 to 1——Some college .183 (.386) 0 to 1——College graduate .190 (.392) 0 to 1——Advanced degree .107 (.309) 0 to 1—Perception of injusticec 14.330 (3.087) 5 to 20—Personal contact with policed 6.345 (2.989) 0 to 12—Personal trouble in schoole 7.265 (2.831) 0 to 21Level Two: School-reported Data—Racial composition: percent white 12.885 (12.813) 0 to 100—Racial composition: percent white squared 330.190 (503.338) 0 to 100—Average contact with police 2.412 (1.422) 0 to 9—Average trouble in school 3.154 (1.947) 0 to 13Controls—Percentage of students in low-income familiesf 2.515 (.686) 1 to 3
a This measure uses student self-report data to construct dummy variables for race. This coding scheme assignsrespondents to only one racial/ethnic group.
b Student’s report on mother’s highest education. This coding scheme assigns mother’s educational attainment toone category.
c Five items were used to construct this ordinal measure of agreement with the following statements (1 = stronglydisagree to 4 = strongly agree). Students were asked: “people from my racial group are more likely to be unfair-ly stopped and questioned by the police.”; “police treat young people worse than old people.”; “police treat richpeople better than poor people.”; “police treat people from my racial group worse than people from other racialgroups.”; “police treat males worse than females.”
d Four items were used to construct this measure of frequency of contact with police (Recoded so that 0 = never,1 = 1–2 times, 2 = 3–5 times, 3 = more than 5 times). Students were asked: how many times in the last yearhave you: “been told off or told to move on by police?”; “been stopped and asked questions by the police?”;“been searched by the police?”; “been arrested by the police?.”
e Seven items were used to construct this measure of frequency of trouble in school (Recoded so that 0 = never,1 = 1–2 times, 2 = 3–5 times, 3 = more than 5 times). Students were asked: how many times this school yearhave you: “gotten into trouble at school?”; “gotten into a physical fight with another student at school?”; “beensent to the office for getting in trouble?”; “been put on in-school suspension?”; “been suspended from school?”;“parents were contacted because of trouble?” and “parents came to the school because of trouble?”
f School administrative data measuring the percentage of students in the school who are low income and qualifyfor reduced/free lunch: 1 = less than 50% low income; 2 = 50%–80% low income; 3 = more than 80% lowincome.

Our measure of non-normative behaviorinvolves getting in trouble at school. This meas-ure is based on responses to items scored on aseven-item scale asking how many times in thecurrent school year have you “gotten into trou-ble at school?”; “gotten into a physical fightwith another student at school?”; “been sent tothe office for getting in trouble?”; “been put onin-school suspension?”; “been suspended fromschool?”; “parents were contacted because oftrouble?”; and “parents came to school becauseof trouble?” African American youth score(7.8) significantly (p < .001) higher than Latino(7.00, t = 18.91) and white (6.86, t = 14.71) stu-dents (Asian adolescents score 6.0) on thisscale. The alpha reliability score for this con-struct is .81. Mean school scores also wereassigned to capture contextual effects of thisschool-based measure of student non-normativebehavior.
Our further measure of personal contact withthe police is based on answers to items askinghow often in the past year youth have been “toldoff or told to move on by police”; “stopped andasked questions by the police”; “searched by thepolice”; and “been arrested by the police”? Bythe time the youth in our sample were in ninthand tenth grade, about half the AfricanAmerican, Latino, and White youth had beentold off/told to move on and stopped and askedquestions by the police, while a quarter to athird had been searched by police, and one-tenth to one-fifth had been arrested. On a four-point scale ranging from never to more thanfive times, African American youth scored (6.6)significantly (p < .001) higher than Latino (6.27,t = 7.63) and white (6.22, t = 6.01) students(Asian adolescents score 4.9) in police contact.The disproportionately low socioeconomic sta-tus of all public school students in Chicagolikely explains the high levels of police contactacross these groups. These relatively high lev-els of contact by ninth and tenth grade againindicate the appropriateness of this age groupfor our study. The alpha coefficient for thisscaled combination of items is .85. Mean schoolscores of police contact were assigned to cap-ture contextual effects of these encounters withthe police.
To establish persuasively the theoretical via-bility of the comparative conflict perspectiveoutlined in this paper, it is necessary to under-take a multilevel as well as multivariate analy-
sis that assesses the micro- as well as macro-level influences of the racial/ethnic/socioeco-nomic group memberships, non-normativebehaviors and police contacts, and school con-texts identified earlier. No previous study hasconsidered this range of factors and levels ofanalysis with a large survey representative of amajor American city such as Chicago.
MMUULLTTIILLEEVVEELL MMOODDEELLSS OOFF PPEERRCCEEIIVVEEDDCCRRIIMMIINNAALL IINNJJUUSSTTIICCEE
The Chicago Consortium survey provides datathat can be analyzed with a nested structureusing appropriately adapted hierarchical linearmodels (HLM) that take into account the non-independence of student responses withinschool contexts. HLM procedures (Bryk andRaudenbush 1992) are used to estimate withinand between school equations simultaneously inthe tables that follow. This approach joins theschool and individual levels of analysis in acommon framework that allows a multilevel,multivariate assessment of our comparative con-flict perspective (see also Sampson,Raudenbush, and Earls 1997). Tables 2 through5 present the results of our HLM estimations forthe full sample and then separately assess non-additive effects of variables such as police con-tacts within the subsamples of white, black, andLatino youth. We use confidence intervals andinteraction terms (see Appendix) to explorewhether variables such as police contacts (andother characteristics) have significantly differ-ent effects across these racial/ethnic groups.
The HLM estimations for the full sample inTable 2 indicate that with the full range ofmicro- and macro-level variables included inModel 4, about 15 percent of the former andtwo-thirds of the latter variation can beexplained in respective individual and school-level perceptions of criminal injustice. Ofcourse, there is greater variation to be explainedin the former individual level than the latterschool level of analysis, and these relative pro-portions of explained variance are consistentwith earlier findings (see, e.g., Sampson andBartusch 1998: Table 3). It is common for small-er levels of explained variation at the individ-ual level to coincide with substantial levels ofexplained variation at higher levels, such asschool context.
339900——––AAMMEERRIICCAANN SSOOCCIIOOLLOOGGIICCAALL RREEVVIIEEWW
#2322-ASR 70:3 filename:70302-hagan

PPEERRCCEEPPTTIIOONNSS OOFF CCRRIIMMIINNAALL IINNJJUUSSTTIICCEE——––339911
#2322-ASR 70:3 filename:70302-hagan
Table 2. Impact of School Racial Composition on Youth Perception of Injustice
Variable Model 1 Model 2 Model 3 Model 4
Level One: Student—Black 2.476*** 2.552*** 2.555*** 2.465***
(.156) (.163) (.169) (.168)—Asian –.068 –.071 –.068 .288
(.234) (.233) (.230) (.204)—Latino 1.606*** 1.627*** 1.627*** 1.671***
(.138) (.139) (.138) (.140)—American Indian/Alaskan Native 1.535** 1.534** 1.484** 1.198**
(.425) (.428) (.429) (.366)—Controls——Male .— .— .575*** –.044
(.055) (.055)——Ninth grader .— .— –.193*** –.201***
(.048) (.048)——Mom’s education———High school graduate .— .— –.121 –.072
(.069) (.063)———Vocational/trade school .— .— –.075 –.143
(.144) (.142)———Some college .— .— .129 .163*
(.076) (.076)———College graduate .— .— –.064 .005
(.077) (.076)———Advanced degree .— .— –.019 .012
(.095) (.094)——Personal contact with police .— .— .— .306***
(.012)——Personal trouble in school .— .— .— .013
(.009)Level Two: School—Percent white .— .046** .044** .036**
(.012) (.013) (.013)—Percent white squared .— –.0008** –.0008* –.0007*
(.0003) (.0003) (.0003)—Controls——School 50%–80% low income .— .— .071 .127
(.139) (.139)——School 80%–95% low income .— .— –.064 –.055
(.115) (.130)——Average student contact with police .— .— .— –.210
(.111)——Average student trouble in school .— .— .— –.128*
(.058)——Constant 12.472*** 12.208*** 12.120*** 12.565***
(.135) (.173) (.215) (.272)Level One Variance 8.718 8.718 8.626 7.900Explained Variation .057 .057 .067 .146Level Two Variance .149 .100 .097 .090Explained Variation .429 .617 .628 .655Level One N 18251 18251 18251 18251Level Two N 91 91 91 91
Note: Data shown as hierarchical linear model (HLM) regressions; standard errors are shown in parentheses.Reference categories: race = white; mom’s education = less than high school; school percent of low incomestudents = less than 50%.* p < .05; ** p < .01; *** p < .001 (two-tailed).
Model 1 in Table 2 contains the fourracial/ethnic categories of adolescents who canbe compared with the omitted category of whiteyouth in our analysis of the Chicago schooldata. While Asian youth are not significantly dif-ferent in their perceptions of criminal injustice
than whites in this estimation, all the remaininggroups are significantly different (p < .01), withthe expected gradient of African American youth(2.48) perceiving more injustice relative towhites than do Latinos (1.61), and the latterscoring just higher than Native American youth
339922——––AAMMEERRIICCAANN SSOOCCIIOOLLOOGGIICCAALL RREEVVIIEEWW
#2322-ASR 70:3 filename:70302-hagan
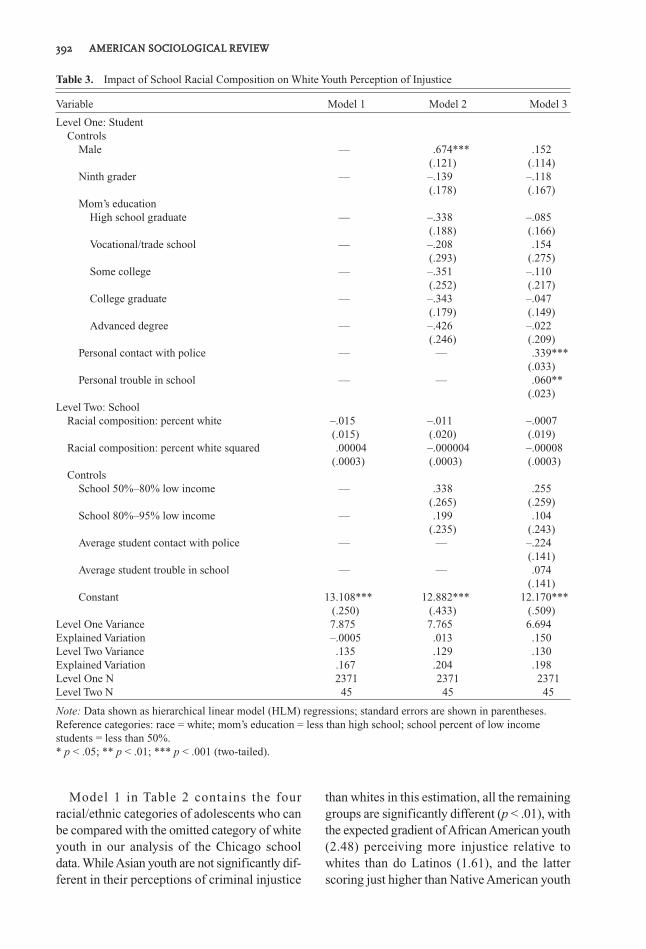
Table 3. Impact of School Racial Composition on White Youth Perception of Injustice
Variable Model 1 Model 2 Model 3
Level One: Student—Controls——Male .— .674*** .152
(.121) (.114)——Ninth grader .— –.139 –.118
(.178) (.167)——Mom’s education———High school graduate .— –.338 –.085
(.188) (.166)———Vocational/trade school .— –.208 .154
(.293) (.275)———Some college .— –.351 –.110
(.252) (.217)———College graduate .— –.343 –.047
(.179) (.149)———Advanced degree .— –.426 –.022
(.246) (.209)——Personal contact with police .— .— .339***
(.033)——Personal trouble in school .— .— .060**
(.023)Level Two: School—Racial composition: percent white –.015 –.011 –.0007
(.015) (.020) (.019)—Racial composition: percent white squared .00004 –.000004 –.00008
(.0003) (.0003) (.0003)—Controls——School 50%–80% low income .— .338 .255
(.265) (.259)——School 80%–95% low income .— .199 .104
(.235) (.243)——Average student contact with police .— .— –.224
(.141)——Average student trouble in school .— .— .074
(.141)——Constant 13.108*** 12.882*** 12.170***
(.250) (.433) (.509)Level One Variance 7.875 7.765 6.694Explained Variation –.0005 .013 .150Level Two Variance .135 .129 .130Explained Variation .167 .204 .198Level One N 2371 2371 2371Level Two N 45 45 45
Note: Data shown as hierarchical linear model (HLM) regressions; standard errors are shown in parentheses.Reference categories: race = white; mom’s education = less than high school; school percent of low incomestudents = less than 50%.* p < .05; ** p < .01; *** p < .001 (two-tailed).

(1.54). The relative size and significance of theadditive African American and Latino maineffects provide preliminary support for our firsttwo comparative conflict hypotheses and theearlier report of mean group differences. Thenon-overlapping .95 confidence intervals forthe African American (2.17/2.78) and Latino(1.34/1.88) youth coefficients confirm not onlythat both of these groups score higher thanwhites, but that there is a significant gradientbetween these effects. The Native Americanfinding also is of obvious potential interest,although we do not pursue this further herebecause of the limited size of this group in ourChicago sample.
Model 2 in Table 2 introduces our consider-ation of school-level variables with our percentwhite measure of school integration, and witha percent white-squared measure also includedto capture the possibility that the effect of stu-dent racial composition changes as it movestoward a potential tipping point. Both of theseeffects are significant (p < .01) in Model 2,with a positive effect of percent white (.05)indicating that perceptions of criminal injus-tice increase with the integration of whites intothe Chicago public schools, and with a furtherand smaller negative effect of percent white-squared (-.0008) indicating that this trend ulti-mately begins to decline. No further change ofdirection was indicated when we added a cubedterm to the HLM equation. These school-leveleffects lend preliminary support for our fourthand sixth hypotheses about the sense of relativedeprivation for minorities that may at firstincrease and then ultimately abate with inte-gration of white students into public schools.
Models 3 and 4 add into the analysis controlsfor the parallel and rival influences of individ-ual and school-level variables. At the individuallevel in Model 3 of Table 2, we see that malesperceive significantly more criminal injusticethan females (.58, p < .001), and that ninthgraders perceive less than tenth graders (-.19,p < .001). There is no significant evidence at theschool level in Model 3 that perceptions ofinjustice are greater in poorer than more afflu-ent schools. The hypothesized individual andschool-level racial/ethnic effects remain sig-nificant in Model 3, net of all other includedvariables.
The racial/ethnic effects further persist intheir significance when the individual and
school-level measures of contact with policeand trouble in school are introduced in Model4. The most salient of these variables is indi-vidual-level personal contact with the police(.31, p < .001), which notably increases per-ceptions of criminal injustice. The school-leveleffects of average student police contact andtrouble in school are negative and the latter isstatistically significant in this model (p < .05),but these effects do not persist in followingtables and therefore are not discussed furtherhere. Overall, the results in Table 2 provide fur-ther support for our first two hypotheses aboutthe additive gradient in the micro-level AfricanAmerican and Latino adolescents’ perceptionsof criminal injustice relative to those of whites,as well as preliminary support for the fourth andsixth hypotheses of macro-level effects of schoolsegregation on these perceptions. Only theschool-level effect of percent white-squareddecreases in statistical significance in Model 4,and this effect is still significant at the .05 level.To assess more thoroughly, however, our thirdhypothesis about the role of police contacts forthe micro-level gradient in race/ethnicity effectsand our fifth hypothesis about a macro-levelracial/ethnic gradient in the effects of schoolsegregation, we next consider the likelihood ofnonadditive effects within the racial and ethnicsubsamples. The gradient in the values of theintercepts in later tables suggest that group-based racial differences in perceptions retaintheir main effects; however, there is evidence ofnonadditive influences as well, as we see next.
We initially modified the equations estimat-ed in Table 2 by adding interaction terms andalternating the omitted racial reference group.The results, presented in Appendix Tables Al andA2, indicate that a number of significant inter-actions occur by race. These interactions can bebetter understood by examining our data with-in the white, African American, and Latino sub-samples. Table 3 provides a benchmark bypresenting HLM estimations for the subsampleof white youths that can be compared with sub-sequent estimations for African American andLatino subsamples in following tables. We high-light the school effects of segregation on per-ceptions of criminal injustice by estimatingthese effects alone in Model 1 of the followingthree tables. As implied by a comparative con-flict perspective, the percent white and percentwhite-squared variables have no significant
PPEERRCCEEPPTTIIOONNSS OOFF CCRRIIMMIINNAALL IINNJJUUSSTTIICCEE——––339933
#2322-ASR 70:3 filename:70302-hagan

effects when estimated in the white subsamplein Table 3. Being male still has a pronouncedeffect on the perception of criminal injusticeamong white youth (.67, p < .001) in Model 2.Meanwhile, both the individual-level contactwith police (.34, p < .001) and trouble in school(.06, p < .01) variables added in Model 3 ofTable 3 lead to greater perceived injustice, whileneither of the school-level police contact norschool trouble variables have significant effects,and the school-level low-income variables arenonsignificant as well. The salient causes ofperceived criminal injustice among white youthare the individual-level police contact andschool-trouble variables, which reduce the onlyremaining notable effect of being male to non-significance in Model 3.
Table 4 presents a more complex picture forAfrican American youth. While the percentwhite and percent white-squared exposure meas-ures were unsurprisingly nonsignificant forwhite youth, they are both notably significantfor African American youth in Model 1 of Table4. The combination of these positive (.07, p <.001) and negative (–.002, p < .01) effectsrespectively provide support for our fourthhypothesis that the comparative effect of beingAfrican American increases with the proportionof white students in schools—until at somepoint this influence peaks and then begins todecline, as anticipated in our sixth tipping pointhypothesis. These effects remain robust throughthe addition of remaining variables in Models2 and 3.
The final Model 3 results confirm that forAfrican American youth, perceptions of crimi-nal injustice increase among the older children(i.e., the ninth grader coefficient is –.20, p < .01)of mothers with some college education (.44, p< .001) and who have had contact with thepolice (.26, p < .001). Note that the latter policecontact effect, while it is still highly signifi-cant, is somewhat reduced from the full sampleand the white subsample, further illustratingthe “experience of the expected” that a greaterfamiliarity with police contacts may produce. Itis notable that in this third Model, with per-sonal contact with the police included, the effectof being male actually becomes significantlynegative (–.22, p < .01). The latter effects do lit-tle to diminish the school-level influence of theschool segregation variables, percent white (.07,
p < .001) and percent white-squared (–.001, p< .01), which persist in their significance.
Table 5 presents a somewhat different picturefor Latino youth. The percent white (.04, p < .05)measure is again significant for Latino youth inModel 1 of Table 5. The effects of percent whiteand percent white squared are modestlyincreased and both are statistically significant(p < .05) with the addition of remaining vari-ables in Model 3. These slightly weaker effectsfor Latino compared to African American youthare in the predicted direction of our fifth hypoth-esis that extends the micro-level gradient to themacro-level, although some overlap in confi-dence levels for these percent white coefficientsfails to provide full statistical support for thispredicted gradient.8 So there is only partial sta-tistical support for the fifth macro-level gradi-ent hypothesis.
The final Model 3 results in Table 5 indicatethat for Latino youth, perceptions of criminalinjustice increase among older children (i.e.,the ninth grader coefficient is –.26, p < .001) ofmothers without college education (i.e., themother with some college coefficient is –.21, p< .05) and who have had contact with the police(.36, p < .001). The opposite effects of some col-lege education among mothers of Latino andAfrican American youth (i.e., decreasing theseperceptions among Latinos and increasing themamong African Americans), is further confirmedby non-overlapping confidence intervals at the.95 level (–.383/.027 and .258/.630). The policecontact variable is significant and more salientin its effect among Latino than AfricanAmerican youth, with non-overlapping .95 con-fidence intervals (.337/.389; .232/.288). Thisfinding indicates that Latino youth are moresensitive to (and their perceptions therefore aremore negatively influenced by) police contactsthan are African American youth. White studentsare more like Latino than black students in theirsensitivity to police contacts (.339, p < .001),which likely reflects the reduced experience ofboth of the former groups with these contacts.Later we return to the argument that it is the
339944——––AAMMEERRIICCAANN SSOOCCIIOOLLOOGGIICCAALL RREEVVIIEEWW
#2322-ASR 70:3 filename:70302-hagan
8 The confidence intervals are nearly non-over-lapping for the percent white variable among whiteyouth (–.038/.036) and African American youth(.033/.099), with Latino youth, as expected, inbetween (.001/.079).

familiarity of the police threat and the “expe-rience of the expected” that helps to explain thelower police contact effect on perceptions ofAfrican American youth. Meanwhile, the policecontact variable removes but does not reversethe gender effect among Latinos (as we saw it
do earlier with African American youth).Interestingly, while personal trouble at schoolsignif icantly increases perceived criminalinjustice among whites, it is nonsignificantfor both Latinos and African American ado-lescents.
PPEERRCCEEPPTTIIOONNSS OOFF CCRRIIMMIINNAALL IINNJJUUSSTTIICCEE——––339955
#2322-ASR 70:3 filename:70302-hagan
Table 4. Impact of School Racial Composition on Black Youth Perception of Injustice
Variable Model 1 Model 2 Model 3
Level One: Student—Controls——Male .— .372*** –.219**
(.078) (.080)——Ninth grader .— –.213** –.197**
(.077) (.071)——Mom’s education———High school graduate .— –.103 –.019
(.107) (.100)———Vocational/trade school .— –.172 –.212
(.235) (.234)———Some college .— .350*** .444***
(.092) (.093)———College graduate .— .051 .164
(.136) (.131)———Advanced degree .— .084 .152
(.137) (.130)——Personal contact with police .— .— .260***
(.014)——Personal trouble in school .— .— .000
(.013)Level Two: School—Racial composition: percent white .074*** .068*** .066***
(.016) (.016) (.017)—Racial composition: percent white squared –.0015** –.0014** –.0014**
(.0004) (.0004) (.0004)—Controls——School 50–80% low income .— –.069 –.058
(.191) (.179)——School 80–95% low income .— –.148 –.153
(.155) (.175)——Average student contact with police .— .— –.169
(.124)——Average student trouble in school .— .— –.089
(.059)——Constant 14.669*** 14.697*** 14.946***
(.085) (.178) (.272)Level One Variance 9.391 9.334 8.827Explained Variation .000 .006 .060Level Two Variance .142 .132 .134Explained Variation .401 .443 .435Level One N 8151 8151 8151Level Two N 80 80 80
Note: Data shown as hierarchical linear model (HLM) regressions; standard errors are shown in parentheses.Reference categories: race = white; mom’s education = less than high school; school percent of low incomestudents = less than 50%.* p < .05; ** p < .01; *** p < .001 (two-tailed).

To get a fuller picture of the effects on youthperceptions of police contacts and the integra-tion of whites into Chicago schools, we presentin Figure 1 a graphical representation of eachgroup’s scores calculated at zero, 15, 30, and 45percent white intervals. This figure further dis-
plays the nonadditive impact of structural dif-ferences in effects of police contacts among theracial/ethnic groups while holding composi-tional differences in these contacts more fullyconstant. This is important because while aswe have noted African American youth have
339966——––AAMMEERRIICCAANN SSOOCCIIOOLLOOGGIICCAALL RREEVVIIEEWW
#2322-ASR 70:3 filename:70302-hagan
Table 5. Impact of School Racial Composition on Latino Youth Perception of Injustice
Variable Model 1 Model 2 Model 3
Level One: Student—Controls——Male .— .709*** –.011
(.090) (.090)——Ninth grader .— –.228** –.262***
(.068) (.070)——Mom’s education———High school graduate .— –.065 –.068
(.102) (.089)———Vocational/trade school .— .081 –.083
(.221) (.203)———Some college .— –.090 –.205*
(.095) (.089)———College graduate .— –.061 –.095
(.104) (.091)———Advanced degree .— .100 –.062
(.148) (.151)——Personal contact with police .— .— .363***
(.013)——Personal trouble in school .— .— .002
(.011)Level Two: School—Racial composition: percent white .039* .038 .044*
(.019) (.021) (.018)—Racial composition: percent white squared –.00082 –.00083 –.00099*
(.00043) (.00046) (.00041)—Controls——School 50–80% low income .— –.093 –.272
(.213) (.200)——School 80–95% low income .— –.132 –.250
(.218) (.169)——Average student contact with police .— .— .093
(.135)——Average student trouble in school .— .— –.121
(.087)——Constant 13.964*** 13.909*** 13.669***
(.106) (.270) (.378)Level One Variance 8.223 8.093 7.124Explained Variation .000 .016 .134Level Two Variance .106 .119 .070Explained Variation .086 –.026 .400Level One N 6815 6815 6815Level Two N 71 71 71
Note: Data shown as hierarchical linear model (HLM) regressions; standard errors are shown in parentheses.Reference categories: race = white; mom’s education = less than high school; school percent of low incomestudents = less than 50%.* p < .05; ** p < .01; *** p < .001 (two-tailed).

more contact with the police, Latino youths’per-ceptions of injustice are more strongly affect-ed by their police contacts (i.e., see again Model3 in Tables 4 and 5). We have argued that it isthe familiar “experience of the expected” thatreduces the police contact effect among AfricanAmerican youth. This difference makes it note-worthy to consider structural and composition-al variation of police contacts in assessing ourthird hypothesis, namely, that responses to policecontacts may be an important factor in produc-ing similarities as well as differences in Latinoand African American perceptions of criminalinjustice. We examine the latter possibilities byusing the full prediction equations in Model 3of Tables 3 through 5. In our use of these pre-diction equations, we initially allow the struc-tural coefficients to vary among groups, whileholding compositional differences constant bysubstituting the overall sample means into theprediction equations.
Thus in Figure 1 we allowed the structuraleffects to vary by using the group-specific coef-
ficients, and we held the compositional differ-ences among groups constant by creating a newgeneric respondent: a male, in tenth grade,whose mother has less than a high school edu-cation, whose personal and school contacts withthe police and trouble in school are set one stan-dard deviation above the overall sample means,and whose school percent low income is 80 to95 percent. More specifically, in the calculationsfor Figure 1 we allowed the nonadditive differ-ence in structural coefficients for the effects ofpolice contacts among the African American(.260) and Latino (.363) youth to vary, while weused the overall sample mean of police con-tacts (5.336) to hold compositional differencesconstant. When for comparative purposes wefurther allowed the compositional differences inmean police contacts for African American(5.647) and Latino (5.237) youth to vary, theAfrican American calculation increased onlyslightly and the Latino calculation was nearlyunchanged. The implication is that it is thegreater structural sensitivity of Latino youth to
PPEERRCCEEPPTTIIOONNSS OOFF CCRRIIMMIINNAALL IINNJJUUSSTTIICCEE——––339977
#2322-ASR 70:3 filename:70302-hagan
Figure 1. Impact of School Racial Composition on Perception of Injustice by Racial/Ethnic Group
Note: The “average student” is calculated as follows: gender = male; grade = 10th; mom’s education = less thanhigh school; personal contact with police = one standard deviation above the mean (5.336); personal trouble inschool = one standard deviation above the mean (6.796); school percent low income = 80%–95%; average studentcontact with police = one standard deviation above the mean (3.835); average trouble in school = one standarddeviation above the mean (5.101).

police contacts, rather than the higher compo-sitional vulnerability of African American youthto police contacts, that is more consequential indriving the respective perceptions of criminalinjustice.
The findings presented in Figure 1 suggestthat the heightened structural sensitivity ofLatino youth to contacts with police can resultin their predicted perceptions of injusticebecoming similar and initially even surpassingthose of African American youth. At zero per-cent white, we now see that the Latino youth areactually even more sensitive to perceived crim-inal injustice than the African American youth.At 15 and 30 percent white, we see a levelingoff of the peak scores of the Latino and AfricanAmerican perceptions at about 15.5 on the per-ceived criminal injustice scale. That is, as theestimation moves to schools with some whiterepresentation, the Latino and African Americanscores coincide in the middle part of the figure.This convergence occurs because, as we saw ear-lier, African Americans are more sensitive toracial integration than Latinos. Finally, at 45 per-cent white, we see the faster decline of AfricanAmerican perceptions and the slightly moremodest decline in Latino perceptions. In theselatter handful of schools that begin to providemore than a token level of white student inte-gration, the Latino and African American scoresdecline by about a half point to approximately15. The results in Figure 1 therefore indicatethat, as anticipated in hypothesis three, thestronger reactions of Latino youth to policecontacts can offset the lower frequency of theircontacts with police and contribute to a con-vergence in African American and Latino per-ceptions of criminal injustice. Meanwhile, theLatino and African American scores are stillnearly a point higher than the white studentscores. Both police contacts and integration ofschools have notable impacts on AfricanAmerican and Latino youths’ perceptions ofcriminal injustice, while the police contact effectis especially notable for Latinos, and the seg-regation/integration effect is somewhat morenotable for African Americans.
We also carried out a final sensitivity analy-sis of our finding (i.e., with the school measureof percent white-squared) that integration ofwhites at levels that begin to approach parityresult in some abatement in perceptions of crim-inal injustice for Latinos and African Americans.
This analysis proceeded by reestimating thefinal structural equations for African Americansand Latinos after removing schools from thesample, one at a time, in the order of their per-cent white population.9 This analysis revealsthat for Latino youth it is the top five schoolsin percent white population, and for AfricanAmerican youth the top four schools in percentwhite population, that account for the abate-ment in perceived injustice. It is notable that thiseffect, with this unusual opportunity for repli-cation across groups, holds separately and sim-ilarly for Latino and African American youth inthe Chicago schools that range from about onethird to 45 percent white.
TTHHEE CCOOGGNNIITTIIVVEE LLAANNDDSSCCAAPPEESS OOFFCCRRIIMMIINNAALL IINNJJUUSSTTIICCEE
Sampson and Bartusch (1998:800) suggest themetaphor of “cognitive landscapes” to describethe demographic and ecological structuring oftroubled American settings where “crime anddeviance are more or less expected and institu-tions of criminal justice are mistrusted.” Thecontours of these contemporary American land-scapes are becoming clearer as surveys attendto the multiple groupings and age-graded set-tings in which citizens and law enforcementofficials come into contact. We have chosen tofocus on young persons in secondary schoolsbecause perceptions of justice and politicalinstitutions are formed at relatively young agesand remain persistent through adulthood. Ourfindings reveal that while perceptions of crim-inal justice become more negative in middleadolescence among Latino and AfricanAmerican youth, this is not apparent amongwhite youth of the same ages in our sample.
Mental maps of distrust have both generic anddifferentiated features, including on the onehand shared skepticism of a range of govern-mental institutions in addition to agencies ofcriminal justice, and on the other hand group-specific perceptions varying along dimensionswith differences and similarities that a com-parative conflict theory can identify and help toexplain. We have argued that the development
339988——––AAMMEERRIICCAANN SSOOCCIIOOLLOOGGIICCAALL RREEVVIIEEWW
#2322-ASR 70:3 filename:70302-hagan
9 The results of this analysis are summarized inTable E on our ASR online supplement (http://www.asanet.org/journals/asr/2005/toc045.html).

of a comparative conflict perspective on per-ceived criminal injustice requires a nuancedunderstanding of the relative positions of sub-ordinate and dominate groups who form rela-tive and collective points of reference for oneanother.
In large American cities where Latino andAfrican Americans live, work, and attend schoolin varying degrees of proximity to one anotheras well as with whites, there is an implicit racialgradient of relative subordination. A compara-tive conflict theory emphasizes that in the aggre-gate, African American youth are at heightenedcomparative risk of justice system surveillance,apprehension, and mistreatment relative toLatino Americans, who in turn are at greater riskthan whites. These differential risks probablylead black youth collectively to perceive morecriminal injustice than Latino youth, who inturn perceive more criminal injustice that theirwhite counterparts. Yet we know little of themechanisms by which these comparative assess-ments are formed and of how the familiaritywith police harassment among AfricanAmerican urban youth influences their percep-tions.
We have found evidence that white and Latinoas well as black youth are sensitive to elevatedlevels of police contact, as reflected by the directeffect of these contacts on their perceptions ofcriminal injustice. While African Americanyouth are in relative terms exposed more fre-quently to police contacts, however, white aswell as Latino youth may actually be more sen-sitive to police contacts when they are subject-ed to them. Since Latino youth have a higherbase level of perceived criminal injustice thanwhite youth, this sensitivity is especially con-sequential for them. We have shown that whenperceptions of criminal injustice are estimatedwith differences in responses to police contactsthat are allowed to vary across groups, Latinoyouth appear much more incredulous than whiteyouth of the justice system, and are more com-parable to black youth. That is, when we allowstructural differences between the effects ofpolice contacts on black and Latino youth tovary, their perceptions of criminal injusticeappear more similar, while both of these groupsstill perceive more criminal injustice than whiteyouth. Latino youth, who are less familiar withpolice harassment than African American youth,may fear that their contacts with the police place
them in a similar risk status as black youth. Inthis important sense, there is commonality aswell as difference in African American andLatino experiences of criminal injustice.
The comparative perceptions of Latino andAfrican American youth are further shaped bythe frames of reference that result from theirdaily experiences in school. As scholars such asOrlando Patterson and Richard Brooks note,segregated residential and educational settingsrestrict the perceptions of ghettoized AfricanAmerican and Latino youth, while more inte-grated institutional experiences increase con-tacts and comparisons across groups,intensifying their relative sensitivity and plac-ing them on heightened alert for differentialtreatment. As this comparative frame of refer-ence expands to include an awareness of the rel-ative and group-specific risks of exposure tomistreatment, members of groups who feeluniquely targeted by the police and courtsappear more sensitive to the perception of injus-tice. In such contexts, the familiar “experienceof the expected” can be newly perceived as out-rageous. Patterson calls this the outrage of lib-eration. We found this pattern in Chicago publichigh schools among both Latino and AfricanAmerican youth who become more sensitiveto perceptions of injustice as they are exposedto low but increasing percentages of white stu-dents in their schools.
Yet there is also a limited linearity of thiseffect of white representation on the compara-tive experience of school environments. That is,there appear to be potential minimums and max-imums to the experience of relative deprivationand subordination in educational settings.Chicago public high schools have become morerather than less segregated since the early 1980s,and a large proportion of these schools have veryfew white students. We found that as the pro-portion of white students at first increases, sotoo do perceptions of relative criminal injustice.Patterson further refers to this as the ordeal ofintegration. Yet, as Patterson’s work also implies,in the four or five Chicago public high schoolswhere the proportion of white students rangesfrom about one-third to one-half, the gaps inminority perceptions of criminal injustice, forAfrican American and Latino youth relative towhites, begin to decline. The replication of theparallel finding of the increase and abatementof perceptions of injustice is striking in its
PPEERRCCEEPPTTIIOONNSS OOFF CCRRIIMMIINNAALL IINNJJUUSSTTIICCEE——––339999
#2322-ASR 70:3 filename:70302-hagan

appearance in the separate subsamples ofAfrican American and Latino youth.
It is possible if not probable that there is amacro- as well as micro-level racial gradient tothe rise and fall of African and Latino Americanperceptions of criminal injustice. That is, wehave found not only persuasive evidence at themicro-level that African American youth per-ceive higher levels of criminal injustice thanLatino youth, and that the perceptions of bothgroups rise and then decline in association withthe proportion of white students in their schools,but also suggestive further evidence (in direc-tion and size if not statistical significance) thatwith increasing representation of whites in pub-lic schools, the elevation and reduction in per-ceived injustice relative to whites is moreintensely felt by African American than Latinoyouth.
In any case, regardless of the statistical sig-nificance of the latter differential sensitivity,there is compelling evidence that the perceptionsof criminal injustice among both African andLatino American youth are at first intensifiedand then modestly improved by the increasingproportionate representation of white studentsin their schools. For policy purposes, it is prob-ably this similarity that is most significant, forthese macro-level contextual effects imply thatintegration of whites into public schools mustreach critical levels that approach parity beforebenef its are realized among both AfricanAmerican and Latino youth. Unfortunately, thisfinding comes at a time when contemporaryefforts to advance the integration of Americanschools in general, and Chicago schools in par-ticular, are in decline.
Meanwhile, it is a possible further irony ofthis paper that efforts to make city schools saferthrough increased deployment of the police mayhave the unintended consequence of alienatingthe students who are ostensibly being protect-ed. This makes it important to consider ways thatpolice behavior can be modified to reduce someof the hostility that it generates among minor-ity youth. Vrij and Winkel (1992) observe intheir research that when police adopt a morerespectful attitude in interactions with AfricanAmerican youth, potential conflict can be dimin-ished. Our findings similarly suggest the poten-tial benefits of such possibilities.
The results of our research represent onlyone American city, yet this city is large and the
sampling of its public schools is comprehensive,and we believe that there are added reasons totake these findings seriously. The hierarchicallinear models and measurements applied in thisstudy surpass earlier research on perceived crim-inal injustice, and they parallel state-of-the-artstudies of contextual effects in other venues(see especially Sampson, Raudenbush, and Earls1997; Sampson, Morenoff, and Earls 1999) byassessing individual differences in schoolsocioeconomic and behavioral composition aswell as prior and concurrent individual-levelnon-normative behavior and police contacts.Notwithstanding these controls, the net effectsof school racial integration that we have foundremain robust predictors of African Americanand Latino perceptions of criminal injustice.We find evidence of both similarity and differ-ence in African American and Latino percep-tions of criminal injustice, but in the end it is thesimilarities between these group experiences,rather than the differences, that are perhapsmost important.
Still, further research is required. Only ahandful of Chicago schools approach the criti-cal levels of white integration required to assessits effects. We have implied that a representa-tion of white students at levels of one-third ormore may be close enough to parity to begin toproduce mitigating perceptual and attitudinaleffects. It is notable that the macro-level controlsin this analysis for socioeconomic status andnon-normative school behavior parallel thekinds of controls introduced in related educa-tional research (e.g., Johnson, Crosnoe, andElder 2001:324–25). Chicago, however, is acity with a very distinct as well as important his-tory of racial segregation that may produceunique as well as more generic consequences foradolescents in its public schools. Further elab-orations and tests of a comparative conflict the-ory will usefully examine urban, rural, andsuburban jurisdictions with higher levels ofracial integration and varying levels of affluence.
It will also be important to develop and assessmediating links in this theoretical approach thatspecify the kinds of school- and community-connected experiences and cognitive processesthat accompany changing perceptions of crim-inal injustice. We have found an interesting dif-ference in the effect of mothers’ education onyouth perceptions among African American andother youth, with some college experience most
440000——––AAMMEERRIICCAANN SSOOCCIIOOLLOOGGIICCAALL RREEVVIIEEWW
#2322-ASR 70:3 filename:70302-hagan

notably resulting in black youth perceivinggreater injustice. While we have speculated thatthis may be a further instance of the “outrage ofliberation” discussed in Patterson’s research, aweaker and reverse pattern is observed amongLatino youth, and more research is needed.
Finally, more work also is needed to assessthe behavioral consequences of the perceptionswe have explored to determine, for example,whether, and if so how, perceptions of injusticegenerate different kinds of behavioral (includ-ing delinquent and criminal) adaptations orresponses, perhaps depending on the levels andsources of the perceptions. Here again, the issueof a tipping point could prove crucial. Suchresearch has the potential to assist policymak-ers as well as sociologists in developingimproved theories and practices linking educa-tion and criminal justice, which are two increas-ingly connected public institutions, for better orworse, in a changing American society.
John Hagan is John D. MacArthur Professor ofSociology and Law at Northwestern University andSenior Research Fellow at the American BarFoundation. His most recent books are Justice in theBalkans: Prosecuting War Crimes at The HagueTribunal (University of Chicago Press, 2003) andNorthern Passage: American Vietnam War Resistersin Canada (Harvard University Press, 2001), whichreceived the 2003 Albert J. Reiss Award from theCrime, Law and Deviance Section of the AmericanSociological Association.
Carla Shedd is a Ph.D. Candidate in the Departmentof Sociology at Northwestern University and is aPre-Doctoral Fellow at the American Bar Foundationin Chicago. Her research interests include race/eth-nicity, crime, inequality, and the sociology of law. Shehas been awarded Pre-Doctoral Fellowships fromthe American Bar Foundation, the NorthwesternUniversity Center for Legal Studies, the NationalConsortium on Violence Research and Bryn MawrCollege.
Monique R. Payne is Assistant Professor in theDepartment of Sociology at DePaul University. Herresearch interests focus on the intersection betweenstratification, education, and race/ethnicity.
AAPPPPEENNDDIIXX
TTEESSTTSS OOFF IINNTTEERRAACCTTIIOONNSS BBYY RRAACCEE//EETTHHNNIICCIITTYY
Appendix Table Al estimates equations thatbuild on those estimated in Table 2 of the textby adding interaction terms assessing the expec-
tation that African American youth in particu-lar may have distinctive responses to policecontacts and school composition. We noted ear-lier that there may be a “familiarity of theexpected” that suppresses African Americanyouth responses to contacts with the police.However, Patterson’s “paradox of integration”is that an “outrage of liberation” (i.e., inresponse to a growing awareness of the collec-tive experience of blacks) may emerge withincreased exposure to white students in school.We examined these possibilities first with inter-action terms representing the nonadditive effectsof black student responses to police contacts andblack student responses to increased exposureto white students (i.e., as a percentage and per-centage-squared of the school population) onperceptions of criminal injustice. We alsoincluded an interaction term for black mothershaving some college experience, with the expec-tation that this expanded educational experi-ence as well might be a source of an “outrageof liberation.” Latino interaction terms also areincluded in this table.
The interaction terms were first introduced inpairs and then all together in the four columnsof Table Al. In Table A1 only white, black andLatino youth are included. In these analyses,white youth serve as the comparison category.When introduced in pairs, several of the blackyouth interaction terms are statistically signif-icant: relative to white youth, black studentswho have contact with the police are less pro-voked to perceive injustice (–.146, p < .001);black students whose mothers have some col-lege experience are significantly more likely toperceive criminal injustice (.477, p < .05); andblack students who are exposed to proportion-ately more white students in school perceivesignificantly more injustice (.079, p < .05).When these interaction terms are introduced inthe same equation in the last column of TableAl, they remain statistically significant. Noneof the Latino interaction terms in this table is sig-nificant at the .05 level.
Table A2 follows the pattern of Table A1,with the exception that only black and Latinoyouth are included in the analyses. Black youthare the reference group, which allows us tocompare the impact of the variables for blackand Latino youth. When introduced in pairs,three of the four Latino youth interaction termsare now statistically significant, so that rela-
PPEERRCCEEPPTTIIOONNSS OOFF CCRRIIMMIINNAALL IINNJJUUSSTTIICCEE——––440011
#2322-ASR 70:3 filename:70302-hagan

440022——––AAMMEERRIICCAANN SSOOCCIIOOLLOOGGIICCAALL RREEVVIIEEWW
#2322-ASR 70:3 filename:70302-hagan
Table A1. Test of Race Interactions on Youth Perception of Injustice
Variable Model 1 Model 2 Model 3 Model 4
Level One: Student—Black 2.805*** 2.351*** 1.668*** 1.984***
(.187) (.167) (.318) (.322)—Latino 1.699*** 1.665*** 1.201*** 1.262***
(.163) (.147) (.318) (.318)Controls—Male –.068 –.080 –.083 –.068
(.054) (.054) (.054) (.054)—Ninth grader –.217*** –.216*** –.217*** –.219***
(.051) (.050) (.051) (.051)—Mom high school graduate –.077 –.052 –.064 –.058
(.065) (.065) (.066) (.065)—Mom vocational/trade school education –.170 –.148 –.173 –.141
(.139) (.140) (.139) (.138)—Mom some college .137 –.069 .155* –.086
(.075) (.180) (.077) (.177)—Mom college graduate –.014 .036 .002 .027
(.073) (.073) (.074) (.072)—Mom advanced degree –.010 .034 –.008 .023
(.094) (.093) (.095) (.094)—Personal contact with police .387*** .306*** .306*** .383***
(.023) (.012) (.012) (.022)—Personal trouble in school .006 .010 .009 .007
(.009) (.009) (.009) (.009)Level Two: School—Percent white .039** .039** –.012 –.009
(.014) (.014) (.023) (.023)—Percent white squared –.001* –.001* –.00002 –.00005
(.0003) (.0004) (.0004) (.0004)Controls—School 50–80% low income .127 .135 .145 .128
(.130) (.134) (.134) (.129)—School 80–95% low income –.025 –.037 –.082 –.073
(.123) (.126) (.132) (.127)
—Average student contact with police –.196 –.208* –.164 –.145(.103) (.104) (.105) (.103)
—Average student trouble in school –.118* –.121* –.117* –.110*(.054) (.054) (.052) (.052)
Interaction Terms—Black by contact with police –.146*** .— .— –.140***
(.024) (.023)—Latino by contact with police –.024 .— .— –.020
(.025) (.024)—Black by mom some college .— .477* .— .463*
(.191) (.188)—Latino by mom some college .— –.010 .— –.092
(.187) (.185)Black Slope (Cross-Level Interaction)—Percent white .— .— .079* .071*
(.031) (.030)
—Percent white squared .— .— –.001 –.001(.0007) (.0007)
(continued on next page
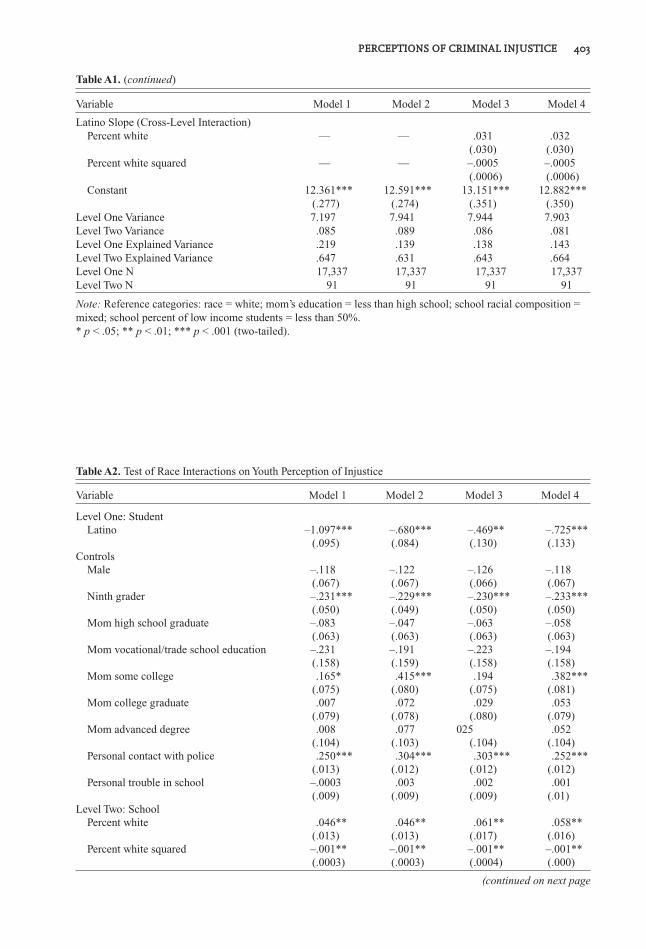
PPEERRCCEEPPTTIIOONNSS OOFF CCRRIIMMIINNAALL IINNJJUUSSTTIICCEE——––440033
#2322-ASR 70:3 filename:70302-hagan
Table A1. (continued)
Variable Model 1 Model 2 Model 3 Model 4
Latino Slope (Cross-Level Interaction)—Percent white .— .— .031 .032
(.030) (.030)—Percent white squared .— .— –.0005 –.0005
(.0006) (.0006)—Constant 12.361*** 12.591*** 13.151*** 12.882***
(.277) (.274) (.351) (.350)Level One Variance 7.197 7.941 7.944 7.903Level Two Variance .085 .089 .086 .081Level One Explained Variance .219 .139 .138 .143Level Two Explained Variance .647 .631 .643 .664Level One N 17,337 17,337 17,337 17,337Level Two N 91 91 91 91
Note: Reference categories: race = white; mom’s education = less than high school; school racial composition =mixed; school percent of low income students = less than 50%.* p < .05; ** p < .01; *** p < .001 (two-tailed).
Table A2. Test of Race Interactions on Youth Perception of Injustice
Variable Model 1 Model 2 Model 3 Model 4
Level One: Student—Latino –1.097*** –.680*** –.469** –.725***
(.095) (.084) (.130) (.133)Controls—Male –.118 –.122 –.126 –.118
(.067) (.067) (.066) (.067) —Ninth grader –.231*** –.229*** –.230*** –.233***
(.050) (.049) (.050) (.050) —Mom high school graduate –.083 –.047 –.063 –.058
(.063) (.063) (.063) (.063) —Mom vocational/trade school education –.231 –.191 –.223 –.194
(.158) (.159) (.158) (.158) —Mom some college .165* .415*** .194 .382***
(.075) (.080) (.075) (.081) —Mom college graduate .007 .072 .029 .053
(.079) (.078) (.080) (.079) —Mom advanced degree .008 .077 025 .052
(.104) (.103) (.104) (.104) —Personal contact with police .250*** .304*** .303*** .252***
(.013) (.012) (.012) (.012) —Personal trouble in school –.0003 .003 .002 .001
(.009) (.009) (.009) (.01)Level Two: School—Percent white .046** .046** .061** .058**
(.013) (.013) (.017) (.016)—Percent white squared –.001** –.001** –.001** –.001**
(.0003) (.0003) (.0004) (.000)
(continued on next page

tive to comparable black youth, Latino studentswho have contact with the police are more pro-voked to perceive injustice (.122, p < .001);Latino students whose mothers have some col-lege experience are significantly less likely toperceive criminal injustice (–.587, p < .001); andLatino students who are exposed to propor-tionately more white students in school per-ceive less (i.e., relative to comparable blackyouth) injustice (–.045, p < .05). When theseinteraction terms are all introduced in the sameequation in the last column of Table 4, only thepercent white effect becomes statistically non-significant.
In the main body of the paper, we continueto test the possibility of the differential impactof all the variables on black, white, and Latinoyouth’s perceptions of injustice. We considereach group separately and use confidenceintervals to compare the relative impact of allthe variables on perceptions of injusticebetween racial/ethnic groups. Such analyses
are similar to interaction terms, are easier topresent and interpret, and still allow us to testour hypotheses.
RREEFFEERREENNCCEESS
Anderson, Elijah. 1999. Code of the Streets: Decency,Violence and the Moral Life of the Inner City.New York: Norton.
Bobo, Lawrence and Devon Johnson. 2004. “A Tastefor Punishment: Black and White Americans’Views on the Death Penalty and the War on Drugs.”Du Bois Review 1:151–80.
Bobo, Lawrence and James Kluegel. 1997. “Status,Ideology, and Dimensions of Whites’ RacialBeliefs and Attitudes: Progress and Stagnation.” InRacial Attitudes in the 1990s: Continuity andChange, edited by Steven Tuch and Jack Martin.Westport, CT: Praeger.
Blumstein, Alfred. 1982. “On the RacialDisproportionality of the United States’ PrisonPopulation.” Journal of Criminal Law &Criminology 73:1259–70.
Brooks, Richard. 2000. “Fear and Fairness in the
440044——––AAMMEERRIICCAANN SSOOCCIIOOLLOOGGIICCAALL RREEVVIIEEWW
#2322-ASR 70:3 filename:70302-hagan
Controls—School 50–80% low income –.021 –.016 .015 –.003
(.132) (.131) (.134) (.135)—School 80–95% low income –.169 –.183 –.196 –.189
(.125) (.124) (.131) (.131)—Average student contact with police –.183 –.192 –.177 –.161
(.103) (.103) (.104) (.102)—Average student trouble in school –.135* –.139* –.135* –.127*
(.052) (.052) (.051) (.051)Interaction Terms—Latino by contact with police .122*** .— .— .120***
(.015) (.015)—Latino by mom some college .— –.587*** .— –.565***
(.109) (.109)Latino Slope (Cross-Level Interaction)—Percent white .— .— –.045* –.036
(.021) (.020)—Percent white squared .— .— .0009 .0007
(.0007) (.0005)—Constant 15.323*** 15.124*** 15.079*** 15.111***
(.202) (.198) (.208) (.211)Level One Variance 8.078 8.098 8.105 8.065Level Two Variance .086 .086 .087 .084Level One Explained Variance .101 .099 .098 .103Level Two Explained Variance .522 .522 .517 .533Level One N 14,966 14,966 14,966 14,966Level Two N 90 90 90 90
Note: Reference categories: race = white; mom’s education = less than high school; school racial composition =mixed; school percent of low income students = less than 50%.* p < .05; ** p < .01; *** p < .001 (two-tailed).
Table A2. (continued)
Variable Model 1 Model 2 Model 3 Model 4

City: Criminal Enforcement and Perceptions ofFairness in Minority Communities.” SouthernCalifornia Law Review 73:1219–73.
Brooks, Richard and Hackyung Jeon-Slaughter. 2001.“Race, Income and Perceptions of the U.S. CourtSystem.” Behavioral Sciences and the Law19:249–64.
Bryk, Anthony and Stephen Raudenbush. 1992.Hierarchical Linear Models. Newbury Park, CA:Sage.
Carter, David. 1985. “Hispanic Perception of PolicePerformance: An Empirical Assessment.” Journalof Criminal Justice 13:487–500.
Chambliss, William J. 1999. Power, Politics andCrime. Boulder, CO: Westview.
Chambliss, William and Robert Seidman. 1971. Law,Order and Power. Reading, MA: Addison-Wesley.
Chicago Public Schools. 1997. Reciprocal RecordsAgreement Between Chicago Public Schools andChicago Police Department (Board Rep. 705.1, pp.97–1217– p02). Chicago, IL.
Chicago Sun-Times. 1992. “Police Fire Two PoliceOfficers Over Incident With Teens.” Chicago Sun-Times, March 21, p. 4.
Collins, Sharon. 1997. Black Corporate Executives:The Making and Breaking of a Black Middle Class.Philadelphia, PA: Temple University Press.
Consortium on Chicago School Research. 2002.Public Use Data Set: User’s Manual. Retrieved03/05/2005 (www.consortium-chicago.org).
Cose, Ellis. 1994. Rage of a Privileged Class. NewYork: Harper Collins.
Davis, James. 1959. “A Formal Interpretation of theTheory of Relative Deprivation.” Sociometry22:280–96.
Dawson, Michael. 1994. Behind the Mule: Race andClass in African American Politics. Princeton, NJ:Princeton University Press.
Ellison, Christopher and Daniel Powers. 1994. “TheContact Hypothesis and Racial Attitudes AmongBlack Americans.” Social Science Quarterly75:385–400.
Entwisle, Doris and Karl Alexander. 1992. “SummerSetback: Race, Poverty, School Composition, andMathematics Achievement in the First Two Yearsof School.” American Sociological Review57:72–84.
Feagin, Joe and Melvin Sikes. 1994. Living withRacism: The Black Middle Class Experience.Boston, Massachusetts: Beacon.
Flanagan, Constance and Lonnie Sherrod. 1998.“Youth Political Development.” Journal of SocialIssues 54:447–56.
Frankenberg, Erica and Chungmei Lee. 2002. “Racein American Public Schools: RapidlyResegregating School Districts.” Cambridge, MA:The Civil Rights Project, Harvard University.
Frankenberg, Erica, Chungmei Lee and Gary Orfield.2003. “A Multiracial Society with Segregated
Schools: Are We Losing the Dream?” Cambridge,MA: The Civil Rights Project, Harvard University.
Hagan, John and Celesta Albonetti. 1982. “Race,Class and the Perception of Criminal Injustice inAmerica.” American Journal of Sociology88:329–355.
Hagan, John and Ilene Bernstein. 1979. “Conflict inContext: The Sanctioning of Draft Resisters,1963–1976.” Social Problems 27:109–22.
Hagan, John, Paul Hirschfield, and Carla Shedd.2002. “First and Last Words: Apprehending theSocial and Legal Facts of an Urban High SchoolShooting.” Sociological Methods & Research31:218–54.
Hallinan, Maureen and Richard Williams. 1987. “TheStability of Students’ Interracial Friendships.”American Sociological Review 52:653–64.
———. 1989. Interracial Friendship Choices inSecondary Schools.” American SociologicalReview 54:67–78.
Hawkins, Darnell. 1987. “Beyond Anomalies:Rethinking the Conflict Perspective on Race andCriminal Punishment.” Social Forces 65:719–45.
Henderson, Martha, Francis Cullen, Liqun Cao,Sandra L. Browning, and Renee Kopache. 1997.“The Impact of Race on Perceptions of CriminalInjustice.” Journal of Criminal Injustice25:447–62.
Hirschfield, Paul. 2003. “Preparing for Prison?”Ph.D. dissertation, Department of Sociology,Northwestern University, Evanston, IL.
Hochschild, Jennifer. 1995. Facing Up to theAmerican Dream: Race, Class and the Soul of theNation. Princeton, NJ: Princeton University Press.
Jaccard, James, Robert Turrisi, and Choi Wan. 1990.Interaction Effects in Multiple Regression.Newbury Park, CA: Sage.
Johnson, Monica Kirkpatrick, Robert Crosnoe, andGlen Elder. 2001. “Students’ Attachment andAcademic Engagement: The Role of Race andEthnicity.” Sociology of Education 74:318–40.
Kennedy, Randall. 1997. Race, Crime and the Law.New York: Pantheon.
LaFree, Gary. 1998. Losing Legitimacy: Street Crimeand the Decline of Social Institutions in America.Boulder, CO: Westview.
Liska, Allen, Michell Chamlin, and Mark Reed.1985. “Testing the Economic Production andConflict Models of Crime Control.” Social Forces64:119–38.
Mann, Coramae Richey. 1993. Unequal Justice: AQuestion of Color. Bloomington, IN: IndianaUniversity Press.
Massey, Douglas and Nancy Denton. 1988. “TheDimensions of Racial Segregation.” Social Forces67:281–315.
———. 1993. American Apartheid: Segregationand the Making of an American Underclass.Cambridge, MA: Harvard University Press.
PPEERRCCEEPPTTIIOONNSS OOFF CCRRIIMMIINNAALL IINNJJUUSSTTIICCEE——––440055
#2322-ASR 70:3 filename:70302-hagan

Mauer, Marc. 1999. Race to Incarcerate. New York:New Press.
Merton, Robert and Alice Rossi. 1957. “Contributionsto the Theory of Reference Group Behavior.” InRobert Merton, Social Theory and SocialStructure. Glencoe, IL: Free Press.
Mitchell, Michael and Jim Sidanius. 1995. “SocialHierarchy and the Death Penalty: A SocialDominance Perspective.” Political Psychology16:591–619.
Niemi, Richard and Mary Hepburn. 1995. “TheRebirth of Political Socialization.” Perspectiveson Political Science 24:7–16.
Olszewski, Lori and Darnell Little. 2004. “SchoolSpending Disparity Revealed.” Chicago Tribune,March 2.
Orfield, Gary and Chungmei Lee. 2004. “Brown at50: King’s Dream or Plessey’s Nightmare?”Cambridge, MA: The Civil Rights Project, HarvardUniversity. Available at [email protected].
Patterson, Orlando. 1997. The Ordeal of Integration:Progress and Resentment in America’s “Racial”Crisis. New York: Basic.
Peek, Charles W., George D. Lowe, and Jon P. Alston.1981. “Race and Attitudes Toward Local Police:Another Look.” Journal of Black Studies11:361–74.
Peterson, Ruth and John Hagan. 1984. “ChangingConceptions of Race and Sentencing Outcomes.”American Sociological Review 49:56–70.
Portes, Alejandro and Ruben Rumbaut. 2001.Legacies: The Story of the Immigrant SecondGeneration. Berkeley, CA and New York:University of California Press and Russell SageFoundation.
Quinney, Richard. 1970. The Social Reality of Crime.Boston, MA: Little, Brown.
Roscigno, Vincent. 1998. “Race and the Reproductionof Educational Disadvantage.” Social Forces76:1033–60.
Runciman, Walter G. 1966. Relative Deprivationand Social Justice: A Study of Attitudes to SocialInequality in Twentieth Century England. London,England: Routledge & Kegan Paul.
Russell, Kathryn. 1998. The Color of Crime: RacialHoaxes, White Fear, Black Protectionism, PoliceHarassment, and Other Macro-aggressions. NewYork: New York University Press.
Sampson, Robert and Dawn Bartusch. 1998. “LegalCynicism and (Subcultural?) Tolerance ofDeviance: The Neighborhood Context of RacialDifferences.” Law & Society Review 32:777–804.
Sampson, Robert and Janet Lauritsen. 1997. “Racialand Ethnic Disparities in Crime and CriminalJustice in the United States.” Crime and Justice311–74.
Sampson, Robert, Jeffrey Morenoff, and Felton Earls.1999. “Beyond Social Capital: Spatial Dynamicsof Collective Efficacy for Children.” AmericanSociological Review 64:633–60.
Sampson, Robert, Stephen Raudenbush, and FeltonEarls. 1997. “Neighborhoods and Violent Crime:A Multilevel Study of Collective Efficacy.” Science15:918–24.
Schelling, Thomas. 1971. “Dynamic Models ofSegregation.” Journal of Mathematical Sociology1:143–86.
Schof ield, Janet Ward. 1979. “The Impact ofPositively Structured Contact on IntergroupBehavior: Does it Last Under AdverseConditions?” Social Psychology Quarterly42:280–84.
Schuman, Howard, Charlotte Steeh, Lawrence Bobo,and Maria Krysan. 1997. Racial Attitudes inAmerica: Trends and Interpretations. Cambridge,MA: Harvard University Press.
Skogan, Wesley, Lynn Steiner, Jill Du Bois, J. ErikGudell, and Aimee Fagan. 2002. “CommunityPolicing and the ‘New Immigrants’: Latinos inChicago.” Washington, DC: National Institute ofJustice.
Stouffer, Samuel. 1949. The American Soldier, I:Adjustment During Army Life. Princeton, NJ:Princeton University Press.
Suttles, Gerald. 1968. The Social Order of the Slum:Ethnicity and Territory in the Inner City. Chicago,IL: University of Chicago Press.
Tonry, Michael. 1995. Malign Neglect: Race, Crimeand Punishment in America. New York: OxfordUniversity Press.
Tuch, Steven and Ronald Weitzer. 1997. “Trends:Racial Differences in Attitudes Toward the Police.”Public Opinion Quarterly 61:642–63.
Turk, Austin. 1969. Criminality and the Legal Order.Chicago, IL: Rand McNally.
Turner, J. C., M. A. Hogg, P. J. Oakes, S. D. Reicher,and M. S. Wetherell. 1987. Rediscovering theSocial Group: A Self-Categorization Theory.Oxford, England: Blackwell.
Tyler, Tom. 1990. Why People Obey the Law. NewHaven, CT: Yale University Press.
Vrij, Aldert and Frans Willem Winkel. 1992. “CrossCultural Police-Citizen Interactions: The Influenceof Race, Beliefs, and Nonverbal Communicationon Impression Formation.” Journal of AppliedSocial Psychology 22:1546–59.
Walker, Samuel, Cassia Spohn, and Miriam DeLone.2000. The Color of Justice: Race, Ethnicity andCrime in America. Stamford, CT: Wadsworth.
Weitzer, Ronald. 1999. “Racialized Policing:Perceptions in Three Neighborhoods.” Law &Society Review 34:301–27.
Weitzer, Ronald and Steven Tuch. 1999. “Race, Class
440066——––AAMMEERRIICCAANN SSOOCCIIOOLLOOGGIICCAALL RREEVVIIEEWW
#2322-ASR 70:3 filename:70302-hagan

PPEERRCCEEPPTTIIOONNSS OOFF CCRRIIMMIINNAALL IINNJJUUSSTTIICCEE——––440077
#2322-ASR 70:3 filename:70302-hagan
and Perceptions of Discrimination by the Police.”Crime & Delinquency 45:494–507.
Wilbanks, William. 1987. The Myth of a RacistCriminal Justice System. Monterey, CA:Brooks/Cole.
Wortley, Scot, John Hagan, and Ross Macmillan.1997. “Just Des(s)erts? The Racial Polarization
of Perceptions of Criminal Injustice.” Law &
Society Review 31:637–76.
Young, Alford. 2004. The Minds of Marginalized
Black Men: Making Sense of Mobility, Opportunity
and Future Life Chances. Princeton, NJ: Princeton
University Press.