Rabobank Group · PDF file2 Sustainability Report 2012 Rabobank Group KPI 1: ... retail...
11
Rabobank Group CSR KPI’s 2012
Transcript of Rabobank Group · PDF file2 Sustainability Report 2012 Rabobank Group KPI 1: ... retail...

Rabobank Group
CSR KPI’s 2012

2 Sustainability Report 2012 Rabobank Group
KPI 1: Helping clients move towards clean and sustainable businessPortfolio of sustainable and responsible finance products
in millions of euros 2012 2011 2010 2009 2008
Loans
Green loans 1,987 2,361 2,855 3,168 3,373
Sustainable project financing
(excluding green loans) 933 783 442 372 313
Rabo Stimuleringskapitaal14 389 445 106 489 451
Loans provided under guarantee form
Borgstellingsfonds Landbouw BF/BF+ 333 329 341 344 358
Loans with state guarantee provided
under BMKB15) 1,179 1,193 1,031 1,349 1,222
Farming relocation loans (VIV) 10 10 7 9 7
Loans incorporating Go facility 312 238 174 28 -
Growth facility
(Rabo Vermogensversterkings-lening) 45 53 51 26 19
Microcredits and start-up loans for SMEs
in the Netherlands 1 2 3 2 1
Sustainable real estate16 65 - - - -
Sustainable mortgages
(climate mortgage and first-time buyer
mortgage (excl. SVn)17 2,450 1,976 654 565 482
Total sustainable finance 7,704 7,388 5,664 6,352 6,228
Total lending to private individuals 457,466 448,337 436,292 415,235 408,620
As a percentage of total lending to the
private sector 1.7 1.6 1.3 1.5 1.5
Equator Principles18
2012 2011 2010 2009 2008
A (significant negative impact) - - - - -
B (potential negative impact) 19 17 13 11 9
C (no negative impact) 6 10 11 2 7
Total 25 27 24 13 16
Rabobank Group CSR key performance indicators
Appendix 1: CSR Facts and Figures
14 Rabo Stimuleringskapitaal has replaced the Stimuleringslening and the Groei & Innovatielening.
15 BMKB has replaced BBMKB.16 In 2012, the definition of sustainable
real estate was revised, the figures of previous years are therefore not comparable and are not corrected.
17 In 2012, the monitoring of sustainable mortgages was revised, the 2011 number was adjusted accordingly, the figures for 2009 and 2008 have not been adjusted so that these are not fully comparable.
18 Table shows the classification of projects on the basis of the first provision. The classification of projects on the basis of completed reviews is not displayed.
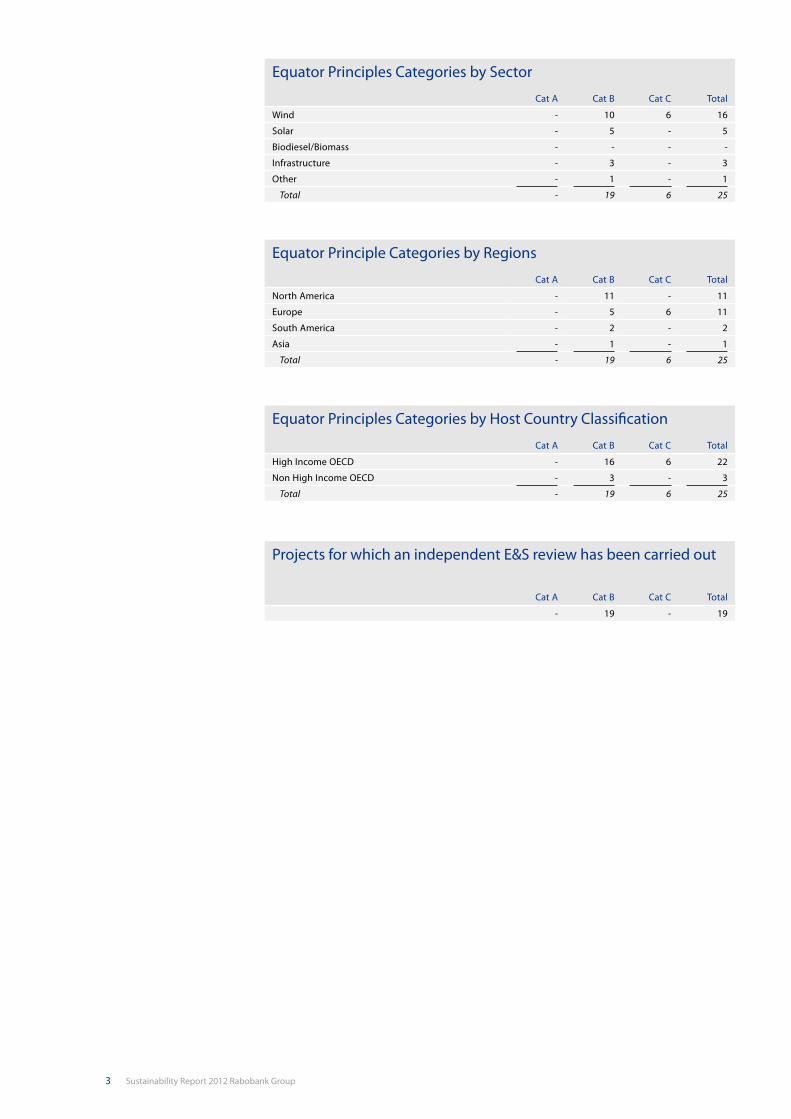
3 Sustainability Report 2012 Rabobank Group
Equator Principles Categories by Sector
Cat A Cat B Cat C Total
Wind - 10 6 16
Solar - 5 - 5
Biodiesel/Biomass - - - -
Infrastructure - 3 - 3
Other - 1 - 1
Total - 19 6 25
Equator Principle Categories by Regions
Cat A Cat B Cat C Total
North America - 11 - 11
Europe - 5 6 11
South America - 2 - 2
Asia - 1 - 1
Total - 19 6 25
Equator Principles Categories by Host Country Classification
Cat A Cat B Cat C Total
High Income OECD - 16 6 22
Non High Income OECD - 3 - 3
Total - 19 6 25
Projects for which an independent E&S review has been carried out
Cat A Cat B Cat C Total
- 19 - 19

4 Sustainability Report 2012 Rabobank Group
KPI 2: Helping clients make responsible investments
in millions of euros 2012 2011 2010 2009
Sustainable assets under management
Robeco 3,703 5,225 6,123 3,992
Sarasin19 - 8,785 8,829 8,345
Private Banking 358 214 292 249
Other 606 577 398 209
Rabo groenobligatie (green bonds) 1,487 2,236 3,243 3,643
Total sustainable assets under management and held
in custody for clients 6,153 17,037 18,885 16,438
Total assets under management and held in custody
for clients 221,200 262,300 270,400 230,400
Total sustainable assets under management and held
in custody for clients as a % of total assets under
management and held in custody for clients 2.5 6.5 7.0 7.1
Assets under engagement
Robeco 50,542 41,352 43,738 15,400
Private Banking 4,686 3,138 1,247 126
Sarasin - 10,796 7,483 4,571
Total sustainable assets under engagement 55,228 55,286 52,468 20,097
Assets under license
Robeco 5,094 4,779 7,395 6,000
Sarasin19 - 22 26 46
Fondsenbeheer
Assets of Fondsenbeheer Nederland 2,945 3,087 2,815 2,713
Sustainable savings
Rabo GroenSparen savings account 1,222 948 425 360
19 In 2012 Sarasin is no longer part of Rabobank, the numbers of previous years are included for comparison.

5 Sustainability Report 2012 Rabobank Group
KPI 3: Supporting community partnerships
Cooperative dividend
in millions of euros 2012 2011 2010 2009 2008
Cooperative funds (local Rabobanks) 42.8 37.0 28.3 25.8 20.4
Donations by Rabobank Nederland and
other group entities 4.6 5.2 4.2 3.3 3.8
Rabobank Foundation
(in and outside the Netherlands) 19.8 15.7 21.7 18.7 11.3
Project Fund - 1.1 0.9 0.8 3.7
Award money Herman Wijffels
Innovation Award 0.1 0.1 0.1 0.1 0.1
Share4more 0.6 1.1 0.7 0.3 0.3
Total cooperative dividend 67.9 60.2 55.9 49.0 39.6
Community sponsorship
in millions of euros 2012 2011 2010 2009 2008
Rabobank Nederland, Communications
department 30.3 25.1 24.1 22.6 21.4
Rabobank International and other group
entities 11.0 9.7 11.8 10.9 16.4
Local Rabobanks 27.4 27.0 24.1 24.5 28.0
Total community sponsorship 68.7 61.8 60.0 58.0 65.8
Funds committed by Rabobank Foundation in the Netherlands
2012 2011 2010 2009 2008
Number of applications in the Netherlands 177 347 300 346 302
Number of applications in the Netherlands
granted 31 43 29 49 38
Funds committed (in millions of euros) 2.5 3.0 2.9 3.2 2.6
Share4More fund
2012 2011 2010 2009 2008
Number of donors 6,146 4,963 4,161 2,785 2,605
Number of applications 190 217 180 173 219
Number of applications granted 136 133 98 87 121
Volume of donations (in millions of euros) 0.64 1.09 0.7020 0.27 0.31
Average donation (in euros) 5,028 8,074 7,597 3,098 2,549
Instruments available to Rabobank Foundation in countries other than the Netherlandsin millions of euros 2012 2011 2010 2009 2008
Trade finance 1.5 0.7 5.5 6.2 3.4
Micro finance 9.5 7.9 4.0 7.0 3.8
Guarantees and commitments 5.7 2.7 3.7 0.5 0.6
Donations and technical assistance 9.1 8.7 10.7 7.9 6.2
Total 25.8 20.0 23.9 21.6 14.0
20 Including Haiti earthquake relief.

6 Sustainability Report 2012 Rabobank Group
Funds committed by Rabobank Foundation in countries other than the Netherlands
Grants by region and type of product
Region Trade finance % Microfinance %Guarantees and
commitments %
Donations and technical
assistance % Total %
Africa 0.7 7% 3.2 30% 2.4 22% 4.4 41% 10.7 100%
Asia 0.4 4% 1.8 20% 3.3 37% 3.4 39% 8.9 100%
Latin America 0.4 6% 4.5 73% - 0% 1.3 21% 6.2 100%
Total 1.5 6% 9.5 37% 5.7 22% 9.1 35% 25.8 100%
Funds committed by Rabobank Foundation in countries other than the Netherlands
2012 2011 2010 2009
Number of applications 310 228 357 282
Number of applications granted 160 133 170 166
Funds committed (in millions of euros) 25.8 20.0 23.9 21.6
Rabo Development partner bank client base
Number of customers (x 1,000) 2012 2011 2010 2009
Tanzania (National Microfinance Bank) 1,488 1,514 1,421 2,055
Mozambique (Banco Terra) 25 23 16 7
Zambia (Zambia National Commercial Bank) 636 566 473 235
China (United Rural Cooperative Bank of Hangzhou) 1,720 1,638 1,573 1,400
Paraguay (Banco Regional) 68 65 61 55
Rwanda (Banque Populaire du Rwanda) 1,469 1,426 1,284 1,075
Brazil (Banco Cooperativo Sicredi)21 2,249 1,979 - -
21 In June 2010, we signed an agreement to take a non-controlling interest in the share capital of Brazil-based Banco Cooperativo Sicredi SA (Apex). The investment was approved by the Brazilian Central Bank and the President of Brazil in 2011, which resulted in the final green light on 20 May 2011.

7 Sustainability Report 2012 Rabobank Group
KPI 4: Offering climate-neutral services
Greenhouse gas emissions and climate footprint: (in tonnes of CO₂)22
Emission source 2012 201123 2010 2009
Scope 1
Consumption of natural gas 11,600 11,900 18,400 14,900
Consumption of other fuels 180 190 330 520
Use of air conditioning 2,000 2,100 2,000 1,900
Lease mileage (km) 49,400 50,100 51,100 53,900
Scope 2
Consumption of electricity 37,500 39,400 41,200 46,400
Consumption of heat 11,900 10,300 10,400 12,400
Scope 3
Business car mileage (km) 7,100 6,800 7,500 10,000
Business flight mileage (km) 24,900 21,500 20,600 20,200
Use of paper 1,800 2,000 4,600 6,200
Climate footprint: total carbon emissions (tonnes of CO₂) 146,380 144,290 156,130 166,420
Climate footprint per FTE 2.2 2.2 2.4 2.7
Rabobank Group energy consumption by source and activity
Change in use vs. 2011 (%) 2012 201125 2010 2009 Unit
Energy consumption26 -1 3,506 3,559 3,606 3,465 Terajoule (TJ)
Electricity -2 2,772 2,835 2,871 2,916 Terajoule (TJ)
- Energy from renewable resources -4 2,022 2,106 2,040 2,014 Terajoule (TJ)
- Energy from non-renewable resources 3 750 729 831 902 Terajoule (TJ)
Gas total -5 489 513 521 294 Terajoule (TJ)
- Gas from renewable resources -5 367 386 216 158 Terajoule (TJ)
- Gas from non-renewable resources -4 122 127 305 136 Terajoule (TJ)
District heating 16 245 211 214 255 Terajoule (TJ)
Electricity per fte -4 4,730 4,906 4,988 5,283 Gigawatt Hour (GWh)
Green power in the Netherlands -2 94 96 96 98
Consumption of green power as a % of
total electricity consumption in the
Netherlands
Green power outside the Netherlands 40 21 15 20 20
Consumption of green power as a % of
total electricity consumption outside
the Netherlands
Natural gas -3 10.4 10.7 10.2 10 m3/m2 (including district heating)
Water in the Netherlands per FTE24 -9 316 348 419 343 x 1,000 m3
-14 6.8 7.9 9.4 7.7 m3/FTE
Lease mileage 2 268 263 268 273 x 1 million km
A4-size paper - 29 29 18.9 33.7 Kg/FTE
Paper and cardboard waste24 -1 55.9 56.6 59 68 Kg/FTE
Residual waste24 - 45 45 49 45 Kg/FTE
Organic catered foods27 1 76 75 64 53 % of total catered foods
22 Reports on greenhouse gas emissions and climate footprint are in accor-dance with the Greenhouse Gas Protocol.
23 CO₂ emission data for 2011 have been restated based on conversion factors for 2012.
24 Rabobank Group in the Netherlands without De Lage Landen and Obvion.
25 CO₂ emission data for 2011 have been restated based on corrections in 2012.
26 In 2012 the methodology for calculating the energy consumption was adjusted, the figures of previous are adjusted accordingly.
27 Rabobank Nederland.
8 Sustainability Report 2012 Rabobank Group
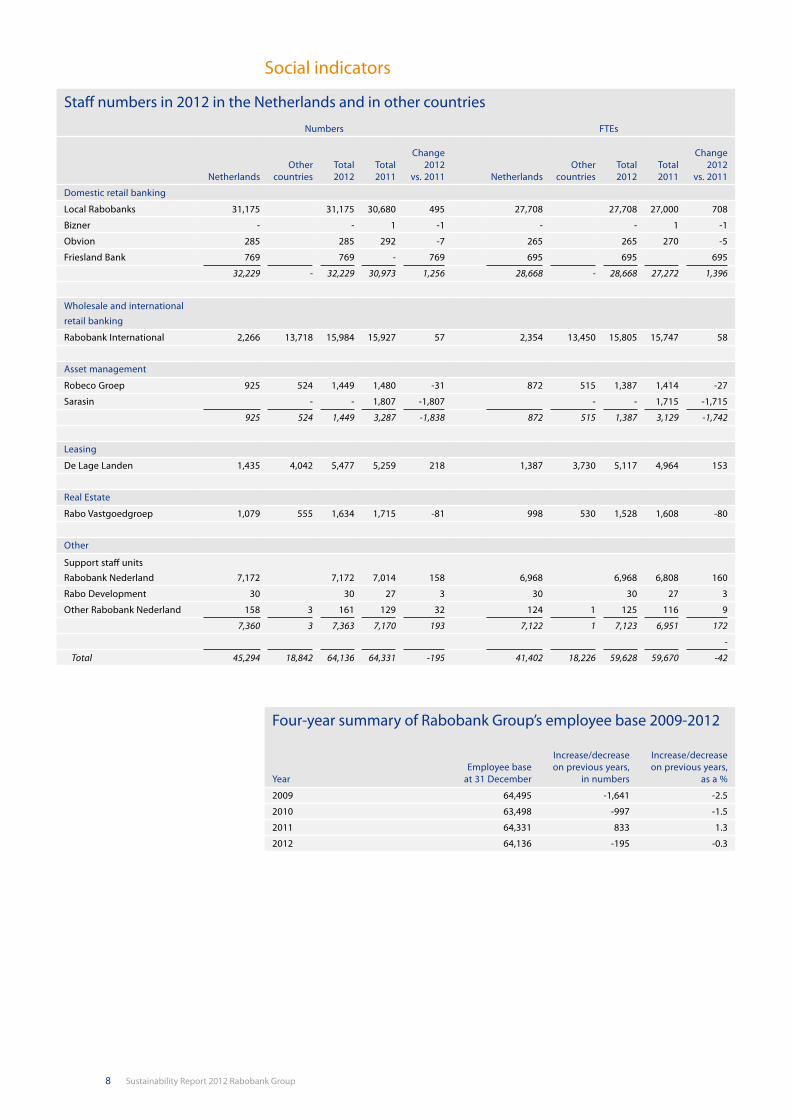
Social indicators
Staff numbers in 2012 in the Netherlands and in other countries
Numbers FTEs
NetherlandsOther
countriesTotal 2012
Total 2011
Change 2012
vs. 2011 NetherlandsOther
countriesTotal 2012
Total 2011
Change 2012
vs. 2011
Domestic retail banking
Local Rabobanks 31,175 31,175 30,680 495 27,708 27,708 27,000 708
Bizner - - 1 -1 - - 1 -1
Obvion 285 285 292 -7 265 265 270 -5
Friesland Bank 769 769 - 769 695 695 695
32,229 - 32,229 30,973 1,256 28,668 - 28,668 27,272 1,396
Wholesale and inter national
retail banking
Rabobank International 2,266 13,718 15,984 15,927 57 2,354 13,450 15,805 15,747 58
Asset management
Robeco Groep 925 524 1,449 1,480 -31 872 515 1,387 1,414 -27
Sarasin - - 1,807 -1,807 - - 1,715 -1,715
925 524 1,449 3,287 -1,838 872 515 1,387 3,129 -1,742
Leasing
De Lage Landen 1,435 4,042 5,477 5,259 218 1,387 3,730 5,117 4,964 153
Real Estate
Rabo Vastgoedgroep 1,079 555 1,634 1,715 -81 998 530 1,528 1,608 -80
Other
Support staff units
Rabobank Nederland 7,172 7,172 7,014 158 6,968 6,968 6,808 160
Rabo Development 30 30 27 3 30 30 27 3
Other Rabobank Nederland 158 3 161 129 32 124 1 125 116 9
7,360 3 7,363 7,170 193 7,122 1 7,123 6,951 172
-
Total 45,294 18,842 64,136 64,331 -195 41,402 18,226 59,628 59,670 -42
Four-year summary of Rabobank Group’s employee base 2009-2012
YearEmployee base
at 31 December
Increase/decrease on previous years,
in numbers
Increase/decrease on previous years,
as a %
2009 64,495 -1,641 -2.5
2010 63,498 -997 -1.5
2011 64,331 833 1.3
2012 64,136 -195 -0.3

9 Sustainability Report 2012 Rabobank Group
Employee base broken down by job level and age, Rabobank Group in the Netherlands28
Women%
Part-time workers
%
Employees with indefinite
employment contracts
%
Employees aged 24 and
under%
Employees aged 25 to 34
%
Employees aged 35 to 44
%
Employees aged 45 to 54
%
Employees aged 55 and
over%
Total employee base 53.6 37.3 90.5 2.9 25.2 37.6 24.4 9.8
Employees in job scales 1 to 7 68.8 50.4 86.8 4.6 30.9 33.8 21.5 9.2
Employees in job scales 8 to 11 27.4 14.5 96.9 0.1 16.3 45.5 28.1 9.9
Senior managers 15.0 10.5 99.9 - 0.5 39.2 43.4 16.9
Executive managers 8.9 4.1 99.7 - - 15.4 53.9 30.7
Employee base broken down by group entity, age, gender and number of working hours in 2009-201229
Employee base
Women (%)
Part-time workers
(%)
Female part-time
workers (%)
Male part-time workers30
(%)
Women in managerial
positions (> job scale 7)
(%)Average
age
Employees aged 55
and over (%)
2009 45,538 54.8 38.5 63.2 5.7 23.2 40.2 8.6
2010 43,849 54.3 38.0 62.8 5.3 24.6 40.6 9.0
2011 43,846 53.9 38.8 62.2 8.8 25.8 40.7 9.5
2012 45,294 53.6 37.3 60.3 8.4 26.9 40.8 9.8
Domestic retail banking
Local Rabobanks 31,175 61.0 43.5 66.3 8.0 28.2 40.5 9.5
Obvion 285 51.6 34.4 58.5 8.7 33.0 41.8 9.5
Wholesale banking and international
retail banking
Rabobank International 2,266 30.2 10.4 28.6 2.5 22.1 39.3 5.5
Asset management
Robeco Group 925 33.8 26.5 52.6 12.8 22.8 40.1 4.1
Leasing
De Lage Landen 1,435 38.3 40.3 64.2 25.5 19.1 40.2 8.2
Real estate
Rabo Vastgoedgroep 1,079 36.0 29.9 64.6 10.3 20.2 42.0 11.1
Other
Support staff units
Rabobank Nederland 7,172 37.1 21.3 44.3 7.7 25.8 42.8 13.1
Rabo Development 30 43.3 10.0 23.1 - 28.6 43.7 10.0
Other31 927 - - - - - - -
28 Excluding Friesland Bank.29 Rabobank Group in the Netherlands.30 % males working part-time in 2011 increased because of two administrative changes. On the one hand the adaptation of the standard working week at DLL
from 36 to 38, while most staff kept working 36 hours. On the other hand adjusting the contract hours of employees with a seniority scheme from 36 to 32 by RN, MA, LB and Obvion, while most staff involved already worked 32 hours.
31 Other: including Friesland Bank.

10 Sustainability Report 2012 Rabobank Group
Breakdown of wage bill by management level32
2012 2011 2010 2009
Executive managers 3% 3% 3% 3%
Senior managers 7% 7% 7% 6%
Middle managers 46% 45% 44% 41%
Other (job scales 1 to 7) 44% 45% 46% 50%
Total 100% 100% 100% 100%
Rabobank Group employee turnover33
total, in % 2012 2011 2010 2009
Inflow from outside Rabobank Group 10.6 10.9 9.5 7.5
Outflow to outside Rabobank Group 9.6 10.1 11.4 10.6
Employee turnover broken down by age and gender34
in % External inflow External outflow
Age Male Female Male Female
Aged 24 and under 39.3 60.7 46.4 53.6
Aged 25 to 34 47.8 52.2 44.0 56.0
Aged 35 to 44 51.5 48.5 45.7 54.3
Aged 45 to 54 57.8 42.2 48.6 51.4
Aged 55 and over 66.2 33.8 61.2 38.8
Total 48.0 52.0 47.7 52.3
Key figures employee development policy
in % 2012 2011 2010 2009
LB RN RG LB RN RG LB RN RG LB RN RG
Employees with PDP 73 70 64 74 66 68 75 66 66 76 75 72
Not every group entity of Rabobank Group conducts an annual survey. The RG columns represented:- In 2009: ‘personal development’ and ‘training opportunities’ relating to Rabobank
Nederland, local Rabobanks, Sarasin;- In 2009: ‘PDP’ relating to Rabobank Nederland, local Rabobanks, Robeco NL and INT, RI INT,
DLL INT, Sarasin;- In 2010 ‘POP’ for Rabobank Groupwide in NL and international excluding DLL in the
Netherlands;- In 2011 ‘POP’ for Rabobank Groupwide in NL and international;- In 2012 ‘POP’ voor Rabobank Group excluding Friesland Bank.
33 Excluding Friesland Bank.
34 Excluding Friesland Bank.
32 Rabobank Group in the Netherlands excluding Friesland Bank.

11 Sustainability Report 2012 Rabobank Group
Training: key figures35
Amounts in millions of euros 2012 2011 2010 2009
Total wage bill 3,631 3,474 3,557 3,416
Total staff costs 5,325 4,862 4,919 4,603
Staff costs other administrative expenses 8,303 7,712 7,629 7,511
Total training expenses 89.1 93.0 87.9 86.8
Training expenses as a % of wage bill 2.45% 2.68% 2.47% 2.50%
Amounts in euros
Wage bill per FTE 62,342 59,635 60,578 57,628
Staff costs per FTE 91,428 83,454 83,779 65,232
Staff costs and other administrative expenses per FTE 142,557 132,382 129,935 114,262
Training expenses per FTE 1,530 1,596 1,497 1,464
Net profit per FTE 32,881 42,794 47,212 37,228
Number of training courses36 303,362 277,157 192,945 177,039
Absenteeism due to illness37/39
2012 2011 2010 2009
Absenteeism (%) 3.57 3.88 3.77 3.72
Frequency of absenteeism reports (%) 1.10 1.13 1.21 1.34
Influx of partially incapacitated employees38 114 93 86 62
Breakdown of wage bill by age40
(in euros, based on median of gross full-time annual salary) Male Female
Aged 24 and under 24,137.01 23,679.26
Aged 25 to 34 34,785.49 31,497.28
Aged 35 to 44 52,182.84 36,664.00
Aged 45 to 54 58,535.28 33,577.91
Aged 55 and over 51,982.02 33,027.43
Average 48,797.03 33,776.59
Breakdown of wage bill by management level41
(in euros, based on median of gross full-time annual salary) Male Female
Executive managers 173,370.32 185,019.34
Senior managers 122,556.77 118,345.46
Job scale 8 to 11 61,030.26 53,898.51
Job scale 1 to 7 36,597.25 33,928.59
Average 48,797.03 33,776.59
40 Rabobank Group in the Netherlands excluding Friesland Bank.
41 Rabobank Group in the Netherlands excluding Friesland Bank.
37 Rabobank Group in the Netherlands.38 2010 Rabobank Group in the
Netherlands exclusive of Robeco in the Netherlands.
39 2012 excluding Friesland Bank.
35 To ensure consistency with the Financial Statements the numbers for 2012 and 2011 are excluding Robeco. The figures for 2010 and 2009 are not adjusted so that they are not fully comparable.
36 Excluding Robeco, excluding Friesland Bank and Rabo Vastgoedgroep NL.