R5ufI TE-T
68
HREA-.uL.E-368 /81-7-2021-49(1u)/2017 gfde e, T Aoo-110002 afavr, yd seary ufRada 30-7 fa-TO yaostocto, T fa à faaa stogo w-673/2018 ufkT TRs: fATS :237T 2021 feit faaRTT 3Hogo io-673/2018 qifa 3ITdT 3Tfa Tfoa -u R5ufI U HRTd TE-T 2021 ECaR, 2021 (oyTO f ) TI-AIaI-368(1)/81-7-2021-49(at) /2017, TT H0-ut1-36640/-4/TRITKRT / 2020-21, f5 22.10.2021
Transcript of R5ufI TE-T
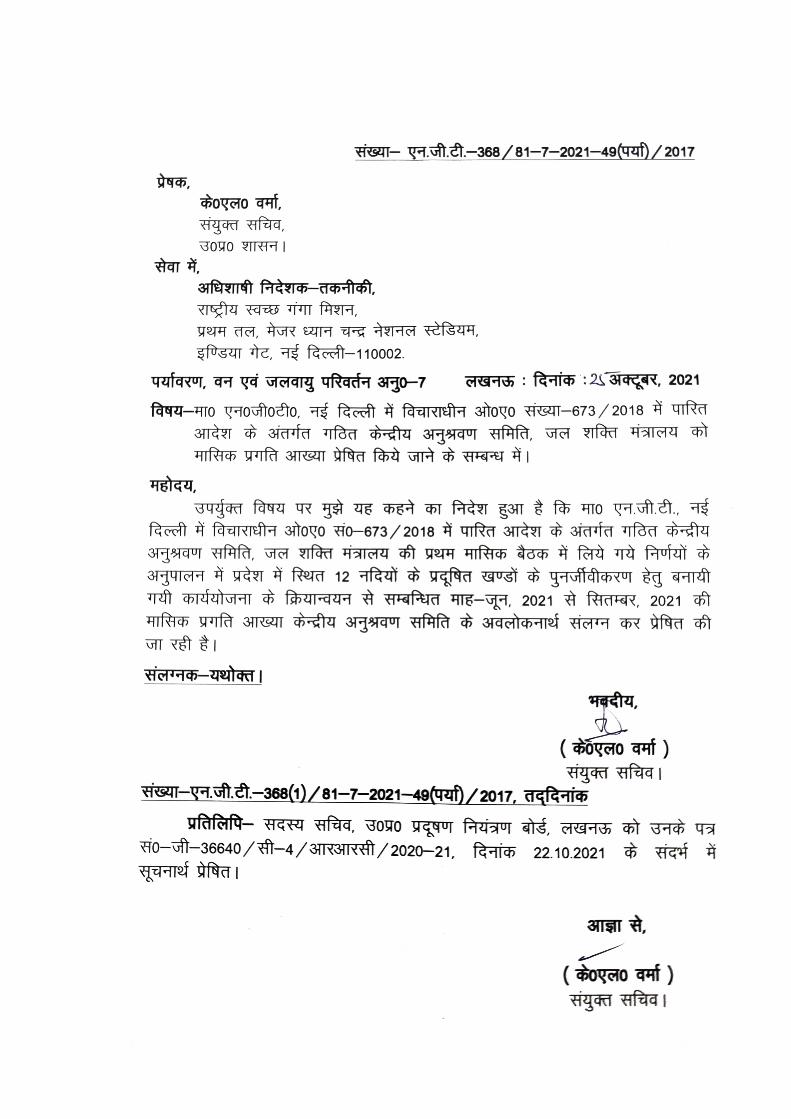
HREA-.uL.E-368 /81-7-2021-49(1u)/2017
gfde e, T Aoo-110002
afavr, yd seary ufRada 30-7fa-TO yaostocto, T fa à faaa stogo w-673/2018 ufkT
TRs: fATS :237T 2021
feit faaRTT 3Hogo io-673/2018 qifa 3ITdT 3Tfa Tfoa -u
R5ufI U HRTd TE-T 2021 ECaR, 2021
(oyTO f )
TI-AIaI-368(1)/81-7-2021-49(at) /2017, TT
H0-ut1-36640/-4/TRITKRT / 2020-21, f5 22.10.2021
1
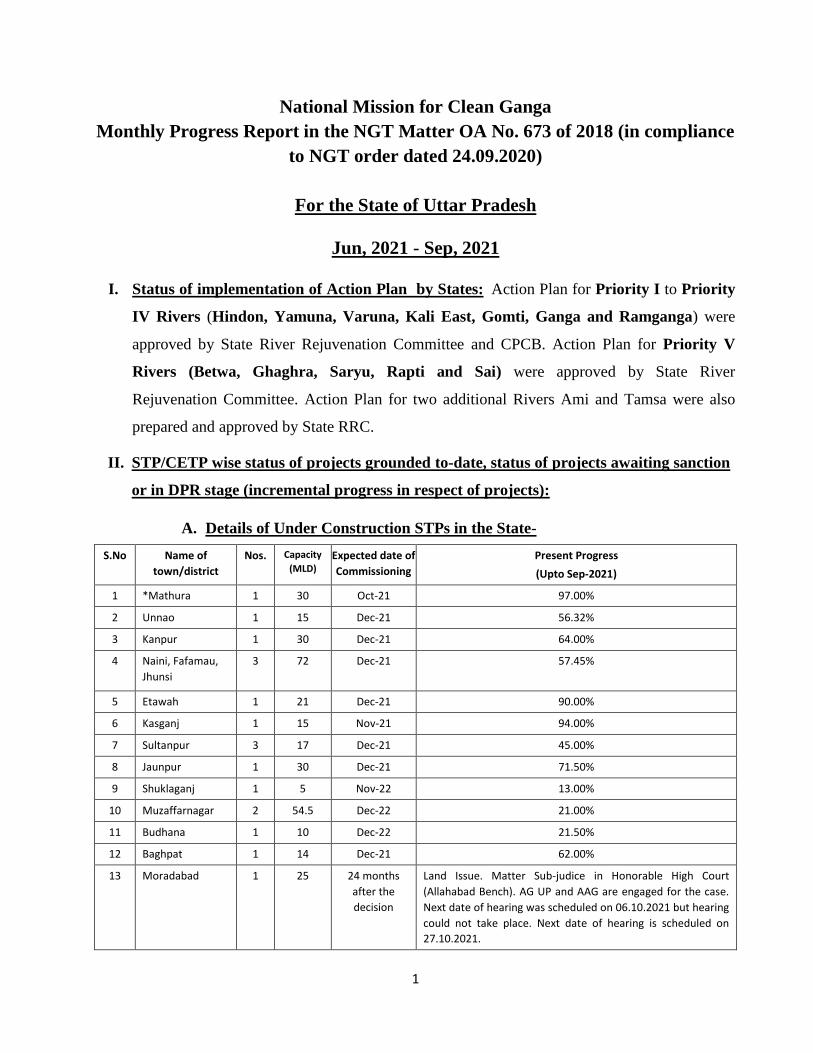
National Mission for Clean Ganga
Monthly Progress Report in the NGT Matter OA No. 673 of 2018 (in compliance
to NGT order dated 24.09.2020)
For the State of Uttar Pradesh
Jun, 2021 - Sep, 2021
I. Status of implementation of Action Plan by States: Action Plan for Priority I to Priority
IV Rivers (Hindon, Yamuna, Varuna, Kali East, Gomti, Ganga and Ramganga) were
approved by State River Rejuvenation Committee and CPCB. Action Plan for Priority V
Rivers (Betwa, Ghaghra, Saryu, Rapti and Sai) were approved by State River
Rejuvenation Committee. Action Plan for two additional Rivers Ami and Tamsa were also
prepared and approved by State RRC.
II. STP/CETP wise status of projects grounded to-date, status of projects awaiting sanction
or in DPR stage (incremental progress in respect of projects):
A. Details of Under Construction STPs in the State-
S.No Name of
town/district
Nos. Capacity
(MLD) Expected date of
Commissioning
Present Progress
(Upto Sep-2021)
1 *Mathura 1 30 Oct-21 97.00%
2 Unnao 1 15 Dec-21 56.32%
3 Kanpur 1 30 Dec-21 64.00%
4 Naini, Fafamau,
Jhunsi
3 72 Dec-21 57.45%
5 Etawah 1 21 Dec-21 90.00%
6 Kasganj 1 15 Nov-21 94.00%
7 Sultanpur 3 17 Dec-21 45.00%
8 Jaunpur 1 30 Dec-21 71.50%
9 Shuklaganj 1 5 Nov-22 13.00%
10 Muzaffarnagar 2 54.5 Dec-22 21.00%
11 Budhana 1 10 Dec-22 21.50%
12 Baghpat 1 14 Dec-21 62.00%
13 Moradabad 1 25 24 months
after the
decision
Land Issue. Matter Sub-judice in Honorable High Court
(Allahabad Bench). AG UP and AAG are engaged for the case.
Next date of hearing was scheduled on 06.10.2021 but hearing
could not take place. Next date of hearing is scheduled on
27.10.2021.
2
S.No Name of
town/district
Nos. Capacity
(MLD) Expected date of
Commissioning
Present Progress
(Upto Sep-2021)
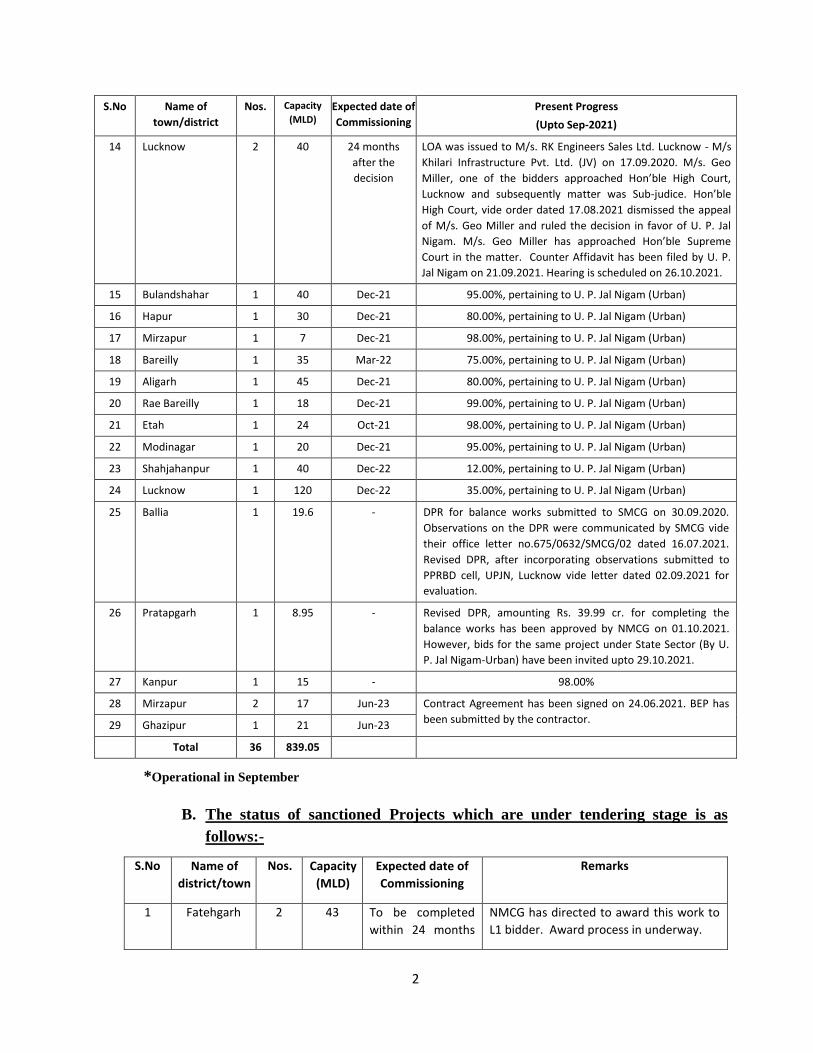
14 Lucknow 2 40 24 months
after the
decision
LOA was issued to M/s. RK Engineers Sales Ltd. Lucknow - M/s
Khilari Infrastructure Pvt. Ltd. (JV) on 17.09.2020. M/s. Geo
Miller, one of the bidders approached Hon’ble High Court,
Lucknow and subsequently matter was Sub-judice. Hon’ble
High Court, vide order dated 17.08.2021 dismissed the appeal
of M/s. Geo Miller and ruled the decision in favor of U. P. Jal
Nigam. M/s. Geo Miller has approached Hon’ble Supreme
Court in the matter. Counter Affidavit has been filed by U. P.
Jal Nigam on 21.09.2021. Hearing is scheduled on 26.10.2021.
15 Bulandshahar 1 40 Dec-21 95.00%, pertaining to U. P. Jal Nigam (Urban)
16 Hapur 1 30 Dec-21 80.00%, pertaining to U. P. Jal Nigam (Urban)
17 Mirzapur 1 7 Dec-21 98.00%, pertaining to U. P. Jal Nigam (Urban)
18 Bareilly 1 35 Mar-22 75.00%, pertaining to U. P. Jal Nigam (Urban)
19 Aligarh 1 45 Dec-21 80.00%, pertaining to U. P. Jal Nigam (Urban)
20 Rae Bareilly 1 18 Dec-21 99.00%, pertaining to U. P. Jal Nigam (Urban)
21 Etah 1 24 Oct-21 98.00%, pertaining to U. P. Jal Nigam (Urban)
22 Modinagar 1 20 Dec-21 95.00%, pertaining to U. P. Jal Nigam (Urban)
23 Shahjahanpur 1 40 Dec-22 12.00%, pertaining to U. P. Jal Nigam (Urban)
24 Lucknow 1 120 Dec-22 35.00%, pertaining to U. P. Jal Nigam (Urban)
25 Ballia 1 19.6 - DPR for balance works submitted to SMCG on 30.09.2020.
Observations on the DPR were communicated by SMCG vide
their office letter no.675/0632/SMCG/02 dated 16.07.2021.
Revised DPR, after incorporating observations submitted to
PPRBD cell, UPJN, Lucknow vide letter dated 02.09.2021 for
evaluation.
26 Pratapgarh 1 8.95 - Revised DPR, amounting Rs. 39.99 cr. for completing the
balance works has been approved by NMCG on 01.10.2021.
However, bids for the same project under State Sector (By U.
P. Jal Nigam-Urban) have been invited upto 29.10.2021.
27 Kanpur 1 15 - 98.00%
28 Mirzapur 2 17 Jun-23 Contract Agreement has been signed on 24.06.2021. BEP has
been submitted by the contractor. 29 Ghazipur 1 21 Jun-23
Total 36 839.05
*Operational in September
B. The status of sanctioned Projects which are under tendering stage is as
follows:-
S.No Name of
district/town
Nos. Capacity
(MLD)
Expected date of
Commissioning
Remarks
1 Fatehgarh 2 43 To be completed
within 24 months
NMCG has directed to award this work to
L1 bidder. Award process in underway.

3
S.No Name of
district/town
Nos. Capacity
(MLD)
Expected date of
Commissioning
Remarks
2 Bareilly 4 63 after signing of the
Contract
Agreement.
LOA issued to M/s. Enviro Infra Engineers
Pvt. Ltd. On 28.07.2021.
3 Agra 13 177.60 Bids have been received on 22.09.2021.
Evaluation under progress.
4 Meerut 1 220 Bids are to be received on 29.10.2021.
5 Kairana 1 15 Date of Start given as 28.08.2021 to M/s
SIPL-RKC (JV).
6 Ayodhya 1 33 AA&ES for the project issued by NMCG on
06.05.2021. NIT floated on 01.09.2021
and bids shall be received on 01.11.2021.
7 Azamgarh 1 8 Pertaining to U. P. Jal Nigam (Urban)
Total 23 559.60
Total 5500 MLD Sewage is being generated in 652 ULBs present in Uttar Pradesh.
Presently, 108 STPs are installed in Uttar Pradesh, which have 3471.84 MLD sewage treatment
capacity. In addition to above, 36 STPs having total capacity of 839.05 MLD are under
construction and 23 STPs having total capacity of 559.60 MLD are under tendering process. Upon
completion of these STPs, the total sewage treatment capacity shall become 4870.49 MLD. Gap of
629.51 MLD is still present.
For long term measures for reducing the gap of 629.51 MLD, 60 Projects for I&D of
drains and construction of STPs have been prepared by U.P. Jal Nigam and submitted to SMCG
for approval and allocation of funds. Of these 60 projects, 26 are Detailed Project Reports and 34
are Pre-Feasibility Reports. The total estimated cost of 26 DPRs is Rs. 5117 Crore. wherein
I&D of 200 drains and construction of 18 STPs, having total capacity of 664.45 MLD (excluding
capacities of 8.95 MLD at Pratapgarh and 19.6 MD STP at Ballia, as they are included in under
construction projects), are proposed.
The total estimated cost of 34 PFRs is Rs. 7667 cr. wherein I&D of 125 drains and
construction of 35 STPs, having total capacity of 737.70 MLD, are proposed.
The summary of above details is mentioned as follows:-
S. No. Description Capacity (MLD)
1 Estimated Sewage Generation 5500.00
2 Total installed capacity of 108 STPs 3471.84
3 Total capacity of 36 nos. STPs under
construction
839.05
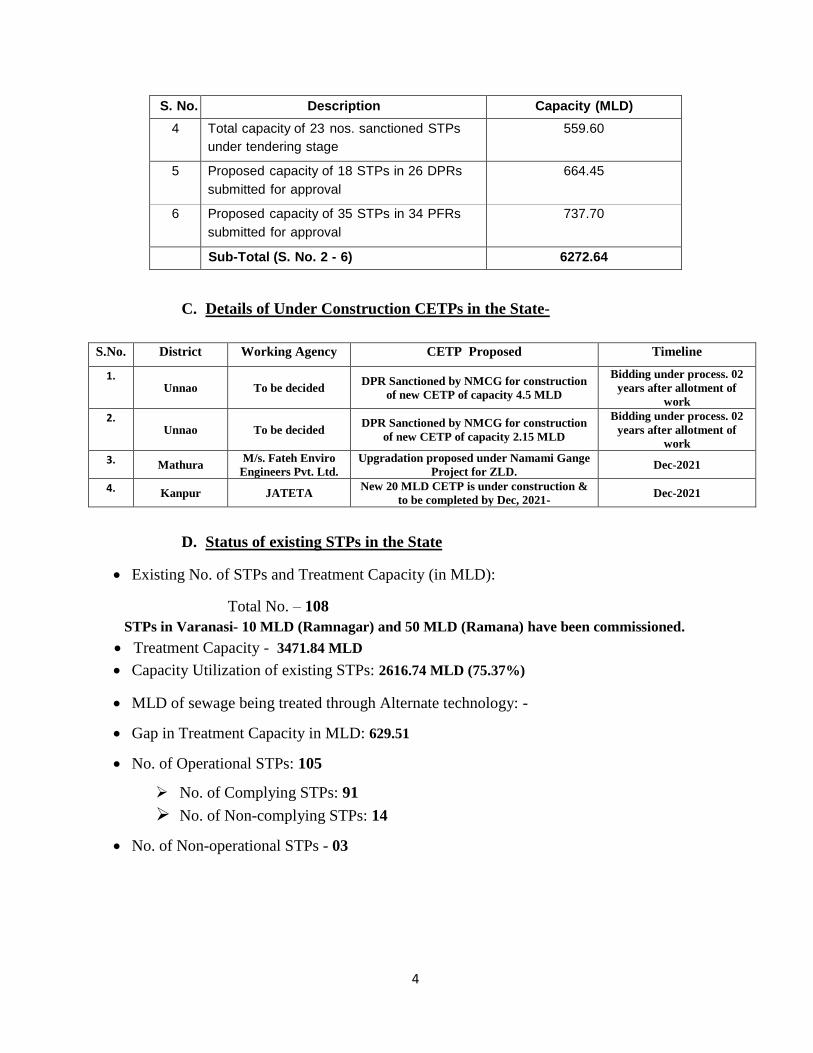
4
S. No. Description Capacity (MLD)
4 Total capacity of 23 nos. sanctioned STPs
under tendering stage
559.60
5 Proposed capacity of 18 STPs in 26 DPRs
submitted for approval
664.45
6 Proposed capacity of 35 STPs in 34 PFRs
submitted for approval
737.70
Sub-Total (S. No. 2 - 6) 6272.64
C. Details of Under Construction CETPs in the State-
S.No. District Working Agency CETP Proposed Timeline
1. Unnao To be decided
DPR Sanctioned by NMCG for construction
of new CETP of capacity 4.5 MLD
Bidding under process. 02
years after allotment of
work
2. Unnao To be decided
DPR Sanctioned by NMCG for construction
of new CETP of capacity 2.15 MLD
Bidding under process. 02
years after allotment of
work
3. Mathura M/s. Fateh Enviro
Engineers Pvt. Ltd. Upgradation proposed under Namami Gange
Project for ZLD. Dec-2021
4. Kanpur JATETA New 20 MLD CETP is under construction &
to be completed by Dec, 2021- Dec-2021
D. Status of existing STPs in the State
Existing No. of STPs and Treatment Capacity (in MLD):
Total No. – 108
STPs in Varanasi- 10 MLD (Ramnagar) and 50 MLD (Ramana) have been commissioned.
Treatment Capacity - 3471.84 MLD
Capacity Utilization of existing STPs: 2616.74 MLD (75.37%)
MLD of sewage being treated through Alternate technology: -
Gap in Treatment Capacity in MLD: 629.51
No. of Operational STPs: 105
No. of Complying STPs: 91
No. of Non-complying STPs: 14
No. of Non-operational STPs - 03
5
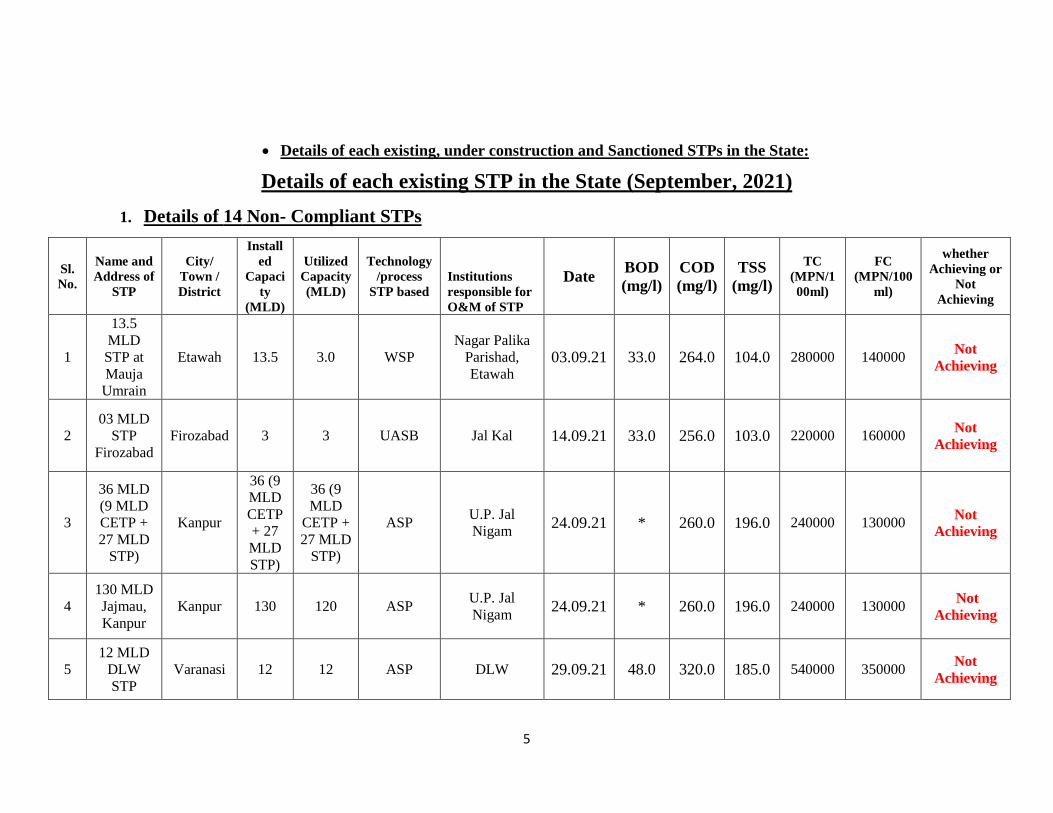
Details of each existing, under construction and Sanctioned STPs in the State:
Details of each existing STP in the State (September, 2021)
1. Details of 14 Non- Compliant STPs
Sl.
No.
Name and
Address of
STP
City/
Town /
District
Install
ed
Capaci
ty
(MLD)
Utilized
Capacity
(MLD)
Technology
/process
STP based
Institutions
responsible for
O&M of STP
Date BOD
(mg/l)
COD
(mg/l)
TSS
(mg/l)
TC
(MPN/1
00ml)
FC
(MPN/100
ml)
whether
Achieving or
Not
Achieving
1
13.5
MLD
STP at
Mauja
Umrain
Etawah 13.5 3.0 WSP
Nagar Palika
Parishad,
Etawah 03.09.21 33.0 264.0 104.0 280000 140000
Not
Achieving
2
03 MLD
STP
Firozabad
Firozabad 3 3 UASB Jal Kal 14.09.21 33.0 256.0 103.0 220000 160000 Not
Achieving
3
36 MLD
(9 MLD
CETP +
27 MLD
STP)
Kanpur
36 (9
MLD
CETP
+ 27
MLD
STP)
36 (9
MLD
CETP +
27 MLD
STP)
ASP U.P. Jal
Nigam 24.09.21 * 260.0 196.0 240000 130000
Not
Achieving
4
130 MLD
Jajmau,
Kanpur
Kanpur 130 120 ASP U.P. Jal
Nigam 24.09.21 * 260.0 196.0 240000 130000
Not
Achieving
5
12 MLD
DLW
STP
Varanasi 12 12 ASP DLW 29.09.21 48.0 320.0 185.0 540000 350000 Not
Achieving
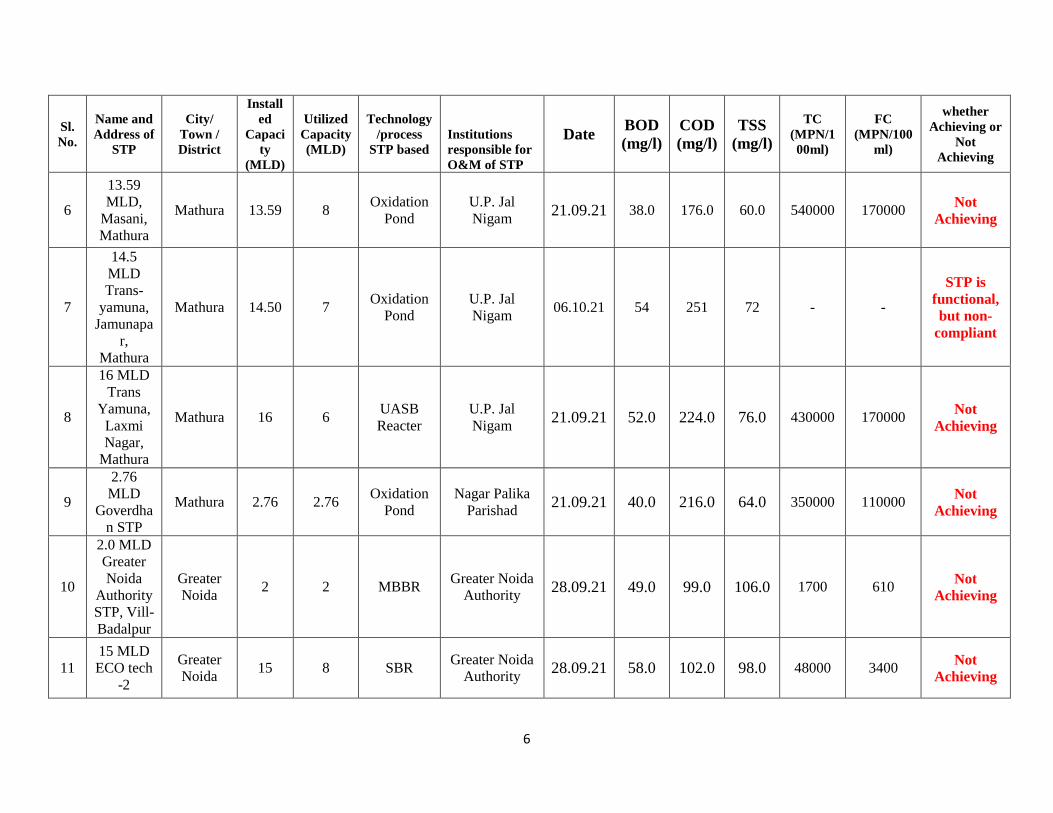
6
Sl.
No.
Name and
Address of
STP
City/
Town /
District
Install
ed
Capaci
ty
(MLD)
Utilized
Capacity
(MLD)
Technology
/process
STP based
Institutions
responsible for
O&M of STP
Date BOD
(mg/l)
COD
(mg/l)
TSS
(mg/l)
TC
(MPN/1
00ml)
FC
(MPN/100
ml)
whether
Achieving or
Not
Achieving
6
13.59
MLD,
Masani,
Mathura
Mathura 13.59 8 Oxidation
Pond
U.P. Jal
Nigam 21.09.21 38.0 176.0 60.0 540000 170000
Not
Achieving
7
14.5
MLD
Trans-
yamuna,
Jamunapa
r,
Mathura
Mathura 14.50 7 Oxidation
Pond
U.P. Jal
Nigam 06.10.21 54 251 72 - -
STP is
functional,
but non-
compliant
8
16 MLD
Trans
Yamuna,
Laxmi
Nagar,
Mathura
Mathura 16 6 UASB
Reacter
U.P. Jal
Nigam 21.09.21 52.0 224.0 76.0 430000 170000
Not
Achieving
9
2.76
MLD
Goverdha
n STP
Mathura 2.76 2.76 Oxidation
Pond
Nagar Palika
Parishad 21.09.21 40.0 216.0 64.0 350000 110000
Not
Achieving
10
2.0 MLD
Greater
Noida
Authority
STP, Vill-
Badalpur
Greater
Noida 2 2 MBBR
Greater Noida
Authority 28.09.21 49.0 99.0 106.0 1700 610
Not
Achieving
11
15 MLD
ECO tech
-2
Greater
Noida 15 8 SBR
Greater Noida
Authority 28.09.21 58.0 102.0 98.0 48000 3400
Not
Achieving
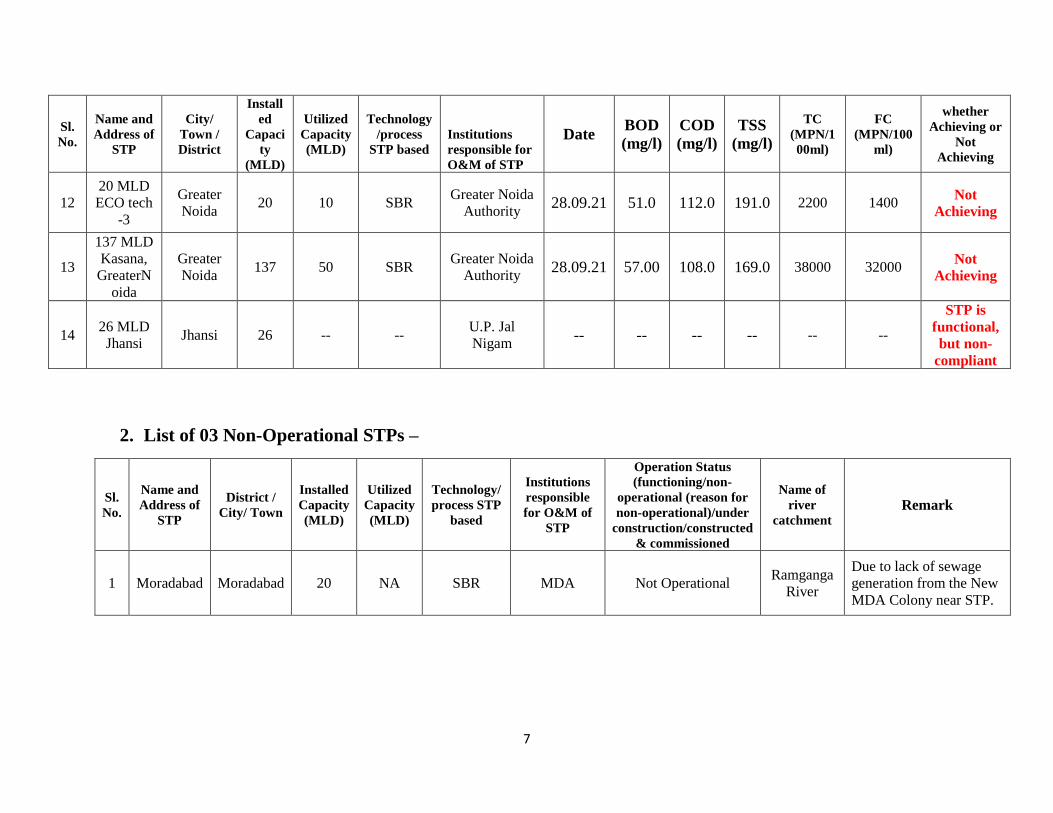
7
Sl.
No.
Name and
Address of
STP
City/
Town /
District
Install
ed
Capaci
ty
(MLD)
Utilized
Capacity
(MLD)
Technology
/process
STP based
Institutions
responsible for
O&M of STP
Date BOD
(mg/l)
COD
(mg/l)
TSS
(mg/l)
TC
(MPN/1
00ml)
FC
(MPN/100
ml)
whether
Achieving or
Not
Achieving
12
20 MLD
ECO tech
-3
Greater
Noida 20 10 SBR
Greater Noida
Authority 28.09.21 51.0 112.0 191.0 2200 1400
Not
Achieving
13
137 MLD
Kasana,
GreaterN
oida
Greater
Noida 137 50 SBR
Greater Noida
Authority 28.09.21 57.00 108.0 169.0 38000 32000
Not
Achieving
14 26 MLD
Jhansi Jhansi 26 -- --
U.P. Jal
Nigam -- -- -- -- -- --
STP is
functional,
but non-
compliant
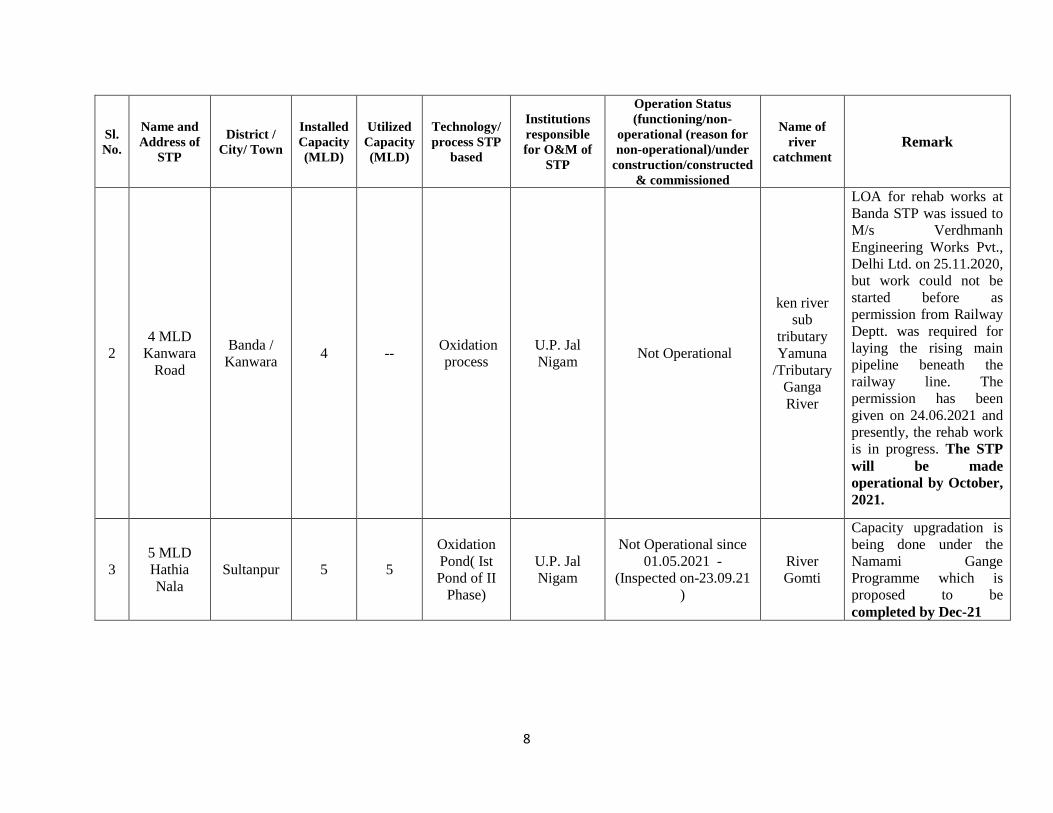
2. List of 03 Non-Operational STPs –
Sl.
No.
Name and
Address of
STP
District /
City/ Town
Installed
Capacity
(MLD)
Utilized
Capacity
(MLD)
Technology/
process STP
based
Institutions
responsible
for O&M of
STP
Operation Status
(functioning/non-
operational (reason for
non-operational)/under
construction/constructed
& commissioned
Name of
river
catchment
Remark
1 Moradabad Moradabad 20 NA SBR MDA Not Operational Ramganga
River
Due to lack of sewage
generation from the New
MDA Colony near STP.
8
Sl.
No.
Name and
Address of
STP
District /
City/ Town
Installed
Capacity
(MLD)
Utilized
Capacity
(MLD)
Technology/
process STP
based
Institutions
responsible
for O&M of
STP
Operation Status
(functioning/non-
operational (reason for
non-operational)/under
construction/constructed
& commissioned
Name of
river
catchment
Remark
2
4 MLD
Kanwara
Road
Banda /
Kanwara 4 --
Oxidation
process
U.P. Jal
Nigam Not Operational
ken river
sub
tributary
Yamuna
/Tributary
Ganga
River
LOA for rehab works at
Banda STP was issued to
M/s Verdhmanh
Engineering Works Pvt.,
Delhi Ltd. on 25.11.2020,
but work could not be
started before as
permission from Railway
Deptt. was required for
laying the rising main
pipeline beneath the
railway line. The
permission has been
given on 24.06.2021 and
presently, the rehab work
is in progress. The STP
will be made
operational by October,
2021.
3
5 MLD
Hathia
Nala
Sultanpur 5 5
Oxidation
Pond( Ist
Pond of II
Phase)
U.P. Jal
Nigam
Not Operational since
01.05.2021 -
(Inspected on-23.09.21
)
River
Gomti
Capacity upgradation is
being done under the
Namami Gange
Programme which is
proposed to be
completed by Dec-21
9
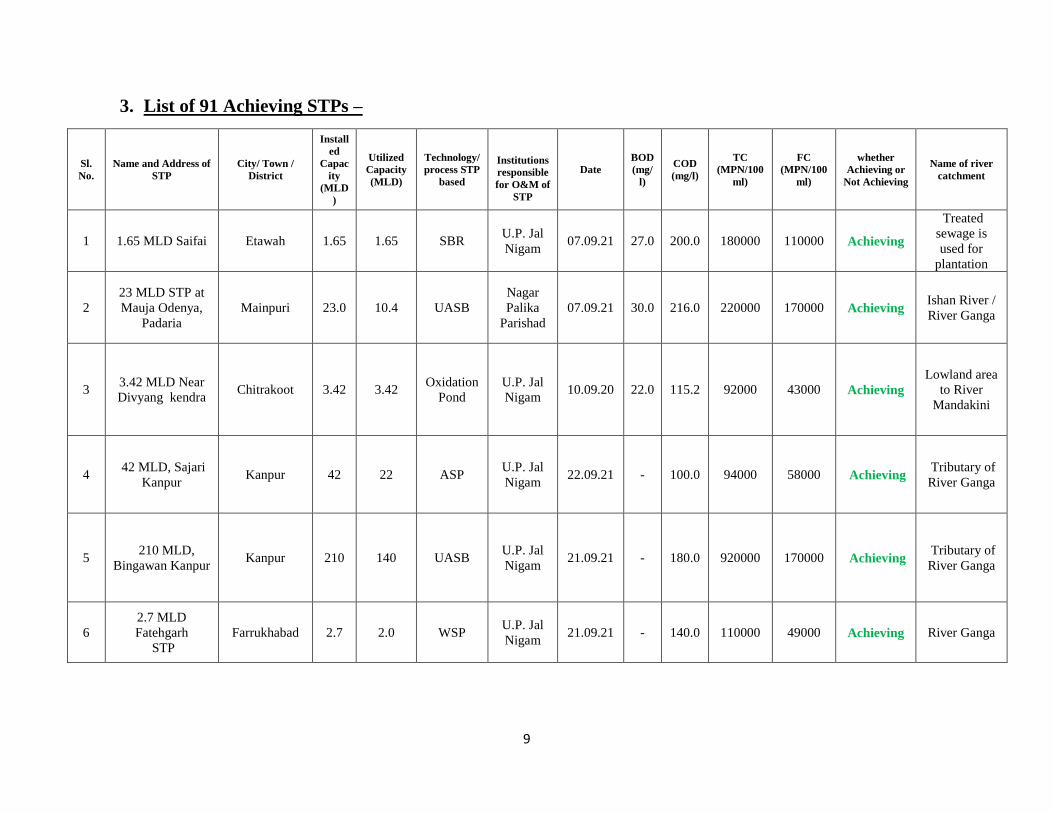
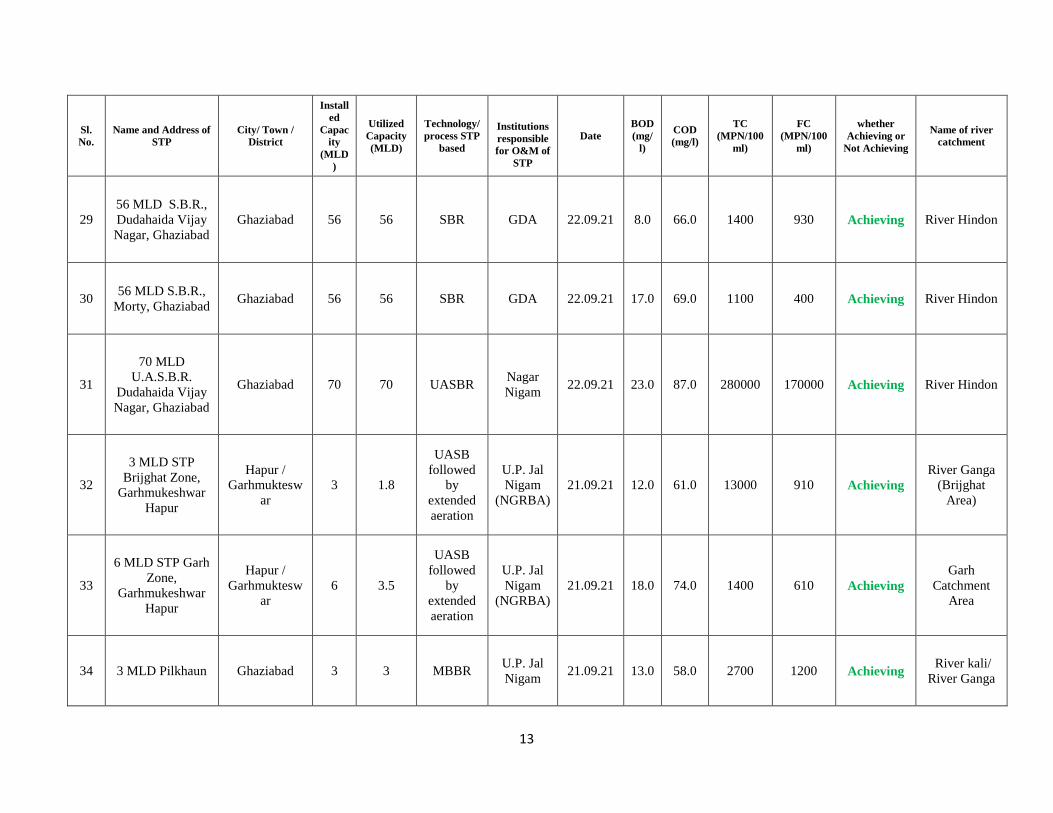
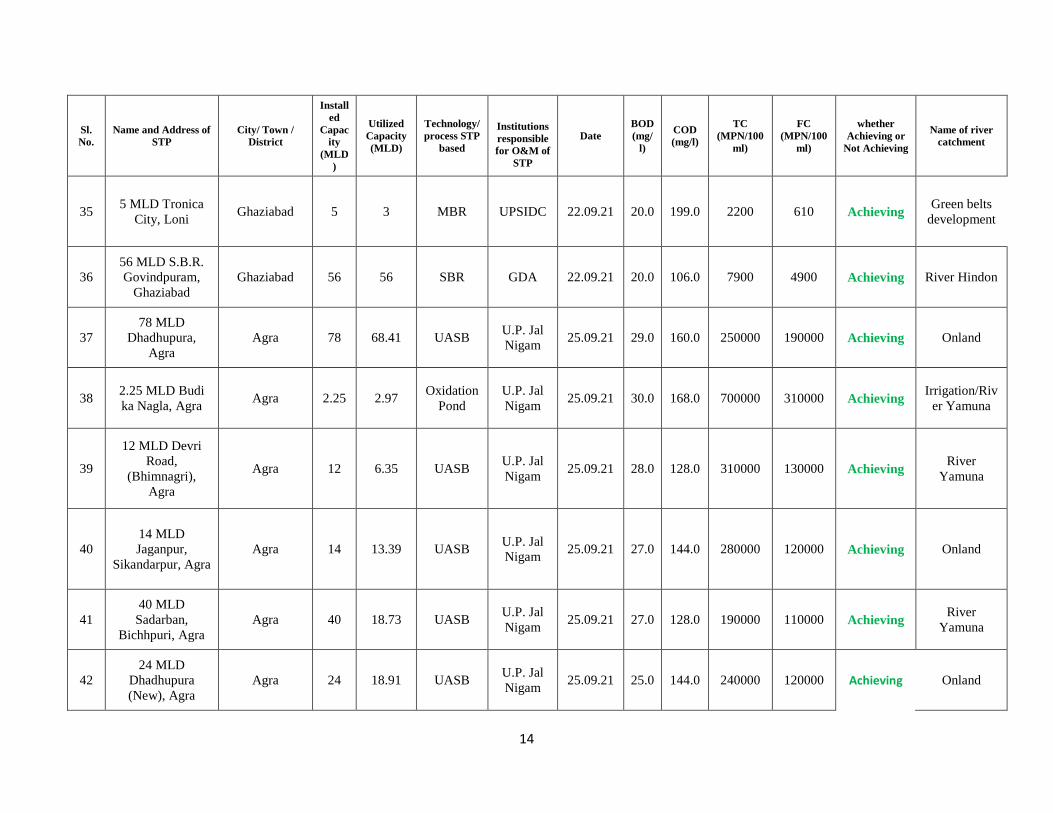
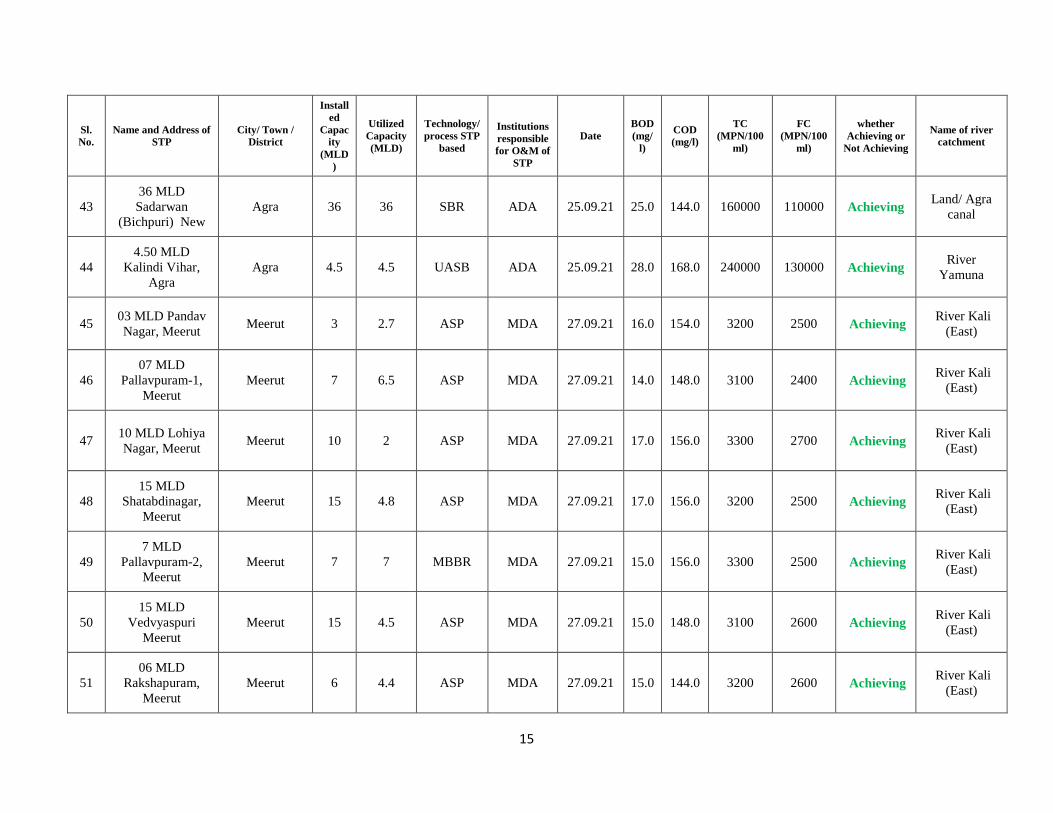
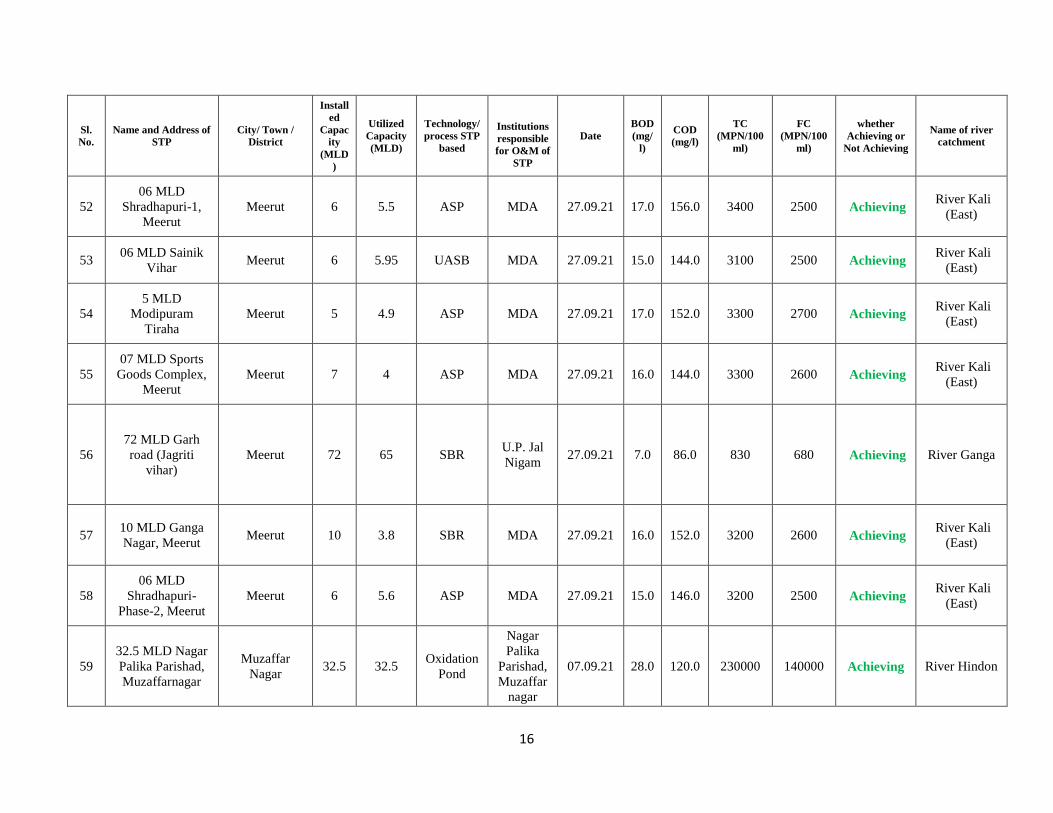
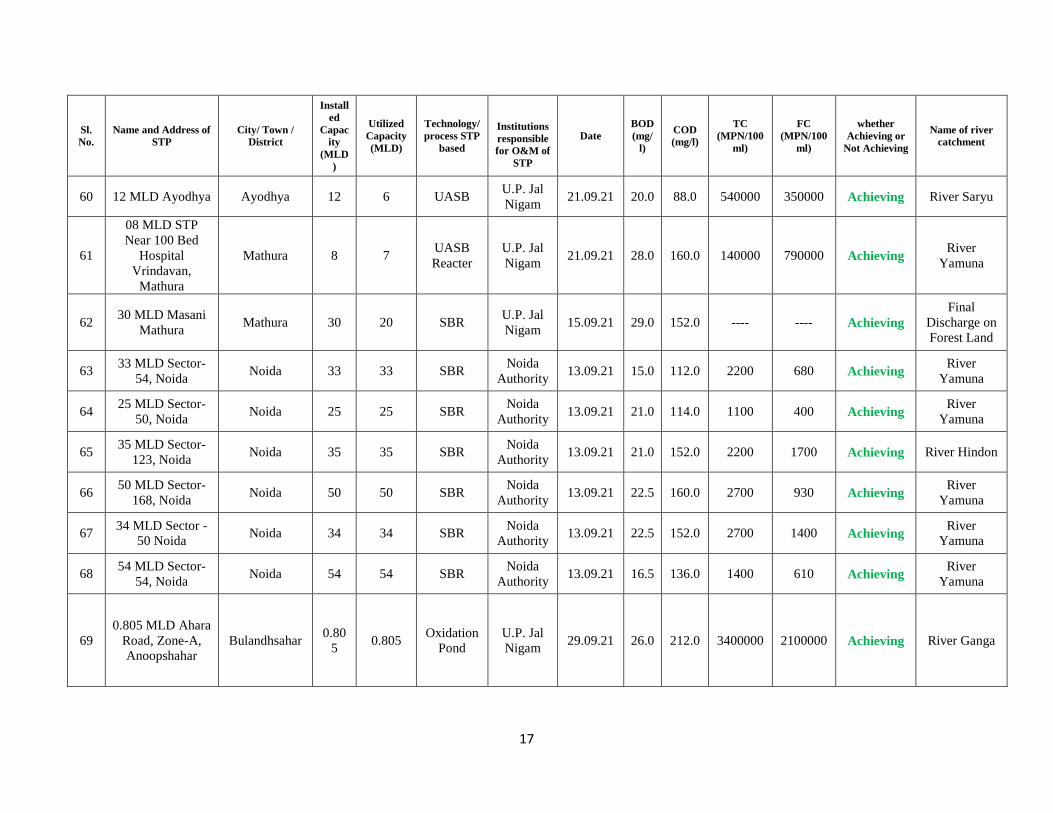
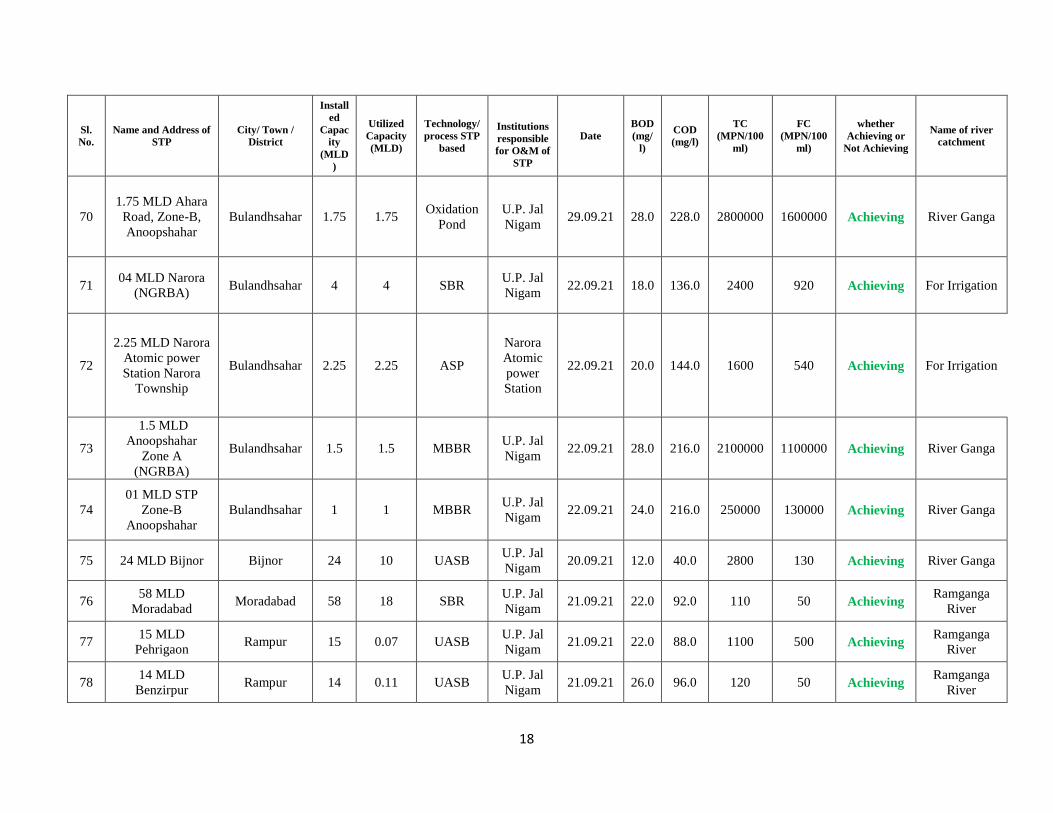
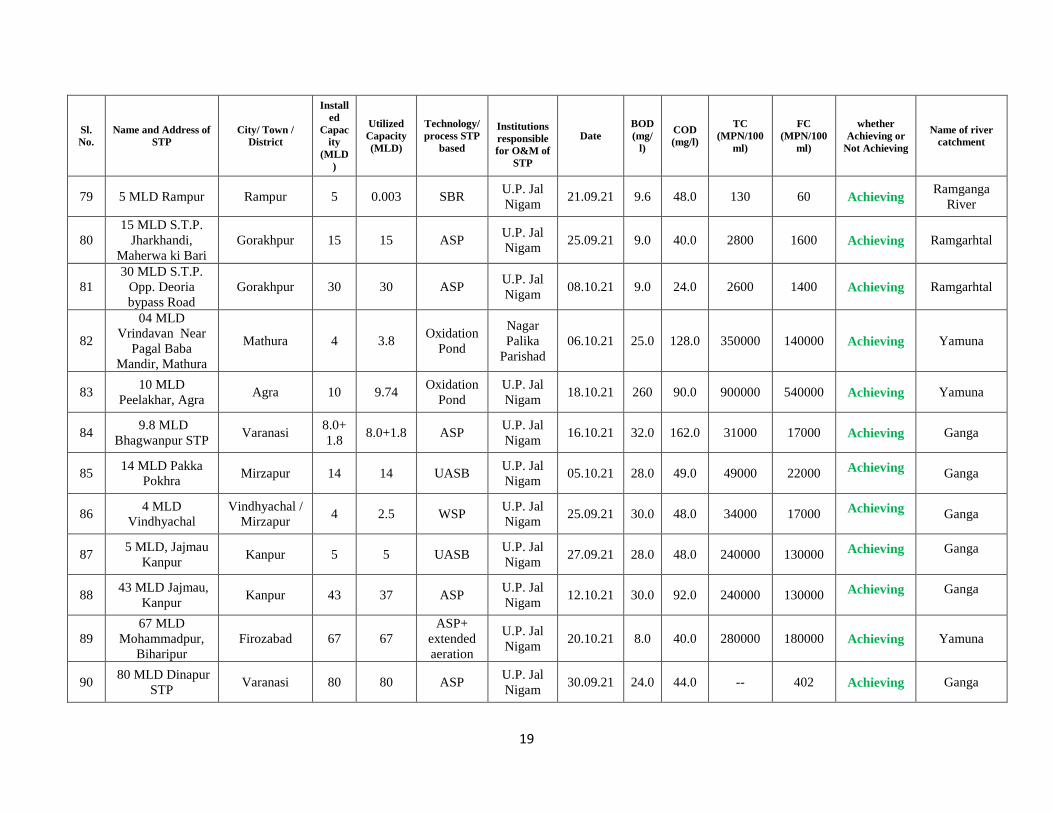
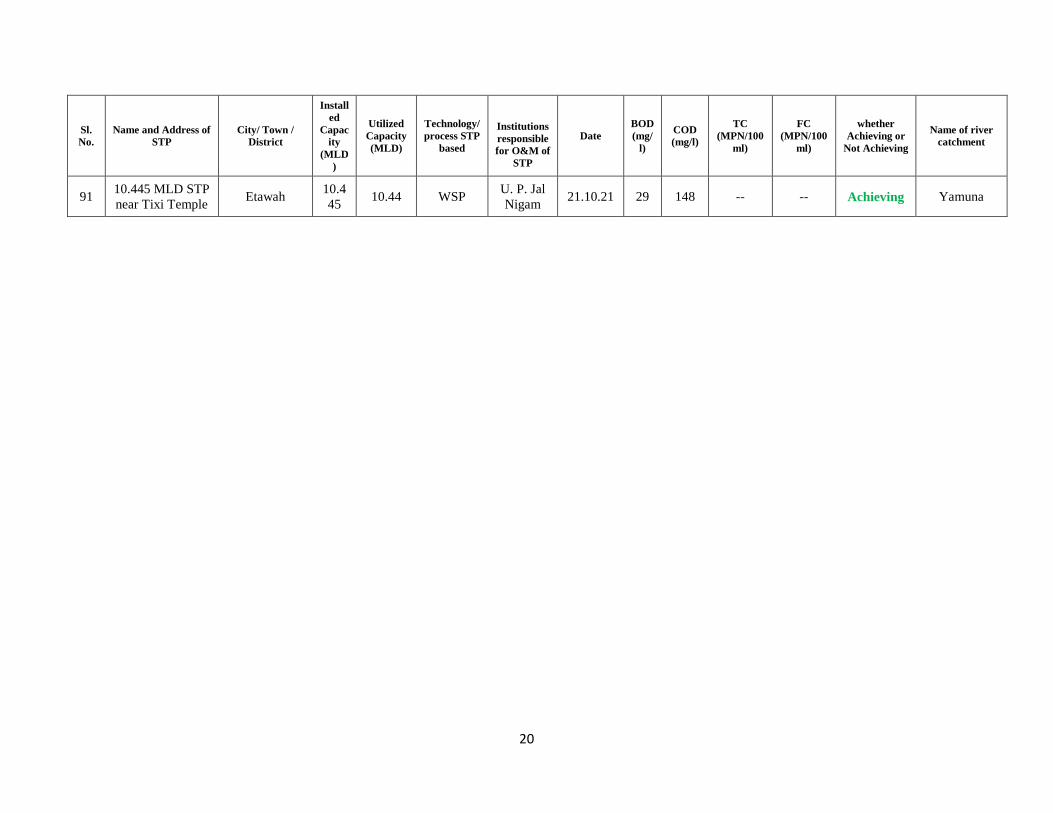
3. List of 91 Achieving STPs –
Sl.
No.
Name and Address of
STP
City/ Town /
District
Install
ed
Capac
ity
(MLD
)
Utilized
Capacity
(MLD)
Technology/
process STP
based
Institutions
responsible
for O&M of
STP
Date
BOD
(mg/
l)
COD
(mg/l)
TC
(MPN/100
ml)
FC
(MPN/100
ml)
whether
Achieving or
Not Achieving
Name of river
catchment
1 1.65 MLD Saifai Etawah 1.65 1.65 SBR U.P. Jal
Nigam 07.09.21 27.0 200.0 180000 110000 Achieving
Treated
sewage is
used for
plantation
2
23 MLD STP at
Mauja Odenya,
Padaria
Mainpuri 23.0 10.4 UASB
Nagar
Palika
Parishad
07.09.21 30.0 216.0 220000 170000 Achieving Ishan River /
River Ganga
3 3.42 MLD Near
Divyang kendra Chitrakoot 3.42 3.42
Oxidation
Pond
U.P. Jal
Nigam 10.09.20 22.0 115.2 92000 43000 Achieving
Lowland area
to River
Mandakini
4 42 MLD, Sajari
Kanpur Kanpur 42 22 ASP
U.P. Jal
Nigam 22.09.21 - 100.0 94000 58000 Achieving
Tributary of
River Ganga
5 210 MLD,
Bingawan Kanpur Kanpur 210 140 UASB
U.P. Jal
Nigam 21.09.21 - 180.0 920000 170000 Achieving
Tributary of
River Ganga
6
2.7 MLD
Fatehgarh
STP
Farrukhabad 2.7 2.0 WSP U.P. Jal
Nigam 21.09.21 - 140.0 110000 49000 Achieving River Ganga
10
Sl.
No.
Name and Address of
STP
City/ Town /
District
Install
ed
Capac
ity
(MLD
)
Utilized
Capacity
(MLD)
Technology/
process STP
based
Institutions
responsible
for O&M of
STP
Date
BOD
(mg/
l)
COD
(mg/l)
TC
(MPN/100
ml)
FC
(MPN/100
ml)
whether
Achieving or
Not Achieving
Name of river
catchment
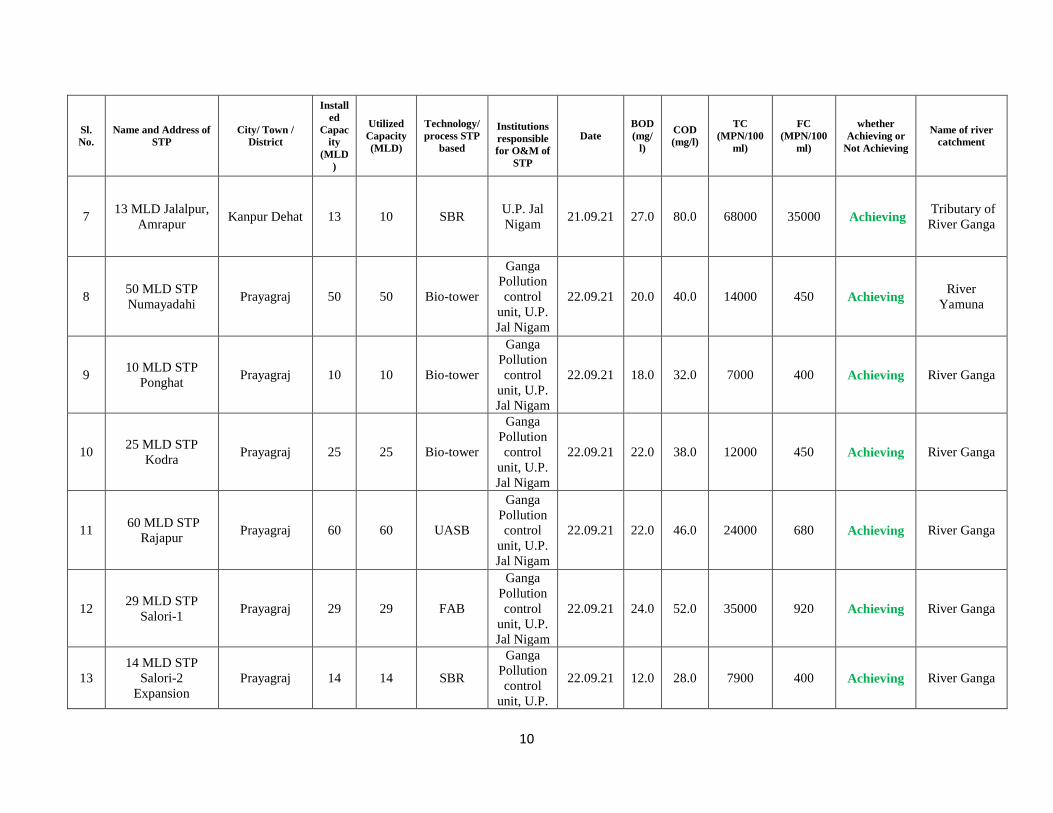
7 13 MLD Jalalpur,
Amrapur Kanpur Dehat 13 10 SBR
U.P. Jal
Nigam 21.09.21 27.0 80.0 68000 35000 Achieving
Tributary of
River Ganga
8 50 MLD STP
Numayadahi Prayagraj 50 50 Bio-tower
Ganga
Pollution
control
unit, U.P.
Jal Nigam
22.09.21 20.0 40.0 14000 450 Achieving River
Yamuna
9 10 MLD STP
Ponghat Prayagraj 10 10 Bio-tower
Ganga
Pollution
control
unit, U.P.
Jal Nigam
22.09.21 18.0 32.0 7000 400 Achieving River Ganga
10 25 MLD STP
Kodra Prayagraj 25 25 Bio-tower
Ganga
Pollution
control
unit, U.P.
Jal Nigam
22.09.21 22.0 38.0 12000 450 Achieving River Ganga
11 60 MLD STP
Rajapur Prayagraj 60 60 UASB
Ganga
Pollution
control
unit, U.P.
Jal Nigam
22.09.21 22.0 46.0 24000 680 Achieving River Ganga
12 29 MLD STP
Salori-1 Prayagraj 29 29 FAB
Ganga
Pollution
control
unit, U.P.
Jal Nigam
22.09.21 24.0 52.0 35000 920 Achieving River Ganga
13
14 MLD STP
Salori-2
Expansion
Prayagraj 14 14 SBR
Ganga
Pollution
control
unit, U.P.
22.09.21 12.0 28.0 7900 400 Achieving River Ganga
11
Sl.
No.
Name and Address of
STP
City/ Town /
District
Install
ed
Capac
ity
(MLD
)
Utilized
Capacity
(MLD)
Technology/
process STP
based
Institutions
responsible
for O&M of
STP
Date
BOD
(mg/
l)
COD
(mg/l)
TC
(MPN/100
ml)
FC
(MPN/100
ml)
whether
Achieving or
Not Achieving
Name of river
catchment
Jal Nigam
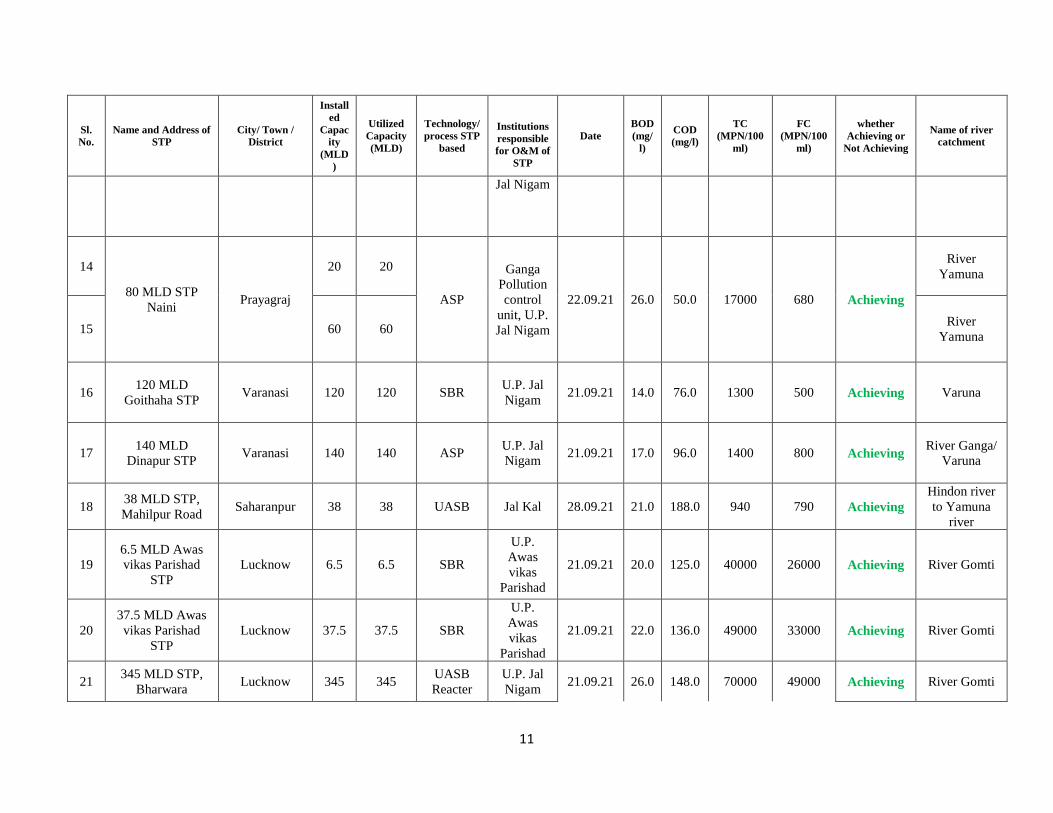
14
80 MLD STP
Naini Prayagraj
20 20
ASP
Ganga
Pollution
control
unit, U.P.
Jal Nigam
22.09.21 26.0 50.0 17000 680 Achieving
River
Yamuna
15 60 60 River
Yamuna
16 120 MLD
Goithaha STP Varanasi 120 120 SBR
U.P. Jal
Nigam 21.09.21 14.0 76.0 1300 500 Achieving Varuna
17 140 MLD
Dinapur STP Varanasi 140 140 ASP
U.P. Jal
Nigam 21.09.21 17.0 96.0 1400 800 Achieving
River Ganga/
Varuna
18 38 MLD STP,
Mahilpur Road Saharanpur 38 38 UASB Jal Kal 28.09.21 21.0 188.0 940 790 Achieving
Hindon river
to Yamuna
river
19
6.5 MLD Awas
vikas Parishad
STP
Lucknow 6.5 6.5 SBR
U.P.
Awas
vikas
Parishad
21.09.21 20.0 125.0 40000 26000 Achieving River Gomti
20
37.5 MLD Awas
vikas Parishad
STP
Lucknow 37.5 37.5 SBR
U.P.
Awas
vikas
Parishad
21.09.21 22.0 136.0 49000 33000 Achieving River Gomti
21 345 MLD STP,
Bharwara Lucknow 345 345
UASB
Reacter
U.P. Jal
Nigam 21.09.21 26.0 148.0 70000 49000 Achieving River Gomti

12
Sl.
No.
Name and Address of
STP
City/ Town /
District
Install
ed
Capac
ity
(MLD
)
Utilized
Capacity
(MLD)
Technology/
process STP
based
Institutions
responsible
for O&M of
STP
Date
BOD
(mg/
l)
COD
(mg/l)
TC
(MPN/100
ml)
FC
(MPN/100
ml)
whether
Achieving or
Not Achieving
Name of river
catchment
22 56 MLD STP,
Daulatganj Lucknow
42+1
4 42+14 FAB
U.P. Jal
Nigam 21.09.21 27.8 160.0 46000 17000 Achieving River Gomti
23 U.P. Jal
Nigam
24
56 MLD Trans
Hindon
(Indirapuram),
Ghaziabad
Ghaziabad 56 56 UASBR Nagar
Nigam 22.09.21 21.0 57.0 320000 26000 Achieving River Hindon
25
56 MLD S.B.R.,
Bapudham,
Ghaziabad
Ghaziabad 56 56 SBR
Ghaziaba
d
Developm
ent
Authority
13.09.21 15.0 157.0 3300 1100 Achieving Hindon
26
30 MLD,
Sadullabad
(Loni), Ghaziabad
Ghaziabad 30 30 MBR U.P. Jal
Nigam 22.09.21 9.0 71.0 1700 920 Achieving Hindon
27
74 MLD S.B.R.,
Indirapuram,
Ghaziabad
Ghaziabad 74 74 SBR U.P. Jal
Nigam 22.09.21 8.0 49.0 1400 610 Achieving River Hindon
28
56 MLD,
Indirapuram,
(GDA),
Ghaziabad
Ghaziabad 56 56 SBR GDA 22.09.21 17.0 178.0 70000 26000 Achieving River Hindon
13
Sl.
No.
Name and Address of
STP
City/ Town /
District
Install
ed
Capac
ity
(MLD
)
Utilized
Capacity
(MLD)
Technology/
process STP
based
Institutions
responsible
for O&M of
STP
Date
BOD
(mg/
l)
COD
(mg/l)
TC
(MPN/100
ml)
FC
(MPN/100
ml)
whether
Achieving or
Not Achieving
Name of river
catchment
29
56 MLD S.B.R.,
Dudahaida Vijay
Nagar, Ghaziabad
Ghaziabad 56 56 SBR GDA 22.09.21 8.0 66.0 1400 930 Achieving River Hindon
30 56 MLD S.B.R.,
Morty, Ghaziabad Ghaziabad 56 56 SBR GDA 22.09.21 17.0 69.0 1100 400 Achieving River Hindon
31
70 MLD
U.A.S.B.R.
Dudahaida Vijay
Nagar, Ghaziabad
Ghaziabad 70 70 UASBR Nagar
Nigam 22.09.21 23.0 87.0 280000 170000 Achieving River Hindon
32
3 MLD STP
Brijghat Zone,
Garhmukeshwar
Hapur
Hapur /
Garhmuktesw
ar
3 1.8
UASB
followed
by
extended
aeration
U.P. Jal
Nigam
(NGRBA)
21.09.21 12.0 61.0 13000 910 Achieving
River Ganga
(Brijghat
Area)
33
6 MLD STP Garh
Zone,
Garhmukeshwar
Hapur
Hapur /
Garhmuktesw
ar
6 3.5
UASB
followed
by
extended
aeration
U.P. Jal
Nigam
(NGRBA)
21.09.21 18.0 74.0 1400 610 Achieving
Garh
Catchment
Area
34 3 MLD Pilkhaun Ghaziabad 3 3 MBBR U.P. Jal
Nigam 21.09.21 13.0 58.0 2700 1200 Achieving
River kali/
River Ganga
14
Sl.
No.
Name and Address of
STP
City/ Town /
District
Install
ed
Capac
ity
(MLD
)
Utilized
Capacity
(MLD)
Technology/
process STP
based
Institutions
responsible
for O&M of
STP
Date
BOD
(mg/
l)
COD
(mg/l)
TC
(MPN/100
ml)
FC
(MPN/100
ml)
whether
Achieving or
Not Achieving
Name of river
catchment
35 5 MLD Tronica
City, Loni Ghaziabad 5 3 MBR UPSIDC 22.09.21 20.0 199.0 2200 610 Achieving
Green belts
development
36
56 MLD S.B.R.
Govindpuram,
Ghaziabad
Ghaziabad 56 56 SBR GDA 22.09.21 20.0 106.0 7900 4900 Achieving River Hindon
37
78 MLD
Dhadhupura,
Agra
Agra 78 68.41 UASB U.P. Jal
Nigam 25.09.21 29.0 160.0 250000 190000 Achieving Onland
38 2.25 MLD Budi
ka Nagla, Agra Agra 2.25 2.97
Oxidation
Pond
U.P. Jal
Nigam 25.09.21 30.0 168.0 700000 310000 Achieving
Irrigation/Riv
er Yamuna
39
12 MLD Devri
Road,
(Bhimnagri),
Agra
Agra 12 6.35 UASB U.P. Jal
Nigam 25.09.21 28.0 128.0 310000 130000 Achieving
River
Yamuna
40
14 MLD
Jaganpur,
Sikandarpur, Agra
Agra 14 13.39 UASB U.P. Jal
Nigam 25.09.21 27.0 144.0 280000 120000 Achieving Onland
41
40 MLD
Sadarban,
Bichhpuri, Agra
Agra 40 18.73 UASB U.P. Jal
Nigam 25.09.21 27.0 128.0 190000 110000 Achieving
River
Yamuna
42
24 MLD
Dhadhupura
(New), Agra
Agra 24 18.91 UASB U.P. Jal
Nigam 25.09.21 25.0 144.0 240000 120000 Achieving Onland
15
Sl.
No.
Name and Address of
STP
City/ Town /
District
Install
ed
Capac
ity
(MLD
)
Utilized
Capacity
(MLD)
Technology/
process STP
based
Institutions
responsible
for O&M of
STP
Date
BOD
(mg/
l)
COD
(mg/l)
TC
(MPN/100
ml)
FC
(MPN/100
ml)
whether
Achieving or
Not Achieving
Name of river
catchment
43
36 MLD
Sadarwan
(Bichpuri) New
Agra 36 36 SBR ADA 25.09.21 25.0 144.0 160000 110000 Achieving Land/ Agra
canal
44
4.50 MLD
Kalindi Vihar,
Agra
Agra 4.5 4.5 UASB ADA 25.09.21 28.0 168.0 240000 130000 Achieving River
Yamuna
45 03 MLD Pandav
Nagar, Meerut Meerut 3 2.7 ASP MDA 27.09.21 16.0 154.0 3200 2500 Achieving
River Kali
(East)
46
07 MLD
Pallavpuram-1,
Meerut
Meerut 7 6.5 ASP MDA 27.09.21 14.0 148.0 3100 2400 Achieving River Kali
(East)
47 10 MLD Lohiya
Nagar, Meerut Meerut 10 2 ASP MDA 27.09.21 17.0 156.0 3300 2700 Achieving
River Kali
(East)
48
15 MLD
Shatabdinagar,
Meerut
Meerut 15 4.8 ASP MDA 27.09.21 17.0 156.0 3200 2500 Achieving River Kali
(East)
49
7 MLD
Pallavpuram-2,
Meerut
Meerut 7 7 MBBR MDA 27.09.21 15.0 156.0 3300 2500 Achieving River Kali
(East)
50
15 MLD
Vedvyaspuri
Meerut
Meerut 15 4.5 ASP MDA 27.09.21 15.0 148.0 3100 2600 Achieving River Kali
(East)
51
06 MLD
Rakshapuram,
Meerut
Meerut 6 4.4 ASP MDA 27.09.21 15.0 144.0 3200 2600 Achieving River Kali
(East)
16
Sl.
No.
Name and Address of
STP
City/ Town /
District
Install
ed
Capac
ity
(MLD
)
Utilized
Capacity
(MLD)
Technology/
process STP
based
Institutions
responsible
for O&M of
STP
Date
BOD
(mg/
l)
COD
(mg/l)
TC
(MPN/100
ml)
FC
(MPN/100
ml)
whether
Achieving or
Not Achieving
Name of river
catchment
52
06 MLD
Shradhapuri-1,
Meerut
Meerut 6 5.5 ASP MDA 27.09.21 17.0 156.0 3400 2500 Achieving River Kali
(East)
53 06 MLD Sainik
Vihar Meerut 6 5.95 UASB MDA 27.09.21 15.0 144.0 3100 2500 Achieving
River Kali
(East)
54
5 MLD
Modipuram
Tiraha
Meerut 5 4.9 ASP MDA 27.09.21 17.0 152.0 3300 2700 Achieving River Kali
(East)
55
07 MLD Sports
Goods Complex,
Meerut
Meerut 7 4 ASP MDA 27.09.21 16.0 144.0 3300 2600 Achieving River Kali
(East)
56
72 MLD Garh
road (Jagriti
vihar)
Meerut 72 65 SBR U.P. Jal
Nigam 27.09.21 7.0 86.0 830 680 Achieving River Ganga
57 10 MLD Ganga
Nagar, Meerut Meerut 10 3.8 SBR MDA 27.09.21 16.0 152.0 3200 2600 Achieving
River Kali
(East)
58
06 MLD
Shradhapuri-
Phase-2, Meerut
Meerut 6 5.6 ASP MDA 27.09.21 15.0 146.0 3200 2500 Achieving River Kali
(East)
59
32.5 MLD Nagar
Palika Parishad,
Muzaffarnagar
Muzaffar
Nagar 32.5 32.5
Oxidation
Pond
Nagar
Palika
Parishad,
Muzaffar
nagar
07.09.21 28.0 120.0 230000 140000 Achieving River Hindon
17
Sl.
No.
Name and Address of
STP
City/ Town /
District
Install
ed
Capac
ity
(MLD
)
Utilized
Capacity
(MLD)
Technology/
process STP
based
Institutions
responsible
for O&M of
STP
Date
BOD
(mg/
l)
COD
(mg/l)
TC
(MPN/100
ml)
FC
(MPN/100
ml)
whether
Achieving or
Not Achieving
Name of river
catchment
60 12 MLD Ayodhya Ayodhya 12 6 UASB U.P. Jal
Nigam 21.09.21 20.0 88.0 540000 350000 Achieving River Saryu
61
08 MLD STP
Near 100 Bed
Hospital
Vrindavan,
Mathura
Mathura 8 7 UASB
Reacter
U.P. Jal
Nigam 21.09.21 28.0 160.0 140000 790000 Achieving
River
Yamuna
62 30 MLD Masani
Mathura Mathura 30 20 SBR
U.P. Jal
Nigam 15.09.21 29.0 152.0 ---- ---- Achieving
Final
Discharge on
Forest Land
63 33 MLD Sector-
54, Noida Noida 33 33 SBR
Noida
Authority 13.09.21 15.0 112.0 2200 680 Achieving
River
Yamuna
64 25 MLD Sector-
50, Noida Noida 25 25 SBR
Noida
Authority 13.09.21 21.0 114.0 1100 400 Achieving
River
Yamuna
65 35 MLD Sector-
123, Noida Noida 35 35 SBR
Noida
Authority 13.09.21 21.0 152.0 2200 1700 Achieving River Hindon
66 50 MLD Sector-
168, Noida Noida 50 50 SBR
Noida
Authority 13.09.21 22.5 160.0 2700 930 Achieving
River
Yamuna
67 34 MLD Sector -
50 Noida Noida 34 34 SBR
Noida
Authority 13.09.21 22.5 152.0 2700 1400 Achieving
River
Yamuna
68 54 MLD Sector-
54, Noida Noida 54 54 SBR
Noida
Authority 13.09.21 16.5 136.0 1400 610 Achieving
River
Yamuna
69
0.805 MLD Ahara
Road, Zone-A,
Anoopshahar
Bulandhsahar 0.80
5 0.805
Oxidation
Pond
U.P. Jal
Nigam 29.09.21 26.0 212.0 3400000 2100000 Achieving River Ganga
18
Sl.
No.
Name and Address of
STP
City/ Town /
District
Install
ed
Capac
ity
(MLD
)
Utilized
Capacity
(MLD)
Technology/
process STP
based
Institutions
responsible
for O&M of
STP
Date
BOD
(mg/
l)
COD
(mg/l)
TC
(MPN/100
ml)
FC
(MPN/100
ml)
whether
Achieving or
Not Achieving
Name of river
catchment
70
1.75 MLD Ahara
Road, Zone-B,
Anoopshahar
Bulandhsahar 1.75 1.75 Oxidation
Pond
U.P. Jal
Nigam 29.09.21 28.0 228.0 2800000 1600000 Achieving River Ganga
71 04 MLD Narora
(NGRBA) Bulandhsahar 4 4 SBR
U.P. Jal
Nigam 22.09.21 18.0 136.0 2400 920 Achieving For Irrigation
72
2.25 MLD Narora
Atomic power
Station Narora
Township
Bulandhsahar 2.25 2.25 ASP
Narora
Atomic
power
Station
22.09.21 20.0 144.0 1600 540 Achieving For Irrigation
73
1.5 MLD
Anoopshahar
Zone A
(NGRBA)
Bulandhsahar 1.5 1.5 MBBR U.P. Jal
Nigam 22.09.21 28.0 216.0 2100000 1100000 Achieving River Ganga
74
01 MLD STP
Zone-B
Anoopshahar
Bulandhsahar 1 1 MBBR U.P. Jal
Nigam 22.09.21 24.0 216.0 250000 130000 Achieving River Ganga
75 24 MLD Bijnor Bijnor 24 10 UASB U.P. Jal
Nigam 20.09.21 12.0 40.0 2800 130 Achieving River Ganga
76 58 MLD
Moradabad Moradabad 58 18 SBR
U.P. Jal
Nigam 21.09.21 22.0 92.0 110 50 Achieving
Ramganga
River
77 15 MLD
Pehrigaon Rampur 15 0.07 UASB
U.P. Jal
Nigam 21.09.21 22.0 88.0 1100 500 Achieving
Ramganga
River
78 14 MLD
Benzirpur Rampur 14 0.11 UASB
U.P. Jal
Nigam 21.09.21 26.0 96.0 120 50 Achieving
Ramganga
River
19
Sl.
No.
Name and Address of
STP
City/ Town /
District
Install
ed
Capac
ity
(MLD
)
Utilized
Capacity
(MLD)
Technology/
process STP
based
Institutions
responsible
for O&M of
STP
Date
BOD
(mg/
l)
COD
(mg/l)
TC
(MPN/100
ml)
FC
(MPN/100
ml)
whether
Achieving or
Not Achieving
Name of river
catchment
79 5 MLD Rampur Rampur 5 0.003 SBR U.P. Jal
Nigam 21.09.21 9.6 48.0 130 60 Achieving
Ramganga
River
80
15 MLD S.T.P.
Jharkhandi,
Maherwa ki Bari
Gorakhpur 15 15 ASP U.P. Jal
Nigam 25.09.21 9.0 40.0 2800 1600 Achieving Ramgarhtal
81
30 MLD S.T.P.
Opp. Deoria
bypass Road
Gorakhpur 30 30 ASP U.P. Jal
Nigam 08.10.21 9.0 24.0 2600 1400 Achieving Ramgarhtal
82
04 MLD
Vrindavan Near
Pagal Baba
Mandir, Mathura
Mathura 4 3.8 Oxidation
Pond
Nagar
Palika
Parishad
06.10.21 25.0 128.0 350000 140000 Achieving Yamuna
83 10 MLD
Peelakhar, Agra Agra 10 9.74
Oxidation
Pond
U.P. Jal
Nigam 18.10.21 260 90.0 900000 540000 Achieving Yamuna
84 9.8 MLD
Bhagwanpur STP Varanasi
8.0+
1.8 8.0+1.8 ASP
U.P. Jal
Nigam 16.10.21 32.0 162.0 31000 17000 Achieving Ganga
85 14 MLD Pakka
Pokhra Mirzapur 14 14 UASB
U.P. Jal
Nigam 05.10.21 28.0 49.0 49000 22000 Achieving Ganga
86 4 MLD
Vindhyachal
Vindhyachal /
Mirzapur 4 2.5 WSP
U.P. Jal
Nigam 25.09.21 30.0 48.0 34000 17000 Achieving Ganga
87 5 MLD, Jajmau
Kanpur Kanpur 5 5 UASB
U.P. Jal
Nigam 27.09.21 28.0 48.0 240000 130000 Achieving Ganga
88 43 MLD Jajmau,
Kanpur Kanpur 43 37 ASP
U.P. Jal
Nigam 12.10.21 30.0 92.0 240000 130000 Achieving Ganga
89
67 MLD
Mohammadpur,
Biharipur
Firozabad 67 67
ASP+
extended
aeration
U.P. Jal
Nigam 20.10.21 8.0 40.0 280000 180000 Achieving Yamuna
90 80 MLD Dinapur
STP Varanasi 80 80 ASP
U.P. Jal
Nigam 30.09.21 24.0 44.0 -- 402 Achieving Ganga
20
Sl.
No.
Name and Address of
STP
City/ Town /
District
Install
ed
Capac
ity
(MLD
)
Utilized
Capacity
(MLD)
Technology/
process STP
based
Institutions
responsible
for O&M of
STP
Date
BOD
(mg/
l)
COD
(mg/l)
TC
(MPN/100
ml)
FC
(MPN/100
ml)
whether
Achieving or
Not Achieving
Name of river
catchment
91 10.445 MLD STP
near Tixi Temple Etawah
10.4
45 10.44 WSP
U. P. Jal
Nigam 21.10.21 29 148 -- -- Achieving Yamuna
21
21
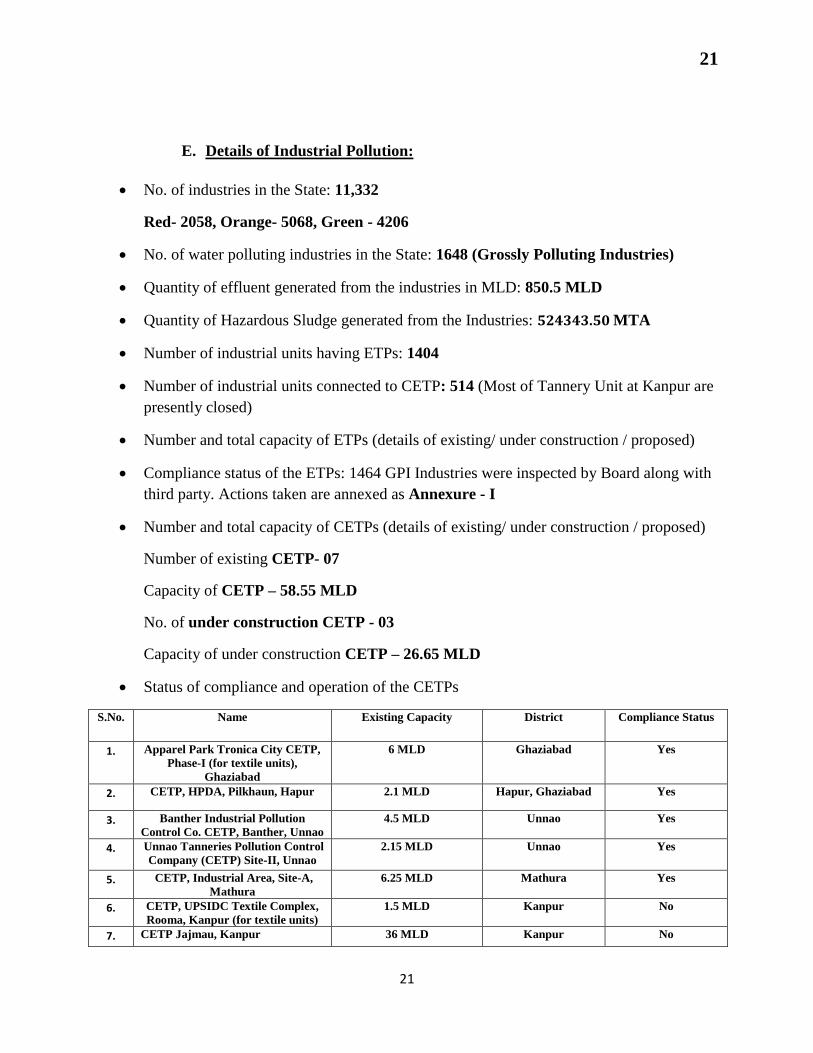
E. Details of Industrial Pollution:
No. of industries in the State: 11,332
Red- 2058, Orange- 5068, Green - 4206
No. of water polluting industries in the State: 1648 (Grossly Polluting Industries)
Quantity of effluent generated from the industries in MLD: 850.5 MLD
Quantity of Hazardous Sludge generated from the Industries: 524343.50 MTA
Number of industrial units having ETPs: 1404
Number of industrial units connected to CETP: 514 (Most of Tannery Unit at Kanpur are
presently closed)
Number and total capacity of ETPs (details of existing/ under construction / proposed)
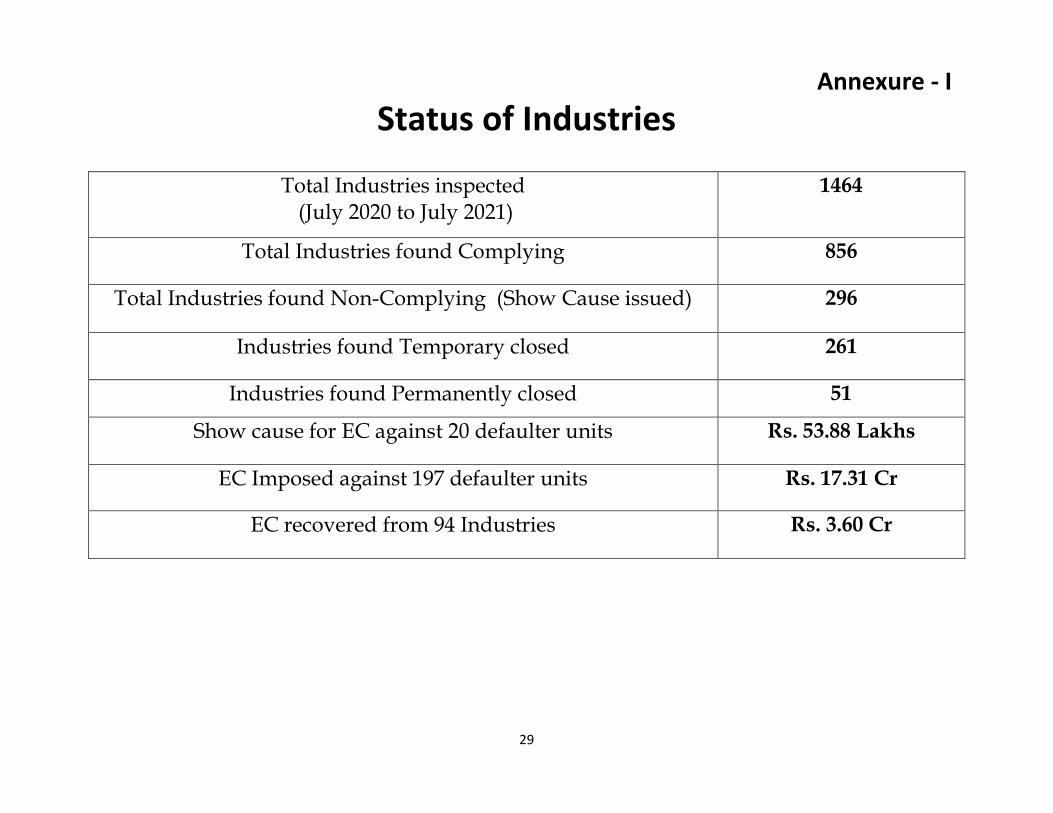
Compliance status of the ETPs: 1464 GPI Industries were inspected by Board along with
third party. Actions taken are annexed as Annexure - I
Number and total capacity of CETPs (details of existing/ under construction / proposed)
Number of existing CETP- 07
Capacity of CETP – 58.55 MLD
No. of under construction CETP - 03
Capacity of under construction CETP – 26.65 MLD
Status of compliance and operation of the CETPs
S.No. Name Existing Capacity District Compliance Status
1. Apparel Park Tronica City CETP,
Phase-I (for textile units),
Ghaziabad
6 MLD Ghaziabad Yes
2. CETP, HPDA, Pilkhaun, Hapur 2.1 MLD Hapur, Ghaziabad Yes
3. Banther Industrial Pollution
Control Co. CETP, Banther, Unnao 4.5 MLD Unnao Yes
4. Unnao Tanneries Pollution Control
Company (CETP) Site-II, Unnao 2.15 MLD Unnao Yes
5. CETP, Industrial Area, Site-A,
Mathura 6.25 MLD Mathura Yes
6. CETP, UPSIDC Textile Complex,
Rooma, Kanpur (for textile units) 1.5 MLD Kanpur No
7. CETP Jajmau, Kanpur 36 MLD Kanpur No

22
22
F. Solid Waste Management:
Total number of Urban Local Bodies and their Population
Urban Local Bodies- 651
Urban Population – 4.5 Crore
Current Municipal Solid Waste Generation- 14468 TPD approx.
Number, installed capacity and utilization of existing MSW processing facilities in TPD
(bifurcated by type of processing eg- Waste to Energy (Tonnage and Power Output),
Compost Plants (Windrow, Vermi, decentralized pit composting), biomethanation, MRF
etc
No. of MSW processing facilities- 17 Plants (all are compost plant)
Installed Capacity- 5,520 TPD
Utilization of existing MSW processing facilities- 5,520 TPD (100%)
Action plan to bridge gap between Installed Capacity and Current Utilization of
processing facilities (if Gap > 20%) - NA
No. and capacity of C&D waste processing plants in TPD (existing, proposed and under
construction)
1. C& D Waste Processing Facilities
Noida
(Sector-81)
Facility of 300 MTD has come into operation since 05-10-
2020.
Ghaziabad (Hindon Vihar) Facility of 400 MTD is functional.
Lucknow, Agra, Varanasi,
Kanpur & Prayagraj
Funds @ Rs. 1.5 Crore/City released to concerned Municipal
Corporation. Expected to be commissioned by March, 2022.
Meerut C & D Waste Management Facility is to be developed in 2
years.
Town No. of
industries
Industrial
discharge
Status of ETPs Status of CETPs (existing,
under construction & proposed)
State of U.P. 1108
Operational
779.639 MLD Installed and Operational As Above
23
23
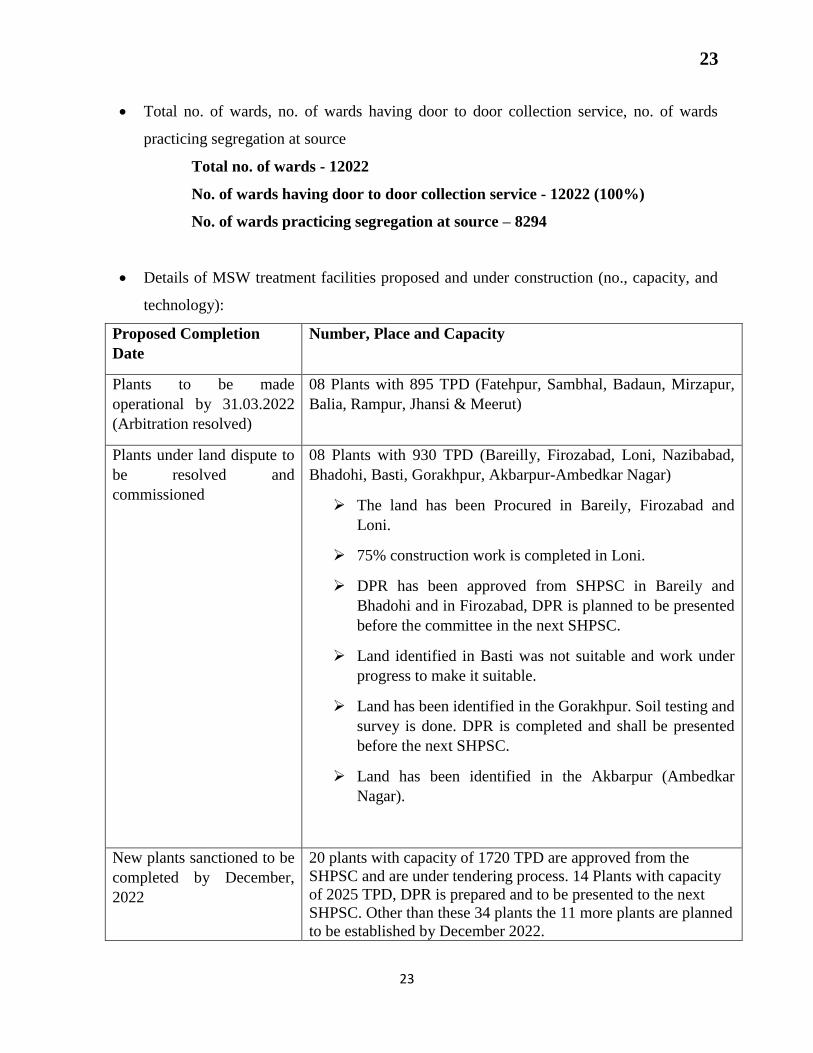
Total no. of wards, no. of wards having door to door collection service, no. of wards
practicing segregation at source
Total no. of wards - 12022
No. of wards having door to door collection service - 12022 (100%)
No. of wards practicing segregation at source – 8294
Details of MSW treatment facilities proposed and under construction (no., capacity, and
technology):
Proposed Completion
Date
Number, Place and Capacity
Plants to be made
operational by 31.03.2022
(Arbitration resolved)
08 Plants with 895 TPD (Fatehpur, Sambhal, Badaun, Mirzapur,
Balia, Rampur, Jhansi & Meerut)
Plants under land dispute to
be resolved and
commissioned
08 Plants with 930 TPD (Bareilly, Firozabad, Loni, Nazibabad,
Bhadohi, Basti, Gorakhpur, Akbarpur-Ambedkar Nagar)
The land has been Procured in Bareily, Firozabad and
Loni.
75% construction work is completed in Loni.
DPR has been approved from SHPSC in Bareily and
Bhadohi and in Firozabad, DPR is planned to be presented
before the committee in the next SHPSC.
Land identified in Basti was not suitable and work under
progress to make it suitable.
Land has been identified in the Gorakhpur. Soil testing and
survey is done. DPR is completed and shall be presented
before the next SHPSC.
Land has been identified in the Akbarpur (Ambedkar
Nagar).
New plants sanctioned to be
completed by December,
2022
20 plants with capacity of 1720 TPD are approved from the
SHPSC and are under tendering process. 14 Plants with capacity
of 2025 TPD, DPR is prepared and to be presented to the next
SHPSC. Other than these 34 plants the 11 more plants are planned
to be established by December 2022.

24
24
It is targeted that all smaller ULBs (approximately 450) that generate less
than 10 TPD of solid waste establish composting facility for processing by
December, 2022.
No. and area (in acres) of uncontrolled garbage dumpsites and Sanitary Landfills.-
No. and area (in acres) of legacy waste within 1km buffer of both side of the rivers-
There is no legacy waste site situated within 1 KM of the banks of rivers.
No. of drains falling into rivers and no. of drains having floating racks/screens installed to
prevent solid waste from falling into the rivers- Out of total 504 drains falling into the
rivers 96 drains having Bar mesh/ Floating Racks.
Status of ULB wise Management of Solid Waste
ULB Total MSW
generation in
TPD
Total MSW
being processed
in TPD
Existing
MSW
facilities
Utilization
Capacity of the
existing MSW
facilities
Proposed MSW
Facilities &
Completion
Timeline
651 14468 9,860 5,520
TPD
100% As Above
G. Bio-medical Waste Management:
Total Bio-medical generation: 52.5 MT/Day
No. of Hospitals and Health Care Facilities: 25,411
Status of Treatment Facility/ CBMWTF:
There are 20 Common Biomedical Waste Treatment Facilities (CBWTFs) installed in the
State, out of which18 are functional and 01 is under up gradation and 01 is closed by the
Board.
Total incineration capacity of 18 functional CBWTFs is 54.5 MT/Day which is adequate
to treat the Biomedical Waste generated in the State.
25
25
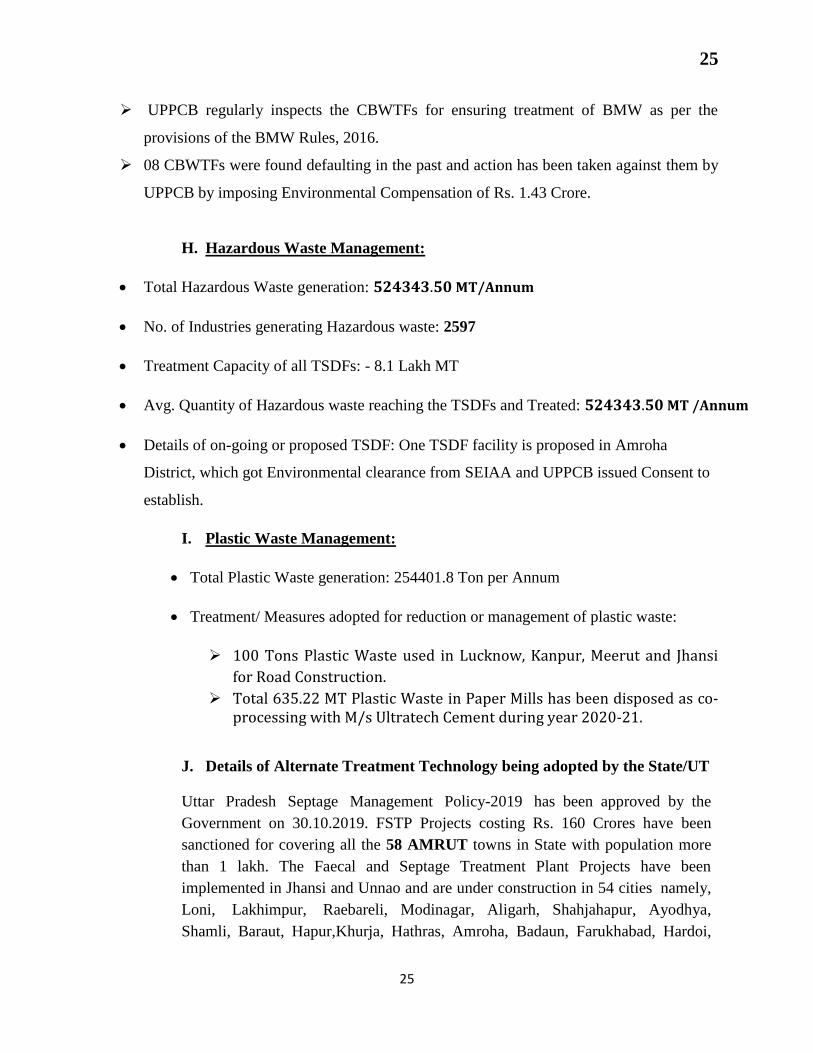
UPPCB regularly inspects the CBWTFs for ensuring treatment of BMW as per the
provisions of the BMW Rules, 2016.
08 CBWTFs were found defaulting in the past and action has been taken against them by
UPPCB by imposing Environmental Compensation of Rs. 1.43 Crore.
H. Hazardous Waste Management:
Total Hazardous Waste generation: 524343.50 MT/Annum
No. of Industries generating Hazardous waste: 2597
Treatment Capacity of all TSDFs: - 8.1 Lakh MT
Avg. Quantity of Hazardous waste reaching the TSDFs and Treated: 524343.50 MT /Annum
Details of on-going or proposed TSDF: One TSDF facility is proposed in Amroha
District, which got Environmental clearance from SEIAA and UPPCB issued Consent to
establish.
I. Plastic Waste Management:
Total Plastic Waste generation: 254401.8 Ton per Annum
Treatment/ Measures adopted for reduction or management of plastic waste:
100 Tons Plastic Waste used in Lucknow, Kanpur, Meerut and Jhansi
for Road Construction.
Total 635.22 MT Plastic Waste in Paper Mills has been disposed as co-processing with M/s Ultratech Cement during year 2020-21.
J. Details of Alternate Treatment Technology being adopted by the State/UT
Uttar Pradesh Septage Management Policy-2019 has been approved by the
Government on 30.10.2019. FSTP Projects costing Rs. 160 Crores have been
sanctioned for covering all the 58 AMRUT towns in State with population more
than 1 lakh. The Faecal and Septage Treatment Plant Projects have been
implemented in Jhansi and Unnao and are under construction in 54 cities namely,
Loni, Lakhimpur, Raebareli, Modinagar, Aligarh, Shahjahapur, Ayodhya,
Shamli, Baraut, Hapur,Khurja, Hathras, Amroha, Badaun, Farukhabad, Hardoi,
26
26
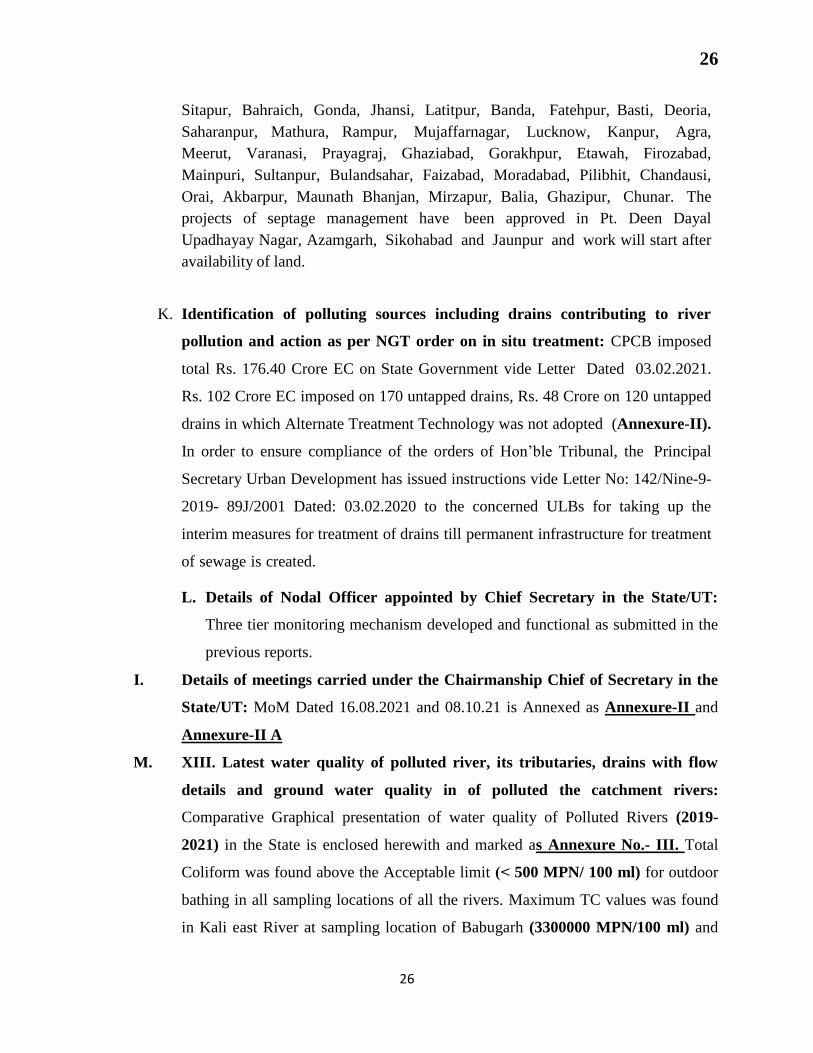
Sitapur, Bahraich, Gonda, Jhansi, Latitpur, Banda, Fatehpur, Basti, Deoria,
Saharanpur, Mathura, Rampur, Mujaffarnagar, Lucknow, Kanpur, Agra,
Meerut, Varanasi, Prayagraj, Ghaziabad, Gorakhpur, Etawah, Firozabad,
Mainpuri, Sultanpur, Bulandsahar, Faizabad, Moradabad, Pilibhit, Chandausi,
Orai, Akbarpur, Maunath Bhanjan, Mirzapur, Balia, Ghazipur, Chunar. The
projects of septage management have been approved in Pt. Deen Dayal
Upadhayay Nagar, Azamgarh, Sikohabad and Jaunpur and work will start after
availability of land.
K. Identification of polluting sources including drains contributing to river
pollution and action as per NGT order on in situ treatment: CPCB imposed
total Rs. 176.40 Crore EC on State Government vide Letter Dated 03.02.2021.
Rs. 102 Crore EC imposed on 170 untapped drains, Rs. 48 Crore on 120 untapped
drains in which Alternate Treatment Technology was not adopted (Annexure-II).
In order to ensure compliance of the orders of Hon’ble Tribunal, the Principal
Secretary Urban Development has issued instructions vide Letter No: 142/Nine-9-
2019- 89J/2001 Dated: 03.02.2020 to the concerned ULBs for taking up the
interim measures for treatment of drains till permanent infrastructure for treatment
of sewage is created.
L. Details of Nodal Officer appointed by Chief Secretary in the State/UT:
Three tier monitoring mechanism developed and functional as submitted in the
previous reports.
I. Details of meetings carried under the Chairmanship Chief of Secretary in the
State/UT: MoM Dated 16.08.2021 and 08.10.21 is Annexed as Annexure-II and
Annexure-II A
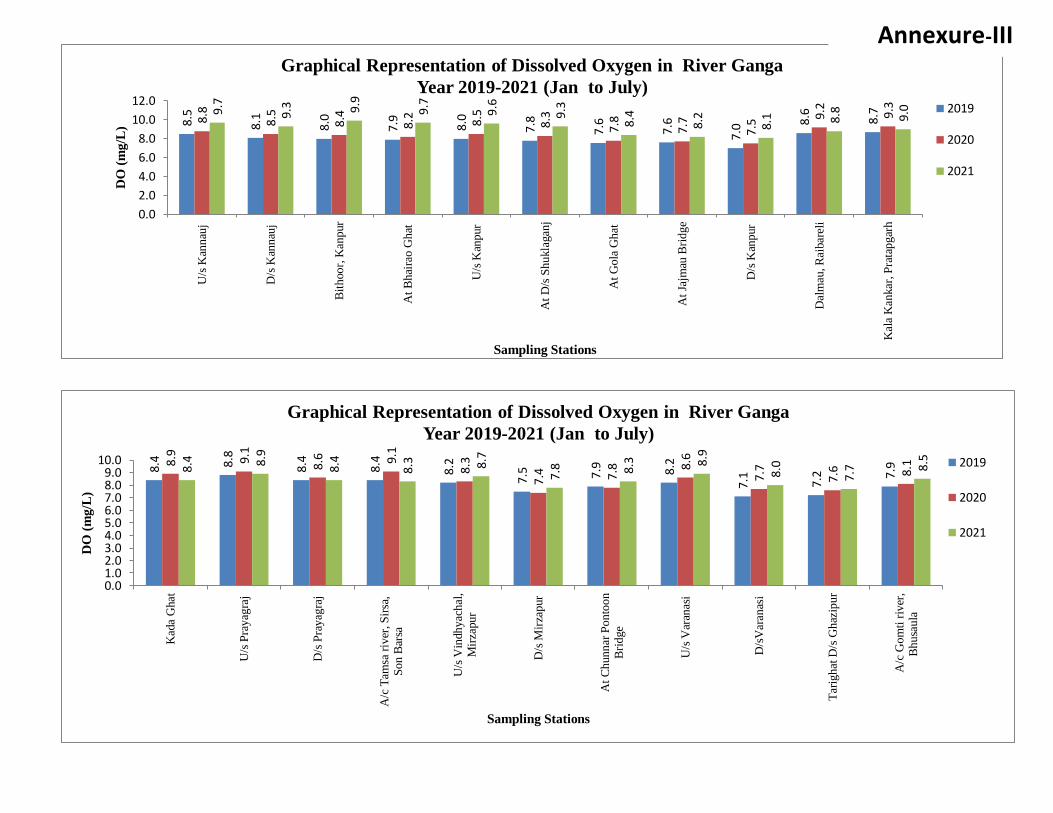
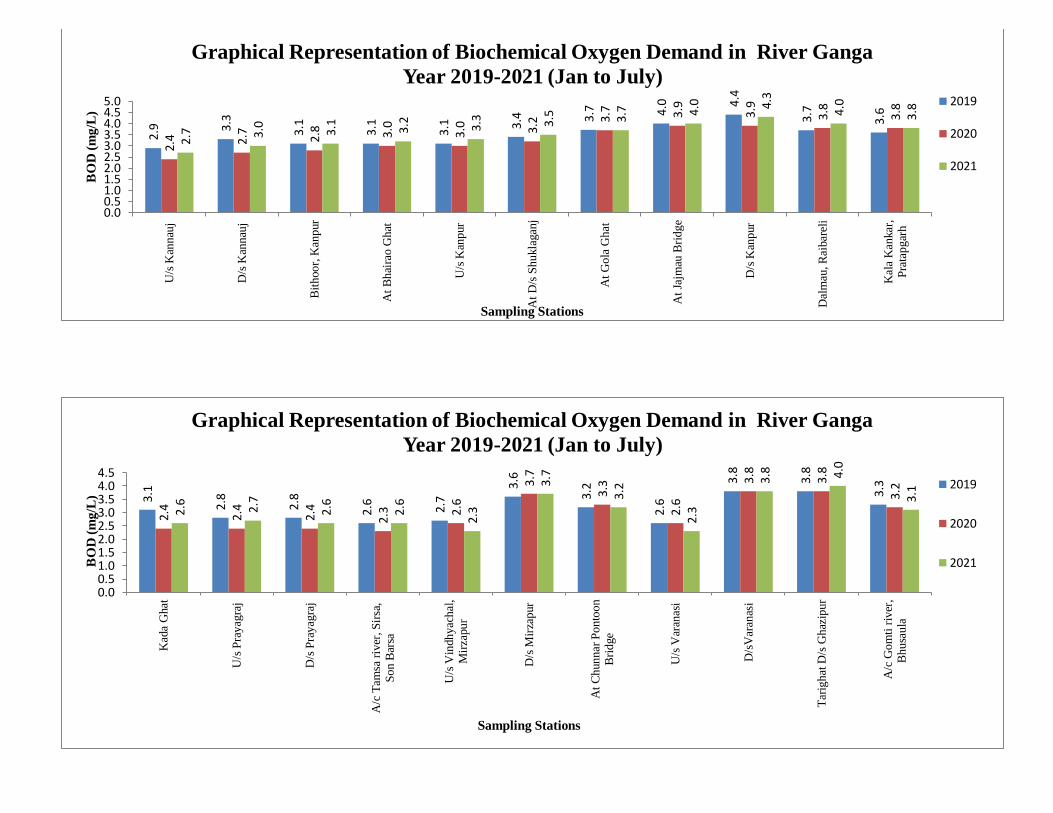
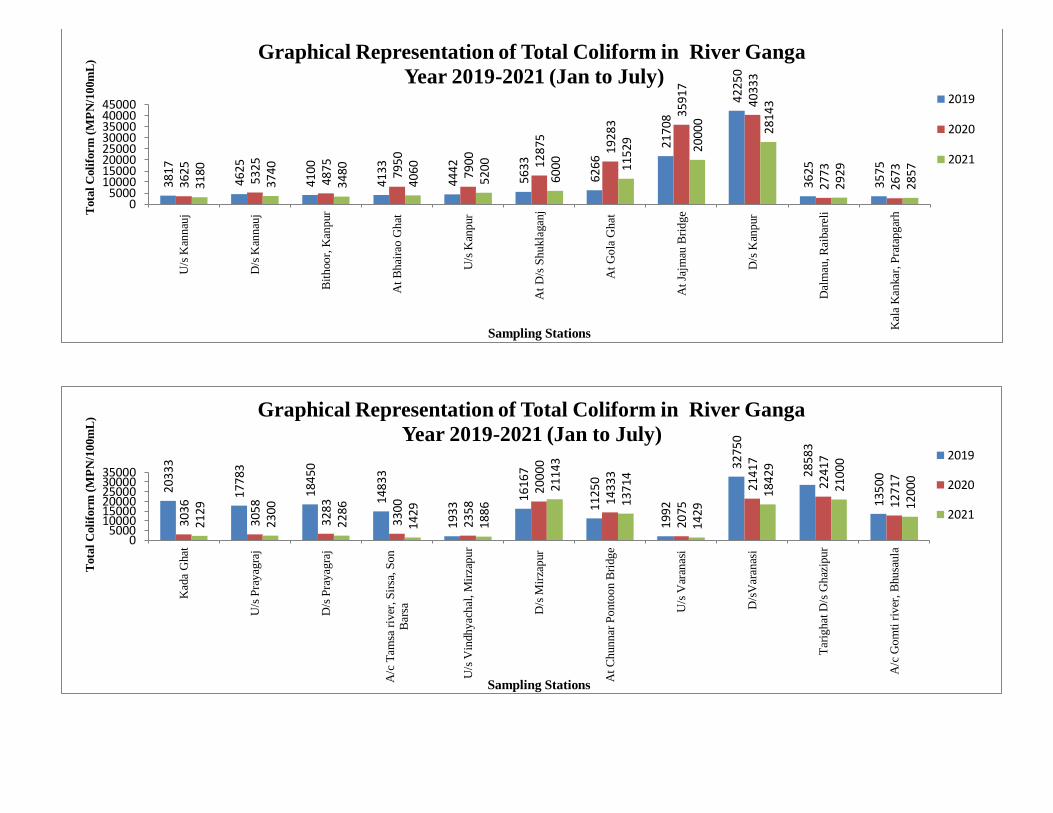
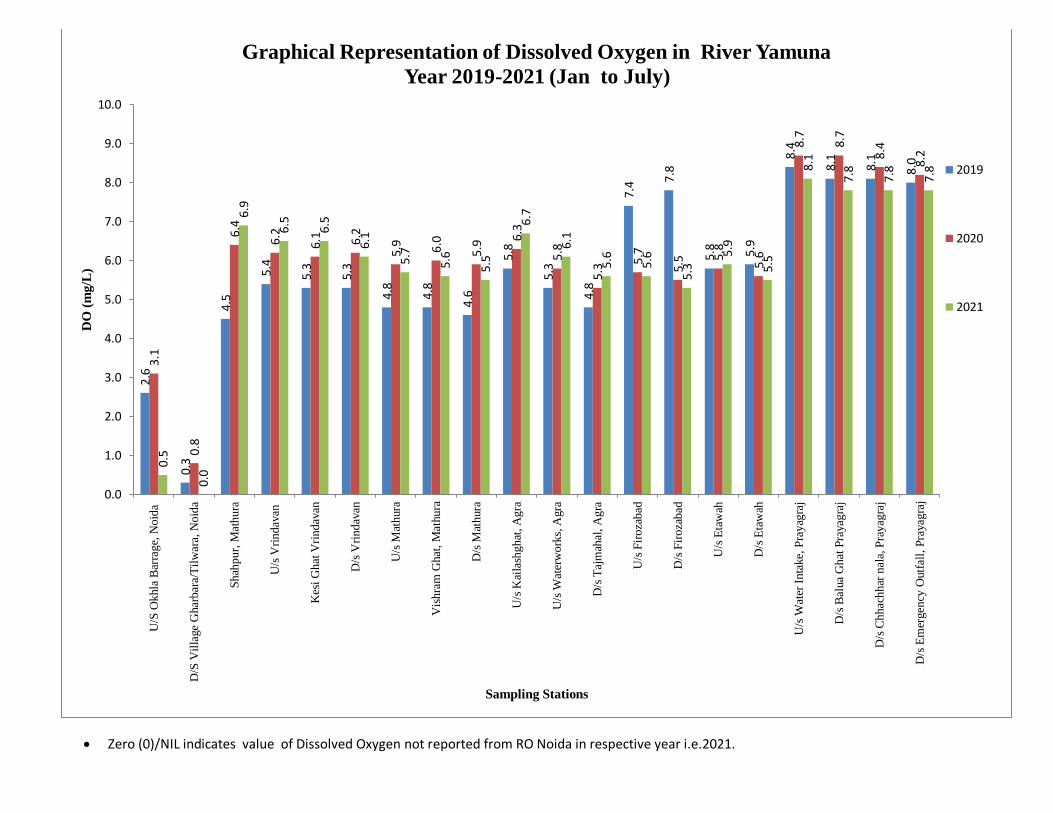
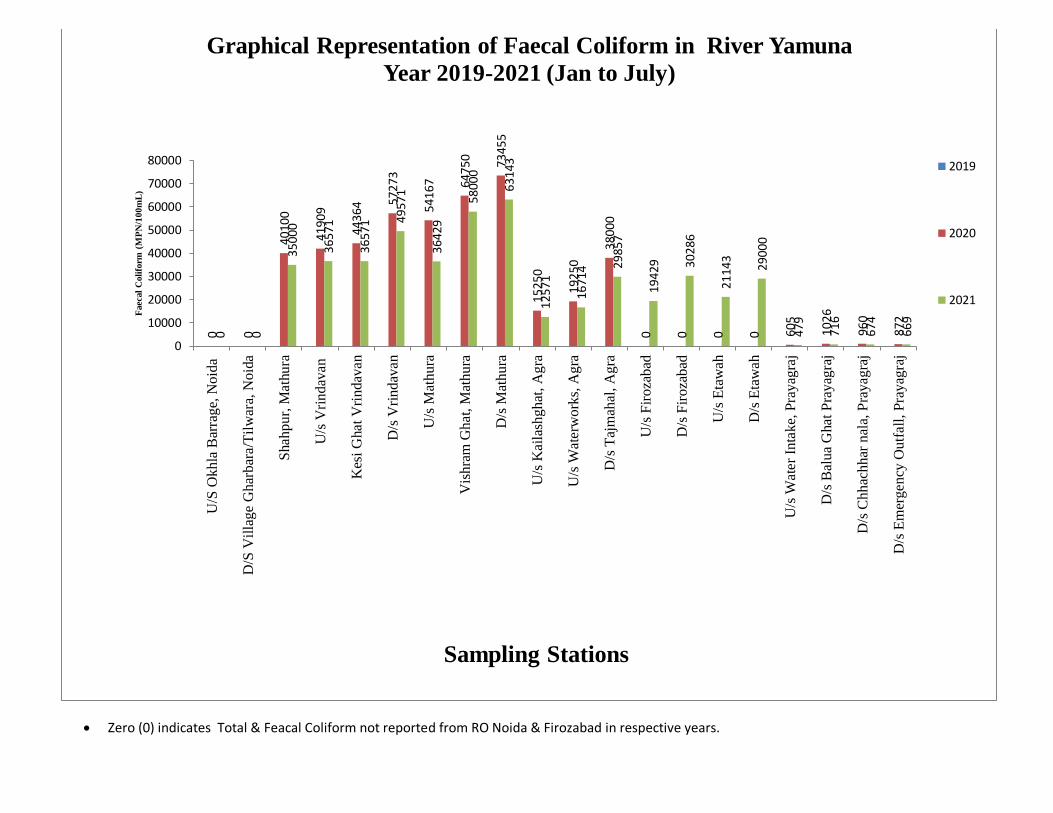
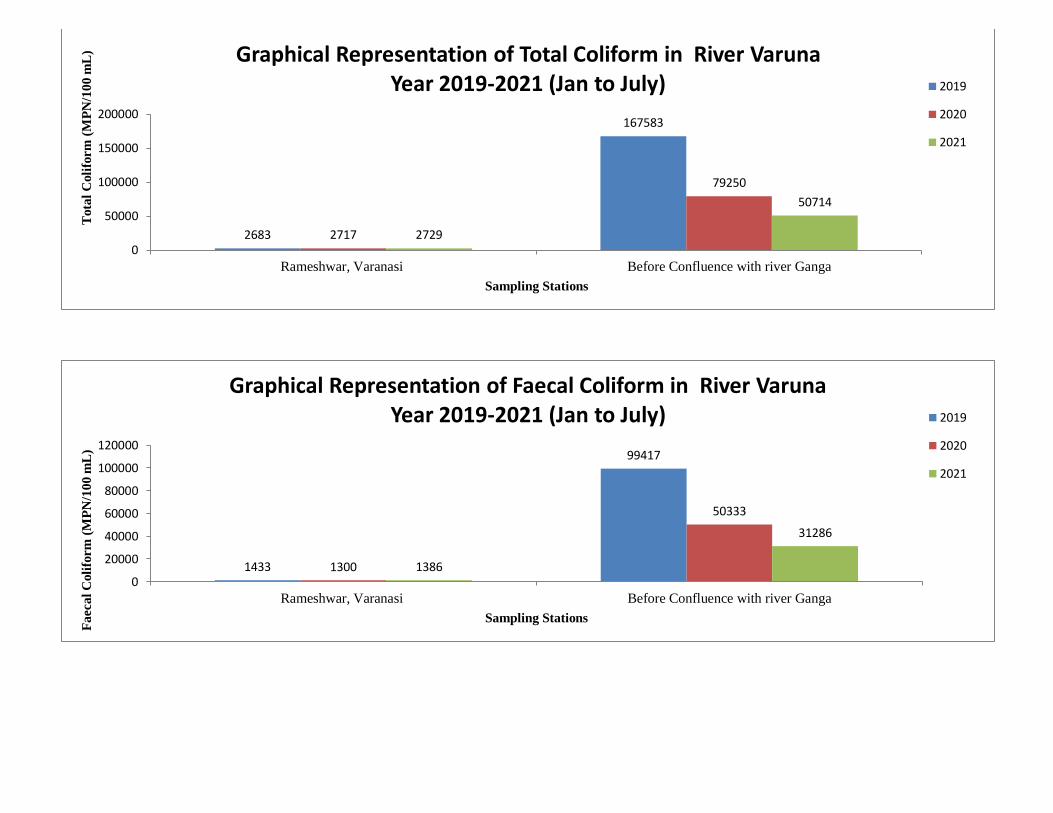
M. XIII. Latest water quality of polluted river, its tributaries, drains with flow
details and ground water quality in of polluted the catchment rivers:
Comparative Graphical presentation of water quality of Polluted Rivers (2019-
2021) in the State is enclosed herewith and marked as Annexure No.- III. Total
Coliform was found above the Acceptable limit (˂ 500 MPN/ 100 ml) for outdoor
bathing in all sampling locations of all the rivers. Maximum TC values was found
in Kali east River at sampling location of Babugarh (3300000 MPN/100 ml) and
27
27
minimum value of TC (600 MPN/100 ml) and BOD (1.6 mg/L) was reported in
Ramganga River at Agwanpur Village, Moradabad. Maximum BOD was found in
Hindon River. In river Ganga maximum TC value was reported at Downstream,
Kanpur.
XIV. Ground water regulation: Details submitted in Previous MPR (Dec. 2020 – Feb.
2021).
XV. Good irrigation practices being adopted by the State: Information not received
from Agriculture Department.
XVI. Rain Water Harvesting: Details submitted in Previous MPR (Dec. 2020 – Feb.
2021).
XVII. Demarcation of Floodplain and removal of illegal encroachments:
Details submitted in Previous MPR (Oct. – Nov. 2020).
XVIII. Maintaining minimum e-flow of river:
Details submitted in Previous MPR (Oct. – Nov. 2020).
XIX. Plantation activities along the rivers:
a). Across the State
22.59 Crore in 2019-20
25.87 Crore in 2020-21
XX. Development of Biodiversity Park: Status submitted in the MPR of Month June-
July 2020.
XXI. Reuse of Treated Water: At present nearly 410 MLD treated water is being used in
agriculture, rest is going for augmentation of river flow. Use of treated waste water
for any other purpose will require tertiary treatment and no STP in Uttar Pradesh as
on date has tertiary treatment facility. Central Public Health and Environmental
Engineering Organization (CPHEEO) manual permits the use of secondary treated
water only for non -edible crops. The use of treated water in agriculture is being
done at Jajmau, Prayagraj, Varanasi etc for non -edible crops.
28
28
XXII. Model River being adopted by the State & Action Proposed for achieving the
bathing quality standards:
XXIII. Status of Preparation of Action Plan by the 13 Coastal States: NA
XXIV. Regulation of Mining Activities in the State/UT: Details submitted in Previous
MPR (Dec. 2020 – Feb. 2021).
29
Status of Industries
Total Industries inspected (July 2020 to July 2021)
1464
Total Industries found Complying 856
Total Industries found Non-Complying (Show Cause issued) 296
Industries found Temporary closed 261
Industries found Permanently closed 51
Show cause for EC against 20 defaulter units Rs. 53.88 Lakhs
EC Imposed against 197 defaulter units Rs. 17.31 Cr
EC recovered from 94 Industries Rs. 3.60 Cr
Annexure - I

Scanned with CamScanner
Annexure- II
30
Scanned with CamScanner31
Scanned with CamScanner32
Scanned with CamScanner33

Scanned with CamScanner34
Annexure-II A
35
36
37

38
39
8.5
8.1
8.0
7.9
8.0
7.8
7.6
7.6
7.0
8.6
8.7
8.8
8.5
8.4
8.2
8.5
8.3
7.8
7.7
7.5 9.
2
9.39.7
9.3 9.9
9.7
9.6
9.3
8.4
8.2
8.1 8.
8
9.0
0.0
2.0
4.0
6.0
8.0
10.0
12.0
U/s
Kan
nau
j
D/s
Kan
nau
j
Bit
hoor,
Kan
pur
At
Bhai
rao G
hat
U/s
Kan
pur
At
D/s
Shukla
gan
j
At
Gola
Ghat
At
Jajm
au B
ridge
D/s
Kan
pur
Dal
mau
, R
aibar
eli
Kal
a K
ankar
, P
rata
pgar
h
DO
(m
g/L
)
Sampling Stations
Graphical Representation of Dissolved Oxygen in River Ganga
Year 2019-2021 (Jan to July)2019
2020
2021
8.4 8.
8
8.4
8.4
8.2
7.5 7.9 8.2
7.1
7.2 7.
98.9
9.1
8.6 9.
1
8.3
7.4 7.8 8.
6
7.7
7.6 8.
18.4 8.
9
8.4
8.3 8.7
7.8 8.
3 8.9
8.0
7.7 8.
5
0.01.02.03.04.05.06.07.08.09.0
10.0
Kad
a G
hat
U/s
Pra
yag
raj
D/s
Pra
yag
raj
A/c
Tam
sa r
iver
, S
irsa
,S
on B
arsa
U/s
Vin
dhyac
hal
,M
irza
pur
D/s
Mir
zapur
At
Chunnar
Ponto
on
Bri
dge
U/s
Var
anas
i
D/s
Var
anas
i
Tar
ighat
D/s
Ghaz
ipur
A/c
Go
mti
riv
er,
Bh
usa
ula
DO
(m
g/L
)
Sampling Stations
Graphical Representation of Dissolved Oxygen in River Ganga
Year 2019-2021 (Jan to July)
2019
2020
2021
Annexure-III
40
2.9 3.
3
3.1
3.1
3.1 3.
4 3.7 4.0 4.
4
3.7
3.6
2.4 2
.7 2.8 3.0
3.0 3.
2 3.7 3.9
3.9
3.8
3.8
2.7 3
.0 3.1
3.2
3.3 3.5 3.
7 4.0 4.
3
4.0
3.8
0.00.51.01.52.02.53.03.54.04.55.0
U/s
Kan
nau
j
D/s
Kan
nau
j
Bit
hoor,
Kan
pur
At
Bhai
rao G
hat
U/s
Kan
pur
At
D/s
Shukla
gan
j
At
Gola
Ghat
At
Jajm
au B
ridge
D/s
Kan
pur
Dal
mau
, R
aibar
eli
Kal
a K
ankar
,P
rata
pgar
h
BO
D (
mg
/L)
Sampling Stations
Graphical Representation of Biochemical Oxygen Demand in River Ganga
Year 2019-2021 (Jan to July)2019
2020
2021
3.1
2.8
2.8
2.6 2.
7
3.6
3.2
2.6
3.8
3.8
3.3
2.4
2.4
2.4
2.3 2
.6
3.7
3.3
2.6
3.8
3.8
3.2
2.6 2.
7
2.6
2.6
2.3
3.7
3.2
2.3
3.8 4.0
3.1
0.00.51.01.52.02.53.03.54.04.5
Kad
a G
hat
U/s
Pra
yag
raj
D/s
Pra
yag
raj
A/c
Tam
sa r
iver
, S
irsa
,S
on B
arsa
U/s
Vin
dhyac
hal
,M
irza
pur
D/s
Mir
zapur
At
Chunnar
Ponto
on
Bri
dge
U/s
Var
anas
i
D/s
Var
anas
i
Tar
ighat
D/s
Ghaz
ipur
A/c
Gom
ti r
iver
,B
husa
ula
BO
D (
mg/L
)
Sampling Stations
Graphical Representation of Biochemical Oxygen Demand in River Ganga
Year 2019-2021 (Jan to July)
2019
2020
2021
41
3817
4625
4100
4133
4442
5633
6266
2170
8
4225
0
3625
3575
3625
5325
4875 79
50
7900 12
875
1928
3
3591
7
4033
3
2773
2673
3180
3740
3480
4060
5200
6000 11
529
2000
0
2814
3
29
29
2857
05000
1000015000200002500030000350004000045000
U/s
Kan
nau
j
D/s
Kan
nau
j
Bit
hoor,
Kan
pur
At
Bhai
rao G
hat
U/s
Kan
pur
At
D/s
Shu
kla
gan
j
At
Gola
Ghat
At
Jajm
au B
ridge
D/s
Kan
pur
Dal
mau
, R
aibar
eli
Kal
a K
ankar
, P
rata
pgar
hTota
l C
oli
form
(M
PN
/100m
L)
Sampling Stations
Graphical Representation of Total Coliform in River Ganga
Year 2019-2021 (Jan to July)2019
2020
202120
333
1778
3
1845
0
1483
3
1933
1616
7
1125
0
1992
3275
0
2858
3
1350
0
30
36
3058
32
83
33
00
2358
2000
0
1433
3
2075
2141
7
2241
7
1271
7
2129
2300
2286
1429
1886
2114
3
1371
4
1429
1842
9
2100
0
1200
0
05000
100001500020000250003000035000
Kad
a G
hat
U/s
Pra
yag
raj
D/s
Pra
yag
raj
A/c
Tam
sa r
iver
, S
irsa
, S
on
Bar
sa
U/s
Vin
dhyac
hal
, M
irza
pur
D/s
Mir
zapur
At
Chun
nar
Ponto
on B
ridge
U/s
Var
anas
i
D/s
Var
anas
i
Tar
ighat
D/s
Ghaz
ipur
A/c
Gom
ti r
iver
, B
husa
ula
Tota
l C
oli
form
(M
PN
/100m
L)
Sampling Stations
Graphical Representation of Total Coliform in River Ganga
Year 2019-2021 (Jan to July)2019
2020
2021
42

2100
2717
2275
2367
2583
3533
3650
1107
5
2475
0
2933
2867
1633
2317
2142 39
33
3583 65
42 8317
1382
5
1850
8
1873
1818
1560
2140
1700
1920
2760
3060 60
57
1270
0
1340
0
1557
1500
0
5000
10000
15000
20000
25000
30000
U/s
Kan
nau
j
D/s
Kan
nau
j
Bit
hoor,
Kan
pur
At
Bhai
rao G
hat
U/s
Kan
pur
At
D/s
Shukla
gan
j
At
Gola
Ghat
At
Jajm
au B
ridge
D/s
Kan
pur
Dal
mau
, R
aibar
eli
Kal
a K
ankar
,P
rata
pgar
h
Faec
al C
oli
form
(M
PN
/100m
L)
Sampling Stations
Graphical Representation of Faecal Coliform in River Ganga
Year 2019-2021 (Jan to July)2019
2020
202110
225
87
42
9158
7075
933
9250
6417
983
1900
0
1300
0
7333
1464
1293
1397
1347
1217
1195
0
7442
1025
1253
3
1277
5
7258
1020
1103
10
39
819
1000
1185
7
8143
829
1114
3
12
28
6
70
00
02000400060008000
100001200014000160001800020000
Kad
a G
hat
U/s
Pra
yag
raj
D/s
Pra
yag
raj
A/c
Tam
sa r
iver
, S
irsa
, S
on
Bar
sa
U/s
Vin
dhyac
hal
, M
irza
pur
D/s
Mir
zapur
At
Chunnar
Po
nto
on B
ridge
U/s
Var
anas
i
D/s
Var
anas
i
Tar
ighat
D/s
Ghaz
ipur
A/c
Gom
ti r
iver
, B
husa
ula
Faec
al C
oli
form
(M
PN
/100m
L)
Sampling Stations
Graphical Representation of Faecal Coliform in River Ganga
Year 2019-2021 (Jan to July)
2019
2020
2021
43
Zero (0)/NIL indicates value of Dissolved Oxygen not reported from RO Noida in respective year i.e.2021.
2.6
0.3
4.5
5.4
5.3
5.3
4.8
4.8
4.6
5.8
5.3
4.8
7.4
7.8
5.8 5.9
8.4
8.1
8.1
8.0
3.1
0.8
6.4
6.2
6.1 6.2
5.9 6.0
5.9
6.3
5.8
5.3
5.7
5.5 5
.8
5.6
8.7
8.7
8.4
8.2
0.5
0.0
6.9
6.5
6.5
6.1
5.7
5.6
5.5
6.7
6.1
5.6
5.6
5.3
5.9
5.5
8.1
7.8
7.8
7.8
0.0
1.0
2.0
3.0
4.0
5.0
6.0
7.0
8.0
9.0
10.0
U/S
Okhla
Bar
rage,
Noid
a
D/S
Vil
lage
Ghar
bar
a/T
ilw
ara,
Noid
a
Shah
pur,
Mat
hura
U/s
Vri
ndav
an
Kes
i G
hat
Vri
ndav
an
D/s
Vri
ndav
an
U/s
Mat
hura
Vis
hra
m G
hat
, M
athura
D/s
Mat
hura
U/s
Kai
lash
ghat
, A
gra
U/s
Wat
erw
ork
s, A
gra
D/s
Taj
mah
al, A
gra
U/s
Fir
oza
bad
D/s
Fir
oza
bad
U/s
Eta
wah
D/s
Eta
wah
U/s
Wat
er I
nta
ke,
Pra
yag
raj
D/s
Bal
ua
Gh
at P
rayag
raj
D/s
Ch
hac
hh
ar n
ala,
Pra
yag
raj
D/s
Em
ergen
cy O
utf
all,
Pra
yag
raj
DO
(m
g/L
)
Sampling Stations
Graphical Representation of Dissolved Oxygen in River Yamuna
Year 2019-2021 (Jan to July)
2019
2020
2021
44

26
.9
50
.8
12.5
8.8
9.4
9.2
9.7 11
.0
10.9
11.3
12.7
14.5 16
.7 20
.3
14.1 16
.0
2.0
2.4
2.4
2.4
18.8
34
.8
7.5
8.1
8.1
8.3
8.3
8.9 9.0 11
.2
13.0
14.2
14.5
16.3
14.8
16.4
1.9
2.1
2.2
2.1
23.4
29.4
7.9
8.3
8.3
8.7 9.2
10.1
10.1
11.6 13
.5 15.5 1
9.1 21
.1
17
.5 20
.0
2.4
2.5
2.5
2.6
0.0
10.0
20.0
30.0
40.0
50.0
60.0
U/S
Ok
hla
Bar
rage
, No
ida
D/S
Vil
lage
Gh
arb
ara/
Til
war
a, N
oid
a
Shah
pu
r, M
ath
ura
U/s
Vri
nd
avan
Kes
i Gh
at V
rin
dav
an
D/s
Vri
nd
avan
U/s
Mat
hu
ra
Vis
hra
m G
hat
, Mat
hu
ra
D/s
Mat
hu
ra
U/s
Kai
lash
ghat
, Agr
a
U/s
Wat
erw
ork
s, A
gra
D/s
Taj
mah
al, A
gra
U/s
Fir
oza
bad
D/s
Fir
oza
ba
d
U/s
Eta
wah
D/s
Eta
wah
U/s
Wat
er I
nta
ke, P
raya
graj
D/s
Bal
ua
Gh
at P
raya
graj
D/s
Ch
hac
hh
ar n
ala,
Pra
yagr
aj
D/s
Em
erg
ency
Ou
tfal
l, P
raya
graj
BO
D (
mg
/L)
Sampling Stations
Graphical Representation of Biochemical Oxygen Demand in River Yamuna
Year 2019-2021 (Jan to July)
2019
2020
2021
45

Zero (0) indicates Total & Feacal Coliform not reported from RO Noida & Firozabad in respective years.
0 0
1034
17
8300
0
8091
7
7955
6
8000
0
8883
3
9800
0
3633
3 5466
7
1092
50
0 0 0 0
4708 11
042
87
83
8458
0 0
6072
7
6908
3
6800
0
7883
3
8150
0
9250
0 1070
00
3441
7
4516
7
8375
0
0 0 0 0 1792
2425
2342
2117
0 0
6371
4
7014
3
7014
3 8571
4
6900
0 9071
4
9828
6
29
71
4
3657
1
8800
0
3385
7
1051
43
3500
0
9714
3
1214
1457
1400
1400
0
20000
40000
60000
80000
100000
120000
U/S
Ok
hla
Bar
rage,
Noid
a
D/S
Vil
lag
e G
har
bar
a/T
ilw
ara,
Noid
a
Shah
pur,
Math
ura
U/s
Vri
ndav
an
Kes
i G
hat
Vri
ndav
an
D/s
Vri
ndav
an
U/s
Mat
hura
Vis
hra
m G
hat,
Mat
hura
D/s
Mat
hu
ra
U/s
Kai
lash
ghat
, A
gra
U/s
Wate
rwork
s, A
gra
D/s
Taj
mah
al, A
gra
U/s
Fir
oza
bad
D/s
Fir
oza
bad
U/s
Eta
wah
D/s
Eta
wah
U/s
Wate
r In
tak
e, P
ray
agra
j
D/s
Bal
ua
Ghat
Pra
yag
raj
D/s
Ch
hac
hh
ar n
ala,
Pra
yagra
j
D/s
Em
erg
en
cy O
utf
all
, P
rayag
raj
Tota
l C
oli
form
(M
PN
/10
0m
L)
Sampling Stations
Graphical Representation of Total Coliform in River Yamuna
Year 2019-2021 (Jan to July)
2019
2020
2021
46
Zero (0) indicates Total & Feacal Coliform not reported from RO Noida & Firozabad in respective years.
0 0
4010
0
4190
9
4436
4 5727
3
54
16
7 6475
0 7345
5
1525
0
1925
0
3800
0
0 0 0 0 605
10
26
960
872
0 0
3500
0
3657
1
3657
1 4957
1
3642
9
5800
0
6314
3
1257
1
1671
4 2985
7
1942
9 3028
6
2114
3
2900
0
479
716
674
669
0
10000
20000
30000
40000
50000
60000
70000
80000
U/S
Okhla
Bar
rage,
Noid
a
D/S
Vil
lag
e G
har
bar
a/T
ilw
ara,
Noid
a
Shahpur,
Math
ura
U/s
Vri
ndav
an
Kes
i G
hat
Vri
ndav
an
D/s
Vri
ndav
an
U/s
Mat
hura
Vis
hra
m G
hat,
Mat
hura
D/s
Mat
hura
U/s
Kai
lash
ghat
, A
gra
U/s
Wate
rwo
rks,
Ag
ra
D/s
Taj
mah
al, A
gra
U/s
Fir
oza
bad
D/s
Fir
oza
bad
U/s
Eta
wah
D/s
Eta
wah
U/s
Wate
r In
take,
Pra
yag
raj
D/s
Bal
ua
Ghat
Pra
yag
raj
D/s
Chhac
hh
ar n
ala,
Pra
yag
raj
D/s
Em
erg
en
cy O
utf
all
, P
rayag
raj
Faecal
Coli
form
(M
PN
/10
0m
L)
Sampling Stations
Graphical Representation of Faecal Coliform in River Yamuna
Year 2019-2021 (Jan to July)
2019
2020
2021
47

7.88
2.97
7.69
3.19
8.21
4.51
0.00
2.00
4.00
6.00
8.00
10.00
Rameshwar, Varanasi Before Confluence with river Ganga
DO
(m
g/L
)
Sampling Stations
Graphical Representation of Dissolved Oxygen in River Varuna Year 2019-2021 (Jan to July) 2019
2020
2021
3.23
22.22
3.25
12.26
3.20
10.9
0.00
5.00
10.00
15.00
20.00
25.00
Rameshwar, Varanasi Before Confluence with river Ganga
BO
D (
mg/L
)
Sampling Stations
Graphical Representation of Biochemical Oxygen Demand in River Varuna Year 2019-2021 (Jan to July) 2019
2020
2021
48
2683
167583
2717
79250
2729
50714
0
50000
100000
150000
200000
Rameshwar, Varanasi Before Confluence with river Ganga
Tota
l C
oli
form
(M
PN
/100 m
L)
Sampling Stations
Graphical Representation of Total Coliform in River Varuna Year 2019-2021 (Jan to July) 2019
2020
2021
1433
99417
1300
50333
1386
31286
0
20000
40000
60000
80000
100000
120000
Rameshwar, Varanasi Before Confluence with river Ganga
Faecal C
oli
form
(M
PN
/100 m
L)
Sampling Stations
Graphical Representation of Faecal Coliform in River Varuna Year 2019-2021 (Jan to July) 2019
2020
2021
49
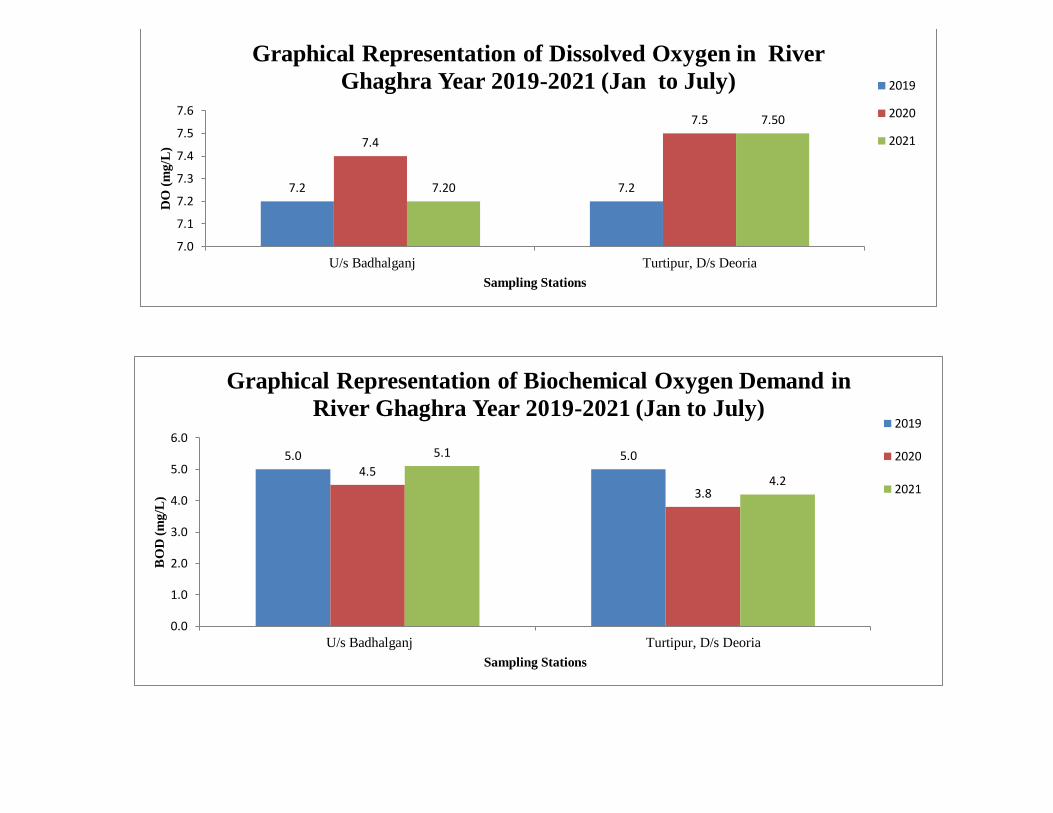
7.2 7.2
7.4
7.5
7.20
7.50
7.0
7.1
7.2
7.3
7.4
7.5
7.6
U/s Badhalganj Turtipur, D/s Deoria
DO
(m
g/L
)
Sampling Stations
Graphical Representation of Dissolved Oxygen in River
Ghaghra Year 2019-2021 (Jan to July) 2019
2020
2021
5.0 5.04.5
3.8
5.1
4.2
0.0
1.0
2.0
3.0
4.0
5.0
6.0
U/s Badhalganj Turtipur, D/s Deoria
BO
D (
mg/L
)
Sampling Stations
Graphical Representation of Biochemical Oxygen Demand in
River Ghaghra Year 2019-2021 (Jan to July)2019
2020
2021
50

20858 20333
41583
24667
48714
34000
0
10000
20000
30000
40000
50000
60000
U/s Badhalganj Turtipur, D/s DeoriaTota
l C
oli
form
(M
PN
/100 m
L)
Sampling Stations
Graphical Representation of Total Coliform in River Ghaghra
Year 2019-2021 (Jan to July) 2019
2020
2021
10558 9775
22667
17833
33571
24429
0
5000
10000
15000
20000
25000
30000
35000
40000
U/s Badhalganj Turtipur, D/s Deoria
Faec
al C
oli
form
(M
PN
/100 m
L)
Sampling Stations
Graphical Representation of Faecal Coliform in River Ghaghra
Year 2019-2021 (Jan to July) 2019
2020
2021
51
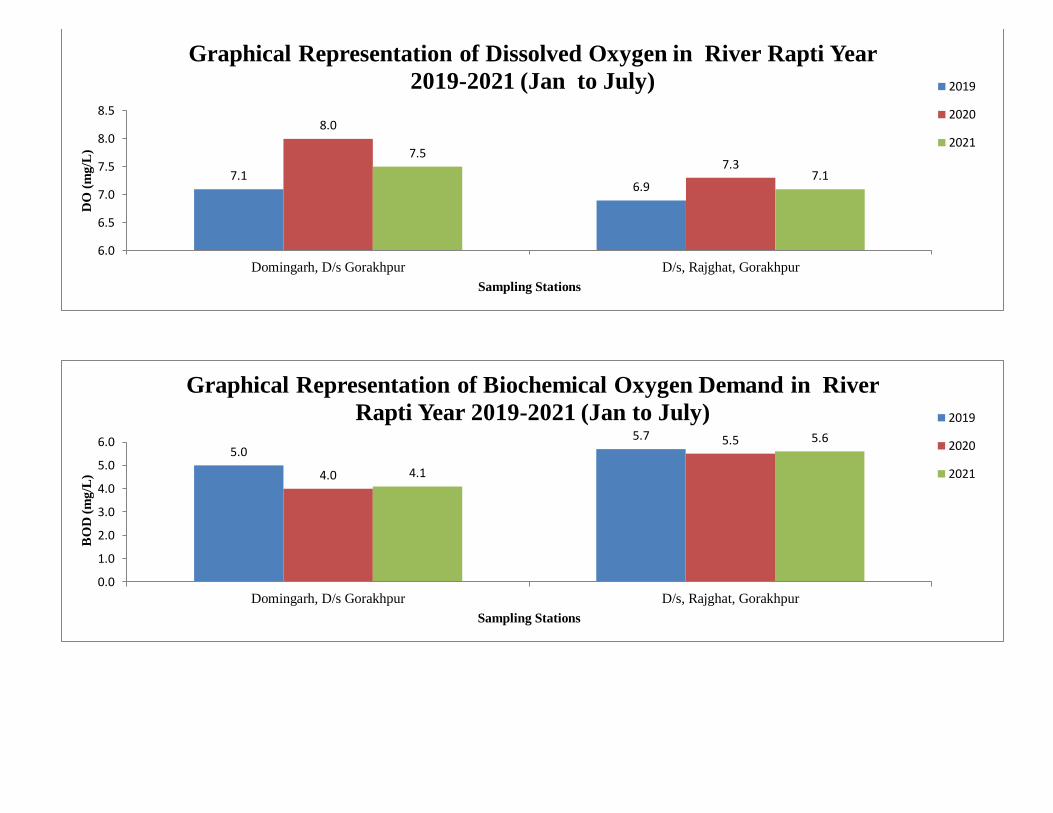
7.16.9
8.0
7.37.5
7.1
6.0
6.5
7.0
7.5
8.0
8.5
Domingarh, D/s Gorakhpur D/s, Rajghat, Gorakhpur
DO
(m
g/L
)
Sampling Stations
Graphical Representation of Dissolved Oxygen in River Rapti Year
2019-2021 (Jan to July) 2019
2020
2021
5.05.7
4.0
5.5
4.1
5.6
0.0
1.0
2.0
3.0
4.0
5.0
6.0
Domingarh, D/s Gorakhpur D/s, Rajghat, Gorakhpur
BO
D (
mg/L
)
Sampling Stations
Graphical Representation of Biochemical Oxygen Demand in River
Rapti Year 2019-2021 (Jan to July) 2019
2020
2021
52
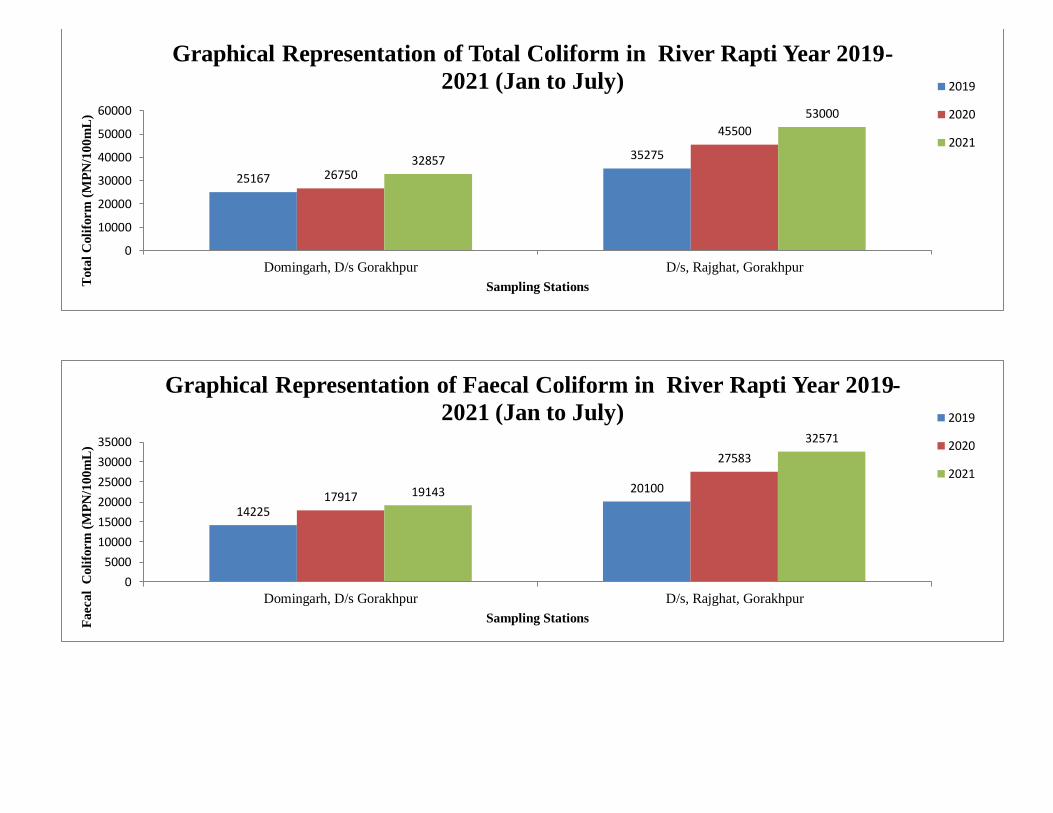
25167
35275
26750
45500
32857
53000
0
10000
20000
30000
40000
50000
60000
Domingarh, D/s Gorakhpur D/s, Rajghat, Gorakhpur
Tota
l C
oli
form
(M
PN
/10
0m
L)
Sampling Stations
Graphical Representation of Total Coliform in River Rapti Year 2019-
2021 (Jan to July) 2019
2020
2021
14225
2010017917
27583
19143
32571
0
5000
10000
15000
20000
25000
30000
35000
Domingarh, D/s Gorakhpur D/s, Rajghat, Gorakhpur
Faecal C
oli
form
(M
PN
/100m
L)
Sampling Stations
Graphical Representation of Faecal Coliform in River Rapti Year 2019-
2021 (Jan to July) 2019
2020
2021
53
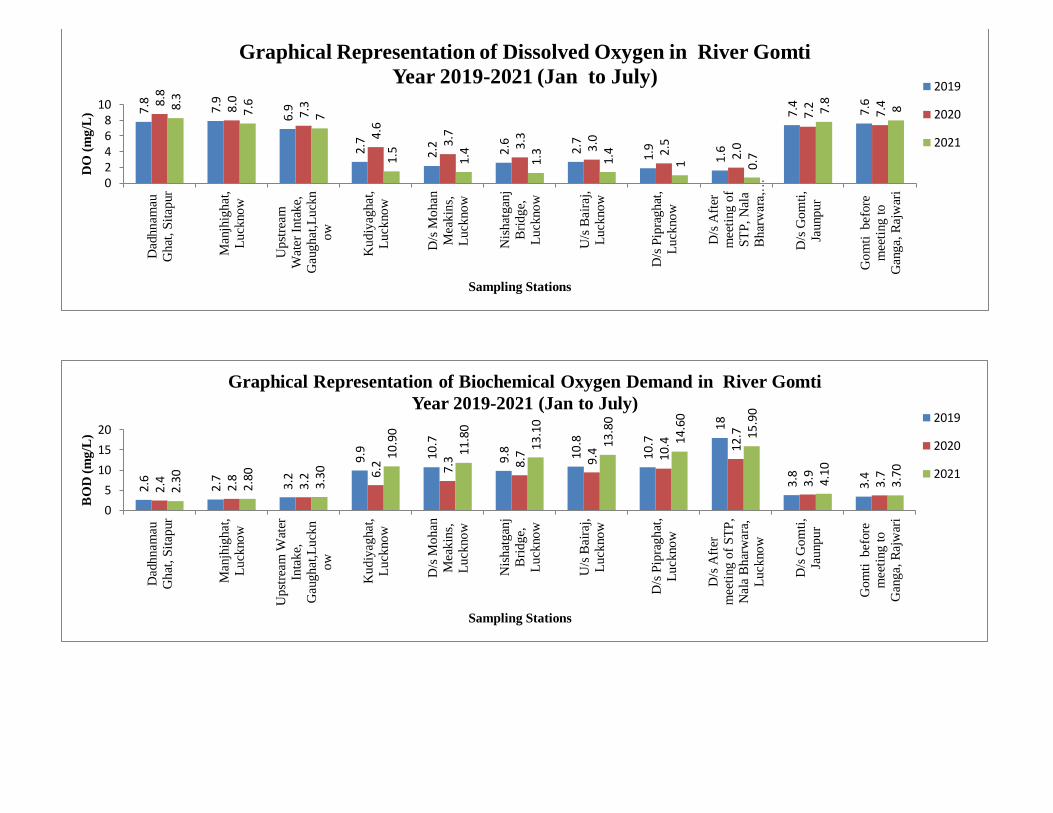
7.8
7.9
6.9
2.7
2.2
2.6 2.7
1.9
1.6
7.4
7.68.
8
8.0
7.3
4.6
3.7
3.3
3.0
2.5
2.0
7.2
7.48.
3
7.6
7
1.5
1.4
1.3 1.4
1 0.7
7.8
8
02468
10
Dad
hn
amau
Gh
at, S
itap
ur
Man
jhig
hat
,
Lu
ckno
w
Up
stre
am
Wat
er I
nta
ke,
Gau
gh
at,L
uck
n
ow
Ku
diy
ag
hat
,
Lu
ckno
w
D/s
Mo
han
Mea
kin
s,
Lu
ckno
w
Nis
hat
gan
j
Bri
dg
e,
Lu
ckno
w
U/s
Bair
aj,
Lu
ckno
w
D/s
Pip
rag
hat
,
Lu
ckno
w
D/s
Aft
er
mee
ting
of
ST
P, N
ala
Bharwara,…
D/s
Go
mti
,
Jau
np
ur
Go
mti
b
efore
mee
ting
to
Gan
ga,
Raj
war
i
DO
(m
g/L
)
Sampling Stations
Graphical Representation of Dissolved Oxygen in River Gomti
Year 2019-2021 (Jan to July)2019
2020
20212.
6
2.7
3.2
9.9
10.7
9.8 10
.8
10.7
18
3.8
3.4
2.4
2.8 3.2 6.
2 7.3 8.7
9.4 10
.4 12.7
3.9
3.7
2.30
2.80
3.30
10.9
0
11.8
0
13.1
0
13.8
0
14.6
0
15.9
0
4.10
3.70
0
5
10
15
20
Dad
hnam
au
Ghat
, S
itap
ur
Man
jhig
hat
,
Luck
now
Upst
ream
Wat
er
Inta
ke,
Gau
ghat
,Luck
n
ow
Kudiy
aghat
,
Luck
now
D/s
Moh
an
Mea
kin
s,
Luck
now
Nis
hat
gan
j
Bri
dge,
Luck
now
U/s
Bai
raj,
Luck
now
D/s
Pip
ragh
at,
Lu
ckno
w
D/s
Aft
er
mee
ting o
f S
TP
,
Nal
a B
har
war
a,
Luck
now
D/s
Gom
ti,
Jaunpur
Gom
ti bef
ore
mee
ting t
o
Gan
ga,
Raj
war
i
BO
D (
mg
/L)
Sampling Stations
Graphical Representation of Biochemical Oxygen Demand in River Gomti
Year 2019-2021 (Jan to July)2019
2020
2021
54
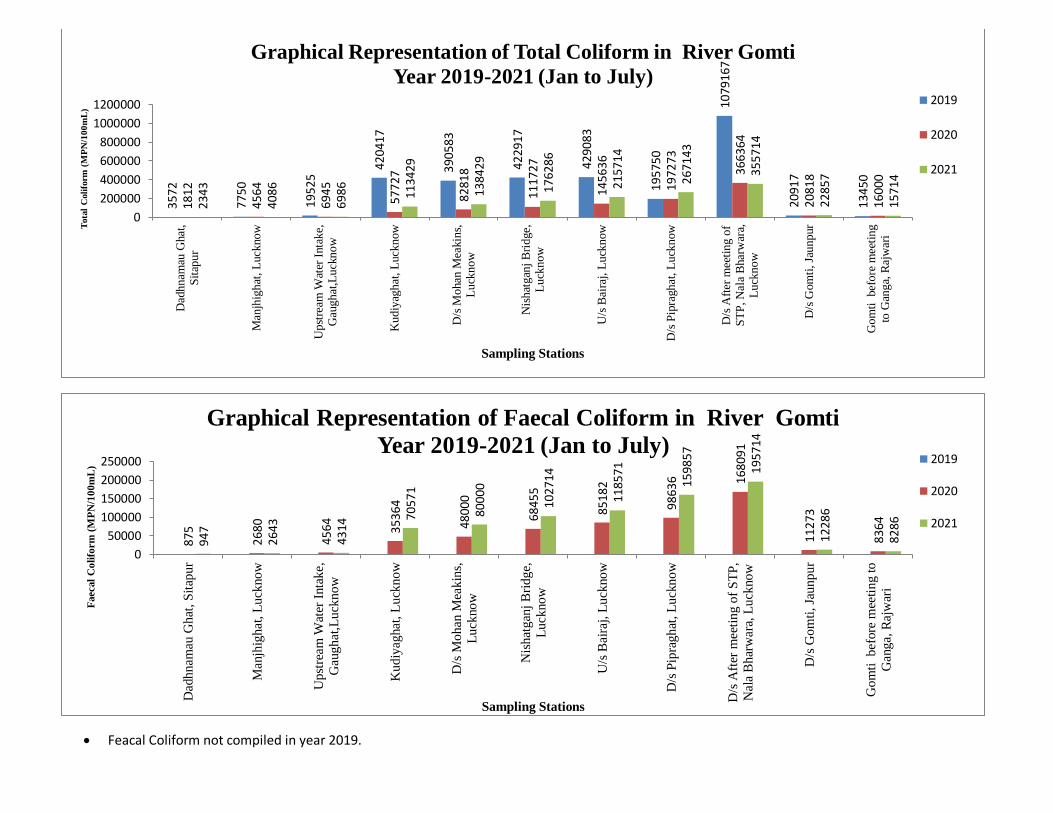
Feacal Coliform not compiled in year 2019.
3572
7750
1952
5
4204
17
3905
83
42
29
17
4290
83
1957
50
1079
167
2091
7
1345
0
1812
4564
6945
5772
7
8281
8
1117
27
1456
36
19
72
73
3663
64
2081
8
1600
0
2343
4086
6986 11
3429
1384
29
1762
86
2157
14
2671
43
3557
14
2285
7
1571
4
0
200000
400000
600000
800000
1000000
1200000
Dad
hnam
au G
hat
,S
itap
ur
Man
jhig
hat
, L
uck
now
Upst
ream
Wat
er I
nta
ke,
Gau
ghat
,Luck
now
Kudiy
aghat
, L
uck
now
D/s
Mohan
Mea
kin
s,L
uck
now
Nis
hat
gan
j B
ridge,
Luck
now
U/s
Bai
raj, L
uck
now
D/s
Pip
raghat
, L
uck
now
D/s
Aft
er m
eeti
ng o
fS
TP
, N
ala
Bhar
war
a,L
uck
now
D/s
Gom
ti, Ja
unpur
Gom
ti bef
ore
mee
ting
to G
anga,
Raj
war
i
Tota
l C
oli
form
(M
PN
/10
0m
L)
Sampling Stations
Graphical Representation of Total Coliform in River Gomti
Year 2019-2021 (Jan to July)2019
2020
2021
875
2680
4564 35
364
4800
0
6845
5
8518
2
9863
6 1680
91
1127
3
8364
947
2643
4314
7057
1
80
00
0
1027
14
1185
71
1598
57
1957
14
1228
6
8286
0
50000
100000
150000
200000
250000
Dad
hn
amau
Ghat
, S
itap
ur
Man
jhig
hat
, L
uck
now
Up
stre
am W
ater
Inta
ke,
Gau
gh
at,L
uck
now
Ku
diy
aghat
, L
uck
now
D/s
Mo
han
Mea
kin
s,
Luck
now
Nis
hat
gan
j B
ridge,
Luck
now
U/s
Bai
raj,
Luck
now
D/s
Pip
rag
hat
, L
uck
no
w
D/s
Aft
er m
eeti
ng o
f S
TP
,
Nal
a B
har
war
a, L
uck
now
D/s
Gom
ti, Ja
unpur
Go
mti
b
efore
mee
ting t
o
Gan
ga,
Raj
war
i
Faecal
Co
lifo
rm
(M
PN
/10
0m
L)
Sampling Stations
Graphical Representation of Faecal Coliform in River Gomti
Year 2019-2021 (Jan to July)2019
2020
2021
55

0.0
0.0
1.6
1.25
1.0
0.0
0.0
0.0 0.0
1.1
1.6
1.1
0.1
0.0
0.0
0.0
0.0
1.7
1.4
0.0
0.0
0.00.20.40.60.81.01.21.41.61.8
Hin
do
n D
/S M
ahes
hpu
r
Sah
aran
pur
Hin
do
n, S
ard
han
a -
Bu
dh
ana
Ro
ad, V
ill
Bap
arsi
, M
eeru
t
Hin
do
n, M
eeru
t B
agh
pat
Ro
ad, M
eeru
t
Hin
do
n, k
arh
eda
vil
lag
e ,
Gh
azia
bad
Hin
do
n, ri
ver
Mo
han
nag
ar R
oad
Bri
dg
e,
Gh
azia
bad
Hin
do
n, ri
ver
Ch
ijar
si
Bri
dg
e, G
haz
iab
ad
Hin
do
n, D
/S K
uls
era
Bri
dg
e, N
oid
a
DO
(m
g/L
)
Sampling Stations
Graphical Representation of Dissolved Oxygen in River Hindon
Year 2019-2021 (Jan to July) 2019
2020
2021
44.6
69
.9
42.3
21.3 29
.7
54.1
56.9
44.5 59
.5
42.0
17.
2
21.4 3
4.9
38.
3
43.0
0 63.1
45.7
19.
6
23.
4 41.2 52
.0
0.010.020.030.040.050.060.070.080.0
Hin
do
n D
/S M
ahes
hpur
Sah
aran
pur
Hin
do
n, S
ardhan
a -
Budh
ana
Ro
ad, V
ill
Bap
arsi
, M
eeru
t
Hin
do
n, M
eeru
t B
aghpat
Ro
ad, M
eeru
t
Hin
do
n, k
arhed
a vil
lage
,
Gh
azia
bad
Hin
do
n, ri
ver
Mohan
nag
ar R
oad
Bri
dge,
Ghaz
iabad
Hin
do
n, ri
ver
Chij
arsi
Bri
dg
e, G
haz
iabad
Hin
do
n,
D/S
Kuls
era
Bri
dg
e, N
oid
a
BO
D (
mg
/L)
Sampling Stations
Graphical Representation of Biochemical Oxygen Demand in River
Hindon Year 2019-2021 (Jan to July)2019
2020
2021
56
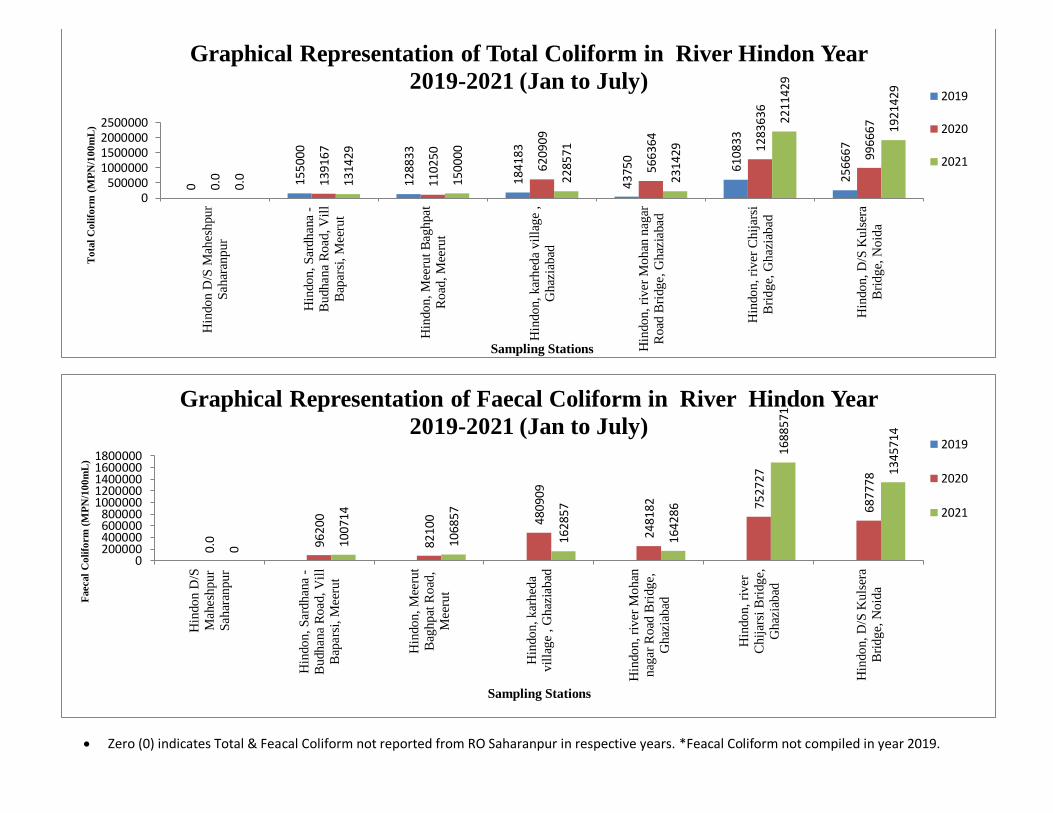
Zero (0) indicates Total & Feacal Coliform not reported from RO Saharanpur in respective years. *Feacal Coliform not compiled in year 2019.
0 1550
00
1288
33
18
41
83
4375
0
6108
33
2566
67
0.0 13
9167
1102
50
6209
09
5663
64 1283
636
9966
67
0.0 13
1429
1500
00
2285
71
2314
29
2211
429
1921
429
0500000
1000000150000020000002500000
Hin
do
n D
/S M
ahes
hpu
r
Sah
aran
pur
Hin
do
n, S
ard
han
a -
Bu
dh
ana
Ro
ad, V
ill
Bap
arsi
, M
eeru
t
Hin
do
n, M
eeru
t B
agh
pat
Road
, M
eeru
t
Hin
do
n, k
arh
eda
vil
lag
e ,
Gh
azia
bad
Hin
do
n, ri
ver
Mo
han
nag
ar
Road
Bri
dg
e, G
haz
iabad
Hin
do
n, ri
ver
Ch
ijar
si
Bri
dg
e, G
haz
iab
ad
Hin
do
n, D
/S K
uls
era
Bri
dg
e, N
oid
a
To
tal
Co
lifo
rm
(M
PN
/10
0m
L)
Sampling Stations
Graphical Representation of Total Coliform in River Hindon Year
2019-2021 (Jan to July)2019
2020
2021
0.0 96
20
0
8210
0 4809
09
2481
82 7527
27
6877
78
0 1007
14
1068
57
1628
57
1642
86
16
88
57
1
1345
714
0200000400000600000800000
10000001200000140000016000001800000
Hin
do
n D
/S
Mah
eshpur
Sah
aran
pur
Hin
don, S
ardhan
a -
Bu
dh
ana
Road
, V
ill
Bap
ars
i, M
eeru
t
Hin
don, M
eeru
t
Bag
hpat
Road
,
Mee
rut
Hin
don, kar
hed
a
vil
lag
e , G
haz
iabad
Hin
do
n, ri
ver
Mo
han
nag
ar R
oad
Bri
dge,
Ghaz
iabad
Hin
don, ri
ver
Ch
ijar
si B
ridge,
Ghaz
iabad
Hin
do
n, D
/S K
uls
era
Bri
dge,
Noid
a
Faecal
Co
lifo
rm
(M
PN
/10
0m
L)
Sampling Stations
Graphical Representation of Faecal Coliform in River Hindon Year
2019-2021 (Jan to July)2019
2020
2021
57
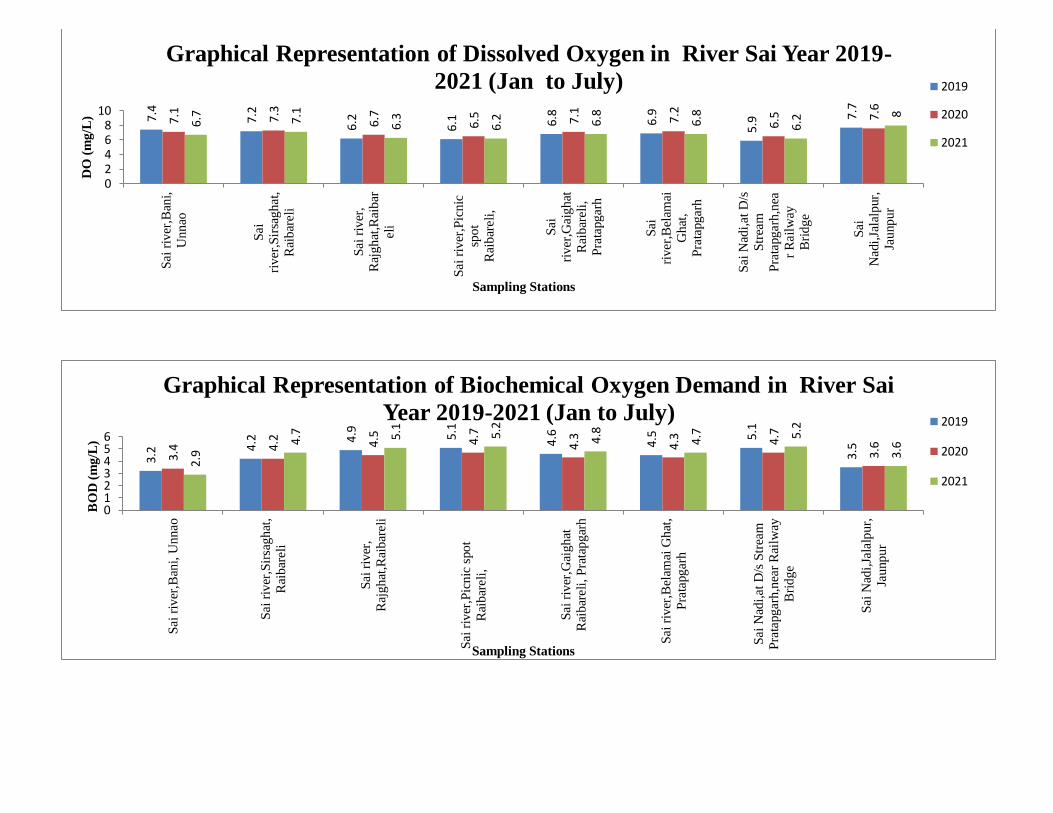
7.4
7.2
6.2
6.1 6.8
6.9
5.9 7.
7
7.1
7.3
6.7
6.5 7.1
7.2
6.5 7.
6
6.7
7.1
6.3
6.2 6.8
6.8
6.2 8
02468
10
Sai
riv
er,B
ani,
Un
nao
Sai
riv
er,S
irsa
gh
at,
Rai
bar
eli
Sai
riv
er,
Raj
gh
at,R
aib
ar
eli
Sai
riv
er,P
icn
ic
spo
t
Rai
bar
eli,
Sai
riv
er,G
aig
hat
Rai
bar
eli,
Pra
tapg
arh
Sai
riv
er,B
elam
ai
Gh
at,
Pra
tapg
arh
Sai
Nad
i,at
D/s
Str
eam
Pra
tapg
arh
,nea
r R
ail
way
Bri
dg
e
Sai
Nad
i,Ja
lalp
ur,
Jau
np
ur
DO
(m
g/L
)
Sampling Stations
Graphical Representation of Dissolved Oxygen in River Sai Year 2019-
2021 (Jan to July) 2019
2020
20213.
2 4.2 4.
9
5.1
4.6
4.5 5.
1
3.5
3.4 4.
2 4.5
4.7
4.3
4.3 4.7
3.6
2.9
4.7 5.1
5.2
4.8
4.7 5.
2
3.6
0123456
Sai
riv
er,B
ani,
Unnao
Sai
riv
er,S
irsa
ghat
,
Rai
bar
eli
Sai
riv
er,
Raj
ghat
,Rai
bar
eli
Sai
riv
er,P
icnic
spot
Rai
bar
eli,
Sai
riv
er,G
aighat
Rai
bar
eli,
Pra
tap
gar
h
Sai
riv
er,B
elam
ai G
hat
,
Pra
tapgar
h
Sai
Nad
i,at
D/s
Str
eam
Pra
tapgar
h,n
ear
Rai
lway
Bri
dge
Sai
Nad
i,Ja
lalp
ur,
Jaunpur
BO
D (
mg
/L)
Sampling Stations
Graphical Representation of Biochemical Oxygen Demand in River Sai
Year 2019-2021 (Jan to July) 2019
2020
2021
58
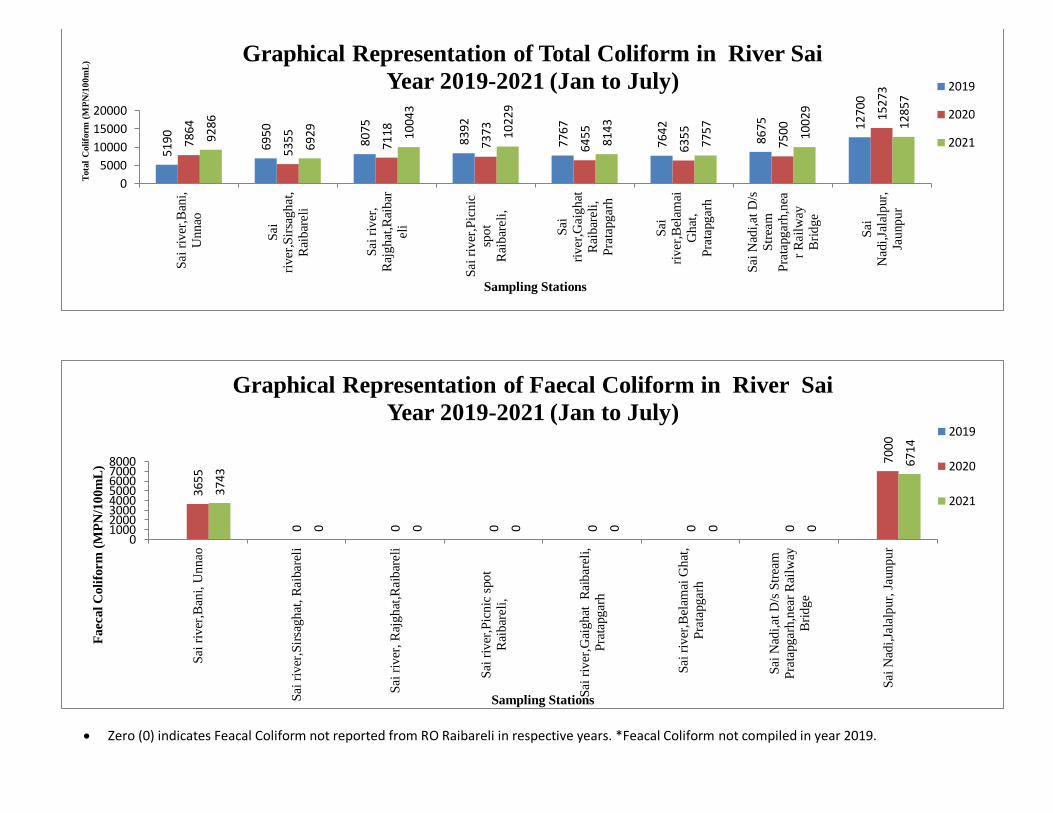
Zero (0) indicates Feacal Coliform not reported from RO Raibareli in respective years. *Feacal Coliform not compiled in year 2019.
5190
6950
8075
8392
7767
7642
8675 12
700
78
64
5355
7118
7373
6455
6355
7500
1527
3
9286
6929 10
043
10
22
9
8143
7757 10
029
1285
7
0
5000
10000
15000
20000
Sai
riv
er,B
ani,
Un
nao
Sai
riv
er,S
irsa
gh
at,
Rai
bar
eli
Sai
riv
er,
Raj
gh
at,R
aib
ar
eli
Sai
riv
er,P
icn
ic
spo
t
Rai
bar
eli,
Sai
riv
er,G
aig
hat
Rai
bar
eli,
Pra
tapg
arh
Sai
riv
er,B
elam
ai
Gh
at,
Pra
tapg
arh
Sai
Nad
i,at
D/s
Str
eam
Pra
tapg
arh
,nea
r R
ail
way
Bri
dg
e
Sai
Nad
i,Ja
lalp
ur,
Jau
np
ur
Tota
l C
oli
form
(M
PN
/10
0m
L)
Sampling Stations
Graphical Representation of Total Coliform in River Sai
Year 2019-2021 (Jan to July) 2019
2020
2021
3655
0 0 0 0 0 0
7000
3743
0 0 0 0 0 0
6714
010002000300040005000600070008000
Sai
riv
er,B
ani,
Unnao
Sai
riv
er,S
irsa
ghat
, R
aibar
eli
Sai
riv
er, R
ajg
hat
,Rai
bar
eli
Sai
riv
er,P
icnic
spot
Rai
bar
eli,
Sai
riv
er,G
aighat
R
aibar
eli,
Pra
tapg
arh
Sai
riv
er,B
elam
ai G
hat
,
Pra
tapgarh
Sai
Nad
i,at
D/s
Str
eam
Pra
tapg
arh,n
ear
Rai
lway
Bri
dg
e
Sai
Nad
i,Ja
lalp
ur,
Jau
npur
Faecal C
oli
form
(M
PN
/100m
L)
Sampling Stations
Graphical Representation of Faecal Coliform in River Sai
Year 2019-2021 (Jan to July)2019
2020
2021
59
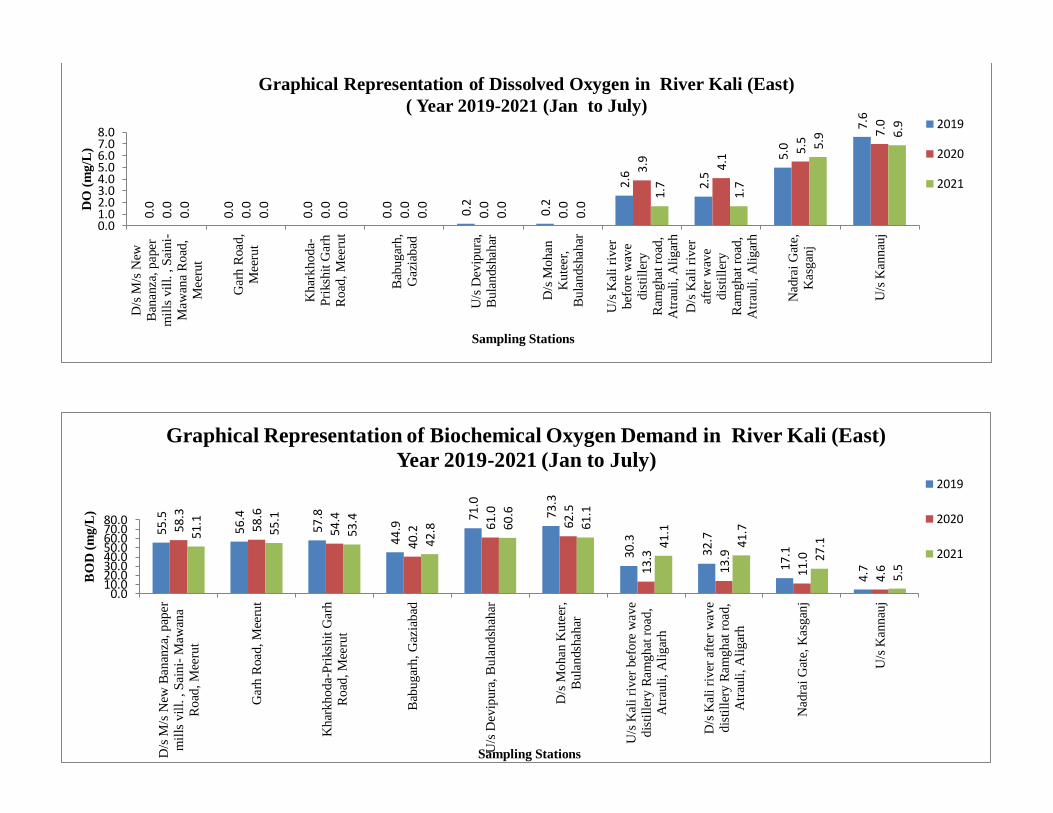
0.0
0.0
0.0
0.0 0.2
0.2
2.6
2.5
5.0
7.6
0.0
0.0
0.0
0.0
0.0
0.0
3.9 4.1 5
.5
7.0
0.0
0.0
0.0
0.0
0.0
0.0
1.7
1.7
5.9 6
.9
0.01.02.03.04.05.06.07.08.0
D/s
M/s
New
Ban
anza
, p
aper
mil
ls v
ill.
, S
ain
i-
Maw
ana
Ro
ad,
Mee
rut
Gar
h R
oad
,
Mee
rut
Kh
ark
ho
da-
Pri
ksh
it G
arh
Road
, M
eeru
t
Bab
ug
arh
,
Gaz
iab
ad
U/s
Dev
ipu
ra,
Bu
lan
dsh
ahar
D/s
Mo
han
Ku
teer
,
Bu
lan
dsh
ahar
U/s
Kal
i ri
ver
bef
ore
wav
e
dis
till
ery
Ram
ghat
ro
ad,
Atr
auli
, A
lig
arh
D/s
Kal
i ri
ver
afte
r w
ave
dis
till
ery
Ram
ghat
ro
ad,
Atr
auli
, A
lig
arh
Nad
rai
Gat
e,
Kas
gan
j
U/s
Kan
nau
j
DO
(m
g/L
)
Sampling Stations
Graphical Representation of Dissolved Oxygen in River Kali (East)
( Year 2019-2021 (Jan to July)2019
2020
2021
55.5
56
.4
57.8
44.9
71.0
73.
3
30.3
32.7
17.1
4.7
58
.3
58.6
54.
4
40.
2 61.0
62.5
13.
3
13.
9
11.0
4.6
51.
1
55.1
53.4
42.8 60
.6
61
.1
41.1
41.7
27.1
5.5
0.010.020.030.040.050.060.070.080.0
D/s
M/s
New
Ban
anza
, pap
er
mil
ls v
ill.
, S
ain
i- M
awan
a
Ro
ad, M
eeru
t
Gar
h R
oad
, M
eeru
t
Kh
ark
ho
da-
Pri
ksh
it G
arh
Road
, M
eeru
t
Bab
ug
arh
, G
azia
bad
U/s
Dev
ipu
ra, B
ula
ndsh
ahar
D/s
Mo
han
Ku
teer
,
Bu
lan
dsh
ahar
U/s
Kal
i ri
ver
bef
ore
wav
e
dis
till
ery
Ram
gh
at r
oad
,
Atr
auli
, A
lig
arh
D/s
Kal
i ri
ver
aft
er w
ave
dis
till
ery
Ram
gh
at r
oad
,
Atr
auli
, A
lig
arh
Nad
rai
Gat
e, K
asg
anj
U/s
Kan
nau
j
BO
D (
mg
/L)
Sampling Stations
Graphical Representation of Biochemical Oxygen Demand in River Kali (East)
Year 2019-2021 (Jan to July)2019
2020
2021
60

1110
83
1245
00
1483
33
4116
667
1825
00
5431
67
0 0 0 8792
8841
7
1250
83
1683
33
4690
909
1700
00
6700
0
0 0 0 1670
0
1128
57
1371
43
1557
14
3742
857
0 0.0
0.0 0.0
0.0 28
286
010000002000000300000040000005000000
D/s
M/s
New
Ban
anza
,
pap
er m
ills
vil
l. , S
ain
i-
Maw
ana
Ro
ad, M
eeru
t
Gar
h R
oad
, M
eeru
t
Kh
ark
ho
da-
Pri
ksh
it
Gar
h R
oad
, M
eeru
t
Bab
ug
arh
, G
azia
bad
U/s
Dev
ipu
ra,
Bu
lan
dsh
ahar
D/s
Mo
han
Ku
teer
,
Bu
lan
dsh
ahar
U/s
Kal
i ri
ver
bef
ore
wav
e d
isti
ller
y R
amgh
at
road
, A
trau
li,
Ali
gar
h
D/s
Kal
i ri
ver
aft
er w
ave
dis
till
ery
Ram
gh
at r
oad
,
Atr
auli
, A
lig
arh
Nad
rai
Gat
e, K
asg
anj
U/s
Kan
nau
j
To
tal
Co
lifo
rm
(M
PN
/10
0m
L)
Sampling Stations
Graphical Representation of Total Coliform in River Kali (East)
Year 2019-2021 (Jan to July)
2019
2020
202169
222
8811
1
1242
22
3536
364
1350
00
6050
0
0 0 0 6120
9371
4
1105
71
1228
57
2585
714
0 0.0
0.0
0.0
0.0
16
57
1
0500000
1000000150000020000002500000300000035000004000000
D/s
M/s
New
Ban
anza
,
pap
er m
ills
vil
l. , S
aini-
Maw
ana
Ro
ad, M
eeru
t
Gar
h R
oad
, M
eeru
t
Kh
ark
ho
da-
Pri
ksh
it G
arh
Road
, M
eeru
t
Bab
ug
arh
, G
azia
bad
U/s
Dev
ipu
ra, B
ula
ndsh
ahar
D/s
Mo
han
Kute
er,
Bu
lan
dsh
ahar
U/s
Kal
i ri
ver
bef
ore
wav
e
dis
till
ery
Ram
gh
at r
oad
,
Atr
auli
, A
lig
arh
D/s
Kal
i ri
ver
aft
er w
ave
dis
till
ery
Ram
gh
at r
oad
,
Atr
auli
, A
ligar
h
Nad
rai
Gat
e, K
asgan
j
U/s
Kan
nau
j
Faecal
Co
lifo
rm
(M
PN
/10
0m
L)
Sampling Stations
Graphical Representation of Faecal Coliform in River Kali (East)
Year 2019-2021 (Jan to July)2019
2020
2021
61
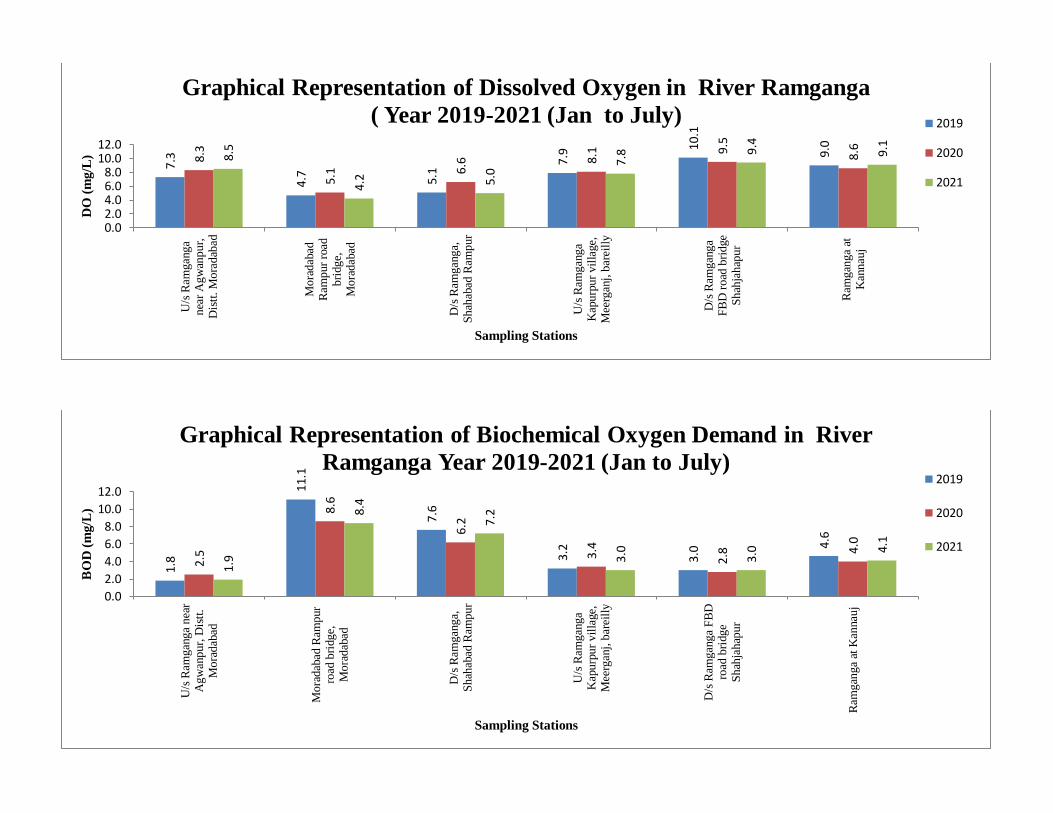
7.3
4.7 5.1
7.9
10
.1
9.0
8.3
5.1 6.
6 8.1 9
.5
8.6
8.5
4.2 5.0
7.8 9
.4
9.1
0.02.04.06.08.0
10.012.0
U/s
Ram
gan
ga
nea
r A
gw
anpur,
Dis
tt.
Mora
dab
ad
Mora
dab
adR
ampur
road
bri
dge,
Mora
dab
ad
D/s
Ram
gan
ga,
Shah
abad
Ram
pur
U/s
Ram
gan
ga
Kap
urp
ur
vil
lage,
Mee
rgan
j, b
arei
lly
D/s
Ram
gan
ga
FB
D r
oad
bri
dge
Shah
jahap
ur
Ram
gan
ga
atK
annau
j
DO
(m
g/L
)
Sampling Stations
Graphical Representation of Dissolved Oxygen in River Ramganga
( Year 2019-2021 (Jan to July) 2019
2020
20211.
8
11.
1
7.6
3.2
3.0
4.6
2.5
8.6
6.2
3.4
2.8 4.
0
1.9
8.4
7.2
3.0 3.0 4.
1
0.0
2.0
4.0
6.0
8.0
10.0
12.0
U/s
Ram
gan
ga
nea
rA
gw
anpur,
Dis
tt.
Mora
dab
ad
Mora
dab
ad R
ampur
road
bri
dge,
Mora
dab
ad
D/s
Ram
gan
ga,
Shah
abad
Ram
pur
U/s
Ram
gan
ga
Kap
urp
ur
vil
lage,
Mee
rgan
j, b
arei
lly
D/s
Ram
gan
ga
FB
Dro
ad b
ridg
eS
hah
jahap
ur
Ram
gan
ga
at K
annau
j
BO
D (
mg/L
)
Sampling Stations
Graphical Representation of Biochemical Oxygen Demand in River
Ramganga Year 2019-2021 (Jan to July)2019
2020
2021
62
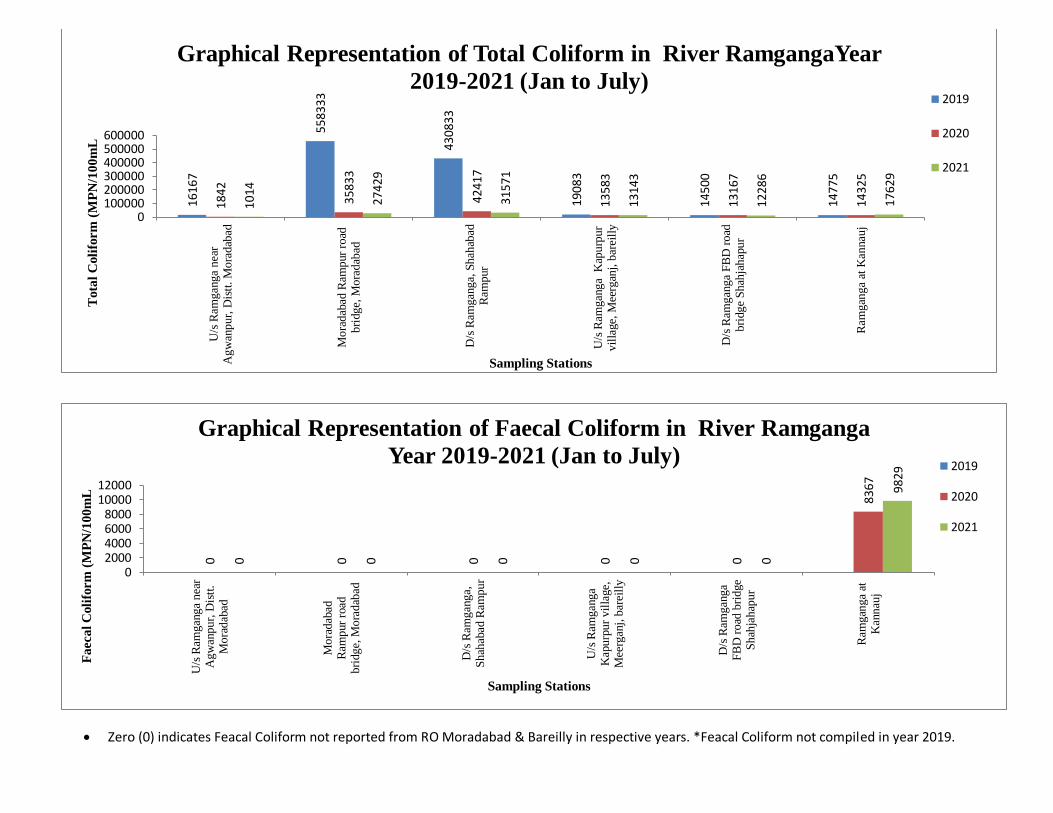
Zero (0) indicates Feacal Coliform not reported from RO Moradabad & Bareilly in respective years. *Feacal Coliform not compiled in year 2019.
1616
7
5583
33
4308
33
1908
3
1450
0
1477
5
1842
3583
3
4241
7
1358
3
1316
7
1432
5
1014
2742
9
3157
1
1314
3
1228
6
17
62
9
0100000200000300000400000500000600000
U/s
Ram
gan
ga
nea
rA
gw
anpur,
Dis
tt. M
ora
dab
ad
Mora
dab
ad R
ampur
road
bri
dge,
Mora
dab
ad
D/s
Ram
gan
ga,
Shah
abad
Ram
pur
U/s
Ram
gan
ga
Kap
urp
ur
vil
lage,
Mee
rgan
j, b
arei
lly
D/s
Ram
gan
ga
FB
D r
oad
bri
dge
Shah
jahap
ur
Ram
gan
ga
at K
annau
j
Tota
l C
oli
form
(M
PN
/10
0m
L
Sampling Stations
Graphical Representation of Total Coliform in River RamgangaYear
2019-2021 (Jan to July)2019
2020
2021
0 0 0 0 0
8367
0 0 0 0 0
9829
02000400060008000
1000012000
U/s
Ram
gan
ga
nea
rA
gw
anpur,
Dis
tt.
Mora
dab
ad
Mo
radab
adR
ampur
road
bri
dge,
Mora
dab
ad
D/s
Ram
gan
ga,
Shah
abad
Ram
pur
U/s
Ram
gan
ga
Kap
urp
ur
vil
lage,
Mee
rgan
j, b
arei
lly
D/s
Ram
gan
ga
FB
D r
oad
bri
dge
Shah
jahap
ur
Ram
gan
ga
atK
annau
j
Fa
ecal C
oli
form
(M
PN
/100m
L
Sampling Stations
Graphical Representation of Faecal Coliform in River Ramganga
Year 2019-2021 (Jan to July)2019
2020
2021
63
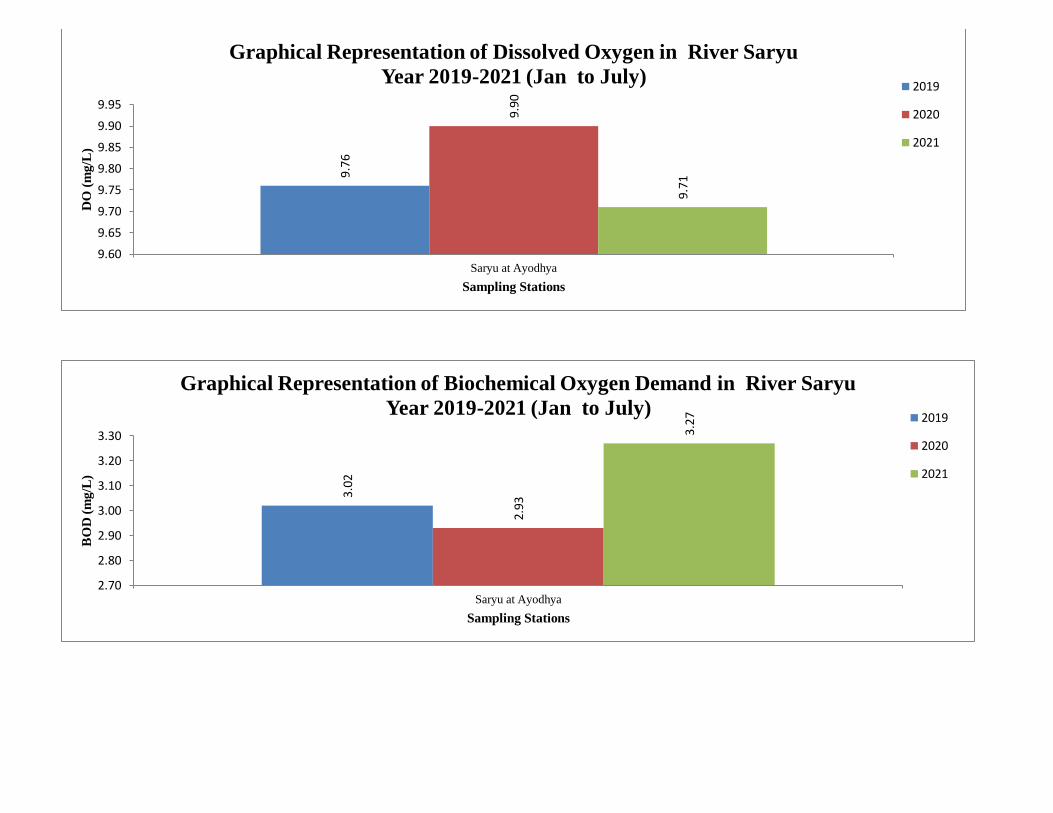
9.7
6
9.90
9.7
1
9.60
9.65
9.70
9.75
9.80
9.85
9.90
9.95
Saryu at Ayodhya
DO
(m
g/L
)
Sampling Stations
Graphical Representation of Dissolved Oxygen in River Saryu
Year 2019-2021 (Jan to July)2019
2020
2021
3.0
2
2.9
3
3.27
2.70
2.80
2.90
3.00
3.10
3.20
3.30
Saryu at Ayodhya
BO
D (
mg/L
)
Sampling Stations
Graphical Representation of Biochemical Oxygen Demand in River Saryu
Year 2019-2021 (Jan to July)2019
2020
2021
64
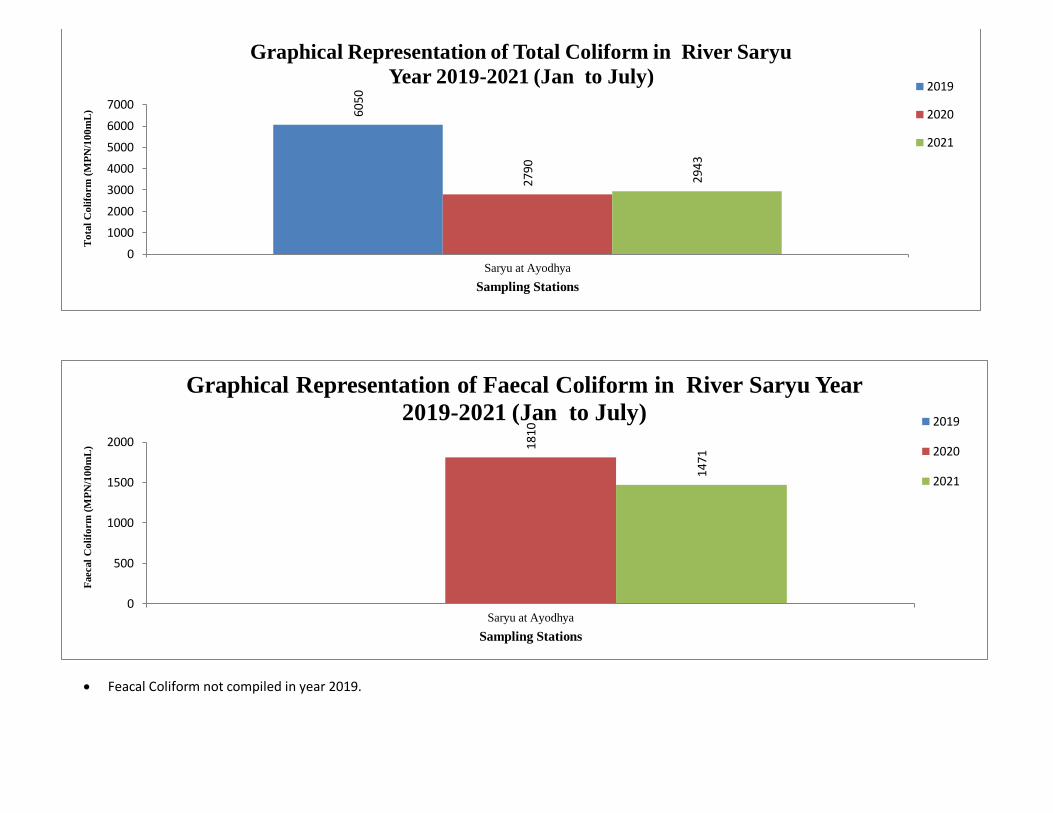
Feacal Coliform not compiled in year 2019.
6050
2790
2943
0
1000
2000
3000
4000
5000
6000
7000
Saryu at Ayodhya
To
tal
Co
lifo
rm
(M
PN
/10
0m
L)
Sampling Stations
Graphical Representation of Total Coliform in River Saryu
Year 2019-2021 (Jan to July)2019
2020
2021
1810
1471
0
500
1000
1500
2000
Saryu at Ayodhya
Faecal
Co
lifo
rm
(M
PN
/10
0m
L)
Sampling Stations
Graphical Representation of Faecal Coliform in River Saryu Year
2019-2021 (Jan to July) 2019
2020
2021
65
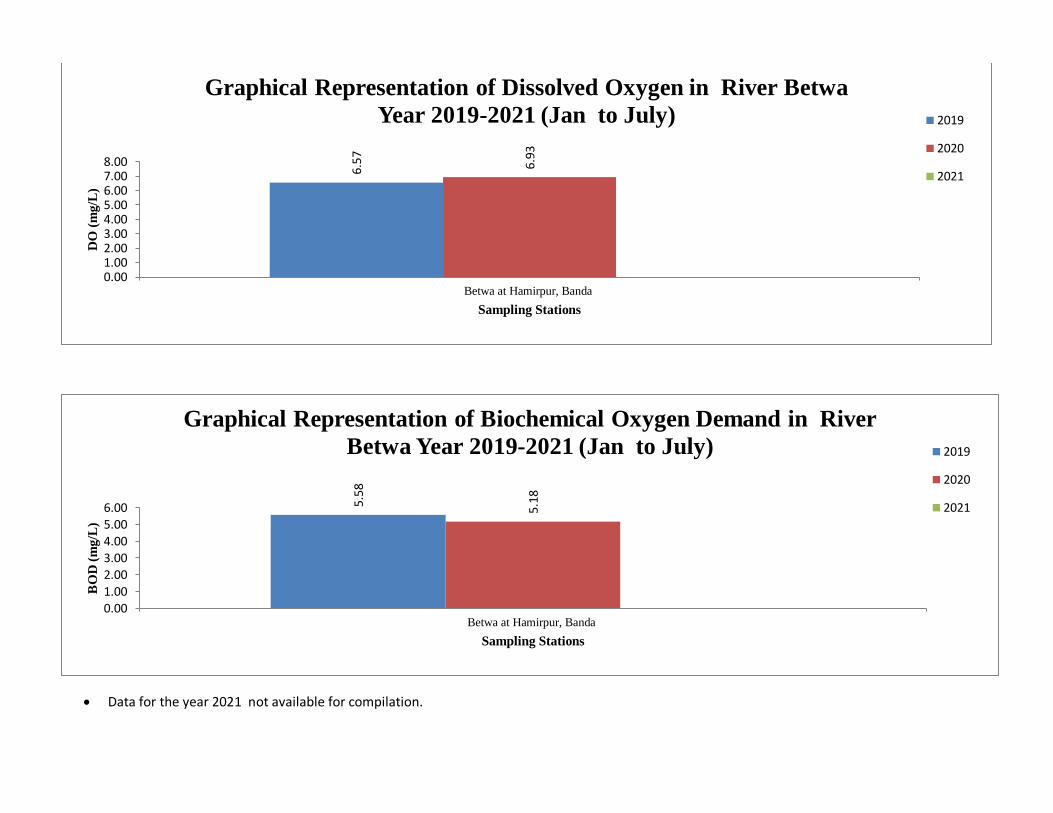
Data for the year 2021 not available for compilation.
6.5
7
6.9
3
0.001.002.003.004.005.006.007.008.00
Betwa at Hamirpur, Banda
DO
(m
g/L
)
Sampling Stations
Graphical Representation of Dissolved Oxygen in River Betwa
Year 2019-2021 (Jan to July) 2019
2020
2021
5.5
8
5.1
8
0.00
1.00
2.003.00
4.00
5.006.00
Betwa at Hamirpur, Banda
BO
D (
mg/L
)
Sampling Stations
Graphical Representation of Biochemical Oxygen Demand in River
Betwa Year 2019-2021 (Jan to July) 2019
2020
2021
66
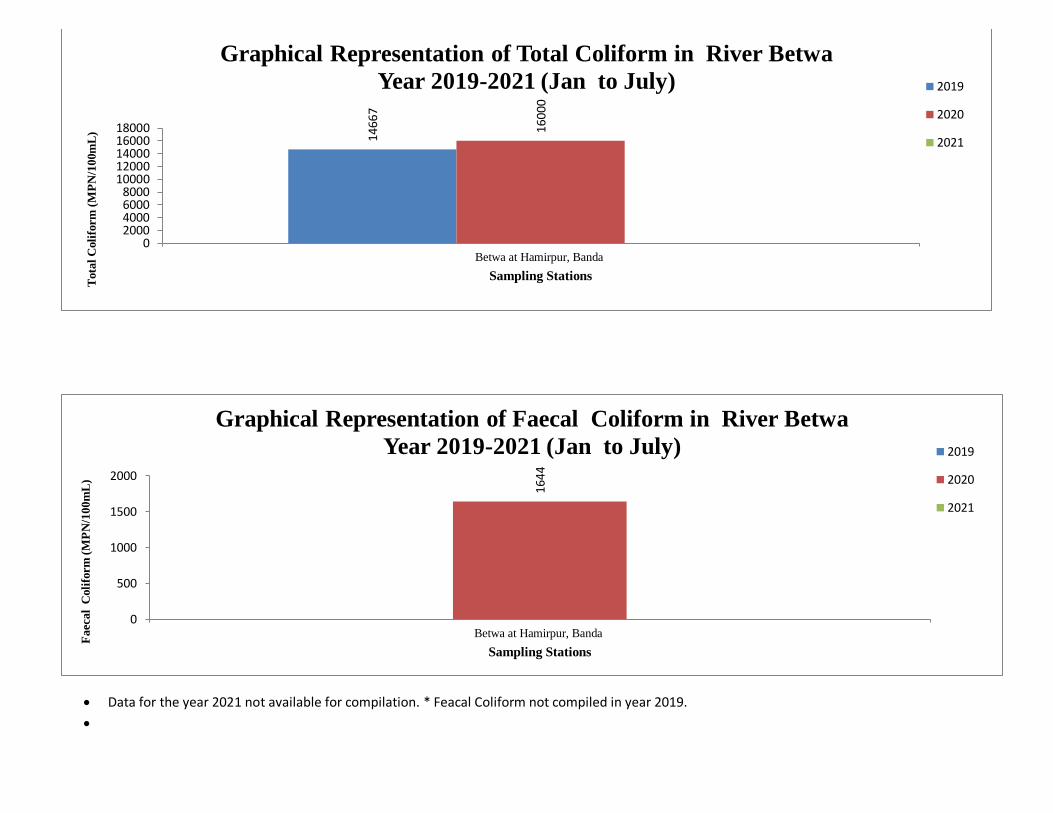
Data for the year 2021 not available for compilation. * Feacal Coliform not compiled in year 2019.
1466
7
1600
0
02000400060008000
1000012000140001600018000
Betwa at Hamirpur, Banda
Tota
l C
oli
form
(M
PN
/100m
L)
Sampling Stations
Graphical Representation of Total Coliform in River Betwa
Year 2019-2021 (Jan to July) 2019
2020
2021
1644
0
500
1000
1500
2000
Betwa at Hamirpur, Banda
Faec
al C
oli
form
(M
PN
/100m
L)
Sampling Stations
Graphical Representation of Faecal Coliform in River Betwa
Year 2019-2021 (Jan to July) 2019
2020
2021
67