
r',;,40 -7
21
Fluor Corporation 1976 Annual Report r',;,40 -7 ' .fl , 4 4-O! IIP
Transcript of r',;,40 -7

Fluor Corporation 1976 Annual Report
r',;,40 -7
'.fl
, 4
4-O!
IIP

Fluor Corporation
Highlights
In this year's report as symbolized YCaLS ended October 31, 1976 and 1975 1976 1975 % Change
by the cover design we are providing Fiscal Y ear Work performed $3,368,805,000 $2,292,288,000 +47.0 additional perspective of Fluor's Revenues 1,801,761,000 5,325,423,000 +35.9 operations and financial results. Net earnings 64,880,000 47,411,000 +36.8
Earnings per share 3.88 2.87 +35.2 Depreciation, depletion, amortization
and dry-hole writeoffs 45,767,000 37,849,000 +10.4 Funds provided from operations New orders received
104,259,000 3,210,551,000
85,095,000 6,925,580,000
+22.5 53.6
At Y ear End Backlog 8,751,256,000 9,088,298,000 3.7 4
2 Net investment Property, plant and equipment Oil and gas properties
247,574,000 25,537,000
576,444,000 29,359,000
+40.3 13.0
Total assets 721,497,000 538,447,000 +34.0 Shareholders' equity 300,812,000 244,319,000 +23.1
Per common share 16.14 12.60 -1-28.1
Number of employees 16,305 16,289 + .r
See Financial Review on pages 20, 21, 22, 23 and 24.
Contents
2 Corporate Profile 6 Financial Terminology
12 Operations Report 16 Corporate 58 Directors and Officers 20 Financial Review 25 Consolidated Financial Statements 30 Five-Year Summary of Consolidated Operations 31 Management's Discussion and
Analysis of the Summary of Consolidated Operations
32 Operations by Lines of Business 33 Five-Year Financial Highlights 34 Principal Subsidiaries and Divisions 35 Shareholder Reference

Corporate Profile
In 1977, we expect a good year for the In 1978 and the years beyond, we fore- The consortium of Peabody buyersJ. Robert Fluor Fluor continued the upswing that began in also declared a quarterly cash dividend of 75
1972 by ending fiscal 1976 with con- cents per share on the company's Series B largest of our subsidiaries, Fluor Engineers see a resumption of excellent year-to-year includes: Newmont Mining Corporation,Chairman, Chief Executive
and Constructors. We expect a higher mar- earnings gains, based on our expectation of 35-percent interest; The Williams Com-Officer and President solidated net earnings of $64,880,000, or preferred stock. Dividends on common and
demand for E&C services through the panies, 35-percent interest; Bechtel$3.88 per share a 37 percent increase over preferred stock were payable January 15, gin on somewhat lower revenues. Mean
1977, to shareholders of record on while, new orders materializing from remainder of this decade and on steady Corporation, r 5-percent interest; Fluorthe record earnings of 1975. Total work
December 31, 1976. contingent awards of some $5-6 billion and business improvement for our other units. Corporation, 10-percent interest, and Theperformed during the year amounted to $3.4 billion, compared with $2.3 billion in Fiscal 1977 should be another record year from about three times that amount of addi- Early in fiscal 1976, the Corporation's Equitable Life Assurance Company of the
for earnings, although total work per- tional prospects around the world should planning and development efforts were United States, 5-percent interest.1975. Revenues for the 12 months were a
restructured and consolidated into a newly The contract of purchase with Kennecottrecord $1,801,761,000, compared with formed and revenues may not exceed the give us a new record backlog on
created staff group, Strategic Planning/ covers all the outstanding stock of Peabody$1,325,423,000 reported in 1975. levels attained in 1976. New orders are October 31, 1977.
Corporate Development. Fluor's corporate Coal, for a price of $1.1 billion principalexpected to establish our highest-ever back- Earlier in 1976, we had hoped for betterFiscal 1976 results set records in revstrategy for growth, diversification, and amount, after divestment of its principallog On October 31, 1977. earnings performance in fiscal 1977. Subseenues and net earnings, despite continued stability was concentrated at the top level Australian assets.While profits in 1977 for Fluor Utah quently, however, the schedule of ourlow capital expenditures in the United of management. The move underscored Our report this year is significantly difand Fluor Ocean Services may parallel their massive gas-conservation program in SaudiStates and Western Europe, the suspension the company's desire to continue to grow ferent than in prior years. We are hopeful'76 results, both subsidiaries anticipate Arabia was stretched out from 1979 to 1982.of a large copper-mine development in both in sales and earnings, while strength- that, by prefacing our figures with an exsubstantially higher new orders. With its Obviously, this will impact profit take-upZaire, and a worldwide downturn in the ening and expanding its base of operations. planation of the terms used in reporting ourrcompletely reorganized staff and revitalized for 1977. Moreover, the Zaire copper projoffshore exploratory-drilling market.
Continuing evaluation of our dividend operations, we will add to your knowledgemarketing organization, Fluor Pioneer ect was suspended early in 1976, affectingNew contract awards of $600 million policy is a basic consideration in our efforts and understanding of Fluor's business andshould enjoy a turn-around year in 1977 as 1976, '77 and '78 earnings projections.and additions to existing projects of to properly utilize our cash flow. Addition- the manner in which we discuss our
$2.6 billion comprised our third largest it takes advantage of much-improved Add to this Indonesia's change in its ally, we're seeking opportunities to invest in financial data.prospects in the domestic utility market. production-sharing agreement. This reducedamount of new orders for any fiscal year a number of areas, one of which is naturalFluor Drilling Services, however, will Oil and Gas profits in 1976 and in future$3.2 billion and maintained year-end
face both reduced utilization of its units in years. But it had a bigger impact on Fluor resources. Toward that end in 1976, Fluorbacklog at $8.8 billion, only slightly below Southeast Asian waters and more com- joined the Peabody Holding Company con-Drilling Services, many of whose rigs inthe record level reported a year earlier.
Since 1972, earnings per share have in- petitive conditions for its rigs in the Gulf of Southeast Asia have been idled while its sortium in a bid to purchase the domestic
creased eight and one half times on revenues Mexico during 1977. This will definitely clients study the future under the new terms. operations of Peabody Coal Company, a
impact its profitability. wholly owned subsidiary of KennecottOn the other hand, we enter 1977that rose from $413 million to $1.8 billion. Copper Corporation. On October 14, 1976,
Comparing 1972 with 1976, new orders Revenues and earnings results in 1977 stronger financially than ever before. We that bid was accepted by Kennecott, subjectgrew from $672 million to $3.2 billion, for Kilsby Tubesupply and Republic Supply have accomplished further reduction in our
Company of California will be tied to the debt, and we are aggressively pursuing a to approval by the Federal Trade Combacklog moved from $7oo million to
economic recovery in the U.S. and, there- development program that will shape the mission, which has ordered Kennecott to$8.8 billion, and total manpower advanced
fore, should be at higher levels than in Fluor of the future. divest Peabody.from about 6,300 to 16,300. 1976. Meanwhile, 1977 should be a much Our decision to join the consortium inReflecting this performance, the Board better year for Fluor Oil & Gas Corporation. bidding for Peabody Coal, the largest U.S.of Directors, at its meeting on December i3, Although income from a concession in Irian producer of steam coal, was based on our1976, voted the fourth increase in three Jaya in which Fluor holds a io percent belief that coal will continue to gain imporyears and raised the common-stock dividend interest will be lower as a result of the tance as one of the United States' major25 percent to an annual rate of $1.00 per Indonesian government's change in its pro- energy sources, both in power generationshare (25 cents per quarter). The Board duction-sharing agreement, this will be and in gasification installations. more than offset by a lesser rate of foreign exploration expenses and by added income from domestic operations.
Orders in Number of EmploNewBacklog in Mons of dollars in thousands billions of dollars
16 10.0
12 7.5
845..
42.5
o o
1972 73 74 75 76 1972 73 74 75 76 1972 73 74 75 762.
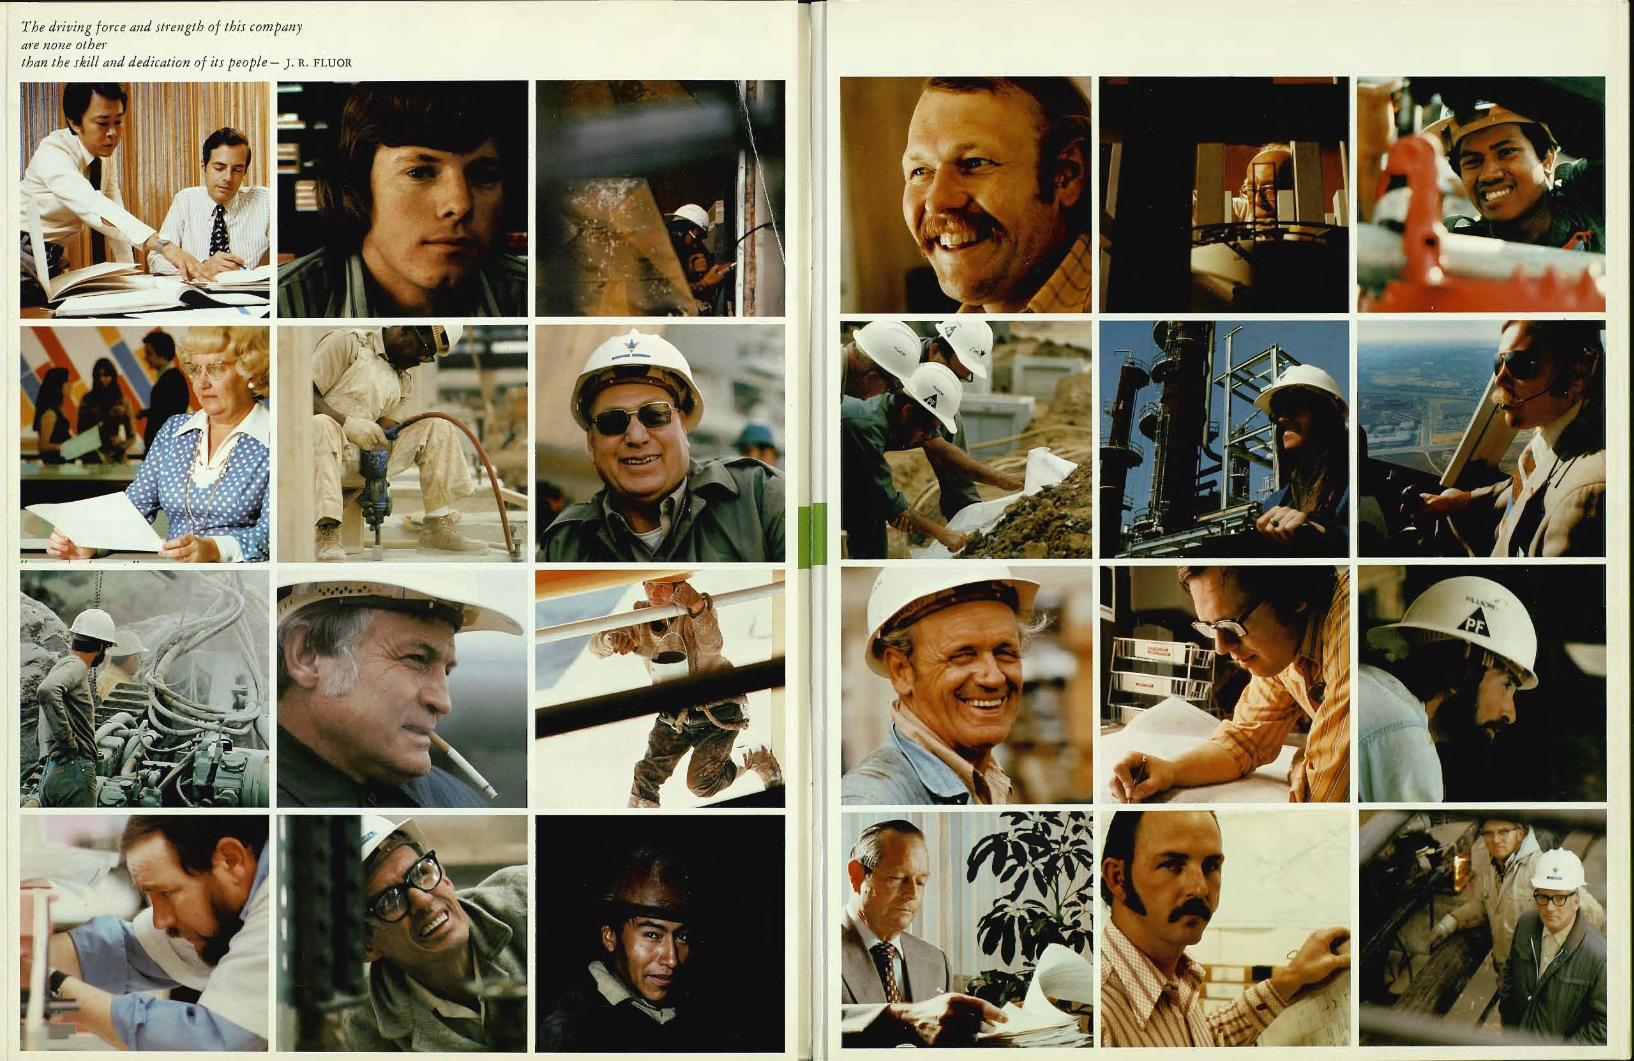
The driving force and strength of this company are none other than the skill and dedication of its people. j. R FLUOR
-
-al
L.441
e At
! , %fill. O.
.004-2
.a fig"'
_
'
Or'
-
Financial Terminology
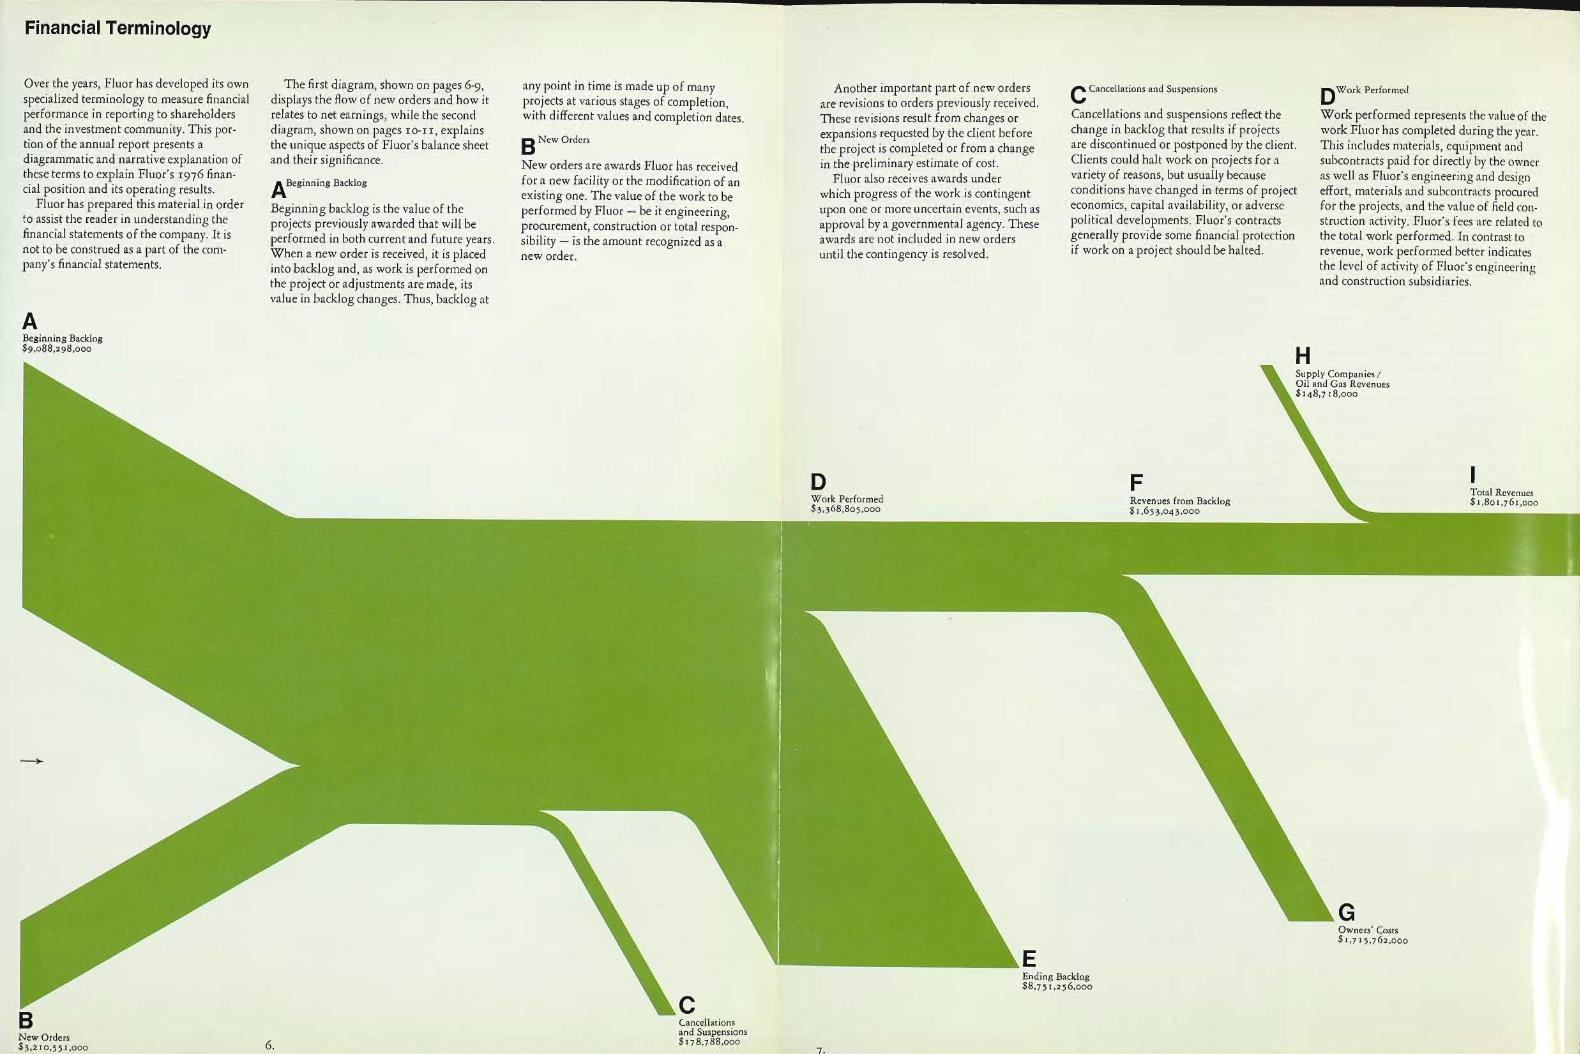
Over the years, Fluor has developed its own specialized terminology to measure financial performance in reporting to shareholders and the investment community. This portion of the annual report presents a diagrammatic and narrative explanation of these terms to explain Fluor's 1976 financial position and its operating results.
Fluor has prepared this material in order to assist the reader in understanding the financial statements of the company. It is not to be construed as a part of the company's financial statements.
A Beginning Backlog S9,088,298,000
The first diagram, shown on pages 6-9, displays the flow of new orders and how it relates to net earnings, while the second diagram, shown on pages TO-II, explains the unique aspects of Fluor's balance sheet and their significance.
Backlog ABeginning Beginning backlog is the value of the projects previously awarded that will be performed in both current and future years. When a new order is received, it is placed into backlog and, as work is performed on the project or adjustments are made, its value in backlog changes. Thus, backlog at
any point in time is made up of inany projects at various stages of completion, with different values and completion dates.
New Orders
New orders are awards Fluor has received for a new facility or the modification of an existing one. The value of the work to be performed by Fluor be it engineering, procurement, construction or total responsibility is the amount recognized as a new order.
Another important part of new orders are revisions to orders previously received. These revisions result from changes or expansions requested by the client before the project is completed or from a change in the preliminary estimate of cost.
Fluor also receives awards under which progress of the work is contingent upon one or more uncertain events, such as approval by a governmental agency. These awards are not included in new orders until the contingency is resolved.
Work Performed $3,368,805,000
and Suspensions Performed CCancellations DWork Cancellations and suspensions reflect the Work performed represents the value of the change in backlog that results if projects work Fluor has completed during the year. are discontinued or postponed by the client. This includes materials, equipment and Clients could halt work on projects for a subcontracts paid for directly by the owner variety of reasons, but usually because as well as Fluor's engineering and design conditions have changed in terms of project effort, materials and subcontracts procured economics, capital availability, or adverse for the projects, and the value of field conpolitical developments. Fluor's contracts struction activity. Fluor's fees are related to generally provide some financial protection the total work performed. In contrast to if work on a project should be halted. revenue, work performed better indicates
the level of activity of Fluor's engineering and construction subsidiaries.
Supply Companies //Oil and Gas Revenues $148,718,000
Total Revenues Revenues from Backlog $1,801,761,000 $1,653,043,000
Owners' Costs S1,715,762,000
E Ending Backlog$8,755,256,000
7. New Orders $3,210,551,000 6.
Cancellations and Suspensions s578,788,000

1
Backlog EEncling Ending backlog represents the value of work to be performed in future years. This value can be derived by taking beginning backlog plus new orders, less work performed, cancellations and suspensions.
from Backlog FRevenues Fluor's engineering and construction revenues include project costs incurred, plus the profit recognized during the period. Fluor uses the percentage-of-completion method of recognizing this profit for financial reporting. The amount of profit recog
8.
nized during a period is based upon the ratio of costs incurred to total estimated contract costs.
In addition to engineering and construction activities, a smaller portion of revenues from backlog is contributed by Fluor's contract drilling business.
costs Gowners, Owners' costs reflect the materials, equipment and subcontracts paid for directly by the client which Fluor procures on behalf of the client and handles as part of a.n overall project. Fluor earns a fee on these owners' costs, and therefore they are included in new orders, backlog and work performed.
Companies / Oil and Gas Revenues HSupply The balance of revenues is derived from the two supply companies and the oil and gas operation.
Total Revenues
Total revenues are the sum of revenues from backlog, supply companies, and oil and gas revenues.
Costs jMaterial In engineering and construction activities, material costs represent the payments that
have been made directly by Fluor for equipment, materials, subcontracts, and other services used in project construction. Material costs for the remainder of Fluor's activities are made up of items purchased for resale or otherwise used in the normal course of business.
Costs KEmployee Employee costs include salaries, wages, incentive compensation, payroll taxes, and employee benefits for both permanent employees and field craft labor. Employee benefits include Fluor's contribution to the
profit-sharing plan and other fringe benefits on behalf of employees.
!Other Costs and Expenses
Other costs and expenses include depreciation, depletion and amortization of assets, property taxes, insurance, and all other costs and expenses not separately defined in this report.
State and Foreign Income Taxes mFederal, Federal, state and foreign income ta.xes reflect the amount required for such taxes, whether payable now or in future years.
Over half of Fluor's earnings before tax for 1976 have been provided to cover these estimated taxes on earnings.
Earnings NNet Net earnings are the amount by which total revenues exceed all costs, expenses, and taxes incurred during the current period.
N Net Earnings $64,880,000
M Federal, State and Foreign Income Taxes $73,500,000
Other Costs and Expenses$124,361,000
Material Costs $856,324,000
Employee Costs $682,496,000
9.

Balance Sheet
The diagrams shown below and the accompanying explanations emphasize certain aspects of the balance sheet that are unique to the engineering and construction business and of particular significance to Fluor.
°Total Current Assets
Current Liabilities sTotal Operating CycleCurrent assets include cash and other assets that can be expected to be converted into cash during Fluor's operating cycle. Alternatively, current liabilities represent the debts or debt equivalents to be paid off within the same operating cycle. The term operating cycle in most businesses means within one
o Total Current Assets $417,218,000
Property, Plant and Equipmentnet $247,574,000
Oil and Gas Properties net$25,537,000
Other Assets S 31,168,000
IO.
year, but, in the case of Fluor's engineering and construction business, it refers to the duration of its contracts. Thus, operating cycle may be several years for the projectrelated assets and liabilities, and one year for other assets and liabilities.
1V orking CapitalThe net difference between current assets and current liabilities, usually termed working capital, is the traditional measure of a corporation's liquidity, or ability to meet its financial obligations within its operating cycle. Fluor has relatively low working-capital needs in project work, since clients generally fund projects in advance.
Deferred Income TaxesDeferred income taxes arise because Fluor earnings are calculated on the percentage-of-completion
method for financial-reporting purposes, while federal income taxes are not payable on some contracts until the contract is completed. The tax payments thus deferred are shown as a current liability in the balance sheet because payment will occur within the operating cycle, although not necessarily within one year. These deferred income taxes have grown rapidly in the past several years due to increases in both project size and duration.
Additional ItemsTwo significant items within current assets and current liabilities that require further explanation are:
Contract work in progress Advance billings on contracts.
These two additional items are terms coi-nmonly used in our engineering and construction business. Much of a) are project costs and earnings that have not been billed, while b) largely represents both advances and billings in excess of costs and earnings.
Plant and Equipmentnet PProperty,
and Gas Propertiesnet QOil These balance sheet items represent Fluor's investment in its productive assets after deducting applicable depreciation, depletion and a.mortization. Investment in such assets has increased significantly in recent years, paralleling the company's growth in earnings, new orders and manpower.
Assets ROther Other assets include several categories. A major share of this is goodwill, which is the excess of cost over and above the net assets of acquired companies at the time of purchase. Much of this goodwill is being amortized over a period of years.
Long-Term Debt
Long-term debt represents that portion of borrowed funds payable after one year.
Noncurrent Liabilities uOther Other noncurrent liabilities include deferred income taxes not payable within the operating cycle. These income taxes result from timing differences between the methods used for financial-statement purposes and
tax reporting, such as depreciation of plant and equipment, as well as income taxes that will be payable on foreign subsidiary earnings when remitted to the United States. Other non-current liabilities include amounts payable under deferred compensation plans.
Shareholders' Equity v, Shareholders' equity represents the total investment of shareholders in the business. This includes the money and property received by the company when shares are issued, together with the earnings retained by the company for reinvestment.
S Total Current Liabilities $394,432,000
Long-Term Debt $4,056,000
U Other Noncurren Liabilities $22,217,000
Shareholders' Equity8300,812,000
Assets $725,497,000
Liabilities and Shareholders Equity $721,497,000
II.
V

Operations Report
The following are highlights of Fluor's operations during fiscal 1976.
The tables in this section do not reflect elimination of transactions between Fluor's various lines of business for work performed, revenues, new orders or backlog.
Process-Plant Engineering and Construction
($ in thousands) 1976 1975
Work Performed 83,031,920 81,865,242
Revenues 1,499,221 968,665
Earnings Before Taxes - 125,508 73,306
New Orders 3,122,848 6,431,760
Backlog, Year End $8,564,888 88,143,953
Manpower 12,363 11,372
Fluor Engineers and Constructors, Inc. (Fluor E&C) at work in a dozen countries on some two dozen major projects made by far the largest contribution to Fluor's record earnings in fiscal 1976.
Fluor E&C completed a number of large total-responsibility jobs, including: two plants in Indonesia, one a facility to process 130 million cubic feet of gas and ioo,000 barrels of oil a day, the other a ioo,000barrels-per-day refinery; a high-sulfur crudeprocessing expansion and a 300-millionpounds-per-year high-density polyethylene plant, both in Texas; a 3oo-million-poundsper-year oxo-alcohol plant expansion in Puerto Rico; and a 250,000-barrels-per-day refinery expansion in Belgium. Fluor E&C also completed engineering and procurement for a 25o,000-barrels-per-day refinery expansion in Texas.
Fluor E&C updated the definition and estimate of several megaprojects during
1976. The largest of these will process gas produced in association with oil in the Eastern Province of Saudi Arabia to ethane, sweet fuel gas, and natural-gas liquids. At year-end 1976, this program was carried in backlog at $4.6 billion and is currently targeted for completion in 1982 a threeyear extension from a preliminary schedule derived in mid-1975. Work on a fuels- and chemicals-from-coal facility in South Africa was updated to $2.2 billion in the October 31 backlog and will be completed in 1981.
Fluor E&C was So percent complete at year-end on the marine terminal and pump stations of the Trans-Alaska pipeline system. About $250 million of construction is scheduled to complete Fluor's portion of the vast installation in 1977.
Meanwhile, Fluor E&C was on schedule with two refinery projects in Iran: a 200, 000-barrels-per-day grass-roots refinery at Esfahan and a i3o,000-barrels-per-day crude-unit expansion at Abadan.
Other on-going Fluor E&C projects include a caustic-chlorine facility in Louisiana, ammonia plants in Trinidad and Oklahoma, fertilizer complexes in Korea and Brazil, a gas-processing facility in Germany, and a plant to calcine nuclear wastes in Idaho.
Among the new projects announced in fiscal 1976, Fluor E&C received design, engineering, procurement, and construction awards valued at $300 million to complete two gas-processing plants using Fluor's turbo-expander technology. The plants are scheduled for completion in Iran in 1978./Under a $200 million contract, Fluor E&C was selected to engineer, obtain materials, and manage construction of two facilities within a Korean petrochemical complex. The subsidiary was also awarded a 3o,000-barrelsper-day expansion to a Louisiana refinery.
And, in another total-responsibility assignment, Fluor E&C began work on a 175million-pounds-per-year high-density polyethylene plant in Texas. Fluor E&C also received contracts in excess of $30 million for the design, engineering, and limited procurement of three gas-processing plants to be built in Western Siberia.
E&C manpower grew by almost i,000 to some 12,000 employees worldwide in fiscal 1976. In the fall, the new headquarters of the Southern California Division was completed, and employees began occupying the 1.3-million-square-foot facility. The complex consolidates operations that had been spread among six locations. In European operations, Fluor Nederland's continued growth led to the lease of additional workspace in Amsterdam. Fluor Asian Services, Ltd., was closed late in the year due to low economic viability of its operations.
Fluor E&C's current five-year market forecast indica.tes that half of the company's new work is expected to come from Middle Eastern countries, but activity in the United States and Europe will start picking up. Petrochemical plants and refineries are expected to comprise more than 50 percent of Fluor E&C's future opportunity. It appears, too, that the synthetic-fuels market has good potential.
Process -Plant Sales Prospects 12
$ billions
9
6
3
0 1969 70 75
Capital Commitment Forecast by Plant Type $ billions (1976 prices)
36
27 k¡ Nuclear Fuels
II Natural Gas & LNG
MI Solid Fuels
MI Refining
Chemicals 9
0 1977 78
New Order Forecast (1977-1979) by Plant Type
Solid Fuel
Petroleum Refining
Nuclear Fuel
Gas Processing
LNG & Other
Chemicals
New Order Forecast (1977-1979) by Plant Location
Europe
Middle East
Far East
United States
Latin America, Africa, Canada & E. Block
Fluor E&C's Historic Data and Current Five-Year Market Forecast.
Mining/Metals Engineering and Construction
($ in thousands) 1976 1975
Work Performed $207,201 $297,500
Revenues 83,895 127,899
Earnings Before Taxes 3,628 9,323
New Orders 26,954 446,504
Backlog, Year End $131,565 $497,618
2 73 74 75 77 Manpower 989 5,765
79 o
Fluor Utah ended fiscal year 1976 with the successful completion of two milestone projects the Cuajone copper complex in Peru and the L-Bar uranium facility in New Mexico.
Completion of the Cuajone development, one of the world's largest copper mines and concentrators, culminated six years' effort by Fluor Utah. L-Bar was the fourth "second generation" uranium mill designed and constructed by the subsidiary.
Notwithstanding the suspension of a major copper-mine development in Zaire early in 1 97 6, Fluor Utah is currently under contract preparing a capital-cost estimate for a reduced-capacity facility at the original site, one of the world's richest copper ore bodies. Fluor Utah, at the same time, is nearing completion of a $50 million coal-mine development in Wyoming. Meanwhile, the subsidiary is winding up a significant study for the U.S. Energy Research and Development Administration aimed at highest-ever production from individual coal mines. Two continuing projects, for which Fluor Utah has engineering and procurement responsibility, are a copper concentrator in Arizona and expansion of an i n-situ uran ium facility in Texas.
a
, 7
=
12.

Field construction will start in 1977 on a but, through further overhead trimming, world's largest crude-oil export terminals, depletion allowance reduced drilling activ- Supply Services Oil and Gas Operations coal-liquefaction complex in South Africa managed to dramatically cut its operating located in Saudi Arabia. In other work in ity. The government also took away the ($ in thousands) 1976 1975 ($ in thousands) 1976 1975 for which Fluor Utah is providing engineer- loss from that reported for 1975. The the Middle East, FOS provided engineering benefit of overseas exploratory drilling Revenues S115,566 $220,495 Revenues $33,152 $24,225 ing, procurement, and construction of the subsidia.ry's 1976 new orders exceeded those and detailed design of a 300,000 barrels- costs, forcing many oil companies to halt
Earnings Before Taxes $ 9,982 $ 26,845 Earnings (Loss)ash-handling and catalyst-preparation of 1975 by $8.7 million. per-day waterflood facility. drilling programs. Then the Indonesian
Before Taxes $ 3,769$ $(1,481)facilities, as well as management of wet- Fluor Pioneer received a contract for Work currently in progress includes government revised its production-sharing Manpower 626 597
Manpower 23 23screening and coal-handling operations. engineering and construction management engineering and construction management formula, further discouraging exploration
Kilsby Tubesupply Company experiencedPhase I of development of a uranium in Northern California of a 150-megawatt, of a crude-oil terminal, overland gas- work in its waters. Finally with a worldwide In U.S. operations, Fluor was a 17-percentsoft and inconsistent customer demand
mine and mill in Yugoslavia was concluded simple-cycle gas-turbine project and resumed gathering lines, an LPG terminal, and a surplus of exploratory rigs looking for con- participant in an attractive new gas disthroughout the better part of fiscal 1976,in 1976, with the balance of engineering engineering and design of a unit in a natural-gas-liquids terminal - all part of tracts, day rates suffered major reductions. covery in the Arbuckle Formation of thebut, during the 12-month period, thisand construction expected to begin in 1977. Southern California power plant that had massive industrial programs in Saudi Arabia. Therein lies the explanation for FDS'S Mills Ranch Field in the Texas Panhandle.specialty tubing distributor broadened
Fluor Utah has also completed the eco- been halted in 1975 due to regulatory FOS is studying the facilities needed for $6.2 million downturn in earnings before At 24,482 feet, it is believed to be the deepopportunity for increased profit in futurenomic feasibility study of a magnesia-from- delays. Pioneer's unique standardized design the development of oil and gas from the taxes, despite only a five-percent decline in est commercial gas discovery in the nation.years by opening its eighth warehouse - anseawater plant in Greece, and authorization for nuclear power plants is proceeding as Prinos Field in the Aegean Sea, an area in the utilization rate of its rigs, against the Fluor Oil and Gas Corporation manages80,000-square-foot facility in Houston,to proceed with engineering, procurement planned, with preliminary design approval which Fluor holds an interest. record levels attained in fiscal 1975. Fluor's interest in this and other oil andTexas - and by expanding its product line.-and construction is anticipated in mid-1977. expected from the Nuclear Regulatory In another study, FOS is working on the Following a collision with another drill- Four new general managerships were gas activities.
In fiscal 1976, Fluor Australia, a Fluor Commission in June 1977. development of a major long-length oil ing rig during a severe storm offshore created, and a manager of strategic planning In a production-sharing contract in Irian Utah subsidiary whose permanent offices are pipeline from a field in North Africa. Dubai in February, the WODECO m was idled Jaya, Indonesia, where Fluor has a To-perjoined Kilsby's corporate staff. The subin Perth and Melbourne, completed mineral- Offshore Engineering and Construction Many of these jobs fulfill an objective for repairs for the remainder of the fiscal cent interest, about 26 million barrels of oilsidiary also started truck service betweensands process facilities at Eneabba. A total- ($ in thousands) 2976 FOS set in 1975, when the subsidiary decided year and fell far short of its potential for1975 were produced from six fields in fiscal 2976.its West Coast branch stores to move responsibility job, the complex will con- to expand its submarine pipelining capa- revenue generation. In addition, use ofWork Performed $ 68,567 $ 53,091 Additional development drilling is plannedinventories at lower cost.tribute substantially toward Australia's bility to onshore installations in order to WODECO VIII was halted several months in during the coming year that is expected toRevenues 16,556 14,281 The 66-year-old Republic Supply Composition as the world's major producer of maximize use of its engineering capability. Taiwan. Finally, delay in the completion of maintain production in excess of 8o,000pany of California also expanded operationsEarnings Before Taxes 917 1,244rutile and zircon. Fluor Australia, mean- WODECO IX - one of the world's three- in fiscal 1976 by opening a new io,000- barrels per day. while, continued maintenance services on New Orders 19,155 315,445 Drilling Services largest drill ships - precluded a quarter of- Block 16/13 in United Kingdom waterssquare-foot branch office in Orange, Califor
activity expected for the vessel in fiscalrailroads and iron-ore mines in North- Backlog, Year End $173,013 $390,325 ($ in thousands) 1976 1975 nia, and a sales office in Houston, Texas, to is expected to be drilled in 2977. The group western Australia. 1976. The WODECO IX is being modified toWork Performed . $50,590 $57,160 for which Fluor acts as operator has madeManpower 230 229 service Gulf Coa.st customers. The new
conform with U.S. Coast Guard standards an arrangement with Deminex Oil iind GasRevenues 50,590 57,260 facilities bring the number of RepublicPower-Plant Engineering for a U.S. flag vessel.During fiscal 1976, Fluor Ocean Services Supply branch stores to i5, plus two divi- (U.K.) Limited of Germany to drill oneand Construction (Fos) completed five major projects, Earnings Before Taxes 12,262 18,444 FDS has intensified its sales effort to assure sion headquarters and a sales office. of two exploratory wells in exchange for
(S in thousands) 1976 1975 including the world's first offshore natural- New Orders 29,862 23,958 the best possible utilization of its rigs in a The development of a new computer- participating interests in the petroleum
Work Performed - $18,425 $24,874 gas-liquids recovery plant. Project engineer- Backlog, Year End $22,960 $33,836 worldwide market that does not seem to ized Inventory Management System helped license. The first of these wells should com
hold great promise through the next two toRevenues 18,425 24.874 ing and construction management of the
Average Rig Utilization Republic achieve a planned 6-percent mence in 450 feet of water during the firstthree years. Given the company's record$r8o-million facility, built in the Java Sea,
Loss Before Taxes (8o8) Rate 87% 92% reduction in inventory in fiscal 2976. The half of 2977.(42) of outstanding service, however, FDS shouldwas handled by FOS, while Fluor E&C's Manpower 827 896 application of this system is in keeping with In the northern Aegean Sea, where Fluor
New Orders 26,284 7,473 fare better than most in the difficultHouston Division supplied process engi Republic's phi losophy of continually is a 4-percent partner in a discovery desig-Backlog, Year End $18,848 $29,983 neering and procurement. In two Texas Retrospectively, Fluor Drilling Services, period ahead.
improving cost-control techniques. nated Prinos Field, three delineation wells Manpower 658 689 jobs, cos engineered, procured, and con- Inc. (Fps), performed far better than could have been drilled and a fourth is now
structed dock facilities capable of handling be expected under the circumstances pre- drilling utilizing the WODECO III. Fluor hasFluor Pioneer Inc. weathered a third year of eight 2o,000-barrel barges simultaneously vailing during 1976. The U.S. Govern a 12.5-percent interest in an arca outsidedangerously low capital commitments for and completed the design of modem marine ment's earlier removal of the foreign oilnew projects by the electric-utility industry, terminal facilities for a refinery.
FOS completed Phase III engineering and construction management of one of the
"5,.

the Prinos Field where at least two exploratory tests are planned for 1977. During 1976, Oceanic Exploration Company former operator for the group - sold its large interest to Denison Mines Limited, a step that enabled progress to be made in preparing the field for production.
Fluor Oil and Gas is forecasting a significant increase in earnings from its operations in 1977.
Underwater Completion Systems
(.$ in thousands) 1976 1975
Work Performed $2,748 $3,646
Revenues 2,748 3,646
Loss Before Taxes (235) (413)
New Orders 1,279 3,035
Backlog $ 197 $1,371
Manpower 39 49
In fiscal 1976, Deep Oil Technology (DOT) took one step farther in development of its Tension Leg Platform (TLP) concept, as it applies to use in the North Sea. Lloyd's Register of Shipping gave the TLP design its quality assurance, the first for a tensionleg-type oil production platform design in which tension cables rather than fixed legs are used to control both horizontal and vertical motions in deep water drilling.
During the year, DOT successfully installed seafloor oil production equipment at an experimental station, off the coast of Africa. In addition, DOT completed a contract with the National Science Foundation for the designing and furnishing of equipment to re-enter core holes to set casing and cementing in water depths up to 20,000 feet.
A design for a production riser pipe for operating in water depths of 3,000 feet was completed, and the design is currently being modified for a specific application at a shallow depth. A computer program also was completed, under the sponsorship of nine oil companies, for the design and analysis of riser pipes for all water depths to be used in conjunction with floating production systems.
Corporate
Warren F. Kane, Senior Vice President and a Board member, resigned on October 31. His duties as President of Fluor Utah were assumed by Senior Vice President James L. Ta.thwell, and the Corporation's strategic planning and corporate development efforts were re-directed to the leadership of the Chairman, Chief Exec-utive Officer and President. Also during fiscal 1976, Ronald G. Cullis resigned as the corporate Controller, a.nd the Board elected Richard D. Paul, former Vice President of Finance for Fluor E&C, as his successor.
On May 31, all the assets of the Houstonbased Bonner & Moore Associates, Inc., were sold to a new Texas corporation bearing the same name. The company is now held by the employees and management of Bonner & Moore through an employee stock ownership plan.
In 1976, Fluor grants to colleges and universities totaled $400,000, and the Corporation contributed more than $476,000 to United Way agencies throughout the United States.
Backlog by Industry and Location 1976 1975 1974
Dollar amounts are in millions
Engineering and Construction
Gas Processing 5,057 57.8 4,356 47.9 683 '5.4
Petroleum 846 9.7 2,167 23.8 2,214 49.8
Solid Fuels 2,300 26.3 1,336 .814-7 38
Chemical/Petrochemical 5.2 705 951 21.4451 7.8
Mining/Metals 46 .5 397 4.4 375 8.4
Power 19 .2 19 .2 26 .6
Offshore 2 67 86 1.9.7
Drilling 13 .1 71 1.634 .4
Other 17 .2 .1 2 .17
Total 8,751 100.0 9,088 100.0 4,446 100.0
United States 6.8 1,790 2,673 60.,598 ,9.7
Outside U.S. 8,153 93.2 7,298 80.3 1,773 39.9
Total 8,751 500.0 9,088 100.0 4,446 100.0
Backlog includes owners' costs of approximately 61% 56% 4J%
The above backlog information, which is detailed by industry and location, does not necessarily relate to the backlog information shown in the Operations Report, which is detailed by major operating units.
1973
334 24.2
810 58.6
22 .1
90 6.5
I00 7.2
.233
6. .5.
35 2.5
.233
1,383 100.0
615 44.4
768 55.6
1,383 100.0
17%
1972
46 6.6
423 6o.6
48 6.9
160 23.0
33 .4
5 .7
12 1.7
.1
698 Ioo.o
268 38.4
430 61.6
698 100.0
'4%
. 17.
Directors and Officers
Directors
J. Robert Fluor* David S. Tappan, Jr.* Thomas P. Pike** Melvin A. Ellsworth" Richard B. Humbert Sibrand Jurriaans
Ross A. McClintock*
George W. Mefferd* Ernest Moncrief Loren K. Olson John K. Pike Arthur C. Sheffield
James L. Tathwell*
Charles Weiner"
Officers
J. Robert Fluor David S. Tappan, Jr. Ross A. McClintock
George W. Mefferd James L. Tathwell
Richard B. Humbert Jay L. Reed -
William R. Warren Richard D. Paul Nad A. Peterson
*Member of Executive Committee **Member of Audit Committee
1976 Financial Review and Consolidated Financial Statements
Chairman, Chief Executive Officer, and President (1946) Vice Chairman of the Board and President of Fluor Engineers and Constructors, Inc. (1965) Retired, Honorary Vice Chairman of the Board (1969) Retired, former President (1936) Vice President Law and Tax and Secretary (1973) Advisor to the Board of Managing Directors of Pierson, Heldring & Pierson, investment and commercial bankers (1964) Senior Vice President and President of Fluor Drilling Services, Inc. (1969)
Senior Vice President Finance and Treasurer (1974) Senior Vice President of Fluor Engineers and Constructors, Inc. (1967) Partner of Morgan, Lewis & Bockius, attorneys (1962) President of Kilsby T ubesupply Company (1969) Senior Vice President of Fluor Engineers and Constructors, Inc. (1971) Senior V ice President and President of Fluor Pioneer Inc.
and President of Fluor Utah, Inc. (1966) Partner, Texas Crude Oil Company, oil and gas property management (1969)
Chairman, Chief Executive Officer, and President (1946) Vice Chairman of the Board and President of Fluor Engineers and Constructors, Inc. (1952) Senior Vice President and President of Fluor Drilling Services, Inc. (1969) Senior Vice President Finance and Treasurer (1974) Senior Vice President and President of Fluor Pioneer Inc. and President of Fluor U tah, Inc. (1941) Vice President Law and Tax and Secretary (1956) Vice President Administration (1949) Vice President Information Systems (1975) Controller (1968) General Counsel (1967)
NOTE: Figures in parentheses indicate the year Director was elected to the Board, or year each Officer joined the Corporation.
8.

Financial Review
Major Accounting Policies
Principles of Consolidation The financial statements include the accounts of the company and all its subsidiaries. All significant intercompany transactions are eliminated. The equity method of accounting is used for investments in partnerships, joint ventures and companies where ownership ranges from 20% to 50% (such assets and related revenues represent an immaterial portion of consolidated assets and related revenues).
Engineering and Construction Contracts The company recognizes revenues on engineering and construction contracts on the percentage-of-completion method based on the ratio of costs incurred to date on the contracts to total estimated contract costs. Changes to total estimated contract costs and losses, if any, are recognized in the period they are determined. Revenues recognized in excess of amounts billed are classified as current assets under contract work in progress. It is anticipated that substantially all contract work in progress at October 31, 1976, will be billed and collected in 1977. Amounts received from clients in excess of revenues recognized to date are classified as current liabilities under advance billings on contracts.
Inventories Inventories are stated at the lower of cost (average and first-in, first-out methods) or market.
Accounting for Foreign S ubsidiaries The assets and liabilities of foreign subsidiaries are translated into U.S. dollars in
fl
accordance with the accounting prescribed by the Financial Accounting Standards Board. Net exchange losses of approximately $2,350,000 in 1976 and $1,814,000 in 1975 have been included with costs and expenses in the consolidated statement of earnings.
Condensed financial information of the combined foreign subsidiaries, which are located principally in Europe, Australia, and the Middle East, follows:
1976
Current assets less current liabilities $23,506,000 Net assets 41,903,000 Revenues 540,060,000 Net earnings 19,105,000
InCOMe Taxes Deferred income taxes included under Current Liabilities relate principally to the use for U.S. tax-reporting purposes of the completed-contract method of accounting by certain engineering and construction subsidiaries, whereas for financial-reporting purposes the percentage-of-completion method of accounting is used. Deferred income taxes included in Other Noncurrent Liabilities relate to timing differences between financial and tax reporting-such as depreciation, deferred compensation, accounting for oil and gas properties, and taxes provided on cumulative undistributed earnings of foreign subsidiaries.
Investment tax credits are applied to reduce the current provision for federal income taxes under the flow-through method.
Depreciation, Depletion, Amortization and Exploration Costs Depreciation and amortization of property, plant and equipment, other than oil and gas properties, are calculated on a straight-line or accelerated basis over the estimated useful lives of the related assets. Depreciation, depletion and amortization of oil and gas
venues in !lions of dollars,
2.0
1.5 E
1.0
0.5
5972 73 74 75 76
1975
$ 14,148,000 28,116,000
271,811,000 5,055,000
properties are calculated on a composite unitof-production method based on estimated reserves. Geological and geophysical costs are capitalized if connected with the acquisition or retention of an economic interest in oil or gas properties; otherwise, such costs are expensed. The costs of exploratory dry holes are charged to expense when the well is known to be non-productive. Lease rentals are charged against income as incurred. The costs of dry holes drilled in the delineation of productive economic fields are capitalized as part of the cost of developing the reservoir. Costs of undeveloped oil and gas leaseholds are capitalized and amortized over the estimated average holding period.
Earnings per Share Earnings per share are based on the weighted average number of common and common equivalent shares outstanding in each period (in 1976 - 16,743,000 and in 1975 --
16,547,000) . . Common equivalent shares consist of the effect of the potential dilution from exercise of stock options and the weighted average of outstanding preferred shares, assuming conversion to common shares.
Earnings
The company's consolidated net earnings for 1976 were $64,880,000, an increase of 37% over the 1975 net earnings of $47,411,000. On a per-share basis, earnings were $3.88 per share in 1976, which compares with $2.87 in 1975.
Net Earnings in millions of dollars
64
48
32
1972 7; 74 75 76
Shareholders' Equity
Shareholders' equity rose to an all-time high of $300,812,000. After giving effect to the preferred stock liquidation preferences, shareholder's equity per common share was $16.14.
Accounts and Notes Receivable
Accounts and notes receivable at October31,
1976 and 1975, includes $8,000,000 and $8,200,000, respectively, for amounts billed on projects which will not be collected until the projects are completed. Substantially all of these amounts will be collected in 1977.
Capital Expenditures
Capital expenditures amounted to $116,869,000 in 1976, compared with $93,137,000 in 1975. The principal expenditures in 1976 were for: drilling and marine equipment, $21,900,000; construction of office buildings and warehouses, $42,000,000; machinery and equipment, $29,000,000; and domestic and foreign oil projects, $18,000,000.
Credit Arrangements
The company has lines of credit with 20 banks from which the company may borrow, on a short-term basis, up to a maximum of $48,800,000 at any one time. Borrowings under these lines of credit would bear interest at the prime rate for domestic borrowings and up to 3/4% above the London Eurodollar Interbank rate for foreign borrowings. During both '976 and 1975, borrowings under these lines of credit were not material.
ShareholderTiquityper common share in dollars
a
12
-,e4mMIRIPRIPPPIMIPP.m.PIPIPPI
1111similifillig' 73 -74

Income Taxes
Income taxes in the consolidated statement of earnings are composed of :
State 1976 Federal Foreign and Local Total
Current tax expense 556,940,000 826,090,000 $4,515,000 S475545,000 Deferred tax expense 33,103,000 (7,548,000) 25,955,000
$50,043,000 $58,942,000 $4,555,000 $73,500,000
2975
Current tax expense $27,895,000 $14,022,000 $3,080,000 $345997,000 Deferred tax expense 17,492,000 (6o,000) 17,432,000
$35,387,000 $13,962,000 $3,080,000 $52,429,000
A reconciliation of income tax expense to the statutory federal income tax rate is as follows:
1976 % 1975 %
Statutory federal tax expense $66,422,000 48.0 $47,923,000 48.0 Increases (reductions) in taxes
resulting from: Foreign oil and gas
operations 5,346,000 3.9 6,036,000 6.o
Investment tax credit (2,603,000) (1.9) (4,508,000) (4.5) Other 4,335,000 3.1 2,978,000 3.0
$73,500,000 53.1 $52,429,000 52.5
Deferred income taxes have been provided for the timing differences described earlier, as follows:
5976 1975
Use of different methods of accounting for contracts for tax purposes, versus financial-reporting purposes $30,360,000 $14,883,000
Other timing differences which are individually Jess than 5% of the statutory federal income tax expense (4,405,000) 2,549,000
$25,955,000 $17,432,000
The balance of current deferred income taxes is estimated to become payable as follows:
1978 1979
1980
Thereafter
Stock Options
At October 31, 1976, various officers and key employees held options granted under the 197' Fluor Stock Option Pla.n (The Plan) to purchase 571,095 shares of common stock at prices ranging from $12.90 to $42.19 per share with a weighted average price of $25.63. The Plan, as approved by the shareholders, provides for grants of qualified and nonqualified options at prices equal to fair market value at date of grant. The options are generally exercisable one year after issuance and expire five years after date of grant for qualified options, or io yea.rs after date of grant for nonqualified options. In accordance with the terms of The Plan, certain holders of nonqualified options have the right to receive the excess of the market value of the shares exercisable over the aggregate option price thereof in cash or stock in lieu of exercising their options. Total outstanding nonqualified options of 125,610 shares at an average price of $27.00 issued between October 31, 1973, and December 9, 1974, have such rights. For such shares and for any future issuance of similar nonqualified options, changes in the market value over the option price are accounted for currently as compensation { ($4.17,000) in 1976 and $1,829,000 in 19751. Under The Plan, 1,097,506 shares were authorized for grant
$47,779,000 22,407,000
5,985,000 1,762,000
$77,933,000
and 45,935 were available for grant at October 31, 1976. Fiscal 1976 transactions are summarized as follows:
Balance, November a, 5975 Exercised Expired Granted, first exercisable in fiscal 1977
Balance October 31, 1976
Exercisable at October 31, 1976
Preferred Stock
Each Series B Preferred share is entitled to one vote, is cumulative as to dividends, and is convertible into 2.4 shares of common stock, for which 1,298,995 shares of common stock have been reserved. Annual dividends of $3.00 per share have been paid or declared to September 30, 1976. Each share is redeemable at the discretion of the company at $103 a share, plus accrued dividends. Upon liquidation, preferred shareholders are entitled to $ioo per share plus accrued dividends which are payable out of capital or surplus of any nature.
Employees' Benefits
The company and its subsidiaries have a noncontributory profit-sharing plan, a savings investment plan, and formal incentive compensation plans. The aggregate contributions to these plans in 1976 and 1975 charged to operations were $30,139,000 and $24,144,000, respectively.
Shares
765,953 (296,358)
(52,400) 113,900
571,095
469,595
Lease Obligations
Total rental expense in 1976 amounted to $20,344,000 ($13,860,000 in 1975). At October 31, 1976, the Company was obligated under noncancellable leases for minimum rentals subsequent to 1976 as follows:
Real Personal Property Property
1977 $ 7,951,000 $2,348,000
1978 7,43f ,000 5,970,000
1979 6,675,000 5,557,000
1980 4,675,000 120,000
1981 3,822,000 1,110,000
1982-5986 16,532,000 547,000
1987-5992 6,683,000 329,000
1992-1996 3,256,000
Remaining Years 350,000 35o,000
There were no material non-ca.pitalized financing leases.
Contingencies and Commitments
The company is contingently liable for commitments and performance guarantees arising in the ordinary course of business. Claims arising from engineering and construction contracts have been made against the company by clients, and the company has made certain claims against clients for costs incurred in excess of contract coverage. The company's consolidated federal income tax returns and certain state and foreign tax returns of subsidiaries for the years 1964 through 1974 have been or are
22. 2

currently being examined by the respective tax authorities. Certain deficiencies have been asserted which the company is contesting. In the opinion of management, the outcome of the claims and the contested deficiencies will not have a material effect on the company's consolidated financial position or results of operations.
Fluor has committed itself to purchase '0% of the $202,000,000 equity of Peabody Holding Company, which has committed itself to purchase all of the outstanding stock of Peabody Coal Company for a price of $1.i billion, principal amount, after divestment of its principal Australian assets, subject to Federal Trade Commission approval. In addition, Fluor expects to be contingently liable for $25,000,000 in the form of a stock subscription agreement designed to provide Fluor's share of certain guarantees to Peabody Holding Company's lenders.
The company is currently constructing office buildings with estimated costs to complete at October 31, 1976, of approximately $27,000,000.
Report of Certified Public Accountants
Board of Directors and Shareholders Fluor Corporation
IFe have examined the accompanying consolidated balance sheets of Fluor Corporation at October 31, 1976 and 1975 and the related consolidated statements of earnings, shareholders' equity and changes in financial position for the years then ended. Our examination was made in accordance with generally accepted auditing standards, and accordingly included such tests of the accounting records and such other auditing procedures as we considered necessary in the circumstances.
In our opinion, the statements mentioned above present fairly the consolidated financial position of Fluor Corporation at October 31, 1976 and 1975 and the consolidated results of operations and changes in financial position for the years then ended, in conformity
with generally accepted accounting principles applied on a consistent basis during the period.
62--tew 26%-r7-Los Angeles, California
December 8, 1976
Fluor Corporation Consolidated Statement of Earnings
Years ended October 31, 1976 and 1975 1976 1975
Revenues $1,801,761,000 $1,325,423,000
Costs and Expenses Cost of revenues 1,650,822,000 1,211,402,000 Corporate administrative and general expenses 18,802,000 19,392,000 Interest income net (6,243,000) (5,211,000)
Total costs and expenses 1,663,381,000 1,225,583,000
Earnings before Income Taxes 138,380,000 99,840,000
lnconze Taxes 73,500,000 52,429,000
Net Earnings $ 64,880,000 47,411,000
Earnings per Share $3.88 $ 2 . 87
See Financial Review on pages zo, 21, 22, 23 and 24.
24. 25.
1975
Fluor Corporation Consolidated Balance Sheet
ASSETS October 31, 1976 and 1975
Current Assets Cash
Short-term investments at cost, which
approximates market Accounts and notes receivable Contract work in progress
Inventories Other current assets
Total current assets
Property, Plant and Land
Equipment-- ot cost Buildings and improvements Machinery and equipment Drilling and marine equipment Construction in progress
Less accumulated depreciation and amortization
Total property, plant and equipmentnet
Oil and Gas Propertiesat cost Less accumulated depletion and depreciation
Total oil and gas propertiesnet
Other Assets Excess of cost over net assets of acquired companies,
less accumulated amortization
Other
Total other assets
See Financial Review on pages 20, 21, 22, 23 and 24.
1976
$ 7,625,000
157,663,000 98,107,000
109,647,000 31,982,000 12,194,000
417,218,000.
16,450,000 92,839,000 73,328,000
103,722,000 42,244,000
328,583,000 81,009,000
247,574,000
62,797,000
- 37,260,000
25,537,000
15,040,000
16,128,000
31,168,000
$721,497,000
,975
$ 10,138,000
101,310,000 90,526,000 65,745,000 30,011,000
7,751,000
305,481,000
11,162,000 39,622,000 50,650,000
107,617,000 42,834,000
251,885,000
75,441,000
176,444,000
59,814,000 30,455,000
29,359,000
15,105,000 12,058,000
27,163,000
$538,447,000
LIABILITIES AND SHAREHOLDERS EQUITY
Current Liabilities Accounts payable
Advance billings on contracts Accrued liabilities
Current portion of long-term debt Income taxes currently payable
Deferred income taxes
Total current liabilities
Long-Term Debt Due After One Y ear
Other Noncurrent Liabilities Deferred income taxes Other
Total other noncurrent liabilities
Contingencies and Conzmitments
Shareholders' Equity
541,248 shares (liquidation preference $54,125,000) and in 1975 554,219 shares
(liquidation preference $55,422,000) Common authorized 40,000,000 shares of $.621/2
par value; issued and outstanding in 1976 15,286,429 shares and in 1975 14,988,132 shares
Additional capital Retained earnings
Capital stock Preferred authorized 1,000,000 shares
without par value Series B issued and outstanding in 1976
Total shareholders' equity
1976
$ 93,997,00o 122,935,000
73,144,000 1,532,000
24,871,000 77,933,000
394,412,000
4,056,000
9,235,000 12,982,000
22,217,000
548,000
9,554,000 120,387,000
170,323,000
300,812,000
$721,497,000
$ 66,050,000 69,082,000 58,089,000
1,395,000
24,895,000
49,590,000
269,101,000
4,242,000
11,623,000
9,162,000
20,785,000
567,000
9,368,000 r6,636,000
117,748,000
244,319,000
$538,447,000
26. 27.

Fluor Corporation
Consolidated Statement of Shareholders' Equity Fluor CoToration
Consolidated Statement of Changes in Financial Position
Years ended October 31, 1976 and 1975 Years ended October 31, 1976 and 1975
See Financial Review on pages 20, 21, 22, 23 and 24.
Balances at November 1, 1974 Net earnings Cash dividends on preferred (83.00 per share) Cash dividends on common ($.35 per share) Conversion of preferred shares into common
and cash in lieu of fractional shares Exercise of stock options
Balances at October 31, 1975 Net earnings Cash dividends on preferred ($3.00 per share) Cash dividends on common ($.70 per share) Conversion of preferred shares into common Exercise of stock options
Balances at October 31, 1976
Series B Preferred Stock
$663,000
(96,000)
567,000
( 19,000)
8548,000
Con-non Stock
$9,203,000
96,000 69,000
9,368,000
19,000
167,000
$9,554,000
Additional Capital
8115,184,000
(3,000) 1,455,000
116,636,000
3,751,000
120,387,000
Retained Earnings
$ 77,327,000 47,411,000 (1,803,000) (5,187,000)
117,748,000 64,880,000 (1,639,000)
(10,666,00o )
$170,323,000
Sources of Funds
Dispositions of Funds
Net earnings
Charges (credits) to earnings not affecting funds: Depreciation, depletion, amortization and
dry-hole write-offs
Decrease in noncurrent deferred income taxes
Funds provided from operations Exercise of stock options
Net book value of property, plant and equipment and other assets sold or retired
Increase in other noncurrent liabilities
Additions to property, plant and equipment Additions to oil and gas properties Reduction of long-term debt Cash dividends paid on preferred stock Cash dividends paid on common stock Other
Decrease in Funds
Clianges in Current Assets and Current Liabilities
Current assetsincrease (decrease) Cash
Short-term investments
Accounts and notes receivable
Contract work in progress Inventories
Other current assets
Current liabilities(increase) decrease Accounts payable
Advance billings on contracts Accrued liabilities Current portion of long-term debt Income taxes currently payable
Deferred income taxes
Decrease in Funds
See Financial Review on pages 20, 21, 22, 23 and 24.
1976 1975
$ 64,880,000 $ 47,411,000
41,767,000 (2,388,000)
104,259,000 3,918,000
37,849,000
(169,000)
85,091,000 1,524,000
8,054,000
3,820,000 9,420,000 4,762,000
120,051,000 100,797,000
98,935,000 17,934,000
I 86,000
1,639,000
io,666,000 4,265,000
72,075,000 21,062,000
3,069,000 1,803,000 5,187,000
(1,418,000)
133,625,000 101,778,000
$(13,574,000) $ (981,000)
$ (2,513,000) 56,353,000
7,581,000 43,902,000
1,971,000
4,443,000
111,737,000
$ (2,925,000) 52,012,000
7,084,000 21,017,000
5,801,000 (1,254,000)
81,735,000
(27,947,000) (53,853,000) (15,055,000)
(137,000) 24,000
(28,343,000)
(125,311,000)
) (11,926,000) (15,709,000) (20,784,000)
(10,000) (16,686,000) (17,601,000)
(82,716,000)
$ (13,574,000)) $ (981,000)
28. 29.

Fluor Corporation
Five-Year Summary of Consolidated Operations Management's Discussion and Analysis of the Summary of Consolidated Operations
Dollar and share amounts are in thousands, except per share amounts 1976
Revenues $1,801,761
Costs and expenses
Cost of revenues 1,650,822 Corporate administrative and general expenses 18,802 Other (income) and expenses:
Interest on indebtedness 2,180 Interest income (8,423) Provision for estimated losses on planned
disposition of assets
Total other (income) and expenses (6,243)
Total cost and expenses - 1,663,381
Earnings before income taxes 138,380
Total income taxes 73,500
Net earnings $ 64,880
Earnings per share $ 3.88
Dividends per share Series B Preferred 3.00 Common .70
Shares of stock used to calculate earnings per share 16,743
Earnings per share have been adjusted for 5% stock dividends in 1972 and 1973 and the 3-for-2 stock split in 1974.
1975
$1,325,423
1,211,402
19,392
1,354 (6,565)
(5,211)
1,225,583
99,840
52,429
5 47,411
$ 2.87
3.00
-35
16,547
1974
$801,322
726,937
14,881
1,671
(7,089)
400
(5,018)
736,800
64,522
31,277
$ 33,245
$ 2.11
$ 3.00
$ .15
15,422
1973
$423,520
387,298 9,867
2,292
(2,680)
2,500
2,112
399,277
24,243
12,936
$ 11,307
$ .69
$ 3.00 5% Stock
14,557
1972
$412,740
389,538 8,192
2,184
(1,053)
1,131
398,861
13,879
6,036
$ 7,843
$ .45
5 3.00
5% Stock
14,370
1976 compared with 1975
From the record levels achieved in 1975, revenues increased $476,338,000, or 36%. This increase was principally due to Fluor Engineers and Constructors, Inc., our largest subsidiary, and reflects higher level of activities at major jobsites around the world, primarily in Iran and Saudi Arabia. This increase more than offset decreases in revenues of our other engineering and construction companies and drilling services. Our supply-service companies also experienced a decrease in revenues resulting from a return to more normal competitive conditions from those experienced in 1974 and 1975. Revenues also increased within our oil and gas operations as a result of increases in both volume and the price of U.S. natural gas.
Cost of revenues increased $439420,000, or 36%, primarily as a result of increased activities at major engineering and construction jobsite locations.
Corporate administrative and general expenses decreased $590,000, or 3%. This decrease reflects the effect of the provision for estimated compensation expense related to certain stock options issued under our stock option plan approved by the shareholders on March 13, 1972. In 1975, this item increased administrative and general expenses by $1,829,000; whereas, in 1976, it decreased administrative and general expenses by $417,000. This item is subject to the fluctuations in the market price of Fluor common stock. This reduction in expense in 1976 was offset by general increases in the cost of doing business principally an increase of $1,882,000 related to salaries and employee benefits.
Interest income increased $1,858,000, or 28%, primarily due to increases in cash available for short-term investments.
Earnings before income taxes increased $38,540,000, or 39%. This increase results from the increased levels of activities within engineering and construction, as well as oil and gas; however, decreases within our drilling services and supply services companies reduced the impact of our engineering and construction operations.
The provision for income taxes in the Consolidated Statement of Earnings increased as a percentage of earnings before taxes from 52.5% to 53.1%, largely due to a reduction in investment tax credits for 1976, as compared with those for 1975. This increase, however, was partially offset by decreased foreign oil and gas costs. The U.S. tax benefit from such costs was severely limited by the Tax Reduction Act of 1975.
1975 compared with 1974
Fluor's net earnings and level of operations rose to all-time highs in 2975. Revenues in 1975 increased $524,101,000, or 65%, over the levels achieved in 1974. The increase was due primarily to increased activity in the engineering and construction subsidiaries, primarily the work associated with the Trans-Alaskan Pipeline System. To a lesser extent, the drilling subsidiary and the supply subsidiaries also contributed to this increase.
Cost of revenues increased $484,465,000, or 67%, during the period as a result of increased construction activity, along with higher costs associated with the expanded drilling and supply operations.
Corporate administrative and general expenses increased $4,511,000, or 30%, during the period due to the general increase in business activity and a provision for contingent compensation expense related to certain stock options issued under the stock option plan approved by the shareholders on March 13, 1972.
Interest on indebtedness decreased by $317,000, Or 19%, primarily due to reductions in long-term debt. Interest income decreased $524,000, or 7%, primarily due to decreases in interest rates during the year.
Provision for income taxes as a percentage of earnings before taxes increased from 48.5% to 52.5%, principally to reflect the limitation imposed by the Tax Reduction Act of 1975 on U.S. tax benefits from foreign oil operations.
30. 31.

Fluor Corporation
Operations by Lines of Business
Dollar amounts are in thousands
Revenues Engineering and construction
Process-plant Mining/metals
'Power-plant Offshore
Drilling services Supply services
Oil and gas operations Other Intergroup revenues
Earnings Before Income Taxes and Corporate Charges Engineering and construction
Process-plant
Mining/metals Power-plant Offshore
Drilling services Supply services
Oil and gas operations
Other
Revenues have been changed from prior periods to reflect intergroup revenues.
1976
$1,499,221 83,895 18,425
16,556
50,590 115,566 33,552
.4,668 (20,352)
$1,801,761
$ 125,508 3,628
(42) 917
12,262
9,982 3,769 1,158
$ 157,182
2975
$ 968,665 127,899
24,874 14,281
57,160
120,495
24,225 7,575
(19,351)
$1,325,423
73,306 9,323
(8o8)
1,244 18,444 16,845
(1,481) 2,359
$ 119,232
1974
$510,123
112,870 7,503
20,703
35,835 111,685
'7,493 4,865
(19,755)
$801,322
$ 39,916 5,967
(796) 1,220
10,369
17,636
2,186 2,905
$ 79,403
1973
$215,178 88,386
21,537 32,227
64,749 4,412 2,636
(5,605)
$423,520
$ 23,582
55 -
1,102
8,396 5,214
218
(4,45-7)
$ 34,110
1972
$243,186 62,272
25,349 27,145
51,335 3,604
3,154
(3,305)
$412,740
$ 14,820 1,390
--(2,391)
7,275
3,292
835
(3,150)
$ 22,071
Fluor Corporation
Five-Year Financial Highlights
Dollar amounts are in thousands, except per share amounts 1976 2975
Financial Position Current assets 417,218 $ 305,485 Current liabilities (394,412) (269,101) Property, plant and equipment-net Oil gas properties-net&
247,574 25,537
176,444
29,359 Other assets 31,168 27,163 Noncurrent liabilities (22,257) (20,785)
Total $ 304,868 $ 248,561
Equity and Capitalization Long-term debt $ 4,056 $ 4,242 Shareholders equity 300,812 244,319
Total capitalization $ 304,868 $ 248,561
Shares Outstanding Series B Preferred 541,248 554,219 Common 15,286,429 '4,988,132
Depreciation, Depletion, Amortization and Dry-Hole Writeoffs $ 41,767 $ 37,849
Funds Provided From Operations 104,259 85,091
New Orders Received DuringY Year 3,210,551 6,925,180
Backlog at End of Y ear $ 8,751,256 $ 9,088,298
Statistics
Percent of total capitalization Long-term debt 1.3 1.7
Shareholders' equity 98.7 98.3 Shareholders' equity per comrnon share $ 16.14 $ 12.60 Percent of net earnings to average equity 23.8 21.0 Number of employees 16,305 16,289
Shareholders' equity per common share assumes payment of the liquidation preference of preferred sitares.
1974
$ 223,746
(586,385) 529,048
30,578
28,893
(16,192)
$ 209,688
$ 7,311 202,377
$ 209,688
617,909
14,724,882
$ 24,784
59,759
3,909,683
$ 4,446,070
3.5 96.5
$ 9.55 18.1
12,729
2973
$ 148,238
(92,809) 85,304 19,595
19,570
(12,989)
$ 566,509
$ 8,549 157,960
$ 166,509
432,336 14,588,616
$ 18,020
29,696
1,134,888
$ 1,382,813
5.1
94.9 $ 7.86
7.4 8,267
1972
$ 90,900 (60,362) 106,130
15,579 19,264
(14,015)
$ '57,496
9,874 547,622
$ 157,496
440,569 14,544,051
$ 18,151
24,479
675,562
$ 697,659
6.3
93.7 $ 7.12
5.4 6,264
32. 33.

'Principal Subsidiaries and Divisions
Engineering and Construction Services: Fluor Arabia Limited' Dhahran AirportPETROLEUM, PETROCHEMICAL AND
CHEMICAL FACILITIES: Dhahran, Saudi Arabia Vice Chairman: Robert E. Harrigan
Fluor Engineers and Constructors, Inc. 2500 South Atlantic Boulevard Fluor Iran Los Angeles, California 90040 144 Bozorgmehr Avenue President: David S. Tappan, Jr. Tehran, Iran
Managing Director:Southern California Division Richard C. Lee 3333 Michelson Drive Irvine, California 92715 Fluor South Africa (Pty.) Limited Senior Vice President: P.O. Box 505
William I. McKay Springs, Transvaal 156o Republic of South Africa
Houston Division Managing Director:
4620 North Braeswood Richard A. Flinton
Houston, Texas 77035 Senior Vice President: MINING AND MINERALS FACILITIES:
Ernest Moncrief Fluor Utah, Inc. 177 Bovet Road
Fluor Europe, Inc. San Mateo, California 94402
II Stanhope Gate President: James L. Tathwell
London, WIYLB, England President: Harold W. Sorensen 1V estern Hemisphere Division:
Fluor Utah, Inc.Fluor (England) Limited
177 Bovet Road26 Finsbury Square
San Mateo, California 94402London, EC2A IEB, England
Executive Vice President:,Managing Director:
Luther W. Garrett, Jr.Thomas S. Arkell
Australasia Division:Fluor Nederland By.
Fluor Australia Pty. LimitedEuropaweg
201-217 Fitzroy StreetHaarlem, The Netherlands
St. Kilda, Victoria, AustraliaManaging Director:
Chairman of the Board:Ronald Olivier
Daniel W. Dailey Fluor GmbH Managing Director: John J. Cinque 4000 Dusseldorf-Nord 30
MARINE AND OFFSHORE FACILITIES: VEBA-HAUS
Fluor Ocean Services, Inc.3 6200 Hillcroft Avenue
Karl-Arnold-Platz West Germany
Houston, Texas 77036Managing Director: President: Pat H. Moore
Frederick C. Brunner ELECTRIC POWER GENERATING FACILITIES',Fluor Canada Lid. Fluor Pioneer Inc.
6712 Fisher Street, S.E. zoo West Monroe Street
Calgary, Alberta. T2H 2A7 Canada Chicago, Illinois 60606
Vice President and General Manager: President: James L. Tathwell
Prescott E. Nickerson Executive Vice President
Patrick.A. Randolph
Contract Drilling Services
Fluor Drilling Services, Inc, 1901 East 4th Street Santa Ana, California 92705 President: Ross A. McClintock Vice President: Edgar D. Turner
Western Offshore Drilling and Exploration Co. 1901 East 4th Street Santa Ana, California 92705 Vice President: James H. Dunn
Coral Drilling Division 1010 De Montluzin Building 234 Loyola Avenue New Orleans, Louisiana 70112 Vice President: John P. Carpenter
Supply Services:
The Republic Supply Company of California 20101 South Santa Fe Avenue Compton, California 90221 President: Edward A. Law, Jr.
Kilsby T abesup ply Company 9500 Telstar Avenue El Monte, California 91731 President: John K. Pike
Oil and Gas Operations:
Fluor Oil and Gas Corporation 1600 Broadway Denver, Colorado 80202 President: Joseph S. Bowman
'Deepwater Production Systems:
Deep Oil Technology, 111C . 5280 Windham Avenue Long Beach, California 90802 President: Edward E. Horton
0
Shareholder Reference ,
Registrars and Transfer Agents
Security Pacific National Bank 333 South Hope Street, Los Angeles, California 90017
The Chase Manhattan Bank One New York Plaza, New York, New York '00'5
The Northern Trust Company Fifty South LaSalle Street, Chicago, Illinois 60675
Auditors
Arthur Young & Company 515 South Flower Street, Los Angeles, California 90071
Annual Shareholders' Meeting
Fluor's annual meeting of shareholders Will be held at 9:30 a.m. on March 14, 1977, at the Fluor Engineers and Constructors' Southern California Division Headquarters at 3333 Michelson Drive, Irvine, California 92715, with notice being' mailed to all shareholders on February 9, 1977.
Fluor Stock
Stock symbol FLR.
Stock Price and Dividend Data for Fiscal 1976-1975
Principal Market:
Common StockNew York Stock Exchange ,Preferred StockNew York Stock Exchange
. _ Common Preferred_ 1976 High Low Dividend High Low Dividend
First Quarter 381/2 321/2 $ .15 923/4, 8o $ .75 Second Quarter 373/4 301/8 .i5 91 723/4 .75 Third Quarter 431/4 323/4 ..2.0 104 781/2 .75 Fourth Quarter 451/s 35 , 20 I o8¼ 85 .75
$ .70 $3.00
1975
First Quarter 291/4 15 $ .o5 68 54 $$ .75 Second Quarter 321/8 171/2 .10 79 57 .75 Third Quarter 293/4 .io. 1151/2 7649 .75 Fourth Quarter 431A 35 .10 ioi. 87 .75
.$ .35 $3.do
if
34,

Form 10-K
A copy of the detailed Form Io-K annual report, which is filed with the Securities and Exchange Commission, is available upon request. Write to:
Corporate Controller Fluor Corporation 2500 South Atlantic Boulevard Los Angeles, California 90040.
36.
I
E.:
ro
fi
A
TA:
e
I/
ssi
*FLUOR CORPORATION 2500 South Atlantic Boulevard, Los Angeles, 'California 90040


