R Wester: Kinematically complete chemical reaction
10
Journal of Physics: Conference Series OPEN ACCESS Kinematically complete chemical reaction dynamics To cite this article: S Trippel et al 2009 J. Phys.: Conf. Ser. 194 012046 View the article online for updates and enhancements. You may also like Design of an Active Bumper with a Series Elastic Actuator for Pedestrian Protection of Small Unmanned Vehicles Narukawa Terumasa, Tsuge Tomoki, Yamamoto Hiroshi et al. - Comparing Charge Transport Predictions for a Ternary Electrolyte Using the Maxwell–Stefan and Nernst–Planck Equations S. T.P. Psaltis and T. W. Farrell - Capillary condensation in an active bath M. Kneževi and H. Stark - Recent citations Fifty years of nucleophilic substitution in the gas phase Roland Wester - A velocity map imaging apparatus optimised for high-resolution crossed molecular beam experiments Vikram Plomp et al - Unexpected Indirect Dynamics in Base- Induced Elimination Jennifer Meyer et al - This content was downloaded from IP address 222.100.81.233 on 15/01/2022 at 19:49
Transcript of R Wester: Kinematically complete chemical reaction

Journal of Physics Conference Series
OPEN ACCESS
Kinematically complete chemical reactiondynamicsTo cite this article S Trippel et al 2009 J Phys Conf Ser 194 012046
View the article online for updates and enhancements
You may also likeDesign of an Active Bumper with a SeriesElastic Actuator for Pedestrian Protectionof Small Unmanned VehiclesNarukawa Terumasa Tsuge TomokiYamamoto Hiroshi et al
-
Comparing Charge Transport Predictionsfor a Ternary Electrolyte Using theMaxwellndashStefan and NernstndashPlanckEquationsS TP Psaltis and T W Farrell
-
Capillary condensation in an active bathM Kneževi and H Stark
-
Recent citationsFifty years of nucleophilic substitution inthe gas phaseRoland Wester
-
A velocity map imaging apparatusoptimised for high-resolution crossedmolecular beam experimentsVikram Plomp et al
-
Unexpected Indirect Dynamics in Base-Induced EliminationJennifer Meyer et al
-
This content was downloaded from IP address 22210081233 on 15012022 at 1949
Kinematically complete chemical reaction dynamics
S Trippela M Steia R Ottoa P Hlavenkaa J Mikoscha1 C Eichhorna
U Lourderajb J X Zhangb W L Haseb M Weidemullera2 R Westera
a Physikalisches Institut Albert-Ludwigs-Universitat Freiburg Hermann-Herder-Str 3 79104Freiburg Germanyb Department of Chemistry and Biochemistry Texas Tech University (TTU) Lubbock TX79409 USA
E-mail rolandwesterphysikuni-freiburgde
Abstract Kinematically complete studies of molecular reactions offer an unprecedented levelof insight into the dynamics and the different mechanisms by which chemical reactions occurWe have developed a scheme to study ion-molecule reactions by velocity map imaging at verylow collision energies Results for the elementary nucleophilic substitution (SN2) reaction Clminus
+ CH3I rarr ClCH3 + Iminus are presented and compared to high-level direct dynamics trajectorycalculations Furthermore an improved design of the crossed-beam imaging spectrometer withfull three-dimensional measurement capabilities is discussed and characterization measurementsusing photoionization of NH3 and photodissociation of CH3I are presented
1 Introduction
Collisions of atoms and molecules with well-defined momentum vectors and angle- and energy-resolved detection have been used for many years to obtain a wealth of information on thereaction dynamics of neutral molecules [1 2 3 4] To study ion-molecule reactions at low energywith high resolution we have developed a crossed-beam imaging spectrometer that allows usto measure these reactions in a kinematically complete way [5] It is based on the technique ofvelocity map imaging [6] which projects ions with the same transverse velocity vector onto thesame spot on the detector surface
For comparison with neutral-neutral scattering it is instructive to calculate the scattering ratefor ion-molecule reactions in crossed beams The probability that an ion traversing a molecularbeam undergoes scattering is given by
pscatt = kndvrel (1)
where d is the path length of the ion through the molecular beam and vrel is the relativevelocity between the ion and the neutral The ion-molecule reaction rate coefficients k is aboutfew times 10minus10 cm3s and the target density n is typically 1012 cmminus3 For d = 1 mm andvrel = 3000 ms one obtains a scattering probability of 3times10minus5 For a typical value of 104 ionsper ion pulse one obtains a 30 probability for a reactive event per pulsed beam intersection
1 present address National Research Council Canada 100 Sussex Drive OttawaON K1A 0R6 Canada2 present address Physikalisches Institut Universitat Heidelberg Philosophenweg 12 69120 HeidelbergGermany
XXVI International Conference on Photonic Electronic and Atomic Collisions IOP PublishingJournal of Physics Conference Series 194 (2009) 012046 doi1010881742-65961941012046
ccopy 2009 IOP Publishing Ltd 1
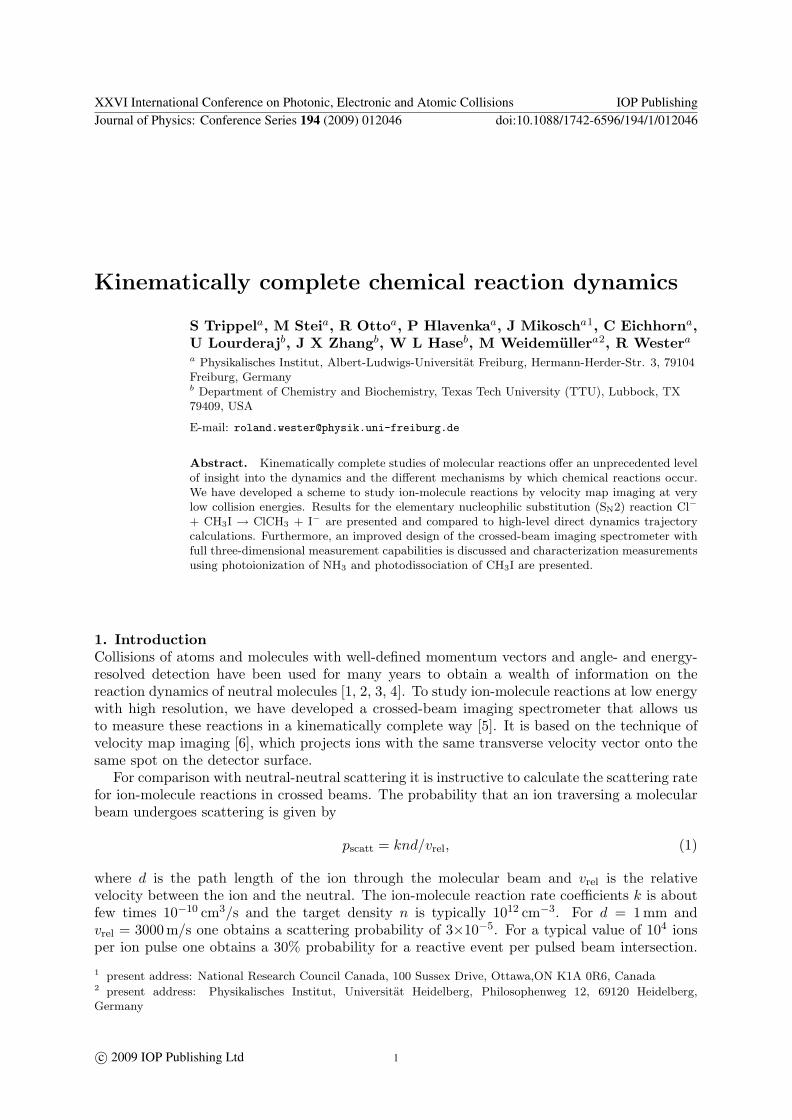
Figure 1 Potential energy of the SN2-reaction of Clminus with CH3I along the reaction coordinate(taken from Ref [8])
For a typical repetition rate of 10 Hz this leads to an event rate of a few events per second Forsmall relative velocities the rate may increase beyond 10 per second and for low reaction ratecoefficients it may be as small as 01 per second With this small event rate it is advantageousthat a velocity map imaging spectrometer has an effective solid angle of almost 4π and thatposition sensitive detectors can measure ion impact positions with above 50 detection efficiencyFurthermore the intrinsic noise of an imaging spectrometer can be smaller than 01 noise eventsper second which provides a significantly large dynamic range in the reaction rate for a varietyof experiments
Using our ion-molecule crossed beam imaging spectrometer we have studied the cation-neutralreaction of Ar+ + N2 and found interesting dynamics [5 7] More recently we have studied theanion-molecule reaction Clminus + CH3I [8] Details of this experiment will be presented in the nextsection Recently we have improved the electric field design of our crossed-beam spectrometerand we have integrated a time-of-flight measurement and thereby set up a full three-dimensionalvelocity vector measurement These improvements have been characterized with photoionizationimaging of NH3 and with photodissociation imaging of CH3I This is presented in section 3
2 Crossed beam imaging of a nucleophilic substitution reaction
A model system for a polyatomic chemical reaction that shows already many of the emergingproperties of complex reactions is the nucleophilic substitution (SN2) reaction
Xminus + CH3Y rarr XCH3 + Yminus (2)
Here Xminus is the approaching nucleophile that forms a bond with the central carbon atom Asa consequence a leaving group Yminus is removed from the molecule In the simplest realizationsXminus and Yminus are halogen anions but they could also represent polyatomic molecular anionsSN2-reactions are important in chemical synthesis because they allow the replacement of onemolecular group with another one This can be used to synthesize large organic molecules Alsoliving cells make use of SN2-reactions
According to the sum formula of Eq (2) the hydrogen atoms are not affected during thisreaction It turns out however that the reaction inverts the ldquoumbrellardquo of the three hydrogenatoms in order to establish a near-tetraedric structure of the product molecule Thus thecoupling of the hydrogen degrees of freedom to the halogen motion is important for the reactiondynamics
XXVI International Conference on Photonic Electronic and Atomic Collisions IOP PublishingJournal of Physics Conference Series 194 (2009) 012046 doi1010881742-65961941012046
2
Figure 2 Measured initial velocity distributions of the Clminus and CH3I reactant beams inthe laboratory frame of reference The solid arrows denote the average beam velocities in thelaboratory frame From them the center of mass velocity (white solid arrow) and the reactantvelocities in the center of mass frame are calculated (dashed arrows) In this Newton diagramthe velocity vector of the Iminus reaction product lies by conservation of energy and momentumwithin the dotted circle
We have selected the elementary SN2-reaction with Xminus being a chlorine anion that reactswith methyl iodide CH3I for the experimental investigation with our crossed-beam spectrometer[8] The potential energy curve for this reaction along the reaction coordinate is depicted in Fig1 Characteristic of this and other anion-molecule reactions are the two relatively deep potentialminima separated by an intermediate barrier In the reaction studied here this barrier liessubmerged below the energy of the reactants Nevertheless it strongly influences the reactivityin that the reaction occurs at only 10 of the Langevin or capture rate
Details of the experimental setup have been described already previously [5] In thisexperiment a pulsed beam of Clminus is formed by co-expanding CCl4 gas and argon in a supersonicbeam that is passed into vacuum by a piezo-electric valve [9] Electron impact ionizes the gasand efficiently allows slow secondary electrons to dissociatively attach to CCl4 and produce Clminus
and CCl3 radicals This delivers packets of about 104 ions with a tunable kinetic energy inthe range from 05 eV up to several electronvolts The typical energy spread amounts to 02 eV(FWHM) The slow Clminus ions are brought to collision with a supersonic beam of the CH3I targetwhich is prepared in a pulsed supersonic beam of CH3I in helium using a second piezo-actuatedpulsed valve
The CH3I velocity distribution is directly measured by ionizing the molecules in collisionswith 1 keV electrons and then imaging the CH3I
+ ions onto the position sensitive detector Theimpact position of an ion on the imaging detector is linearly transformed into the ionrsquos transversevelocity [5] The momentum transfer during ionization is only a small correction to the initialbeam velocity and is neglected The resulting distribution is shown on the left side of Fig 2The velocity origin is calibrated by imaging an isotropic thermal cloud of argon or xenon andmeasuring its center of gravity
The Clminus velocities are measured in a similar way but operating the imaging spectrometerwith opposite polarity The imaging electrodes are pulsed on when the ions are in the interactionvolume The neutral target beam is deactivated The resulting distribution is depicted on theright side of Fig 2 The figure also shows the full Newton diagram of the reaction kinematicsthe reactant velocities in the center of mass frame (dashed arrows) and the range of product Iminus
XXVI International Conference on Photonic Electronic and Atomic Collisions IOP PublishingJournal of Physics Conference Series 194 (2009) 012046 doi1010881742-65961941012046
3
Figure 3 Measured differential scattering cross section for the reaction of Clminus + CH3I givingClCH3 + Iminus Shown are two images at 039 and 19 eV relative collision energy of the Iminus velocityvector in the scattering plane obtained by velocity map slice imaging The largest circles showthe maximum product ion velocity based on the known total energy in the reaction system(taken from Ref [8])
velocities that are in accord with energy and momentum conservation (dashed arrow and circle)To observe reactive scattering both the ion and the neutral reactant beam are synchronously
activated with a repetition rate of 10 Hz A few microseconds after both beams have started tocross each other the high voltages of the velocity map imaging electrodes are pulsed on within afew tens of nanoseconds Then the Iminus product ions and the non-reacting Clminus ions are projectedonto the imaging detector To avoid saturating the detector with the chlorine reactants thedetector gain is electronically gated to the arrival time of the iodine mass In fact the time-window of the detector gain is reduced even further to accept only events where the reactivescattering occurs in the plane parallel to the detector which is referred to as slice imaging[10 11] In this way the recorded images directly reflect the differential scattering cross section
Two types of transformations need to be applied to the data First the transformation tothe center of mass frame is calculated for each scattering event which involves a translation anda rotation of the image parallel to the relative velocity vector Second the loss of fast movingreaction products needs to be corrected Product ions with high laboratory velocities have achance to leave the spectrometer volume that can be imaged onto the position-sensitive detectorTo correct for this an empirical function is used to provide events with large laboratory velocitieswith a larger weight than events with small velocities This correction function is independent ofthe scattering angle Furthermore the same correction function is used for all collision energies
The differential cross section images for two relative energies 039 eV and 19 eV are shownin Fig 3 [8] At the low energy an isotropic distribution of product velocities is observed This isindicating a long-lived intermediate complex that decays on the time scale of several rotationalperiods and thus looses the information of the direction of the incoming particles The measuredvelocity magnitudes are much smaller than the maximum velocity possible at this energy Thismaximum is indicated by the largest circle superimposed onto the distribution At 039 eVtherefore a large fraction about 84 of the available energy is partitioned into internal degreesof freedom of the ClCH3 product molecule This amount of internal energy can be explained by astatistical branching of the available energy over all product states [8] This is another indicationthat at this collision energy the specific properties of the initial state have no influence on thedynamics A very different behavior is observed at 19 eV relative energy Here the Iminus ionsscatter preferentially backward with respect to the direction of the incoming CH3I Also theirvelocity is found very near the maximum possible velocity This can be explained by a fast anddirect reaction mechanism where the Iminus leaves the reaction approximately co-linearly with theincoming Clminus anion
XXVI International Conference on Photonic Electronic and Atomic Collisions IOP PublishingJournal of Physics Conference Series 194 (2009) 012046 doi1010881742-65961941012046
4
Figure 4 Snapshots of two selected trajectories for the reaction Clminus + CH3I obtained withdirect dynamics calculations a) The direct nucleophilic substitution mechanism which is foundin about 90 of the trajectories b) The indirect roundabout mechanism where the CH3Imolecule undergoes a single rotation before the substitution occurs
In order to understand the details of the measured differential cross sections comparison withtheoretical calculation is essential However the theoretical description of polyatomic reactionsthat involve more than four atoms is very difficult The present reaction involves six atomsand therefore twelve internal degrees of freedom Such a large system can not be calculatedquantum mechanically and one has to resort to significant approximations These are eitherquantum scattering calculations in reduced dimensions (typically four) [12] or calculations thattreat the electronic structure quantum mechanically but propagate the nuclei classically on theBorn-Oppenheimer surface [13 14]
The latter approach was used to calculate the reaction dynamics of the Clminus + CH3I reactionat 19 eV relative collision energy The calculations were carried out using the approach ofldquodirect dynamicsrdquo [15] where at each point along the 12-dimensional trajectory the electroniceigenenergy and its gradient are calculated within the Born-Oppenheimer potential Thisinformation is then used to propagate the trajectory further This approach is numerically verydemanding but it circumvents the requirement of a global Born-Oppenheimer hypersurface Inthe present study the electronic structure was calculated at the MP2(fc)ECPaug-cc-pVDZ [8]level of theory
The calculated trajectories show that at 19 eV collision energy a direct reaction mechanismgoverns the nucleophilic substitution reaction This mechanism is depicted in the upper sequenceof Fig 4 The Clminus ion moves into the umbrella of the hydrogen atoms and forms a bond with thecentral carbon atom Roughly co-linearly to this motion the Iminus product ion is moving away afterthe three hydrogen atoms have inverted to form the ClCH3 product molecule This numericalresult corresponds directly to the back-scattering observed in the experiment
The trajectory calculations also revealed another reaction mechanism that occurs with about10 probability In this mechanism which is depicted in the lower panel of Fig 4 the CH3Ireactant undergoes a single 360 revolution about an axis perpendicular to the C-I bond Onlyafter this revolution the substitution occurs This mechanism which we named the ldquoroundaboutmechanismrdquo is found to go along with a large energy partitioning into internal degrees of freedomof the neutral product molecule Therefore the translational energy of the reaction products issmaller than for the direct mechanism This nicely agrees with the observed structures in themeasured differential cross sections at small Iminus velocity (see Fig 3b) which we attribute to theroundabout mechanism [8]
XXVI International Conference on Photonic Electronic and Atomic Collisions IOP PublishingJournal of Physics Conference Series 194 (2009) 012046 doi1010881742-65961941012046
5
Figure 5 View of the improved design of the electrostatic ion optics for velocity map imaging
3 Improved crossed beam ion imaging
31 Second generation imaging electrodes
In crossed-beam ion imaging a much larger interaction volume needs to be imaged onto theposition sensitive detector as compared to applications in photodissociation and photoionizationTo improve the resolution of the spectrometer under these conditions and to minimize theinfluence of stray fields from outside the spectrometer we have constructed a second generationconfiguration of the electric fields
The setup consists of six plates and the microchannel plate detector with phosphor screen andCCD camera The classical velocity map imaging detector consists of planar plates In contrastwe have changed the geometry of our electrodes in order to shield the interaction region fromelectric potentials which are applied to ion optics elements close to the stack We also addedrims on the upper surface of the electrodes [16] which we found in simulations to lead to animproved imaging resolution The shielding of the second electrode has 12 cylindrical holes forthe beams with a diameter of 10 mm In order to increase the interaction volume we use sixinstead of three field plates
Fig 5 shows a simulation of our new velocity map imaging stack carried out with SIMION[17] It shows ion trajectories of two pairs of ions starting in the same plane parallel to thedetector By choosing the correct combination of potentials on the electrodes the ions with thesame velocity vector are focused onto the same spot
To characterize the performance of the new spectrometer we have measured the velocityspread and the rotational spectrum of ammonia seeded in a supersonic expansion of argon outof the pulsed piezo valve We used the frequency doubled output of a NdYAG pumped tuneablepulsed dye laser in the range of 63760 to 63940 cmminus1 for (2+1) REMPI of Ammonia via thevibration-less C-state [18] The produced ions are imaged on the detector
The measured velocity distribution is shown in Fig 6a We find that the determined spreadcorresponds to an effective translational temperature of the NH3 molecules of below 1 K in thereference frame of the supersonic argon beam The rotational spectrum is recorded scanning the
XXVI International Conference on Photonic Electronic and Atomic Collisions IOP PublishingJournal of Physics Conference Series 194 (2009) 012046 doi1010881742-65961941012046
6
Figure 6 a) Measured velocity distribution for NH3 molecules seeded in a supersonic beamof argon obtained by 2+1 REMPI and subsequent velocity map imaging The translationaltemperature corresponds to below 1 K b) Rotationally-resolved spectrum of NH3 in the seededsupersonic beam The observation of only one rotational transition starting from the J=1 K=1state indicates a rotational temperature of at most 7 K
dye laser wavelength and measuring the integrated ion yield As shown in Fig 6b only a singleQ-branch transition persists that starts from the ground state J=1 K=1 of the ortho hyperfinemanifold (for the para ground state J=0 K=0 no Q-branch transition exists) According tosimulations of the rotationally resolved spectrum this measurement implies an upper bound onthe rotational temperature in the supersonic beam of about 7K This shows that the expansioncools very efficiently the translational and the rotational degrees of freedom Furthermoreblurring of the obtained image introduced by electric field inhomogeneities has to be smallerthan 3
32 Three-dimensional ion imaging
Two dimensional velocity map imaging brings along several shortcomings as usually the reactionproducts fly away in all 3 directions In order to retrieve information such as the kinetic energydistribution from the measured images a certain class of velocity components in one direction isselected and the other two components are displayed Usually the fixed component is the oneperpendicular to the detector and the produced slice is around its zero value
There are two methods to obtain slices through the three-dimensional product velocitydistributions using two-dimensional velocity map imaging The first method uses an inverseAbel transformation on the image integrated over the third velocity component (perpendicularto the detector surface) Several numerical algorithms have been developed for this purpose[19] The second method is the slicing technique [10 11] that we also applied in the SN2 reactivescattering experiment (see section 2)
Both methods describe the 3D product velocity distribution in 2D and rely on cylindricalsymmetry in the process under study In crossed-beam scattering experiments this is in principleoften the case as the scattering cross section for spherical reactants is cylindrically symmetricaround the relative velocity vector However the symmetry is quickly lost due to unsymmetricbroadenings induced by the distribution of reactant velocities The Abel inversion can thenno longer be used and instead forward reconstruction algorithms [5] or direct slicing is neededFurthermore if spatially aligned molecules are brought to collision the symmetry is directly lostThen the full 3D distribution has to be measured
A solution to this problem is to measure the time-of-flight of each ion in addition to its impactposition and deriving the full three-dimensional velocity distribution from these measurementsIn order to do this we have integrated a high-resolution time-of-flight detector into our velocitymap imaging spectrometer A photo-multiplier (Hamamatsu R7402-20 transition time spread230 ps risetime 780 ps) is used to detect the light pulses on the phosphor screen that are inducedby ion impacts on the microchannel plate detector After conversion to an electronic logic pulse
XXVI International Conference on Photonic Electronic and Atomic Collisions IOP PublishingJournal of Physics Conference Series 194 (2009) 012046 doi1010881742-65961941012046
7
with a constant fraction discriminator (Ortec 583) this signal is used as a stop signal for a time-to-digital converter (TDC ATMD GPX) The start trigger is provided by the pulse generator(Quantum Composers 9520 lt 200 ps jitter) that triggers the entire experiment In a testmeasurement with logic pulses replacing the photomultiplier signals the overall time resolutionof the electronics was measured to be 140 ps RMS Attention has to be paid to the correctassignment of the TDC data to the camera data as the data transmission from the camera tothe computer as well as the online image analysis are CPU time-consuming
This setup now allows 3D imaging if the event rate is smaller than the read-out rate of thecamera and TDC system which has been increased to 20 Hz Considering the typical reactionevent rates (see section 1) this is no significant limitation for the experiments For a firstcharacterization of the time-of-flight setup we have imaged the well-known photodissociation ofCH3I into CH3 + I at 266 nm [20 21] using the fourth harmonic of a NdYAG laser polarizedparallel to the detector surface The pulse energy is attenuated in order to detect about one ionper camera frame The I atom product is ionized by three additional photons from the samelaser pulse
Fig 7 shows measured I+ velocity distributions and derived kinetic energy distributions Theupper panel is obtained by setting in the offline analysis a 20 ns cut on the measured time-of-flightaround the mean of the time-of-flight distribution and the lower one by an Abel transformationof the entire projected data set One can see from the high-velocity ring segments that thedissociation probability is proportional to cos2 θ as expected for a parallel transition where θis the angle between the polarization axis of the laser and the C-I bond The events near thecenter of the images are likely due to non-resonant multiphoton ionization and fragmentation ofCH3I The energy distributions show that position and width of the peaks quantitatively agreewith each other well within the experimental accuracy
4 Conclusion and outlook
The presented crossed-beam imaging spectrometer for low-energy ion-molecule reactions hasdeveloped into a robust and versatile tool Further experiments on anion-molecule nucleophilicsubstitution reactions are under way It will be interesting to investigate the role of directand indirect reaction mechanisms in these and other systems Also further studies of quantummechanical effects in ion-molecule reactions will be carried out Particularly important will beto understand the role of quantum scattering resonances in chemical reactions where only veryfew have been identified up to now
Acknowledgments
This work has been supported by the Deutsche Forschungsgemeinschaft under contract NoWE 26614-1 and WE 25923-2 and by the Eliteforderprogramm der Landesstiftung Baden-Wurttemberg P H acknowledges support from the Alexander von Humboldt Foundation
References[1] Casavecchia P 2000 Rep Prog Phys 63 355[2] Lin J J Zhou J Shiu W and Liu K 2003 Science 300 966[3] Qiu M Ren Z Che L Dai D Harich S A Wang X Yang X Xu C Xie D Gustafsson M Skodje R T Sun
Z and Zhang D H 2006 Science 311 1440[4] Zhang W Kawamata H and Liu K 2009 Science 325 303[5] Mikosch J Fruhling U Trippel S Schwalm D Weidemuller M and Wester R 2006 Phys Chem Chem Phys
8 2990[6] Eppink A T J B and Parker D H 1997 Rev Sci Instrum 68 3477[7] Mikosch J Trippel S Otto R Eichhorn C Hlavenka P Weidemuller M and Wester R 2007 J Phys Conf
Series 88 012025[8] Mikosch J Trippel S Eichhorn C Otto R Lourderaj U Zhang J X Hase W L Weidemuller M and Wester
R 2008 Science 319 183
XXVI International Conference on Photonic Electronic and Atomic Collisions IOP PublishingJournal of Physics Conference Series 194 (2009) 012046 doi1010881742-65961941012046
8
Figure 7 Measured kinetic energy distributions for the I fragment after CH3I photodissociationa) Obtained by slicing the measured events based on the time-of-flight measurement b) Obtainedby Abel-inversion of the projection of all events The insets show the corresponding two-dimensional velocity distributions sliced and Abel-inverted respectively
[9] Person U and Gerlich D 1992 Piezo valve priv communication[10] Gebhardt C R Rakitzis T P Samartzis P C Ladopoulos V and Kitsopoulos T N 2001 Rev Sci Instrum
72 3848[11] Lin J J Zhou J Shiu W and Liu K 2003 Rev Sci Instrum 74 2495[12] Schmatz S 2004 ChemPhysChem 5 600[13] Hase W L 1994 Science 266 998[14] Sun L Song K and Hase W L 2002 Science 296 875[15] Lourderaj U Song K Windus T L Zhuang Y and Hase W L 2007 J Chem Phys 126 044105[16] Papadakis V and Kitsopoulos T N 2006 Rev Sci Instrum 77 083101[17] 2006 SIMION 80 Idaho National Engineering Laboratory[18] Nolde M Weitzel K M and Western C M 2005 Phys Chem Chem Phys 7 1527[19] Whitacker B (ed) 2003 Imaging in Molecular Dynamics Technology and Applications (Cambridge University
Press)[20] Eppink A T J B and Parker D H 1998 J Chem Phys 109 4758[21] Eppink A T J B and Parker D H 1999 J Chem Phys 110 832
XXVI International Conference on Photonic Electronic and Atomic Collisions IOP PublishingJournal of Physics Conference Series 194 (2009) 012046 doi1010881742-65961941012046
9
Kinematically complete chemical reaction dynamics
S Trippela M Steia R Ottoa P Hlavenkaa J Mikoscha1 C Eichhorna
U Lourderajb J X Zhangb W L Haseb M Weidemullera2 R Westera
a Physikalisches Institut Albert-Ludwigs-Universitat Freiburg Hermann-Herder-Str 3 79104Freiburg Germanyb Department of Chemistry and Biochemistry Texas Tech University (TTU) Lubbock TX79409 USA
E-mail rolandwesterphysikuni-freiburgde
Abstract Kinematically complete studies of molecular reactions offer an unprecedented levelof insight into the dynamics and the different mechanisms by which chemical reactions occurWe have developed a scheme to study ion-molecule reactions by velocity map imaging at verylow collision energies Results for the elementary nucleophilic substitution (SN2) reaction Clminus
+ CH3I rarr ClCH3 + Iminus are presented and compared to high-level direct dynamics trajectorycalculations Furthermore an improved design of the crossed-beam imaging spectrometer withfull three-dimensional measurement capabilities is discussed and characterization measurementsusing photoionization of NH3 and photodissociation of CH3I are presented
1 Introduction
Collisions of atoms and molecules with well-defined momentum vectors and angle- and energy-resolved detection have been used for many years to obtain a wealth of information on thereaction dynamics of neutral molecules [1 2 3 4] To study ion-molecule reactions at low energywith high resolution we have developed a crossed-beam imaging spectrometer that allows usto measure these reactions in a kinematically complete way [5] It is based on the technique ofvelocity map imaging [6] which projects ions with the same transverse velocity vector onto thesame spot on the detector surface
For comparison with neutral-neutral scattering it is instructive to calculate the scattering ratefor ion-molecule reactions in crossed beams The probability that an ion traversing a molecularbeam undergoes scattering is given by
pscatt = kndvrel (1)
where d is the path length of the ion through the molecular beam and vrel is the relativevelocity between the ion and the neutral The ion-molecule reaction rate coefficients k is aboutfew times 10minus10 cm3s and the target density n is typically 1012 cmminus3 For d = 1 mm andvrel = 3000 ms one obtains a scattering probability of 3times10minus5 For a typical value of 104 ionsper ion pulse one obtains a 30 probability for a reactive event per pulsed beam intersection
1 present address National Research Council Canada 100 Sussex Drive OttawaON K1A 0R6 Canada2 present address Physikalisches Institut Universitat Heidelberg Philosophenweg 12 69120 HeidelbergGermany
XXVI International Conference on Photonic Electronic and Atomic Collisions IOP PublishingJournal of Physics Conference Series 194 (2009) 012046 doi1010881742-65961941012046
ccopy 2009 IOP Publishing Ltd 1
Figure 1 Potential energy of the SN2-reaction of Clminus with CH3I along the reaction coordinate(taken from Ref [8])
For a typical repetition rate of 10 Hz this leads to an event rate of a few events per second Forsmall relative velocities the rate may increase beyond 10 per second and for low reaction ratecoefficients it may be as small as 01 per second With this small event rate it is advantageousthat a velocity map imaging spectrometer has an effective solid angle of almost 4π and thatposition sensitive detectors can measure ion impact positions with above 50 detection efficiencyFurthermore the intrinsic noise of an imaging spectrometer can be smaller than 01 noise eventsper second which provides a significantly large dynamic range in the reaction rate for a varietyof experiments
Using our ion-molecule crossed beam imaging spectrometer we have studied the cation-neutralreaction of Ar+ + N2 and found interesting dynamics [5 7] More recently we have studied theanion-molecule reaction Clminus + CH3I [8] Details of this experiment will be presented in the nextsection Recently we have improved the electric field design of our crossed-beam spectrometerand we have integrated a time-of-flight measurement and thereby set up a full three-dimensionalvelocity vector measurement These improvements have been characterized with photoionizationimaging of NH3 and with photodissociation imaging of CH3I This is presented in section 3
2 Crossed beam imaging of a nucleophilic substitution reaction
A model system for a polyatomic chemical reaction that shows already many of the emergingproperties of complex reactions is the nucleophilic substitution (SN2) reaction
Xminus + CH3Y rarr XCH3 + Yminus (2)
Here Xminus is the approaching nucleophile that forms a bond with the central carbon atom Asa consequence a leaving group Yminus is removed from the molecule In the simplest realizationsXminus and Yminus are halogen anions but they could also represent polyatomic molecular anionsSN2-reactions are important in chemical synthesis because they allow the replacement of onemolecular group with another one This can be used to synthesize large organic molecules Alsoliving cells make use of SN2-reactions
According to the sum formula of Eq (2) the hydrogen atoms are not affected during thisreaction It turns out however that the reaction inverts the ldquoumbrellardquo of the three hydrogenatoms in order to establish a near-tetraedric structure of the product molecule Thus thecoupling of the hydrogen degrees of freedom to the halogen motion is important for the reactiondynamics
XXVI International Conference on Photonic Electronic and Atomic Collisions IOP PublishingJournal of Physics Conference Series 194 (2009) 012046 doi1010881742-65961941012046
2
Figure 2 Measured initial velocity distributions of the Clminus and CH3I reactant beams inthe laboratory frame of reference The solid arrows denote the average beam velocities in thelaboratory frame From them the center of mass velocity (white solid arrow) and the reactantvelocities in the center of mass frame are calculated (dashed arrows) In this Newton diagramthe velocity vector of the Iminus reaction product lies by conservation of energy and momentumwithin the dotted circle
We have selected the elementary SN2-reaction with Xminus being a chlorine anion that reactswith methyl iodide CH3I for the experimental investigation with our crossed-beam spectrometer[8] The potential energy curve for this reaction along the reaction coordinate is depicted in Fig1 Characteristic of this and other anion-molecule reactions are the two relatively deep potentialminima separated by an intermediate barrier In the reaction studied here this barrier liessubmerged below the energy of the reactants Nevertheless it strongly influences the reactivityin that the reaction occurs at only 10 of the Langevin or capture rate
Details of the experimental setup have been described already previously [5] In thisexperiment a pulsed beam of Clminus is formed by co-expanding CCl4 gas and argon in a supersonicbeam that is passed into vacuum by a piezo-electric valve [9] Electron impact ionizes the gasand efficiently allows slow secondary electrons to dissociatively attach to CCl4 and produce Clminus
and CCl3 radicals This delivers packets of about 104 ions with a tunable kinetic energy inthe range from 05 eV up to several electronvolts The typical energy spread amounts to 02 eV(FWHM) The slow Clminus ions are brought to collision with a supersonic beam of the CH3I targetwhich is prepared in a pulsed supersonic beam of CH3I in helium using a second piezo-actuatedpulsed valve
The CH3I velocity distribution is directly measured by ionizing the molecules in collisionswith 1 keV electrons and then imaging the CH3I
+ ions onto the position sensitive detector Theimpact position of an ion on the imaging detector is linearly transformed into the ionrsquos transversevelocity [5] The momentum transfer during ionization is only a small correction to the initialbeam velocity and is neglected The resulting distribution is shown on the left side of Fig 2The velocity origin is calibrated by imaging an isotropic thermal cloud of argon or xenon andmeasuring its center of gravity
The Clminus velocities are measured in a similar way but operating the imaging spectrometerwith opposite polarity The imaging electrodes are pulsed on when the ions are in the interactionvolume The neutral target beam is deactivated The resulting distribution is depicted on theright side of Fig 2 The figure also shows the full Newton diagram of the reaction kinematicsthe reactant velocities in the center of mass frame (dashed arrows) and the range of product Iminus
XXVI International Conference on Photonic Electronic and Atomic Collisions IOP PublishingJournal of Physics Conference Series 194 (2009) 012046 doi1010881742-65961941012046
3
Figure 3 Measured differential scattering cross section for the reaction of Clminus + CH3I givingClCH3 + Iminus Shown are two images at 039 and 19 eV relative collision energy of the Iminus velocityvector in the scattering plane obtained by velocity map slice imaging The largest circles showthe maximum product ion velocity based on the known total energy in the reaction system(taken from Ref [8])
velocities that are in accord with energy and momentum conservation (dashed arrow and circle)To observe reactive scattering both the ion and the neutral reactant beam are synchronously
activated with a repetition rate of 10 Hz A few microseconds after both beams have started tocross each other the high voltages of the velocity map imaging electrodes are pulsed on within afew tens of nanoseconds Then the Iminus product ions and the non-reacting Clminus ions are projectedonto the imaging detector To avoid saturating the detector with the chlorine reactants thedetector gain is electronically gated to the arrival time of the iodine mass In fact the time-window of the detector gain is reduced even further to accept only events where the reactivescattering occurs in the plane parallel to the detector which is referred to as slice imaging[10 11] In this way the recorded images directly reflect the differential scattering cross section
Two types of transformations need to be applied to the data First the transformation tothe center of mass frame is calculated for each scattering event which involves a translation anda rotation of the image parallel to the relative velocity vector Second the loss of fast movingreaction products needs to be corrected Product ions with high laboratory velocities have achance to leave the spectrometer volume that can be imaged onto the position-sensitive detectorTo correct for this an empirical function is used to provide events with large laboratory velocitieswith a larger weight than events with small velocities This correction function is independent ofthe scattering angle Furthermore the same correction function is used for all collision energies
The differential cross section images for two relative energies 039 eV and 19 eV are shownin Fig 3 [8] At the low energy an isotropic distribution of product velocities is observed This isindicating a long-lived intermediate complex that decays on the time scale of several rotationalperiods and thus looses the information of the direction of the incoming particles The measuredvelocity magnitudes are much smaller than the maximum velocity possible at this energy Thismaximum is indicated by the largest circle superimposed onto the distribution At 039 eVtherefore a large fraction about 84 of the available energy is partitioned into internal degreesof freedom of the ClCH3 product molecule This amount of internal energy can be explained by astatistical branching of the available energy over all product states [8] This is another indicationthat at this collision energy the specific properties of the initial state have no influence on thedynamics A very different behavior is observed at 19 eV relative energy Here the Iminus ionsscatter preferentially backward with respect to the direction of the incoming CH3I Also theirvelocity is found very near the maximum possible velocity This can be explained by a fast anddirect reaction mechanism where the Iminus leaves the reaction approximately co-linearly with theincoming Clminus anion
XXVI International Conference on Photonic Electronic and Atomic Collisions IOP PublishingJournal of Physics Conference Series 194 (2009) 012046 doi1010881742-65961941012046
4
Figure 4 Snapshots of two selected trajectories for the reaction Clminus + CH3I obtained withdirect dynamics calculations a) The direct nucleophilic substitution mechanism which is foundin about 90 of the trajectories b) The indirect roundabout mechanism where the CH3Imolecule undergoes a single rotation before the substitution occurs
In order to understand the details of the measured differential cross sections comparison withtheoretical calculation is essential However the theoretical description of polyatomic reactionsthat involve more than four atoms is very difficult The present reaction involves six atomsand therefore twelve internal degrees of freedom Such a large system can not be calculatedquantum mechanically and one has to resort to significant approximations These are eitherquantum scattering calculations in reduced dimensions (typically four) [12] or calculations thattreat the electronic structure quantum mechanically but propagate the nuclei classically on theBorn-Oppenheimer surface [13 14]
The latter approach was used to calculate the reaction dynamics of the Clminus + CH3I reactionat 19 eV relative collision energy The calculations were carried out using the approach ofldquodirect dynamicsrdquo [15] where at each point along the 12-dimensional trajectory the electroniceigenenergy and its gradient are calculated within the Born-Oppenheimer potential Thisinformation is then used to propagate the trajectory further This approach is numerically verydemanding but it circumvents the requirement of a global Born-Oppenheimer hypersurface Inthe present study the electronic structure was calculated at the MP2(fc)ECPaug-cc-pVDZ [8]level of theory
The calculated trajectories show that at 19 eV collision energy a direct reaction mechanismgoverns the nucleophilic substitution reaction This mechanism is depicted in the upper sequenceof Fig 4 The Clminus ion moves into the umbrella of the hydrogen atoms and forms a bond with thecentral carbon atom Roughly co-linearly to this motion the Iminus product ion is moving away afterthe three hydrogen atoms have inverted to form the ClCH3 product molecule This numericalresult corresponds directly to the back-scattering observed in the experiment
The trajectory calculations also revealed another reaction mechanism that occurs with about10 probability In this mechanism which is depicted in the lower panel of Fig 4 the CH3Ireactant undergoes a single 360 revolution about an axis perpendicular to the C-I bond Onlyafter this revolution the substitution occurs This mechanism which we named the ldquoroundaboutmechanismrdquo is found to go along with a large energy partitioning into internal degrees of freedomof the neutral product molecule Therefore the translational energy of the reaction products issmaller than for the direct mechanism This nicely agrees with the observed structures in themeasured differential cross sections at small Iminus velocity (see Fig 3b) which we attribute to theroundabout mechanism [8]
XXVI International Conference on Photonic Electronic and Atomic Collisions IOP PublishingJournal of Physics Conference Series 194 (2009) 012046 doi1010881742-65961941012046
5
Figure 5 View of the improved design of the electrostatic ion optics for velocity map imaging
3 Improved crossed beam ion imaging
31 Second generation imaging electrodes
In crossed-beam ion imaging a much larger interaction volume needs to be imaged onto theposition sensitive detector as compared to applications in photodissociation and photoionizationTo improve the resolution of the spectrometer under these conditions and to minimize theinfluence of stray fields from outside the spectrometer we have constructed a second generationconfiguration of the electric fields
The setup consists of six plates and the microchannel plate detector with phosphor screen andCCD camera The classical velocity map imaging detector consists of planar plates In contrastwe have changed the geometry of our electrodes in order to shield the interaction region fromelectric potentials which are applied to ion optics elements close to the stack We also addedrims on the upper surface of the electrodes [16] which we found in simulations to lead to animproved imaging resolution The shielding of the second electrode has 12 cylindrical holes forthe beams with a diameter of 10 mm In order to increase the interaction volume we use sixinstead of three field plates
Fig 5 shows a simulation of our new velocity map imaging stack carried out with SIMION[17] It shows ion trajectories of two pairs of ions starting in the same plane parallel to thedetector By choosing the correct combination of potentials on the electrodes the ions with thesame velocity vector are focused onto the same spot
To characterize the performance of the new spectrometer we have measured the velocityspread and the rotational spectrum of ammonia seeded in a supersonic expansion of argon outof the pulsed piezo valve We used the frequency doubled output of a NdYAG pumped tuneablepulsed dye laser in the range of 63760 to 63940 cmminus1 for (2+1) REMPI of Ammonia via thevibration-less C-state [18] The produced ions are imaged on the detector
The measured velocity distribution is shown in Fig 6a We find that the determined spreadcorresponds to an effective translational temperature of the NH3 molecules of below 1 K in thereference frame of the supersonic argon beam The rotational spectrum is recorded scanning the
XXVI International Conference on Photonic Electronic and Atomic Collisions IOP PublishingJournal of Physics Conference Series 194 (2009) 012046 doi1010881742-65961941012046
6
Figure 6 a) Measured velocity distribution for NH3 molecules seeded in a supersonic beamof argon obtained by 2+1 REMPI and subsequent velocity map imaging The translationaltemperature corresponds to below 1 K b) Rotationally-resolved spectrum of NH3 in the seededsupersonic beam The observation of only one rotational transition starting from the J=1 K=1state indicates a rotational temperature of at most 7 K
dye laser wavelength and measuring the integrated ion yield As shown in Fig 6b only a singleQ-branch transition persists that starts from the ground state J=1 K=1 of the ortho hyperfinemanifold (for the para ground state J=0 K=0 no Q-branch transition exists) According tosimulations of the rotationally resolved spectrum this measurement implies an upper bound onthe rotational temperature in the supersonic beam of about 7K This shows that the expansioncools very efficiently the translational and the rotational degrees of freedom Furthermoreblurring of the obtained image introduced by electric field inhomogeneities has to be smallerthan 3
32 Three-dimensional ion imaging
Two dimensional velocity map imaging brings along several shortcomings as usually the reactionproducts fly away in all 3 directions In order to retrieve information such as the kinetic energydistribution from the measured images a certain class of velocity components in one direction isselected and the other two components are displayed Usually the fixed component is the oneperpendicular to the detector and the produced slice is around its zero value
There are two methods to obtain slices through the three-dimensional product velocitydistributions using two-dimensional velocity map imaging The first method uses an inverseAbel transformation on the image integrated over the third velocity component (perpendicularto the detector surface) Several numerical algorithms have been developed for this purpose[19] The second method is the slicing technique [10 11] that we also applied in the SN2 reactivescattering experiment (see section 2)
Both methods describe the 3D product velocity distribution in 2D and rely on cylindricalsymmetry in the process under study In crossed-beam scattering experiments this is in principleoften the case as the scattering cross section for spherical reactants is cylindrically symmetricaround the relative velocity vector However the symmetry is quickly lost due to unsymmetricbroadenings induced by the distribution of reactant velocities The Abel inversion can thenno longer be used and instead forward reconstruction algorithms [5] or direct slicing is neededFurthermore if spatially aligned molecules are brought to collision the symmetry is directly lostThen the full 3D distribution has to be measured
A solution to this problem is to measure the time-of-flight of each ion in addition to its impactposition and deriving the full three-dimensional velocity distribution from these measurementsIn order to do this we have integrated a high-resolution time-of-flight detector into our velocitymap imaging spectrometer A photo-multiplier (Hamamatsu R7402-20 transition time spread230 ps risetime 780 ps) is used to detect the light pulses on the phosphor screen that are inducedby ion impacts on the microchannel plate detector After conversion to an electronic logic pulse
XXVI International Conference on Photonic Electronic and Atomic Collisions IOP PublishingJournal of Physics Conference Series 194 (2009) 012046 doi1010881742-65961941012046
7
with a constant fraction discriminator (Ortec 583) this signal is used as a stop signal for a time-to-digital converter (TDC ATMD GPX) The start trigger is provided by the pulse generator(Quantum Composers 9520 lt 200 ps jitter) that triggers the entire experiment In a testmeasurement with logic pulses replacing the photomultiplier signals the overall time resolutionof the electronics was measured to be 140 ps RMS Attention has to be paid to the correctassignment of the TDC data to the camera data as the data transmission from the camera tothe computer as well as the online image analysis are CPU time-consuming
This setup now allows 3D imaging if the event rate is smaller than the read-out rate of thecamera and TDC system which has been increased to 20 Hz Considering the typical reactionevent rates (see section 1) this is no significant limitation for the experiments For a firstcharacterization of the time-of-flight setup we have imaged the well-known photodissociation ofCH3I into CH3 + I at 266 nm [20 21] using the fourth harmonic of a NdYAG laser polarizedparallel to the detector surface The pulse energy is attenuated in order to detect about one ionper camera frame The I atom product is ionized by three additional photons from the samelaser pulse
Fig 7 shows measured I+ velocity distributions and derived kinetic energy distributions Theupper panel is obtained by setting in the offline analysis a 20 ns cut on the measured time-of-flightaround the mean of the time-of-flight distribution and the lower one by an Abel transformationof the entire projected data set One can see from the high-velocity ring segments that thedissociation probability is proportional to cos2 θ as expected for a parallel transition where θis the angle between the polarization axis of the laser and the C-I bond The events near thecenter of the images are likely due to non-resonant multiphoton ionization and fragmentation ofCH3I The energy distributions show that position and width of the peaks quantitatively agreewith each other well within the experimental accuracy
4 Conclusion and outlook
The presented crossed-beam imaging spectrometer for low-energy ion-molecule reactions hasdeveloped into a robust and versatile tool Further experiments on anion-molecule nucleophilicsubstitution reactions are under way It will be interesting to investigate the role of directand indirect reaction mechanisms in these and other systems Also further studies of quantummechanical effects in ion-molecule reactions will be carried out Particularly important will beto understand the role of quantum scattering resonances in chemical reactions where only veryfew have been identified up to now
Acknowledgments
This work has been supported by the Deutsche Forschungsgemeinschaft under contract NoWE 26614-1 and WE 25923-2 and by the Eliteforderprogramm der Landesstiftung Baden-Wurttemberg P H acknowledges support from the Alexander von Humboldt Foundation
References[1] Casavecchia P 2000 Rep Prog Phys 63 355[2] Lin J J Zhou J Shiu W and Liu K 2003 Science 300 966[3] Qiu M Ren Z Che L Dai D Harich S A Wang X Yang X Xu C Xie D Gustafsson M Skodje R T Sun
Z and Zhang D H 2006 Science 311 1440[4] Zhang W Kawamata H and Liu K 2009 Science 325 303[5] Mikosch J Fruhling U Trippel S Schwalm D Weidemuller M and Wester R 2006 Phys Chem Chem Phys
8 2990[6] Eppink A T J B and Parker D H 1997 Rev Sci Instrum 68 3477[7] Mikosch J Trippel S Otto R Eichhorn C Hlavenka P Weidemuller M and Wester R 2007 J Phys Conf
Series 88 012025[8] Mikosch J Trippel S Eichhorn C Otto R Lourderaj U Zhang J X Hase W L Weidemuller M and Wester
R 2008 Science 319 183
XXVI International Conference on Photonic Electronic and Atomic Collisions IOP PublishingJournal of Physics Conference Series 194 (2009) 012046 doi1010881742-65961941012046
8
Figure 7 Measured kinetic energy distributions for the I fragment after CH3I photodissociationa) Obtained by slicing the measured events based on the time-of-flight measurement b) Obtainedby Abel-inversion of the projection of all events The insets show the corresponding two-dimensional velocity distributions sliced and Abel-inverted respectively
[9] Person U and Gerlich D 1992 Piezo valve priv communication[10] Gebhardt C R Rakitzis T P Samartzis P C Ladopoulos V and Kitsopoulos T N 2001 Rev Sci Instrum
72 3848[11] Lin J J Zhou J Shiu W and Liu K 2003 Rev Sci Instrum 74 2495[12] Schmatz S 2004 ChemPhysChem 5 600[13] Hase W L 1994 Science 266 998[14] Sun L Song K and Hase W L 2002 Science 296 875[15] Lourderaj U Song K Windus T L Zhuang Y and Hase W L 2007 J Chem Phys 126 044105[16] Papadakis V and Kitsopoulos T N 2006 Rev Sci Instrum 77 083101[17] 2006 SIMION 80 Idaho National Engineering Laboratory[18] Nolde M Weitzel K M and Western C M 2005 Phys Chem Chem Phys 7 1527[19] Whitacker B (ed) 2003 Imaging in Molecular Dynamics Technology and Applications (Cambridge University
Press)[20] Eppink A T J B and Parker D H 1998 J Chem Phys 109 4758[21] Eppink A T J B and Parker D H 1999 J Chem Phys 110 832
XXVI International Conference on Photonic Electronic and Atomic Collisions IOP PublishingJournal of Physics Conference Series 194 (2009) 012046 doi1010881742-65961941012046
9
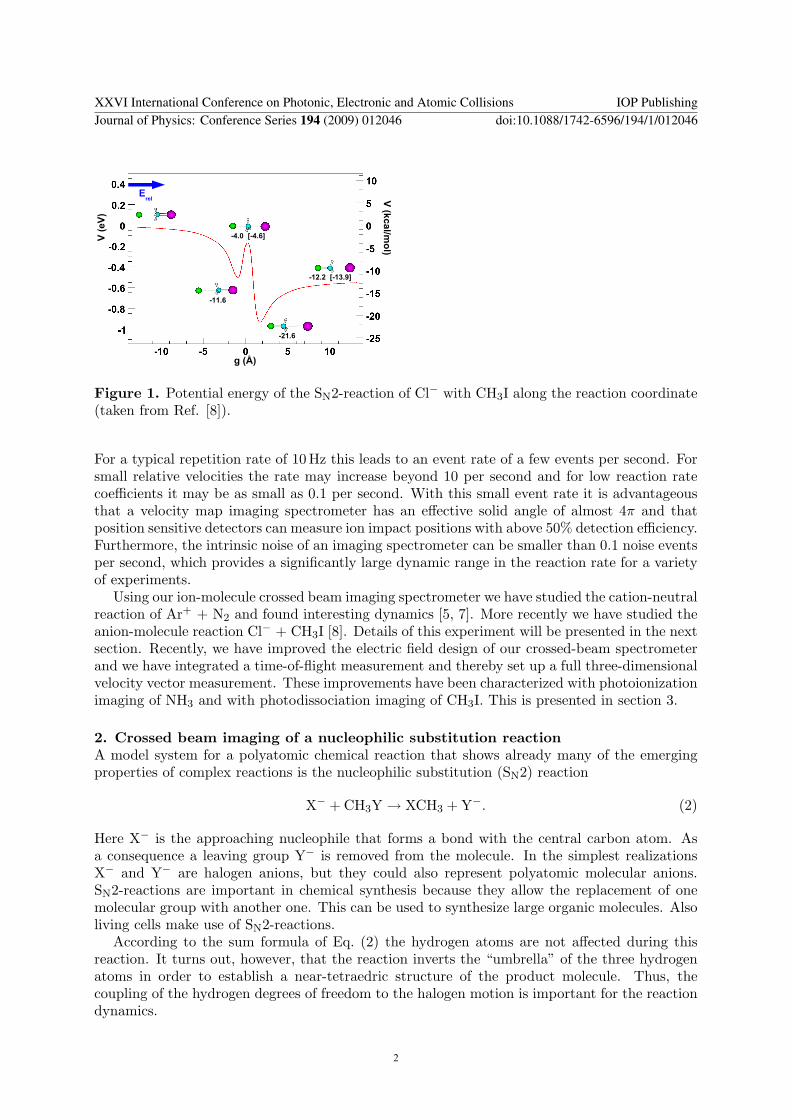
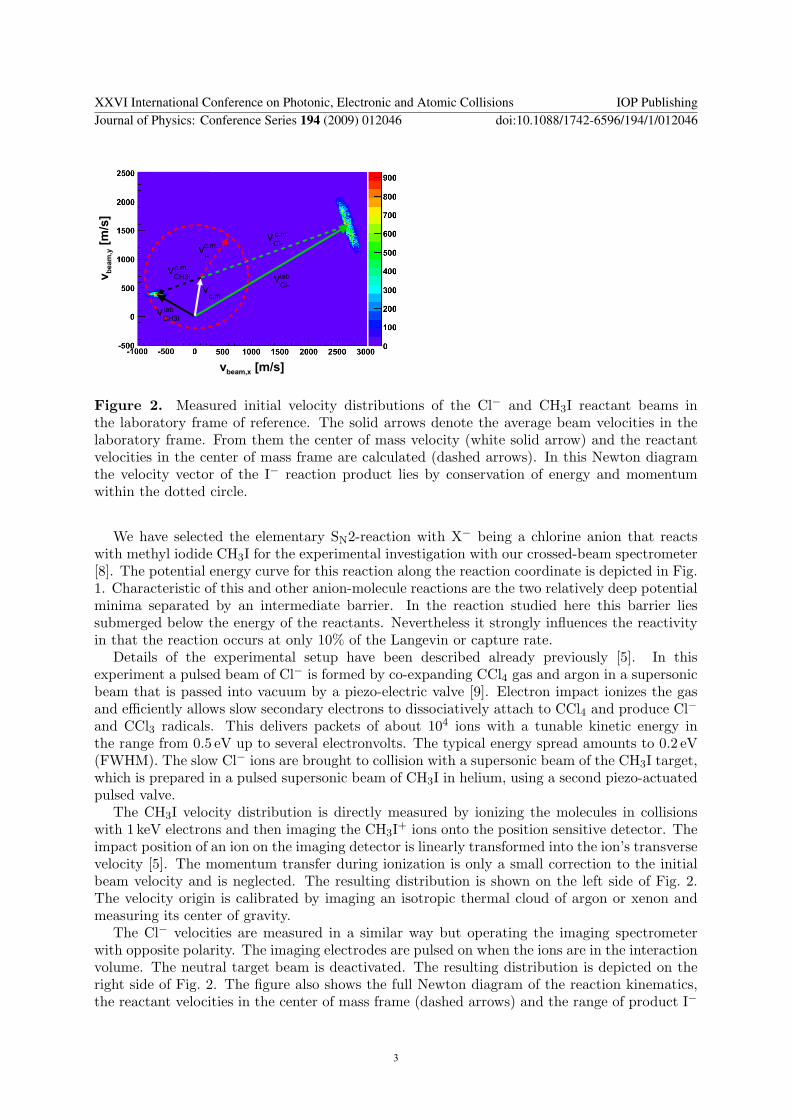
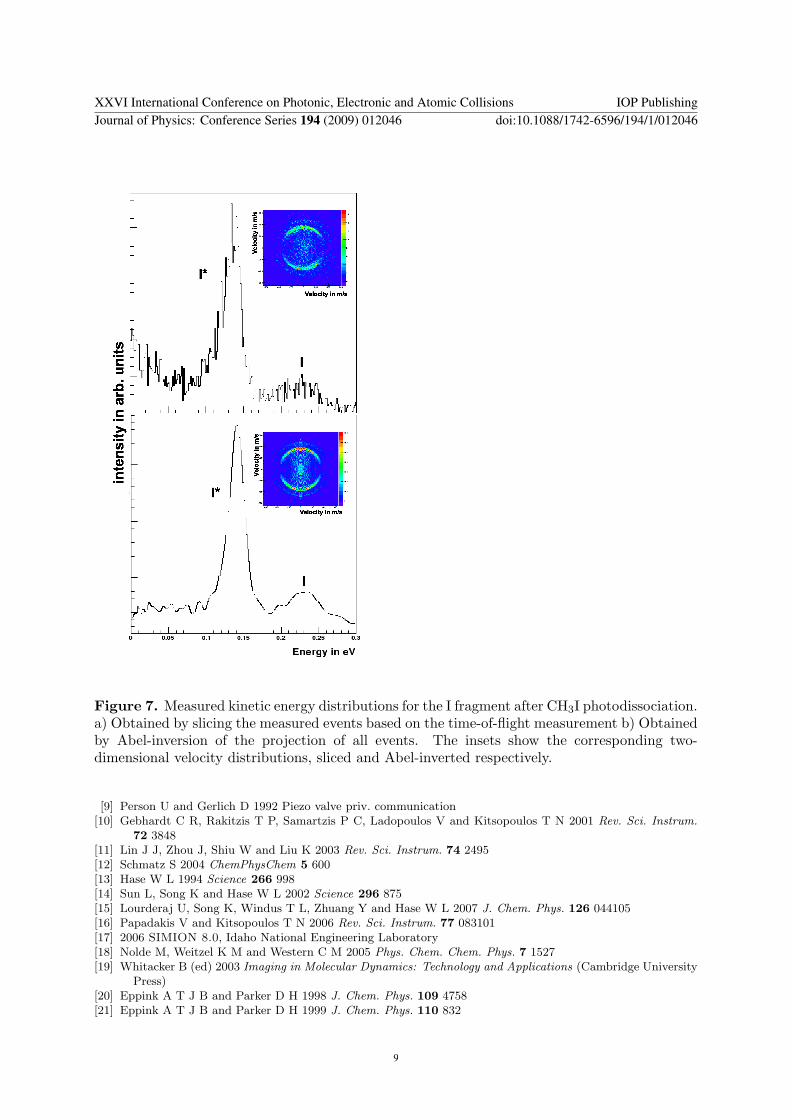


![c a arXiv:0708.3944v1 [nucl-ex] 29 Aug 2007 · Abstract The quasifree reaction np → ppπ− was studied in a kinematically complete experiment by bombarding a liquid hydrogen target](https://static.fdocuments.us/doc/165x107/606a4c8c094f8621c5590544/c-a-arxiv07083944v1-nucl-ex-29-aug-2007-abstract-the-quasifree-reaction-np-a.jpg)


![Kinematically consistent models of viscoelastic stress evolution · 2016. 8. 1. · et al., 2013; Tong et al., 2014; P. R. DeVries et al., submitted manuscript, 2016]. A kinematically](https://static.fdocuments.us/doc/165x107/6048491dd84a9e2520128a75/kinematically-consistent-models-of-viscoelastic-stress-evolution-2016-8-1-et.jpg)