(R) we there yet? The state of coda /r/ vocalization on ...€¦ · vocalization on the Lower East...
22
KARA BECKER KATHLEEN ASTON REED COLLEGE NEW WAYS OF ANALYZING VARIATION (NWAV) 41 OCTOBER 26, 2012 (R) we there yet? The state of coda /r/ vocalization on the Lower East Side of Manhattan
Transcript of (R) we there yet? The state of coda /r/ vocalization on ...€¦ · vocalization on the Lower East...

K A R A B E C K E R K A T H L E E N A S T O N
R E E D C O L L E G E N E W W A Y S O F A N A LY Z I N G VA R I A T I O N ( N W AV ) 4 1
O C T O B E R 2 6 , 2 0 1 2
(R) we there yet? The state of coda /r/ vocalization on the Lower East Side of
Manhattan

The restoration of coda /r/ in North America
The South: Rapid advancement, change complete for young white speakers (Feagin 1987; Labov, Ash and Boberg 2006: 47)
The North: No advancement (New England) or slow advancement (NYC)
NYCE /r/ is:
Slow “Under pressure from of the new r-pronouncing norm, New York City speech is changing
slowly” (Labov 1994) “[r-1] is not steamrolling its way into LMC speech as Labov predicted” (Fowler 1986)
Formal /r/ is “Primarily a feature of formal speech: a superposed dialect.” (Labov, Ash & Boberg
2006) “The effect of the new prestige norm was not to modify the vernacular of most New
Yorkers, but rather to produce variable behavior in formal situations.” (Labov, 1994: 89-90)

/r/’s advancement is slow
Rapid anonymous data (Labov 1966; Fowler 1986; MacDonald 1984; Mather 2011). The percentage of speaker who produce all [r-1], by department store
Community Study (Labov 1966, 1972; Becker 2009)
Carmella, department store study participant?
1962: Lower middle class, aged 40+, careful speech
2006: Lower middle class, middle-aged, interview speech
Percent Increase, 1962-2006
Percent Increase per year (44 years)
Mean [r-1] 21 55 162% 3.7%
1962 1986
Increase 1962-86 % yearly growth
(24 years)
2009 Increase 1962-2009 % yearly growth
(47 years)
Saks 30 39 30% 1.25% 54 80% 1.7%
Macy’s 20 24 20% .83% 43 115% 2.45%
Klein’s/May’s 4 7 75% 3.13% 5 25% .53%
Total 21 28 33% 1.39% 48 128% 2.7%

/r/ is formal
Our Interview Speech

Coda /r/ and Ethnicity
African Americans and /r/ Labov (1966) Labov (1966) Department Store Fowler (1986) Mather (2011) Nagy and Irwin (2011)
In all of these studies, African American speakers use lower rates of [r-1] than their white counterparts Blake and Shousterman (2010): African American New Yorkers use
lower rates of [r-1] than West Indian New Yorkers
Speakers of other non-white ethnicities and /r/ - ?

Year of Birth 1924-1951 1952-1973 1974-1990
F M F M F M
African American 2 2 2 2 2 1 11
Chinese 1 0 1 2 2 3 9
Jewish 3 3 2 4 2 1 15
Puerto Rican 2 3 4 3 3 1 16
White 3 3 3 2 1 2 14
Total 22 25 18 65

Auditory Coding of /r/
Initial ratings of /r/ constriction, or [r-1] /r/ vocalization or /r/ deletion, or [r-0] unclear
Two coders working independently Agreement rate of 95%; a third coder resolved the
remaining 5% of tokens. Resulting response variable (binary): [r-1] or [r-0] A total of 19,149 tokens of /r/ (average 295 per
speaker)

Overall [r-1] index: [r-68] Abe, [r-56] Damaris, [r-91]
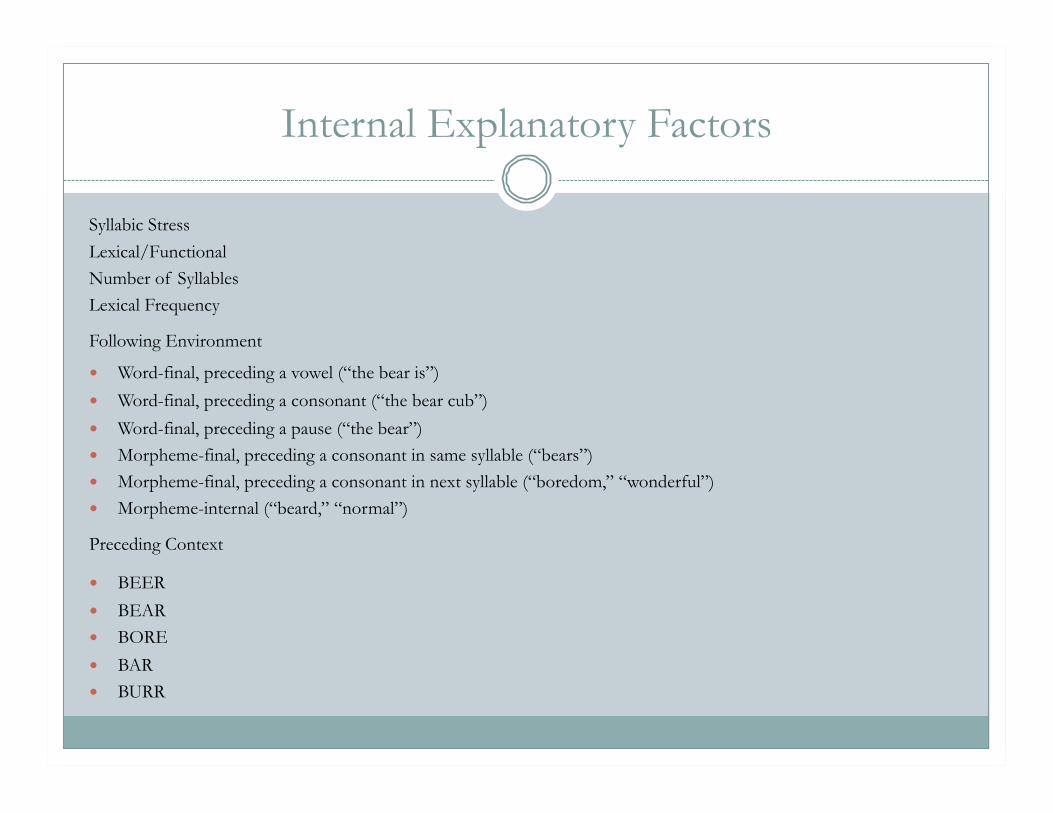
Internal Explanatory Factors
Syllabic Stress Lexical/Functional Number of Syllables Lexical Frequency
Following Environment
Word-final, preceding a vowel (“the bear is”)
Word-final, preceding a consonant (“the bear cub”)
Word-final, preceding a pause (“the bear”) Morpheme-final, preceding a consonant in same syllable (“bears”) Morpheme-final, preceding a consonant in next syllable (“boredom,” “wonderful”) Morpheme-internal (“beard,” “normal”)
Preceding Context
BEER
BEAR BORE
BAR BURR

External Explanatory Factors
Year of birth (continuous)
Gender (M, F)
Ethnicity (African American, Chinese, Jewish, Puerto Rican, White)
Socioeconomic Status: Class scores based off of education, occupation, and housing type (range 4-19) collapsed into five class ranks:
Lower Class
Lower Working Class
Upper Working Class
Lower Middle Class
Upper Middle Class
Generation Status (1.5 – 4)
Place Ideology (1-5)
Interactions:
Year of Birth: SES
Year of Birth: Ethnicity
Year of Birth: Gender
SES: Gender
SES: Ethnicity

Significant Internal Factors

Significant Social Factors
Year of Birth: Ethnicity (p = 0.00024)
Year of Birth [main effect]
Ethnicity [main effect]
Gender: Class Rank (p = 0.0145)
Gender [main effect]
Class Rank [main effect]
Generation Status (p = 0.00224)
Full Model: SPEAKER [random] and word [random] and Following Context (8.61e-138) + Preceding Context (7.59e-47) + Syllabic Stress (3.12e-35) + Year of Birth:Ethnicity (0.00024) + Generation Status (0.00224) + Lexical (0.0142) + Gender:Class Rank (0.0145) + Gender [main effect] + Ethnicity [main effect] + Class Rank [main effect] + Year of Birth [main effect].
(Deviance = 12951.56, df = 37; intercept = -2.297 ; grand mean = .678)


Gender and Class Rank as main effects
Factor Level [r-1] N Log odds Factor Weight
Gender Women 74 9647 .739 .677
Men 61 9502 -.739 .323
Factor Level [r-1] N Log odds Factor Weight
Class Lower Middle 84 3268 1.123 .754
Upper Middle 71 2082 .530 .63
Upper Working 70 4676 .423 .604
Lower Working 66 5291 -1.032 .263
Lower 53 3832 -1.043 .261

Gender and Class Rank
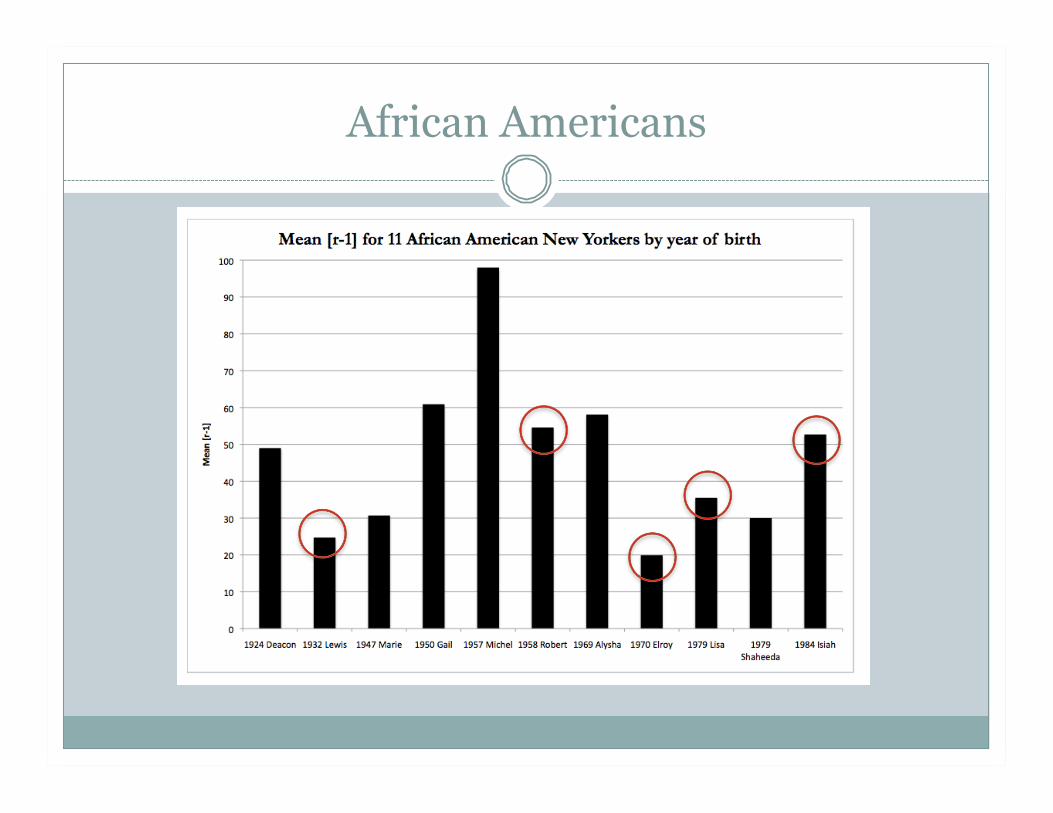
African Americans

Operationalizing Place Ideology
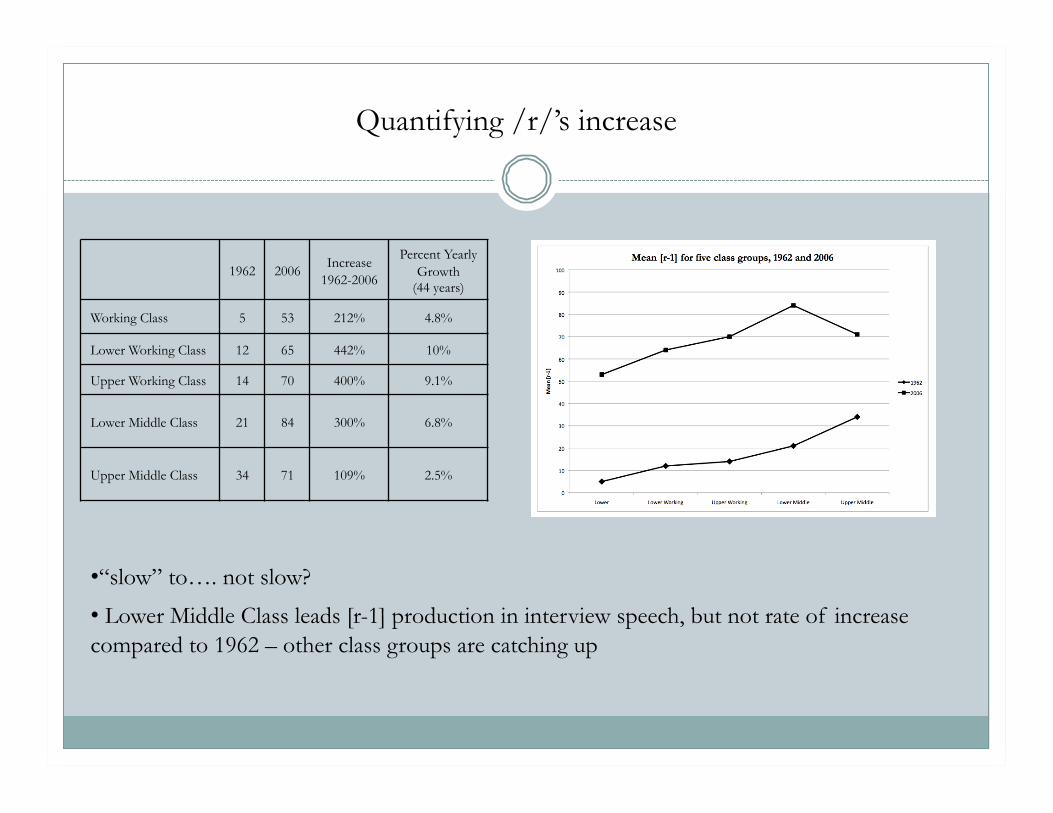
1962 2006 Increase
1962-2006
Percent Yearly Growth
(44 years)
Working Class 5 53 212% 4.8%
Lower Working Class 12 65 442% 10%
Upper Working Class 14 70 400% 9.1%
Lower Middle Class 21 84 300% 6.8%
Upper Middle Class 34 71 109% 2.5%
Quantifying /r/’s increase
• “slow” to…. not slow?
• Lower Middle Class leads [r-1] production in interview speech, but not rate of increase compared to 1962 – other class groups are catching up

Conclusion
Internal factors that predict [r-1]: preceding and following context, syllabic stress, and lexicality
Social factors that predict [r-1]: Year of birth in interaction with ethnicity; Gender in interaction with class; Generation status.
Change is no longer slow, no longer formal Change in progress found for four ethnic groups – white,
Jewish, Puerto Rican, and Chinese Lower East Siders

THANK YOU!
Please email us with questions or for copies of these slides:
[email protected] [email protected]
Special thanks to: Laura Leibman, Hannah Kosstrin, Ely Fernandez-Collins, Daniel Ezra Johnson, members of the Reed linguistics department, and Oliver Binkley.

References
Becker, Kara. 2009. /r/ and the construction of place identity on New York City’s Lower East Side. Journal of Sociolinguistics 13 (5): 634-658.
Blake, Renée and Cara Shousterman. 2010. Second generation West Indian Americans and English in New York City. English Today 103 (26): 35-43.
Feagin, Crawford. 1990. The dynamics of a sound change in Southern States English: From R-less to R-ful in three generations. In Jerold A. Edmondson, Crawford Feagin and Peter Muhlhausler (eds.) Development and Diversity: Language Variation across Time and Space. Arlington, Texas: The Summer Institute of Linguistics and the University of Texas at Arlington. 129–145.
Fowler, Joy. 1986. The social stratification of (r) in New York City department stores, 24 years after Labov. Unpublished manuscript, New York University, New York City, New York.
Johnson, Daniel. 2009. Getting off the GoldVarb standard: Introducing Rbrul for mixed-effects variable rule analysis. Language and Linguistics Compass 3/1, 359-383
Labov, William. 1966. The Social Stratification of English in New York City. Washington, D.C.: Center for Applied Linguistics.
Labov, William. 1972. Sociolinguistic Patterns. Philadelphia, Pennsylvania: University of Pennsylvania Press.
Labov, W., Ash, S., & Boberg, C. (2006). The Atlas of North American English: Phonetics, Phonology, and Sound Change. Berlin: Walter de Gruyter.
Mather, Patrik-André. 2011. The social stratification of /r/ in New York City: Labov’s department store study revisited. Journal of English Linguistics.