r. s~q - Digital Library/67531/metadc626815/m2/1/high_res_d/10820.pdf · The submitted manum”pt...
14
c r. ~ s~q a netic spiral structures in La/Fe multilayers W. Lohstroh’, M. Munzenberg’, W. Felsch’, H. Fritzsche2, and G.P. Felche~ ‘Physikalisches Institut Universitat Gottingen, Bunsenstr. 9,37073 Gottingen, Germany 2Hahn-Meitner-Institut Berlin, Glienicker Str. 100, 14109 Berlin, Germany 3Argonne National Laboratory, Argonne, Illinois 60439 The submitted manum”pt has been created by the Univera”~ of Chicago as Operator of Argonne National Laboratory (%r90nne-) under Contract No. W-31 -109-ENG-M with the U.S. Department of Energy. The U.S. Government retafna for-tielf, and others act- ing on its behalf, a @d-up, nonexdus-~et irrevocable worfdwide ficanse in a-d article to reproduce, prepare derivative works, dk+ tribute mpies to the public. and PerformPJ~ Iidy and display publicly, by or on behaff of the Government. Submitted to Physics B September 1998 This work was supported by the U.S. Department of Energy, BES-Material Sciences, under Contract No. W-3 1-109-ENG-38.
-
Upload
vuongtuong -
Category
Documents
-
view
214 -
download
0
Transcript of r. s~q - Digital Library/67531/metadc626815/m2/1/high_res_d/10820.pdf · The submitted manum”pt...
c
r.
~ s~qa netic spiral structures in La/Fe multilayers
W. Lohstroh’, M. Munzenberg’, W. Felsch’, H. Fritzsche2, and G.P. Felche~
‘Physikalisches Institut Universitat Gottingen, Bunsenstr. 9,37073 Gottingen, Germany
2Hahn-Meitner-Institut Berlin, Glienicker Str. 100, 14109 Berlin, Germany
3Argonne National Laboratory, Argonne, Illinois 60439
The submitted manum”pt has been createdby the Univera”~ of Chicago as Operator ofArgonne National Laboratory (%r90nne-)under Contract No. W-31 -109-ENG-M withthe U.S. Department of Energy. The U.S.Government retafna for-tielf, and others act-ing on its behalf, a @d-up, nonexdus-~etirrevocable worfdwide ficanse in a-d articleto reproduce, prepare derivative works, dk+tribute mpies to the public. and PerformPJ~Iidy and display publicly, by or on behaff ofthe Government.
Submitted to Physics B
September 1998
This work was supported by the U.S. Department of Energy, BES-Material Sciences, underContract No. W-3 1-109-ENG-38.

DISCLAIMER
This report was prepared as an account of work sponsoredby an agency of the United States Government. Neither theUnited States Government nor any agency thereof, nor anyof their employees, make any warranty, express or implied,or assumes any legal liability or responsibility for theaccuracy, completeness, or usefulness of any information,apparatus, product, or process disclosed, or represents thatits use would not infringe privately owned rights. Referenceherein to any specific commercial product, process, orservice by trade name, trademark, manufacturer, or .otherwise does not necessarily constitute or imply itsendorsement, recommendation, or favoring by the UnitedStates Government or any agency thereof. The views andopinions of authors expressed herein do not necessarilystate or reflect those of the United States Government orany agency thereof.
n,.. - -.-T..., . ----- --=,--- .m., a — —-.—. . . .V— -— —- —--- .-— — ..-
DECLAIMER
Portions of this document may be illegiblein electronic image products. Images areproduced from the best available originaldocument. “
,,,,. ,,.,../ -,... .... .... .. . .... .. .. ...!.. . . . . . , ,~—— —-- .. —_____ .
Waste Minimization in Analytical Chemistry through Innovative Sample PreparationTechniques
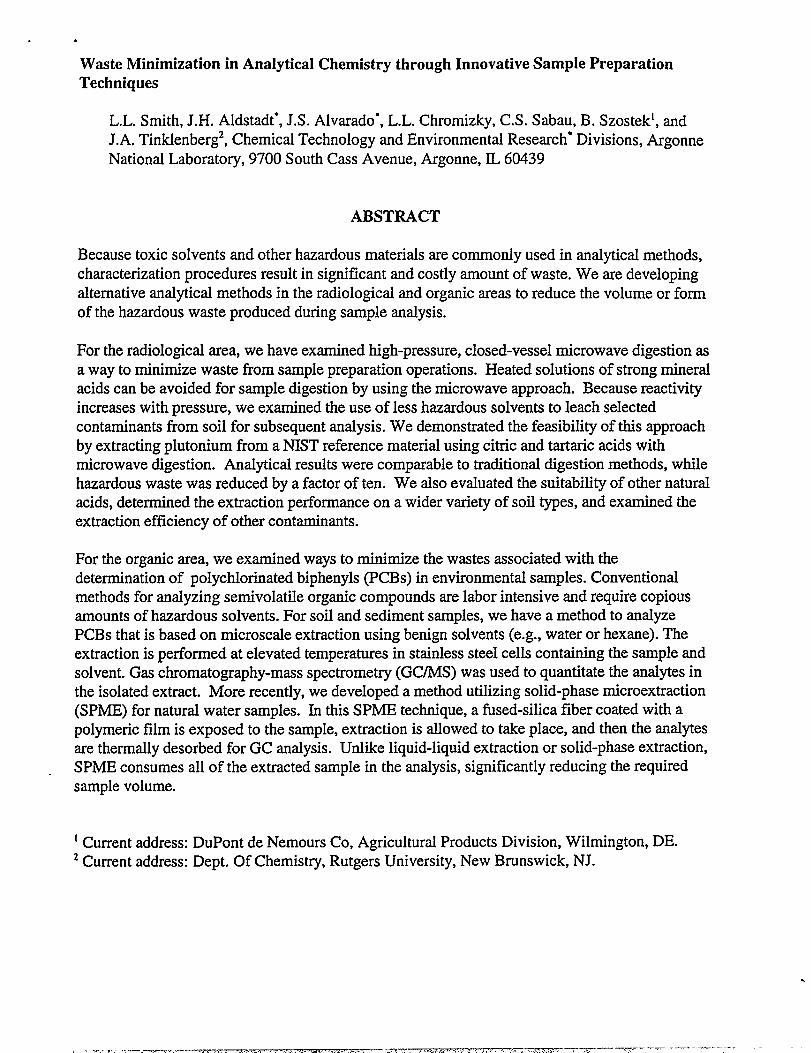
L.L. Smith, J.H. Aldstadt”, J.S. A1varado*, L.L. Chromizky, C.S. Sabau, B. Szostek’, andJ.A, Tinklenberg2, Chemical Technology and Environmental Research* Divisions, ArgonneNational Laboratory, 9700 South Cass Avenue, Argonne, IL 60439
ABSTRACT
Because toxic solvents and other hazardous materials are commonly used in analytical methods,characterization procedures result in significant and costly amount of waste. We are developingalternative analytical methods in the radiological and organic areas to reduce the volume or formof the hazardous waste produced during sample analysis.
For the radiological area, we have examined high-pressure, closed-vessel microwave digestion asa way to minimize waste from sampIe preparation operations. Heated solutions of strong mineralacids can be avoided for sample digestion by using the microwave approach. Because reactivityincreases with pressure, we examined the use of less hazardous solvents to leach selectedcontaminants from soil for subsequent analysis. We demonstrated the feasibility of this approachby extracting plutonium from a NET reference material using citric and tartaric acids withmicrowave digestion. Analytical results were comparable to traditional digestion methods, whilehazardous waste was reduced by a factor often. We also evaluated the suitability of other naturalacids, determined the extraction performance on a wider variety of soil types, and examined theextraction efficiency of other contaminants.
For the organic area, we examined ways to minimize the wastes associated with thedetermination of polychlorinated biphenyls (PCBS) in environmental samples. Conventionalmethods for analyzing sernivolatile organic compounds are labor intensive and require copiousamounts of hazardous solvents. For soil and sediment samples, we have a method to analyzePCBS that is based on microscale extraction using benign solvents (e.g., water or hexane). Theextraction is performed at elevated temperatures in stainless steel cells containing the sample andsolvent. Gas chromatography-mass spect.rometry (GC/MS) was used to quantitate the analytes inthe isolated extract. More recently, we developed a method utilizing solid-phase microextraction(SPME) for natural water samples. In this SPME technique, a fused-silica fiber coated with apolymeric film is exposed to the sample, extraction is allowed to take place, and then the analytesare thermally desorbed for GC analysis. Unlike liquid-liquid extraction or solid-phase extraction,SPME consumes all of the extracted sample in the analysis, significantly reducing the requiredsample volume.
‘ Current address: DuPont de Nemours Co, Agricultural Products Division, Wilmington, DE.2Current address: Dept. Of Chemistry, Rutgers University, New Brunswick, NJ.
.
.= ..,.. ———-, ! ,.---n-.. ., ,-, .,. m.. . . . .. . ,. . -rtw?rc?z- .,, -—.T ---= .—. .——-.. —
.
INTRODUCTION
Because toxic solvents and other hazardous materials are commonly used in analytical methods,the analysis itself can become a significant source of new waste. In radiochemical procedures,this waste must often be categorized as mixed waste. Alternative analytical methods can reducethe volume or form of the hazardous waste produced during sample preparation. We areexamining high-pressure, closed-vessel microwave digestion to minimize waste from samplepreparation operations in the radiological laboratory and microscale extraction techniques forthe analysis of polychlorinated biphenyis (PCBS) in environmental matrices in organic analyses.
RADIOCHEMICAL ANALYSIS
The traditional soil dissolution techniques’*2of high temperature fusion or prolonged aciddigestion are time consuming and generate large quantities of secondary wastes and fhme hoodemissions. Microwave energy as a heat source for sample digestion was fnst described over 20years ago? and today samples are frequently prepared for metal analysis by microwave digestionusing strong mineral acids.45 However, this technology has had limited application in theradiochemical laboratory because of constraints on sample size resulting from vessel pressurelimitations. As a result, microwave dissolution techniques were not practical for manyradiochernical procedures where larger sample sizes are required to achieve required detectionlimits. However, recent advances in vessel design have eliminated this disadvantage. Thesenew vessels allow for pressures on the order of 110 bar (1500 psi)G,thereby allowing for largersample sizes. Additionally, improvements in vessel composition have been made. Noltner et. alhave demonstrated that Tetrafluorometoxil (TFM) vessels exhibit significantly lower memorythan vessels produced from the more traditional Perfluoroalcoholoxil (PFA).7 This lowermemory results in lower blank values and consequent Iower limits of detection, a clearadvantage for environmental laboratories. The TFM vessels are also able to withstand higherpressures and temperatures than the PFA vessels. ‘
In previous work, we demonstrated that these high-pressure, closed-vessel systems with strongmineral acids as solvents allow significant improvements in the sample preparation process forsoils and vegetations.&10 These microwave systems dramatically reduced secondary wastes andacid time emissions while allowing larger sample sizes, shorter processing times, and reliablesample digestion.
Because reactivity increases as pressure increases, these high-pressure microwave systemsenabled us to use alternative, nonhazardous solvents to leach certain contaminants from soils foranalysis. In this work, we investigated replacing strong, corrosive acids with milder,nonhazardous completing agents such as citric and tartaric acids for removing selectedcontaminants from soils.
Experimental
Instrumentation. A Milestone MLS-1200 MEGA Microwave Digestion System with MDR(Microwave Digestion Rotor) technology was used in this study. A polypropylene rotor holds
.7--- ---- -7---- .-zm~m.-=’r,w——— -.;w~ —“”-- “–-- . ... .> .. :.>.. .-
six high-pressure TFM vessels that are designed to tolerate exposure to a variety of aggressiveacids at elevated pressures up to 110 bar. The power of the magnetron is 1200 W with 1000 Wdelivered inside the working chamber. The microwave emission is “unpulsed” in the 250 Wmode, but pulsed at other wattages. The unpulsed 250 W mode assures controlled oxidation oforganics. The microwave digestion protocol has been previously described.s
Plutonium and americium samples were electrodeposited onto 1.9-cm stairdess steel disks andcounted by alpha spectrometry using surface barrier detectors. A sodium sulfate/sodiumbisulfate medium described by Kressinll was utilized for the electrodeposition.
The behavior of a variety of metals such as strontium, nickel, and zinc was monitored byinductively coupled plasma- mass spectrometry (ICP-MS) using a Fisons PlasmaQuad II with aglass, dual-concentric type nebulizer (Glass Expansion Pty. Ltd., Australia). A water-cooledScott double-pass spray chamber (also supplied by Fisons) was used in combination with thenebulizer. Samples were transferred to the nebulizer by using a ten-roller peristaltic pump(Miniplus 3: Gilson Medical Electronics, Middleton, WI).
Standards and samples. Plutonium and americium analyses were quantified by isotopedilution employing radionuclides traceable to the National Ihstitute of Standards andTechnology (NIST). ICP standards were made from analytical grade reagents and distilled,deionized water.
A variety of soil types were selected for testing. For radiological analyses, the availability ofstandard reference materials is limited. We used NIST standards SRM 4353-Rocky Flats Soil #1and SRM 4350B-Columbia River Sediment and MAPEP-97-S4 and QAP9703 soils fromperformance evaluation programs sponsored by the Department of Energy (DOE). Referencematerials for non-radiological metal analyses are more numerous. NIST standards SRM 2709-San Joaquin Soil and SRM 2711- Montana Soil, as well as CANMET SO-2, SO-3, and SO-4were analyzed for this project. Soil SO-2 is from the B horizon of a Ferro-Humic Podzoldeveloped in sandy till with an organic content of approximately 10%. Soil SO-3 is of thecalcareous till parent material of the Guelpgh series, a gray Brown Luvisol. SO-3 soil has anappreciable content of both calcite and dolomite. SO-4 is from the A horizon of a BlackChemozemic soil developed in silty glacial lacustrine deposits.
Reagents and Materials. All reagents were American Chemical Society reagent grade andwere utilized as received. Type-II distilled, deionized water was used for preparation ofsolutions. Solutions of citric acid, citric acid with hydrogen peroxide, quinnic acid, sodiumcarbonate-EDTA (ethylenediaminetetraacetic acid), sodium tartrate, and ammonium bioxalatewere used as solvents for soil digestion.
Tru SPS and Teva resins, as well as Prefilter Material, an inert support, were received as bulkmaterial (Trademarks of EIChrom Industries, Inc., Darien, IL). Prepacked AG 1-X8 (chlorideform, 100-200 mesh) columns were obtained from Bio-Rad Laboratories (Richmond, CA).
Microwave Acid Digestion Procedure. Soils were dried at 110° C for at least 48 hours (or
until dry weight was obtained) and were ashed at 510° C overnight to remove organic material.Two grams maximum of sample were used in each analysis. Each soil-solvent pair was run intriplicate. Each sample was transferred to a clean TFM vessel and treated with 15 mL of thechosen solvent. The vessel was capped and placed into the microwave rotor apparatus. Thesample was irradiated and subsequently cooled in a cold water bath. The sample was removedfrom the vessel, and the Ieachate was separated by centrifugation. The residue was washed with5 mL 8 M HNO~ and centrifuged. The supernatants were combined to form a sample digestatethat is 2 M HNO~.
Separation chemistry. Non-radiological metal analysis required no elemental separationbefore ICP-MS analysis. However, americium and plutonium had to be isolated prior to theirdetermination by alpha spectroscopy. This step was accomplished through extractionchromatography using Tru SPS and Tevaresins (trademarks of EIChrom Industries, Inc) aspreviously described.12
Results and Discussion
The best extractant for the plutonium and americium proved to be 1-2 M citric acid withperoxide. See Tables 1 and 2. It provided the best extraction recoveries and was the easiest tohandle during the subsequent separation chemistry. Chemical yiel@ for the separation processwere in the range of 60-95 %. At 0.5 M citric acid, the extraction eff-iciency declined. Sodiumtartrate extracted the analytes adequately, but it created gaseous by-products during themicrowave procedure resulting in frequent venting of the vessels. Ammonium bioxalate did notextract adequately. Quinnic acid tended to decompose during the separation procedure resultingin channeling on the columns and very poor chemical recoveries. It also fouled the microwavevessels such that they had to be cleaned with aqua regia, a step counterproductive in a wasteminimization method. Similar results were observed with sodium carbonate - EDTA. Thisreagent tended to precipitate during separation, thereby interfering with the analysis.
The strontium extractions were generaI1y quite poor. Of the reagents examined, 2M citric acidwith peroxide proved the best extractant, but its average extraction efllciency was only 35%.Citric acid with peroxide was also the best extractant for zinc with an average extractionrecovery of 70%. The extraction recovery for nickel from this media was better, 89%. SeeTables 3-5.
ORGANIC ANALYSIS
Sample preparation is frequently the most time- and labor-consuming step in the trace organicanalysis of environmental samples. The analytes typically have to be extracted andpreconcentrated from the matrix before instrumental anrdysis. In a variety of techniques thathave been developed for this purpose, emphasis has been placed on simplicity, usage of organicsolvents, time, costs, and ease of automation. We are examining several new approaches tomeasuring PCBS in natural water and solid samples that are primarily designed to minimize oreliminate the use of organic solvents. We are applying these methods to the determination of
..—. . .. . . . . . ..... ... .- ..4.:.. . . . . . . . . -.~,,,. .
PCBS as a representative subset of the semi-volatile organic compound (SVOC) class. PCBSform a class of 209 chemical compounds in which from 1 to 10 chlorine atoms are attached tobiphenyl. These nonpolar compounds are characterized by low aqueous volubility, low vaporpressures, and excellent chemical stability and electrical isolating properties. Thus, PCBS havefound many applications in the past. However, their suspected human carcinogenic properties,their widespread environmental occurrence resulting from contamination, their environmentalpersistence, and their tendency to bioaccumulation have gathered attention, resulting in thedevelopment of a myriad of analytical methods for PCB analysis over the last several decades.13
To meet regulatory requirements for the measurement of PCBS in environmental solids, largevolumes of the samples must be processed to extract the analytes. For solid matrices, Soxhletextraction, sonication, supercriticrd fluid extraction (SFE), pressurized fluid extraction (PFE),and microwave assisted extraction (MAE) are currently used. However, long extraction times,kirge amounts of solvents, or high capital costs (such as in implementation of PFE usingcommercial instrumentation) are required for these approaches.
We recently demonstrated an inexpensive and instrumentally simple approach to PFE for thequantitative extraction of PCBS in environmental samples of soils and sediments that usesnonhazardous solvents. 14In this method, stainless steel extraction cells (64-mm-long pipe, 7mm id. and 12 mm o.d., threaded at both ends and fitted with end caps) are filled with a solidsample (-350 mg) and solvent (high purity hexane) and heated for 30 min at elevatedtemperatures (-300 “C). After cooling the cell to room temperature, PCBS are measured in theextract by direct injection (3+L sample) to a gas chromatography with an electron capturedetector (ECD). We tested the method on a set of PCB-spiked solid matrices and a PCB-contaminated river sediment (NEST SRM 1939). The recovery results for spiked samples wereclose to 100% for eight PCB congeners from sand and two different soil matrices. For riversediment, extraction with hexane at 300°C provided higher recoveries for three tested PCBcongeners than those reported for a duplicate 16-hr Soxhlet extraction with a mixture of organicsolvents. Our adaptation thus extends the PFE approach to an important class of contaminantsby using a nonhazardous organic solvent. Furthermore, the method is inexpensive and usesreadily available instrumentation, therefore making it more appealing to laboratories that handlesmall numbers of samples.
For natural water samples, PCBS are typically extracted by either liquid-liquid extraction (LLE)or solid-phase extraction (SPE). In either case, only a small portion of the final preconcentratedextract is introduced to the analytical instrument. IrI solid-phase microextraction (SPME), all ofthe extracted sample is introduced into the analytical instrument, significantly reducing therequired sample volume. The SPME technique involves exposing a fused-silica fiber coatedwith a polymeric film to a liquid or gaseous sample. The fiber is usually kept in the sampleuntil the equilibrium of analyte partitioning from the sample to the coating is reached. Theanalytes then typically are thermally desorbed into the injector of the GC. Thus, the sampling,extraction, concentration, and sample introduction are combined into a single step. SPME15hasmatured into a solvent-free, simple, and inexpensive extraction technique that has foundnumerous applications in environmental analysis, including PCJ3S in natural water samples. Acomprehensive study of direct SPME of PCBS from water samples was reported by Potter and
>,, ,.,.-. —— -. -—. . . . .— ..7 ,~.y , . .
. . . . . . . . . .
. . . .,.
.
Pawliszyn.[b The SPME conditions were optimized by using a 15-pm-thickpoly(dimethylsiloxane)- (PDMS-) coated fiber for two PCB congeners (PCB 18 and PCB 87).However, significant carryover and precision, expressed as a relative standard deviation (RSD)above 15%, were observed for both congeners. Koch and Volker recently reported” the resultsof a detailed study of headspace SPME of PCBS in aqueous matrices using a 100-pm-thickPDMS-coated fiber. In the SPME work reported herein, we examine the effect of the SPMEfiber type and sampling time on several analytical figures of merit for a representative group ofPCB congeners in aqueous solution.
Experimental
Instrumentation. A Star CX 3600 gas chromatography (Varian, Sunnyvale, CA) with an ECD andsplit/splitless injector were employed with hydrogen at a flow rate of 1.2 mIAnin as the carrier gasand with nitrogen at 30 rnlhin as the detector makeup gas (injector temperature 250”C; ECDtemperature 300”C). A 30 m x 0.25 mm, with aO.25 pmfilm thickness, SPB-608 column (Supelco,Bellefonte, PA) was used for PCB separation with a split ratio of 100:1. The GC temperatureprogram was started at 150”C and held there for 2 tin, ramped to 290°C at 20°C/rnin, and held at290”C for 6 min.
The SPME holder for manual sampling and the SPME fibers were obtained from Supelco. Samples(2.5 mL) of water spiked with PCBS were placed in 4-mL clear glass vials and capped withpoly(tetrafluoroethylene)- (PTEE-) silicone septa (Supelco, Bellefonte, PA) for the SPME extractionstep (2-rein resorption time at 250”C).
Materials. A stock solution of the PCB calibration mixture (CB-681M, Ultra Scientific, NorthKingstown, RI) was obtained by diluting it 100-fold with acetone. High-purity deionized (18 MCl)water from a Barnstead NanoPure system (Dubuque, IA), degassed by sonication at reducedpressure, was used for all SPME experiments.
Results and Discussion
Unlike other extraction techniques, SPME is based not on the exhaustive extraction of analyte froma sample, but rather on reaching an equilibrium state of the partitioning of analyte between thesample matrix (usually water) and the polymeric fiber coating. The equilibrium state ischaracterized by the distribution constant K, which is defined as the ratio of an analyte’sconcentration in the coating to its concentration in the aqueous phase at equilibrium. The value ofthe distribution constant is dependent on the nature of the analyte, the sample matrix, and thecoating. As a first approximation, the polarity of the analyte and the coating can be used to estimatethe distribution constant. GeneraIly, if the polarity of the coating and the analyte are similar and ifthe sample matrix is of opposite polarity, the analyte will have a strong tendency to partition fromthe matrix to the coating (characterized by large values of K). Larger values of K will yield a largermass of analyte in the coating for the same bulk concentration of analyte in the sample, a processthat is directly related to attainable limits of detection for the SPME method. However, for the samerate of mass transport, a corresponding increase in the time required to reach the equilibrium statefor large values of K will be observed.
.“~yT ~- -. -,.:-.
. ——. ——--------- -“., -. . . . . ~..r=y ,a.emm31c.es—— --- -, ., . ., .<., J ? . . ,. . . +
Currently, several SPME fibers with different type of coatings are commercially available. Mostof the work on the use of SPME for PCB determination has been done with PDMS-coated fibers.In this work, we examined the following coated fibers: 100-pm-thick PDMS, 30-pm-thick PDMS,85-pm-thick poly(acrylate) (PA), and 65-pm-thick Carbowax/divinylbenzene (CW/DVB). Amixture of nine PCB congeners of the composition described in the experimental section, whereeach congener of the mixture corresponds to a different degree of biphenyl chlorination, wasselected for the study. The GC separation of the congeners was optimized to obtain a baselineresolution of all of the compounds in less than 15 min. Data for 2-chlorobiphenyl are not presentedbecause its signal was barely detectable with the ECD at the concentration of the mixture used forspiking; its initial concentration in the original mixture was low, as is the ECD response factor forthis compound.
For the fiber type selection study, 10mL of the nine-component PCB mixture solution was preparedby diluting the PCB stock solution 100-fold with wateq 2.5-rnLportions were placed in 4-rnL glassvials. Direct SPME extraction at room temperature was performed in triplicate for 15 min for eachfiber type. Split GC injections at the ratio of 100:1 were performed to avoid saturating of the ECD.In Figure 1, the peak areas for eight PCB congeners (arranged in the order of elution from the GCcolumn) are compared for different types of fibers by using a 15-rnin extraction from a 2.5 mLsample. The error bar represents one standard deviation. No dramatic differences in signals wereobserved for the different fibers. Generally, a higher response was obtained for the 100-pm-thickPDMS fiber versus the 30-pm-thick PDMS fiber. One would expect this to occur if the responseswere compared at equilibrium for both fibers. It is, however, unlikely that equilibrium conditionsare obtained for any of the fibers examined in such a short period of time (15 rein). In the case ofthe PDMS coating, the values for the octanol-waterpartition coefficient (&W)can be directly relatedto the distribution constant.17 The PCBS are characterized by large values of l& (log ?& from 4to 11).18This observation implies that the partition coefficients are also Iarge for PCBS to nonpolarcoatings and that long extraction times are needed to achieve equilibrium. The 15-Inin extractiontime was selected as reasonable for practicality. Because the fibers studied differ in the thicknessof the coating, the polarity, and the mechanism of extraction (extraction with the CW/DVB coatingis based on surface adsorption, rather than absorption as with the other three fibers) and becausesampling is finished presumably before equilibrium is reached, clear trends were not observed. Itis surprising, however, that the observed differences in response were so mild. When sampling isdone under nonequilibrium conditions for analytes with large distribution constants, the precisionand the carryover are concerns. Generally, good precision (expressed as an RSD) of less than 10%was obsetied for most PCB congeners with the 100-pm-thick and 30-pm-thick PDMS fibers. LargeRSDS, ranging from 10% to 25% and from 5% to 20%, were obtained for the 85-pm-thick PA fiberand the 65-pm-thick CW/DVB fiber, respectively. The carryover was examined by comparison toa splitless injection. The carryover was defined as the ratio of the peak area obtained for splitlesscarryover injection divided by a factor of 100 to the peak area obtained with split sample injection.Generally, for both of the PDMS fibers and the CW/DVB fiber, the carryover signals were obsenedonly for the last five PCB congeners. However, the signal did not exceed 2%. Higher carryover wasobserved for the PA fiber, ranging from 2.5% to 6.0%.
The 30-pm-thick PDMS fiber was further examined to determine the extraction time profiles forthe eight PCB congeners. The experiments were run in triplicate for each extraction time. Figure
.- . -.-c------ —-.—- r ... ,. ., -.. , ,,-- . -. .--,-.-VC:-T--7 T = Z!L=.. ,-. !$ . . . . . 3-
— --
,—-—.77,. . ~,,,.,+.
2 shows the extraction time profiles for the eight PCB congeners with the 30-pm-thick PDMS fiber.The expected shape of an extraction time profile is obtained for most of the PCB congeners studied.The precision of the measurement improves as the extraction time is extended; that is, higheroveraIl precision is observed for the Iower-molecukir-weight PCBS. Odd-shaped extraction timeprofiles are observed for PCB-201 and-209. Problems were encountered with the precision and thebetween-day signal reproducibility for these two congeners.
Using the 30-pm-thick PDMS fiber and an extraction time of 30 rein, calibration curves wereobtained for the eight PCB congeners. The range of concentrations used for calibration was from104-to 10-fold dilution of the stock solution, which corresponds to a concentration for PCB 50 of0.1-100 ppb, for example. Linear calibration models (R z 0.99) were obtained for all PCBcongeners studied. Generally, the chromatogram obtained for the Iowest concentration examinedin the calibration study showed a signal for all PCBS, with a signal-to-noise ratio approximatelyequal to 3 (even with a 100:1 split ratio used for calibration). By assuming that the response wouldbe increased by factor of 100 when splitless injection is used, limits of detection close to 1 ppt canbe expected for all PCB congeners with SPME.
ACKNOWLEDGMENT
We thank Drs. Mitchell D. Erickson and Jorge S. Alvarado for their helpful suggestions. This workwas supported by the U.S. Department of Energy, Chicago Operations Office, EM-77 PollutionPrevention Program. Argonne National Laboratory is operated by the University of Chicago for theU.S. Department of Energy under contract W-31-109-ENG-38.
FIGURE LEGENDS
Figure 1. Comparison of the GC responses obtained for a range of PCB congeners to the four SPME fibertypes.
Figure 2(a). Comparison of the effect of sampling time on GC response for a 30 ~m PDMS fiber for (a)PCB 5, PCB 29, PCB 50, and PCB 154.
Figure 2 (b). Comparison of the effect of sampling time on GC response for a 30 pm PDMS fiber for PCB87, PCB i88, PCB 201, and PCB 209.
.-c. - ../-”3- r., --! . . . . . . . . - . .
~—< -Y—?C-------------- ‘-.................... ........ ,-,,:,----. --,
T-
14
2,3.4.
5.
6.‘i’.8.9.
BIBLIOGRAPHY
Chieco, N. A., Environmental Measurements Procedure Manual HASL-300, U.S.Department of Energy - New York (1990).
Sill, C. W., Puphal, K. W., Hindman, F. D., Anal. Chem., 1974, 46, 1725.Abu-Samra, A., Morris, J.S., Koirtyohann, S.R., Anal. C7zem., 1975,47, 1475.ASTM Method D 5258-92. Acid-Extraction of E1ements from Sediments UsingClosed Vessel Microwave Heating. (1992)ASTM Method D 4309-91. Standard Practice for Sample Digestion Using ClosedVessel Microwave Heating Technique for the Determination of Total RecoverableMetals in Water. (1991)Lautenschlaeger, W., Spectroscopy, 1989, 4(9), 16.
Noltner, T., Maisenbacher, P., Puchelt, H., Spectroscopy, 1990, 5(4), 49.Smith, IL., Yaeger, J.S., Radioactivity & Radiochemistry, 1996, 7(2), 35.Yaeger, J.S., Smith, L.L., Waste Minimization through High-Pressure MicrowaveDigestion of Soils for Gross@ Analyses, Argonne Nation~ Laboratory ANIJACL-95-3, (1995).
10. Alvarado, J.S., Neal, T.J., Smith, L.L., Erickson, M.D., Anal. Chim. Acts, 1996,322,11.
11. Kressin, I.K., Anal. Chem., 1977,49,842.12. Smith, L.L., Crain, J.S., Yaeger, J.S., Horwitz, E.P., Diamond, H., Chiarizi~ R., J.
Radioanal. Nucl. Chem., Articles, 1995,394 (1), 151.13. Erickson, M.D., Analytical Chemistry of PCBs, 2nd cd., CRC Lewis Publishers,
Boca Raton, EL, 1997.14. Szostek, B., Tinklenberg, J., Aldstadt, J.H., “A Simple Method for the Quantitative
Microextraction of Polychlorinated Biphenyls in Soils and Sedirnents~’ submitted toJournal of High Resolution Chromatography.
15. Pawliszyn, J., Solid-Phase Microextraction: Theory and Practice, Wiley, New York,1997.
16. Potter, D.W., Pawliszyn, J., Environ. Sci. Technol., 1994,28,298.17. Koch, J., Volker, P., Acts Hydrochim. Hydrobiol., 1997,25,179.18. Shiu, W.Y., Mackay, D., J. Phys. Chem. Re$ Data, 1986,15,911.
‘.. . . ~-.,y..- .— ,., -..
. .
. . . . . . . . . . . . . ., .~-,.. - .,-------- “,---- .*, ,-. .. .

.
Table 1. Plutonium extraction results”
Reagent NIST SRM 4353 NIST SRM 4350B QAP9703 MAPEP-97-S4[0.217k 0.016] [0.0137* 0.0008] [3.65* 0.46] [1.06 * 0.07]’
2M Citric+ 1ML30%HZOZ
lM Citric+ 1 ML30% H20Z
lM Citric acid
0.5M Citric+ 1 ML30% HZOZ
0.5M Citric acid
1.5MSodiumtartrate
O.lM Ammoniumbioxalate
0.5MQuinnicacid
0.209 * 0.021 0.013 * 0.003 3.17*0.21 1.11*0.21
0.195*0.015 0.014 * 0.003 3.1O*O.15 1.14* 0.26
0.195 * 0.014 0.014 * 0.003 3.13 * 0.23 1.09* 0.23
0.162*0.013
0.158 &0.014
0.218 * 0.040 3.26 * 0.26 1.O2*O.1O
0.177 * 0.030 2.73 * 0.36 0.73 * 0.07
0.144 * 0.030 reagentdecomposedoncolumnscreatingchannelingitalso fouledmicrowavevessels
I 2M NzC03 + O.lM EDTA reagentprecipitationduringsampleprocessinginterferedwithseparation‘ ValuesreportedinpCi/g.bValue is a laboratorydetermined valueusingstrong mineralacids. Certifkd valuenot availableat thetime of this report.
Table 2. Americium extraction results’II Reagent NIST SRM 4353 QAP9703 MAPEP-97-S4I [0.034* 0.003] [0.154 * 0.014] [0.539* o.042]b
O,lM Amrhoniumbioxalate 0.041 *0.012 0.457 * 0.039
2M Citric+ 1 ML30% ~02 0.039 * 0.007 0.132 * 0.012 0.513 * 0.066
lM Citric+ 1 ML30% HZOZ 0.044 * 0.008 0.136 * 0.023 0.525 &0.065
lM Citric acid 0.044 &0.008
0,5M Citric i- 1 mL 30% HZOZ 0.046 * 0.008
0.5M Citric acid 0.036 * 0.007
1.5MSodiumtartrate 0.042 * 0.012 0.156 * 0.029 0.515 * 0.065
0.5M Quinnicacid reagentdecomposedon columns creatingchanneling it alsofouled microwavevessels
2M N%CO,+ O.IM EDTA reagentprecipitationduring sample processing interferedwithseparation
‘ Valuesreportedin pCi/g.bValue is a laboratorydetermined valueusingstrong mineralacids. Certified valuenot availableat thetime of this report.
_. _..3
.,=. . . . .. .. —.- . . .. . . . . . . . . . --- ..-.’ ,.k, ,A -.. ,-, .-. $.-: .-,~f. . . . .

#,r
Table3. Strontium extraction results’I
Reagent so-2b so-3b so4b SRM SRM2711C[340 * 50] [217 * 29] [170*18] 2709’ [245.3 * 0.7]
[231$s2]
2M Citric+ 1 mL 30% 97.7 k 25.7 142.9* 4.4 35.4 k 0.7 87.0 &2.2 48.8 &0.4HZ02
1.5MSodium tartrate 5.30 * 0.58 48.9 *1.1 31.0* 0.7
O.lM Ammoniumbioxalate 5.07*0.21 78.7 * 1.0 24.8 * 0.6 65.5 * 1.6 37.2 &0.8
2M Ni%CO,+ O.lM EDTA 9.13 * 0.35 24.1 * 0.7 28.6 * 0.4‘Values reported in pg/g (ppm).bCANMET standard referencematerials.cNIST standardreferencematerials.
Table 4. Zinc extraction results’I 1
Reagent so-2b so-3b so-4b SRM 2709C SRM2711C[124 *5] [52 &3] [94 *3] [106&3] [350.3&4.8]
2M Citric+ 1 rnL30% 83.8 * 2.1 31.2* 1.1 34.3 * 1.1 133&4 197*3HZ02
1.5MSOdhm tartrate 121*2 12.1* 0.4 17.4* 0.5
O.lM Ammoniumbioxalate 81.2 *2.2 15.9&0.5 14.4* 0.6 98.0 &2.2 120*3
2M NqCO~+ O.lM EDTA 114*2 20.2 * 0.7 21.7 * 0.51 I
‘Values reported in pg/g (ppm).bCANMET standard referencematerials.cNIST standardreferencematerials.
Table 5. Nickel extraction results’ ~
Reagent so-2b so-3b so-4b SRM 2709’ SRM 2711’[8* 2] [16 k 3] [26 k 3] [88 *5] [20.6*LI]
2M Citric+ 1mL 30% 5.86 * 0.22 14.4* 0.76 17.9*0.7 86.9 * 3.0 23.7 &0.5H20Z
1.5MSodium tartrate 6.91 *0.17 2.15*0.18 4.93 &0.28
0. lM Ammoniumbioxalate 4.11 *0.25 3.10 * 0.25 3.92 * 0.28 18.1*0.7 6.66 k 0.28
2M NqCOJ + O.lM EDTA 7.05 * 0.27 4.17*0.17 21.0 *0.41
‘ Values reported in pg/g (ppm).bCANMETstandard referencematerials.CNIST standard referencematerials.
.. . .. . . . .- r”.- .—---- ---
,- —--$ -4 ...,.,,,~.+..-,.>... .... —~ ........ ...