R. SCOTT ROWE - Flowserve Corporation
124
2020 ANNUAL REPORT FOCUS FORWARD
Transcript of R. SCOTT ROWE - Flowserve Corporation

FLOWSER
VE
20
20 AN
NU
AL R
EPO
RT
2020 ANNUAL REPORT
FOCUSFORWARD

R. SCOTT ROWEPresident and Chief Executive Officer
ROGER L. FIXNon-Executive Chairman of the Board
TO OUR SHAREHOLDERS:
2020 brought unprecedented challenges to our business, our customers, and our Flowserve associates. Despite responding to COVID-19, a market downturn and uncertain geopolitical climates, we kept our associates safe, performed for our customers, and generated good financial results.
We sincerely thank our Flowserve associates, especially our frontline workers, for their continued dedication in providing our customers with essential flow control products and services to keep the world running.
At Flowserve, safety is a core value. And in today’s environment, that means not only keeping people safe operationally, but also protecting them against the spread of COVID-19. I’m proud to highlight that our associates achieved record safety performance in 2020, including in our pandemic-related protocols.
We also appreciate the trust and confidence that our customers have placed in Flowserve to support their business needs. It is through the commitment of our associates and the strength of the long-term relationships we have built with our customers, that I believe we are well positioned in 2021 to capitalize on the significant opportunities ahead of us, better serve our customers and achieve our financial aspirations.
We accomplished a lot in 2020 despite the ongoing associated challenges with COVID:
• Leveraged the Flowserve 2.0 operating model to respond, manage and adapt to this downturn more quickly and efficiently than in past cycles
• Reprioritized the timing of key Flowserve 2.0 initiatives, to accelerate cost initiatives to reduce cost structure by $100m, continuing to position Flowserve for the future
• Decreased net debt by approximately $75 million during the year, and at $632 million achieved the lowest year-end net debt level since 2012
• Reduced primary working capital and generated impressive full-year cash flow conversion, which produced over $300 million in cash flow from operations
• Returned to bookings growth by generating a sequential bookings increase in the fourth quarter• Launched more than 20 new or improved products, including our IoT Red Raven platform,
enhancing our already broad portfolio of products and services
As we turn the corner into 2021, we are focused forward and have set clear priorities to:
• Drive bookings growth and capitalize on increased global infrastructure, post-COVID, capital and MRO spending
• Support our customers today and be a leader in products and services through the energy transition of the future
• Deliver an unparalleled experience to our customers, through relationship management, innovation, new product development and enhanced IOT offerings to proactively address our customers’ needs
• Complete our Flowserve 2.0 transformation and embed our transformational processes and discipline deep into our business and functions
• Drive enhanced financial returns and free cash flow conversion through our disciplined Flowserve 2.0 operating model
• Enhance our position on environmental, social and governance (ESG) issues by reducing our carbon emissions and helping our customers do the same through our innovative solutions; maintaining a safe workplace; and continuing to foster a culture of diversity, equity and inclusion amongst our associates and our Board of Directors
We look forward to 2021 and the vast opportunities that lie before us.
I am confident that as we focus forward in 2021, Flowserve will be well positioned to win in the recovery, support our customers and associates, and create long-term value for our shareholders.(a) Diluted
FINANCIAL HIGHLIGHTS
OPERATING CASH FLOW in Millions
240311
191
324 311
17 18 19 2016
EARNINGS PER SHARE (a) in US Dollars
0.97
(0.08)
0.80
1.81
0.89
16 17 18 19 20
3804
BOOKINGS in Millions
3760 40204238
3412
16 17 18 19 20
0.38
SAFETY: TOTAL RECORDABLE RATE
0.43 0.470.35
0.29
17 18 19 2016
324
OPERATING INCOME in Millions
269228
387
250
16 17 18 19 20
NET DEBT TO NET CAPITAL RATIO Percentage
42.434.6
28.5 26.4
42.4
16 17 18 19 20

UNITED STATESSECURITIES AND EXCHANGE COMMISSION
Washington, D.C. 20549
Form 10-K☑ ANNUAL REPORT PURSUANT TO SECTION 13 OR 15(d) OF THE SECURITIES EXCHANGE ACT OF 1934 FOR
THE FISCAL YEAR ENDED DECEMBER 31, 2020
OR
□ TRANSITION REPORT PURSUANT TO SECTION 13 OR 15(d) OF THE SECURITIES EXCHANGE ACT OF 1934
FOR THE TRANSITION PERIOD FROM TO
Commission file number 1-13179
FLOWSERVE CORPORATION(Exact name of registrant as specified in its charter)
New York 31-0267900
(State or other jurisdiction ofincorporation or organization)
(I.R.S. EmployerIdentification No.)
5215 N. O’Connor Boulevard 75039
Suite 2300, Irving, Texas(Address of principal executive offices)
(Zip Code)
(972) 443-6500(Registrant’s telephone number, including area code)
Securities registered pursuant to Section 12(b) of the Act:
Title of Each Class Trading Symbol Name of Each Exchange on Which Registered
Common Stock, $1.25 Par Value1.25% Senior Notes due 2022
FLSFLS22A
New York Stock ExchangeNew York Stock Exchange
Securities registered pursuant to Section 12(g) of the Act:
None
Indicate by check mark if the registrant is a well-known seasoned issuer, as defined in Rule 405 of the Securities Act. Yes ☑ No □
Indicate by check mark if the registrant is not required to file reports pursuant to Section 13 or Section 15(d) of the Act. Yes □ No ☑
Indicate by check mark whether the registrant (1) has filed all reports required to be filed by Section 13 or 15(d) of the Securities Exchange Actof 1934 during the preceding 12 months (or for such shorter period that the registrant was required to file such reports), and (2) has been subject tosuch filing requirements for the past 90 days. Yes ☑ No □
Indicate by check mark whether the registrant has submitted electronically every Interactive Data File required to be submitted pursuant to Rule405 of Regulation S-T (§ 232.405 of this chapter) during the preceding 12 months (or for such shorter period that the registrant was required to submitsuch files). Yes ☑ No □
Indicate by check mark whether the registrant is a large accelerated filer, an accelerated filer, a non-accelerated filer, a smaller reporting company,or an emerging growth company. See the definitions of ‘‘large accelerated filer,’’ ‘‘accelerated filer’’, ‘‘smaller reporting company’’ and ‘‘emerginggrowth company’’ in Rule 12b-2 of the Exchange Act.
Large accelerated filer ☑ Accelerated filer □ Non-accelerated filer □ Smaller reporting company □
Emerging growth company □
If an emerging growth company, indicate by check mark if the registrant has elected not to use the extended transition period for complying withany new or revised financial accounting standards provided pursuant to Section 13(a) of the Exchange Act. □
Indicate by check mark whether the registrant has filed a report on and attestation to its management’s assessment of the effectiveness of itsinternal control over financial reporting under Section 404(b) of the Sarbanes-Oxley Act (15 U.S.C. 7262(b)) by the registered public accounting firmthat prepared or issued its audit report. Yes ☑ No □
Indicate by check mark whether the registrant is a shell company (as defined in Rule 12b-2 of the Exchange Act). Yes □ No ☑
The aggregate market value of the common stock held by non-affiliates of the registrant, computed by reference to the closing price of theregistrant’s common stock as reported on June 30, 2020 (the last business day of the registrant’s most recently completed second fiscal quarter), wasapproximately $1,610,916,122. For purposes of the foregoing calculation only, all directors, executive officers and known 5% beneficial owners havebeen deemed affiliates.
Number of the registrant’s common shares outstanding as of February 17, 2021 was 130,276,070.
DOCUMENTS INCORPORATED BY REFERENCE
Certain information contained in the definitive proxy statement for the registrant’s 2021 Annual Meeting of Shareholders scheduled to be heldon May 20, 2021 is incorporated by reference into Part III hereof.

[THIS PAGE INTENTIONALLY LEFT BLANK]

FLOWSERVE CORPORATION
FORM 10-K
TABLE OF CONTENTS
Page
PART I
Item 1. Business. . . . . . . . . . . . . . . . . . . . . . . . . . . . . . . . . . . . . . . . . . . . . . . . . . . . . . . . . . . . . . . . . . . . . . 1
Item 1A. Risk Factors. . . . . . . . . . . . . . . . . . . . . . . . . . . . . . . . . . . . . . . . . . . . . . . . . . . . . . . . . . . . . . . . . . . 13
Item 1B. Unresolved Staff Comments . . . . . . . . . . . . . . . . . . . . . . . . . . . . . . . . . . . . . . . . . . . . . . . . . . . . . . 25
Item 2. Properties . . . . . . . . . . . . . . . . . . . . . . . . . . . . . . . . . . . . . . . . . . . . . . . . . . . . . . . . . . . . . . . . . . . . . 25
Item 3. Legal Proceedings . . . . . . . . . . . . . . . . . . . . . . . . . . . . . . . . . . . . . . . . . . . . . . . . . . . . . . . . . . . . . . 26
Item 4. Mine Safety Disclosures . . . . . . . . . . . . . . . . . . . . . . . . . . . . . . . . . . . . . . . . . . . . . . . . . . . . . . . . . 26
PART II
Item 5. Market for the Registrant’s Common Equity, Related Stockholder Matters and Issuer
Purchases of Equity Securities . . . . . . . . . . . . . . . . . . . . . . . . . . . . . . . . . . . . . . . . . . . . . . . . . . . . 27
Item 6. Selected Financial Data . . . . . . . . . . . . . . . . . . . . . . . . . . . . . . . . . . . . . . . . . . . . . . . . . . . . . . . . . 29
Item 7. Management’s Discussion and Analysis of Financial Condition and Results of Operations . . . 30
Item 7A. Quantitative and Qualitative Disclosures About Market Risk . . . . . . . . . . . . . . . . . . . . . . . . . . . 55
Item 8. Financial Statements and Supplementary Data . . . . . . . . . . . . . . . . . . . . . . . . . . . . . . . . . . . . . . . 56
Item 9. Changes in and Disagreements with Accountants on Accounting and Financial Disclosure . . . 109
Item 9A. Controls and Procedures . . . . . . . . . . . . . . . . . . . . . . . . . . . . . . . . . . . . . . . . . . . . . . . . . . . . . . . . . 109
Item 9B. Other Information . . . . . . . . . . . . . . . . . . . . . . . . . . . . . . . . . . . . . . . . . . . . . . . . . . . . . . . . . . . . . . 109
PART III
Item 10. Directors, Executive Officers and Corporate Governance . . . . . . . . . . . . . . . . . . . . . . . . . . . . . . 110
Item 11. Executive Compensation. . . . . . . . . . . . . . . . . . . . . . . . . . . . . . . . . . . . . . . . . . . . . . . . . . . . . . . . . 110
Item 12. Security Ownership of Certain Beneficial Owners and Management and Related Stockholder
Matters . . . . . . . . . . . . . . . . . . . . . . . . . . . . . . . . . . . . . . . . . . . . . . . . . . . . . . . . . . . . . . . . . . . . . . . 110
Item 13. Certain Relationships and Related Transactions, and Director Independence . . . . . . . . . . . . . . . 110
Item 14. Principal Accountant Fees and Services . . . . . . . . . . . . . . . . . . . . . . . . . . . . . . . . . . . . . . . . . . . . 110
PART IV
Item 15. Exhibits and Financial Statement Schedules . . . . . . . . . . . . . . . . . . . . . . . . . . . . . . . . . . . . . . . . . 111
Item 16. Form 10-K Summary . . . . . . . . . . . . . . . . . . . . . . . . . . . . . . . . . . . . . . . . . . . . . . . . . . . . . . . . . . . 113
Signatures . . . . . . . . . . . . . . . . . . . . . . . . . . . . . . . . . . . . . . . . . . . . . . . . . . . . . . . . . . . . . . . . . . . . . . . . . . . . . . . 114
i

[THIS PAGE INTENTIONALLY LEFT BLANK]

PART I
ITEM 1. BUSINESS
OVERVIEW
Flowserve Corporation is a world leading manufacturer and aftermarket service provider of comprehensive flow
control systems. Flowserve Corporation as it exists today was created in 1997 through the merger of two leading fluid
motion and control companies — BW/IP and Durco International. Under the name of a predecessor entity, we were
incorporated in the State of New York on May 1, 1912, but some of our heritage product brand names date back to
our founding in 1790. Over the years, we have evolved through organic growth and strategic acquisitions, and our
over 225-year history of Flowserve heritage brands serves as the foundation for the breadth and depth of our products
and services today. Unless the context otherwise indicates, references to ‘‘Flowserve,’’ ‘‘the Company’’ and such
words as ‘‘we,’’ ‘‘our’’ and ‘‘us’’ include Flowserve Corporation and its subsidiaries.
We develop and manufacture precision-engineered flow control equipment integral to the movement, control
and protection of the flow of materials in our customers’ critical processes. Our product portfolio of pumps, valves,
seals, automation and aftermarket services supports global infrastructure industries, including oil and gas, chemical,
power generation (including nuclear, fossil and renewable) and water management, as well as certain general
industrial markets where our products and services add value. Through our manufacturing platform and global
network of Quick Response Centers (‘‘QRCs’’), we offer a broad array of aftermarket equipment services, such as
installation, advanced diagnostics, repair and retrofitting.
We sell our products and services to more than 10,000 companies, including some of the world’s leading
engineering, procurement and construction firms (‘‘EPC’’), original equipment manufacturers, distributors and end
users. Our products and services are used in several distinct industries having a broad geographic reach. Our bookings
mix by industry in 2020 and 2019 consisted of:
2020 2019
• oil and gas . . . . . . . . . . . . . . . . . . . . . . . . . . . . . . . . . . . . . . . . . . . . . . . . . . . . . . . . . . . . . . . . . . . . 34% 41%
• general industries(1) . . . . . . . . . . . . . . . . . . . . . . . . . . . . . . . . . . . . . . . . . . . . . . . . . . . . . . . . . . . . . 26% 22%
• chemical(2) . . . . . . . . . . . . . . . . . . . . . . . . . . . . . . . . . . . . . . . . . . . . . . . . . . . . . . . . . . . . . . . . . . . . 24% 22%
• power generation. . . . . . . . . . . . . . . . . . . . . . . . . . . . . . . . . . . . . . . . . . . . . . . . . . . . . . . . . . . . . . . 13% 11%
• water management . . . . . . . . . . . . . . . . . . . . . . . . . . . . . . . . . . . . . . . . . . . . . . . . . . . . . . . . . . . . . 3% 4%
(1) General industries include mining and ore processing, pulp and paper, food and beverage and other smaller applications, as well as salesto distributors whose end customers typically operate in the industries we primarily serve.
(2) Chemical industry is comprised of chemical-based and pharmaceutical products.
Demand for most of our products depends on the level of new capital investment as well as planned and
unplanned maintenance expenditures by our customers. The level of new capital investment depends, in turn, on
capital infrastructure projects driven by the need for products that rely on oil and gas, chemicals, power generation
and water resource management, as well as general economic conditions. These drivers are generally related to the
phase of the business cycle in their respective industries and the expectations of future market behavior. The levels
of maintenance expenditures are additionally driven by the reliability of equipment, planned and unplanned
downtime for maintenance and the required capacity utilization of the process.
Sales to EPC firms and original equipment manufacturers are typically for large project orders and critical
applications, as are certain sales to distributors. Project orders are typically procured for customers either directly
from us or indirectly through contractors for new construction projects or facility enhancement projects.
The quick turnaround business, which we also refer to as ‘‘short-cycle,’’ is defined as orders that are received
from the customer (booked) and shipped generally within six months of receipt. These orders are typically for more
standardized, general purpose products, parts or services. Each of our two business segments generate certain levels
of this type of business.
In the sale of aftermarket products and services, we benefit from a large installed base of our original equipment,
which requires periodic maintenance, repair and replacement parts. We use our manufacturing platform and global
network of QRCs to offer a broad array of aftermarket equipment services, such as installation, advanced diagnostics,
repair and retrofitting. In geographic regions where we are positioned to provide quick response, we believe
1

customers have traditionally relied on us, rather than our competitors, for aftermarket products due to our highly
engineered and customized products. However, the aftermarket for standard products is competitive, as the existence
of common standards allows for easier replacement of the installed products. As proximity of service centers,
timeliness of delivery and quality are important considerations for all aftermarket products and services, we continue
to selectively expand our global QRC capabilities to improve our ability to capture this important aftermarket
business.
We have pursued a strategy of industry diversity and geographic breadth to mitigate the impact on our business
of normal economic downturns in any one of the industries or in any particular part of the world we serve. For events
that may occur and adversely impact our business, financial condition, results of operations and cash flows, refer to
‘‘Item 1A. Risk Factors’’ of this Annual Report on Form 10-K for the year ended December 31, 2020 (‘‘Annual
Report’’). For information on our sales and long-lived assets by geographic areas, see Note 20 to our consolidated
financial statements included in ‘‘Item 8. Financial Statements and Supplementary Data’’ (‘‘Item 8’’) of this Annual
Report.
Our segments share a focus on industrial flow control technology and benefit from our global footprint and our
economies of scale in reducing administrative and overhead costs to serve customers more cost effectively. All
segments share certain resources and functions, including elements of research and development (‘‘R&D’’), supply
chain, safety, quality assurance and administrative functions that provide efficiencies and an overall lower cost
structure.
Our operations leadership reports to our Chief Executive Officer and the segments share leadership for
operational support functions such as R&D, marketing and supply chain. We believe this leadership structure
positions the Company to leverage operational excellence, cost reduction initiatives and internal synergies across our
entire operating platform to drive further growth and increase in shareholder value.
Strategies
Our overarching objectives are to be a leader in each of the market segments we serve and become the employer
of choice in the flow control industry. Additionally, we seek to be recognized by our customers as the most trusted
brand of flow control technology in terms of reliability and quality, which we believe will help maximize shareholder
value.
In pursuit of these objectives, we maintain a rolling, five-year strategic plan that takes a balanced approach to
integrating both short-term and long-term initiatives in four key areas: People, Process & Technology, Customer and
Finance.
People
With the goal of developing and maintaining a people-first culture, we focus on several elements in our strategic
efforts to continuously enhance our organizational capability, including: (i) fully committing to providing a safe work
environment for our associates, worldwide, (ii) upholding a high-performance workforce, that is empowered,
accountable and flexible, (iii) becoming an employer of choice by fostering a people-first culture and (iv) recruiting,
developing and retaining a global and diverse workforce.
Process and Technology
With the goal of improving our productivity and delivering a continuous stream of innovative solutions to our
customers, we focus on select strategies relating to: (i) developing and maintaining an enterprise-first business
approach across all operating units and functional organizations, (ii) simplifying our business processes and
optimizing corporate structural costs, (iii) significantly reducing our product cost and rationalizing our product
portfolio and (iv) becoming the technical leader in the flow control industry.
Customer
With the goal of achieving the highest level of customer satisfaction amongst our peers, we focus on select
strategies related to rigorous and disciplined selection of target markets and customers, while maintaining competitive
lead times and emphasizing the highest levels of on-time delivery and quality. We seek to provide an outstanding
experience for our customers over the entire product lifecycle by providing unique, integrated flow-control solutions
that solve real-world application problems in our customers’ facilities.
2
Finance
With the goal of growing the value of our enterprise, we focus on select strategies we believe will increase our
revenue above the rate of market growth, while optimizing performance in terms of gross margin, selling, general and
administrative (‘‘SG&A’’) expense, operating margin, cash flow and primary working capital.
Flowserve 2.0 Transformation
In 2018 we launched and committed resources to our Flowserve 2.0 Transformation (‘‘Flowserve 2.0
Transformation’’), a program designed to transform our business model to drive operational excellence, reduce
complexity, accelerate growth, expand margins, increase capital efficiency and improve organizational health. The
goals of the Flowserve 2.0 Transformation are to (i) accelerate revenue growth, (ii) drive margin expansion,
(iii) increase capital efficiency and (iv) improve organizational health. The Flowserve 2.0 Transformation consists of
individual projects spread over six work-streams (operations, commercial, growth, aftermarket, cost structure and
working capital). The projects include elements of organizational design, business process definition, process
automation and metrics, and operational footprint optimization. Individual projects vary in terms of time to execute,
ranging from one year for simple quick-fix efforts to five years for more complex infrastructure efforts. Structured
processes are created to ensure that each project followed common milestones and delivered value over its lifecycle,
with a governance process that oversaw the portfolio to ensure that time-phased trade-offs between cost and benefits
are proactively managed. For further discussion of the Flowserve 2.0 Transformation program refer to Note 22 to our
consolidated financial statements included in Item 8 of this Annual Report.
Seasonality
Our financial results are traditionally seasonal during the year as we typically experience lower earnings in the
first quarter of the year, with lower sales, coupled with fixed operating expenses, impacting our earnings and cash
flows. We typically have higher sales, earnings and cash flows in the second half of the year with the fourth quarter
being the strongest. Given that certain of our operating expenses are fixed, fluctuations in sales volumes from quarter
to quarter may affect operating income for the respective quarters.
Competition
Despite consolidation activities in past years, the markets for our products remain highly competitive, with
primary competitive drivers being price, reputation, project management, timeliness of delivery, quality, proximity
to service centers and technical expertise, as well as contractual terms and previous installation history. In the pursuit
of large capital projects, competitive drivers and competition vary depending on the industry and products involved.
Industries experiencing slow growth generally tend to have a competitive environment more heavily influenced by
price due to supply outweighing demand and price competition tends to be more significant for original equipment
orders than aftermarket services. We expect pricing for original equipment orders to continue to be a particularly
influential competitive factor. The unique competitive environments in our business segments are discussed in more
detail under the ‘‘Business Segments’’ heading below.
In the aftermarket portion of our business, we compete against other large, well-established national and global
competitors and, in some markets, against regional and local companies. In the oil and gas and chemical industries,
the primary competitors for aftermarket services tend to be customers’ own in-house capabilities. In the nuclear
power generation industry, we possess certain competitive advantages due to our ‘‘N Stamp’’ certification, which is
a prerequisite to serve customers in that industry, as well as our considerable base of proprietary knowledge.
Aftermarket competition for standardized products is aggressive due to the existence of common standards allowing
for easier replacement or repair of the installed products.
In the sale of aftermarket products and services, we benefit from our large installed base of pumps, valves and
seals, which continually require maintenance, repair and replacement parts due to the nature of the products and the
conditions under which they operate. Timeliness of delivery, quality and the proximity of service centers are
important customer considerations when selecting a provider for aftermarket products and services. In geographic
regions where we are locally positioned to provide a quick response, customers have traditionally relied on us, rather
than our competitors, for aftermarket products relating to our highly-engineered and customized products, although
we are seeing increased competition in this area.
Generally, our customers attempt to reduce the number of vendors from which they purchase, thereby reducing
the size and diversity of their supply chain. Although vendor reduction programs could adversely affect our business,
3

we have been successful in establishing long-term supply agreements with a number of customers. While the majority
of these agreements do not provide us with exclusive rights, they can provide us a ‘‘preferred’’ status with our
customers and thereby increase opportunities to win future business. We also utilize our LifeCycle Advantage
program to establish fee-based contracts to manage customers’ aftermarket requirements. These programs provide an
opportunity to manage the customer’s installed base and expand the business relationship with the customer.
Our ability to use our portfolio of products, solutions and services to meet customer needs is a competitive
strength. Our market approach is to create value for our customers throughout the life cycle of their investments in
flow control management. We continue to explore and develop potential new offerings in conjunction with our
customers. In the early phases of project design, we endeavor to create value in optimizing the selection of equipment
for the customer’s specific application, as we are capable of providing technical expertise on product and system
capabilities even outside the scope of our specific products, solutions and services. After the equipment is constructed
and delivered to the customer’s site, we continue to create value through our aftermarket capabilities by optimizing
the performance of the equipment over its operational life. Our skilled service personnel can provide these
aftermarket services for our products, as well as many competitors’ products, within the installed base. This value is
further enhanced by the global reach of our QRCs and, when combined with our other solutions for our customers’
flow control management needs, allows us to create value for our customers during all phases of the capital and
operating expenditure cycles.
Customers
We sell to a wide variety of customers globally including leading EPC firms, original equipment manufacturers,
distributors and end users in several distinct industries: oil and gas, chemical, power generation, water management
and general industries. We do not have sales to any individual customer that represent 10% or more of consolidated
2020 revenues. Customer information relating to each of our business segments is discussed in more detail under the
‘‘Business Segments’’ heading below.
We are not normally required to carry unusually high amounts of inventory to meet customer delivery
requirements, although higher backlog levels and longer lead times generally require higher amounts of inventory.
We typically require advance cash payments from customers on longer lead time projects to help offset our
investment in inventory. While we do provide cancellation policies through our contractual relationships, we
generally do not provide rights of product return for our customers. We manage inventory more stringently and
intensively during challenging cycles by actively managing and applying discrete measures to reduce inventory levels
based on current demand and visibility of shipments, with the overall target at improving our operational
effectiveness and reduce our overall working capital needs.
Selling and Distribution
We primarily distribute our products through direct sales by employees assigned to specific regions, industries
or products. In addition, we use distributors and sales representatives to supplement our direct sales force where it
is more economically efficient. We generate a majority of our sales leads through existing relationships with vendors,
customers and prospects or through referrals.
Intellectual Property
We own a number of trademarks and patents relating to the names and designs of our products. We consider our
trademarks and patents to be valuable assets of our business. In addition, our pool of proprietary information,
consisting of know-how and trade secrets related to the design, manufacture and operation of our products, is
considered particularly valuable. Accordingly, we take proactive measures to protect such proprietary information.
We generally own the rights to the products that we manufacture and sell and are unencumbered by licensing or
franchise agreements. In limited circumstances, we have entered into agreements to license intellectual property. The
operational and financial terms of these agreements are not material. Our trademarks can typically be renewed
indefinitely as long as they remain in use, whereas our existing patents generally expire 10 to 20 years from the dates
they were filed, which has occurred at various times in the past. We do not believe that the expiration of any
individual patent will have a material adverse impact on our business, financial condition or results of operations.
Raw Materials
The principal raw materials used in manufacturing our products are readily available and include ferrous and
non-ferrous metals in the form of bar stock, machined castings, fasteners, forgings and motors, as well as silicon,
carbon faces, gaskets and fluoropolymer components. A substantial volume of our raw materials is purchased from
4

outside sources, and we have been able to develop a robust supply chain and anticipate no significant shortages of
such materials in the future. We continually monitor the business conditions of our suppliers to manage competitive
market conditions and to avoid potential supply disruptions. We continue to expand global sourcing to capitalize on
localization in emerging markets and low-cost sources of purchased goods balanced with efficient consolidated and
compliant logistics.
Metal castings used in the manufacture of our pump, valve, and mechanical seals are purchased from qualified
and approved foundry sources. We remain vertically integrated with metal castings in certain strategic product
families.
Concerning the products we supply to customers in the nuclear power generation industry, suppliers of raw
materials for nuclear power generation markets must be qualified to meet the requirements of nuclear industry
standards and governmental regulations. Supply channels for these materials are currently adequate, and we do not
anticipate difficulty in obtaining such materials in the future.
Human Capital Management
Our associates worldwide are critical to delivering on our purpose to create extraordinary flow control solutions.
As a global manufacturer, our values start with our people - we strive to create a collaborative team environment that
enables us to develop each other, embrace our differences and respect one another.
As of December 31, 2020, we have approximately 16,000 employees (‘‘associates’’) globally and a footprint of
manufacturing facilities and Quick Response Centers in more than 50 countries. Of our global associates, there are
approximately 3,500 in the Flowserve Pump Division (‘‘FPD’’), 3,500 in the Flow Control Division (‘‘FCD’’) and
4,500 supporting the aftermarket sales and services business across both divisions. The remaining 4,500 associates
support core business functions including legal, human resources, information technology, finance, commercial
operations and sales, global engineering operations and marketing and technology operations. Regionally,
approximately 5,000 of our associates are in North America, approximately 1,600 of our associates are in Latin
America, approximately 5,900 of our associates are in Europe, the Middle East and Africa, and approximately 3,500
of our associates are in Asia Pacific. Our workforce is made up of approximately 9,000 salaried employees and
7,000 hourly employees.
We are committed to achieving business success with integrity at the forefront. All of our associates and our
Board of Directors are governed by our Code of Conduct as we continuously work together to improve our operations
by fostering a work environment that supports employee health, safety, training, development, diversity, equity and
inclusion. In order to create that environment, members of management work together to identify areas of opportunity
and develop and implement various policies, procedures, and initiatives in these key areas. Members of management
also provide quarterly (or more frequent, as needed) updates to our Board of Directors, who provide additional input
and guidance to management. Additionally, we conduct annual employee engagement surveys to solicit feedback and
input directly from our associates. In 2020, more than 80% of our associates participated in our employee engagement
survey. Based on the results of our surveys, management and our Board of Directors work together to create
additional action plans as appropriate.
Workplace Health and Safety: We strive to create and maintain a safe working environment, empowering our
employees to identify and report safety concerns and act to correct hazards. Our focus on safety and environmental
protection has led to meaningful reductions in workplace safety incidents, emissions to the environment, and solid
waste and hazardous waste generation at our facilities worldwide.
Compensation and Benefits: We maintain a market-based compensation strategy that provides a competitive
total target compensation opportunity for our associates. We also value the health and well-being of our associates
and offer competitive overall benefits, health and wellness programs tailored to the specific localized needs of our
employees. We offer a global employee assistance program to support the mental health and wellness needs our
employees, as well as physical health incentives aimed at creating healthy lives for our employees and their families.
Training, Development and Ethics: Developing our people is an essential aspect of the Flowserve journey.
Flowserve believes that development is a continuous process. We offer developmental opportunities to help our
associates build the skills needed to reach their short-term and long-term career goals, including but not limited to
5

on-the-job training, online learning, rotational programs, professional memberships, language learning and leadership
and management training. To help our associates see how their work contributes to overall Company objectives and
successes, management utilize a robust performance management system and provide regular feedback in order to
develop talent and foster engagement.
Recognizing that our associates are our most valuable resource in achieving operational excellence, we have
instituted broad Continuous Improvement Process (‘‘CIP’’) training initiatives, certifying or training our employees
as ‘‘black belts’’ or ‘‘green belts’’ and deploying them to CIP led projects throughout the Company. As a result, we
have developed and implemented processes to shorten engineering and manufacturing cycle times, improve on-time
delivery and service response time, lower inventory levels and otherwise reduce costs. To date, over 800 of our
employees are CIP certified.
Environmental Regulations and Proceedings
We are subject to environmental laws and regulations in all jurisdictions in which we have operating facilities.
These requirements primarily relate to the generation and disposal of waste, air emissions and waste water discharges.
We periodically make capital expenditures to enhance our compliance with environmental requirements, as well as
to abate and control pollution. At present, we have no plans for any material capital expenditures for environmental
control equipment at any of our facilities. However, we have incurred and continue to incur operating costs relating
to ongoing environmental compliance matters. Based on existing and proposed environmental requirements and our
anticipated production schedule, we believe that future environmental compliance expenditures will not have a
material adverse effect on our financial condition, results of operations or cash flows.
We use hazardous substances and generate hazardous wastes in many of our manufacturing and foundry
operations. Most of our current and former properties are or have been used for industrial purposes and some may
require clean-up of historical contamination. During the due diligence phase of our acquisitions, we conduct
environmental site assessments to identify potential environmental liabilities and required clean-up measures. We are
currently conducting follow-up investigation and/or remediation activities at those locations where we have known
environmental concerns. We have cleaned up a majority of the sites with known historical contamination and are
addressing the remaining identified issues.
Over the years, we have been involved as one of many potentially responsible parties (‘‘PRP’’) at former public
waste disposal sites that are or were subject to investigation and remediation. We are currently involved as a PRP at
four Superfund sites. The sites are in various stages of evaluation by government authorities. Our total projected ‘‘fair
share’’ cost allocation at these four sites is expected to be immaterial. See ‘‘Item 3. Legal Proceedings’’ included in
this Annual Report for more information.
We have established reserves that we currently believe to be adequate to cover our currently identified on-site
and off-site environmental liabilities.
Exports
Our export sales from the U.S. to foreign unaffiliated customers were $264.6 million in 2020, $300.9 million
in 2019 and $234.3 million in 2018.
Licenses are required from U.S. and other government agencies to export certain products. In particular,
products with nuclear power generation and/or military applications are restricted, as are certain other pump, valve
and seal products.
BUSINESS SEGMENTS
We report a two operating segment structure, consisting of our Flowserve Pumps Division and our Flow Control
Division. In addition to the business segment information presented below, Note 20 to our consolidated financial
statements in Item 8 of this Annual Report contains additional financial information about our business segments and
geographic areas in which we have conducted business in 2020, 2019 and 2018.
FLOWSERVE PUMP DIVISION
Our largest business segment is FPD, through which we design, manufacture, pre-test, distribute and service
specialty and highly-engineered custom and pre-configured pumps and pump systems, mechanical seals, auxiliary
systems, replacement parts and upgrades and related aftermarket services (collectively referred to as ‘‘aftermarket’’).
6

FPD products and services are primarily used by companies that operate in the oil and gas, petrochemical, chemical,
power generation, water management and general industries. We market our pump and mechanical seal products
through our global sales force and our regional QRCs and service and repair centers or through independent
distributors and sales representatives. A portion of our mechanical seal products are sold directly to other original
equipment manufacturers for incorporation into their rotating equipment requiring mechanical seals.
Our pump products are manufactured in a wide range of metal alloys and with a variety of configurations to
reliably meet the operating requirements of our customers. Mechanical seals are critical to the reliable operation of
rotating equipment in that they prevent leakage and emissions of hazardous substances from the rotating equipment
and reduce shaft wear on the equipment caused by the use of non-mechanical seals. We also manufacture a
gas-lubricated mechanical seal that is used in high-speed compressors for gas pipelines and in the oil and gas
production and process markets. Our products are currently manufactured in 39 manufacturing facilities worldwide,
13 of which are located in Europe, 12 in North America, eight in Asia Pacific and six in Latin America, and we have
137 QRCs, including those co-located in manufacturing facilities and/or shared with FCD.
We also conduct business through strategic foreign joint ventures. We have six unconsolidated joint ventures that
are located in Chile, China, India, Saudi Arabia, South Korea and the United Arab Emirates, where a portion of our
products are manufactured, assembled or serviced in these territories. These relationships provide numerous strategic
opportunities, including increased access to our current and new markets, access to additional manufacturing capacity
and expansion of our operational platform to support best-cost sourcing initiatives and balance capacity demands for
other markets.
FPD Products
We manufacture more than 40 different active types of pumps and approximately 185 different models of
mechanical seals and sealing systems. The following is a summary list of our FPD product types and globally
recognized brands:
FPD Product Types
Single and Multistage Between Bearings Pumps Single Stage Overhung Pumps
• Single Case — Axially Split • API Process
• Single Case — Radially Split
• Double Case
Overhung Pumps Between Bearings Pumps
• Chemical Process ASME and ISO • Single Case — Radially Split
• Industrial Process • Side Channel Multistage
• Slurry and Solids Handling • Split Case — Axially Split
• Metallic & Lined Magnetic Drive Process • Split Case — Radially Split
Positive Displacement Pumps Mechanical Seals and Seal Support Systems
• Rotary Multiphase • Dry-Running Seals
• Rotary Screw • Barrier Fluids and Lubricants
• Bearing Isolators
Vertical Pumps • Compressor Seals
• Deepwell Submersible • Gas Barrier Seals
• Slurry and Solids Handling • Mixer Seals
• Sump & Cantilever • Standard Cartridge Seals
• Vertical Inline • Seal Support Systems
• Vertical Line Shaft
• Vertical Canned Shaft Vacuum Systems
• Wet Pit, Double Case API & Double • Liquid Ring
• LR Systems
7

Positive Displacement Pumps • Dry Systems
• Gear
Specialty Products
• Ag Chem • Submersible Pumps
• Barge Pumps • Solids Handling Submersible
• Cryogenic Pumps • Wireless Transmitters
• Concrete Volute Pumps • Power Recovery — DWEER
• Ebullator Recycle Pumps • Power Recovery — Hydro Turbine
• Geothermal Deepwell Pumps • Energy Recovery Devices
• Molten Salt Pumps • Hydraulic Decoking Systems
• Nuclear Pumps • API Slurry Pumps
• Nuclear Seals
FPD Brand Names
• BW Seals • Meregalli
• Byron Jackson • Niigata Worthington
• Calder Energy Recovery Devices • QRC™
• Durametallic • Pacific
• Durco • Pacific Weitz
• Five Star Seal • Pac-Seal
• Flowserve • ReadySeal
• GASPAC™ • Scienco
• Halberg • SIHI
• IDP • TKL
• Innomag • United Centrifugal
• Interseal • Western Land Roller
• Lawrence • Worthington
• LifeCycle Advantage • Worthington-Simpson
• Labour
FPD Services
We market our pump products through our worldwide sales force, regional service and repair centers,
independent distributors and sales representatives. We also provide engineered aftermarket services through our
global network of 137 QRCs, some of which are co-located in manufacturing facilities, in 48 countries. Our FPD
service personnel provide a comprehensive set of equipment services for flow management control systems,
including installation, commissioning services, seal systems spare parts, repairs, advanced diagnostics, re-rate and
upgrade solutions and retrofit programs, machining and comprehensive asset management solutions. We provide
asset management services and condition monitoring for rotating equipment through special contracts with many of
our customers that reduce maintenance costs. A large portion of FPD’s service work is performed on a quick response
basis, and we offer 24-hour service in all of our major markets.
FPD New Product Development
Our investments in new product R&D continue to focus on increasing the capability of our products as customer
applications become more advanced, demanding greater levels of production (i.e., flow and power) and under more
extreme conditions (i.e., erosive, corrosive and temperature) beyond the level of traditional technology. We will
invest in our product platform to expand and enhance our products offered to the global chemical industry. We
continue to develop innovations that improve our competitive position in the engineered equipment industry,
specifically upstream, offshore and downstream applications for the oil and gas market. Continued engagement with
our end users is exemplified through the completion of advancements that significantly improve energy efficiency,
reduce total cost-of-ownership and enhance safety.
8

As new sources of energy generation are explored, we continue to develop new product designs to support the
most critical applications in the power generation market. New designs and qualification test programs continue to
support the critical services found in the coal fired, combined cycle, small modular nuclear and concentrated solar
power generation plant.
We continue to address our core products with design enhancements that improve performance, reduce costs,
extend operating life between required maintenance periods and reduce the lead times in which we can deliver our
products. Our engineering teams continue to apply and develop sophisticated design technology and methods
supporting continuous improvement of our proven technology. Additionally, we are incentivizing our operations and
tracking the R&D projects more closely, which is leading to broader engagement in developing new products.
We continue to advance our capabilities and technology position in the rapidly developing segment known as
the Industrial Internet of Things (‘‘IIoT’’). Over the past few years we have continued to both invest and partner in
this space to build remote monitoring solutions, as well as advanced equipment diagnostics in order to provide remote
asset management and related services capabilities for our end-user customers. These technologies include delivering
intelligent ‘‘edge’’ devices, advanced networking infrastructure and secure communication and security protocols,
secure data management, and remote monitoring and reporting for our customers. In addition, we have moved beyond
exploring new additive manufacturing capabilities, such as 3D printing and fast casting methods, and are looking for
ways to economically scale these techniques as another means of manufacturing our products to both reduce lead time
and lower our production costs.
None of these newly developed products or services required the investment of a material amount of our assets
or was otherwise material to our business.
FPD Customers
Our customer mix is diversified and includes leading EPC firms, major national oil companies, international oil
companies, equipment end users in our served markets, other original equipment manufacturers, distributors and end
users. Our sales mix of original equipment products and aftermarket products and services diversifies our business
and helps mitigate the impact of normal economic cycles on our business. Our sales are diversified among several
industries, including oil and gas, petrochemical, chemical, power generation, water management and general
industries.
FPD Competition
The pump and mechanical seal industry is highly fragmented, with thousands of competitors globally. We
compete, however, primarily with a limited number of large companies operating on a global scale. There are also
a number of smaller, newer entrants in some of our emerging markets. Competition among our closest competitors
is generally driven by delivery times, application knowledge, experience, expertise, price, breadth of product
offerings, contractual terms, previous installation history and reputation for quality. Some of our largest industry
competitors include: Sulzer Pumps; Ebara Corp.; SPX FLOW, Inc.; Eagle Burgmann, which is a joint venture of two
traditional global seal manufacturers, A. W. Chesterton Co. and AES Corp.; John Crane Inc., a unit of Smiths Group
Plc; Weir Group Plc.; ITT Industries; and KSB SE & Co. KGaA.
The pump and mechanical seal industry continues to undergo considerable consolidation, which is primarily
driven by (i) the need to lower costs through reduction of excess capacity and (ii) customers’ preference to align with
global full service suppliers to simplify their supplier base. Despite the consolidation activity, the market remains
highly competitive.
We believe that our strongest sources of competitive advantage rest with our extensive range of pumps for the
oil and gas, petrochemical, chemical and power generation industries, our large installed base of products, our strong
customer relationships, our high technology, our more than 225 years of experience in manufacturing and servicing
pumping equipment, our reputation for providing quality engineering solutions and our ability to deliver engineered
new seal product orders within 72 hours from the customer’s request.
FPD Backlog
FPD’s backlog of orders as of December 31, 2020 was $1,236.9 million, compared with $1,560.9 million as of
December 31, 2019. We expect to recognize revenue on approximately 90% of December 31, 2020 backlog during
2021.
9

FLOW CONTROL DIVISION
FCD designs, manufactures, distributes and services a broad portfolio of flow control solutions, including
engineered and industrial valve and automation systems, isolation and control valves, actuation, controls and related
equipment. FCD leverages its experience and application know-how by offering a complete menu of engineering and
project management services to complement its expansive product portfolio. FCD products are used to control, direct
and manage the flow of liquids, gases and multi-phase fluids, and are a critical part of any flow control system. Our
valve and automation products are based on flexible architecture that can be customized or engineered to perform
specific functions within each customer’s unique flow control environment or objective.
Our flow control products are primarily used by companies operating in the chemical, power generation, oil and
gas, water management and general industries. Our products are currently manufactured in 21 principal
manufacturing facilities, five of which are located in the U.S., 10 located in Europe, five located in Asia Pacific and
one located in Latin America. We deliver our services through our global network of 27 QRCs worldwide, including
five sites in Europe and Africa, nine in North America, three in the Middle East, eight in Asia Pacific and two in Latin
America, including those co-located in manufacturing facilities.
FCD Products
Our valve, automation and controls product and solutions portfolio represent one of the most comprehensive in
the flow control industry. Our products are used in a wide variety of applications, from general service to the most
severe and demanding services, including those involving high levels of corrosion, extreme temperatures and/or
pressures, zero fugitive emissions and emergency shutdown.
Our ‘‘smart’’ valve and diagnostic technologies integrate sensors, microprocessor controls and software into
high performance integrated control valves, digital positioners and switchboxes for automated on/off valve
assemblies and electric actuators. These technologies permit real-time system analysis, system warnings and remote
indication of asset health. These technologies have been developed in response to the growing demand for reduced
maintenance, improved process control efficiency and digital communications at the plant level. We are committed
to further enhancing the quality of our product portfolio by continuing to upgrade our existing offerings with
cutting-edge technologies.
Our valve actuation products encompass a broad range of pneumatic, electric, hydraulic and stored energy
actuation designs to take advantage of whatever power source the customer has available, including utilizing the
process fluid flowing through the pipeline as a source of power to actuate the valve. Our actuation products also cover
one of the widest ranges of output torques in the industry, providing the ability to automate anything from the smallest
linear globe valve to the largest multi-turn gate valve. Most importantly, FCD combines best-in-class mechanical
designs with the latest in controls and communication technologies in order to provide complete integrated
automation solutions that optimize flow control performance and enhance digital end-user experience.
The following is a summary list of our valve and automation products and globally recognized brands:
FCD Product Types
• Ball Valves • Intelligent Positioners• Butterfly Valves • Isolation Valves• Check Valves • Limit Switches• Control Valves • Linear Actuators• Diagnostic Software • Lined Ball Valves• Diaphragm Actuators • Lined Plug Valves• Digital Communications • Lubricated Plug Valves• Digital Positioners • Non-Lubricated Plug Valves• Direct Gas and Gas-over-Oil Actuators • On-Off Valves• Electric/Electronic Actuators • Pneumatic Actuators• Electro Pneumatic Positioners • Pneumatic Positioners• Gate Valves • Rotary Actuators• Globe Valves • Valve Automation Systems• Hydraulic Actuators • Valve and Automation Repair Services• Integrated Valve Controllers
10

FCD Brand Names
• Accord • McCANNA/MARPAC• Anchor/Darling • NAF• Argus • Noble Alloy• Atomac • Norbro• Automax • Nordstrom• Durco • PMV• Edward • Serck Audco• Flowserve • Valbart• Kammer • Valtek• Limitorque • Worcester Controls• Logix
FCD Services
Our service personnel provide comprehensive equipment maintenance services for flow control systems,
including advanced diagnostics, repair, installation, commissioning, retrofit programs and field machining
capabilities. A large portion of our service work is performed on a quick response basis, which includes 24-hour
service in all of our major markets. We also provide in-house repair and return manufacturing services worldwide
through our manufacturing facilities. We believe our ability to offer comprehensive, quick turnaround services
provides us with a unique competitive advantage and unparalleled access to our customers’ installed base of flow
control products.
FCD New Product Development
Our R&D investment is focused on areas that will enhance end-user experience and advance our technological
leadership by creating compelling value propositions for our customers, and lasting competitive advantage of our
products and services in the market. In that respect, our investments have been focusing in four critical areas –
(1) significantly enhancing the digital integration and interoperability of automation products (e.g., positioners,
actuators, limit switches and associated accessories) with Distributed Control Systems (‘‘DCS’’) and Asset
Management Systems (‘‘AMS’’); (2) developing and deploying next-generation hardware and software solutions that
leverage our in-depth domain knowledge, big data and artificial intelligence, to further flow control diagnostics and
bring insights that increase performance and efficiency of end-user processes; (3) advancing material science and
processing technologies in order to further increase products’ capabilities in severe and critical services – including
but not limited to noise and cavitation reduction; and (4) investing in our talents and processes that adopt modern
R&D project management tools (such as lean startup, SCRUM, agile and hybrid portfolio management, etc.) that
enable effective risk mitigation and shorter commercialization cycles. We expect to continue our R&D investments
in the areas discussed above.
None of these newly developed valve products or services required the investment of a material amount of our
assets or was otherwise material.
FCD Customers
Our customer mix spans several end markets, including the chemical, power generation, oil and gas, water
management, pulp and paper, mining and other general industries. We are especially active in providing solutions for
emerging applications that supports sustainability (such as concentrated solar power, hydrogen economy, carbon
capture, desalination, etc.) or increases energy productivity (such as LNG, Ethylene cracking, Hydrocracking, etc.).
Our product offerings include original equipment, aftermarket parts, and a portfolio of services and solutions.
Contracts and transactions are conducted through a variety of channels depending on customer requirements,
including direct end-users, EPC firms, distributors, and other original equipment manufacturers.
FCD Competition
While in recent years the valve market has undergone a significant amount of consolidation, the market remains
highly fragmented. Some of the largest valve industry competitors include Emerson Electric Co., Cameron
International Corp. (a Schlumberger company), Baker Hughes, Rotork plc, Neles and Crane Co.
11

Our market research and assessments indicate that the top 10 global valve manufacturers collectively comprise
less than 15% of the total valve market. Based on independent industry sources, we believe that FCD is the second
largest industrial valve supplier in the world. We believe that our strongest sources of competitive advantage rest with
our comprehensive portfolio of valve and automation products and services, our ability to provide complementary
pump and rotating equipment products and services, our focus on execution, our expertise in severe corrosion and
erosion applications, and strategic partnerships purposely built to advance market adoption of new technologies and
digital tools.
FCD Backlog
FCD’s backlog of orders as of December 31, 2020 was $623.1 million, compared with $600.0 million as of
December 31, 2019. We expect to recognize revenue on approximately 89% of December 31, 2020 backlog during
2021.
AVAILABLE INFORMATION
We maintain an Internet web site at www.flowserve.com. Our Annual Reports on Form 10-K, Quarterly Reports
on Form 10-Q, Current Reports on Form 8-K and any amendments to those reports filed or furnished pursuant to
Section 13(a) of the Securities Exchange Act of 1934 are made available free of charge through the ‘‘Investor
Relations’’ section of our Internet web site as soon as reasonably practicable after we electronically file the reports
with, or furnish the reports to, the U.S. Securities and Exchange Commission (‘‘SEC’’). Reports, proxy statements
and other information filed or furnished with the SEC are also available at www.sec.gov.
Also available on our Internet web site are our Corporate Governance Guidelines for our Board of Directors and
Code of Ethics and Business Conduct, as well as the charters of the Audit, Finance and Risk, Organization and
Compensation and Corporate Governance and Nominating Committees of our Board of Directors and other important
governance documents. All of the foregoing documents may be obtained through our Internet web site as noted above
and are available in print without charge to shareholders who request them. Information contained on or available
through our Internet web site is not incorporated into this Annual Report or any other document we file with, or
furnish to, the SEC.
12

ITEM 1A. RISK FACTORS
Please carefully consider the following discussion of material factors, events, and uncertainties that make an
investment in our securities risky. When the factors, events and contingencies discussed below or elsewhere in this
Annual Report materialize, our business, financial condition, results of operations, cash flows, reputation or prospects
could be materially adversely affected. While we believe all known material risks are disclosed, additional risks and
uncertainties not presently known to us, or that we currently deem immaterial, may also materially adversely affect
our business, financial condition, results of operations, cash flows, reputation, prospects or stock price. Because of
the risk factors discussed below and elsewhere in this Annual Report and in other filings we make with the SEC,
as well as other variables affecting our operating results, past financial performance may not be a reliable indicator
of future performance, historical trends should not be used to anticipate results or trends in future periods and actual
results could differ materially from those projected in the forward-looking statements contained in this Annual
Report.
Business and Operating Risks
Our business depends on our customers’ levels of capital investment and maintenance expenditures, whichin turn are affected by numerous factors, including changes in the state of domestic and global economies, globalenergy demand and the liquidity cyclicality and condition of global credit and capital markets, which haveimpacted and which could continue to impact the ability or willingness of our customers to invest in our productsand services and adversely affect our financial condition, results of operations and cash flow.
Demand for most of our products and services depends on the level of new capital investment and planned
maintenance expenditures by our customers. The level of capital expenditures by our customers depends, in turn, on
general economic conditions, availability of credit, economic conditions within their respective industries and
expectations of future market behavior. Additionally, volatility in commodity prices can negatively affect the level
of these activities and can result in postponement of capital spending decisions or the delay or cancellation of existing
orders. The ability of our customers to finance capital investment and maintenance is also affected by factors
independent of the conditions in their industry, such as the condition of global credit and capital markets.
The businesses of many of our customers, particularly oil and gas companies, chemical companies and general
industrial companies, are to varying degrees cyclical and have experienced periodic downturns. Our customers in
these industries, particularly those whose demand for our products and services is primarily profit-driven, tend to
delay large capital projects, including expensive maintenance and upgrades, during economic downturns. For
example, our chemical customers generally tend to reduce their spending on capital investments and operate their
facilities at lower levels in a soft economic environment, which reduces demand for our products and services.
Additionally, fluctuating energy demand forecasts and lingering uncertainty concerning commodity pricing,
specifically the price of oil, have caused, and may in the future cause, our customers to be more conservative in their
capital planning, reducing demand for our products and services. Reduced demand for our products and services
could result in the delay or cancellation of existing orders or lead to excess manufacturing capacity, which
unfavorably impacts our absorption of fixed manufacturing costs. This reduced demand has in the past and may
continue in the future to also erode average selling prices in our industry. Any of these results could continue to
adversely affect our business, financial condition, results of operations and cash flows.
The novel coronavirus (‘‘COVID-19’’, ‘‘Pandemic’’) pandemic, and the volatile regional and global economic
conditions stemming from the pandemic, have precipitated or aggravated many of the factors described above, and
we expect that these factors will continue to adversely impact our operations and financial performance as well as
those of many of our customers and suppliers. For further discussion of the risks presented by the ongoing pandemic,
see the discussion below under the heading ‘‘The outbreak and global spread of the novel coronavirus (COVID-19)
are having an adverse impact on our operations and financial performance, as well as on the operations and financial
performance of many of our customers and suppliers. We are unable to predict the full extent to which the COVID-19
pandemic will continue to adversely impact our operations, financial performance, results of operations, financial
condition, cash flows and/or stock price.’’
Additionally, our customers sometimes delay capital investment and maintenance even during favorable
conditions in their industries or markets. Despite these favorable conditions, the general health of global credit and
capital markets and our customers’ ability to access such markets impacts investments in large capital projects,
including necessary maintenance and upgrades. In addition, the liquidity and financial position of our customers
impacts capital investment decisions and their ability to pay in full and/or on a timely basis. Any of these factors,
13

whether individually or in the aggregate, could have a material adverse effect on our customers and, in turn, our
business, financial condition, results of operations and cash flows.
Volatility in commodity prices, effects from credit and capital market conditions and global economic growthforecasts have in the past prompted and may in the future prompt customers to delay or cancel existing orders,which could adversely affect the viability of our backlog and could impede our ability to realize revenues on ourbacklog.
Our backlog represents the value of uncompleted customer orders. While we cannot be certain that reported
backlog will be indicative of future results, our ability to accurately value our backlog can be adversely affected by
numerous factors, including the health of our customers’ businesses and their access to capital, volatility in
commodity prices (e.g., copper, nickel, stainless steel) and economic uncertainty. While we attempt to mitigate the
financial consequences of order delays and cancellations through contractual provisions and other means, if we were
to experience a significant increase in order delays or cancellations that can result from the aforementioned economic
conditions or other factors beyond our control, it could impede or delay our ability to realize anticipated revenues on
our backlog. Such a loss of anticipated revenues could have a material adverse effect on our business, financial
condition, results of operations and cash flows.
Our inability to deliver our backlog on time could affect our revenues, future sales and profitability and ourrelationships with customers.
At December 31, 2020, our backlog was $1.9 billion. In 2021, our ability to meet customer delivery schedules
for backlog is dependent on a number of factors including, but not limited to, sufficient manufacturing plant capacity,
adequate supply channel access to the raw materials and other inventory required for production, an adequately
trained and capable workforce, project engineering expertise for certain large projects and appropriate planning and
scheduling of manufacturing resources. Our manufacturing plant operations, capacity and supply chain are subject
to disruption as a result of equipment failure, severe weather conditions and other natural or manmade disasters,
including power outages, fires, explosions, terrorism, cyber-based attacks, conflicts or unrest, epidemics or
pandemics (including the ongoing global COVID-19 pandemic), labor disputes, acts of God, or other reasons. We
may also encounter capacity limitations due to changes in demand despite our forecasting efforts. Many of the
contracts we enter into with our customers require long manufacturing lead times and contain penalty clauses related
to late delivery. Failure to deliver in accordance with contract terms and customer expectations could subject us to
financial penalties, damage existing customer relationships, increase our costs, reduce our sales and have a material
adverse effect on our business, financial condition, results of operations and cash flows.
Failure to successfully execute and realize the expected financial benefits from our transformation andstrategic realignment and other cost-saving initiatives could adversely affect our business.
In the second quarter of 2018, we launched and committed resources to our Flowserve 2.0 Transformation, a
program designed to transform our business model to drive operational excellence, reduce complexity, accelerate
growth, improve organizational health and better leverage our existing global platform. Additionally, in the second
quarter of 2020, we identified and initiated certain realignment activities resulting from our Flowserve
2.0 Transformation to right-size our organizational operations based on the current business environment, with the
overall objective to reduce our workforce costs.
While we have experienced significant financial benefits from our Flowserve 2.0 Transformation, we may not
realize the full benefits that we currently expect within the anticipated time frame or at all. Adverse effects from our
execution of transformation and realignment activities could interfere with our realization of anticipated synergies,
customer service improvements and cost savings from these strategic initiatives. Additionally, our ability to fully
realize the benefits and implement the transformation and realignment programs is limited by the terms of our credit
facilities and other contractual commitments. Moreover, because such expenses are difficult to predict and are
necessarily inexact, we may incur substantial expenses in connection with the execution of our transformation and
realignment plans in excess of what is currently anticipated. Further, transformation and realignment activities are a
complex and time-consuming process that can place substantial demands on management, which could divert
attention from other business priorities or disrupt our daily operations. Any of these failures could, in turn, materially
adversely affect our business, financial condition, results of operations and cash flows, which could constrain our
liquidity.
14

If these measures are not successful or sustainable, we may undertake additional realignment and cost reduction
efforts, which could result in future charges. Moreover, our ability to achieve our other strategic goals and business
plans may be adversely affected, and we could experience business disruptions with customers and elsewhere if our
transformation and realignment efforts prove ineffective.
We sell our products in highly competitive markets, which results in pressure on our profit margins and limitsour ability to maintain or increase the market share of our products.
The markets for our products and services are geographically diverse and highly competitive. We compete
against large and well-established national and global companies, as well as regional and local companies, low-cost
replicators of spare parts and in-house maintenance departments of our end-user customers. We compete based on
price, technical expertise, timeliness of delivery, contractual terms, project management, proximity to service centers,
previous installation history and reputation for quality and reliability. Competitive environments in slow-growth
industries and for original equipment orders have been inherently more influenced by pricing and domestic and global
economic conditions and current economic forecasts suggest that the competitive influence of pricing has broadened.
Additionally, some of our customers have been attempting to reduce the number of vendors from which they purchase
in order to reduce the size and diversity of their supply chain. To remain competitive, we must invest in
manufacturing, technology, marketing, customer service and support and our distribution networks. No assurances
can be made that we will have sufficient resources to continue to make the investment required to maintain or
increase our market share or that our investments will be successful. In addition, negative publicity or other organized
campaigns critical of us, through social media or otherwise, could negatively affect our reputation and competitive
position. If we do not compete successfully, our business, financial condition, results of operations and cash flows
could be materially adversely affected.
Failure to successfully develop and introduce new products could limit our ability to grow and maintain ourcompetitive position and adversely affect our financial condition, results of operations and cash flow.
The success of new and improved products and services depends on their initial and continued acceptance by
our customers. Our businesses are affected by varying degrees of technological change and corresponding shifts in
customer demand, which result in unpredictable product transitions, shortened life cycles and increased importance
of being first to market with new products and services. Difficulties or delays in the research, development,
production and/or marketing of new products and services may negatively impact our operating results and prevent
us from recouping or realizing a return on the investments required to continue to bring these products and services
to market.
Our inability to obtain raw materials at favorable prices may adversely affect our operating margins andresults of operations.
We purchase substantially all electric power and other raw materials we use in the manufacturing of our products
from outside sources. The costs of these raw materials have been volatile historically and are influenced by factors
that are outside our control. In recent years, the prices for energy, metal alloys, nickel and certain other of our raw
materials have been volatile. While we strive to offset our increased costs through supply chain management,
contractual provisions and our Continuous Improvement Process initiative, where gains are achieved in operational
efficiencies, our operating margins and results of operations and cash flows may be adversely affected if we are
unable to pass increases in the costs of our raw materials on to our customers or operational efficiencies are not
achieved.
The outbreak and global spread of the novel coronavirus (COVID-19) are having an adverse impact on ouroperations and financial performance, as well as on the operations and financial performance of many of ourcustomers and suppliers. We are unable to predict the full extent to which the COVID-19 pandemic will continueto adversely impact our operations, financial performance, results of operations, financial condition, cash flowsand/or stock price.
The COVID-19 pandemic has curtailed the movement of people, goods and services worldwide, including in
most of the regions in which we conduct our operations. As part of intensifying efforts to contain the spread of
COVID-19, a number of local, state and national governments have imposed various restrictions on the conduct of
business and travel, such as stay-at-home orders and quarantines, that have led to a significant number of business
slowdowns and closures. The COVID-19 pandemic has resulted in, and is expected to continue to result in,
15

a substantial curtailment of business activities (including the decrease in demand for a broad variety of goods and
services), weakened economic conditions, supply chain disruptions, significant economic uncertainty and volatility
in the financial and commodity markets, including the reduction in global demand for oil and gas combined with
excessive supply due to disagreements between OPEC, both in the United States and abroad.
The COVID-19 pandemic is adversely impacting, and is expected to continue to adversely impact, our
operations and financial performance, and has had an adverse impact on the operations and financial performance of
many of our customers and suppliers. These impacts have included, and may continue to include: adverse revenue
and income effects; disruptions to our global operations; customer shutdowns; customer reductions in capital
expenditures, particularly for large projects; disruptions and delays in our supply chain; employee impacts from
illness, shelter-in-place orders and other community response measures; modifications to business practices, such as
mandatory work-from-home policies, restrictions on travel (including, in some cases, restrictions on travel to
customer facilities); increased operational expenses and underutilized manufacturing capacity; and increased
sanitation and hygiene practices in our facilities; and temporary closures of our facilities or the facilities of our
customers and suppliers.
Because the severity, magnitude and duration of the COVID-19 pandemic and its economic consequences are
uncertain, rapidly changing and difficult to predict, the pandemic’s impact on our operations and financial
performance remains uncertain and difficult to predict. Further, the ultimate impact of the COVID-19 pandemic on
our operations and financial performance depends on many factors that are not within our control, including, but not
limited, to: governmental, business and individuals’ actions that have been and continue to be taken in response to
the pandemic (including restrictions on travel and transport, workforce pressures and social distancing and
shelter-in-place orders); the impact of the pandemic and actions taken in response on global and regional economies,
travel and economic activity; general economic uncertainty in key global markets and financial market volatility; the
effect of the pandemic on the credit-worthiness of our customers; national or global supply chain challenges or
disruption; facility closures; commodity cost volatility (including the time it takes for oil prices and demand to
stabilize after the pandemic subsides); global economic conditions and levels of economic growth; and the pace of
recovery when the COVID-19 pandemic subsides, as well as response to a potential reoccurrence.
Further, the COVID-19 pandemic, and the volatile regional and global economic conditions stemming from the
pandemic, could also precipitate or aggravate the other risk factors that we identify herein, which could adversely
affect our operations, financial condition, results of operations and/or stock price. Further, COVID-19 may also affect
our operating and financial results in a manner that is not presently known to us or that we currently do not consider
to present material risks to our operations.
Terrorist acts, conflicts, wars, natural or manmade disasters, epidemics or pandemics, acts of God and othersuch events around the world at times materially adversely affect our business, financial condition and results ofoperations and the market for our common stock.
As a global company with a large international footprint, we are subject to increased risk of damage or disruption
to us, our employees, facilities, partners, suppliers, distributors, resellers or customers due to, among other things,
terrorist acts, conflicts, wars, severe weather conditions and other natural or manmade disasters, including power
outages, fires, explosions, cyber-based attacks, epidemics or pandemics (including the ongoing COVID-19
pandemic), labor disputes, and acts of God wherever located around the world. The potential for future such events,
the national and international responses to such events or perceived threats to national security, and other actual or
potential conflicts or wars, such as the Israeli-Hamas conflict and ongoing instability in Syria and Egypt, have created
many economic and political uncertainties. In addition, as a global company with headquarters and significant
operations located in the U.S., actions against or by the U.S. may impact our business or employees. Although it is
impossible to predict the occurrences or consequences of any such events, they could result in a decrease in demand
for our products, make it difficult or impossible to deliver products to our customers or to receive components from
our suppliers, create delays and inefficiencies in our supply chain and pose risks to our employees, resulting in the
need to impose travel restrictions, which at times adversely affect our business, financial condition, results of
operations and cash flows.
Our business may be adversely impacted by work stoppages and other labor matters.
As of December 31, 2020, we had approximately 16,000 employees, of which approximately 5,000 were located
in the U.S. Approximately 5% of our U.S. employees are represented by unions. We also have unionized employees
or employee work councils in Argentina, Australia, Austria, Brazil, Finland, France, Germany, India, Italy, Japan,
16

Mexico, The Netherlands, South Africa, Spain, Sweden and the U.K. No individual unionized facility produces more
than 10% of our revenues. Although we believe that our relations with our employees are generally satisfactory and
we have not experienced any material strikes or work stoppages recently, no assurances can be made that we will not
in the future experience these and other types of conflicts with labor unions, works councils, other groups
representing employees or our employees generally, or that any future negotiations with our labor unions will not
result in significant increases in our cost of labor. Our ability to successfully negotiate new and acceptable agreements
when the existing agreements with employees covered by collective bargaining expire could result in business
disruptions or increased costs.
Our ability to implement our business strategy and serve our customers is dependent upon the continuing ability
to employ talented professionals and attract, train, develop and retain a skilled workforce. We are subject to the risk
that we will not be able to effectively replace the knowledge and expertise of an aging workforce as workers retire.
Without a properly skilled and experienced workforce, our costs, including productivity costs and costs to replace
employees may increase, and this could negatively impact our earnings.
In addition, our policies prohibit harassment or discrimination in the workplace. Notwithstanding our conducting
training and taking disciplinary action or other actions against or in response to alleged violations, we may encounter
additional costs from claims made and/or legal proceedings brought against us, and we could suffer reputational
harm.
Our growth strategy depends on our ability to continue to expand our market presence through acquisitions,
and any future acquisitions may present unforeseen integration difficulties or costs which could materially affect
our business.
Since 1997, we have expanded through a number of acquisitions, and we may pursue strategic acquisitions of
businesses in the future. Our ability to implement this growth strategy will be limited by our ability to identify
appropriate acquisition candidates, covenants in our credit agreement and other debt agreements and our financial
resources, including available cash and borrowing capacity. Acquisitions may require additional debt financing,
resulting in higher leverage and an increase in interest expense or may require equity financing, resulting in
ownership dilution to existing shareholders. In addition, acquisitions sometimes require large one-time charges and
can result in the incurrence of contingent liabilities, adverse tax consequences, substantial depreciation or deferred
compensation charges, the amortization of identifiable purchased intangible assets or impairment of goodwill, any of
which could have a material adverse effect on our business, financial condition, results of operations and cash flows.
When we acquire another business, the process of integrating acquired operations into our existing operations
creates operating challenges and requires significant financial and managerial resources that would otherwise be
available for the ongoing development or expansion of existing operations. Some of the more common challenges
associated with acquisitions that we may experience, and have experienced in the past, include:
• loss of key employees or customers of the acquired company;
• conforming the acquired company’s standards, processes, procedures and controls, including accounting
systems and controls, with our operations, which could cause deficiencies related to our internal control
over financial reporting;
• coordinating operations that are increased in scope, geographic diversity and complexity;
• retooling and reprogramming of equipment;
• hiring additional management and other critical personnel; and
• the diversion of management’s attention from our day-to-day operations.
Further, no guarantees can be made that we would realize the cost savings, synergies or revenue enhancements
that we may anticipate from any acquisition, or that we will realize such benefits within the time frame that we
expect. If we are not able to timely address the challenges associated with acquisitions and successfully integrate
acquired businesses, or if our integrated product and service offerings fail to achieve market acceptance, our business
could be adversely affected.
17

A significant data breach or disruption to our information technology infrastructure could adversely affectour business operations.
Our information technology networks and related systems and devices and those technology systems under
control of third parties with whom we do business are critical to the operation of our business and essential to our
ability to successfully perform day-to-day operations. These information technology networks and related systems
and devices are susceptible to damage, disruptions or shutdowns due to programming errors, defects or other
vulnerabilities, power outages, hardware failures, computer viruses, cyber-attacks, malware attacks, ransomware
attacks, theft, misconduct by employees or other insiders, misuse, human errors or other events. If any of the
aforementioned breaches or disruptions occur and our business continuity plans do not effectively resolve the issues
in a timely manner, our business, financial condition, results of operations, and liquidity could be materially adversely
affected.
In addition, any of the aforementioned breaches or disruptions could expose us to a risk of loss, disclosure,
misuse, corruption, or interruption of sensitive and critical data, information and functions, including our proprietary
and confidential information and information related to our customers, suppliers and employees. It is also possible
a security breach could result in theft of material trade secrets or other material intellectual property. While we devote
substantial resources to maintaining adequate levels of cybersecurity, there can be no assurance that we will be able
to prevent all of the rapidly evolving forms of increasingly sophisticated and frequent cyberattacks, or avoid or limit
a material adverse impact on our systems after such incidents or attacks occur. The potential consequences of a
material cybersecurity incident include reputational damage, loss of customers, litigation with third parties,
regulatory actions and fines, theft of intellectual property, disruption of manufacturing plant operations and increased
cybersecurity protection and remediation costs. If we are unable to prevent, anticipate, detect or adequately respond
to security breaches, our operations could be disrupted and our business could be materially and adversely affected.
Developments in the applicable legal standards for the handling of personal data require changes to our business
practices, penalties, increased cost of operations, or otherwise harm our business. To conduct our operations, we
regularly move data across national borders and must comply with increasingly complex and rigorous regulatory
standards enacted to protect business and personal data in the U.S. and elsewhere. For example, the E.U. recently
adopted the General Data Protection Regulation (the ‘‘GDPR’’). The GDPR imposes additional obligations on
companies regarding the handling of personal data and provides certain individual privacy rights to persons whose
data is stored. Compliance with existing, proposed and recently enacted laws and regulations can be costly; any
failure to comply with these regulatory standards could subject us to legal and reputational risks, including
proceedings against the Company by governmental entities or others, fines and penalties, damage to our reputation
and credibility and could have a negative impact on our business and results of operations.
Related to International Operations
Economic, political and other risks associated with international operations could adversely affect ourbusiness.
A substantial portion of our operations is conducted and located outside the U.S. We have manufacturing, sales
or service facilities in more than 50 countries and sell to customers in over 90 countries, in addition to the U.S.
Moreover, we primarily source certain of our manufacturing and engineering functions, raw materials and
components from China, Eastern Europe, India and Latin America. Accordingly, our business and results of
operations are subject to risks associated with doing business internationally, including:
• instability in a specific country’s or region’s political or economic conditions, particularly economic
conditions in Europe and Latin America, and political conditions in Russia, the Middle East, Asia,
North Africa, Latin America and other emerging markets;
• trade protection measures, such as tariff increases, and import and export licensing and control
requirements;
• political, financial market or economic instability relating to Brexit;
• political, financial market or economic instability relating to epidemics or pandemics (including the
ongoing COVID-19 pandemic);
• uncertainties related to any geopolitical, economic and regulatory effects or changes due to recent or
upcoming domestic and international elections;
18

• the imposition of governmental economic sanctions on countries in which we do business, including Russia
and Venezuela;
• potentially negative consequences from changes in tax laws or tax examinations;
• difficulty in staffing and managing widespread operations;
• increased aging and slower collection of receivables, particularly in Latin America and other emerging
markets;
• difficulty of enforcing agreements and collecting receivables through some foreign legal systems;
• differing and, in some cases, more stringent labor regulations;
• potentially negative consequences from fluctuations in foreign currency exchange rates;
• partial or total expropriation;
• differing protection of intellectual property;
• inability to repatriate income or capital; and
• difficulty in administering and enforcing corporate policies, which may be different than the customary
business practices of local cultures.
For example, political unrest or work stoppages negatively impact the demand for our products from customers
in affected countries and other customers, such as U.S. oil refineries, that are affected by the resulting disruption in
the supply of crude oil. Similarly, military conflicts in Russia, the Middle East, Asia and North Africa could soften
the level of capital investment and demand for our products and services. The COVID-19 pandemic, and the volatile
regional and global economic conditions stemming from the pandemic, have precipitated or aggravated many of the
factors described above, and we expect that these factors will continue to adversely impact our operations and
financial performance as well as those of many of our customers and suppliers. For further discussion of the risks
presented by the ongoing COVID-19 pandemic, see the discussion above under the heading ‘‘The outbreak and global
spread of the novel coronavirus (COVID-19) are having an adverse impact on our operations and financial
performance, as well as on the operations and financial performance of many of our customers and suppliers. We are
unable to predict the full extent to which the COVID-19 pandemic will continue to adversely impact our operations,
financial performance, results of operations, financial condition, cash flows and/or stock price.’’
In order to manage our day-to-day operations, we must overcome cultural and language barriers and assimilate
different business practices. In addition, we are required to create compensation programs, employment policies and
other administrative programs that comply with laws of multiple countries. We also must communicate and monitor
standards and directives across our global network. In addition, emerging markets pose other uncertainties, including
challenges to our ability to protect our intellectual property, pressure on the pricing of our products and increased risk
of political instability, and may prefer local suppliers because of existing relationships, local restrictions or incentives.
Our failure to successfully manage our geographically diverse operations could impair our ability to react quickly to
changing business and market conditions and to enforce compliance with standards and procedures.
Our future success will depend, in large part, on our ability to anticipate and effectively manage these and other
risks associated with our international operations. Any of these factors could, however, materially adversely affect our
international operations and, consequently, our financial condition, results of operations and cash flows.
Our operations may be impacted by the United Kingdom’s exit from the European Union.
The United Kingdom’s June 2016 referendum in which voters approved an exit from the European Union
(commonly referred to as ‘‘Brexit’’) and subsequent developments related to the referendum have caused and may
continue to cause volatility in the global stock markets, currency exchange rate fluctuations and global economic
uncertainty, which could adversely affect our customers’ ability to invest in capital expenditures, which may in turn
reduce demand for our products and services. The United Kingdom’s membership in the European Union single
market ended on December 31, 2020. On December 24, 2020, the United Kingdom and the European Union
announced that they had struck a new bilateral trade and cooperation deal governing the future relationship between
the United Kingdom and the European Union (the ‘‘EU-UK Trade and Cooperation Agreement’’), which is expected
to be formally ratified by the EU parliament during the first quarter of 2021. The EU-UK Trade and Cooperation
Agreement provides some clarity in respect of the intended shape of the future relationship between the United
19

Kingdom and the European Union and some detailed matters of trade and cooperation. However, there remain
unavoidable uncertainties related to Brexit and the new relationship between the United Kingdom and the European
Union.
The United Kingdom’s withdrawal from the European Union may result in adverse effects on the tax, tax treaty,
currency, operational, legal and regulatory regimes to which our businesses in the region are subject. Brexit could
also, among other potential outcomes, disrupt the free movement of goods, services and people between the United
Kingdom and the European Union, significantly disrupt trade between the United Kingdom and the European Union
and other parties, and result in greater restrictions on imports and exports between the United Kingdom and other
European Union countries, among other regulatory complexities. These potential and unknown outcomes and
uncertainties related to Brexit and its impact on the global economic climate could have a material adverse effect on
our operations, financial condition, results of operations and cash flows.
Implementation of new tariffs and changes to or uncertainties related to tariffs and trade agreements could
adversely affect our business.
The U.S. has recently implemented certain tariffs on steel and aluminum imported into the country. In response,
certain foreign governments have implemented or reportedly considered implementing additional tariffs on U.S.
goods. In addition, there have been recent changes to trade agreements, like the U.S. withdrawal from the
Trans-Pacific Partnership and the replacement of the North American Free Trade Agreement with the United
States-Mexico-Canada Agreement. Under the new U.S. Presidential administration, U.S. policy with respect to tariffs
and international trade agreements may be rolled back or modified in other ways. Uncertainties with respect to tariffs,
trade agreements, or any potential trade wars negatively impact the global economic markets and could affect our
customers’ ability to invest in capital expenditures, which may in turn result in reduced demand for our products and
services, and could have a material adverse effect on our financial condition, results of operations and cash flows.
Changes in tariffs could also result in changes in supply and demand of our raw material needs, affect our
manufacturing capabilities and lead to increased prices that we may not be able to effectively pass on to customers,
each of which could materially adversely affect our operating margins, results of operations and cash flows.
Our international operations expose us to fluctuations in foreign currency exchange rates which couldadversely affect our business.
A significant portion of our revenue and certain of our costs, assets and liabilities, are denominated in currencies
other than the U.S. dollar. The primary currencies to which we have exposure are the Euro, British pound,
Mexican peso, Brazilian real, Indian rupee, Japanese yen, Singapore dollar, Argentine peso, Canadian dollar,
Australian dollar, Chinese yuan, Colombian peso, Chilean peso and South African rand. Certain of the foreign
currencies to which we have exposure, such as the Venezuelan bolivar and Argentine peso, have undergone
significant devaluation in the past, which reduce the value of our local monetary assets, reduce the U.S. dollar value
of our local cash flow, generate local currency losses that may impact our ability to pay future dividends from our
subsidiary to the parent company and potentially reduce the U.S. dollar value of future local net income. Although
we enter into forward exchange contracts to economically hedge some of our risks associated with transactions
denominated in certain foreign currencies, no assurances can be made that exchange rate fluctuations will not
adversely affect our financial condition, results of operations and cash flows.
We could be adversely affected by violations of the U.S. Foreign Corrupt Practices Act and similar worldwideanti-bribery laws and regulations.
The U.S. Foreign Corrupt Practices Act (‘‘FCPA’’) and similar anti-bribery laws and regulations in other
jurisdictions, such as the UK Bribery Act, generally prohibit companies and their intermediaries from making
improper payments to government officials for the purpose of obtaining or retaining business or securing an improper
advantage. Because we operate in many parts of the world and sell to industries that have experienced corruption to
some degree, our policies mandate compliance with applicable anti-bribery laws worldwide. Violation of the FCPA
or other similar anti-bribery laws or regulations, whether due to our or others’ actions or inadvertence, could subject
us to civil and criminal penalties or other sanctions that could have a material adverse impact on our business,
financial condition, results of operations and cash flows. In addition, actual or alleged violations could damage our
reputation or ability to do business.
20

Regulatory and Legal Risks
Our operations are subject to a variety of complex and continually changing laws, regulations and policies,both internationally and domestically, which could adversely affect our business.
Due to the international scope of our operations, the system of laws, regulations and policies to which we are
subject is complex and includes, without limitation, regulations issued by the U.S. Customs and Border Protection,
the U.S. Department of Commerce’s Bureau of Industry and Security, the U.S. Treasury Department’s Office of
Foreign Assets Control and various foreign governmental agencies, including applicable export controls, customs,
currency exchange control and transfer pricing regulations, as applicable. No assurances can be made that we will
continue to be found to be operating in compliance with, or be able to detect violations of, any such laws, regulations
or policies. In addition, we cannot predict the nature, scope or effect of future regulatory requirements to which our
international operations might be subject or the manner in which existing laws might be administered or interpreted.
Compliance with laws and any new laws or regulations may increase our operations costs or require significant
capital expenditures. Any failure to comply with applicable laws, regulations or policies in the U.S. or in any other
country in which we operate could result in substantial fines and penalties, which could adversely affect our business.
In particular, there is uncertainty related to the new U.S. Presidential administration’s plans for new or existing
treaty and trade relationships with other countries, including with respect to the January 2017 U.S. withdrawal from
the Trans-Pacific Partnership, which may affect restrictions or tariffs imposed on products we buy or sell. These
factors, together with other key global events during 2020 (such as the global economic impact of the COVID-19
pandemic, continuing uncertainty arising from the Brexit transition, as well as ongoing terrorist activity), may
adversely impact the ability or willingness of non-U.S. companies to transact business in the U.S. This uncertainty
may also affect regulations and trade agreements affecting U.S. companies, global stock markets (including the
NYSE, on which our common shares are traded), currency exchange rates, and general global economic conditions.
All of these factors are outside of our control, but may nonetheless cause us to adjust our strategy in order to compete
effectively in global markets. For further discussion of the impact of tariffs and trade agreements on our business,
please see the discussion above under the heading ‘‘Implementation of new tariffs and changes to or uncertainties
related to tariffs and trade agreements could adversely affect our business.’’
Environmental compliance costs and liabilities could adversely affect our financial condition, results ofoperations and cash flows.
Our operations and properties are subject to regulation under environmental laws, which can impose substantial
sanctions for violations. We must conform our operations to applicable regulatory requirements and adapt to changes
in such requirements in all countries in which we operate.
We use hazardous substances and generate hazardous wastes in many of our manufacturing and foundry
operations. Most of our current and former properties are or have been used for industrial purposes, and some may
require clean-up of historical contamination. We are currently conducting investigation and/or remediation activities
at a number of locations where we have known environmental concerns. In addition, we have been identified as one
of many PRPs at four Superfund sites. The projected cost of remediation at these sites, as well as our alleged ‘‘fair
share’’ allocation, while not anticipated to be material, has been reserved. However, until all studies have been
completed and the parties have either negotiated an amicable resolution or the matter has been judicially resolved,
some degree of uncertainty remains.
We have incurred, and expect to continue to incur, operating and capital costs to comply with environmental
requirements. In addition, new laws and regulations, stricter enforcement of existing requirements, the discovery of
previously unknown contamination or the imposition of new clean-up requirements could require us to incur costs
or become the basis for new or increased liabilities. Moreover, environmental and sustainability initiatives, practices,
rules and regulations are under increasing scrutiny of both governmental and non-governmental bodies, which can
cause rapid change in operational practices, standards and expectations and, in turn, increase our compliance costs.
Any of these factors could have a material adverse effect on our financial condition, results of operations and cash
flows.
We are exposed to certain regulatory and financial risks related to climate change, which could adverselyaffect our financial condition, results of operations and cash flows.
Emissions of carbon dioxide and other greenhouse gases and their role in climate change are receiving ever
increasing attention worldwide, which has led to significant legislative and regulatory efforts to limit greenhouse gas
emissions. Existing or future legislation and regulations related to greenhouse gas emissions and climate change by
21
the U.S. Congress, state and foreign legislatures and federal, state, local and foreign governmental agencies could
adversely affect our business. Additionally, it is uncertain whether, when and in what form mandatory carbon dioxide
emissions reduction programs may be adopted. Similarly, certain countries have adopted the Paris Climate Agreement
and these and other existing international initiatives or those under consideration affect our operations.
When our customers, particularly those involved in the oil and gas, power generation, petrochemical processing
or petroleum refining industries, are subject to any of these or other similar proposed or newly enacted laws and
regulations, we are exposed to risks that the additional costs by customers to comply with such laws and regulations
could impact their ability or desire to continue to operate at similar levels in certain jurisdictions as historically seen
or as currently anticipated, which could negatively impact their demand for our products and services. In addition,
new laws and regulations that might favor the increased use of non-fossil fuels, including nuclear, wind, solar and
bio-fuels or that are designed to increase energy efficiency, could dampen demand for oil and gas production or power
generation resulting in lower spending by customers for our products and services. These actions could also increase
costs associated with our operations, including costs for raw materials and transportation. There is also increased
focus, including by governmental and non-governmental organizations, environmental advocacy groups, investors
and other stakeholders on these and other sustainability matters, and adverse publicity in the global marketplace about
the levels of greenhouse gas emissions by companies in the manufacturing and energy industry could reduce
customer demand for our products and services or harm our reputation. Because it is uncertain what laws will be
enacted, we cannot predict the potential impact of such laws on our future financial condition, results of operations
and cash flows, but such new or additional laws could adversely affect our business.
We are party to asbestos-containing product litigation that could adversely affect our financial condition,results of operations and cash flows.
We are a defendant in a substantial number of lawsuits that seek to recover damages for personal injury allegedly
resulting from exposure to asbestos-containing products formerly manufactured and/or distributed by us. Such
products were used as internal components of process equipment, and we do not believe that there was any significant
emission of asbestos-containing fibers during the use of this equipment. Although we are defending these allegations
vigorously and believe that a high percentage of these lawsuits are covered by insurance or indemnities from other
companies, there can be no assurance that we will prevail or that coverage or payments made by insurance or such
other companies would be adequate. Unfavorable rulings, judgments or settlement terms could have a material
adverse impact on our business, financial condition, results of operations and cash flows.
Inability to protect our intellectual property could negatively affect our competitive position.
We rely on a combination of patents, copyrights, trademarks, trade secrets, confidentiality provisions and
licensing arrangements to establish and protect our proprietary rights. We cannot guarantee, however, that the steps
we have taken to protect our intellectual property will be adequate to prevent infringement of our rights or
misappropriation of our technology. For example, effective patent, trademark, copyright and trade secret protection
are unavailable or limited in some of the foreign countries in which we operate. In addition, while we generally enter
into confidentiality agreements with our employees and third parties to protect our intellectual property, such
confidentiality agreements could be breached or otherwise may not provide meaningful protection for our trade
secrets and know-how related to the design, manufacture or operation of our products. Resorting to litigation to
protect our intellectual property rights is burdensome and costly, and we may not always prevail. Further, adequate
remedies are not always available in the event of an unauthorized use or disclosure of our trade secrets and
manufacturing expertise. Failure to successfully enforce our intellectual property rights could harm our competitive
position, business, financial condition, results of operations and cash flows.
Increased costs as a result of product liability and warranty claims could adversely affect our financialcondition, results of operations and cash flows.
From time to time, we are exposed to product liability and warranty claims when the use of one of our products
results in, or is alleged to result in, bodily injury and/or property damage or our products actually or allegedly fail
to perform as expected. Some of our products are designed to support the most critical, severe service applications
in the markets that we serve and any failure of such products could result in significant product liability and warranty
claims, as well as damage to our reputation in the marketplace. While we maintain insurance coverage with respect
to certain product liability claims, we may not be able to obtain such insurance on acceptable terms in the future, and
any such insurance may not provide adequate coverage against product liability claims. In addition, product liability
22

claims can be expensive to defend and can divert the attention of management and other personnel for significant
periods of time, regardless of the ultimate outcome. An unsuccessful defense of a product liability claim could have
an adverse effect on our business, financial condition, results of operations and cash flows. Even if we are successful
in defending against a claim relating to our products, claims of this nature could cause our customers to lose
confidence in our products and our company. Warranty claims are not generally covered by insurance, and we may
incur significant warranty costs that are not reimbursable, which could adversely affect our financial condition,
results of operations and cash flows.
Financial and Accounting Risks
Significant changes in pension fund investment performance or assumptions changes may have a materialeffect on the valuation of our obligations under our defined benefit pension plans, the funded status of these plansand our pension expense.
We maintain funded defined benefit pension plans that are either currently funded in accordance with local
requirements in the U.S., Belgium, Canada, The Netherlands, Switzerland and the U.K., or above funded
requirements in India and Mexico, and defined benefit plans that are not required to be funded and are not funded
in Austria, France, Germany, Italy, Japan and Sweden. Our pension liability is materially affected by the discount rate
used to measure our pension obligations and, in the case of the plans that are required to be funded, the level of plan
assets available to fund those obligations and the expected long-term rate of return on plan assets. A change in the
discount rate can result in a significant increase or decrease in the valuation of pension obligations, affecting the
reported status of our pension plans and our pension expense. Significant changes in investment performance or a
change in the portfolio mix of invested assets can result in increases and decreases in the valuation of plan assets or
in a change of the expected rate of return on plan assets. This impact may be particularly prevalent where we maintain
significant concentrations of specified investments, such as the U.K. equity and fixed income securities in our
non-U.S. defined benefit plans. Changes in the expected return on plan assets assumption can result in significant
changes in our pension expense and future funding requirements.
We continually review our funding policy related to our U.S. pension plan in accordance with applicable laws
and regulations. U.S. regulations have increased the minimum level of funding for U.S. pension plans in prior years,
which has at times required significant contributions to our pension plans. Contributions to our pension plans reduce
the availability of our cash flows to fund working capital, capital expenditures, R&D efforts and other general
corporate purposes.
The recording of increased deferred tax asset valuation allowances in the future or the impact of tax lawchanges on such deferred tax assets could adversely affect our operating results.
We currently have significant net deferred tax assets resulting from tax credit carryforwards, net operating losses
and other deductible temporary differences that are available to reduce taxable income in future periods. Based on
our assessment of our deferred tax assets, we determined, based on projected future income and certain available tax
planning strategies, that approximately $153 million of our deferred tax assets will more likely than not be realized
in the future, and no valuation allowance is currently required for this portion of our deferred tax assets. Should we
determine in the future that these assets will not be realized we will be required to record an additional valuation
allowance in connection with these deferred tax assets and our operating results would be adversely affected in the
period such determination is made. In addition, tax law changes could negatively impact our deferred tax assets.
Our outstanding indebtedness and the restrictive covenants in the agreements governing our indebtednesslimit our operating and financial flexibility.
Under certain events of default, mandatory repayments on our outstanding indebtedness, which requires us to
dedicate a substantial portion of our cash flows from operations to payments on our indebtedness, thereby reducing
the availability of our cash flows to fund working capital, capital expenditures, R&D efforts and other general
corporate purposes, such as dividend payments and share repurchases, and could generally limit our flexibility in
planning for, or reacting to, changes in our business and industry. In addition, we may need new or additional
financing in the future to expand our business or refinance our existing indebtedness. Our current senior credit facility
matures on July 16, 2024 and our senior notes are due in 2022, 2023 and 2030. For additional information regarding
our current indebtedness refer to Note 13 to our consolidated financial statements included in Item 8 of this Annual
Report. Our inability to timely access capital on satisfactory terms, including as a result of market disruptions, could
limit our ability to expand our business as desired and refinance our indebtedness.
23

In addition, the agreements governing our indebtedness impose certain operating and financial restrictions on us
and somewhat limit management’s discretion in operating our businesses. These agreements limit or restrict our
ability, among other things, to: incur additional debt; fully utilize the capacity under the senior credit facility; pay
dividends and make other distributions; repurchase shares of our common stock in certain circumstances; prepay
subordinated debt; make investments and other restricted payments; create liens; sell assets; and enter into
transactions with affiliates.
We are also required to maintain debt ratings, comply with leverage and interest coverage financial covenants
and deliver to our lenders audited annual and unaudited quarterly financial statements. Our ability to comply with
these covenants may be affected by events beyond our control. Failure to comply with these covenants could result
in an event of default which, if not cured or waived, may have a material adverse effect on our business, financial
condition, results of operations and cash flows.
Goodwill impairment could negatively impact our net income and shareholders’ equity.
Goodwill is not amortized, but is tested for impairment at the reporting unit level, which is an operating segment
or one level below an operating segment. Goodwill is required to be tested for impairment annually and between
annual tests if events or circumstances indicate that it is more likely than not that the fair value of a reporting unit
is less than its carrying value. Reductions in or impairment of the value of our goodwill or other intangible assets will
result in charges against our earnings, which could have a material adverse effect on our reported results of operations
and financial position in future periods.
There are numerous risks that may cause the fair value of a reporting unit to fall below its carrying amount,
which could lead to the measurement and recognition of goodwill impairment. These risks include, but are not limited
to, lowered expectations of future financial results, adverse changes in the business climate, increase in the discount
rate, an adverse action or assessment by a regulator, the loss of key personnel, a more-likely-than-not expectation that
all or a significant portion of a reporting unit may be disposed of, failure to realize anticipated synergies from
acquisitions, a sustained decline in the Company’s market capitalization, and significant, prolonged negative
variances between actual and expected financial results. In recent years, the estimated fair value of our Pump
reporting unit has fluctuated, partially due to broad-based capital spending declines and heightened pricing pressures
experienced in the oil and gas markets. Although we have concluded that there is no impairment on the goodwill
associated with our Pump reporting unit as of December 31, 2020, we will continue to monitor their performance and
related market conditions for future indicators of potential impairment. For additional information, see the discussion
in Item 7 of this Annual Report and under Note 1 to our consolidated financial statements included in Item 8 of this
Annual Report.
Ineffective internal controls could impact the accuracy and timely reporting of our business and financialresults.
Our internal control over financial reporting has not always prevented or detected misstatements because of its
inherent limitations, including the possibility of human error, the circumvention or overriding of controls or fraud.
We have in the past discovered, and may in the future discover, areas of our internal controls that need improvement,
including material weaknesses in internal controls. We have devoted significant resources to remediate and improve
our internal controls and to monitor the effectiveness of these remediated measures. There can be no assurance that
these measures will ensure that we maintain at all times effective internal controls over our financial processes and
reporting in the future. Even effective internal controls can provide only reasonable assurance with respect to the
preparation and fair presentation of financial statements. Failure to maintain the adequacy of our internal controls,
including any failure to implement required new or improved controls, or difficulties in their implementation, could
harm our business and financial results and we could fail to meet our financial reporting obligations.
General Risks
We depend on key personnel, the loss of whom would harm our business.
Our future success will depend in part on the continued service of key executive officers and personnel. The loss
of the services of any key individual could harm our business. Our future success also depends on our ability to
recruit, retain and engage our personnel sufficiently, both to maintain our current business and to execute our strategic
initiatives. Competition for officers and employees in our industry is intense and we may not be successful in
attracting and retaining such personnel.
24

Changes in accounting principles and guidance could result in unfavorable accounting charges or effects.
We prepare our consolidated financial statements in conformity with accounting principles generally accepted
in the U.S. A change in these principles can have a significant effect on our reported financial position and financial
results. The adoption of new or revised accounting principles may require us to make changes to our systems,
processes and internal controls, which could have a significant effect on our reported financial results and internal
controls, cause unexpected financial reporting fluctuations, retroactively affect previously reported results or require
us to make costly changes to our operational processes and accounting systems upon our following the adoption of
these standards.
Forward-Looking Information is Subject to Risk and Uncertainty
This Annual Report and other written reports and oral statements we make from time-to-time include
‘‘forward-looking statements’’ within the meaning of Section 27A of the Securities Act of 1933, Section 21E of the
Securities Exchange Act of 1934 and the Private Securities Litigation Reform Act of 1995. All statements other than
statements of historical facts included in this Annual Report regarding our financial position, business strategy and
expectations, plans and objectives of management for future operations, industry conditions, market conditions and
indebtedness covenant compliance are forward-looking statements. Forward-looking statements may include, among
others, statements about our goals and strategies, new product introductions, plans to cultivate new businesses, future
economic conditions, revenue, pricing, gross profit margin and costs, capital spending, expected cost savings from
our realignment programs, depreciation and amortization, research and development expenses, potential impairment
of assets, tax rate and pending tax and legal proceedings. In some cases forward-looking statements can be identified
by terms such as ‘‘may,’’ ‘‘should,’’ ‘‘expects,’’ ‘‘could,’’ ‘‘intends,’’ ‘‘projects,’’ ‘‘predicts,’’ ‘‘plans,’’ ‘‘anticipates,’’
‘‘estimates,’’ ‘‘believes,’’ ‘‘forecasts,’’ ‘‘seeks’’ or other comparable terminology. These statements are not historical
facts or guarantees of future performance, but instead are based on current expectations and are subject to material
risks, uncertainties and other factors, many of which are outside of our control.
We have identified factors that could cause actual plans or results to differ materially from those included in any
forward-looking statements. These factors include those described above under this ‘‘Risk Factors’’ heading, or as
may be identified in our other SEC filings from time to time. These uncertainties are beyond our ability to control,
and in many cases, it is not possible to foresee or identify all the factors that may affect our future performance or
any forward-looking information, and new risk factors can emerge from time to time. Given these risks and
uncertainties, undue reliance should not be placed on forward-looking statements as a prediction of actual results.
All forward-looking statements included in this Annual Report are based on information available to us on the
date of this Annual Report and the risk that actual results will differ materially from expectations expressed in this
report will increase with the passage of time. We undertake no obligation, and disclaim any duty, to publicly update
or revise any forward-looking statement or disclose any facts, events or circumstances that occur after the date hereof
that may affect the accuracy of any forward-looking statement, whether as a result of new information, future events,
changes in our expectations or otherwise. This discussion is provided as permitted by the Private Securities Litigation
Reform Act of 1995 and all of our forward-looking statements are expressly qualified in their entirety by the
cautionary statements contained or referenced in this section.
ITEM 1B. UNRESOLVED STAFF COMMENTS
None.
ITEM 2. PROPERTIES
Our principal executive offices, including our global headquarters, are located at 5215 N. O’Connor Boulevard,
Suite 2300, Irving, Texas 75039. Our global headquarters is a leased facility, which we began to occupy on January 1,
2004. In December 2018, we extended our original lease term an additional 10 years to December 2030. We have
the option to renew the current lease for two additional five-year periods. We currently occupy approximately
151,000 square feet at this facility.
25

Our major manufacturing facilities (those with 50,000 or more square feet of manufacturing capacity) operating
at December 31, 2020 are presented in the table below. See ‘‘Item 1. Business’’ in this Annual Report for further
information with respect to all of our manufacturing and operational facilities, including QRCs.
Numberof Facilities
ApproximateAggregate
Square Footage
FPD
U.S. . . . . . . . . . . . . . . . . . . . . . . . . . . . . . . . . . . . . . . . . . . . . . . . . . . . . . . . . . . . . . . . . . . 7 1,198,000
Non-U.S. . . . . . . . . . . . . . . . . . . . . . . . . . . . . . . . . . . . . . . . . . . . . . . . . . . . . . . . . . . . . . . 20 3,742,000
FCD
U.S. . . . . . . . . . . . . . . . . . . . . . . . . . . . . . . . . . . . . . . . . . . . . . . . . . . . . . . . . . . . . . . . . . . 5 1,109,000
Non-U.S. . . . . . . . . . . . . . . . . . . . . . . . . . . . . . . . . . . . . . . . . . . . . . . . . . . . . . . . . . . . . . . 13 2,063,000
We own the majority of our manufacturing facilities, and those manufacturing facilities we do not own are
leased. We also maintain a substantial network of U.S. and foreign service centers and sales offices, most of which
are leased. The majority of our manufacturing leased facilities are covered by lease agreements with terms ranging
from two to seven years, with individual lease terms generally varying based on the facilities’ primary usage.
We believe we will be able to extend leases on our various facilities as necessary, as they expire.
We believe that our current facilities are adequate to meet the requirements of our present and foreseeable future
operations. We continue to review our capacity requirements as part of our strategy to optimize our global
manufacturing efficiency. See Note 5 to our consolidated financial statements included in Item 8 of this Annual
Report for additional information regarding our lease obligations.
ITEM 3. LEGAL PROCEEDINGS
We are party to the legal proceedings that are described in Note 16 to our consolidated financial statements
included in Item 8 of this Annual Report, and such disclosure is incorporated by reference into this Item 3. In addition
to the foregoing, we and our subsidiaries are named defendants in certain other routine lawsuits incidental to our
business and are involved from time to time as parties to governmental proceedings, all arising in the ordinary course
of business. Although the outcome of lawsuits or other proceedings involving us, and our subsidiaries cannot be
predicted with certainty, and the amount of any liability that could arise with respect to such lawsuits or other
proceedings cannot be predicted accurately, management does not currently expect these matters, either individually
or in the aggregate, to have a material effect on our financial position, results of operations or cash flows. We have
established reserves covering exposures relating to contingencies to the extent believed to be reasonably estimable
and probable based on past experience and available facts.
ITEM 4. MINE SAFETY DISCLOSURES
Not applicable.
26

PART II
ITEM 5. MARKET FOR THE REGISTRANT’S COMMON EQUITY, RELATED STOCKHOLDER
MATTERS AND ISSUER PURCHASES OF EQUITY SECURITIES
Market Information
Our common stock is traded on the New York Stock Exchange (‘‘NYSE’’) under the symbol ‘‘FLS’’ and our
CUSIP number is number is 34354P105. On February 11, 2021, our records showed 963 shareholders of record. We
have historically paid quarterly dividends based on a dividend date-of-record in the last month of each quarter with
the dividend paid the following month. Any subsequent dividends will be reviewed by our Board of Directors and
declared in its discretion.
Issuer Purchases of Equity Securities
During the quarter ended December 31, 2020, we had no repurchases of our common stock shares as part of
publicly announced plans. As of December 31, 2020, we have $113.6 million of remaining capacity under our current
share repurchase program. The following table sets forth the repurchase data for each of the three months during the
quarter ended December 31, 2020:
Period
Total Numberof SharesPurchased
Average Price Paidper Share
Total Number ofShares Purchased as
Part of PubliclyAnnounced Plan(3)(4)
Approximate DollarValue That May YetBe Purchased Under
the Plan
(In millions)
October 1 - 31 . . . . . . . . . . . . . . . . . . . . . . . . 1,317(1) $27.90 — $113.6
November 1 - 30 . . . . . . . . . . . . . . . . . . . . . . 1,916(2) 33.51 — 113.6
December 1 - 31 . . . . . . . . . . . . . . . . . . . . . . 1,140(1) 36.61 — 113.6
Total . . . . . . . . . . . . . . . . . . . . . . . . . . . . . . . . 4,373 $32.63 —
(1) Shares tendered by employees to satisfy minimum tax withholding amounts for Restricted Shares.
(2) Includes 12 shares that were tendered by employees to satisfy minimum tax withholding amounts for Restricted Shares at an average price
per share of $30.02 and 1,904 shares purchased at a price of $33.53 per share by a rabbi trust that we established in connection with our
director deferral plans, pursuant to which non-employee directors may elect to defer directors’ quarterly cash compensation to be paid at
a later date in the form of common stock.
(3) On November 13, 2014, our Board of Directors approved a $500.0 million share repurchase authorization. Our share repurchase program
does not have an expiration date, and we reserve the right to limit or terminate the repurchase program at any time without notice.
(4) Note 18 to our consolidated financial statements included in Item 8 of this Annual Report provides additional information regarding our
share repurchase activity.
27

Stock Performance Graph
The following graph depicts the most recent five-year performance of our common stock with the S&P 500
Index and S&P 500 Industrial Machinery. The graph assumes an investment of $100 on December 31, 2015, and
assumes the reinvestment of any dividends over the following five years. The stock price performance shown in the
graph is not necessarily indicative of future price performance.
Base Period December 31,
Company/Index 2015 2016 2017 2018 2019 2020
Flowserve Corporation . . . . . . . . . . . . . . . . . . . . . . $100.00 $116.01 $103.04 $ 94.59 $126.44 $ 96.25
S&P 500 Index . . . . . . . . . . . . . . . . . . . . . . . . . . . . 100.00 111.95 136.38 130.39 171.45 202.98
S&P 500 Industrial Machinery . . . . . . . . . . . . . . . . 100.00 126.94 169.42 143.78 196.79 227.05
28

ITEM 6. SELECTED FINANCIAL DATA
Year Ended December 31,
2020(a) 2019(b)(j) 2018(c)(j) 2017(d)(j) 2016(e)(j)
(Amounts in thousands, except per share data and ratios)
RESULTS OF OPERATIONSSales(1). . . . . . . . . . . . . . . . . . . . . . . . . . . . $3,728,134 $3,939,697 $3,835,699 $3,660,831 $3,990,487Gross profit(1) . . . . . . . . . . . . . . . . . . . . . . 1,116,769 1,289,343 1,190,869 1,088,953 1,236,798Selling, general and administrative
expense(1) . . . . . . . . . . . . . . . . . . . . . . . (878,245) (913,203) (966,584) (918,718) (973,277)Loss (gain) on sale of businesses. . . . . . . — — (7,727) 141,317 (7,664)Operating income(1) . . . . . . . . . . . . . . . . . 250,277 386,623 227,701 324,143 268,784Interest expense(1) . . . . . . . . . . . . . . . . . . . (57,386) (54,980) (58,160) (59,730) (60,137)Provision for income taxes(f)(1) . . . . . . . . (60,031) (75,493) (46,550) (254,573) (74,433)Net earnings (loss) attributable to
Flowserve Corporation(1) . . . . . . . . . . . 116,326 238,828 104,508 (10,234) 127,502Net earnings (loss) per share of
Flowserve Corporation common
shareholders (basic)(1). . . . . . . . . . . . . . 0.89 1.82 0.80 (0.08) 0.98Net earnings (loss) per share of
Flowserve Corporation common
shareholders (diluted)(1) . . . . . . . . . . . . 0.89 1.81 0.80 (0.08) 0.97Cash flows from operating activities(1) . . 310,537 324,097 190,831 311,066 240,476Cash dividends declared per share. . . . . . 0.80 0.76 0.76 0.76 0.76FINANCIAL CONDITIONWorking capital(1) . . . . . . . . . . . . . . . . . . . $1,762,700 $1,389,305 $1,303,134 $1,315,837 $1,119,251Total assets(g)(1) . . . . . . . . . . . . . . . . . . . . . 5,314,677 4,938,277 4,649,369 4,948,829 4,753,441Total debt . . . . . . . . . . . . . . . . . . . . . . . . . 1,726,906 1,377,249 1,483,047 1,575,257 1,570,623Retirement obligations and other
liabilities(g)(1). . . . . . . . . . . . . . . . . . . . . 692,333 682,517 519,319 547,735 451,897Total equity(1) . . . . . . . . . . . . . . . . . . . . . . 1,762,800 1,772,341 1,632,002 1,658,528 1,637,848FINANCIAL RATIOSReturn on average net assets(g)(h)(1) . . . . . 5.2% 9.2% 4.8% (0.3)% 4.9%Net debt to net capital ratio(i)(1) . . . . . . . . 26.4% 28.5% 34.6% 42.4% 42.4%
(a) Results of operations in 2020 include costs of $104.8 million resulting from realignment and transformation initiatives, resulting in a
reduction of after tax net earnings of $86.9 million.
(b) Results of operations in 2019 include costs of $36.0 million resulting from realignment and transformation initiatives, resulting in a
reduction of after tax net earnings of $21.7 million.
(c) Results of operations in 2018 include costs of $95.1 million resulting from realignment and transformation initiatives, resulting in a
reduction of after tax net earnings of $72.4 million.
(d) Results of operations in 2017 include costs of $71.3 million resulting from realignment initiatives, resulting in a reduction of after tax net
earnings of $54.3 million.
(e) Results of operations in 2016 include costs of $94.8 million resulting from realignment initiatives, resulting in a reduction of after tax netearnings of $75.8 million.
(f) Provision for income taxes in 2017 was impacted by the Tax Reform Act. See Note 19 to our consolidated financial statements includedin Item 8 of this Annual Report.
(g) Total assets for 2019 impacted by our adoption of ASC 842, Leases (Topic 842) (‘‘New Lease Standard’’) effective January 1, 2019.
(h) Calculated as adjusted net income divided by adjusted net assets, where (i) adjusted net income is the sum of earnings before income taxes,plus interest expense, multiplied by one minus our effective tax rate, and (ii) adjusted net assets is the average of beginning of year and endof year net assets, excluding cash and cash equivalents and debt due in one year.
(i) Calculated as total debt minus cash and cash equivalents divided by the sum of total debt and shareholders’ equity minus cash and cashequivalents.
(j) The financial information in the table above has been revised to reflect adjustments to previously reported amounts. The revision adjustmentsin 2019, 2018, 2017 and 2016 primarily related to the recognition of incurred but not reported claims associated with unasserted asbestosclaims against the Company and the resulting impact on insurance recoveries. The impacts of the revision on the 2019 consolidated financialstatements and 2018 consolidated statement of operations are described in Note 2 to the consolidated financial statements. Previouslyreported amounts for other periods were impacted as follows: net earnings attributable to Flowserve Corporation was reduced by$12.9 million and $5.0 million for the years ended December 31, 2017 and 2016, respectively, with a corresponding decreases in earnings(loss) per share, basic and diluted, of $0.10 and $.04, respectively. The net impact to 2018, 2017 and 2016 financial condition was a reductionof total equity of $28.8 million and $12.4 million as of December 31, 2018 and 2017, respectively, and an increase to total equity as ofDecember 31, 2016 of less than $1 million. Specific line items impacted by the revisions are designated with a (1) in the above tables.
29

ITEM 7. MANAGEMENT’S DISCUSSION AND ANALYSIS OF FINANCIAL CONDITION ANDRESULTS OF OPERATIONS
The following discussion and analysis is provided to increase the understanding of, and should be read in
conjunction with, the accompanying consolidated financial statements and notes. See ‘‘Item 1A. Risk Factors’’ and
the section titled ‘‘Forward-Looking Information is Subject to Risk and Uncertainty’’ included in this Annual Report
on Form 10-K for the year ended December 31, 2020 (‘‘Annual Report’’) for a discussion of the risks, uncertainties
and assumptions associated with these statements. Unless otherwise noted, all amounts discussed herein are
consolidated.
EXECUTIVE OVERVIEW
Our Company
We are a world-leading manufacturer and aftermarket service provider of comprehensive flow control systems.
We develop and manufacture precision-engineered flow control equipment integral to the movement, control and
protection of the flow of materials in our customers’ critical processes. Our product portfolio of pumps, valves, seals,
automation and aftermarket services supports global infrastructure industries, including oil and gas, chemical, power
generation and water management, as well as general industrial markets where our products and services add value.
Through our manufacturing platform and global network of QRCs, we offer a broad array of aftermarket equipment
services, such as installation, advanced diagnostics, repair and retrofitting. As of December 31, 2020, we have
approximately 16,000 employees (‘‘associates’’) globally and a footprint of manufacturing facilities and Quick
Response Centers in more than 50 countries.
Our business model is significantly influenced by the capital spending of global infrastructure industries for the
placement of new products into service and maintenance spending for aftermarket services for existing operations.
The worldwide installed base of our products is an important source of aftermarket revenue, where products are
expected to ensure the maximum operating time of many key industrial processes. We have significantly invested in
our aftermarket strategy to provide local support to drive customer investments in our offerings and use of our
services to replace or repair installed products. The aftermarket portion of our business also helps provide business
stability during various economic periods. The aftermarket business, which is primarily served by our network of
163 QRCs located around the globe, provides a variety of service offerings for our customers including spare parts,
service solutions, product life cycle solutions and other value-added services. It is generally a higher margin business
compared to our original equipment business and a key component of our profitable growth strategy.
Our operations are conducted through two business segments that are referenced throughout this Management’s
Discussion and Analysis of Financial Condition and Results of Operations (‘‘MD&A’’):
• Flowserve Pump Division (‘‘FPD’’) for custom, highly-engineered pumps, pre-configured industrial
pumps, pump systems, mechanical seals, auxiliary systems and replacement parts and related services; and
• Flow Control Division (‘‘FCD’’) for engineered and industrial valves, control valves, actuators and controls
and related services.
Our business segments share a focus on industrial flow control technology and have a high number of common
customers. These segments also have complementary product offerings and technologies that are often combined in
applications that provide us a net competitive advantage. Our segments also benefit from our global footprint, our
economies of scale in reducing administrative and overhead costs to serve customers more cost effectively and shared
leadership for operational support functions, such as research and development, marketing and supply chain.
The reputation of our product portfolio is built on more than 50 well-respected brand names such as
Worthington, IDP, Valtek, Limitorque, Durco, Argus, Edward, Valbart and Durametallic, which we believe to be one
of the most comprehensive in the industry. Our products and services are sold either directly or through designated
channels to more than 10,000 companies, including some of the world’s leading engineering, procurement and
construction (‘‘EPC’’) firms, original equipment manufacturers, distributors and end users.
We continue to leverage our QRC network to be positioned as near to customers as possible for service and
support in order to capture valuable aftermarket business. Along with ensuring that we have the local capability to
sell, install and service our equipment in remote regions, we continuously improve our global operations. Despite
recent headwinds caused by the COVID-19 pandemic, we continue to enhance our global supply chain capability to
increase our ability to meet global customer demands and improve the quality and timely delivery of our products
30

over the long-term. Additionally, we continue to devote resources to improving the supply chain processes across our
business segments to find areas of synergy and cost reduction and to improve our supply chain management
capability to meet global customer demands. We also remain focused on improving on-time delivery and quality,
while managing warranty costs as a percentage of sales across our global operations, through the assistance of a
focused Continuous Improvement Process (‘‘CIP’’) initiative. The goal of the CIP initiative, which includes lean
manufacturing, six sigma business management strategy and value engineering, is to maximize service fulfillment to
customers through on-time delivery, reduced cycle time and quality at the highest internal productivity.
COVID-19 Update
The COVID-19 pandemic continues to have an impact on human health, the global economy and society at
large. The pandemic is expected to continue to adversely impact, for its duration, our operations and financial
performance. In response, we continue to actively monitor the impacts of the COVID-19 pandemic on all aspects of
our business and geographies. Our cross-functional crisis management team established during the first quarter of
2020 has continued monitoring and making recommendations to management to help us continue operating as an
essential business across jurisdictions, while also protecting the health and safety of our associates.
Despite our evolving response, the COVID-19 pandemic has had an adverse effect on our performance during
the year, and we expect the impact will continue through at least the second quarter of 2021. While we cannot
reasonably estimate with certainty the ongoing duration and severity of the COVID-19 pandemic, including the
effects of any vaccine, or its ultimate impact on the global economy, our business or our financial condition and
results, we nonetheless remain committed to providing the critical support, products and services that our customers
rely on, and currently believe that we will emerge from these events well positioned for long-term growth.
Health and Safety of Our Associates
The health and safety of our associates, suppliers and customers around the world continues to be our first
priority as we continue to navigate the COVID-19 pandemic, including recent spikes in cases and returning
work-from-home restrictions in various geographies in which we operate. We are incredibly proud of the great
teamwork exhibited by our global workforce who have demonstrated strong resilience in adapting to continually
evolving health and safety guidelines while addressing these challenging times and providing products and services
to our customers.
We have implemented policies and practices to help protect our workforce so they can safely and effectively
carry out their vital work, and we have continued to revise those policies and practices in light of guidance received
from local and regional health authorities where appropriate. We instituted global restrictions on non-essential travel
in March 2020 and the work-from-home policy for all non-essential employees who are able to do so has continued
in effect in locations where health officials have advised such policies, including for our global headquarters in Irving,
Texas, which will maintain its work-from-home policy at least through the second quarter of 2021. In those locations
where employees are going to work in our facilities, we have continued taking steps, in light of guidelines from local
and global health experts to protect our employees so that we can continue to manufacture critical technologies and
equipment, including providing face coverings and other personal protective equipment, enhanced cleaning of sites
and implemented social distancing protocols.
Our employees and facilities have a key role in keeping essential infrastructure and industries operating,
including oil and gas, water, chemical, power generation and other essential industries, such as food and beverage
and healthcare. While some of our facilities have experienced periods of temporary closures during 2020 in
accordance with decrees, orders and laws in their respective countries and geographies, as of February 18, 2021, all
of our facilities are open and operational, and are running close to pre-COVID-19 levels as we continue to make
essential products and provide services for our customers. However, the measures described above, combined with
continued employee costs and under-absorption of manufacturing costs as a result of temporary closures and
work-from-home policies, have had and are expected to continue having an adverse impact on our financial
performance throughout the remainder of the pandemic.
Customer Demand
During 2020 and into 2021 the reduction in global demand for oil and gas driven by the COVID-19 pandemic,
coupled with excessive supply due to disagreements between the Organization of Petroleum Exporting Countries
(‘‘OPEC’’) and other oil producing nations in the first half of 2020, led to extreme volatility in global markets and
31
in oil prices. These conditions have adversely impacted our customers, particularly in the oil and gas markets. For
example, in the first half of 2020, these conditions drove a significant and broad-based decrease in customer planned
capital spending, leading many of our large customers to announce double-digit capital expenditure budget decreases
for the remainder of 2020. As a result, we saw overall bookings decline by approximately 20% during 2020 as
compared to the same period in 2019, resulting in a lower sequential backlog, though we have not seen a significant
increase in the levels of customer cancellations in our existing backlog.
Additionally, the rapidly evolving impacts of the COVID-19 pandemic during 2020 and into 2021 have caused
reduced activity levels in our aftermarket business due to deferred spending of our customers’ repair and maintenance
budgets, including the impact of restricted access to our customers’ facilities. While we expect that these repair and
maintenance projects will ultimately need to be completed, the timing will largely depend on the duration of the
COVID-19 pandemic and how the virus and any variants continue to spread in our customers’ various geographies.
These trends are likely to continue during the duration of the COVID-19 pandemic as various actions
implemented to combat the pandemic will continue to reduce demand for oil and gas. As a result, we have
experienced decreased bookings, sales and financial performance and anticipate this continuing throughout the
remainder of the pandemic. Additionally, we expect the headwinds in the oil and gas markets that have resulted in,
and are likely to continue to result in, reduced capital expenditures and bookings for oil and gas customers to continue
at least until oil demand and prices stabilize, which may not occur until after the pandemic subsides.
Supply Chain Impact
Since the onset of the pandemic, many of our suppliers have also experienced varying lengths of production and
shipping conditions related to the COVID-19 pandemic, some of which continue to exist in highly affected countries.
These conditions have had an adverse effect on the speed at which we can manufacture and ship our products to
customers, and have also led to an increase in logistics, transportation and freight costs, requiring that we diversify
our supply chain and, in some instances, source materials from new suppliers. Additionally, these conditions have in
some cases impacted our ability to deliver products to customers on time, which has in turn led to an increase in
backlog at some of our manufacturing sites. Though some of these issues have abated in the second half of 2020 and
into 2021 certain disruptions in our supply chain and their effects have continued through the year, and we expect
they will continue as the COVID-19 pandemic continues.
Operational Impacts
We have also engaged in a number of cost savings measures in order to help mitigate certain of the adverse
effects of the COVID-19 pandemic on our financial results, including certain realignment activities (further described
below under ‘‘RESULTS OF OPERATIONS’’), a freeze on all non-essential open employment requisitions,
cancellation of merit-based payroll increases for 2020, reduction of capital expenditures to approximately $60 million
and cuts in other discretionary spending. Together, we planned for approximately $100 million of cost reductions,
excluding realignment charges, in 2020 as compared to 2019, due in large part to our response to the effects of
COVID-19, which partially offsets the increased costs and operational impacts of the safety protocols and procedures
that we have implemented as described above under the heading ‘‘-Health and Safety of Our Associates.’’ We
continue to evaluate additional cost savings measures and will continue to implement such measures in the near term
in order to reduce the impact of the COVID-19 pandemic on our financial results.
We continue to monitor and assess the spread of COVID-19, including in areas that have seen recent increases
in cases, and we will continue to adapt our operations to respond the changing conditions as needed. As we continue
to manage our business through this unprecedented time of uncertainty and market volatility, we will remain focused
on the health and safety of our associates, suppliers, customers, and will continue to provide essential products and
services to our customers.
Our Markets
Our products and services are used in several distinct industries: oil and gas, chemical, power generation, water
management, and several other industries, such as mining, steel and paper, that are collectively referred to as ‘‘general
industries.’’
Oil and Gas
The oil and gas industry, which represented approximately 34% and 41% of our bookings in 2020 and 2019,
respectively, experienced a material decrease in capital spending in 2020 compared to the previous year. The decrease
32

was primarily due to decreased project activity and short cycle investment resulting from the pandemic’s negative
impact on demand for refined products. Aftermarket opportunities in this industry also experienced a material
decrease in 2020 due to deferred spending of our customers’ repair and maintenance budgets and pandemic related
challenges accessing our customers’ facilities.
The outlook for the oil and gas industry is heavily dependent on the duration of the pandemic and its impact on
fuel demand, demand growth from both mature markets and developing geographies as well as changes in the
regulatory environment. In the short-term, we believe that the pandemic will continue to negatively impact our
customers’ capital investment and maintenance budgets. We further believe improved and stable oil prices provide
support for increased demand for our aftermarket products and services. We believe the medium and long-term
fundamentals for this industry remain attractive and see a stabilized environment with expected increased fuel
demand on improved pandemic management, and as the industry works through current excess supply. In addition,
we believe projected depletion rates of existing fields and forecasted long-term demand growth will require additional
investments. With our long-standing reputation in providing successful solutions for upstream, mid-stream and
downstream applications, along with the advancements in our portfolio of offerings, we believe that we continue to
be well-positioned to assist our customers in this improving environment.
Chemical
The chemical industry represented approximately 24% and 22% of our bookings in 2020 and 2019, respectively.
The chemical industry is comprised of petrochemical, specialty chemical and pharmaceutical products. Capital
spending in 2020 decreased materially primarily due to the pandemic’s negative impact on demand for chemical
products. The aftermarket opportunities also materially decreased in 2020 due to deferred spending of our customers’
repair and maintenance budgets and pandemic related challenges accessing our customers’ facilities.
The outlook for the chemical industry remains heavily dependent on global economic conditions. As global
economies and unemployment conditions improve, a rise in consumer spending should follow. An increase in
spending would drive greater demand for petrochemical, specialty chemical and pharmaceutical products supporting
improved levels of capital investment. We believe the chemical industry will continue to invest in North America and
Middle East capacity additions, maintenance and upgrades for optimization of existing assets and that developing
regions will selectively invest in capital infrastructure to meet current and future indigenous demand. We believe our
global presence and our localized aftermarket capabilities are well-positioned to serve the potential growth
opportunities in this industry.
Power Generation
The power generation industry represented approximately 13% and 11% of our bookings in 2020 and 2019,
respectively. In 2020, the power generation industry continued to experience softness in thermal power generation
capital spending in the mature and key developing markets. China continued to curtail the construction of new
coal-fired power generation over the last year, while in India and southeast Asia capital investment remained in place
driven by increased demand forecasts.
Natural gas-fired combined cycle (‘‘NGCC’’) plants increased their share of the energy mix, driven by market
prices for gas remaining low and stable (partially due to the increasing global availability of liquefied natural gas
(‘‘LNG’’)), low capital expenditures, and the ability of NGCC to stabilize unpredictable renewable sources. With the
potential of unconventional sources of gas, the global power generation industry is forecasting an increased use of
this form of fuel for power generation plants.
Despite fewer new nuclear plants being constructed in recent years, nuclear power remains an important
contributor to the global energy mix. We continue to support our significant installed base in the global nuclear fleet
by providing aftermarket and life extension products and services. Due to our extensive history, we believe we are
well positioned to take advantage of this ongoing source of aftermarket and new construction opportunities.
Political efforts to limit the emissions of carbon dioxide may have some adverse effect on thermal power
investment plans depending on the potential requirements imposed and the timing of compliance by country.
However, many proposed methods of capturing and limiting carbon dioxide emissions offer business opportunities
for our products and services. At the same time, we continue to take advantage of new investments in concentrated
solar power generating capacity, where our pumps, valves, and seals are uniquely positioned for both molten salt
applications as well as the traditional steam cycle.
33
We believe the long-term fundamentals for the power generation industry remain solid based on projected
increases in demand for electricity driven by global population growth, growth of urbanization in developing markets
and the increased use of electricity driven transportation. We also believe that our long-standing reputation in the
power generation industry, our portfolio of offerings for the various generating methods, our advancements in serving
the renewable energy market and carbon capture methodologies, as well as our global service and support structure,
position us well for the future opportunities in this important industry.
Water Management
The water management industry represented approximately 3% and 4% of our bookings in 2020 and 2019,
respectively. Water management industry activity levels decreased in 2020 primarily due to the pandemic’s negative
impact on government budgets across the globe. Worldwide demand for fresh water, water treatment and re-use,
desalination and flood control are expected to create requirements for new facilities or for upgrades of existing
systems, many of which require products that we offer, particularly pumps. With improved management of the
pandemic, we expect capital and aftermarket spending to rise in developed and emerging markets with governments
and private industry providing funding for critical projects when their priorities shift away from pandemic-
management.
The proportion of people living in regions that find it difficult to meet water requirements is expected to double
by 2025. We believe that the persistent demand for fresh water during all economic cycles supports continued
investments, especially in North America and developing regions.
General Industries
General industries represented, in the aggregate, approximately 26% and 22% of our bookings in 2020 and 2019,
respectively. General industries comprise a variety of different businesses, including mining and ore processing, pulp
and paper, food and beverage and other smaller applications, none of which individually represented more than 5%
of total bookings in 2020 and 2019. General industries also include sales to distributors, whose end customers operate
in the industries we primarily serve. Sales to distributors in 2020 were negatively impacted by decreased upstream
oil and gas activity in North America.
The outlook for this group of industries is heavily dependent upon the condition of global economies and
consumer confidence levels. The long-term fundamentals of many of these industries remain sound, as many of the
products produced by these industries are common staples of industrialized and urbanized economies. We believe that
our specialty product offerings designed for these industries and our aftermarket service capabilities will provide
continued business opportunities.
Outlook for 2021
As the headwinds experienced during the year continue to impact our business, we experienced approximately
a 20% decline in bookings as compared to the same period in 2019, with less of an impact on revenue, which declined
approximately 5% as compared to the same period in 2019. We anticipate further pressure on revenue with a year
over year decline of approximately 4% to 7% in 2021 as a result of lower bookings in 2020, resulting in lower
customer backlog as we enter 2021. Despite these effects, however, we expect to maintain adequate liquidity over
the next 12 months as we manage through the current market environment. We will continue to actively monitor the
potential impacts of COVID-19 and related events on the credit markets in order to maintain sufficient liquidity and
access to capital throughout 2021.
Our future results of operations and other forward-looking statements contained in this Annual Report, including
this MD&A, involve a number of risks and uncertainties — in particular, the statements regarding our goals and
strategies, new product introductions, plans to cultivate new businesses, future economic conditions, revenue, pricing,
gross profit margin and costs, capital spending, expected cost savings from our transformation and realignment
programs, global economic and political risk, depreciation and amortization, research and development expenses,
potential impairment of assets, tax rate and pending tax and legal proceedings. Our future results of operations may
also be affected by employee incentive compensation including our annual program and the amount, type and
valuation of share-based awards granted, as well as the amount of awards forfeited due to employee turnover. In
addition to the various important factors discussed above, a number of other factors could cause actual results to differ
materially from our expectations. See the risks described in ‘‘Item 1A. Risk Factors’’ as well as the section titled
‘‘Forward-Looking Information is Subject to Risk and Uncertainty’’ of this Annual Report.
34

Our bookings were $3,411.6 million during 2020. Because a booking represents a contract that can be, in certain
circumstances, modified or canceled, and can include varying lengths between the time of booking and the time of
revenue recognition, there is no guarantee that bookings will result in comparable revenues or otherwise be indicative
of future results.
On December 31, 2020, we had $1,701.5 million of fixed-rate Senior Notes outstanding. We expect our interest
expense in 2021 will be modestly higher compared with amounts incurred in 2020. Our results of operations may also
be impacted by unfavorable foreign currency exchange rate movements. See ‘‘Item 7A. Quantitative and Qualitative
Disclosures about Market Risk’’ of this Annual Report.
We expect to generate sufficient cash from operations and have sufficient capacity under our Senior Credit
Facility to fund our working capital, capital expenditures, dividend payments, share repurchases, debt payments and
pension plan contributions in 2021. The amount of cash generated or consumed by working capital is dependent on
our level of revenues, customer cash advances, backlog, customer-driven delays and other factors. We will seek to
improve our working capital utilization, with a particular focus on improving the management of accounts receivable
and inventory. In 2021, our cash flows for investing activities will be focused on strategic initiatives, information
technology infrastructure, general upgrades and cost reduction opportunities and we currently estimate capital
expenditures to be between $70 million and $80 million, before consideration of any acquisition activity.
We currently anticipate that our minimum contribution to our qualified U.S. pension plan will be approximately
$20 million, excluding direct benefits paid, in 2021 in order to maintain fully-funded status as defined by applicable
law. We currently anticipate that our contributions to our non-U.S. pension plans will be approximately $2 million
in 2021, excluding direct benefits paid.
OUR RESULTS OF OPERATIONS
Throughout this discussion of our results of operations, we discuss the impact of fluctuations in foreign currency
exchange rates. We have calculated currency effects on operations by translating current year results on a monthly
basis at prior year exchange rates for the same periods.
In October 2020, we entered into a settlement agreement with two insurance companies providing coverage for
one of our heritage companies. Given the size of the settlement, and as part of the third quarter close process, we
re-evaluated our accounting for asbestos-related matters and evaluated the amount of receivables that were currently
recorded. We made certain adjustments primarily related to an incurred but not reported (‘‘IBNR’’) liability
associated with unasserted asbestos claims, but also included adjustments related to the associated receivables for
expected insurance proceeds for asbestos settlement and defense costs from insurance coverage and the recognition
as an expense the related legal fees that were previously estimated to be recoverable from insurance carriers for which
coverage is not currently sufficient following the recognition of the IBNR for periods beginning with the year ended
December 31, 2014 through the second quarter of 2020 and to correct certain other previously identified immaterial
errors. These errors, individually and in the aggregate, are not material to any prior annual or interim period.
However, the aggregate amount of the prior period errors would have been material to our quarterly results for the
period ended September 30, 2020 and the results for the year ended December 31, 2020 and therefore we have revised
our previously issued financial statements for the fiscal years ended December 31, 2019 and 2018. Refer to Note 2
to our consolidated financial statements included in this Annual Report for more information.
Realignment Activity
In the second quarter of 2018, we launched and committed resources to our Flowserve 2.0 Transformation, a
program designed to transform our business model to drive operational excellence, reduce complexity, accelerate
growth, improve organizational health and better leverage our existing global platform, which is further discussed in
Note 22 to our consolidated financial statements included in Item 8 of this Annual Report. We anticipate that the
Flowserve 2.0 Transformation will result in further restructuring charges, non-restructuring charges and other related
transformation expenses. The Flowserve 2.0 Transformation expenses incurred primarily consist of professional
services, project management and related travel costs recorded in SG&A expenses. For the year ended December 31,
2020 and 2019, we incurred Flowserve 2.0 Transformation related expenses of $22.7 million and $28.0 million,
respectively.
In the second quarter of 2020, we identified and initiated certain realignment activities resulting from our
Flowserve 2.0 Transformation Program to right-size our organizational operations based on the current business
35

environment, with the overall objective to reduce our workforce costs. We anticipate a total investment in 2020
Realignment Program activities of approximately $80 million and that the majority of the charges were incurred in
2020 with the remainder to be incurred in early 2021. Based on actions initiated in 2020, we estimate that we have
achieved cost savings of approximately $41 million as of December 31, 2020, with approximately $16 million of
those savings in COS and approximately $25 million SG&A. Upon completion of the 2020 Realignment Program
activities, we expect full year run-rate cost savings of approximately $100 million. Actual savings could vary from
expected savings, which represent management’s best estimate to date. There are certain other realignment activities
that are currently being evaluated, but have not yet been finalized. The realignment programs initiated in 2015 (‘‘2015
Realignment Programs’’), which consisted of both restructuring and non-restructuring charges, were substantially
complete as of March 31, 2020, resulting in $362.4 million of total charges incurred through the completion of the
programs.
The total charges incurred in 2020 related to our 2020 Realignment Program activities and Flowserve 2.0
Transformation by segment and the charges incurred in 2019 related to our 2015 Realignment Programs and
Flowserve 2.0 Transformation by segment are presented in the following tables:
December 31, 2020
(Amounts in thousands) FPD FCD
Subtotal–ReportableSegments All Other
ConsolidatedTotal
Total Realignment and Transformation
Program Charges
COS. . . . . . . . . . . . . . . . . . . . . . . . . . . . . . . . . $38,838 $ 8,407 $47,245 $ 52 $ 47,297
SG&A . . . . . . . . . . . . . . . . . . . . . . . . . . . . . . . 11,322 4,940 16,262 41,230 57,492
Total . . . . . . . . . . . . . . . . . . . . . . . . . . . . . . $50,160 $13,347 $63,507 $41,282 $104,789
December 31, 2019
(Amounts in thousands) FPD FCD
Subtotal–ReportableSegments All Other
ConsolidatedTotal
Total Realignment and Transformation
Program Charges
COS. . . . . . . . . . . . . . . . . . . . . . . . . . . . . . . . . $ 12,587 $4,395 $ 16,982 $ 255 $17,237
SG&A(1) . . . . . . . . . . . . . . . . . . . . . . . . . . . . . (14,506) 774 (13,732) 32,467 18,735
Income tax expense(2) . . . . . . . . . . . . . . . . . . (4,000) — (4,000) — (4,000)
Total . . . . . . . . . . . . . . . . . . . . . . . . . . . . . . $ (5,919) $5,169 $ (750) $32,722 $31,972
(1) Includes gains from the sales of non-strategic manufacturing facilities that are included in our Realignment Programs.
(2) Income tax expense (benefit) includes exit taxes.
Bookings and Backlog
2020 2019 2018
(Amounts in millions)
Bookings . . . . . . . . . . . . . . . . . . . . . . . . . . . . . . . . . . . . . . . . . . . . . . . . . . . . . . . $3,411.6 $4,238.3 $4,019.8
Backlog (at period end) . . . . . . . . . . . . . . . . . . . . . . . . . . . . . . . . . . . . . . . . . . . 1,854.9 2,157.0 1,891.6
We define a booking as the receipt of a customer order that contractually engages us to perform activities on
behalf of our customer in regard to the manufacture, delivery, and/or support of products or the delivery of service.
Bookings recorded and subsequently canceled within the same fiscal period are excluded from reported bookings.
Bookings of $3.4 billion in 2020 decreased by $826.7 million, or 19.5%, as compared with 2019. The decrease
included negative currency effects of approximately $24 million. The decrease was driven by lower bookings in the
oil and gas, chemical, general, power generation and water management industries. Customer bookings were down
significantly in both aftermarket and original equipment, which have decreased in light of the impacts of COVID-19
on customer spending and distressed oil prices on these industries.
36

Bookings of $4.2 billion in 2019 increased by $218.5 million, or 5.4%, as compared with 2018. The increase
included negative currency effects of approximately $108 million. The increase was primarily driven by customer
original equipment bookings. The increase was driven by higher bookings in the oil and gas, power generation,
chemical and water management industries, partially offset by decreased bookings in the general industries. Bookings
in 2018 included approximately $31 million related to the two FPD locations and associated product lines that were
divested in the third quarter of 2018.
Backlog represents the aggregate value of booked but uncompleted customer orders and is influenced primarily
by bookings, sales, cancellations and currency effects. Backlog of $1.9 billion at December 31, 2020 decreased by
$302.1 million, or 14.0%, as compared with December 31, 2019. Currency effects provided an increase of
approximately $54 million (currency effects on backlog are calculated using the change in period end exchange
rates). Backlog related to aftermarket orders was approximately 36% and 33% of the backlog at December 31, 2020
and 2019, respectively. We expect to recognize revenue on approximately 90% of December 31, 2020 backlog during
2021. Backlog includes our unsatisfied (or partially unsatisfied) performance obligations related to contracts having
an original expected duration in excess of one year of approximately $541 million as discussed in Note 3 to our
consolidated financial statements included in Item 8 of this Annual Report.
Backlog of $2.2 billion at December 31, 2019 increased by $265.4 million, or 14.0%, as compared with
December 31, 2018. Currency effects provided an increase of less than $1 million (currency effects on backlog are
calculated using the change in period end exchange rates). Backlog related to aftermarket orders was approximately
33% and 36% of the backlog at December 31, 2019 and 2018, respectively. We expected to recognize revenue on
approximately 88% of December 31, 2019 backlog during 2020.
Sales
2020 2019 2018
(Amounts in millions)
Sales . . . . . . . . . . . . . . . . . . . . . . . . . . . . . . . . . . . . . . . . . . . . . . . . . . . . . . . . . . $3,728.1 $3,939.7 $3,835.7
Sales in 2020 decreased by $211.6 million, or 5.4%, as compared with 2019. The decrease included negative
currency effects of approximately $17 million. The decrease in sales was primarily driven by aftermarket sales, with
decreased sales into North America, Europe, Africa, Latin America and Asia Pacific, partially offset by increased
sales into the Middle East.
Sales in 2019 increased by $104.0 million, or 2.7%, as compared with 2018. The increase included negative
currency effects of approximately $94 million. The increase was more heavily-weighted to aftermarket sales, with
increased sales into North America, Europe and Asia Pacific, partially offset by decreased sales into Latin America,
Africa and the Middle East. Sales in 2018 included approximately $30 million related to the two FPD locations and
associated product lines that were divested in the third quarter of 2018.
Sales to international customers, including export sales from the U.S., were approximately 65% of total sales
in 2020 and 63% in both 2019 and 2018. Sales into Europe, the Middle East and Africa (‘‘EMA’’) were approximately
33% of total sales in 2020, 32% in both 2019 and 2018. Sales into Asia Pacific were approximately 22% of total sales
for 2020, 21% for 2019 and 20% for 2018. Sales into Latin America were approximately 6% of total sales in 2020,
2019 and 2018.
Gross Profit and Gross Profit Margin
2020 2019 2018
(Amounts in millions, except percentages)
Gross profit. . . . . . . . . . . . . . . . . . . . . . . . . . . . . . . . . . . . . . . . . . . . . . . . . . . . . $1,116.8 $1,289.3 $1,190.9
Gross profit margin . . . . . . . . . . . . . . . . . . . . . . . . . . . . . . . . . . . . . . . . . . . . . . 30.0% 32.7% 31.0%
Gross profit in 2020 decreased by $172.5 million, or 13.4%, as compared with 2019. Gross profit margin in 2020
of 30.0% decreased from 32.7% in 2019. The decrease in gross profit margin was primarily due to a sales mix shift
to lower margin original equipment sales, revenue recognized on lower margin original equipment orders as
compared to the same period in 2019, increased realignment charges associated with our 2020 Realignment Program
and the unfavorable impact of underutilized capacity from the COVID-19 pandemic resulting in $15.0 million of
37

manufacturing costs being expensed and other related costs, partially offset by increased savings related to our 2020
Realignment Program. Aftermarket sales represented approximately 49% of total sales, as compared with
approximately 50% of total sales for the same period in 2019.
Gross profit in 2019 increased by $98.4 million, or 8.3%, as compared with 2018. Gross profit margin in 2019
of 32.7% increased from 31.0% in 2018. The increase in gross profit margin was primarily attributed to the favorable
impact of revenue recognized on higher margin projects, lower realignment charges associated with our Realignment
Programs, improvements in operational efficiency and a $7.7 million charge related to the write-down of inventory
in the second quarter of 2018 that did not recur. Aftermarket sales represented approximately 50% of total sales in
both 2019 and 2018.
SG&A
2020 2019 2018
(Amounts in millions, except percentages)
SG&A . . . . . . . . . . . . . . . . . . . . . . . . . . . . . . . . . . . . . . . . . . . . . . . . . . . . . . . . . $878.2 $913.2 $966.6
SG&A as a percentage of sales . . . . . . . . . . . . . . . . . . . . . . . . . . . . . . . . . . . . . 23.6% 23.2% 25.2%
SG&A in 2020 decreased by $35.0 million, or 3.8%, as compared with 2019. Currency effects yielded a decrease
of approximately $1 million. In 2020, SG&A as a percentage of sales increased 40 basis points as compared with the
same period in 2019. The decrease in in SG&A, including currency, was due to a decrease in travel and selling-related
expenses and increased savings related to our 2020 Realignment Program, partially offset by increased charges
related to our 2020 Realignment Program as compared to the same period in 2019 and an $8.5 million write-down
of accounts receivables and contract assets related to a contract with an oil and gas customer in Latin America during
the first quarter of 2020.
SG&A in 2019 increased by $53.4 million, or 5.5%, as compared with 2018. Currency effects yielded a decrease
of approximately $18 million. In 2019, SG&A as a percentage of sales decreased 200 basis points as compared with
the same period in 2018 primarily due to lower charges related to our Flowserve 2.0 Transformation and Realignment
Programs, decreased broad-based annual incentive compensation expense, gains from the sales of non-strategic
manufacturing facilities during the year, favorable impacts resulting from the 2018 divestiture of two FPD locations
and a $9.7 million impairment charge related to long-lived assets in the second quarter of 2018 that did not recur.
Loss on Sale of Business
2020 2019 2018
(Amounts in millions)
Loss on sale of business . . . . . . . . . . . . . . . . . . . . . . . . . . . . . . . . . . . . . . . . . . $— $— $(7.7)
The loss on sale of business in 2018 of $7.7 million resulted from the divestiture of two FPD locations and
related product lines. See Note 4 to our consolidated financial statements included in Item 8 of this Annual Report
for additional information on this sale.
Net Earnings from Affiliates
2020 2019 2018
(Amounts in millions)
Net earnings from affiliates . . . . . . . . . . . . . . . . . . . . . . . . . . . . . . . . . . . . . . . . $11.8 $10.5 $11.1
Net earnings from affiliates represents our net income from investments in six joint ventures (one located in each
of Chile, China, India, Saudi Arabia, South Korea and the United Arab Emirates) that are accounted for using the
equity method of accounting. Net earnings from affiliates in 2020 increased by $1.3 million, or 12.4%, as compared
to the prior year, primarily as a result of increased earnings of our FPD joint venture in South Korea. Net earnings
from affiliates in 2019 decreased by $0.6 million, or 5.4%, as compared to the prior year, primarily as a result of
decreased earnings of our FPD joint venture in India.
38

Operating Income
2020 2019 2018
(Amounts in millions, except percentages)
Operating income . . . . . . . . . . . . . . . . . . . . . . . . . . . . . . . . . . . . . . . . . . . . . . . . $250.3 $386.6 $227.7Operating income as a percentage of sales . . . . . . . . . . . . . . . . . . . . . . . . . . . . 6.7% 9.8% 5.9%
Operating income in 2020 decreased by $136.3 million, or 35.3%, as compared with 2019. The decrease
included negative currency effects of approximately $9 million. The decrease was primarily a result of the
$172.5 million decrease in gross profit, partially offset by the $35.0 million decrease in SG&A.
Operating income in 2019 increased by $158.9 million, or 69.8%, as compared with 2018. The increase included
negative currency effects of approximately $12 million. The increase was primarily as result of the $98.4 million
increase in gross profit driven primarily by reduced demand and other impacts of the pandemic, as well as reduced
oil prices, the $53.4 million decrease in SG&A and the loss of $7.7 million from the divestiture of two FPD locations
and related product lines in the third quarter of 2018 that did not recur.
Interest Expense and Interest Income
2020 2019 2018
(Amounts in millions)
Interest expense . . . . . . . . . . . . . . . . . . . . . . . . . . . . . . . . . . . . . . . . . . . . . . . . . . . . . . $(57.4) $(55.0) $(58.2)Interest income. . . . . . . . . . . . . . . . . . . . . . . . . . . . . . . . . . . . . . . . . . . . . . . . . . . . . . . 4.2 8.4 6.5
Interest expense in 2020 increased by $2.4 million as compared with 2019. The increase was primarily
attributable to interest expense associated with the senior notes issued in the third quarter of 2020, partially offset by
the net impact of our partial tender of our 1.250% EUR Senior Notes due 2022 (‘‘2022 Euro Senior Notes’’). Interest
income in 2020 decreased by $4.2 million as compared to 2019. The decrease in interest income was partially due
to lower interest rates on our average cash balances compared with same period in 2019.
Interest expense in 2019 decreased by $3.2 million as compared with 2018. The decrease was primarily
attributable to lower borrowings in 2019 and currency impacts on interest expense associated with our outstanding
Euro-denominated senior notes, as compared to the same period in 2018. Interest income in 2019 increased by
$1.9 million as compared to 2018. The increase in interest income was primarily attributed to higher average cash
balances compared with same period in 2018.
Other Income (Expense), net
2020 2019 2018
(Amounts in millions)
Other income (expense), net . . . . . . . . . . . . . . . . . . . . . . . . . . . . . . . . . . . . . . . . . . . . $(10.3) $(17.6) $(19.6)
Other expense, net decreased $7.3 million as compared to 2019, due to a $12.4 million increase in gains from
transactions in currencies other than our sites’ functional currencies, partially offset by a $3.8 million increase in
losses from foreign exchange contracts. The net change was primarily due to the foreign currency exchange rate
movements in the Canadian dollar, Mexican peso, Euro and Brazilian real in relation to the U.S. dollar during the
year ended December 31, 2020, as compared with the same period in 2019.
Other expense, net decreased $2.0 million in 2019, due to a $7.6 million decrease in losses from transactions
in currencies other than our sites’ functional currencies, partially offset by a $3.3 million increase in losses from
foreign exchange contracts. The net change was primarily due to the foreign currency exchange rate movements in
the Euro, Indian rupee, Singapore dollar and Mexican peso in relation to the U.S. dollar during the year ended
December 31, 2019, as compared with the same period in 2018.
Tax Expense and Tax Rate
2020 2019 2018
(Amounts in millions, except percentages)
Provision for income taxes . . . . . . . . . . . . . . . . . . . . . . . . . . . . . . . . . . . . . . $60.0 $75.5 $46.6Effective tax rate . . . . . . . . . . . . . . . . . . . . . . . . . . . . . . . . . . . . . . . . . . . . . . 32.1% 23.4% 29.8%
39

Our effective tax rate of 32.1% for the year ended December 31, 2020 increased from 23.4% in 2019 primarily
due to the establishment of a valuation allowance against certain deferred tax assets given the current and anticipated
impact to the Company’s operations resulting from the COVID-19 pandemic and the distressed oil prices. The 2020
effective tax rate differed from the federal statutory rate of 21% primarily due to the establishment of a valuation
allowance described above. The 2019 effective tax rate differed from the federal statutory rate of 21% primarily due
to state tax and foreign audit assessments, partially offset by the net impact of foreign operations. The 2018 effective
tax rate differed from the federal statutory rate of 21% primarily due to the net impact of foreign operations, including
losses in certain foreign jurisdictions for which no tax benefit was provided.
Our effective tax rate is based upon current earnings and estimates of future taxable earnings for each domestic
and international location. Changes in any of these and other factors, including our ability to utilize foreign tax credits
and net operating losses or results from tax audits, could impact the tax rate in future periods. As of December 31,
2020, we have foreign tax credits of $35.9 million, expiring in 2026 and 2028-2030 tax years, against which we
recorded a valuation allowance of $35.9 million. Additionally, we have recorded other net deferred tax assets of
$30.5 million, which relate to net operating losses, tax credits and other deductible temporary differences that are
available to reduce taxable income in future periods, most of which do not have a definite expiration. Should we not
be able to utilize all or a portion of these credits and losses, our effective tax rate would increase.
Net Earnings and Earnings Per Share
2020 2019 2018
(Amounts in millions, except per share amounts)
Net earnings attributable to Flowserve Corporation . . . . . . . . . . . . . . . . $116.3 $238.8 $104.5
Net earnings per share — diluted . . . . . . . . . . . . . . . . . . . . . . . . . . . . . . $ 0.89 $ 1.81 $ 0.80
Average diluted shares . . . . . . . . . . . . . . . . . . . . . . . . . . . . . . . . . . . . . . . 131.1 131.7 131.3
Net earnings in 2020 decreased by $122.5 million to $116.3 million, or to $0.89 per diluted share, as compared
with 2019. The decrease was primarily attributable to a decrease in operating income of $136.3 million and a
$6.6 million increase in interest expense, net, partially offset by a $7.3 million decrease in other expense, net and a
$15.5 million decrease in tax expense.
Net earnings in 2019 increased by $134.3 million to $238.8 million, or to $1.81 per diluted share, as compared
with 2018. The increase was primarily attributable to an increase in operating income of $158.9 million, a
$2.0 million decrease in other expense, net and a $5.1 million decrease in interest expense, net, partially offset by
a $28.9 million increase in tax expense.
Other Comprehensive Income (Loss)
2020 2019 2018
(Amounts in millions)
Other comprehensive income (loss) . . . . . . . . . . . . . . . . . . . . . . . . . . . . . . . . . . . . . . $(9.0) $(9.8) $(67.8)
Other comprehensive income (loss) in 2020 decreased by $0.8 million from a loss of $9.8 million in 2019. The
decreased loss was primarily due to foreign currency translation adjustments resulting primarily from exchange rate
movements of the Euro, Chinese yuan, British pound and Canadian dollar versus the U.S. dollar at December 31,
2020 as compared with 2019.
Other comprehensive income (loss) in 2019 decreased by $58.0 million as compared with 2018. The decreased
loss was primarily due to foreign currency translation adjustments resulting primarily from exchange rate movements
of the Euro, British pound, Chinese yuan and Indian rupee versus the U.S. dollar at December 31, 2019 as compared
with 2018.
Business Segments
We conduct our operations through two business segments based on type of product and how we manage the
business. We evaluate segment performance and allocate resources based on each segment’s operating income. See
Note 20 to our consolidated financial statements included in Item 8 of this Annual Report for further discussion of
our segments. The key operating results for our two business segments, FPD and FCD, are discussed below.
40

Flowserve Pump Division Segment Results
Our largest business segment is FPD, through which we design, manufacture, pre-test, distribute and service
specialty and highly-engineered custom and pre-configured pumps and pump systems, mechanical seals and auxiliary
systems (collectively referred to as ‘‘original equipment’’). FPD includes longer lead time, highly-engineered pump
products and mechanical seals that are generally manufactured within shorter lead times. FPD also manufactures
replacement parts and related equipment and provides aftermarket services. FPD primarily operates in the oil and gas,
petrochemical, chemical, power generation, water management and general industries. FPD operates in 48 countries
with 39 manufacturing facilities worldwide, 13 of which are located in Europe, 12 in North America, eight in Asia
Pacific and six in Latin America, and we have 137 QRCs, including those co-located in manufacturing facilities
and/or shared with FCD.
FPD
2020 2019 2018
(Amounts in millions, except percentages)
Bookings . . . . . . . . . . . . . . . . . . . . . . . . . . . . . . . . . . . . . . . . . . . . . . . . . . . . . . . $2,358.4 $3,007.9 $2,753.5
Sales . . . . . . . . . . . . . . . . . . . . . . . . . . . . . . . . . . . . . . . . . . . . . . . . . . . . . . . . . . 2,675.7 2,706.3 2,623.3
Gross profit. . . . . . . . . . . . . . . . . . . . . . . . . . . . . . . . . . . . . . . . . . . . . . . . . . . . . 811.4 899.3 775.7
Gross profit margin . . . . . . . . . . . . . . . . . . . . . . . . . . . . . . . . . . . . . . . . . . . . . . 30.3% 33.2% 29.6%
SG&A . . . . . . . . . . . . . . . . . . . . . . . . . . . . . . . . . . . . . . . . . . . . . . . . . . . . . . . . . 552.2 566.3 578.9
Loss on sale of business . . . . . . . . . . . . . . . . . . . . . . . . . . . . . . . . . . . . . . . . . . — — (7.7)
Segment operating income. . . . . . . . . . . . . . . . . . . . . . . . . . . . . . . . . . . . . . . . . 271.0 343.5 201.0
Segment operating income as a percentage of sales. . . . . . . . . . . . . . . . . . . . . 10.1% 12.7% 7.7%
Backlog (at period end) . . . . . . . . . . . . . . . . . . . . . . . . . . . . . . . . . . . . . . . . . . . 1,236.9 1,560.9 1,286.2
Bookings in 2020 decreased by $649.5 million, or 21.6%, as compared with 2019. The decrease included
negative currency effects of approximately $20 million. The decrease in customer bookings was driven by decreased
orders in the oil and gas, chemical, power generation and general industries. Decreased customer bookings of
$288.0 million into North America, $146.8 million into the Middle East, $79.9 million into Asia Pacific,
$68.1 million into Europe, $39.1 million into Africa and $21.6 million into Latin America. The decrease in customer
bookings was primarily driven by customer original equipment bookings which have decreased in light of the impacts
of COVID-19 on customer spending and distressed oil prices on these industries. Interdivision bookings (which are
eliminated and are not included in consolidated bookings as disclosed above) increased $3.1 million. Of the
$2.4 billion of bookings in 2020, approximately 37% were from oil and gas, 27% from general industries, 20% from
chemical, 12% from power generation and 4% from water management.
Bookings in 2019 increased by $254.4 million, or 9.2%, as compared with 2018. The increase included negative
currency effects of approximately $79 million. Bookings in 2018 included approximately $31 million related to the
two FPD locations and associated product lines that were divested in the third quarter of 2018. The increase in
customer bookings was primarily driven by the oil and gas, chemical and power generation industries, partially offset
by decreased bookings in the general industries. Increased customer bookings of $100.4 million into North America,
$78.1 million into the Middle East, $72.1 million into Asia Pacific, $18.6 million in Latin America and $11.5 million
into Africa, were partially offset by decreased customer bookings of $49.9 million into Europe. The increase was
primarily driven by customer original equipment bookings. Of the $3.0 billion of bookings in 2019, approximately
44% were from oil and gas, 22% from general industries, 19% from chemical, 10% from power generation and 5%
from water management.
Sales in 2020 decreased $30.6 million, or 1.1%, as compared with 2019. The decrease included negative
currency effects of approximately $19 million. The decrease was driven by aftermarket sales, resulting from
decreased customer sales of $43.6 million into North America, $16.3 million into Africa, $13.5 million into Europe
and $10.2 million into Latin America, partially offset by increased sales of $39.4 million into Asia Pacific and
$20.7 million into the Middle East.
Sales in 2019 increased $83.0 million, or 3.2%, as compared with 2018. The increase included negative currency
effects of approximately $66 million. Sales in 2018 included approximately $30 million related to the two FPD
locations and associated product lines that were divested in the third quarter of 2018. The increase was primarily
41

driven by aftermarket sales, resulting from increased customer sales of $45.3 million into North America,
$28.6 million into Europe, $16.8 million into the Middle East and $8.8 million into Africa, partially offset by
decreased sales of $17.8 million into Latin America and $4.0 million into Asia Pacific.
Gross profit in 2020 decreased by $87.9 million, or 9.8%, as compared with 2019. Gross profit margin in 2020
of 30.3% decreased from 33.2% in 2019. The decrease in gross profit margin was primarily due to a sales mix shift
to lower margin original equipment sales as compared to the same period in 2019, the increased charges related to
our 2020 Realignment Program and the unfavorable impact of underutilized capacity from the COVID-19 pandemic
resulting in $9.2 million of manufacturing costs being expensed and other related costs, partially offset by increased
savings related to our 2020 Realignment Program.
Gross profit in 2019 increased by $123.6 million, or 15.9%, as compared with 2018. Gross profit margin in 2019
of 33.2% increased from 29.6% in 2018. The increase in gross profit margin was primarily attributable to revenue
recognized on higher margin projects, lower realignment charges associated with our Realignment Programs, sales
mix shift to higher margin aftermarket sales, improvements in operational efficiency and a $7.7 million charge related
to the write-down of inventory in the second quarter of 2018 that did not recur.
SG&A in 2020 decreased by $14.1 million, or 2.5%, as compared with 2019. Currency effects provided a
decrease of approximately $1 million. The decrease in SG&A, including currency, was due to favorable impacts on
SG&A due to a decrease in travel and selling-related expenses, increased savings related to our 2020 Realignment
Program as compared to the same period in 2019 and the favorable impacts resulting from gains from the sales of
non-strategic manufacturing facilities in the first quarter of 2019 that did not recur, partially offset by an $8.5 million
write-down of accounts receivables and contract assets related to a contract with an oil and gas customer in Latin
America during the first quarter of 2020.
SG&A in 2019 decreased by $12.6 million, or 2.2%, as compared with 2018. Currency effects provided a
decrease of approximately $13 million. The decrease in SG&A, including currency, was due to favorable impacts on
SG&A due to gains from the sales of non-strategic manufacturing facilities during the year, the 2018 divestiture of
two FPD locations and a $9.7 million impairment charge related to the long-lived assets in the second quarter of 2018
that did not recur, partially offset by an increase in selling-related expenses and collections of previously reserved bad
debts in 2018 that did not recur.
The loss on sale of business in 2018 of $7.7 million resulted from the divestiture of two FPD locations and
related product lines. See Note 4 to our consolidated financial statements included in Item 8 of this Annual Report
for additional information on this sale.
Operating income in 2020 decreased by $72.5 million, or 21.1%, as compared with 2019. The decrease included
negative currency effects of approximately $9 million. The decrease was due to the $87.9 million decrease in gross
profit, partially offset by the $14.1 million decrease in SG&A.
Operating income in 2019 increased by $142.5 million, or 70.9%, as compared with 2018. The increase included
negative currency effects of approximately $10 million. The increase was due to the $123.6 million increase in gross
profit, the $12.6 million decrease in SG&A and the $7.7 million loss from the divestiture of two FPD locations and
related product lines in the third quarter of 2018 that did not recur.
Backlog of $1.2 billion at December 31, 2020 decreased by $324.0 million, or 20.8%, as compared with
December 31, 2019. Currency effects provided an increase of approximately $36 million. Backlog of $1.6 billion at
December 31, 2019 increased by $274.7 million, or 21.4%, as compared with December 31, 2018. Currency effects
provided an increase of approximately $5 million.
42

Flow Control Division Segment Results
FCD designs, manufactures, distributes and services a broad portfolio of engineered and industrial valve and
automation solutions, including isolation and control valves, actuation, controls and related equipment. FCD
leverages its experience and application know-how by offering a complete menu of engineering and project
management services to complement its expansive product portfolio. FCD has a total of 48 manufacturing facilities
and QRCs in 22 countries around the world, with five of its 21 manufacturing operations located in the U.S., 10
located in Europe, five located in Asia Pacific and one located in Latin America. We believe that FCD is the second
largest industrial valve supplier in the world.
FCD
2020 2019 2018
(Amounts in millions, except percentages)
Bookings . . . . . . . . . . . . . . . . . . . . . . . . . . . . . . . . . . . . . . . . . . . . . . . . . . . . . . . $1,065.8 $1,240.9 $1,274.3
Sales . . . . . . . . . . . . . . . . . . . . . . . . . . . . . . . . . . . . . . . . . . . . . . . . . . . . . . . . . . 1,057.5 1,238.9 1,218.8
Gross profit. . . . . . . . . . . . . . . . . . . . . . . . . . . . . . . . . . . . . . . . . . . . . . . . . . . . . 321.9 405.5 419.9
Gross profit margin . . . . . . . . . . . . . . . . . . . . . . . . . . . . . . . . . . . . . . . . . . . . . . 30.4% 32.7% 34.5%
SG&A . . . . . . . . . . . . . . . . . . . . . . . . . . . . . . . . . . . . . . . . . . . . . . . . . . . . . . . . . 196.3 213.6 215.0
Segment operating income. . . . . . . . . . . . . . . . . . . . . . . . . . . . . . . . . . . . . . . . . 125.6 191.9 204.2
Segment operating income as a percentage of sales. . . . . . . . . . . . . . . . . . . . . 11.9% 15.5% 16.8%
Backlog (at period end) . . . . . . . . . . . . . . . . . . . . . . . . . . . . . . . . . . . . . . . . . . . 623.1 600.0 608.4
Bookings in 2020 decreased $175.1 million, or 14.1%, as compared with 2019. The decrease included negative
currency effects of approximately $3.4 million. The decrease was driven by lower bookings in the oil and gas,
general, chemical and power generation industries. Decreased customer bookings of $140.9 million into North
America, $33.4 million into Europe, $20.4 million into the Middle East and $9.0 million into Africa, were partially
offset by increased bookings of $17.5 million into Asia Pacific and $6.7 million into Latin America. The decrease
was more heavily weighted towards original equipment bookings. Of the $1.1 billion of bookings in 2020,
approximately 31% were from chemical, 29% were from oil and gas, 25% from general industries and 15% from
power generation.
Bookings in 2019 decreased $33.4 million, or 2.6%, as compared with 2018. The decrease included negative
currency effects of approximately $29 million. The decrease in customer bookings in the general and chemical
industries were partially offset by increases in the power generation, oil and gas and water management industries.
Decreased customer bookings of $27.3 million into North America, $8.2 million into Asia Pacific and $2.6 million
into Europe were partially offset by increased bookings of $24.1 million into the Middle East. The decrease was more
heavily weighted towards customer aftermarket bookings. Of the $1.2 billion of bookings in 2019, approximately
34% were from oil and gas, 29% from chemical, 24% from general industries and 13% from power generation.
Sales in 2020 decreased by $181.4 million, or 14.6%, as compared with 2019. The decrease included currency
benefits of approximately $1 million and was primarily driven by decreased customer original equipment sales. Sales
decreased $113.9 million into North America, $45.9 million into Asia Pacific, $32.0 million into Europe and
$2.6 million into Latin America and were partially offset by increased customer sales of $8.8 million into the Middle
East and $2.7 million into Africa.
Sales in 2019 increased by $20.1 million, or 1.6%, as compared with 2018. The increase included negative
currency effects of approximately $28 million and was driven by increased customer original equipment sales. Sales
increased $40.2 million into Asia Pacific, $17.6 million into Europe, $6.5 million into Latin America and $3.5 million
into North America and were partially offset by decreased customer sales of $23.5 million into the Middle East and
$15.9 million into Africa.
Gross profit in 2020 decreased by $83.6 million, or 20.6%, as compared with 2019. Gross profit margin in 2020
of 30.4% decreased from 32.7% in 2019. The decrease in gross profit margin was primarily due to lower sales volume
and revenue recognized on lower margin original equipment orders as compared to the same period in 2019,
increased charges related to our 2020 Realignment Program and the unfavorable impact of underutilized capacity
from the COVID-19 pandemic resulting in $5.8 million of manufacturing costs and other related costs being
expensed, partially offset by increased savings related to our 2020 Realignment Program.
43

Gross profit in 2019 decreased by $14.4 million, or 3.4%, as compared with 2018. Gross profit margin in 2019
of 32.7% decreased from 34.5% in 2018. The decrease in gross profit margin was primarily attributed to a mix shift
to more original equipment sales and revenue recognized on lower margin original equipment orders as compared to
the same period in 2018.
SG&A in 2020 decreased by $17.3 million, or 8.1% as compared with 2019. Currency effects provided a
decrease of less than $1 million. The decrease in SG&A was primarily due to increased savings related to our 2020
Realignment Program as compared to the same period in 2019 and a decrease in travel and selling-related expenses
from our cost saving initiatives in response to COVID-19.
SG&A in 2019 decreased by $1.4 million, or 0.7% as compared with 2018. Currency effects provided a decrease
of approximately $4 million. The decrease in SG&A was primarily due to currency effects as compared to 2018.
Operating income in 2020 decreased by $66.3 million, or 34.5%, as compared with 2019. The decrease included
negative currency effects of less than $1 million. The decrease was primarily due to the $83.6 million decrease in
gross profit, partially offset by the decrease in SG&A of $17.3 million.
Operating income in 2019 decreased by $12.3 million, or 6.0%, as compared with 2018. The decrease included
negative currency effects of approximately $3 million. The decrease was primarily due to the $14.4 million decrease
in gross profit, partially offset by the decrease in SG&A of $1.4 million.
Backlog of $623.1 million at December 31, 2020 increased by $23.1 million, or 3.9%, as compared with
December 31, 2019. Currency effects provided an increase of approximately $19 million. Backlog of $600.0 million
at December 31, 2019 decreased by $8.4 million, or 1.4%, as compared with December 31, 2018. Currency effects
provided a decrease of approximately $5 million.
LIQUIDITY AND CAPITAL RESOURCES
Cash Flow Analysis
2020 2019 2018
(Amounts in millions)
Net cash flows provided (used) by operating activities . . . . . . . . . . . . . . . . . . . . $310.5 $ 324.1 $ 190.8
Net cash flows provided (used) by investing activities. . . . . . . . . . . . . . . . . . . . . (41.7) (33.4) (81.5)
Net cash flows provided (used) by financing activities . . . . . . . . . . . . . . . . . . . . 147.6 (231.5) (173.3)
Existing cash, cash generated by operations and borrowings available under our senior credit facility are our
primary sources of short-term liquidity. We monitor the depository institutions that hold our cash and cash equivalents
on a regular basis, and we believe that we have placed our deposits with creditworthy financial institutions. Our
sources of operating cash generally include the sale of our products and services and the conversion of our working
capital, particularly accounts receivable and inventories. Our total cash balance at December 31, 2020 was
$1,095.3 million, compared with $671.0 million at December 31, 2019 and $619.7 million at December 31, 2018.
Our cash provided by operating activities was $310.5 million, $324.1 million and $190.8 million in 2020, 2019
and 2018, respectively, which provided cash to support short-term working capital needs. Cash flow provided by
working capital increased in 2020 due primarily to cash provided by lower accounts receivable of $45.6 million,
higher accrued liabilities and income taxes payable of $50.2 million, lower inventory of $15.3 million and lower
contract assets, net of $4.3 million, partially offset by cash used by lower accounts payable of $22.6 million and lower
contract liabilities of $34.1 million. Cash flow used by working capital increased in 2019 due primarily to cash used
by higher contract assets of $45.2 million, higher inventory of $31.1 million, lower accounts receivables of
$2.9 million and lower accrued liabilities and income taxes payable of $12.4 million, partially offset by cash provided
by higher contract liabilities of $19.7 million. During 2020, we contributed $15.9 million to our defined benefit
pension plans as compared to $37.3 million in 2019.
Decreases in accounts receivable provided $45.6 million and $2.9 million of cash flow in 2020 and 2019,
respectively, as compared with cash flow used of $25.4 million in 2018. For the fourth quarter of 2020 our days’ sales
outstanding (‘‘DSO’’) was 69 days as compared to 67 days for 2019 and 72 days for 2018. We have not experienced
a significant increase in customer payment defaults in 2020.
Decreases in inventory provided $15.3 million of cash flow in 2020, as compared with cash used of
$31.1 million and $29.3 million in 2019 and 2018, respectively. The cash used from inventory in 2019 was due to
44

an increase in raw materials and work in process. Inventory turns were 4.1 times at December 31, 2020, as compared
with 4.3 times for 2019 and 4.2 times for 2018. Our calculation of inventory turns does not reflect the impact of
advanced cash received from our customers.
Decreases in contract assets provided $4.3 million of cash flow and decreases in contact liabilities used
$34.1 million of cash flow in 2020. Increases in contract assets used $45.2 million of cash flow and increases in
contact liabilities provided $19.7 million of cash flow in 2019.
Decreases in accounts payable used $22.6 million of cash flow in 2020 compared with cash provided of
$24.7 million and $7.6 million in 2019 and 2018, respectively. Increases in accrued liabilities and income taxes
payable provided $50.2 million of cash flow in 2020 compared to $12.4 million 2019 and cash used of $15.2 million
in 2018.
Cash used by investing activities were $41.7 million in 2020, as compared to $33.4 million and $81.5 million
in 2019 and 2018, respectively. The increase of cash used in 2020 was primarily due to lower proceeds provided from
the disposal of assets during the year of $13.8 million, compared to $42.3 million in 2019. Capital expenditures were
$57.4 million, $75.7 million and $84.0 million in 2020, 2019 and 2018, respectively. In 2021, we currently estimate
capital expenditures to be between $70 million and $80 million, before consideration of any acquisition activity.
Cash provided by financing activities were $147.6 million in 2020 compared to cash flow used of $231.5 million
and $173.3 million in 2019 and 2018, respectively. Cash inflows during 2020 resulted primarily from the
$498.3 million in net proceeds from the issuance of the senior notes due October 1, 2030 (‘‘2030 Senior Notes’’),
partially offset by a $191.3 million in payments on long-term debt resulting from our partial tender offer of our 2022
Euro Senior Notes, $104.2 million of dividend payments and the repurchase of $15.0 million of our common stock.
Cash outflows during 2019 resulted primarily from $105.0 million in payments on long-term debt and $99.6 million
of dividend payments. Cash outflows during 2018 resulted primarily from $99.4 million of dividend payments and
$60.0 million in payments on long-term debt. On February 17, 2021, we announced that we will redeem the
outstanding balance of our 2022 Euro Senior Notes on March 19, 2021. We will use the remaining net proceeds from
the public offering of the 2030 Senior Notes for the redemption.
In 2020 we repurchased 1,057,115 shares of our outstanding common stock for $32.1 million. As of
December 31, 2020, we had $113.6 million of remaining capacity under our share repurchase plan previously
approved by the Board of Directors.
Our cash needs for the next 12 months, including for our estimated 2021 capital expenditures described above,
are expected to be lower than those of 2020 due to anticipated benefits from working capital reductions and savings
from 2020 Realignment Program, discussed in Note 22 to our consolidated financial statements included in Item 8
of this Annual Report. We believe cash flows from operating activities, combined with availability under our senior
credit facility and our existing cash balances, will be sufficient to enable us to meet our cash flow needs for the next
12 months. However, cash flows from operations could be adversely affected by a continued decrease in the rate of
general global economic growth and an extended decrease in capital spending of our customers, as well as economic,
political and other risks associated with sales of our products, operational factors, competition, regulatory actions,
fluctuations in foreign currency exchange rates and fluctuations in interest rates, among other factors. We believe that
cash flows from operating activities and our expectation of continuing availability to draw upon our credit agreements
are also sufficient to meet our cash flow needs for periods beyond the next 12 months.
Acquisitions and Dispositions
We regularly evaluate acquisition opportunities of various sizes. The cost and terms of any financing to be raised
in conjunction with any acquisition, including our ability to raise economical capital, is a critical consideration in any
such evaluation.
Note 4 to our consolidated financial statements included in Item 8 of this Annual Report contains a discussion
of our disposition activity.
Financing
Our credit agreement provides for a $800.0 million unsecured senior credit facility with a maturity date of
July 16, 2024 (‘‘Senior Credit Facility’’). The Senior Credit Facility includes a $750.0 million sublimit for the
issuance of letters of credit and a $30.0 million sublimit for swing line loans. We have the right to increase the amount
45

of the Senior Credit Facility by an aggregate amount not to exceed $400.0 million, subject to certain conditions,
including the approval of the lenders under our Senior Credit Facility of any such increase.
The interest rates per annum applicable to the Senior Credit Facility (other than with respect to swing line loans)
are LIBOR plus between 1.000% to 1.750%, depending on our debt rating by either Moody’s Investors Service, Inc.
or Standard & Poor’s (‘‘S&P’’) Ratings, or, at our option, the Base Rate (as defined in the Senior Credit Agreement)
plus between 0.000% to 0.750% depending on our debt rating by either Moody’s Investors Service, Inc. or S&P
Global Ratings. At December 31, 2020 the interest rate on the Senior Credit Facility was LIBOR plus 1.375% in the
case of LIBOR loans and the Base Rate plus 0.375% in the case of Base Rate loans. In addition, a commitment fee
is payable quarterly in arrears on the daily unused portions of the Senior Credit Facility. The commitment fee will
be between 0.090% and 0.300% of unused amounts under the Senior Credit Facility depending on our debt rating
by either Moody’s Investors Service, Inc. or S&P Global Ratings. Certain financing arrangements contain provisions
that may result in an event of default if there was a failure under other financing arrangements to meet payment terms.
Such provisions are referred to as ‘‘cross default’’ provisions. A discussion of our debt and related covenants is
included in Note 13 to our consolidated financial statements included in Item 8 of this Annual Report. We were in
compliance with the covenants as of December 31, 2020.
Liquidity Analysis
Our cash balance increased by $424.3 million to $1,095.3 million as of December 31, 2020 as compared with
December 31, 2019. The cash increase included $310.5 million in operating cash inflows, $498.3 million in net
proceeds from the issuance of the senior notes due October 1, 2030 (‘‘2030 Senior Notes’’) and $13.8 million from
the sale of non-strategic manufacturing facilities that are included in our Realignment Programs, partially offset by
$191.3 million in payments on long-term debt, $104.2 million in dividend payments, $57.4 million in capital
expenditures and the repurchase of $32.1 million of our common stock. Proceeds received during 2019 included
$42.3 million of proceeds from the sale of non-strategic manufacturing facilities that were included in our 2015
Realignment Programs.
At December 31, 2020 and 2019, as a result of the values of the plan’s assets and our contributions to the plan,
our U.S. pension plan was fully-funded as defined by applicable law. After consideration of our funded status, we
elected to make no contributions attributable to the U.S. pension plan in 2020. As of December 31, 2020 direct
benefits paid by the U.S. pension plan were less than $1.0 million. We continue to maintain an asset allocation
consistent with our strategy to maximize total return, while reducing portfolio risks through asset class
diversification.
COVID-19 Liquidity Update
As of December 31, 2020, we had approximately $1,837 million of liquidity, consisting of cash and cash
equivalents of $1,095 million and $742 million of borrowings available under our Senior Credit Facility. In light of
the liquidity currently available to us, and the costs savings measures planned and already in place, we expect to be
able to maintain adequate liquidity over the next 12 months as we manage through the current market environment.
We will continue to actively monitor the potential impacts of COVID-19 and related events on the credit markets in
order to maintain sufficient liquidity and access to capital throughout 2020.
46

CONTRACTUAL OBLIGATIONS AND COMMERCIAL COMMITMENTS
The following table presents a summary of our contractual obligations at December 31, 2020:
Payments Due By Period
Within 1 Year 1-3 Years 3-5 Years Beyond 5 Years Total
(Amounts in millions)
Senior Notes . . . . . . . . . . . . . . . . . . . . . . . . . . . . . . . . . . . $ — $1,207.7 $ — $493.9 $1,701.6
Fixed interest payments(1) . . . . . . . . . . . . . . . . . . . . . . 52.1 70.9 35.0 83.2 241.2
Other debt . . . . . . . . . . . . . . . . . . . . . . . . . . . . . . . . . . . 9.0 16.4 — — 25.4
Leases:
Operating. . . . . . . . . . . . . . . . . . . . . . . . . . . . . . . . . . . . 42.6 93.4 21.0 95.0 252.0
Finance . . . . . . . . . . . . . . . . . . . . . . . . . . . . . . . . . . . . . 5.5 9.0 0.9 5.3 20.7
Purchase obligations:(2)
Inventory . . . . . . . . . . . . . . . . . . . . . . . . . . . . . . . . . . . . 407.9 10.7 0.3 — 418.9
Non-inventory . . . . . . . . . . . . . . . . . . . . . . . . . . . . . . . . 35.9 0.5 0.3 — 36.7
Pension and postretirement benefits(3) . . . . . . . . . . . . . . . 63.3 125.4 124.8 302.7 616.2
Total. . . . . . . . . . . . . . . . . . . . . . . . . . . . . . . . . . . . . . . . . . $616.3 $1,534.0 $182.3 $980.1 $3,312.7
(1) Fixed interest payments represent interest payments on the Senior Notes as defined in Note 13 to our consolidated financial statements
included in Item 8 of this Annual Report.
(2) Purchase obligations are presented at the face value of the purchase order, excluding the effects of early termination provisions. Actual
payments could be less than amounts presented herein.
(3) Retirement and postretirement benefits represent estimated benefit payments for our U.S. and non-U.S. defined benefit plans and our
postretirement medical plans, as more fully described below and in Note 14 to our consolidated financial statements included in Item 8 of
this Annual Report.
As of December 31, 2020, the gross liability for uncertain tax positions was $54.8 million. We do not expect
a material payment related to these obligations to be made within the next twelve months. We are unable to provide
a reasonably reliable estimate of the timing of future payments relating to the uncertain tax positions.
The following table presents a summary of our commercial commitments at December 31, 2020:
Commitment Expiration By Period
Within 1 Year 1-3 Years 3-5 Years Beyond 5 Years Total
(Amounts in millions)
Letters of credit . . . . . . . . . . . . . . . . . . . . . . . . . . . . . . . . $482.0 $120.9 $27.0 $27.4 $ 657.3
Surety bonds . . . . . . . . . . . . . . . . . . . . . . . . . . . . . . . . . . . 341.5 10.8 0.8 — 353.1
Total. . . . . . . . . . . . . . . . . . . . . . . . . . . . . . . . . . . . . . . . . . $823.5 $131.7 $27.8 $27.4 $1,010.4
We expect to satisfy these commitments through performance under our contracts.
PENSION AND POSTRETIREMENT BENEFITS OBLIGATIONS
Plan Descriptions
We and certain of our subsidiaries have defined benefit pension plans and defined contribution plans for
full-time and part-time employees. Approximately 62% of total defined benefit pension plan assets and
approximately 51% of defined benefit pension obligations are related to the U.S. qualified plan as of December 31,
2020. Unless specified otherwise, the references in this section are to all of our U.S. and non-U.S. plans. None of our
common stock is directly held by these plans.
47

Our U.S. defined benefit plan assets consist of a balanced portfolio of equity and fixed income securities. Our
non-U.S. defined benefit plan assets include a significant concentration of United Kingdom (‘‘U.K.’’) fixed income
securities, as discussed in Note 14 to our consolidated financial statements included in Item 8 of this Annual Report.
We monitor investment allocations and manage plan assets to maintain an acceptable level of risk. At December 31,
2020, the estimated fair market value of U.S. and non-U.S. plan assets for our defined benefit pension plans increased
to $765.0 million from $745.1 million at December 31, 2019. Assets were allocated as follows:
U.S. Plan
Asset category 2020 2019
Cash and Cash Equivalents . . . . . . . . . . . . . . . . . . . . . . . . . . . . . . . . . . . . . . . . . . . . . . . . . . . . . . 1% 1%
Global Equity . . . . . . . . . . . . . . . . . . . . . . . . . . . . . . . . . . . . . . . . . . . . . . . . . . . . . . . . . . . . . . . . . 30% 28%
Global Real Assets . . . . . . . . . . . . . . . . . . . . . . . . . . . . . . . . . . . . . . . . . . . . . . . . . . . . . . . . . . . . . 13% 12%
Equity securities . . . . . . . . . . . . . . . . . . . . . . . . . . . . . . . . . . . . . . . . . . . . . . . . . . . . . . . . . . . . . 43% 40%
Diversified Credit . . . . . . . . . . . . . . . . . . . . . . . . . . . . . . . . . . . . . . . . . . . . . . . . . . . . . . . . . . . . . . 14% 12%
Liability-Driven Investment . . . . . . . . . . . . . . . . . . . . . . . . . . . . . . . . . . . . . . . . . . . . . . . . . . . . . . 42% 47%
Fixed income. . . . . . . . . . . . . . . . . . . . . . . . . . . . . . . . . . . . . . . . . . . . . . . . . . . . . . . . . . . . . . . . 56% 59%
Non-U.S. Plans
Asset category 2020 2019
Cash and Cash Equivalents . . . . . . . . . . . . . . . . . . . . . . . . . . . . . . . . . . . . . . . . . . . . . . . . . . . . . . 1% 2%
North American Companies . . . . . . . . . . . . . . . . . . . . . . . . . . . . . . . . . . . . . . . . . . . . . . . . . . . . . . 1% 1%
Global Equity . . . . . . . . . . . . . . . . . . . . . . . . . . . . . . . . . . . . . . . . . . . . . . . . . . . . . . . . . . . . . . . . . 1% 1%
Equity securities . . . . . . . . . . . . . . . . . . . . . . . . . . . . . . . . . . . . . . . . . . . . . . . . . . . . . . . . . . . . . 2% 2%
U.K. Government Gilt Index . . . . . . . . . . . . . . . . . . . . . . . . . . . . . . . . . . . . . . . . . . . . . . . . . . . . . 39% 43%
Liability-Driven Investment . . . . . . . . . . . . . . . . . . . . . . . . . . . . . . . . . . . . . . . . . . . . . . . . . . . . . . 12% 7%
Fixed income. . . . . . . . . . . . . . . . . . . . . . . . . . . . . . . . . . . . . . . . . . . . . . . . . . . . . . . . . . . . . . . . 51% 50%
Multi-asset . . . . . . . . . . . . . . . . . . . . . . . . . . . . . . . . . . . . . . . . . . . . . . . . . . . . . . . . . . . . . . . . . . . . 20% 19%
Buy-in Contract . . . . . . . . . . . . . . . . . . . . . . . . . . . . . . . . . . . . . . . . . . . . . . . . . . . . . . . . . . . . . . . . 20% 21%
Other . . . . . . . . . . . . . . . . . . . . . . . . . . . . . . . . . . . . . . . . . . . . . . . . . . . . . . . . . . . . . . . . . . . . . . . . 6% 6%
Other types . . . . . . . . . . . . . . . . . . . . . . . . . . . . . . . . . . . . . . . . . . . . . . . . . . . . . . . . . . . . . . . . . 46% 46%
The projected benefit obligation (‘‘Benefit Obligation’’) for our defined benefit pension plans was
$957.4 million and $897.1 million as of December 31, 2020 and 2019, respectively. Benefits under our defined
benefit pension plans are based primarily on participants’ compensation and years of credited service.
We sponsor defined benefit postretirement medical plans covering certain current retirees and a limited number
of future retirees in the U.S. These plans provide for medical and dental benefits and are administered through
insurance companies. We fund the plans as benefits are paid, such that the plans hold no assets in any period
presented. Accordingly, we have no investment strategy or targeted allocations for plan assets. The benefits under the
plans are not available to new employees or most existing employees.
The Benefit Obligation for our defined benefit postretirement medical plans was $18.6 million and $18.9 million
as of December 31, 2020 and 2019, respectively.
Accrual Accounting and Significant Assumptions
We account for pension benefits using the accrual method, recognizing pension expense before the payment of
benefits to retirees. The accrual method of accounting for pension benefits requires actuarial assumptions concerning
future events that will determine the amount and timing of the benefit payments.
Our key assumptions used in calculating our cost of pension benefits are the discount rate, the rate of
compensation increase and the expected long-term rate of return on plan assets. We, in consultation with our
actuaries, evaluate the key actuarial assumptions and other assumptions used in calculating the cost of pension and
postretirement benefits, such as discount rates, expected return on plan assets for funded plans, mortality rates,
retirement rates and assumed rate of compensation increases, and determine such assumptions as of December 31 of
48

each year to calculate liability information as of that date and pension and postretirement expense for the following
year. See discussion of our accounting for and assumptions related to pension and postretirement benefits in the ‘‘Our
Critical Accounting Estimates’’ section of this MD&A.
In 2020, the service cost component of the pension expense for our defined benefit pension plans included in
operating income was $32.9 million compared with $29.0 million in 2019 and $29.4 million in 2018. The non-service
cost portion of net pension expense (e.g., interest cost, actuarial gains and losses and expected return on plan assets)
for our defined benefit pension plans included in other income (expense), net was $4.0 million, compared to
$1.8 million in 2019 and a benefit of $1.2 million in 2018.
The following are assumptions related to our defined benefit pension plans as of December 31, 2020:
U.S. Plan Non-U.S. Plans
Weighted average assumptions used to determine Benefit Obligation:
Discount rate . . . . . . . . . . . . . . . . . . . . . . . . . . . . . . . . . . . . . . . . . . . . . . . . . . . . . . . . . . . 2.62% 1.23%
Rate of increase in compensation levels . . . . . . . . . . . . . . . . . . . . . . . . . . . . . . . . . . . . . 3.63 3.11
Weighted average assumptions used to determine 2020 net pension expense:
Long-term rate of return on assets . . . . . . . . . . . . . . . . . . . . . . . . . . . . . . . . . . . . . . . . . . 6.00% 2.37%
Discount rate . . . . . . . . . . . . . . . . . . . . . . . . . . . . . . . . . . . . . . . . . . . . . . . . . . . . . . . . . . . 3.41 1.61
Rate of increase in compensation levels . . . . . . . . . . . . . . . . . . . . . . . . . . . . . . . . . . . . . 3.56 3.12
Weighted-average interest crediting rates . . . . . . . . . . . . . . . . . . . . . . . . . . . . . . . . . . . . . . . 3.79% 1.00%
The following provides a sensitivity analysis of alternative assumptions on the U.S. qualified and aggregate
non-U.S. pension plans and U.S. postretirement plans.
Effect of Discount Rate Changes and Constancy of Other Assumptions:
0.5% Increase 0.5% Decrease
(Amounts in millions)
U.S. defined benefit pension plan:
Effect on net pension expense. . . . . . . . . . . . . . . . . . . . . . . . . . . . . . . . . . . . . . . . . $ (2.1) $ 2.1
Effect on Benefit Obligation . . . . . . . . . . . . . . . . . . . . . . . . . . . . . . . . . . . . . . . . . . (20.7) 22.6
Non-U.S. defined benefit pension plans:
Effect on net pension expense. . . . . . . . . . . . . . . . . . . . . . . . . . . . . . . . . . . . . . . . . (0.6) 0.9
Effect on Benefit Obligation . . . . . . . . . . . . . . . . . . . . . . . . . . . . . . . . . . . . . . . . . . (36.2) 41.2
U.S. Postretirement medical plans:
Effect on Benefit Obligation . . . . . . . . . . . . . . . . . . . . . . . . . . . . . . . . . . . . . . . . . . (0.6) 0.6
Effect of Changes in the Expected Return on Assets and Constancy of Other Assumptions:
0.5% Increase 0.5% Decrease
(Amounts in millions)
U.S. defined benefit pension plan:
Effect on net pension expense. . . . . . . . . . . . . . . . . . . . . . . . . . . . . . . . . . . . . . . . . $(2.1) $2.1
Non-U.S. defined benefit pension plans:
Effect on net pension expense. . . . . . . . . . . . . . . . . . . . . . . . . . . . . . . . . . . . . . . . . (1.0) 1.0
As discussed below, accounting principles generally accepted in the U.S. (‘‘U.S. GAAP’’) provide that
differences between expected and actual returns are recognized over the average future service of employees or over
the remaining expected lifetime for plans with only inactive participants.
At December 31, 2020, as compared with December 31, 2019, we decreased our discount rate for the U.S. plan
from 3.41% to 2.62% based on an analysis of publicly-traded investment grade U.S. corporate bonds, which had
lower yields due to current market conditions. The average discount rate for the non-U.S. plans decreased from 1.61%
to 1.23% based on analysis of bonds and other publicly-traded instruments, by country, which had lower yields due
to market conditions. The average assumed rate of compensation increased to 3.63% for the U.S. plan and decreased
to 3.11% from 3.12% for our non-U.S. plans. To determine the 2020 pension expense, the expected rate of return on
U.S. plan assets remained constant at 6.00% and we decreased our average rate of return on non-U.S. plan assets from
49

3.37% to 2.37%, primarily based on our target allocations and expected long-term asset returns. As the expected rate
of return on plan assets is long-term in nature, short-term market fluctuations do not significantly impact the rate. For
all U.S. plans, we adopted the Pri-2012 mortality tables and the MP-2020 improvement scale published in October
2020. We applied the Pri-2012 tables based on the constituency of our plan population for union and non-union
participants. We adjusted the improvement scale to utilize the Proxy SSA Long Term Improvement Rates (‘‘LTIR’’),
consistent with assumptions adopted by the Social Security Administration trustees, based on long-term historical
experience. Currently, we believe this approach provides the best estimate of our future obligation. Most plan
participants elect to receive plan benefits as a lump sum at the end of service, rather than an annuity. As such, the
updated mortality tables had an immaterial effect on our pension obligation.
We expect that the net pension expense for our defined benefit pension plans included in earnings before income
taxes will be approximately $3.3 million lower in 2021 than the $37.0 million in 2020, primarily due to a decrease
in interest costs and expected return on assets with no anticipated special events. We have used discount rates of
2.62%, 1.23% and 2.32% at December 31, 2020, in calculating our estimated 2021 net pension expense for the U.S.
pension plans, non-U.S. pension plans and postretirement medical plans, respectively.
The assumed ranges for the annual rates of increase in health care costs were 7.0% for 2020, 7.5% for 2019 and
7% for 2018, with a gradual decrease to 5.0% for 2029 and future years. If actual costs are higher than those assumed,
this will likely put modest upward pressure on our expense for retiree health care.
Plan Funding
Our funding policy for defined benefit plans is to contribute at least the amounts required under applicable laws
and local customs. We contributed $15.9 million, $37.3 million and $48.1 million to our defined benefit plans in
2020, 2019 and 2018, respectively. After consideration of our intent to remain fully-funded based on standards set
by law, we currently anticipate that our contribution to our U.S. pension plan in 2021 will be approximately
$20 million, excluding direct benefits paid. We expect to contribute approximately $2 million to our non-U.S. pension
plans in 2021, excluding direct benefits paid.
For further discussion of our pension and postretirement benefits, see Note 14 to our consolidated financial
statements included in Item 8 of this Annual Report.
OUR CRITICAL ACCOUNTING ESTIMATES
The process of preparing financial statements in conformity with U.S. GAAP requires the use of estimates and
assumptions to determine reported amounts of certain assets, liabilities, revenues and expenses and the disclosure of
related contingent assets and liabilities. These estimates and assumptions are based upon information available at the
time of the estimates or assumptions, including our historical experience, where relevant. The most significant
estimates made by management include: timing and amount of revenue recognition; deferred taxes, tax valuation
allowances and tax reserves; reserves for contingent loss; pension and postretirement benefits; and valuation of
goodwill, indefinite-lived intangible assets and other long-lived assets. The significant estimates are reviewed at least
annually if not quarterly by management. Because of the uncertainty of factors surrounding the estimates,
assumptions and judgments used in the preparation of our financial statements, actual results may differ from the
estimates, and the difference may be material.
Our critical accounting policies are those policies that are both most important to our financial condition and
results of operations and require the most difficult, subjective or complex judgments on the part of management in
their application, often as a result of the need to make estimates about the effect of matters that are inherently
uncertain. We believe that the following represent our critical accounting policies. For a summary of all of our
significant accounting policies, see Note 1 to our consolidated financial statements included in Item 8 of this Annual
Report. Management and our external auditors have discussed our critical accounting estimates and policies with the
Audit Committee of our Board of Directors.
Revenue Recognition
We recognize revenue when (or as) we satisfy a performance obligation by transferring control to a customer.
Transfer of control is evaluated based on the customer’s ability to direct the use of and obtain substantially all of the
benefits of a performance obligation. Revenue is recognized either over time or at a point in time, depending on the
specific facts and circumstances for each contract, including the terms and conditions of the contract as agreed with
the customer and the nature of the products or services to be provided.
50

Our primary method for recognizing revenue over time is the percentage of completion (‘‘POC’’) method,
whereby progress towards completion is measured by applying an input measure based on costs incurred to date
relative to total estimated costs at completion. If control of the products and/or services does not transfer over time,
then control transfers at a point in time. We determine the point in time that control transfers to a customer based on
the evaluation of specific indicators, such as title transfer, risk of loss transfer, customer acceptance and physical
possession. For a discussion related to revenue recognition refer to Note 3 included in Item 8 of this Annual Report.
Deferred Taxes, Tax Valuation Allowances and Tax Reserves
We recognize valuation allowances to reduce the carrying value of deferred tax assets to amounts that we expect
are more likely than not to be realized. Our valuation allowances primarily relate to the deferred tax assets established
for certain tax credit carryforwards and net operating loss carryforwards for non-U.S. subsidiaries, and we evaluate
the realizability of our deferred tax assets and adjust the amount of the valuation allowances, if necessary. We assess
such factors as our forecast of future taxable income and available tax planning strategies that could be implemented
to realize the net deferred tax assets in determining the sufficiency of our valuation allowances. Failure to achieve
forecasted taxable income in the applicable tax jurisdictions could affect the ultimate realization of deferred tax assets
and could result in an increase in our effective tax rate on future earnings. Implementation of different tax structures
in certain jurisdictions could, if successful, result in future reductions of certain valuation allowances.
The amount of income taxes we pay is subject to ongoing audits by federal, state and foreign tax authorities,
which often result in proposed assessments. Significant judgment is required in determining income tax provisions
and evaluating tax positions. We establish reserves for open tax years for uncertain tax positions that may be subject
to challenge by various tax authorities. The consolidated tax provision and related accruals include the impact of such
reasonably estimable losses and related interest and penalties as deemed appropriate. Tax benefits recognized in the
financial statements from uncertain tax positions are measured based on the largest benefit that has a greater than
fifty percent likelihood of being realized upon ultimate settlement.
While we believe we have adequately provided for any reasonably foreseeable outcomes related to these
matters, our future results may include favorable or unfavorable adjustments to our estimated tax liabilities. To the
extent that the expected tax outcome of these matters changes, such changes in estimate will impact the income tax
provision in the period in which such determination is made.
Reserves for Contingent Loss
We are a defendant in a number of lawsuits that seek to recover damages for personal injury allegedly resulting
from exposure to asbestos-containing products formerly manufactured and/or distributed by heritage companies of
the Company. We have estimated that the liability for pending and future claims not yet asserted, and which are
probable and estimable, could be experienced through 2049, which represents the expected end of our asbestos
liability exposure with no further ongoing claims expected beyond that date. This estimate is based on the Company’s
historical claim experience and estimates of the number and resolution cost of potential future claims that may be
filed based on anticipated levels of unique plaintiff asbestos-related claims in the U.S. tort system against all
defendants, the diminished volatility and consistency of observable claims data, the period of time that has elapsed
since we stopped manufacturing products that contained encapsulated asbestos and an expected downward trend in
claims due to the average age of our claimants. This estimate is not discounted to present value. In light of the
uncertainties and variables inherent in the long-term projection of the total asbestos liability, as part of our ongoing
review of asbestos claims, each year we will reassess the projected liability of unasserted asbestos claims to be filed
through 2049, and we will continually reassess the time horizon over which a reasonable estimate of unasserted
claims can be projected.
We assess the sufficiency of the estimated liability for pending and future claims on an ongoing basis by
evaluating actual experience regarding claims filed, settled and dismissed, and amounts paid in settlements. In
addition to claims and settlement experience, we consider additional quantitative and qualitative factors such as
changes in legislation, the legal environment and the Company’s defense strategy. In connection with our ongoing
review of asbestos-related claims, we have also reviewed the amount of potential insurance coverage for such claims,
taking into account the remaining limits of such coverage, the number and amount of claims on our insurance from
co-insured parties, ongoing litigation against the Company’s insurers, potential remaining recoveries from insolvent
51

insurers, the impact of previous insurance settlements and coverage available from solvent insurers not party to the
coverage litigation. Continuously, we review ongoing insurance coverage available for a significant amount of the
potential future asbestos-related claims and in the future could secure additional insurance coverage as deemed
necessary.
The study from the Company’s actuary, based on data as of September 30, 2020, provided for a range of possible
future liability from approximately $80.1 million to $131.7 million. The Company does not believe any amount
within the range of potential outcomes represents a better estimate than another given the many factors and
assumptions inherent in the projections and therefore the Company has recorded the liability at the actuarial central
estimate of approximately $99.5 million as of December 31, 2020. In addition, the Company has recorded estimated
insurance receivables of approximately $69.5 million as of December 31, 2020. The amounts recorded for the
asbestos-related liability and the related insurance receivables are based on facts known at the time and a number of
assumptions. However, projecting future events, such as the number of new claims to be filed each year, the length
of time it takes to defend, resolve, or otherwise dispose of such claims, coverage issues among insurers and the
continuing solvency of various insurance companies, as well as the numerous uncertainties surrounding asbestos
litigation in the United States, could cause the actual liability and insurance recoveries for us to be higher or lower
than those projected or recorded. Additionally, we have claims pending against certain insurers that, if resolved more
favorably than reflected in the recorded receivables, would result in discrete gains in the applicable year. Changes
recorded in the estimated liability and estimated insurance recovery based on projections of asbestos litigation and
corresponding insurance coverage, result in the recognition of additional expense or income. For a discussion
pertaining to the activity related to asbestos claims refer to Note 16 included in Item 8 of this Annual Report.
Liabilities are recorded for various non-asbestos contingencies arising in the normal course of business when it
is both probable that a loss has been incurred and such loss is reasonably estimable. Assessments of reserves are based
on information obtained from our independent and in-house experts, including recent legal decisions and loss
experience in similar situations. The recorded legal reserves are susceptible to changes due to new developments
regarding the facts and circumstances of each matter, changes in political environments, legal venue and other factors.
Recorded environmental reserves could change based on further analysis of our properties, technological innovation
and regulatory environment changes.
Pension and Postretirement Benefits
We provide pension and postretirement benefits to certain of our employees, including former employees, and
their beneficiaries. The assets, liabilities and expenses we recognize and disclosures we make about plan actuarial and
financial information are dependent on the assumptions and estimates used in calculating such amounts. The
assumptions include factors such as discount rates, health care cost trend rates, inflation, expected rates of return on
plan assets, retirement rates, mortality rates, turnover, rates of compensation increases and other factors.
The assumptions utilized to compute expense and benefit obligations are shown in Note 14 to our consolidated
financial statements included in Item 8 of this Annual Report. These assumptions are assessed annually in
consultation with independent actuaries and investment advisors as of December 31 and adjustments are made as
needed. We evaluate prevailing market conditions and local laws and requirements in countries where plans are
maintained, including appropriate rates of return, interest rates and medical inflation (health care cost trend) rates. We
ensure that our significant assumptions are within the reasonable range relative to market data. The methodology to
set our significant assumptions includes:
• Discount rates are estimated using high quality debt securities based on corporate or government bond
yields with a duration matching the expected benefit payments. For the U.S. the discount rate is obtained
from an analysis of publicly-traded investment-grade corporate bonds to establish a weighted average
discount rate. For plans in the U.K. and the Eurozone we use the discount rate obtained from an analysis
of AA-graded corporate bonds used to generate a yield curve. For other countries or regions without a
corporate AA bond market, government bond rates are used. Our discount rate assumptions are impacted
by changes in general economic and market conditions that affect interest rates on long-term high-quality
debt securities, as well as the duration of our plans’ liabilities.
52

• The expected rates of return on plan assets are derived from reviews of asset allocation strategies, expected
long-term performance of asset classes, risks and other factors adjusted for our specific investment strategy.
These rates are impacted by changes in general market conditions, but because they are long-term in nature,
short-term market changes do not significantly impact the rates. Changes to our target asset allocation also
impact these rates.
• The expected rates of compensation increase reflect estimates of the change in future compensation levels
due to general price levels, seniority, age and other factors.
Depending on the assumptions used, the pension and postretirement expense could vary within a range of
outcomes and have a material effect on reported earnings. In addition, the assumptions can materially affect benefit
obligations and future cash funding. Actual results in any given year may differ from those estimated because of
economic and other factors.
We evaluate the funded status of each retirement plan using current assumptions and determine the appropriate
funding level considering applicable regulatory requirements, tax deductibility, reporting considerations, cash flow
requirements and other factors. We discuss our funding assumptions with the Finance Committee of our Board of
Directors.
Valuation of Goodwill, Indefinite-Lived Intangible Assets and Other Long-Lived Assets
The initial recording of goodwill and intangible assets requires subjective judgments concerning estimates of the
fair value of the acquired assets. We test the value of goodwill and indefinite-lived intangible assets for impairment
as of December 31 each year or whenever events or circumstances indicate such assets may be impaired.
The test for goodwill impairment involves significant judgment in estimating projections of fair value generated
through future performance of each of the reporting units. The identification of our reporting units began at the
operating segment level and considered whether components one level below the operating segment levels should be
identified as reporting units for purpose of testing goodwill for impairment based on certain conditions. These
conditions included, among other factors, (i) the extent to which a component represents a business and (ii) the
aggregation of economically similar components within the operating segments and resulted in three reporting units.
Other factors that were considered in determining whether the aggregation of components was appropriate included
the similarity of the nature of the products and services, the nature of the production processes, the methods of
distribution and the types of industries served.
Accounting Standards Codification (‘‘ASC’’) 350 allows an optional qualitative assessment, prior to a
quantitative assessment test, to determine whether it is more likely than not that the fair value of a reporting unit
exceeds its carrying amount. We generally do not attempt a qualitative assessment and proceed directly to the
quantitative test. If the carrying value of a reporting unit exceeds its fair value, the goodwill of that reporting unit
is impaired and an impairment loss is recorded equal to the excess of the carrying value over its fair value. We
estimate the fair value of our reporting units based on an income approach, whereby we calculate the fair value of
a reporting unit based on the present value of estimated future cash flows. A discounted cash flow analysis requires
us to make various judgmental assumptions about future sales, operating margins, growth rates and discount rates,
which are based on our budgets, business plans, economic projections, anticipated future cash flows and market
participants.
We did not record an impairment of goodwill in 2020, 2019 or 2018; however, the estimated fair value of our
Pump reporting unit has reduced moderately during the year due to decreased broad-based capital spending resulting
from the ongoing COVID-19 pandemic and to a lesser extent the heightened pricing pressure experienced in the oil
and gas markets, both of which are anticipated to continue in the near to mid-term. The Pump reporting unit is a
component of EPD reporting segment and is primarily focused on highly engineered custom and pre-configured
pump products and systems. As of December 31, 2020, our Pump reporting unit had approximately $482.7 million
of goodwill and an estimated fair value that exceeded its carrying value by approximately 46% as compared to
approximately $468.8 million of goodwill and an estimated fair value that exceeded its carrying value by
approximately 131% as of December 31, 2019. The key factors considered in determining the estimated fair value
of our reporting units included the annual operating plan and forecasted operating results, successful execution of our
current continuous improvement and identified strategic initiatives, a constant cost of capital, continued stabilization
and mid to long-term improvement of the macro-economic conditions of the oil and gas market, and a relatively
stable global gross domestic product. Although we have concluded that there is no impairment on the goodwill
53

associated with our Pump reporting unit as of December 31, 2020, we will continue to closely monitor their
performance and related market conditions for future indicators of potential impairment and reassess accordingly.
We also considered our market capitalization in our evaluation of the fair value of our goodwill. Our market
capitalization decreased as compared with 2019, however this did not indicate a potential impairment of our goodwill
as of December 31, 2020.
Impairment losses for indefinite-lived intangible assets are recognized whenever the estimated fair value is less
than the carrying value. Fair values are calculated for trademarks using a ‘‘relief from royalty’’ method, which
estimates the fair value of a trademark by determining the present value of estimated royalty payments that are
avoided as a result of owning the trademark. This method includes judgmental assumptions about sales growth and
discount rates that have a significant impact on the fair value and are substantially consistent with the assumptions
used to determine the fair value of our reporting unit discussed above. We did not record a material impairment of
our trademarks in 2020, 2019 or 2018.
The recoverable value of other long-lived assets, including property, plant and equipment and finite-lived
intangible assets, is reviewed when indicators of potential impairments are present. The recoverable value is based
upon an assessment of the estimated future cash flows related to those assets, utilizing assumptions similar to those
for goodwill. Additional considerations related to our long-lived assets include expected maintenance and
improvements, changes in expected uses and ongoing operating performance and utilization.
Due to uncertain market conditions and potential changes in strategy and product portfolio, it is possible that
forecasts used to support asset carrying values may change in the future, which could result in non-cash charges that
would adversely affect our financial condition and results of operations.
ACCOUNTING DEVELOPMENTS
We have presented the information about accounting pronouncements not yet implemented in Note 1 to our
consolidated financial statements included in Item 8 of this Annual Report.
54

ITEM 7A. QUANTITATIVE AND QUALITATIVE DISCLOSURES ABOUT MARKET RISK
We have market risk exposure arising from changes in foreign currency exchange rate movements. We are
exposed to credit-related losses in the event of non-performance by counterparties to financial instruments, but we
currently expect the counterparties will continue to meet their obligations given their current creditworthiness.
Foreign Currency Exchange Rate Risk
A substantial portion of our operations are conducted by our subsidiaries outside of the U.S. in currencies other
than the U.S. dollar. The primary currencies in which we operate, in addition to the U.S. dollar, are the Argentine
peso, Australian dollar, Brazilian real, British pound, Canadian dollar, Chinese yuan, Colombian peso, Euro,
Hungarian forint, Indian rupee, Japanese yen, Mexican peso, Singapore dollar, Swedish krona, Russian ruble,
Malaysian ringgit and Venezuelan bolivar. Almost all of our non-U.S. subsidiaries conduct their business primarily
in their local currencies, which are also their functional currencies. Foreign currency exposures arise from translation
of foreign-denominated assets and liabilities into U.S. dollars and from transactions, including firm commitments and
anticipated transactions, denominated in a currency other than a non-U.S. subsidiary’s functional currency. We have
designated €336.3 million of our 1.25% EUR Senior Notes due 2022 as a net investment hedge of our investments
in certain of our international subsidiaries that use the Euro as their functional currency. On September 22, 2020, as
a means of managing the volatility of foreign currency exposure with the Euro/U.S. dollar exchange rate, we entered
into a swap associated with our Euro investment in certain of our international subsidiaries and was designated as
a net investment hedge. As of December 31, 2020, the notional value of the swap was €163.2 million. Routinely, we
review our investments in foreign subsidiaries from a long-term perspective and use capital structuring techniques
to manage our investment in foreign subsidiaries as deemed necessary. We realized net gains (losses) associated with
foreign currency translation of $0.4 million, $6.6 million and $(63.1) million for the years ended December 31, 2020,
2019 and 2018, respectively, which are included in other comprehensive income (loss). The net gain in 2020 was
primarily driven by the strengthening of the Euro, Chinese yuan, British pound and Canadian dollar versus the
U.S. dollar at December 31, 2020 as compared with December 31, 2019.
We employ a foreign currency risk management strategy to minimize potential changes in cash flows from
unfavorable foreign currency exchange rate movements. Where available, the use of forward exchange contracts
allows us to mitigate transactional exposure to exchange rate fluctuations as the gains or losses incurred on the
forward exchange contracts will offset, in whole or in part, losses or gains on the underlying foreign currency
exposure. Our policy allows foreign currency coverage only for identifiable foreign currency exposures. As of
December 31, 2020, we had a U.S. dollar equivalent of $388.1 million in aggregate notional amount outstanding in
foreign exchange contracts with third parties, compared with $398.5 million at December 31, 2019. Transactional
currency gains and losses arising from transactions outside of our sites’ functional currencies and changes in fair
value of foreign exchange contracts are included in our consolidated results of operations. We recognized foreign
currency net losses of $5.9 million, $14.5 million and $18.7 million for the years ended December 31, 2020, 2019
and 2018, respectively, which are included in other income (expense), net in the accompanying consolidated
statements of income.
Based on a sensitivity analysis at December 31, 2020, a 10% change in the foreign currency exchange rates for
the year ended December 31, 2020 would have impacted our net earnings by approximately $15 million. At
December 31, 2019, a 10% change in the foreign currency exchange rates for the year ended December 31, 2019
would have impacted our net earnings by approximately $17 million. This calculation assumes that all currencies
change in the same direction and proportion relative to the U.S. dollar and that there are no indirect effects, such as
changes in non-U.S. dollar sales volumes or prices. This calculation does not take into account the impact of the
foreign currency forward exchange contracts discussed above.
55

ITEM 8. FINANCIAL STATEMENTS AND SUPPLEMENTARY DATA
REPORT OF INDEPENDENT REGISTERED PUBLIC ACCOUNTING FIRM
To the Board of Directors and Shareholders of Flowserve Corporation
Opinions on the Financial Statements and Internal Control over Financial Reporting
We have audited the accompanying consolidated balance sheets of Flowserve Corporation and its subsidiaries
(the ‘‘Company’’) as of December 31, 2020 and 2019, and the related consolidated statements of income, of
comprehensive income, of shareholders’ equity and of cash flows for each of the three years in the period ended
December 31, 2020, including the related notes and the financial statement schedule listed in the index appearing
under Item 15(a)(2) (collectively referred to as the ‘‘consolidated financial statements’’). We also have audited the
Company’s internal control over financial reporting as of December 31, 2020, based on criteria established in Internal
Control - Integrated Framework (2013) issued by the Committee of Sponsoring Organizations of the Treadway
Commission (COSO).
In our opinion, the consolidated financial statements referred to above present fairly, in all material respects, the
financial position of the Company as of December 31, 2020 and 2019, and the results of its operations and its cash
flows for each of the three years in the period ended December 31, 2020 in conformity with accounting principles
generally accepted in the United States of America. Also in our opinion, the Company maintained, in all material
respects, effective internal control over financial reporting as of December 31, 2020, based on criteria established in
Internal Control - Integrated Framework (2013) issued by the COSO.
Change in Accounting Principle
As discussed in Note 1 to the consolidated financial statements, the Company changed the manner in which it
accounts for sales from contracts with customers in 2018.
Basis for Opinions
The Company’s management is responsible for these consolidated financial statements, for maintaining effective
internal control over financial reporting, and for its assessment of the effectiveness of internal control over financial
reporting, included in Management’s Report on Internal Control Over Financial Reporting appearing under Item 9A.
Our responsibility is to express opinions on the Company’s consolidated financial statements and on the Company’s
internal control over financial reporting based on our audits. We are a public accounting firm registered with the
Public Company Accounting Oversight Board (United States) (PCAOB) and are required to be independent with
respect to the Company in accordance with the U.S. federal securities laws and the applicable rules and regulations
of the Securities and Exchange Commission and the PCAOB.
We conducted our audits in accordance with the standards of the PCAOB. Those standards require that we plan
and perform the audits to obtain reasonable assurance about whether the consolidated financial statements are free
of material misstatement, whether due to error or fraud, and whether effective internal control over financial reporting
was maintained in all material respects.
Our audits of the consolidated financial statements included performing procedures to assess the risks of
material misstatement of the consolidated financial statements, whether due to error or fraud, and performing
procedures that respond to those risks. Such procedures included examining, on a test basis, evidence regarding the
amounts and disclosures in the consolidated financial statements. Our audits also included evaluating the accounting
principles used and significant estimates made by management, as well as evaluating the overall presentation of the
consolidated financial statements. Our audit of internal control over financial reporting included obtaining an
understanding of internal control over financial reporting, assessing the risk that a material weakness exists, and
testing and evaluating the design and operating effectiveness of internal control based on the assessed risk. Our audits
also included performing such other procedures as we considered necessary in the circumstances. We believe that our
audits provide a reasonable basis for our opinions.
Definition and Limitations of Internal Control over Financial Reporting
A company’s internal control over financial reporting is a process designed to provide reasonable assurance
regarding the reliability of financial reporting and the preparation of financial statements for external purposes in
accordance with generally accepted accounting principles. A company’s internal control over financial reporting
56

includes those policies and procedures that (i) pertain to the maintenance of records that, in reasonable detail,
accurately and fairly reflect the transactions and dispositions of the assets of the company; (ii) provide reasonable
assurance that transactions are recorded as necessary to permit preparation of financial statements in accordance with
generally accepted accounting principles, and that receipts and expenditures of the company are being made only in
accordance with authorizations of management and directors of the company; and (iii) provide reasonable assurance
regarding prevention or timely detection of unauthorized acquisition, use, or disposition of the company’s assets that
could have a material effect on the financial statements.
Because of its inherent limitations, internal control over financial reporting may not prevent or detect
misstatements. Also, projections of any evaluation of effectiveness to future periods are subject to the risk that
controls may become inadequate because of changes in conditions, or that the degree of compliance with the policies
or procedures may deteriorate.
Critical Audit Matters
The critical audit matter communicated below is a matter arising from the current period audit of the
consolidated financial statements that was communicated or required to be communicated to the audit committee and
that (i) relates to accounts or disclosures that are material to the consolidated financial statements and (ii) involved
our especially challenging, subjective, or complex judgments. The communication of critical audit matters does not
alter in any way our opinion on the consolidated financial statements, taken as a whole, and we are not, by
communicating the critical audit matter below, providing a separate opinion on the critical audit matter or on the
accounts or disclosures to which it relates.
Goodwill Impairment Test – Pump Reporting Unit
As described in Notes 1 and 6 to the consolidated financial statements, the Company’s consolidated goodwill
balance was $1,224.9 million as of December 31, 2020, and the goodwill associated with the Pump reporting unit
was $482.7 million. The value of goodwill is tested for impairment as of December 31 each year or whenever events
or circumstances indicate goodwill may be impaired. If the carrying value of a reporting unit exceeds its fair value,
the goodwill of that reporting unit is impaired and an impairment loss is recorded equal to the excess of the carrying
value over its fair value. Fair value is estimated using a discounted cash flow analysis, which requires management
to make various judgmental assumptions about future sales, operating margins, growth rates and discount rates.
The principal considerations for our determination that performing procedures relating to the goodwill
impairment assessment of the Pump reporting unit is a critical audit matter are (i) the significant judgment by
management when estimating the fair value of the reporting unit; (ii) a high degree of auditor judgment, subjectivity
and effort in performing procedures and evaluating management’s significant assumptions related to the operating
margins, growth rate and discount rate; and (iii) the audit effort involved the use of professionals with specialized
skill and knowledge.
Addressing the matter involved performing procedures and evaluating audit evidence in connection with
forming our overall opinion on the consolidated financial statements. These procedures included testing the
effectiveness of controls relating to management’s goodwill impairment test, including controls over the valuation of
the Company’s reporting units. These procedures also included, among others (i) testing management’s process for
estimating the fair value of the Pump reporting unit, (ii) evaluating the appropriateness of the discounted cash flow
analysis, (iii) testing the completeness and accuracy of underlying data used in the analysis, and (iv) evaluating the
significant assumptions used by management related to the operating margins, growth rate and discount rate.
Evaluating management’s assumptions related to the operating margins and growth rate involved evaluating whether
the assumptions were reasonable considering (i) current and past performance of the reporting unit and (ii) whether
the assumptions were consistent with evidence obtained in other areas of the audit. Professionals with specialized
skill and knowledge were used to assist in the evaluation of the Company’s discounted cash flow analysis and
assumption related to the discount rate.
/s/ PricewaterhouseCoopers LLP
Dallas, Texas
February 23, 2021
We have served as the Company’s auditor since 2000.
57

FLOWSERVE CORPORATION
CONSOLIDATED BALANCE SHEETS
December 31,
2020 2019
(Amounts in thousands,except per share data)
ASSETS
Current assets:
Cash and cash equivalents. . . . . . . . . . . . . . . . . . . . . . . . . . . . . . . . . . . . . . . . . . . . $ 1,095,274 $ 670,980
Accounts receivable, net . . . . . . . . . . . . . . . . . . . . . . . . . . . . . . . . . . . . . . . . . . . . . 753,462 795,538
Contract assets, net . . . . . . . . . . . . . . . . . . . . . . . . . . . . . . . . . . . . . . . . . . . . . . . . . 277,734 272,914
Inventories, net. . . . . . . . . . . . . . . . . . . . . . . . . . . . . . . . . . . . . . . . . . . . . . . . . . . . . 667,228 660,837
Prepaid expenses and other . . . . . . . . . . . . . . . . . . . . . . . . . . . . . . . . . . . . . . . . . . . 110,635 106,478
Total current assets . . . . . . . . . . . . . . . . . . . . . . . . . . . . . . . . . . . . . . . . . . . . . . . 2,904,333 2,506,747
Property, plant and equipment, net . . . . . . . . . . . . . . . . . . . . . . . . . . . . . . . . . . . . . . . 556,873 563,564
Operating lease right-of-use assets, net . . . . . . . . . . . . . . . . . . . . . . . . . . . . . . . . . . . 208,125 186,218
Goodwill. . . . . . . . . . . . . . . . . . . . . . . . . . . . . . . . . . . . . . . . . . . . . . . . . . . . . . . . . . . . 1,224,886 1,193,010
Deferred taxes . . . . . . . . . . . . . . . . . . . . . . . . . . . . . . . . . . . . . . . . . . . . . . . . . . . . . . . 30,538 54,879
Other intangible assets, net . . . . . . . . . . . . . . . . . . . . . . . . . . . . . . . . . . . . . . . . . . . . . 168,496 180,805
Other assets, net . . . . . . . . . . . . . . . . . . . . . . . . . . . . . . . . . . . . . . . . . . . . . . . . . . . . . . 221,426 253,054
Total assets . . . . . . . . . . . . . . . . . . . . . . . . . . . . . . . . . . . . . . . . . . . . . . . . . . . . . . . . . . $ 5,314,677 $ 4,938,277
LIABILITIES AND EQUITY
Current liabilities:
Accounts payable . . . . . . . . . . . . . . . . . . . . . . . . . . . . . . . . . . . . . . . . . . . . . . . . . . . $ 440,199 $ 447,582
Accrued liabilities . . . . . . . . . . . . . . . . . . . . . . . . . . . . . . . . . . . . . . . . . . . . . . . . . . 463,222 401,385
Contract liabilities . . . . . . . . . . . . . . . . . . . . . . . . . . . . . . . . . . . . . . . . . . . . . . . . . . 194,227 221,095
Debt due within one year . . . . . . . . . . . . . . . . . . . . . . . . . . . . . . . . . . . . . . . . . . . . 8,995 11,272
Operating lease liabilities . . . . . . . . . . . . . . . . . . . . . . . . . . . . . . . . . . . . . . . . . . . . 34,990 36,108
Total current liabilities. . . . . . . . . . . . . . . . . . . . . . . . . . . . . . . . . . . . . . . . . . . . . 1,141,633 1,117,442
Long-term debt due after one year . . . . . . . . . . . . . . . . . . . . . . . . . . . . . . . . . . . . . . . 1,717,911 1,365,977
Operating lease liabilities . . . . . . . . . . . . . . . . . . . . . . . . . . . . . . . . . . . . . . . . . . . . . . 176,246 151,523
Retirement obligations and other liabilities . . . . . . . . . . . . . . . . . . . . . . . . . . . . . . . . 516,087 530,994
Commitments and contingencies (See Note 16)
Shareholders’ equity:
Common shares, $1.25 par value Shares authorized — 305,000
Shares issued — 176,793 and 176,793, respectively . . . . . . . . . . . . . . . . . . . . 220,991 220,991
Capital in excess of par value . . . . . . . . . . . . . . . . . . . . . . . . . . . . . . . . . . . . . . . . . 502,227 501,045
Retained earnings. . . . . . . . . . . . . . . . . . . . . . . . . . . . . . . . . . . . . . . . . . . . . . . . . . . 3,656,449 3,652,244
Treasury shares, at cost — 46,768 and 46,262 shares, respectively . . . . . . . . . . . (2,059,309) (2,051,583)
Deferred compensation obligation. . . . . . . . . . . . . . . . . . . . . . . . . . . . . . . . . . . . . . 6,164 8,334
Accumulated other comprehensive loss . . . . . . . . . . . . . . . . . . . . . . . . . . . . . . . . . (594,052) (584,292)
Total Flowserve Corporation shareholders’ equity . . . . . . . . . . . . . . . . . . . . . . . . . . . 1,732,470 1,746,739
Noncontrolling interests. . . . . . . . . . . . . . . . . . . . . . . . . . . . . . . . . . . . . . . . . . . . . . . . 30,330 25,602
Total equity . . . . . . . . . . . . . . . . . . . . . . . . . . . . . . . . . . . . . . . . . . . . . . . . . . . . . 1,762,800 1,772,341
Total liabilities and equity . . . . . . . . . . . . . . . . . . . . . . . . . . . . . . . . . . . . . . . . . . . . . . $ 5,314,677 $ 4,938,277
58
See accompanying notes to consolidated financial statements.

FLOWSERVE CORPORATION
CONSOLIDATED STATEMENTS OF INCOME
Year Ended December 31,
2020 2019 2018
(Amounts in thousands, except per share data)
Sales . . . . . . . . . . . . . . . . . . . . . . . . . . . . . . . . . . . . . . . . . . . . . . . . . . . $ 3,728,134 $ 3,939,697 $ 3,835,699
Cost of sales. . . . . . . . . . . . . . . . . . . . . . . . . . . . . . . . . . . . . . . . . . . . . (2,611,365) (2,650,354) (2,644,830)
Gross profit . . . . . . . . . . . . . . . . . . . . . . . . . . . . . . . . . . . . . . . . . . . . . 1,116,769 1,289,343 1,190,869
Selling, general and administrative expense . . . . . . . . . . . . . . . . . . (878,245) (913,203) (966,584)
Loss on sale of business . . . . . . . . . . . . . . . . . . . . . . . . . . . . . . . . . — — (7,727)
Net earnings from affiliates . . . . . . . . . . . . . . . . . . . . . . . . . . . . . . . 11,753 10,483 11,143
Operating income. . . . . . . . . . . . . . . . . . . . . . . . . . . . . . . . . . . . . . . . . 250,277 386,623 227,701
Interest expense . . . . . . . . . . . . . . . . . . . . . . . . . . . . . . . . . . . . . . . . (57,386) (54,980) (58,160)
Interest income. . . . . . . . . . . . . . . . . . . . . . . . . . . . . . . . . . . . . . . . . 4,175 8,409 6,465
Other income (expense), net . . . . . . . . . . . . . . . . . . . . . . . . . . . . . . (10,254) (17,619) (19,569)
Earnings before income taxes . . . . . . . . . . . . . . . . . . . . . . . . . . . . . . . 186,812 322,433 156,437
Provision for income taxes . . . . . . . . . . . . . . . . . . . . . . . . . . . . . . . . . (60,031) (75,493) (46,550)
Net earnings, including noncontrolling interests . . . . . . . . . . . . . . . . 126,781 246,940 109,887
Less: Net earnings attributable to noncontrolling interests . . . . (10,455) (8,112) (5,379)
Net earnings attributable to Flowserve Corporation. . . . . . . . . . . . . . $ 116,326 $ 238,828 $ 104,508
Net earnings per share attributable to Flowserve Corporation
common shareholders:
Basic . . . . . . . . . . . . . . . . . . . . . . . . . . . . . . . . . . . . . . . . . . . . . . . . . $ 0.89 $ 1.82 $ 0.80
Diluted . . . . . . . . . . . . . . . . . . . . . . . . . . . . . . . . . . . . . . . . . . . . . . . 0.89 1.81 0.80
59
See accompanying notes to consolidated financial statements.

FLOWSERVE CORPORATION
CONSOLIDATED STATEMENTS OF COMPREHENSIVE INCOME
Year Ended December 31,
2020 2019 2018
(Amounts in thousands)
Net earnings, including noncontrolling interests . . . . . . . . . . . . . . . . . . . $126,781 $246,940 $109,887
Other comprehensive income (loss):
Foreign currency translation adjustments, net of deferred taxes of
$11,104, $(740) and $(490) in 2020, 2019 and 2018,
respectively . . . . . . . . . . . . . . . . . . . . . . . . . . . . . . . . . . . . . . . . . . . . 388 6,561 (63,146)
Pension and other postretirement effects, net of deferred taxes of
$(311), $(598)and $3,103 in 2020, 2019 and 2018, respectively. . (9,562) (16,514) (4,892)
Cash flow hedging activity, net . . . . . . . . . . . . . . . . . . . . . . . . . . . . . . 183 187 232
Other comprehensive income (loss). . . . . . . . . . . . . . . . . . . . . . . . . . . . . (8,991) (9,766) (67,806)
Comprehensive income, including noncontrolling interests . . . . . . . . . . 117,790 237,174 42,081
Comprehensive income attributable to noncontrolling interests . . . . . . . (11,225) (8,691) (6,047)
Comprehensive income attributable to Flowserve Corporation . . . . . . . $106,565 $228,483 $ 36,034
60
See accompanying notes to consolidated financial statements.

FLOWSERVE CORPORATION
CONSOLIDATED STATEMENTS OF SHAREHOLDERS’ EQUITY
Total Flowserve Corporation Shareholders’ Equity
Common Stock
Capitalin Excess
of ParValue
RetainedEarnings
TreasuryStock
DeferredCompensation
Obligation
AccumulatedOther
ComprehensiveLoss
NoncontrollingInterests
TotalEquityShares Amount Shares Amount
(Amounts in thousands)
Balance — January 1, 2018 . 176,793 $220,991 $488,326 $3,491,524 (46,471) $(2,059,558) $ 6,354 $(505,473) $16,367 $1,658,531
ASU No. 2014-09, Revenuefrom Contracts withCustomers (Topic 606) . . . . — — — 18,450 — — — — — 18,450
Stock activity under stockplans . . . . . . . . . . . . . . . — — (13,687) — 234 10,154 — — — (3,533)
Stock-based compensation . . . — — 19,912 — — — — — — 19,912
Tax benefit associated withstock-based compensation . . — — — — — — — — — —
Net earnings . . . . . . . . . . . . — — — 104,508 — — — — 5,379 109,887
Cash dividends declared . . . . — — — (100,253) — — — — — (100,253)
Other comprehensive loss, netof tax . . . . . . . . . . . . . . . — — — — — — — (68,474) 668 (67,806)
Other, net . . . . . . . . . . . . . . — — — — — — 763 — (3,948) (3,185)
Balance — December 31,2018. . . . . . . . . . . . . . . . 176,793 $220,991 $494,551 $3,514,229 (46,237) $(2,049,404) $ 7,117 $(573,947) $18,466 $1,632,003
Stock activity under stockplans . . . . . . . . . . . . . . . — — (17,388) — 300 12,821 1,217 — — (3,350)
Stock-based compensation . . . — — 23,882 — — — — — — 23,882
Net earnings . . . . . . . . . . . . — — — 238,828 — — — — 8,112 246,940
Cash dividends declared . . . . — — — (100,813) — — — — — (100,813)
Repurchases of commonshares . . . . . . . . . . . . . . . — — — — (325) (15,000) — — — (15,000)
Other comprehensive loss, netof tax . . . . . . . . . . . . . . . — — — — — — — (10,345) 579 (9,766)
Other, net . . . . . . . . . . . . . . — — — — — — — — (1,555) (1,555)
Balance — December 31,2019. . . . . . . . . . . . . . . . 176,793 $220,991 $501,045 $3,652,244 (46,262) $(2,051,583) $ 8,334 $(584,292) $25,602 $1,772,341
ASU No. 2016-13 -Measurement of CreditLosses on FinancialInstruments (Topic 326) . . . — — — (7,291) — — — — — (7,291)
Stock activity under stockplans . . . . . . . . . . . . . . . — — (26,070) — 551 24,386 (2,170) — — (3,854)
Stock-based compensation . . . — — 27,252 — — — — — — 27,252
Net earnings . . . . . . . . . . . . — — — 116,326 — — — — 10,455 126,781
Cash dividends declared . . . . — — — (104,830) — — — — — (104,830)
Repurchases of commonshares . . . . . . . . . . . . . . . — — — — (1,057) (32,112) — — — (32,112)
Other comprehensive loss, netof tax . . . . . . . . . . . . . . . — — — — — — — (9,760) 769 (8,991)
Other, net . . . . . . . . . . . . . . — — — — — — — — (6,496) (6,496)
Balance — December 31,2020. . . . . . . . . . . . . . . . 176,793 $220,991 $502,227 $3,656,449 (46,768) $(2,059,309) $ 6,164 $(594,052) $30,330 $1,762,800
61
See accompanying notes to consolidated financial statements.

FLOWSERVE CORPORATION
CONSOLIDATED STATEMENTS OF CASH FLOWS
Year Ended December 31,
2020 2019 2018
(Amounts in thousands)
Cash flows — Operating activities:
Net earnings, including noncontrolling interests . . . . . . . . . . . . . . . . . . . . $ 126,781 $ 246,940 $ 109,887
Adjustments to reconcile net earnings to net cash provided (used) by
operating activities:
Depreciation . . . . . . . . . . . . . . . . . . . . . . . . . . . . . . . . . . . . . . . . . . . . . . 86,175 92,042 95,820
Amortization of intangible and other assets . . . . . . . . . . . . . . . . . . . . . 14,578 13,862 16,653
Loss on disposition of business . . . . . . . . . . . . . . . . . . . . . . . . . . . . . . . — — 7,727
Stock-based compensation . . . . . . . . . . . . . . . . . . . . . . . . . . . . . . . . . . . 27,252 23,882 19,912
Provision for U.S. Tax Cuts and Jobs Act of 2017 . . . . . . . . . . . . . . . . — — (5,654)
Foreign currency, asset impairment and other non-cash adjustments. . 21,051 (11,724) 36,052
Change in assets and liabilities:
Accounts receivable, net . . . . . . . . . . . . . . . . . . . . . . . . . . . . . . . . . . . 45,648 2,883 (25,448)
Inventories, net . . . . . . . . . . . . . . . . . . . . . . . . . . . . . . . . . . . . . . . . . . 15,306 (31,058) (29,314)
Contract assets, net . . . . . . . . . . . . . . . . . . . . . . . . . . . . . . . . . . . . . . . 4,258 (45,220) (24,411)
Prepaid expenses and other assets, net. . . . . . . . . . . . . . . . . . . . . . . . 34,262 (9,455) (15,491)
Contract liabilities . . . . . . . . . . . . . . . . . . . . . . . . . . . . . . . . . . . . . . . . (34,066) 19,699 32,955
Accounts payable . . . . . . . . . . . . . . . . . . . . . . . . . . . . . . . . . . . . . . . . (22,571) 24,678 7,589
Accrued liabilities and income taxes payable . . . . . . . . . . . . . . . . . . 50,203 12,418 (15,248)
Retirement obligations and other . . . . . . . . . . . . . . . . . . . . . . . . . . . . 3,636 (3,357) (26,595)
Net deferred taxes . . . . . . . . . . . . . . . . . . . . . . . . . . . . . . . . . . . . . . . . (61,976) (11,493) 6,397
Net cash flows provided (used) by operating activities . . . . . . . . . . . . . . 310,537 324,097 190,831
Cash flows — Investing activities:
Capital expenditures . . . . . . . . . . . . . . . . . . . . . . . . . . . . . . . . . . . . . . . . (57,405) (75,716) (83,993)
Proceeds from disposal of assets . . . . . . . . . . . . . . . . . . . . . . . . . . . . . . 15,705 42,333 6,190
Payments for disposition of business . . . . . . . . . . . . . . . . . . . . . . . . . . . — — (3,663)
Net cash flows provided (used) by investing activities. . . . . . . . . . . . . (41,700) (33,383) (81,466)
Cash flows — Financing activities:
Payments on long-term debt . . . . . . . . . . . . . . . . . . . . . . . . . . . . . . . . . . (191,258) (105,000) (60,000)
Proceeds from issuance of senior notes . . . . . . . . . . . . . . . . . . . . . . . . . 498,280 — —
Payments of deferred loan costs. . . . . . . . . . . . . . . . . . . . . . . . . . . . . . . (4,572) — —
Proceeds from short-term financing . . . . . . . . . . . . . . . . . . . . . . . . . . . . — 75,000 —
Payments on short-term financing . . . . . . . . . . . . . . . . . . . . . . . . . . . . . — (75,000) —
Proceeds under other financing arrangements . . . . . . . . . . . . . . . . . . . . 2,285 3,404 3,377
Payments under other financing arrangements . . . . . . . . . . . . . . . . . . . (9,792) (9,856) (9,853)
Payments related to tax withholding for stock-based compensation . . (4,607) (3,900) (3,061)
Repurchases of common shares . . . . . . . . . . . . . . . . . . . . . . . . . . . . . . . (32,112) (15,000) —
Payments of dividends . . . . . . . . . . . . . . . . . . . . . . . . . . . . . . . . . . . . . . (104,159) (99,557) (99,416)
Other . . . . . . . . . . . . . . . . . . . . . . . . . . . . . . . . . . . . . . . . . . . . . . . . . . . . (6,478) (1,555) (4,331)
Net cash flows provided (used) by financing activities . . . . . . . . . . . . . . 147,587 (231,464) (173,284)
Effect of exchange rate changes on cash . . . . . . . . . . . . . . . . . . . . . . . . . . 7,870 (7,953) (19,843)
Net change in cash and cash equivalents. . . . . . . . . . . . . . . . . . . . . . . . . . 424,294 51,297 (83,762)
Cash and cash equivalents at beginning of year . . . . . . . . . . . . . . . . . . . . 670,980 619,683 703,445
Cash and cash equivalents at end of year . . . . . . . . . . . . . . . . . . . . . . . . . $1,095,274 $ 670,980 $ 619,683
Income taxes paid (net of refunds) . . . . . . . . . . . . . . . . . . . . . . . . . . . . . . $ 75,342 $ 66,372 $ 87,009
Interest paid. . . . . . . . . . . . . . . . . . . . . . . . . . . . . . . . . . . . . . . . . . . . . . . . . 57,041 53,607 54,576
62
See accompanying notes to consolidated financial statements.

FLOWSERVE CORPORATION
NOTES TO CONSOLIDATED FINANCIAL STATEMENTSAS OF DECEMBER 31, 2020 AND 2019 AND FOR THE
THREE YEARS ENDED DECEMBER 31, 2020
1. SIGNIFICANT ACCOUNTING POLICIES AND ACCOUNTING DEVELOPMENTS
We are principally engaged in the worldwide design, manufacture, distribution and service of industrial flow
management equipment. We provide long lead time, custom and other highly-engineered pumps; standardized,
general-purpose pumps; mechanical seals; engineered and industrial valves; related automation products; and
services and solutions primarily for oil and gas, chemical, power generation, water management and other general
industries requiring flow management products and services. Equipment manufactured and serviced by us is
predominantly used in industries that deal with difficult-to-handle and corrosive fluids, as well as environments with
extreme temperatures, pressure, horsepower and speed. Our business is affected by economic conditions in the
United States (‘‘U.S.’’) and other countries where our products are sold and serviced, by the cyclical nature and
competitive environment of our industries served, by the relationship of the U.S. dollar to other currencies and by
the demand for and pricing of our customers’ end products.
Revision to Previously Reported Financial Information — In conjunction with our close process for the third
quarter of 2020, we identified accounting errors related to the recognition of a liability for unasserted asbestos claims.
The adjustments primarily related to an incurred but not reported (‘‘IBNR’’) liability associated with unasserted
asbestos claims, but also included adjustments related to the associated receivables for expected insurance proceeds
for asbestos settlement and defense costs from insurance coverage and the recognition as an expense the related legal
fees that were previously estimated to be recoverable from insurance carriers for which coverage is not currently
sufficient following the recognition of the IBNR for periods beginning with the year ended December 31, 2014
through the second quarter of 2020 and to correct certain other previously identified immaterial errors.
We have assessed these errors, individually and in the aggregate, and concluded that they were not material to
any prior periods. However, the aggregate amount of the prior period errors would have been material to our
consolidated statements of income and full year results and therefore, we have revised our previously issued audited
consolidated financial information for the fiscal years ended December 31, 2019 and 2018. Interim periods for the
three-months ended March 31, 2020 and the three and six-months ended June 30, 2020 will be revised in connection
with the corresponding 2021 interim filings. Refer to Note 2 to our consolidated financial statements included in this
Annual Report for additional information.
Coronavirus Pandemic (‘‘COVID-19’’) and Oil and Gas Market — Over the past year, we have been challenged
by macroeconomics and global economic impacts based on the disruption and uncertainties caused by COVID-19 and
the emanating impacts of the pandemic on pricing and dampened demand for oil, further resulting in instability and
volatility in oil commodity prices. To date, the COVID-19 pandemic has had widespread implications worldwide and
has caused substantial economic uncertainty and challenging operational conditions. For example, during the year,
these conditions drove the announcement of significant and broad-based decreases in customer planned capital
spending. As a result, many of our large customers have announced and executed on double-digit capital expenditure
budget decreases for 2020, resulting in lower bookings during 2020 as compared to the prior year.
Principles of Consolidation — The consolidated financial statements include the accounts of our company and
our wholly and majority-owned subsidiaries. In addition, we would consolidate any variable interest entities for
which we are deemed to be the primary beneficiary. Noncontrolling interests of non-affiliated parties have been
recognized for all majority-owned consolidated subsidiaries. Intercompany profits/losses, transactions and balances
among consolidated entities have been eliminated from our consolidated financial statements.
In the ordinary course of our operations worldwide, we have entered into joint ventures and interests
(collectively referred to as ‘‘affiliates’’) to provide greater flexibility in delivering our products and services, gain
access to markets and geographical locations and reduce exposure and diversify risk. Investments in affiliate
companies with a noncontrolling ownership interests between 20% and 50%, are unconsolidated and are accounted
for using the equity method, which approximates our equity interest in their underlying equivalent net book value
under accounting principles generally accepted in the U.S. (‘‘U.S. GAAP’’). All equity method investments are
reviewed for impairment whenever events and conditions indicate that a decrease in the value of an investment has
occurred that is other than temporary. If impaired, an impairment loss representing the difference between our
63

carrying value and fair value is recorded and the investment is written down to a new carrying value. Investment in
affiliate companies where we own less than 20% are accounted for by the cost method, whereby income is only
recognized in the event of dividend receipt. Investments accounted for by the cost method are tested for impairment
if an impairment indicator is present.
Use of Estimates — The process of preparing financial statements in conformity with U.S. GAAP requires us
to make estimates and assumptions that affect reported amounts of certain assets, liabilities, revenues and expenses.
We believe our estimates and assumptions are reasonable; however, actual results may differ materially from such
estimates. The full extent to which the COVID-19 pandemic directly or indirectly impacts our business, results of
operations and financial condition, including sales, expenses, our allowance for expected credit losses, stock based
compensation, the carrying value of our goodwill and other long-lived assets, financial assets, and valuation
allowances for tax assets, will depend on future developments that are highly uncertain, including as a result of new
information that may emerge concerning COVID-19 and the actions taken to contain it or treat it, as well as the
economic impact on local, regional, national and international customers, suppliers and markets. We have made
estimates of the impact of COVID-19 within our financial statements and there may be changes to those estimates
in the near to mid-term as new information becomes available. The most significant estimates and assumptions are
used in determining:
• Timing and amount of revenue recognition;
• Deferred taxes, tax valuation allowances and tax reserves;
• Reserves for contingent loss;
• Pension and postretirement benefits; and
• Valuation of goodwill, indefinite-lived intangible assets and other long-lived assets.
Argentina Highly Inflationary — Effective July 1, 2018, Argentina was designated as hyperinflationary, and as
a result, we began using the U.S. dollar as our functional currency in Argentina. Our Argentinian subsidiary’s sales
and assets for the year ended December 31, 2020 represented approximately 1% of consolidated sales and total
consolidated assets at December 31, 2020. Assets primarily consisted of U.S. dollar-denominated monetary assets and
Argentinian peso-denominated non-monetary assets at December 31, 2020. In addition, certain of our operations in
other countries sell equipment and parts that are typically denominated in U.S. dollars directly to Argentinian
customers.
Revenue Recognition — We adopted Accounting Standards Update (‘‘ASU’’) No. 2014-09, ‘‘Revenue from
Contracts with Customers (Topic 606)’’ (‘‘New Revenue Standard’’) on January 1, 2018, using the modified
retrospective method for transition, which resulted in a cumulative adjustment to opening retained earnings as of
January 1, 2018.
The majority of our revenues relate to customer orders that typically contain a single commitment of goods or
services which have lead times under a year. Longer lead time, more complex contracts with our customers typically
have multiple commitments of goods and services, including any combination of designing, developing,
manufacturing, modifying, installing and commissioning of flow management equipment and providing services and
parts related to the performance of such products. We recognize revenue when (or as) we satisfy a performance
obligation by transferring control to a customer. Transfer of control is evaluated based on the customer’s ability to
direct the use of and obtain substantially all of the benefits of a performance obligation. Revenue is recognized either
over time or at a point in time, depending on the specific facts and circumstances for each contract, including the
terms and conditions of the contract as agreed with the customer and the nature of the products or services to be
provided.
Our primary method for recognizing revenue over time is the percentage of completion (‘‘POC’’) method,
whereby progress towards completion is measured by applying an input measure based on costs incurred to date
relative to total estimated costs at completion. If control of the products and/or services does not transfer over time,
then control transfers at a point in time. We determine the point in time that control transfers to a customer based on
the evaluation of specific indicators, such as title transfer, risk of loss transfer, customer acceptance and physical
possession. For a detailed discussion related to revenue recognition refer to Note 3.
64
Cash and Cash Equivalents — We place temporary cash investments with financial institutions and, by policy,
invest in those institutions and instruments that have minimal credit risk and market risk. These investments, with an
original maturity of three months or less when purchased, are classified as cash equivalents. They are highly liquid
and principal values are not subject to significant risk of change due to interest rate fluctuations.
Accounts Receivable, Allowance for Doubtful Accounts and Credit Risk — Trade accounts receivables are
recorded at the invoiced amount and do not bear interest. We establish an allowance for expected credit losses on an
aging schedule and according to historical losses as determined from our billings and collections history.
Additionally, we consider factors that are specific to our customers’ credit risk such as financial difficulties, liquidity
issues, insolvency, and country and political risk. We also consider both the current and forecasted direction of
macroeconomic conditions at the reporting date in estimating expected credit losses. Receivables are written off
against the allowance in the period when the receivable is deemed to be uncollectible. Subsequent recoveries of
amounts previously written off are reflected as a reduction to credit impairment losses in the income statement.
Credit risks are mitigated by the diversity of our customer base across many different geographic regions and
industries and by performing creditworthiness analyses on our customers. Additionally, we mitigate credit risk
through letters of credit and advance payments received from our customers. We do not believe that we have any
other significant concentrations of credit risk.
Inventories and Related Reserves — Inventories are stated at the lower of cost and net realizable value. Cost is
determined by the first-in, first-out method. Reserves for excess and obsolete inventories are based upon our
assessment of market conditions for our products determined by historical usage and estimated future demand. Due
to the long life cycles of our products, we carry spare parts inventories that have historically low usage rates and
provide reserves for such inventory based on demonstrated usage and aging criteria.
Income Taxes, Deferred Taxes, Tax Valuation Allowances and Tax Reserves — We account for income taxes
under the asset and liability method. Deferred tax assets and liabilities are recognized for the future tax consequences
attributable to differences between the financial statement carrying amounts of existing assets and liabilities and their
respective tax bases and operating loss and tax credit carryforwards. Deferred tax assets and liabilities are calculated
using enacted tax rates expected to apply to taxable income in the years in which those temporary differences are
expected to be recovered or settled. The effect on deferred tax assets and liabilities of a change in tax rates is
recognized in the period that includes the enactment date. We record valuation allowances to reduce the carrying
value of deferred tax assets to amounts that we expect are more likely than not to be realized. We assess existing
deferred tax assets, net operating losses and tax credits by jurisdiction and expectations of our ability to utilize these
tax attributes through a review of past, current and estimated future taxable income and establishment of tax planning
strategies.
We provide deferred taxes for the temporary differences associated with our investment in foreign subsidiaries
that have a financial reporting basis that exceeds tax basis, unless we can assert permanent reinvestment in foreign
jurisdictions. Financial reporting basis and tax basis differences in investments in foreign subsidiaries consist of both
unremitted earnings and losses, as well as foreign currency translation adjustments.
The amount of income taxes we pay is subject to ongoing audits by federal, state, and foreign tax authorities,
which often result in proposed assessments. We establish reserves for open tax years for uncertain tax positions that
may be subject to challenge by various tax authorities. The consolidated tax provision and related accruals include
the impact of such reasonably estimable losses and related interest and penalties as deemed appropriate.
We recognize the tax benefit from an uncertain tax position only if it is more likely than not that the tax position
will be sustained on examination by the taxing authorities. The determination is based on the technical merits of the
position and presumes that each uncertain tax position will be examined by the relevant taxing authority that has full
knowledge of all relevant information. The tax benefits recognized in the financial statements from such a position
are measured based on the largest benefit that has a greater than fifty percent likelihood of being realized upon
ultimate settlement.
Legal and Environmental Contingencies — Legal and environmental reserves are recorded based upon a
case-by-case analysis of the relevant facts and circumstances and an assessment of potential legal obligations and
costs. Amounts relating to legal and environmental liabilities are recorded when it is probable that a loss has been
incurred and such loss is reasonably estimable. Assessments of legal and environmental costs are based on
65
information obtained from our independent and in-house experts and our loss experience in similar situations.
Estimates are updated as applicable when new information regarding the facts and circumstances of each matter
becomes available. Legal fees associated with legal and environmental liabilities are expensed as incurred.
We are a defendant in a number of lawsuits that seek to recover damages for personal injury allegedly resulting
from exposure to asbestos-containing products formerly manufactured and/or distributed by heritage companies of
the Company. We have estimated that the liability for pending and future claims not yet asserted, and which are
probable and estimable, could be experienced through 2049, which represents the expected end of our asbestos
liability exposure with no further ongoing claims expected beyond that date. This estimate is based on the Company’s
historical claim experience and estimates of the number and resolution cost of potential future claims that may be
filed based on anticipated levels of unique plaintiff asbestos-related claims in the U.S. tort system against all
defendants, the diminished volatility and consistency of observable claims data, the period of time that has elapsed
since we stopped manufacturing products that contained encapsulated asbestos and an expected downward trend in
claims due to the average age of our claimants. This estimate is not discounted to present value. In light of the
uncertainties and variables inherent in the long-term projection of the total asbestos liability, as part of our ongoing
review of asbestos claims, each year we will reassess the projected liability of unasserted asbestos claims to be filed
through 2049, and we will continually reassess the time horizon over which a reasonable estimate of unasserted
claims can be projected.
We assess the sufficiency of the estimated liability for pending and future claims on an ongoing basis by
evaluating actual experience regarding claims filed, settled and dismissed, and amounts paid in settlements. In
addition to claims and settlement experience, we consider additional quantitative and qualitative factors such as
changes in legislation, the legal environment and the Company’s defense strategy. In connection with our ongoing
review of asbestos-related claims, we have also reviewed the amount of potential insurance coverage for such claims,
taking into account the remaining limits of such coverage, the number and amount of claims on our insurance from
co-insured parties, ongoing litigation against the Company’s insurers, potential remaining recoveries from insolvent
insurers, the impact of previous insurance settlements and coverage available from solvent insurers not party to the
coverage litigation. Continuously, we review ongoing insurance coverage available for a significant amount of the
potential future asbestos-related claims and in the future could secure additional insurance coverage as deemed
necessary.
The study from the Company’s actuary, based on data as of September 30, 2020, provided for a range of possible
future liability from approximately $80.1 million to $131.7 million. The Company does not believe any amount
within the range of potential outcomes represents a better estimate than another given the many factors and
assumptions inherent in the projections and therefore the Company has recorded the liability at the actuarial central
estimate of approximately $99.5 million as of December 31, 2020. In addition, the Company has recorded estimated
insurance receivables of approximately $69.5 million as of December 31, 2020. The amounts recorded for the
asbestos-related liability and the related insurance receivables are based on facts known at the time and a number of
assumptions. However, projecting future events, such as the number of new claims to be filed each year, the length
of time it takes to defend, resolve, or otherwise dispose of such claims, coverage issues among insurers and the
continuing solvency of various insurance companies, as well as the numerous uncertainties surrounding asbestos
litigation in the United States, could cause the actual liability and insurance recoveries for us to be higher or lower
than those projected or recorded. Additionally, we have claims pending against certain insurers that, if resolved more
favorably than reflected in the recorded receivables, would result in discrete gains in the applicable year. Changes
recorded in the estimated liability and estimated insurance recovery based on projections of asbestos litigation and
corresponding insurance coverage, result in the recognition of additional expense or income. For a discussion
pertaining to the activity related to asbestos claims refer to Note 16.
Warranty Accruals — Warranty obligations are based upon product failure rates, materials usage, service
delivery costs, an analysis of all identified or expected claims and an estimate of the cost to resolve such claims. The
estimates of expected claims are generally a factor of historical claims and known product issues. Warranty
obligations based on these factors are adjusted based on historical sales trends for the preceding 24 months.
Insurance Accruals — Insurance accruals are recorded for wholly or partially self-insured risks such as medical
benefits and workers’ compensation and are based upon an analysis of our claim loss history, insurance deductibles,
policy limits and other relevant factors that are updated annually and are included in accrued liabilities in our
consolidated balance sheets. The estimates are based upon information received from actuaries, insurance company
adjusters, independent claims administrators or other independent sources. Receivables from insurance carriers are
66

estimated using our historical experience with insurance recovery rates and estimates of future recoveries, which
include estimates of coverage and financial viability of our insurance carriers. Estimated receivables are included in
accounts receivable, net and other assets, net, as applicable, in our consolidated balance sheets.
Pension and Postretirement Obligations — Determination of pension and postretirement benefits obligations is
based on estimates made by management in consultation with independent actuaries and investment advisors.
Inherent in these valuations are assumptions including discount rates, expected rates of return on plan assets,
retirement rates, mortality rates and rates of compensation increase and other factors all of which are reviewed
annually and updated if necessary. Current market conditions, including changes in rates of return, interest rates and
medical inflation rates, are considered in selecting these assumptions.
Actuarial gains and losses and prior service costs are recognized in accumulated other comprehensive loss as
they arise and we amortize these costs into net pension expense over the remaining expected service period.
Property, Plant and Equipment and Depreciation — Property, plant and equipment are stated at historical cost,
less accumulated depreciation. If asset retirement obligations exist, they are capitalized as part of the carrying amount
of the asset and depreciated over the remaining useful life of the asset. The useful lives of leasehold improvements
are the lesser of the remaining lease term or the useful life of the improvement. When assets are retired or otherwise
disposed of, their costs and related accumulated depreciation are removed from the accounts and any resulting gains
or losses are included in income from operations for the period. Depreciation is computed by the straight-line method
based on the estimated useful lives of the depreciable assets, or in the case of assets under finance leases, over the
related lease term. Generally, the estimated useful lives of the assets are:
Buildings and improvements . . . . . . . . . . . . . . . . . . . . . . . . . . . . . . . . . . . . . . . . . . . . . . . . . . . . . . . . 10 to 40 years
Machinery, equipment and tooling . . . . . . . . . . . . . . . . . . . . . . . . . . . . . . . . . . . . . . . . . . . . . . . . . . . 3 to 14 years
Software, furniture and fixtures and other . . . . . . . . . . . . . . . . . . . . . . . . . . . . . . . . . . . . . . . . . . . . . 3 to 7 years
Costs related to routine repairs and maintenance are expensed as incurred.
Leases — We have operating and finance leases for certain manufacturing facilities, offices, service and quick
response centers, machinery, equipment and automobiles. Our leases have remaining lease terms of up to 33 years.
The terms and conditions of our leases may include options to extend or terminate the lease which are considered
and included in the lease term when these options are reasonably certain of exercise.
We determine if a contract is (or contains) a lease at inception by evaluating whether the contract conveys the
right to control the use of an identified asset. For all classes of leased assets, we account for any non-lease
components in the contract together with the related lease component in the same unit of account. For lease contracts
containing more than one lease component, we allocate the contract consideration to each of the lease components
on the basis of relative standalone prices in order to identify the lease payments for each lease component.
Right-of-use (‘‘ROU’’) assets and lease liabilities are recognized in our consolidated balance sheets at the
commencement date based on the present value of remaining lease payments over the lease term. Additionally, ROU
assets include any lease payments made at or before the commencement date, as well as any initial direct costs
incurred, and are reduced by any lease incentives received. For a detailed discussion related to leases refer to Note 5.
Internally Developed Software — We capitalize certain costs associated with the development of internal-use
software. Generally, these costs are related to significant software development projects and are amortized over their
estimated useful life, typically three to five years, upon implementation of the software. We also capitalize certain
costs incurred during the application development stage of implementation of cloud computing arrangements.
Amounts capitalized for cloud arrangements are amortized on a straight-line basis over a period of three to
seven years and are reported as a component of other long-term assets.
Intangible Assets — Intangible assets, excluding trademarks (which are considered to have an indefinite life),
consist primarily of engineering drawings, patents, existing customer relationships, software, distribution networks
and other items that are being amortized over their estimated useful lives generally ranging from four to 40 years.
These assets are reviewed for impairment whenever events and circumstances indicate impairment may have
occurred.
Valuation of Goodwill, Indefinite-Lived Intangible Assets and Other Long-Lived Assets — The value of goodwill
and indefinite-lived intangible assets is tested for impairment as of December 31 each year or whenever events or
67

circumstances indicate such assets may be impaired. The identification of our reporting units began at the operating
segment level and considered whether components one level below the operating segment levels should be identified
as reporting units for purpose of testing goodwill for impairment based on certain conditions. These conditions
included, among other factors, (i) the extent to which a component represents a business and (ii) the aggregation of
economically similar components within the operating segments and resulted in three reporting units. Other factors
that were considered in determining whether the aggregation of components was appropriate included the similarity
of the nature of the products and services, the nature of the production processes, the methods of distribution and the
types of industries served.
Accounting Standards Codification (‘‘ASC’’) 350 allows an optional qualitative assessment, prior to a
quantitative assessment test, to determine whether it is more likely than not that the fair value of a reporting unit
exceeds its carrying amount. We generally do not attempt a qualitative assessment and proceed directly to the
quantitative test. If the carrying value of a reporting unit exceeds its fair value, the goodwill of that reporting unit
is impaired and an impairment loss is recorded equal to the excess of the carrying value over its fair value. We
estimate the fair value of our reporting units based on an income approach, whereby we calculate the fair value of
a reporting unit based on the present value of estimated future cash flows. A discounted cash flow analysis requires
us to make various judgmental assumptions about future sales, operating margins, growth rates and discount rates,
which are based on our budgets, business plans, economic projections, anticipated future cash flows and market
participants.
We did not record an impairment of goodwill in 2020, 2019 or 2018; however, the estimated fair value of our
Pump reporting unit has reduced moderately during the year due to decreased broad-based capital spending resulting
from the ongoing COVID-19 pandemic and to a lesser extent the heightened pricing pressure experienced in the oil
and gas markets, both of which are anticipated to continue in the near to mid-term. The Pump reporting unit is a
component of EPD reporting segment and is primarily focused on highly engineered custom and pre-configured
pump products and systems. As of December 31, 2020, our Pump reporting unit had approximately $482.7 million
of goodwill and an estimated fair value that exceeded its carrying value by approximately 46% as compared to
approximately $468.8 million of goodwill and an estimated fair value that exceeded its carrying value by
approximately 131% as of December 31, 2019. The key factors considered in determining the estimated fair value
of our reporting units included the annual operating plan and forecasted operating results, successful execution of our
current continuous improvement and identified strategic initiatives, a constant cost of capital, continued stabilization
and mid to long-term improvement of the macro-economic conditions of the oil and gas market, and a relatively
stable global gross domestic product. Although we have concluded that there is no impairment on the goodwill
associated with our Pump reporting unit as of December 31, 2020, we will continue to closely monitor their
performance and related market conditions for future indicators of potential impairment and reassess accordingly.
We also considered our market capitalization in our evaluation of the fair value of our goodwill. Our market
capitalization decreased as compared with 2019, however this did not indicate a potential impairment of our goodwill
as of December 31, 2020.
Impairment losses for indefinite-lived intangible assets are recognized whenever the estimated fair value is less
than the carrying value. Fair values are calculated for trademarks using a ‘‘relief from royalty’’ method, which
estimates the fair value of a trademark by determining the present value of estimated royalty payments that are
avoided as a result of owning the trademark. This method includes judgmental assumptions about sales growth and
discount rates that have a significant impact on the fair value and are substantially consistent with the assumptions
used to determine the fair value of our reporting unit discussed above. We did not record a material impairment of
our trademarks in 2020, 2019 or 2018.
The recoverable value of other long-lived assets, including property, plant and equipment and finite-lived
intangible assets, is reviewed when indicators of potential impairments are present. The recoverable value is based
upon an assessment of the estimated future cash flows related to those assets, utilizing assumptions similar to those
for goodwill. Additional considerations related to our long-lived assets include expected maintenance and
improvements, changes in expected uses and ongoing operating performance and utilization.
Deferred Loan Costs — Deferred loan costs, consisting of fees and other expenses associated with debt
financing, are amortized over the term of the associated debt using the effective interest method. Additional
amortization is recorded in periods where optional prepayments on debt are made.
68

Fair Values of Financial Instruments — Our financial instruments are presented at fair value in our consolidated
balance sheets, with the exception of our long-term debt. Fair value is defined as the price that would be received
to sell an asset or paid to transfer a liability in an orderly transaction between market participants at the measurement
date. Where available, fair value is based on observable market prices or parameters or derived from such prices or
parameters. Where observable prices or inputs are not available, valuation models may be applied.
Assets and liabilities recorded at fair value in our consolidated balance sheets are categorized based upon the
level of judgment associated with the inputs used to measure their fair values. Hierarchical levels, as defined by ASC
820, ‘‘Fair Value Measurements and Disclosures,’’ are directly related to the amount of subjectivity associated with
the inputs to fair valuation of these assets and liabilities. An asset or a liability’s categorization within the fair value
hierarchy is based on the lowest level of significant input to its valuation. Hierarchical levels are as follows:
Level I — Inputs are unadjusted, quoted prices in active markets for identical assets or liabilities at the
measurement date.
Level II — Inputs (other than quoted prices included in Level I) are either directly or indirectly observable
for the asset or liability through correlation with market data at the measurement date and for the duration of
the instrument’s anticipated life.
Level III — Inputs reflect management’s best estimate of what market participants would use in pricing the
asset or liability at the measurement date. Consideration is given to the risk inherent in the valuation technique
and the risk inherent in the inputs to the model.
Recurring fair value measurements are limited to investments in derivative instruments and certain equity
securities. The fair value measurements of our derivative instruments are determined using models that maximize the
use of the observable market inputs including interest rate curves and both forward and spot prices for currencies,
and are classified as Level II under the fair value hierarchy. The fair values of our derivative instruments are included
in Note 9. The fair value measurements of our investments in equity securities are determined using quoted market
prices and are classified as Level I. The fair values of our investments in equity securities, and changes thereto, are
immaterial to our consolidated financial position and results of operations.
Derivatives and Hedging Activities — We have a foreign currency derivatives and hedging policy outlining the
conditions under which we can enter into financial derivative transactions. We do not use derivative instruments for
trading or speculative purposes. All derivative instruments are recognized on the balance sheet at their fair values.
We employ a foreign currency economic hedging strategy to mitigate certain financial risks resulting from
foreign currency exchange rate movements that impact foreign currency denominated receivables and payables, firm
committed transactions and forecasted sales and purchases. The changes in the fair values are recognized immediately
in other income (expense), net in the consolidated statements of income. See Note 9 for further discussion of forward
exchange contracts.
We are exposed to risk from credit-related losses resulting from nonperformance by counterparties to our
financial instruments. We perform credit evaluations of our counterparties under forward exchange contracts and
expect all counterparties to meet their obligations. If necessary, we would adjust the values of our derivative contracts
for our or our counterparties’ credit risks.
Foreign Currency Translation — Assets and liabilities of our foreign subsidiaries are translated to U.S. dollars
at exchange rates prevailing at the balance sheet date, while income and expenses are translated at average rates for
each month. Translation gains and losses are reported as a component of accumulated other comprehensive loss.
Transactional currency gains and losses arising from transactions in currencies other than our sites’ functional
currencies are included in our consolidated results of operations.
Transaction and translation gains and losses arising from intercompany balances are reported as a component
of accumulated other comprehensive loss when the underlying transaction stems from a long-term equity investment
or from debt designated as not due in the foreseeable future. Otherwise, we recognize transaction gains and losses
arising from intercompany transactions as a component of income. Where intercompany balances are not long-term
investment related or not designated as due beyond the foreseeable future, we may mitigate risk associated with
foreign currency fluctuations by entering into forward exchange contracts.
Stock-Based Compensation — Stock-based compensation is measured at the grant-date fair value. The exercise
price of stock option awards and the value of restricted share, restricted share unit and performance-based unit awards
69
(collectively referred to as ‘‘Restricted Shares’’) are set at the closing price of our common stock on the New York
Stock Exchange on the date of grant, which is the date such grants are authorized by our Board of Directors.
Restricted share units and performance-based units refer to restricted awards that do not have voting rights and accrue
dividends, and are forfeited if vesting does not occur.
The intrinsic value of Restricted Shares, which is typically the product of share price at the date of grant and
the number of Restricted Shares granted, is amortized on a straight-line basis to compensation expense over the
periods in which the restrictions lapse based on the expected number of shares that will vest. We account for
forfeitures as they occur resulting in the reversal of cumulative expense previously recognized.
Earnings Per Share — We use the two-class method of calculating Earnings Per Share (‘‘EPS’’), which
determines earnings per share for each class of common stock and participating security as if all earnings for the
period had been distributed. Unvested restricted share awards that earn non-forfeitable dividend rights qualify as
participating securities and, accordingly, are included in the basic computation as such. Our unvested Restricted
Shares participate on an equal basis with common shares; therefore, there is no difference in undistributed earnings
allocated to each participating security.
Research and Development Expense — Research and development costs are charged to expense when incurred.
Aggregate research and development costs included in SG&A were $36.1 million, $42.0 million and $39.6 million
in 2020, 2019 and 2018, respectively. Costs incurred for research and development primarily include salaries and
benefits and consumable supplies, as well as rent, professional fees, utilities and the depreciation of property and
equipment used in research and development activities.
Accounting Developments
Pronouncements Implemented
In June 2016, the Financial Accounting Standards Board (‘‘FASB’’) issued Accounting Standards Update
(‘‘ASU’’) No. 2016-13, ‘‘Financial Instruments-Credit Losses (Topic 326), Measurement of Credit Losses on
Financial Instruments’’ (‘‘CECL’’). The ASU requires, among other things, the use of a new current expected credit
loss model in order to determine an allowance for expected credit losses with respect to financial assets and
instruments held. The CECL model requires that we estimate the lifetime of an expected credit loss for financial
assets held at the reporting date based on historical experience, current conditions and reasonable and supportable
forecasts. On January 1, 2020, we adopted the ASU on a prospective basis to determine our allowance for credit
losses in accordance with the requirements of Topic 326, and we modified our accounting policy and processes to
facilitate this approach. As a result of the adoption of the ASU, we recorded a noncash cumulative effect after-tax
adjustment to retained earnings of $7.3 million on our opening consolidated balance sheet.
Our primary exposure to financial assets that are within the scope of CECL are trade receivables and contract
assets. For these financial assets, we record an allowance for expected credit losses that, when deducted from the
gross asset balance, presents the net amount expected to be collected. We estimate the allowance based on an aging
schedule and according to historical losses as determined from our billings and collections history. Additionally, we
adjust the allowance for factors that are specific to our customers’ credit risk such as financial difficulties, liquidity
issues, insolvency, and country and political risk. We also consider both the current and forecasted direction of
macroeconomic conditions at the reporting date. The CECL model requires consideration of reasonable and
supportable forecasts of future economic conditions in the estimate of expected credit losses.
We adjust the allowance and recognize adjustments in the income statement each period. Trade receivables are
written off against the allowance in the period when the receivable is deemed to be uncollectible. Subsequent
recoveries of amounts previously written off are reflected as a reduction to credit impairment losses in the income
statement.
Our allowance for expected credit losses for short-term receivables as of December 31, 2020, was $75.2 million,
compared to $53.4 million as of December 31, 2019. The 2020 activity included $6.9 million for the adoption of the
CECL model at January 1, 2020 and $14.9 million for current period adjustments.
Our long-term receivables, included in other assets, net, represent receivables with collection periods longer than
12 months and the balance primarily consists of amounts to be collected from insurance companies and fully-reserved
70

receivables associated with the national oil company in Venezuela. As of December 31, 2020, we had $105.3 million
of long-term receivables, compared to $140.0 million as of December 31, 2019. Our allowance for expected credit
losses for long-term receivables as of December 31, 2020 was $96.1 million, compared to $101.4 million as of
December 31, 2019.
We have exposure to credit losses from off-balance sheet exposures, such as financial guarantees and standby
letters of credit, where we believe the risk of loss is immaterial to our financial statements as of December 31, 2020.
In January 2017, the FASB issued ASU No. 2017-04, ‘‘Intangibles - Goodwill and Other (Topic 350):
Simplifying the Test for Goodwill Impairment.’’ The amendments in this ASU allow companies to apply a one-step
quantitative test and record the amount of goodwill impairment as the excess of a reporting unit’s carrying amount
over its fair value, not to exceed the total amount of goodwill allocated to the reporting unit. The amendments of the
ASU are effective for annual or interim goodwill impairment tests in fiscal years beginning after December 15, 2019.
Our adoption of ASU No. 2017-04 effective January 1, 2020 did not have an impact on our consolidated financial
condition and results of operations.
In August 2018, the FASB issued ASU No. 2018-13, ‘‘Fair Value Measurement (Topic 820): Disclosure
Framework—Changes to the Disclosure Requirements for Fair Value Measurement.’’ The amendments of the ASU
modify the disclosure requirements for fair value measurements by removing, modifying, or adding certain disclosure
requirements for assets and liabilities measured at fair value in the statement of financial position or disclosed in the
notes to the financial statements. The ASU is effective for fiscal years, and interim periods within those fiscal years,
beginning after December 15, 2019, with early adoption permitted for the removed disclosures and delayed adoption
until fiscal year 2020 permitted for the new disclosures. The removed and modified disclosures were adopted on a
retrospective basis and the new disclosures were adopted on a prospective basis. Our adoption of ASU No. 2018-13
effective January 1, 2020 did not have an impact on our disclosures.
In August 2018, the FASB issued ASU No. 2018-14, ‘‘Compensation-Retirement Benefits-Defined Benefit
Plans-General (Subtopic 715-20): Disclosure Framework-Changes to the Disclosure Requirements for Defined
Benefit Plans.’’ The ASU amends the disclosure requirements by adding, clarifying, or removing certain disclosures
for sponsor defined benefit pension or other postretirement plans. The amendments are effective for fiscal years
ending after December 15, 2020 and the amendments should be applied retrospectively to all periods presented. We
have adopted the standard and the required disclosure are reflected on our annual disclosures of the Company’s
noncontributory defined benefit pension plans.
In August 2018, the FASB issued ASU No. 2018-15, ‘‘Intangibles-Goodwill and Other-Internal-Use Software
(Subtopic 350-40): Customer’s Accounting for Implementation Costs Incurred in a Cloud Computing Arrangement
That Is a Service Contract.’’ The ASU addresses how entities should account for costs associated with implementing
a cloud computing arrangement that is considered a service contract. Per the amendments of the ASU,
implementation costs incurred in a cloud computing arrangement that is a service contract should be accounted for
in the same manner as implementation costs incurred to develop or obtain software for internal use as prescribed by
guidance in ASC 350-40. The ASU requires that implementation costs incurred in a cloud computing arrangement
be capitalized rather than expensed. Further, the ASU specifies the method for the amortization of costs incurred
during implementation, and the manner in which the unamortized portion of these capitalized implementation costs
should be evaluated for impairment. The ASU also provides guidance on how to present such implementation costs
in the financial statements and also creates additional disclosure requirements. The amendments are effective for
fiscal years beginning after December 15, 2019. The amendments in this ASU can be applied either retrospectively
or prospectively to all implementation costs incurred after the date of adoption. Our adoption of ASU No. 2018-15
effective January 1, 2020 on a prospective basis did not have a material impact on our consolidated financial
condition and results of operations.
In October 2018, the FASB issued ASU No. 2018-17, ‘‘Consolidation (Topic 810): Targeted Improvements to
Related Party Guidance for Variable Interest Entities (‘‘VIEs’’).’’ The standard reduces the cost and complexity of
financial reporting associated with VIEs. The new standard amends the guidance for determining whether a
decision-making fee is a VIE. The amendments require organizations to consider indirect interests held through
related parties under common control on a proportional basis rather than as the equivalent of a direct interest in its
entirety as currently required in U.S. Generally Accepted Accounting Principles (‘‘GAAP’’). The amendments of this
ASU are effective for fiscal years beginning after December 15, 2019. Our adoption of ASU No. 2018-17 effective
January 1, 2020 did not have an impact on our consolidated financial condition and results of operations.
71

In November 2018, the FASB issued ASU No. 2018-18, ‘‘Collaborative Arrangements (Topic 808): Clarifying
the Interaction Between Topic 808 and Topic 606.’’ The ASU clarifies the interaction between the guidance for certain
collaborative arrangements and ASU No. 2014-09, ‘‘Revenue from Contracts with Customers (Topic 606),’’ which
we adopted January 1, 2018. The amendments of the ASU provide guidance on how to assess whether certain
transactions between collaborative arrangement participants should be accounted for within ASU No. 2014-09. The
ASU also provides more comparability in the presentation of revenue for certain transactions between collaborative
arrangement participants. Parts of the collaborative arrangement that are not in the purview of the revenue recognition
standard should be presented separately. The amendments are effective for fiscal years beginning after December 15,
2019. Our adoption of ASU No. 2018-18 effective January 1, 2020 did not have an impact on our consolidated
financial condition and results of operations.
In December 2019, the FASB issued ASU No. 2019-12, ‘‘Income Taxes (Topic 740): Simplifying the
Accounting for Income Taxes.’’ The ASU intends to simplify various aspects related to accounting for income taxes
and removes certain exceptions to the general principles in the standard. Additionally, the ASU clarifies and amends
existing guidance to improve consistent application of its requirements. We early adopted ASU No. 2019-12 effective
January 1, 2020 on a prospective basis and the adoption did not have an impact on our consolidated financial
condition and results of operations.
Pronouncements Not Yet Implemented
In March of 2020, the FASB issued ASU No. 2020-04, ‘‘Reference Rate Reform (Topic 848): Facilitation of The
Effects of Reference Rate Reform on Financial Reporting.’’ The ASU provides guidance designed to enable the
process for migrating away from reference rates such as the London Interbank Offered Rate (‘‘LIBOR’’) and others
to new reference rates. Further, the amendments of the ASU provides optional expedients and exceptions for applying
U.S. GAAP to contract modifications and hedging relationships, subject to meeting certain criteria, that reference
LIBOR or another reference rate expected to be discontinued. The amendments are effective as of March 12, 2020
through December 31, 2022 and should be applied prospectively to all periods presented. We have evaluated the
impact of ASU No. 2020-04 and other related ASUs, and we anticipate that our adoption of these ASUs will not have
a material impact on our consolidated financial condition and results of operations.
In October 2020, the FASB issued ASU No. 2020-10, ‘‘Codification Improvements: Amendments to the FASB
Accounting Standards Codification.’’ The amendments in this ASU do not change GAAP and, therefore, are not
expected to result in a significant change in practice. Rather, the amendments are intended to improve codification
guidance and disclosure requirements in Company’s financial statements and notes to the financial statements. The
amendments are effective for annual periods beginning after December 15, 2020 and the amendments should be
applied retrospectively to all periods presented. We are currently evaluating the impact of ASU 2010-10 and we
anticipate that our adoption of this ASU will not have a material impact on our consolidated financial condition,
results of operations or net cash flows.
2. REVISION TO PREVIOUSLY REPORTED FINANCIAL INFORMATION
In conjunction with our close process for the third quarter of 2020, we identified accounting errors related to the
recognition of a liability for unasserted asbestos claims. The adjustments primarily relate to an incurred but not
reported (‘‘IBNR’’) liability associated with unasserted asbestos claims, but also include adjustments related to the
associated receivables for expected insurance proceeds for asbestos settlement and defense costs from insurance
coverage and the recognition as an expense the related legal fees that were previously estimated to be recoverable
from insurance carriers for which coverage is not currently sufficient following the recognition of the IBNR and to
correct certain other previously identified immaterial misstatements. Prior periods not presented herein will be
revised, as applicable, in future filings.
72
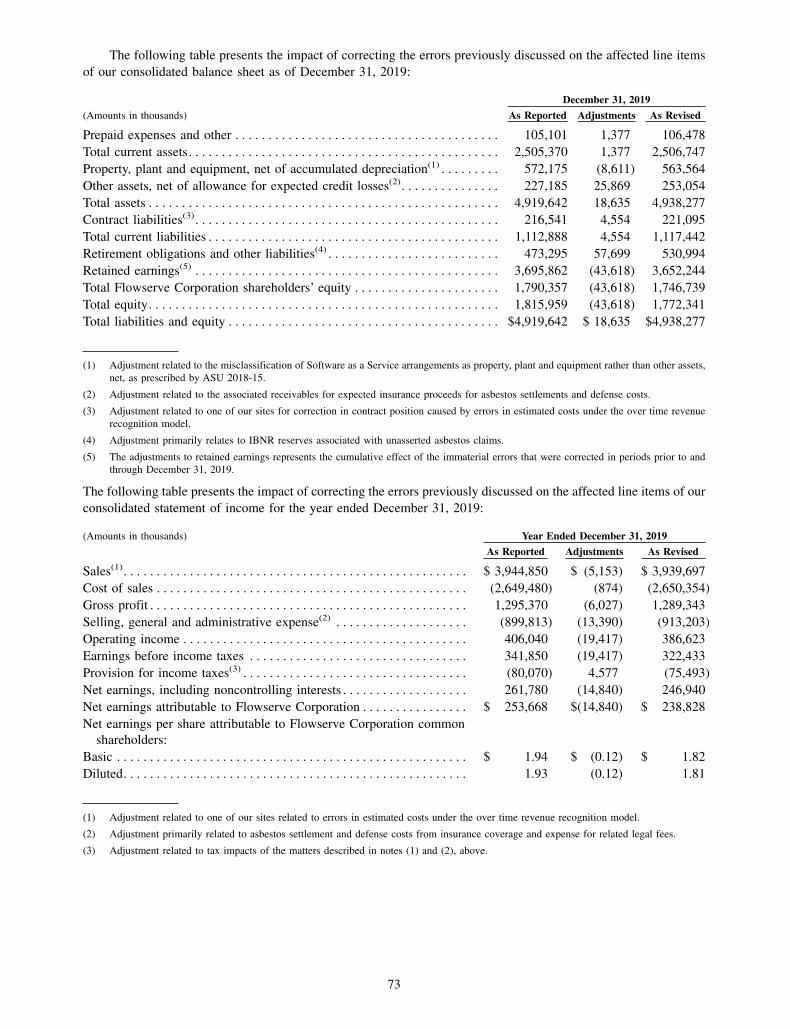
The following table presents the impact of correcting the errors previously discussed on the affected line items
of our consolidated balance sheet as of December 31, 2019:
December 31, 2019
(Amounts in thousands) As Reported Adjustments As Revised
Prepaid expenses and other . . . . . . . . . . . . . . . . . . . . . . . . . . . . . . . . . . . . . . . . 105,101 1,377 106,478
Total current assets. . . . . . . . . . . . . . . . . . . . . . . . . . . . . . . . . . . . . . . . . . . . . . . 2,505,370 1,377 2,506,747
Property, plant and equipment, net of accumulated depreciation(1) . . . . . . . . . 572,175 (8,611) 563,564
Other assets, net of allowance for expected credit losses(2). . . . . . . . . . . . . . . 227,185 25,869 253,054
Total assets . . . . . . . . . . . . . . . . . . . . . . . . . . . . . . . . . . . . . . . . . . . . . . . . . . . . . 4,919,642 18,635 4,938,277
Contract liabilities(3). . . . . . . . . . . . . . . . . . . . . . . . . . . . . . . . . . . . . . . . . . . . . . 216,541 4,554 221,095
Total current liabilities . . . . . . . . . . . . . . . . . . . . . . . . . . . . . . . . . . . . . . . . . . . . 1,112,888 4,554 1,117,442
Retirement obligations and other liabilities(4) . . . . . . . . . . . . . . . . . . . . . . . . . . 473,295 57,699 530,994
Retained earnings(5) . . . . . . . . . . . . . . . . . . . . . . . . . . . . . . . . . . . . . . . . . . . . . . 3,695,862 (43,618) 3,652,244
Total Flowserve Corporation shareholders’ equity . . . . . . . . . . . . . . . . . . . . . . 1,790,357 (43,618) 1,746,739
Total equity. . . . . . . . . . . . . . . . . . . . . . . . . . . . . . . . . . . . . . . . . . . . . . . . . . . . . 1,815,959 (43,618) 1,772,341
Total liabilities and equity . . . . . . . . . . . . . . . . . . . . . . . . . . . . . . . . . . . . . . . . . $4,919,642 $ 18,635 $4,938,277
(1) Adjustment related to the misclassification of Software as a Service arrangements as property, plant and equipment rather than other assets,
net, as prescribed by ASU 2018-15.
(2) Adjustment related to the associated receivables for expected insurance proceeds for asbestos settlements and defense costs.
(3) Adjustment related to one of our sites for correction in contract position caused by errors in estimated costs under the over time revenue
recognition model.
(4) Adjustment primarily relates to IBNR reserves associated with unasserted asbestos claims.
(5) The adjustments to retained earnings represents the cumulative effect of the immaterial errors that were corrected in periods prior to and
through December 31, 2019.
The following table presents the impact of correcting the errors previously discussed on the affected line items of our
consolidated statement of income for the year ended December 31, 2019:
(Amounts in thousands) Year Ended December 31, 2019
As Reported Adjustments As Revised
Sales(1). . . . . . . . . . . . . . . . . . . . . . . . . . . . . . . . . . . . . . . . . . . . . . . . . . . . $ 3,944,850 $ (5,153) $ 3,939,697
Cost of sales . . . . . . . . . . . . . . . . . . . . . . . . . . . . . . . . . . . . . . . . . . . . . . . (2,649,480) (874) (2,650,354)
Gross profit . . . . . . . . . . . . . . . . . . . . . . . . . . . . . . . . . . . . . . . . . . . . . . . . 1,295,370 (6,027) 1,289,343
Selling, general and administrative expense(2) . . . . . . . . . . . . . . . . . . . . (899,813) (13,390) (913,203)
Operating income . . . . . . . . . . . . . . . . . . . . . . . . . . . . . . . . . . . . . . . . . . . 406,040 (19,417) 386,623
Earnings before income taxes . . . . . . . . . . . . . . . . . . . . . . . . . . . . . . . . . 341,850 (19,417) 322,433
Provision for income taxes(3) . . . . . . . . . . . . . . . . . . . . . . . . . . . . . . . . . . (80,070) 4,577 (75,493)
Net earnings, including noncontrolling interests . . . . . . . . . . . . . . . . . . . 261,780 (14,840) 246,940
Net earnings attributable to Flowserve Corporation . . . . . . . . . . . . . . . . $ 253,668 $(14,840) $ 238,828
Net earnings per share attributable to Flowserve Corporation common
shareholders:
Basic . . . . . . . . . . . . . . . . . . . . . . . . . . . . . . . . . . . . . . . . . . . . . . . . . . . . . $ 1.94 $ (0.12) $ 1.82
Diluted. . . . . . . . . . . . . . . . . . . . . . . . . . . . . . . . . . . . . . . . . . . . . . . . . . . . 1.93 (0.12) 1.81
(1) Adjustment related to one of our sites related to errors in estimated costs under the over time revenue recognition model.
(2) Adjustment primarily related to asbestos settlement and defense costs from insurance coverage and expense for related legal fees.
(3) Adjustment related to tax impacts of the matters described in notes (1) and (2), above.
73

The following table presents the impact of correcting the errors previously discussed on the affected line items
of our consolidated statement of income for the year ended December 31, 2018:
(Amounts in thousands) Year Ended December 31, 2018
As Reported Adjustments As Revised
Sales(1). . . . . . . . . . . . . . . . . . . . . . . . . . . . . . . . . . . . . . . . . . . . . . . . . . . . $3,832,666 $ 3,033 $3,835,699
Gross profit . . . . . . . . . . . . . . . . . . . . . . . . . . . . . . . . . . . . . . . . . . . . . . . . 1,187,836 3,033 1,190,869
Selling, general and administrative expense(2) . . . . . . . . . . . . . . . . . . . . (943,714) (22,870) (966,584)
Operating income . . . . . . . . . . . . . . . . . . . . . . . . . . . . . . . . . . . . . . . . . . . 247,538 (19,837) 227,701
Earnings before income taxes . . . . . . . . . . . . . . . . . . . . . . . . . . . . . . . . . 176,274 (19,837) 156,437
Provision for income taxes(3) . . . . . . . . . . . . . . . . . . . . . . . . . . . . . . . . . . (51,224) 4,674 (46,550)
Net earnings, including noncontrolling interests . . . . . . . . . . . . . . . . . . . 125,050 (15,163) 109,887
Net earnings attributable to Flowserve Corporation . . . . . . . . . . . . . . . . $ 119,671 $(15,163) $ 104,508
Net earnings per share attributable to Flowserve Corporation common
shareholders:
Basic . . . . . . . . . . . . . . . . . . . . . . . . . . . . . . . . . . . . . . . . . . . . . . . . . . . . . $ 0.91 $ (0.11) $ 0.80
Diluted. . . . . . . . . . . . . . . . . . . . . . . . . . . . . . . . . . . . . . . . . . . . . . . . . . . . 0.91 (0.11) 0.80
(1) Adjustment related to one of our sites related to errors in estimated costs under the over time revenue recognition model.
(2) Adjustment primarily related to asbestos settlement and defense costs from insurance coverage and expense for related legal fees and
broad-based annual incentive compensation.
(3) Adjustment related to tax impacts of the matters described in notes (1) and (2), above.
The consolidated statements of shareholders’ equity and the consolidated statements of comprehensive income
for the periods ending December 31, 2020, 2019 and 2018 have also been revised to reflect the impacts to net
earnings. The impact of errors arising in periods commencing prior to January 1, 2018 has been reflected as a
reduction to opening retained earnings in the amount of $28.8 million in the consolidated statement of shareholders’
equity.
Except for as described below in (1), the effect of the adjustments to the consolidated statements of cash flows
for the period ended December 31, 2019 primarily related to net earnings, including noncontrolling interests, for the
change in net earnings in the table above and were offset primarily by impacts to changes in operating assets and
liabilities. The following table presents the impact of correcting the errors previously discussed on the affected line
items of our consolidated statement of cash flows for the years ended December 31, 2019 and 2018:
Year Ended December 31, 2019
(Amounts in thousands) As Reported Adjustments As Revised
Net cash flows provided (used) by operating activities(1) . . . . . . . . . . . . . . . . $ 312,741 $11,356 $ 324,097
Net cash flows provided (used) by investing activities(1) . . . . . . . . . . . . . . . . (23,837) (9,546) (33,383)
Net cash flows provided (used) by financing activities . . . . . . . . . . . . . . . . . . (229,654) (1,810) (231,464)
Cash and cash equivalents at end of period(1) . . . . . . . . . . . . . . . . . . . . . . . . . 670,980 — 670,980
(1) Primarily related to adjustments resulting from the misclassification of Software as a Service arrangements as property, plant and equipment
rather than other assets, net, as prescribed by ASU 2018-15, and adjustments related to our international operations’ exposure to fluctuations
in foreign currency exchange rates, resulting from our Argentinian subsidiary’s change in using the U.S. dollar as our functional currency
in Argentina.
The effects of the prior period revisions on the consolidated statements of cash flows for the year ended
December 31, 2018 were primarily to the change in net earnings, as well as the changes in net cash flows provided
(used) by operating activities, limited to prepaid expenses and other assets, net, accounts payable, accrued liabilities
and income taxes payable, retirement obligations and other and deferred tax movements. Accordingly, there were no
changes to any subtotals within the 2018 consolidated statement of cash flows.
The impacts of the revisions have been reflected throughout the financial statements, including the applicable
footnotes, as appropriate.
74

3. REVENUE RECOGNITION
The majority of our revenues relate to customer orders that typically contain a single commitment of goods or
services which have lead times under a year. Longer lead time, more complex contracts with our customers typically
have multiple commitments of goods and services, including any combination of designing, developing,
manufacturing, modifying, installing and commissioning of flow management equipment and providing services and
parts related to the performance of such products. Control transfers over time when the customer is able to direct the
use of and obtain substantially all of the benefits of our work as we perform.
Our primary method for recognizing revenue over time is the percentage of completion (‘‘POC’’) method.
Revenue from products and services transferred to customers over time accounted for approximately 22%, 19% and
22% of total revenue for the years ended December 31, 2020, 2019 and 2018, respectively. If control does not transfer
over time, then control transfers at a point in time. We recognize revenue at a point in time at the level of each
performance obligation based on the evaluation of certain indicators of control transfer, such as title transfer, risk of
loss transfer, customer acceptance and physical possession. Revenue from products and services transferred to
customers at a point in time accounted for approximately 78%, 81% and 78% of total revenue for the years ended
December 31, 2020, 2019 and 2018, respectively.
Disaggregated Revenue
We conduct our operations through two business segments based on the type of product and how we manage
the business:
• Flowserve Pump Division (‘‘FPD’’) for custom, highly-engineered pumps, pre-configured industrial
pumps, pump systems, mechanical seals, auxiliary systems and replacement parts and related services; and
• Flow Control Division (‘‘FCD’’) for engineered and industrial valves, control valves, actuators and controls
and related services.
Our revenue sources are derived from our original equipment manufacturing and our aftermarket sales and
services. Our original equipment revenues are generally related to originally designed, manufactured, distributed and
installed equipment that can range from pre-configured, short-cycle products to more customized, highly-engineered
equipment (‘‘Original Equipment’’). Our aftermarket sales and services are derived from sales of replacement
equipment, as well as maintenance, advanced diagnostic, repair and retrofitting services (‘‘Aftermarket’’). Each of
our two business segments generate Original Equipment and Aftermarket revenues.
The following table presents our customer revenues disaggregated by revenue source:
December 31, 2020
(Amounts in thousands) FPD FCD Total
Original Equipment . . . . . . . . . . . . . . . . . . . . . . . . . . . . . . . . . . . . . . . . . . . . . . $1,091,906 $ 808,585 $1,900,491
Aftermarket. . . . . . . . . . . . . . . . . . . . . . . . . . . . . . . . . . . . . . . . . . . . . . . . . . . . . 1,581,799 245,844 1,827,643
$2,673,705 $1,054,429 $3,728,134
December 31, 2019
(Amounts in thousands) FPD FCD Total
Original Equipment . . . . . . . . . . . . . . . . . . . . . . . . . . . . . . . . . . . . . . . . . . . . . . $ 994,719 $ 967,271 $1,961,990
Aftermarket. . . . . . . . . . . . . . . . . . . . . . . . . . . . . . . . . . . . . . . . . . . . . . . . . . . . . 1,709,726 267,981 1,977,707
$2,704,445 $1,235,252 $3,939,697
December 31, 2018
(Amounts in thousands) FPD FCD Total
Original Equipment . . . . . . . . . . . . . . . . . . . . . . . . . . . . . . . . . . . . . . . . . . . . . . $ 992,162 $ 946,926 $1,939,088
Aftermarket. . . . . . . . . . . . . . . . . . . . . . . . . . . . . . . . . . . . . . . . . . . . . . . . . . . . . 1,628,326 268,285 1,896,611
$2,620,488 $1,215,211 $3,835,699
75

Our customer sales are diversified geographically. The following table presents our revenues disaggregated by
geography, based on the shipping addresses of our customers:
December 31, 2020
(Amounts in thousands) FPD FCD Total
North America(1). . . . . . . . . . . . . . . . . . . . . . . . . . . . . . . . . . . . . . . . . . . . . . . . . $1,039,285 $ 429,572 $1,468,857
Latin America(1) . . . . . . . . . . . . . . . . . . . . . . . . . . . . . . . . . . . . . . . . . . . . . . . . . 191,517 26,393 217,910
Middle East and Africa . . . . . . . . . . . . . . . . . . . . . . . . . . . . . . . . . . . . . . . . . . . 359,403 110,539 469,942
Asia Pacific. . . . . . . . . . . . . . . . . . . . . . . . . . . . . . . . . . . . . . . . . . . . . . . . . . . . . 537,792 270,238 808,030
Europe. . . . . . . . . . . . . . . . . . . . . . . . . . . . . . . . . . . . . . . . . . . . . . . . . . . . . . . . . 545,708 217,687 763,395
$2,673,705 $1,054,429 $3,728,134
December 31, 2019
(Amounts in thousands) FPD FCD Total
North America(1). . . . . . . . . . . . . . . . . . . . . . . . . . . . . . . . . . . . . . . . . . . . . . . . . $1,085,627 $ 542,182 $1,627,809
Latin America(1) . . . . . . . . . . . . . . . . . . . . . . . . . . . . . . . . . . . . . . . . . . . . . . . . . 202,247 28,899 231,146
Middle East and Africa . . . . . . . . . . . . . . . . . . . . . . . . . . . . . . . . . . . . . . . . . . . 355,937 98,959 454,896
Asia Pacific. . . . . . . . . . . . . . . . . . . . . . . . . . . . . . . . . . . . . . . . . . . . . . . . . . . . . 499,932 315,886 815,818
Europe. . . . . . . . . . . . . . . . . . . . . . . . . . . . . . . . . . . . . . . . . . . . . . . . . . . . . . . . . 560,702 249,326 810,028
$2,704,445 $1,235,252 $3,939,697
December 31, 2018
(Amounts in thousands) FPD FCD Total
North America(1). . . . . . . . . . . . . . . . . . . . . . . . . . . . . . . . . . . . . . . . . . . . . . . . . $1,037,637 $ 541,378 $1,579,015
Latin America(1) . . . . . . . . . . . . . . . . . . . . . . . . . . . . . . . . . . . . . . . . . . . . . . . . . 219,376 22,405 241,781
Middle East and Africa . . . . . . . . . . . . . . . . . . . . . . . . . . . . . . . . . . . . . . . . . . . 329,484 138,240 467,724
Asia Pacific. . . . . . . . . . . . . . . . . . . . . . . . . . . . . . . . . . . . . . . . . . . . . . . . . . . . . 502,559 281,080 783,639
Europe. . . . . . . . . . . . . . . . . . . . . . . . . . . . . . . . . . . . . . . . . . . . . . . . . . . . . . . . . 531,432 232,108 763,540
$2,620,488 $1,215,211 $3,835,699
(1) North America represents United States and Canada; Latin America includes Mexico.
On December 31, 2020, the aggregate transaction price allocated to unsatisfied (or partially unsatisfied)
performance obligations related to contracts having an original expected duration in excess of one year was
approximately $541 million. We estimate recognition of approximately $412 million of this amount as revenue in
2021 and an additional $129 million in 2022 and thereafter.
Contract Balances
We receive payment from customers based on a contractual billing schedule and specific performance
requirements as established in our contracts. We record billings as accounts receivable when an unconditional right
to consideration exists. A contract asset represents revenue recognized in advance of our right to bill the customer
under the terms of a contract. A contract liability represents our contractual billings in advance of revenue recognized
for a contract.
76
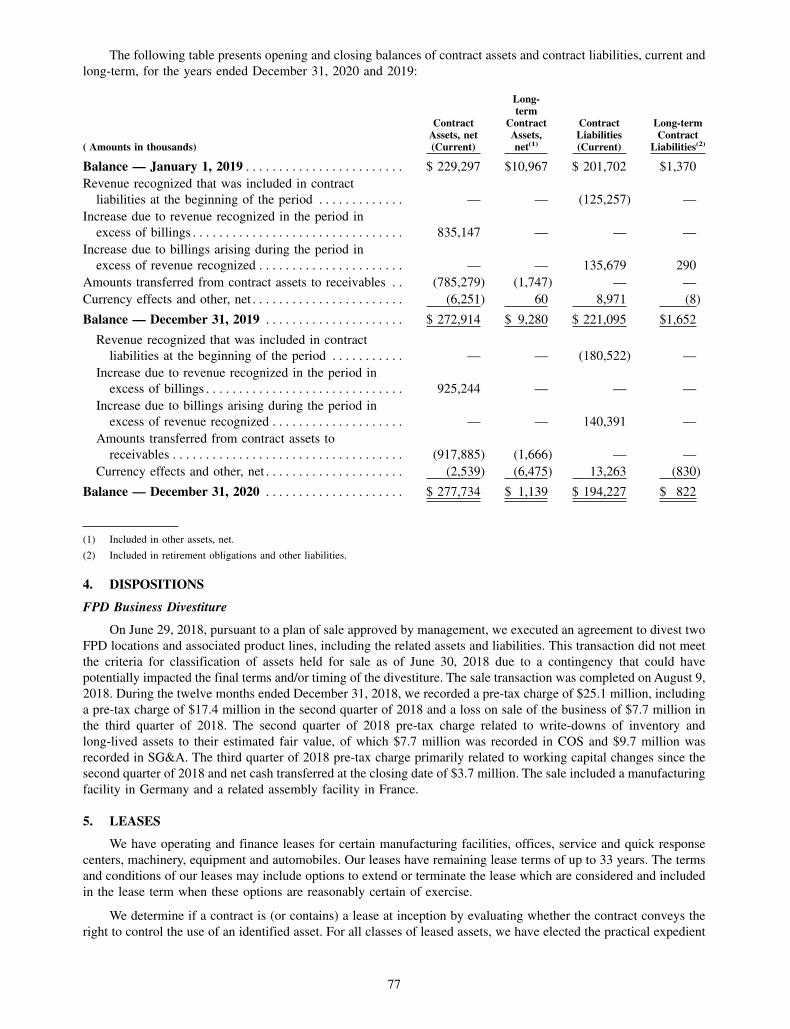
The following table presents opening and closing balances of contract assets and contract liabilities, current and
long-term, for the years ended December 31, 2020 and 2019:
( Amounts in thousands)
ContractAssets, net(Current)
Long-term
ContractAssets,net(1)
ContractLiabilities(Current)
Long-termContract
Liabilities(2)
Balance — January 1, 2019 . . . . . . . . . . . . . . . . . . . . . . . . $ 229,297 $10,967 $ 201,702 $1,370
Revenue recognized that was included in contract
liabilities at the beginning of the period . . . . . . . . . . . . . — — (125,257) —
Increase due to revenue recognized in the period in
excess of billings . . . . . . . . . . . . . . . . . . . . . . . . . . . . . . . . 835,147 — — —
Increase due to billings arising during the period in
excess of revenue recognized . . . . . . . . . . . . . . . . . . . . . . — — 135,679 290
Amounts transferred from contract assets to receivables . . (785,279) (1,747) — —
Currency effects and other, net . . . . . . . . . . . . . . . . . . . . . . . (6,251) 60 8,971 (8)
Balance — December 31, 2019 . . . . . . . . . . . . . . . . . . . . . $ 272,914 $ 9,280 $ 221,095 $1,652
Revenue recognized that was included in contract
liabilities at the beginning of the period . . . . . . . . . . . — — (180,522) —
Increase due to revenue recognized in the period in
excess of billings . . . . . . . . . . . . . . . . . . . . . . . . . . . . . . 925,244 — — —
Increase due to billings arising during the period in
excess of revenue recognized . . . . . . . . . . . . . . . . . . . . — — 140,391 —
Amounts transferred from contract assets to
receivables . . . . . . . . . . . . . . . . . . . . . . . . . . . . . . . . . . . (917,885) (1,666) — —
Currency effects and other, net . . . . . . . . . . . . . . . . . . . . . (2,539) (6,475) 13,263 (830)
Balance — December 31, 2020 . . . . . . . . . . . . . . . . . . . . . $ 277,734 $ 1,139 $ 194,227 $ 822
(1) Included in other assets, net.
(2) Included in retirement obligations and other liabilities.
4. DISPOSITIONS
FPD Business Divestiture
On June 29, 2018, pursuant to a plan of sale approved by management, we executed an agreement to divest two
FPD locations and associated product lines, including the related assets and liabilities. This transaction did not meet
the criteria for classification of assets held for sale as of June 30, 2018 due to a contingency that could have
potentially impacted the final terms and/or timing of the divestiture. The sale transaction was completed on August 9,
2018. During the twelve months ended December 31, 2018, we recorded a pre-tax charge of $25.1 million, including
a pre-tax charge of $17.4 million in the second quarter of 2018 and a loss on sale of the business of $7.7 million in
the third quarter of 2018. The second quarter of 2018 pre-tax charge related to write-downs of inventory and
long-lived assets to their estimated fair value, of which $7.7 million was recorded in COS and $9.7 million was
recorded in SG&A. The third quarter of 2018 pre-tax charge primarily related to working capital changes since the
second quarter of 2018 and net cash transferred at the closing date of $3.7 million. The sale included a manufacturing
facility in Germany and a related assembly facility in France.
5. LEASES
We have operating and finance leases for certain manufacturing facilities, offices, service and quick response
centers, machinery, equipment and automobiles. Our leases have remaining lease terms of up to 33 years. The terms
and conditions of our leases may include options to extend or terminate the lease which are considered and included
in the lease term when these options are reasonably certain of exercise.
We determine if a contract is (or contains) a lease at inception by evaluating whether the contract conveys the
right to control the use of an identified asset. For all classes of leased assets, we have elected the practical expedient
77

to account for any non-lease components in the contract together with the related lease component in the same unit
of account. For lease contracts containing more than one lease component, we allocate the contract consideration to
each of the lease components on the basis of relative standalone prices in order to identify the lease payments for each
lease component.
ROU assets and lease liabilities are recognized in our consolidated balance sheets at the commencement date
based on the present value of remaining lease payments over the lease term. Additionally, ROU assets include any
lease payments made at or before the commencement date, as well as any initial direct costs incurred, and are reduced
by any lease incentives received. As most of our operating leases do not provide an implicit rate, we apply our
incremental country-specific borrowing rate to determine the present value of remaining lease payments. Our
incremental borrowing country-specific rate is determined based on information available at the commencement date
of the lease.
Operating leases are included in operating lease right-of-use assets, net and operating lease liabilities in our
consolidated balance sheets. Finance leases are included in property plant and equipment, debt due within one year
and long-term debt due after one year in our consolidated balance sheets.
For all classes of leased assets, we have applied an accounting policy election to exclude short-term leases from
recognition in our consolidated balance sheets. A short-term lease has a lease term of 12 months or less at the
commencement date and does not include a purchase option that is reasonably certain of exercise. We recognize
short-term lease expense in our consolidated income statements on a straight-line basis over the lease term. Our
short-term lease expense and short-term lease commitments as of December 31, 2020 are immaterial.
We have certain lease contracts with terms and conditions that provide for variability in the payment amount
based on changes in facts or circumstances occurring after the commencement date. These variable lease payments
are recognized in our consolidated income statements as the obligation is incurred.
We have certain lease contracts where we provide a guarantee to the lessor that the value of an underlying asset
will be at least a specified amount at the end of the lease. Estimated amounts expected to be paid for residual value
guarantees are included in lease liabilities and ROU assets.
We had $0.4 million and $34.7 million of legally binding minimum lease payments for operating leases signed
but not yet commenced as of December 31, 2020 and 2019. We did not have material subleases, leases that imposed
significant restrictions or covenants, material related party leases or sale-leaseback arrangements.
Other information related to our leases is as follows:
December 31,
(Amounts in thousands) 2020 2019
Finance Leases:ROU assets recorded under finance leases . . . . . . . . . . . . . . . . . . . . . . . . . . . . . . . . . . . . . . . . . . $27,624 $19,606Accumulated depreciation associated with finance leases . . . . . . . . . . . . . . . . . . . . . . . . . . . . . . (9,463) (7,551)
Total finance leases ROU assets, net(1) . . . . . . . . . . . . . . . . . . . . . . . . . . . . . . . . . . . . . . . . . . . . . $18,161 $12,055
Total finance leases liabilities(2) . . . . . . . . . . . . . . . . . . . . . . . . . . . . . . . . . . . . . . . . . . . . . . . . . . . $18,287 $11,788
The costs components of operating and finance leases are as follows:
December 31,
(Amounts in thousands) 2020 2019
Operating Lease Costs:Fixed lease expense(3) . . . . . . . . . . . . . . . . . . . . . . . . . . . . . . . . . . . . . . . . . . . . . . . . . . . . . . . . . . . $57,050 $57,450Variable lease expense(3). . . . . . . . . . . . . . . . . . . . . . . . . . . . . . . . . . . . . . . . . . . . . . . . . . . . . . . . . 7,299 6,492
Total operating lease expense . . . . . . . . . . . . . . . . . . . . . . . . . . . . . . . . . . . . . . . . . . . . . . . . . . . . . $64,349 $63,942
Finance Lease Costs:Depreciation of finance lease ROU assets(3) . . . . . . . . . . . . . . . . . . . . . . . . . . . . . . . . . . . . . . . . . $ 5,392 $ 4,729Interest on lease liabilities(4). . . . . . . . . . . . . . . . . . . . . . . . . . . . . . . . . . . . . . . . . . . . . . . . . . . . . . 646 352
Total finance lease expense . . . . . . . . . . . . . . . . . . . . . . . . . . . . . . . . . . . . . . . . . . . . . . . . . . . . . . $ 6,038 $ 5,081
(1) Included in property plant and equipment, net
78

(2) Included in debt due within one year and long-term debt due after one year, accordingly
(3) Included in cost of sales and selling, general and administrative expense, accordingly
(4) Included in interest expense
Supplemental cash flows information related to our leases is as follows:
December 31,
(Amounts in thousands, except lease term and discount rate) 2020 2019
Cash paid for amounts included in the measurement of lease liabilities:Operating cash flows from operating leases(1) $66,478 $64,725Financing cash flows from finance leases(2) . . . . . . . . . . . . . . . . . . . . . . . . . . . . . . . . 4,704 4,465
ROU assets obtained in exchange for lease obligations:Operating leases . . . . . . . . . . . . . . . . . . . . . . . . . . . . . . . . . . . . . . . . . . . . . . . . . . . . . . $62,425 $14,569Finance leases . . . . . . . . . . . . . . . . . . . . . . . . . . . . . . . . . . . . . . . . . . . . . . . . . . . . . . . . 13,124 10,615
Weighted average remaining lease term (in years)Operating leases . . . . . . . . . . . . . . . . . . . . . . . . . . . . . . . . . . . . . . . . . . . . . . . . . . . . . . 9 years 9 yearsFinance leases . . . . . . . . . . . . . . . . . . . . . . . . . . . . . . . . . . . . . . . . . . . . . . . . . . . . . . . . 7 years 3 years
Weighted average discount rate (percent)Operating leases . . . . . . . . . . . . . . . . . . . . . . . . . . . . . . . . . . . . . . . . . . . . . . . . . . . . . . 4.2% 4.5%Finance leases . . . . . . . . . . . . . . . . . . . . . . . . . . . . . . . . . . . . . . . . . . . . . . . . . . . . . . . . 3.5% 3.6%
(1) Included in our consolidated statement of cash flows, operating activities, prepaid expenses and other assets, net and retirement obligationsand other
(2) Included in our consolidated statement of cash flows, financing activities, payments under other financing arrangements
Future undiscounted lease payments under operating and finance leases as of December 31, 2020, were as
follows (amounts in thousands):
Year ending December 31,Operating
LeasesFinanceLeases
2021 . . . . . . . . . . . . . . . . . . . . . . . . . . . . . . . . . . . . . . . . . . . . . . . . . . . . . . . . . . . . . . . 42,570 5,5392022 . . . . . . . . . . . . . . . . . . . . . . . . . . . . . . . . . . . . . . . . . . . . . . . . . . . . . . . . . . . . . . . 36,596 4,5222023 . . . . . . . . . . . . . . . . . . . . . . . . . . . . . . . . . . . . . . . . . . . . . . . . . . . . . . . . . . . . . . . 30,458 2,9962024 . . . . . . . . . . . . . . . . . . . . . . . . . . . . . . . . . . . . . . . . . . . . . . . . . . . . . . . . . . . . . . . 26,334 1,5212025 . . . . . . . . . . . . . . . . . . . . . . . . . . . . . . . . . . . . . . . . . . . . . . . . . . . . . . . . . . . . . . . 20,977 939Thereafter . . . . . . . . . . . . . . . . . . . . . . . . . . . . . . . . . . . . . . . . . . . . . . . . . . . . . . . . . . . 94,991 5,265
Total future minimum lease payments . . . . . . . . . . . . . . . . . . . . . . . . . . . . . . . . . . $251,926 $20,782Less: Imputed interest . . . . . . . . . . . . . . . . . . . . . . . . . . . . . . . . . . . . . . . . . . . . . . . . . (40,690) (2,495)
Total . . . . . . . . . . . . . . . . . . . . . . . . . . . . . . . . . . . . . . . . . . . . . . . . . . . . . . . . . . . . . . . $211,236 $18,287
Other current liabilities . . . . . . . . . . . . . . . . . . . . . . . . . . . . . . . . . . . . . . . . . . . . . . . . $ 34,990 $ —Operating lease liabilities . . . . . . . . . . . . . . . . . . . . . . . . . . . . . . . . . . . . . . . . . . . . . . 176,246 —Debt due within one year . . . . . . . . . . . . . . . . . . . . . . . . . . . . . . . . . . . . . . . . . . . . . . — 5,354Long-term debt due after one year . . . . . . . . . . . . . . . . . . . . . . . . . . . . . . . . . . . . . . . — 12,933
Total . . . . . . . . . . . . . . . . . . . . . . . . . . . . . . . . . . . . . . . . . . . . . . . . . . . . . . . . . . . . . $211,236 $18,287
6. GOODWILL AND OTHER INTANGIBLE ASSETS
The changes in the carrying amount of goodwill for the years ended December 31, 2020 and 2019 are as follows:
FPD FCD Total
(Amounts in thousands)
Balance as of December 31, 2018 . . . . . . . . . . . . . . . . . . . . . . . . . . . . . . . . . . $790,139 $407,501 $1,197,640Currency translation and other. . . . . . . . . . . . . . . . . . . . . . . . . . . . . . . . . . . . (3,509) (1,121) (4,630)
Balance as of December 31, 2019 . . . . . . . . . . . . . . . . . . . . . . . . . . . . . . . . . . $786,630 $406,380 $1,193,010Currency translation and other. . . . . . . . . . . . . . . . . . . . . . . . . . . . . . . . . . . . 18,425 13,451 31,876
Balance as of December 31, 2020 . . . . . . . . . . . . . . . . . . . . . . . . . . . . . . . . . . $805,055 $419,831 $1,224,886
79

The following table provides information about our intangible assets for the years ended December 31, 2020 and
2019:
December 31, 2020 December 31, 2019
UsefulLife
(Years)
EndingGross
AmountAccumulatedAmortization
EndingGross
AmountAccumulatedAmortization
(Amounts in thousands, except years)
Finite-lived intangible assets:
Engineering drawings(1) . . . . . . . . . . . . . . . . . . . . . . 10-22 $ 90,638 $ (83,620) $ 89,490 $ (78,854)
Existing customer relationships(2) . . . . . . . . . . . . . . 5-10 85,214 (62,796) 81,844 (53,468)
Patents . . . . . . . . . . . . . . . . . . . . . . . . . . . . . . . . . . . 9-16 27,015 (27,015) 26,132 (26,132)
Other. . . . . . . . . . . . . . . . . . . . . . . . . . . . . . . . . . . . . 4-40 93,923 (43,633) 92,920 (40,149)
$296,790 $(217,064) $290,386 $(198,603)
Indefinite-lived intangible assets(3) . . . . . . . . . . . . . . . $ 90,355 $ (1,585) $ 90,607 $ (1,585)
(1) Engineering drawings represent the estimated fair value associated with specific acquired product and component schematics.
(2) Existing customer relationships acquired prior to 2011 had a useful life of five years.
(3) Accumulated amortization for indefinite-lived intangible assets relates to amounts recorded prior to the implementation date of guidanceissued in ASC 350.
The following schedule outlines actual amortization expense recognized during 2020 and an estimate of future
amortization based upon the finite-lived intangible assets owned at December 31, 2020:
AmortizationExpense
(Amounts in thousands)
Actual for year ended December 31, 2020 . . . . . . . . . . . . . . . . . . . . . . . . . . . . . . . . . . . . . $13,645
Estimated for year ended December 31, 2021 . . . . . . . . . . . . . . . . . . . . . . . . . . . . . . . . . . . 14,313
Estimated for year ended December 31, 2022 . . . . . . . . . . . . . . . . . . . . . . . . . . . . . . . . . . . 12,298
Estimated for year ended December 31, 2023 . . . . . . . . . . . . . . . . . . . . . . . . . . . . . . . . . . . 9,283
Estimated for year ended December 31, 2024 . . . . . . . . . . . . . . . . . . . . . . . . . . . . . . . . . . . 4,286
Estimated for year ended December 31, 2025 . . . . . . . . . . . . . . . . . . . . . . . . . . . . . . . . . . . 2,338
Thereafter. . . . . . . . . . . . . . . . . . . . . . . . . . . . . . . . . . . . . . . . . . . . . . . . . . . . . . . . . . . . . . . . 37,208
Amortization expense for finite-lived intangible assets was $13.8 million in 2019 and $14.1 million in 2018.
7. INVENTORIES
Inventories, net consisted of the following:
December 31,
2020 2019
(Amounts in thousands)
Raw materials . . . . . . . . . . . . . . . . . . . . . . . . . . . . . . . . . . . . . . . . . . . . . . . . . . . . . . . . . . . . $321,600 $328,080
Work in process . . . . . . . . . . . . . . . . . . . . . . . . . . . . . . . . . . . . . . . . . . . . . . . . . . . . . . . . . . . 210,174 192,993
Finished goods. . . . . . . . . . . . . . . . . . . . . . . . . . . . . . . . . . . . . . . . . . . . . . . . . . . . . . . . . . . . 221,532 218,408
Less: Excess and obsolete reserve . . . . . . . . . . . . . . . . . . . . . . . . . . . . . . . . . . . . . . . . . . . . (86,078) (78,644)
Inventories, net . . . . . . . . . . . . . . . . . . . . . . . . . . . . . . . . . . . . . . . . . . . . . . . . . . . . . . . . . . . $667,228 $660,837
During 2020, 2019 and 2018, we recognized expenses of $14.9 million, $17.1 million and $16.2 million,
respectively, for excess and obsolete inventory. These expenses are included in COS in our consolidated statements
of income.
8. STOCK-BASED COMPENSATION PLANS
Effective January 1, 2020, our shareholders approved the Flowserve Corporation 2020 Long-Term Incentive
Plan (‘‘2020 Plan’’). The 2020 Plan replaces and supersedes the Flowserve Corporation Equity and Incentive
80

Compensation Plan (‘‘2010 Plan’’) in its entirety. The 2020 Plan authorizes the issuance of 12,500,000 shares of our
common stock in the form of restricted shares, restricted share units and performance-based units (collectively
referred to as ‘‘Restricted Shares’’), incentive stock options, non-statutory stock options, stock appreciation rights and
bonus stock, in addition to any shares available for issuance or subject to forfeiture under the 2010 Plan as of its
expiration on December 31, 2019. Of the shares of common stock authorized under the 2020 Plan and remaining
shares under the 2010 Plan, 13,606,725 were available for issuance as of December 31, 2020. Restricted Shares
primarily vest over a three year period. Restricted Shares granted to employees who retire and have achieved at least
55 years of age and 10 years of service to continue to vest over the original vesting period (‘‘55/10 Provision’’).
Stock Options — Options granted to officers, other employees and directors allow for the purchase of common
shares at the market value of our stock on the date the options are granted. Options generally become exercisable after
three years. Options generally expire ten years from the date of the grant or within a short period of time following
the termination of employment or cessation of services by an option holder. As of December 31, 2020, 114,943 stock
options were outstanding and exercisable, with a grant date fair value of $2.0 million recognized over three years and
a weighted average exercise price of $48.63. As of December 31, 2020, compensation associated with these stock
options was fully earned. Using the Black-Scholes option pricing model to estimate the fair value of each option
award, as of December 31, 2020 the total fair value of stock options vested was $2.0 million. No stock option were
exercisable during the years ended December 31, 2019 and 2018. No stock options were granted, canceled or vested
during years ended December 31, 2020, 2019 or 2018. The weighted average remaining contractual life of options
outstanding at December 31, 2020, 2019 and 2018 was 6.3 years, 7.3 years and 8.3 years, respectively.
Restricted Shares — Generally, the restrictions on Restricted Shares do not expire for a minimum of one year
and a maximum of three years, and shares are subject to forfeiture during the restriction period. Most typically,
Restricted Share grants have staggered vesting periods over one to three years from grant date. The intrinsic value
of the Restricted Shares, which is typically the product of share price at the date of grant and the number of Restricted
Shares granted, is amortized on a straight-line basis to compensation expense over the periods in which the
restrictions lapse.
Awards of Restricted Shares are valued at the closing market price of our common stock on the date of grant.
The unearned compensation is amortized to compensation expense over the vesting period of the Restricted Shares,
except for awards related to the 55/10 Provision which are expensed when granted. As of December 31, 2020 and
2019, we had $18.7 million and $23.4 million, respectively, of unearned compensation cost related to unvested
Restricted Shares, which is expected to be recognized over a weighted-average period of approximately one year. The
total fair value of Restricted Shares vested during the years ended December 31, 2020, 2019 and 2018 was
$26.4 million, $16.8 million and $14.3 million, respectively.
We recorded stock-based compensation for Restricted Shares as follows:
Year Ended December 31,
2020 2019 2018
(Amounts in millions)
Stock-based compensation expense. . . . . . . . . . . . . . . . . . . . . . . . . . . . . . . . . . . . . . . $27.3 $23.9 $19.9Related income tax benefit . . . . . . . . . . . . . . . . . . . . . . . . . . . . . . . . . . . . . . . . . . . . . (6.2) (5.4) (4.5)
Net stock-based compensation expense . . . . . . . . . . . . . . . . . . . . . . . . . . . . . . . . . . . $21.1 $18.5 $15.4
The following table summarizes information regarding Restricted Shares:
Year Ended December 31, 2020
Shares
WeightedAverage
Grant-DateFair Value
Number of unvested Restricted Shares:Outstanding — beginning of year . . . . . . . . . . . . . . . . . . . . . . . . . . . . . . . . . . . . . . . . 1,690,600 $46.71Granted . . . . . . . . . . . . . . . . . . . . . . . . . . . . . . . . . . . . . . . . . . . . . . . . . . . . . . . . . . . . . 730,065 46.56Vested . . . . . . . . . . . . . . . . . . . . . . . . . . . . . . . . . . . . . . . . . . . . . . . . . . . . . . . . . . . . . . (587,301) 45.02Canceled . . . . . . . . . . . . . . . . . . . . . . . . . . . . . . . . . . . . . . . . . . . . . . . . . . . . . . . . . . . . (459,707) 48.47
Outstanding — ending of year. . . . . . . . . . . . . . . . . . . . . . . . . . . . . . . . . . . . . . . . . . . . . 1,373,657 $46.76
81

Unvested Restricted Shares outstanding as of December 31, 2020, includes approximately 539,000 units with
performance-based vesting provisions. Performance-based units are issuable in common stock and vest upon the
achievement of pre-defined performance targets. Performance-based units have performance targets based on our
average return on invested capital and our total shareholder return (‘‘TSR’’) over a three-year period. Most unvested
units were granted in three annual grants since January 1, 2018 and have a vesting percentage between 0% and 200%
depending on the achievement of the specific performance targets. Except for shares granted under the 55/10
Provision, compensation expense is recognized ratably over a cliff-vesting period of 36 months, based on the fair
value of our common stock on the date of grant, as adjusted for actual forfeitures. During the performance period,
earned and unearned compensation expense is adjusted based on changes in the expected achievement of the
performance targets for all performance-based units granted except for the TSR-based units. Vesting provisions range
from 0 to approximately 1,078,000 shares based on performance targets. As of December 31, 2020, we estimate
vesting of approximately 537,000 shares based on expected achievement of performance targets.
9. DERIVATIVES AND HEDGING ACTIVITIES
Our risk management and foreign currency derivatives and hedging policy specifies the conditions under which
we may enter into derivative contracts. See Note 1 for additional information on our purpose for entering into
derivatives and our overall risk management strategies. We enter into foreign exchange forward contracts to hedge
our cash flow risks associated with transactions denominated in currencies other than the local currency of the
operation engaging in the transaction.
Foreign exchange contracts had notional values of $388.1 million and $398.5 million at December 31, 2020 and
2019, respectively. At December 31, 2020, the length of foreign exchange contracts currently in place ranged from
15 days to 20 months.
We are exposed to risk from credit-related losses resulting from nonperformance by counterparties to our
financial instruments. We perform credit evaluations of our counterparties under forward exchange contracts and
expect all counterparties to meet their obligations. We have not experienced credit losses from our counterparties.
The fair values of foreign exchange contracts are summarized below:
Year Ended December 31,
2020 2019
(Amounts in thousands)
Current derivative assets . . . . . . . . . . . . . . . . . . . . . . . . . . . . . . . . . . . . . . . . . . . . . . . . . . . . $2,857 $ 892
Noncurrent derivative assets . . . . . . . . . . . . . . . . . . . . . . . . . . . . . . . . . . . . . . . . . . . . . . . . . 249 15
Current derivative liabilities . . . . . . . . . . . . . . . . . . . . . . . . . . . . . . . . . . . . . . . . . . . . . . . . . 682 3,418
Noncurrent derivative liabilities . . . . . . . . . . . . . . . . . . . . . . . . . . . . . . . . . . . . . . . . . . . . . . — 8
Current and noncurrent derivative assets are reported in our consolidated balance sheets in prepaid expenses and
other and other assets, net, respectively. Current and noncurrent derivative liabilities are reported in our consolidated
balance sheets in accrued liabilities and retirement obligations and other liabilities, respectively.
The impact of net changes in the fair values of foreign exchange contracts are summarized below:
Year Ended December 31,
2020 2019 2018
(Amounts in thousands)
Loss recognized in income . . . . . . . . . . . . . . . . . . . . . . . . . . . . . . . . . . . . . . . . . . . . . $(10,294) $(6,495) $(3,154)
Gains and losses recognized in our consolidated statements of income for foreign exchange contracts are
classified as other income (expense), net.
On September 22, 2020, as a means of managing the volatility of foreign currency exposure with the Euro/U.S.
dollar exchange rate, we entered into a cross-currency swap (‘‘Swap’’) associated with our Euro investment in certain
of our international subsidiaries and was designated as a net investment hedge. We exclude the interest accruals on
the swap from the assessment of hedge effectiveness and recognize the interest accruals in earnings within interest
expense. For each reporting period, the change in the fair value of the swap attributable to changes in the spot rate
and differences between the change in the fair value of the excluded components and the amounts recognized in
earnings under the swap accrual process are reported in accumulated other comprehensive loss on our consolidated
82

balance sheet. As of December 31, 2020, the notional value of the Swap was €163.2 million and has an early
termination date of September 2025. The swap is included in retirement obligations and other liabilities in our
consolidated balance sheet as of December 31, 2020, with a fair value of $18.1 million and is classified as Level II
under the fair value hierarchy. For the period ending December 31, 2020, an interest accrual of $(0.6) million was
recognized as other income (expense), net, in our consolidated statements of income.
The cumulative net investment hedge loss, net of deferred taxes, under cross-currency swap recorded in
accumulated other comprehensive loss (‘‘AOCL’’) on our consolidated balance sheet are summarized below:
Year Ended December 31,
2020 2019 2018
(Amounts in thousands)
Loss recognized in AOCL . . . . . . . . . . . . . . . . . . . . . . . . . . . . . . . . . . . . . . . . . . . . . . $(13,836) $— $—
In March 2015, we designated €255.7 million of our 1.25% EUR Senior Notes due 2022 (‘‘2022 Euro Senior
Notes’’) discussed in Note 13 as a net investment hedge of our Euro investment in certain of our international
subsidiaries. On September 22, 2020, we increased the designated hedged value on the 2022 Euro Senior Notes to
€336.3 million, which reflects the remaining balance of the 2022 Euro Senior Notes following the closing of the
previously announced tender offer for the 2022 Euro Senior Notes on the same date. For each reporting period, the
change in the carrying value due to the remeasurement of the effective portion is reported in accumulated other
comprehensive loss on our consolidated balance sheet and the remaining change in the carrying value of the
ineffective portion, if any, is recognized in other income (expense), net in our consolidated statement of income.
The cumulative impact recorded in AOCL on our consolidated balance sheet from the change in carrying value
due to the remeasurement of the effective portion of the net investment hedge are summarized below:
Year Ended December 31,
2020 2019 2018
(Amounts in thousands)
Loss recorded in AOCL. . . . . . . . . . . . . . . . . . . . . . . . . . . . . . . . . . . . . . . . . . . . . . . . (34,973) (12,084) (17,164)
We use the spot method to measure the effectiveness of both of the net investment hedges and evaluate the
effectiveness on a prospective basis at the beginning of each quarter. We did not record any ineffectiveness for the
years ended December 31, 2020, 2019 or 2018.
10. FAIR VALUE OF FINANCIAL INSTRUMENTS
Our financial instruments are presented at fair value in our consolidated balance sheets. Fair value is defined as
the price that would be received to sell an asset or paid to transfer a liability in an orderly transaction between market
participants at the measurement date. Where available, fair value is based on observable market prices or parameters
or derived from such prices or parameters. Where observable prices or inputs are not available, valuation models may
be applied. Assets and liabilities recorded at fair value in our consolidated balance sheets are categorized based upon
the level of judgment associated with the inputs used to measure their fair values. Recurring fair value measurements
are limited to investments in derivative instruments and some equity securities. The fair value measurements of our
derivative instruments are determined using models that maximize the use of the observable market inputs including
interest rate curves and both forward and spot prices for currencies, and are classified as Level II under the fair value
hierarchy. The fair values of our derivatives are included above in Note 9. The fair value measurements of our
investments in equity securities are determined using quoted market prices and are classified as Level I. The fair
values of our investments in equity securities, and changes thereto, are immaterial to our consolidated financial
position and results of operations.
The carrying value of our debt is included in Note 13 and, except for the Senior Notes, approximates fair value.
The estimated fair value of the Senior Notes is based on Level I quoted market rates. The estimated fair value of our
Senior Notes at December 31, 2020 was $1,778.4 million compared to the carrying value of $1,701.5 million. The
carrying amounts of our other financial instruments (i.e., cash and cash equivalents, accounts receivable, net and
accounts payable) approximated fair value due to their short-term nature at December 31, 2020 and December 31,
2019.
83

11. DETAILS OF CERTAIN CONSOLIDATED BALANCE SHEET CAPTIONS
The following tables present financial information of certain consolidated balance sheet captions.
Accounts Receivable, net — Accounts receivable, net were:
December 31,
2020 2019
(Amounts in thousands)
Trade accounts receivables . . . . . . . . . . . . . . . . . . . . . . . . . . . . . . . . . . . . . . . . . . . . . . . . . . $808,459 $830,919Less: allowance for doubtful accounts . . . . . . . . . . . . . . . . . . . . . . . . . . . . . . . . . . . . . . . . . (59,280) (47,269)
Other short-term receivables . . . . . . . . . . . . . . . . . . . . . . . . . . . . . . . . . . . . . . . . . . . . . . . . . 20,179 18,031Less: allowance for doubtful accounts . . . . . . . . . . . . . . . . . . . . . . . . . . . . . . . . . . . . . . . . . (15,896) (6,143)
Accounts receivable, net . . . . . . . . . . . . . . . . . . . . . . . . . . . . . . . . . . . . . . . . . . . . . . . . . . . . $753,462 $795,538
Property, Plant and Equipment, net — Property, plant and equipment, net were:
December 31,
2020 2019
(Amounts in thousands)
Land . . . . . . . . . . . . . . . . . . . . . . . . . . . . . . . . . . . . . . . . . . . . . . . . . . . . . . . . . . . . . . . . . . . . $ 65,894 $ 64,778Buildings and improvements. . . . . . . . . . . . . . . . . . . . . . . . . . . . . . . . . . . . . . . . . . . . . . . . . 446,008 419,454Machinery, equipment and tooling . . . . . . . . . . . . . . . . . . . . . . . . . . . . . . . . . . . . . . . . . . . . 699,256 666,376Software, furniture and fixtures and other . . . . . . . . . . . . . . . . . . . . . . . . . . . . . . . . . . . . . . 439,063 427,866
Gross property, plant and equipment . . . . . . . . . . . . . . . . . . . . . . . . . . . . . . . . . . . . . . . . . . 1,650,221 1,578,474Less: accumulated depreciation . . . . . . . . . . . . . . . . . . . . . . . . . . . . . . . . . . . . . . . . . . . . . . (1,093,348) (1,014,910)
Property, plant and equipment, net . . . . . . . . . . . . . . . . . . . . . . . . . . . . . . . . . . . . . . . . . . . . $ 556,873 $ 563,564
Accrued Liabilities — Accrued liabilities were:
December 31,
2020 2019
(Amounts in thousands)
Wages, compensation and other benefits . . . . . . . . . . . . . . . . . . . . . . . . . . . . . . . . . . . . . . . $225,133 $192,354Commissions and royalties . . . . . . . . . . . . . . . . . . . . . . . . . . . . . . . . . . . . . . . . . . . . . . . . . . 22,847 23,027Warranty costs and late delivery penalties . . . . . . . . . . . . . . . . . . . . . . . . . . . . . . . . . . . . . . 27,757 30,625Sales and use tax . . . . . . . . . . . . . . . . . . . . . . . . . . . . . . . . . . . . . . . . . . . . . . . . . . . . . . . . . . 29,067 18,146Income tax . . . . . . . . . . . . . . . . . . . . . . . . . . . . . . . . . . . . . . . . . . . . . . . . . . . . . . . . . . . . . . . 31,378 20,018Other . . . . . . . . . . . . . . . . . . . . . . . . . . . . . . . . . . . . . . . . . . . . . . . . . . . . . . . . . . . . . . . . . . . 127,040 117,215
Accrued liabilities . . . . . . . . . . . . . . . . . . . . . . . . . . . . . . . . . . . . . . . . . . . . . . . . . . . . . . . . . $463,222 $401,385
‘‘Other’’ accrued liabilities include professional fees, lease obligations, insurance, interest, freight, accrued cash
dividends payable, legal and environmental matters, derivative liabilities, restructuring reserves and other items, none
of which individually exceed 5% of current liabilities.
Retirement Obligations and Other Liabilities — Retirement obligations and other liabilities were:
December 31,
2020 2019
(Amounts in thousands)
Pension and postretirement benefits . . . . . . . . . . . . . . . . . . . . . . . . . . . . . . . . . . . . . . . . . . . $225,994 $199,603Deferred taxes . . . . . . . . . . . . . . . . . . . . . . . . . . . . . . . . . . . . . . . . . . . . . . . . . . . . . . . . . . . . 84,345 149,633Operating lease liabilities . . . . . . . . . . . . . . . . . . . . . . . . . . . . . . . . . . . . . . . . . . . . . . . . . . . 176,246 151,523Legal and environmental. . . . . . . . . . . . . . . . . . . . . . . . . . . . . . . . . . . . . . . . . . . . . . . . . . . . 101,203 99,744Uncertain tax positions and other tax liabilities. . . . . . . . . . . . . . . . . . . . . . . . . . . . . . . . . . 50,259 42,086Other . . . . . . . . . . . . . . . . . . . . . . . . . . . . . . . . . . . . . . . . . . . . . . . . . . . . . . . . . . . . . . . . . . . 54,286 39,928
Retirement obligations and other liabilities . . . . . . . . . . . . . . . . . . . . . . . . . . . . . . . . . . . . . $692,333 $682,517
84

12. EQUITY METHOD INVESTMENTS
We occasionally enter into joint venture arrangements with local country partners as our preferred means of
entry into countries where barriers to entry may exist. Similar to our consolidated subsidiaries, these unconsolidated
joint ventures generally operate within our primary businesses of designing, manufacturing, assembling and
distributing fluid motion and control products and services. We have agreements with certain of these joint ventures
that restrict us from otherwise entering the respective market and certain joint ventures produce and/or sell our
products as part of their broader product offering. Net earnings from investments in unconsolidated joint ventures is
reported in net earnings from affiliates in our consolidated statements of income. Given the integrated role of the
unconsolidated joint ventures in our business, net earnings from affiliates is presented as a component of operating
income.
As of December 31, 2020, we had investments in six joint ventures, one located in each of Chile, China, India,
Saudi Arabia, South Korea and the United Arab Emirates that were accounted for using the equity method and are
immaterial for disclosure purposes.
13. DEBT AND FINANCE LEASE OBLIGATIONS
Debt, including finance lease obligations, consisted of:
December 31,
2020 2019
(Amounts in thousands)
1.25% EUR Senior Notes due March 17, 2022, net of unamortized discount and debt
issuance costs of $1,070 and $2,653 at December 31, 2020 and 2019, respectively . . $ 410,243 $ 557,847
3.50% USD Senior Notes due September 15, 2022, net of unamortized discount and
debt issuance costs of $1,235 and $1,924 at December 31, 2020 and 2019,
respectively . . . . . . . . . . . . . . . . . . . . . . . . . . . . . . . . . . . . . . . . . . . . . . . . . . . . . . . . . . . . 498,765 498,076
4.00% USD Senior Notes due November 15, 2023, net of unamortized discount and
debt issuance costs of $1,345 and $1,777 at December 31, 2020 and 2019,
respectively . . . . . . . . . . . . . . . . . . . . . . . . . . . . . . . . . . . . . . . . . . . . . . . . . . . . . . . . . . . . 298,655 298,223
3.50% USD Senior Notes due October 1, 2030, net of unamortized discount and debt
issuance costs of $6,147 of December 31, 2020 . . . . . . . . . . . . . . . . . . . . . . . . . . . . . . . 493,853 —
Finance lease obligations and other borrowings . . . . . . . . . . . . . . . . . . . . . . . . . . . . . . . . . 25,390 23,103
Debt and finance lease obligations . . . . . . . . . . . . . . . . . . . . . . . . . . . . . . . . . . . . . . . . . . . . 1,726,906 1,377,249
Less amounts due within one year . . . . . . . . . . . . . . . . . . . . . . . . . . . . . . . . . . . . . . . . . . . . 8,995 11,272
Total debt due after one year . . . . . . . . . . . . . . . . . . . . . . . . . . . . . . . . . . . . . . . . . . . . . . . . $1,717,911 $1,365,977
Scheduled maturities of our Senior Notes and other debt, are (amounts in thousands):
2021. . . . . . . . . . . . . . . . . . . . . . . . . . . . . . . . . . . . . . . . . . . . . . . . . . . . . . . . . . . . . . . . . . . . . . . . . . . . . . $ 8,995
2022. . . . . . . . . . . . . . . . . . . . . . . . . . . . . . . . . . . . . . . . . . . . . . . . . . . . . . . . . . . . . . . . . . . . . . . . . . . . . . 925,403
2023. . . . . . . . . . . . . . . . . . . . . . . . . . . . . . . . . . . . . . . . . . . . . . . . . . . . . . . . . . . . . . . . . . . . . . . . . . . . . . 298,655
Thereafter . . . . . . . . . . . . . . . . . . . . . . . . . . . . . . . . . . . . . . . . . . . . . . . . . . . . . . . . . . . . . . . . . . . . . . . . . 493,853
Total. . . . . . . . . . . . . . . . . . . . . . . . . . . . . . . . . . . . . . . . . . . . . . . . . . . . . . . . . . . . . . . . . . . . . . . . . . . . . . $1,726,906
Senior Notes
On September 14, 2020, we completed a public offering of $500.0 million in aggregate principal amount of
senior notes due October 1, 2030 (‘‘2030 Senior Notes’’). The 2030 Senior Notes bear an interest rate of 3.50% per
year, payable on April 1 and October 1 of each year, commencing on April 1, 2021. The 2030 Senior Notes were
priced at 99.656% of par value, reflecting a discount to the aggregate principal amount. We used a portion of the net
proceeds of the 2030 Senior Notes offering to fund a partial tender offer of our 2022 Euro Senior Notes. During the
third quarter of 2020 we had tendered $191.4 million of our 2022 Euro Senior Notes and have recorded in interest
expense an early extinguishment loss of $1.2 million. On February 17, 2021, we announced that we will redeem the
outstanding balance of our 2022 Euro Senior Notes on March 19, 2021. We will use the remaining net proceeds from
the public offering of the 2030 Senior Notes for the redemption.
85

On March 17, 2015, we completed a public offering of €500.0 million of Euro senior notes in aggregate principal
amount due March 17, 2022. The 2022 Euro Senior Notes bear an interest rate of 1.25% per year, payable each year
on March 17. The 2022 Euro Senior Notes were priced at 99.336% of par value, reflecting a discount to the aggregate
principal amount.
On November 1, 2013 we completed the public offering of $300.0 million in aggregate principal amount of
senior notes due November 15, 2023 (‘‘2023 Senior Notes’’). The 2023 Senior Notes bear an interest rate of 4.00%
per year, payable on May 15 and November 15 of each year. The 2023 Senior Notes were priced at 99.532% of par
value, reflecting a discount to the aggregate principal amount.
On September 11, 2012, we completed the public offering of $500.0 million in aggregate principal amount of
senior notes due September 15, 2022 (‘‘2022 Senior Notes’’). The 2022 Senior Notes bear an interest rate of 3.50%
per year, payable on March 15 and September 15 of each year. The 2022 Senior Notes were priced at 99.615% of
par value, reflecting a discount to the aggregate principal amount.
We have the right to redeem the 2022 Senior Notes, 2023 Senior Notes and 2030 Senior notes at any time prior
to June 15, 2022, August 15, 2023 and July 1, 2030, respectively, in whole or in part, at our option, at a redemption
price equal to the greater of: (1) 100% of the principal amount of the senior notes being redeemed; or (2) the sum
of the present values of the remaining scheduled payments of principal and interest in respect of the Senior Notes
being redeemed discounted to the redemption date on a semi-annual basis, at the applicable Treasury Rate plus
30 basis points for the 2022 Senior Notes, plus 25 basis points for the 2023 Senior Notes and plus 45 basis points
for the 2030 Senior Notes. In addition, at any time on or after June 15, 2022 for the 2022 Senior Notes, August 15,
2023 for the 2023 Senior Notes and July 1 2030 for the 2030 Senior Notes, we may redeem the Senior Notes at a
redemption price equal to 100% of the principal amount of the Senior Notes being redeemed. In each case, we will
also pay the accrued and unpaid interest on the principal amount being redeemed to the redemption date.
We have the right to redeem the 2022 Euro Senior Notes at any time prior to December 17, 2021, in whole or
in part, at our option, at a redemption price equal to the greater of: (1) 100% of the principal amount of the senior
notes being redeemed; or (2) the sum of the present values of the remaining scheduled payments of principal and
interest in respect of the Senior Notes being redeemed (exclusive of interest accrued to, but excluding, the date of
redemption) discounted to the redemption date on an annual basis, at the Comparable German Government Bond
Rate plus 25 basis points. At any time on or after December 17, 2021, we may redeem the 2022 Euro Senior Notes,
in whole or in part from time to time, at our option, at a redemption price equal to 100% of the principal amount of
the notes to be redeemed.
Senior Credit Facility
On September 4, 2020, we amended our credit agreement with Bank of America, N.A., as administrative agent,
and the other lenders party thereto (‘‘Amended Credit Agreement’’) to provide greater flexibility in maintaining
adequate liquidity in the event we have the need to access available borrowings under our Senior Credit Facility
(‘‘Credit Facility’’). The Credit Agreement provides for a $800.0 million unsecured senior credit facility with a
maturity date of July 16, 2024 (‘‘Senior Credit Facility’’). The Senior Credit Facility includes a $750.0 million
sublimit for the issuance of letters of credit and a $30.0 million sublimit for swing line loans. We have the right to
increase the amount of the Senior Credit Facility by an aggregate amount not to exceed $400.0 million, subject to
certain conditions, including each Lender’s approval providing any increase.
The Amended Credit Agreement, among other things, (i) replaces the existing leverage ratio financial covenant
(the ‘‘Existing Leverage Covenant’’) with a leverage ratio financial covenant that requires the Company’s ratio of
consolidated funded indebtedness, minus the amount of all cash and cash equivalents on our balance sheet in excess
of $250.0 million, to the Company’s Consolidated EBITDA, not to exceed 4.00 to 1.00 as of the last day of any
quarter through and including December 31, 2021 (the ‘‘Covenant Relief Period’’), (ii) amends the Existing Leverage
Covenant to provide that it will not be tested until the quarter ending March 31, 2022, (iii) provides that the Existing
Leverage Covenant, beginning March 31, 2022, cannot exceed 4.00 to 1.00 (or as increased to 4.50 to 1.00 in
connection with certain acquisitions) and (iv) limits the Company’s ability to pay dividends and repurchase its shares
of common stock, par value $1.25, during the Covenant Relief Period, to an amount not to exceed 115% of the total
amount of dividends and share repurchases we made during the period commencing January 1, 2019 through and
including June 30, 2020.
The interest rates per annum applicable to the Senior Credit Facility (other than with respect to swing line loans)
are LIBOR plus between 1.000% to 1.750%, depending on our debt rating by either Moody’s Investors Service, Inc.
86
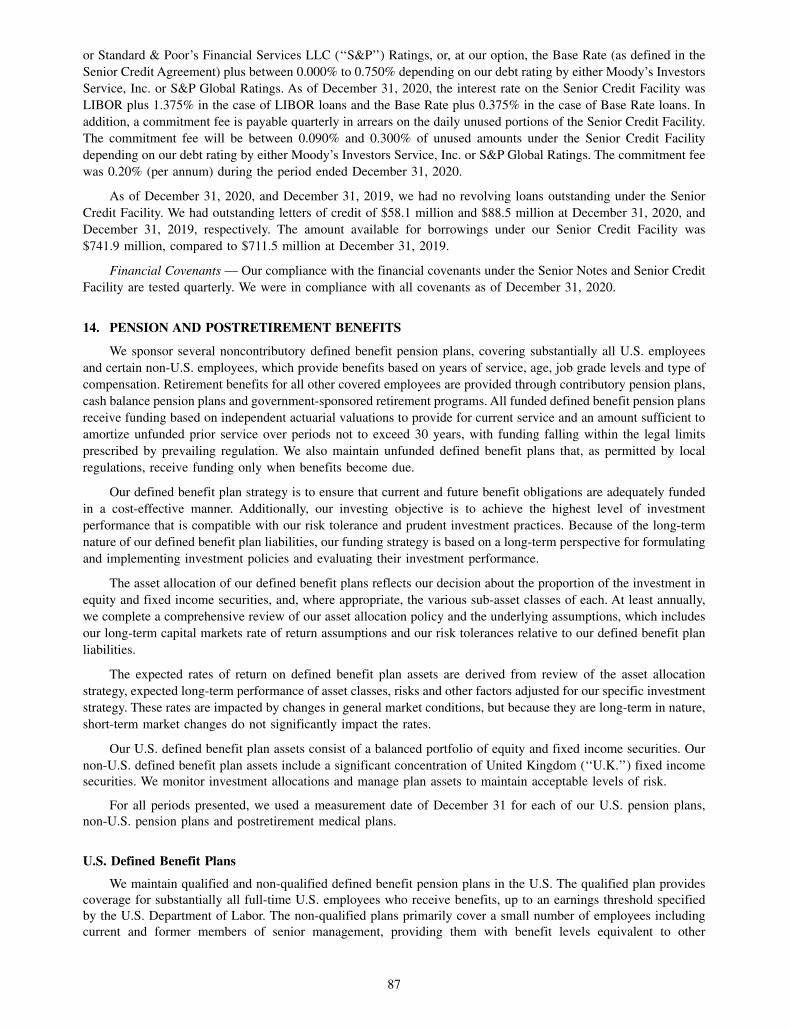
or Standard & Poor’s Financial Services LLC (‘‘S&P’’) Ratings, or, at our option, the Base Rate (as defined in the
Senior Credit Agreement) plus between 0.000% to 0.750% depending on our debt rating by either Moody’s Investors
Service, Inc. or S&P Global Ratings. As of December 31, 2020, the interest rate on the Senior Credit Facility was
LIBOR plus 1.375% in the case of LIBOR loans and the Base Rate plus 0.375% in the case of Base Rate loans. In
addition, a commitment fee is payable quarterly in arrears on the daily unused portions of the Senior Credit Facility.
The commitment fee will be between 0.090% and 0.300% of unused amounts under the Senior Credit Facility
depending on our debt rating by either Moody’s Investors Service, Inc. or S&P Global Ratings. The commitment fee
was 0.20% (per annum) during the period ended December 31, 2020.
As of December 31, 2020, and December 31, 2019, we had no revolving loans outstanding under the Senior
Credit Facility. We had outstanding letters of credit of $58.1 million and $88.5 million at December 31, 2020, and
December 31, 2019, respectively. The amount available for borrowings under our Senior Credit Facility was
$741.9 million, compared to $711.5 million at December 31, 2019.
Financial Covenants — Our compliance with the financial covenants under the Senior Notes and Senior Credit
Facility are tested quarterly. We were in compliance with all covenants as of December 31, 2020.
14. PENSION AND POSTRETIREMENT BENEFITS
We sponsor several noncontributory defined benefit pension plans, covering substantially all U.S. employees
and certain non-U.S. employees, which provide benefits based on years of service, age, job grade levels and type of
compensation. Retirement benefits for all other covered employees are provided through contributory pension plans,
cash balance pension plans and government-sponsored retirement programs. All funded defined benefit pension plans
receive funding based on independent actuarial valuations to provide for current service and an amount sufficient to
amortize unfunded prior service over periods not to exceed 30 years, with funding falling within the legal limits
prescribed by prevailing regulation. We also maintain unfunded defined benefit plans that, as permitted by local
regulations, receive funding only when benefits become due.
Our defined benefit plan strategy is to ensure that current and future benefit obligations are adequately funded
in a cost-effective manner. Additionally, our investing objective is to achieve the highest level of investment
performance that is compatible with our risk tolerance and prudent investment practices. Because of the long-term
nature of our defined benefit plan liabilities, our funding strategy is based on a long-term perspective for formulating
and implementing investment policies and evaluating their investment performance.
The asset allocation of our defined benefit plans reflects our decision about the proportion of the investment in
equity and fixed income securities, and, where appropriate, the various sub-asset classes of each. At least annually,
we complete a comprehensive review of our asset allocation policy and the underlying assumptions, which includes
our long-term capital markets rate of return assumptions and our risk tolerances relative to our defined benefit plan
liabilities.
The expected rates of return on defined benefit plan assets are derived from review of the asset allocation
strategy, expected long-term performance of asset classes, risks and other factors adjusted for our specific investment
strategy. These rates are impacted by changes in general market conditions, but because they are long-term in nature,
short-term market changes do not significantly impact the rates.
Our U.S. defined benefit plan assets consist of a balanced portfolio of equity and fixed income securities. Our
non-U.S. defined benefit plan assets include a significant concentration of United Kingdom (‘‘U.K.’’) fixed income
securities. We monitor investment allocations and manage plan assets to maintain acceptable levels of risk.
For all periods presented, we used a measurement date of December 31 for each of our U.S. pension plans,
non-U.S. pension plans and postretirement medical plans.
U.S. Defined Benefit Plans
We maintain qualified and non-qualified defined benefit pension plans in the U.S. The qualified plan provides
coverage for substantially all full-time U.S. employees who receive benefits, up to an earnings threshold specified
by the U.S. Department of Labor. The non-qualified plans primarily cover a small number of employees including
current and former members of senior management, providing them with benefit levels equivalent to other
87

participants, but that are otherwise limited by U.S. Department of Labor rules. The U.S. plans are designed to operate
as ‘‘cash balance’’ arrangements, under which the employee has the option to take a lump sum payment at the end
of their service. The difference between total accumulated benefit obligation and total projected benefit obligation
(‘‘Benefit Obligation’’) is immaterial.
The following are assumptions related to the U.S. defined benefit pension plans:
Year Ended December 31,
2020 2019 2018
Weighted average assumptions used to determine Benefit Obligations:
Discount rate . . . . . . . . . . . . . . . . . . . . . . . . . . . . . . . . . . . . . . . . . . . . . . . . . . . . . . 2.62% 3.41% 4.34%
Rate of increase in compensation levels. . . . . . . . . . . . . . . . . . . . . . . . . . . . . . . . . 3.63 3.50 3.50
Weighted average assumptions used to determine net pension expense:
Long-term rate of return on assets . . . . . . . . . . . . . . . . . . . . . . . . . . . . . . . . . . . . . 6.00% 6.00% 6.00%
Discount rate . . . . . . . . . . . . . . . . . . . . . . . . . . . . . . . . . . . . . . . . . . . . . . . . . . . . . . 3.41 4.34 3.63
Rate of increase in compensation levels. . . . . . . . . . . . . . . . . . . . . . . . . . . . . . . . . 3.56 3.50 4.01
Weighted-average interest crediting rates . . . . . . . . . . . . . . . . . . . . . . . . . . . . . . . . . . 3.79% 3.79% 3.79%
At December 31, 2020 as compared with December 31, 2019, we decreased our discount rate from 3.41% to
2.62% based on an analysis of publicly-traded investment grade U.S. corporate bonds, which had a lower yield due
to current market conditions. In determining 2020 expense, the expected rate of return on U.S. plan assets remained
constant at 6.00%, primarily based on our target allocations and expected long-term asset returns. The long-term rate
of return assumption is calculated using a quantitative approach that utilizes unadjusted historical returns and asset
allocation as inputs for the calculation. For all U.S. plans, we adopted the Pri-2012 mortality tables and the MP-2020
improvement scale published in October 2020. We applied the Pri-2012 tables based on the constituency of our plan
population for union and non-union participants. We adjusted the improvement scale to utilize the Proxy SSA Long
Term Improvement Rates (‘‘LTIR’’), consistent with assumptions adopted by the Social Security Administration
trustees, based on long-term historical experience. Currently, we believe this approach provides the best estimate of
our future obligation. Most plan participants elect to receive plan benefits as a lump sum at the end of service, rather
than an annuity. As such, the updated mortality tables had an immaterial effect on our pension obligation.
Net pension expense for the U.S. defined benefit pension plans (including both qualified and non-qualified
plans) was:
Year Ended December 31,
2020 2019 2018
(Amounts in thousands)
Service cost . . . . . . . . . . . . . . . . . . . . . . . . . . . . . . . . . . . . . . . . . . . . . . . . . . . . . . . . . $ 25,893 $ 23,245 $ 22,195
Interest cost . . . . . . . . . . . . . . . . . . . . . . . . . . . . . . . . . . . . . . . . . . . . . . . . . . . . . . . . . 15,100 17,584 15,789
Expected return on plan assets . . . . . . . . . . . . . . . . . . . . . . . . . . . . . . . . . . . . . . . . . . (25,794) (25,645) (25,704)
Settlement loss (gain) . . . . . . . . . . . . . . . . . . . . . . . . . . . . . . . . . . . . . . . . . . . . . . . . . 128 — (462)
Amortization of unrecognized prior service cost . . . . . . . . . . . . . . . . . . . . . . . . . . . . 184 164 164
Amortization of unrecognized net loss . . . . . . . . . . . . . . . . . . . . . . . . . . . . . . . . . . . . 6,977 3,675 5,514
U.S. net pension expense. . . . . . . . . . . . . . . . . . . . . . . . . . . . . . . . . . . . . . . . . . . . . . . $ 22,488 $ 19,023 $ 17,496
The following summarizes the net pension (liability) asset for U.S. plans:
December 31,
2020 2019
(Amounts in thousands)
Plan assets, at fair value . . . . . . . . . . . . . . . . . . . . . . . . . . . . . . . . . . . . . . . . . . . . . . . . . . . . $ 477,680 $ 482,553
Benefit Obligation . . . . . . . . . . . . . . . . . . . . . . . . . . . . . . . . . . . . . . . . . . . . . . . . . . . . . . . . . (487,418) (471,462)
Funded status . . . . . . . . . . . . . . . . . . . . . . . . . . . . . . . . . . . . . . . . . . . . . . . . . . . . . . . . . . . . . $ (9,738) $ 11,091
88

The following summarizes amounts recognized in the balance sheet for U.S. plans:
December 31,
2020 2019
(Amounts in thousands)
Noncurrent assets. . . . . . . . . . . . . . . . . . . . . . . . . . . . . . . . . . . . . . . . . . . . . . . . . . . . . . . . . . $ — $16,396
Current liabilities . . . . . . . . . . . . . . . . . . . . . . . . . . . . . . . . . . . . . . . . . . . . . . . . . . . . . . . . . . (233) (348)
Noncurrent liabilities . . . . . . . . . . . . . . . . . . . . . . . . . . . . . . . . . . . . . . . . . . . . . . . . . . . . . . . (9,505) (4,957)
Funded status . . . . . . . . . . . . . . . . . . . . . . . . . . . . . . . . . . . . . . . . . . . . . . . . . . . . . . . . . . . . . $(9,738) $11,091
The following is a summary of the changes in the U.S. defined benefit plans’ pension obligations:
December 31,
2020 2019
(Amounts in thousands)
Balance — January 1 . . . . . . . . . . . . . . . . . . . . . . . . . . . . . . . . . . . . . . . . . . . . . . . . . . . . . . $471,462 $432,595
Service cost . . . . . . . . . . . . . . . . . . . . . . . . . . . . . . . . . . . . . . . . . . . . . . . . . . . . . . . . . . . . 25,893 23,245
Interest cost . . . . . . . . . . . . . . . . . . . . . . . . . . . . . . . . . . . . . . . . . . . . . . . . . . . . . . . . . . . . 15,100 17,584
Plan amendments and settlements . . . . . . . . . . . . . . . . . . . . . . . . . . . . . . . . . . . . . . . . . . (953) 276
Actuarial losses(1) . . . . . . . . . . . . . . . . . . . . . . . . . . . . . . . . . . . . . . . . . . . . . . . . . . . . . . . 29,166 31,214
Benefits paid . . . . . . . . . . . . . . . . . . . . . . . . . . . . . . . . . . . . . . . . . . . . . . . . . . . . . . . . . . . (53,250) (33,452)
Balance — December 31 . . . . . . . . . . . . . . . . . . . . . . . . . . . . . . . . . . . . . . . . . . . . . . . . . . . $487,418 $471,462
Accumulated benefit obligations at December 31 . . . . . . . . . . . . . . . . . . . . . . . . . . . . . . . . $486,501 $470,643
(1) The actuarial losses in 2020 and 2019 primarily reflect the impact of changes in the discount rate.
The following table summarizes the expected cash benefit payments for the U.S. defined benefit pension plans
in the future (amounts in millions):
2021. . . . . . . . . . . . . . . . . . . . . . . . . . . . . . . . . . . . . . . . . . . . . . . . . . . . . . . . . . . . . . . . . . . . . . . . . . . . . . $ 43.3
2022. . . . . . . . . . . . . . . . . . . . . . . . . . . . . . . . . . . . . . . . . . . . . . . . . . . . . . . . . . . . . . . . . . . . . . . . . . . . . . 42.2
2023. . . . . . . . . . . . . . . . . . . . . . . . . . . . . . . . . . . . . . . . . . . . . . . . . . . . . . . . . . . . . . . . . . . . . . . . . . . . . . 42.8
2024. . . . . . . . . . . . . . . . . . . . . . . . . . . . . . . . . . . . . . . . . . . . . . . . . . . . . . . . . . . . . . . . . . . . . . . . . . . . . . 41.2
2025. . . . . . . . . . . . . . . . . . . . . . . . . . . . . . . . . . . . . . . . . . . . . . . . . . . . . . . . . . . . . . . . . . . . . . . . . . . . . . 42.4
2026-2030 . . . . . . . . . . . . . . . . . . . . . . . . . . . . . . . . . . . . . . . . . . . . . . . . . . . . . . . . . . . . . . . . . . . . . . . . . 196.3
The following table shows the change in accumulated other comprehensive loss attributable to the components
of the net cost and the change in Benefit Obligations for U.S. plans, net of tax:
December 31,
2020 2019
(Amounts in thousands)
Balance — January 1 . . . . . . . . . . . . . . . . . . . . . . . . . . . . . . . . . . . . . . . . . . . . . . . . . . . . . . $(49,510) $(62,018)
Amortization of net loss . . . . . . . . . . . . . . . . . . . . . . . . . . . . . . . . . . . . . . . . . . . . . . . . . . 5,336 2,809
Amortization of prior service cost . . . . . . . . . . . . . . . . . . . . . . . . . . . . . . . . . . . . . . . . . . 140 125
Net (loss) gain arising during the year. . . . . . . . . . . . . . . . . . . . . . . . . . . . . . . . . . . . . . . (5,328) 9,785
Settlement gain . . . . . . . . . . . . . . . . . . . . . . . . . . . . . . . . . . . . . . . . . . . . . . . . . . . . . . . . . 98 —
Prior service cost arising during the year. . . . . . . . . . . . . . . . . . . . . . . . . . . . . . . . . . . . . (57) (211)
Balance — December 31 . . . . . . . . . . . . . . . . . . . . . . . . . . . . . . . . . . . . . . . . . . . . . . . . . . . $(49,321) $(49,510)
89

Amounts recorded in accumulated other comprehensive loss consist of:
December 31,
2020 2019
(Amounts in thousands)
Unrecognized net loss . . . . . . . . . . . . . . . . . . . . . . . . . . . . . . . . . . . . . . . . . . . . . . . . . . . . . . $(48,460) $(48,578)
Unrecognized prior service cost . . . . . . . . . . . . . . . . . . . . . . . . . . . . . . . . . . . . . . . . . . . . . . (861) (932)
Accumulated other comprehensive loss, net of tax . . . . . . . . . . . . . . . . . . . . . . . . . . . . . . . $(49,321) $(49,510)
The following is a reconciliation of the U.S. defined benefit pension plans’ assets:
December 31,
2020 2019
(Amounts in thousands)
Balance — January 1 . . . . . . . . . . . . . . . . . . . . . . . . . . . . . . . . . . . . . . . . . . . . . . . . . . . . . . $482,553 $425,792
Return on plan assets . . . . . . . . . . . . . . . . . . . . . . . . . . . . . . . . . . . . . . . . . . . . . . . . . . . . 47,992 69,663
Company contributions . . . . . . . . . . . . . . . . . . . . . . . . . . . . . . . . . . . . . . . . . . . . . . . . . . . 1,412 20,552
Benefits paid . . . . . . . . . . . . . . . . . . . . . . . . . . . . . . . . . . . . . . . . . . . . . . . . . . . . . . . . . . . (53,250) (33,454)
Settlements. . . . . . . . . . . . . . . . . . . . . . . . . . . . . . . . . . . . . . . . . . . . . . . . . . . . . . . . . . . . . (1,027) —
Balance — December 31 . . . . . . . . . . . . . . . . . . . . . . . . . . . . . . . . . . . . . . . . . . . . . . . . . . . $477,680 $482,553
We contributed $1.4 million and $20.6 million to the U.S. defined benefit pension plans during 2020 and 2019,
respectively. These payments exceeded the minimum funding requirements mandated by the U.S. Department of
Labor rules. Our estimated contribution in 2021 is expected to be approximately $20 million, excluding direct
benefits paid.
All U.S. defined benefit plan assets are held by the qualified plan. The asset allocations for the qualified plan
at the end of 2020 and 2019 by asset category, are as follows:
Target Allocationat December 31,
Percentage of Actual Plan Assetsat December 31,
Asset category 2020 2019 2020 2019
Cash and cash equivalents. . . . . . . . . . . . . . . . . . . . . . . . . . . . . . . . . . —% —% 1% 1%
Cash and cash equivalents. . . . . . . . . . . . . . . . . . . . . . . . . . . . . . . . —% —% 1% 1%
Global Equity . . . . . . . . . . . . . . . . . . . . . . . . . . . . . . . . . . . . . . . . . . . . 31% 31% 30% 28%
Global Real Assets. . . . . . . . . . . . . . . . . . . . . . . . . . . . . . . . . . . . . . . . 12% 12% 13% 12%
Equity securities. . . . . . . . . . . . . . . . . . . . . . . . . . . . . . . . . . . . . . . . 43% 43% 43% 40%
Diversified Credit. . . . . . . . . . . . . . . . . . . . . . . . . . . . . . . . . . . . . . . . . 12% 12% 14% 12%
Liability-Driven Investment. . . . . . . . . . . . . . . . . . . . . . . . . . . . . . . . . 45% 45% 42% 47%
Fixed income . . . . . . . . . . . . . . . . . . . . . . . . . . . . . . . . . . . . . . . . . . 57% 57% 56% 59%
None of our common stock is directly held by our qualified plan. Our investment strategy is to earn a long-term
rate of return consistent with an acceptable degree of risk and minimize our cash contributions over the life of the
plan, while taking into account the liquidity needs of the plan. We preserve capital through diversified investments
in high quality securities. Our current allocation target is to invest approximately 43% of plan assets in equity
securities and 57% in fixed income securities. Within each investment category, assets are allocated to various
investment strategies. Professional money management firms manage our assets, and we engage a consultant to assist
in evaluating these activities. We periodically review the allocation target, generally in conjunction with an asset and
liability study and in consideration of our future cash flow needs. We regularly rebalance the actual allocation to our
target investment allocation.
Plan assets are invested in commingled funds. Our ‘‘Pension and Investment Committee’’ is responsible for
setting the investment strategy and the target asset allocation for the plan’s assets. As the qualified plan approached
90

fully funded status, we implemented a Liability-Driven Investing (‘‘LDI’’) strategy, which more closely aligns the
duration of the plan’s assets with the duration of its liabilities. The LDI strategy results in an asset portfolio that more
closely matches the behavior of the liability, thereby reducing the volatility of the plan’s funded status.
The plan’s financial instruments, shown below, are presented at fair value. See Note 1 for further discussion on
how the hierarchical levels of the fair values of the Plan’s investments are determined. The fair values of our
U.S. defined benefit plan assets were:
At December 31, 2020 At December 31, 2019
Hierarchical Levels Hierarchical Levels
Total I II III Total I II III
(Amounts in thousands) (Amounts in thousands)
Cash and cash equivalents . . . . . . . . . . . . $ 5,986 $5,986 $ — $— $ 4,994 $4,994 $ — $—
Commingled Funds:
Equity securities
Global Equity(a) . . . . . . . . . . . . . . . . 142,401 — 142,401 — 135,350 — 135,350 —
Global Real Assets(b) . . . . . . . . . . . . 61,604 — 61,604 — 60,523 — 60,523 —
Fixed income securities
Diversified Credit(c) . . . . . . . . . . . . . 66,995 — 66,995 — 56,375 — 56,375 —
Liability-Driven Investment(d) . . . . . 200,694 — 200,694 — 225,311 — 225,311 —
$477,680 $5,986 $471,694 $— $482,553 $4,994 $477,559 $—
(a) Global Equity fund seeks to closely track the performance of the MSCI All Country World Index.
(b) Global Real Asset funds seek to provide exposure to the listed global real estate investment trusts (REITs) and infrastructure markets.
(c) Diversified Credit funds seek to provide exposure to the high yield, emerging markets, bank loans and securitized credit markets.
(d) Liability-Driven Investment (‘‘LDI’’) funds seek to invest in high quality fixed income securities that collectively closely match those found
in discount curves used to value the plan’s liabilities.
Non-U.S. Defined Benefit Plans
We maintain defined benefit pension plans, which cover some or all of our employees in the following countries:
Austria, Belgium, Canada, France, Germany, India, Italy, Japan, Mexico, The Netherlands, Sweden, Switzerland and
the U.K. The assets of the plans in the U.K. (two plans), The Netherlands and Canada represent 94% of the total
non-U.S. plan assets (‘‘non-U.S. assets’’). Details of other countries’ plan assets have not been provided due to
immateriality.
The following are assumptions related to the non-U.S. defined benefit pension plans:
Year Ended December 31,
2020 2019 2018
Weighted average assumptions used to determine Benefit Obligations:
Discount rate . . . . . . . . . . . . . . . . . . . . . . . . . . . . . . . . . . . . . . . . . . . . . . . . . . . . 1.23% 1.61% 2.42%
Rate of increase in compensation levels . . . . . . . . . . . . . . . . . . . . . . . . . . . . . . 3.11 3.12 3.28
Weighted average assumptions used to determine net pension expense:
Long-term rate of return on assets . . . . . . . . . . . . . . . . . . . . . . . . . . . . . . . . . . . 2.37% 3.37% 3.62%
Discount rate . . . . . . . . . . . . . . . . . . . . . . . . . . . . . . . . . . . . . . . . . . . . . . . . . . . . 1.61 2.42 2.25
Rate of increase in compensation levels . . . . . . . . . . . . . . . . . . . . . . . . . . . . . . 3.12 3.28 3.25
Weighted-average interest crediting rates. . . . . . . . . . . . . . . . . . . . . . . . . . . . . . . . 1.00% 1.00% 1.00%
At December 31, 2020, as compared with December 31, 2019, we decreased our average discount rate for
non-U.S. plans from 1.61% to 1.23% based on analysis of bonds and other publicly-traded instruments, by country,
which had lower yields due to market conditions. To determine 2020 pension expense, we decreased our average
expected rate of return on plan assets from 3.37% at December 31, 2019 to 2.37% at December 31, 2020, primarily
based on our target allocations and expected long-term asset returns. As the expected rate of return on plan assets is
long-term in nature, short-term market fluctuations do not significantly impact the rate.
91

Many of our non-U.S. defined benefit plans are unfunded, as permitted by local regulation. The expected
long-term rate of return on assets for funded plans was determined by assessing the rates of return for each asset class
and is calculated using a quantitative approach that utilizes unadjusted historical returns and asset allocation as inputs
for the calculation. We work with our actuaries to determine the reasonableness of our long-term rate of return
assumptions by looking at several factors including historical returns, expected future returns, asset allocation, risks
by asset class and other items.
Net pension expense for non-U.S. defined benefit pension plans was:
Year Ended December 31,
2020 2019 2018
(Amounts in thousands)
Service cost . . . . . . . . . . . . . . . . . . . . . . . . . . . . . . . . . . . . . . . . . . . . . . . . . . . . . . . $ 7,052 $ 5,728 $ 7,208Interest cost . . . . . . . . . . . . . . . . . . . . . . . . . . . . . . . . . . . . . . . . . . . . . . . . . . . . . . . 6,572 8,867 8,970Expected return on plan assets . . . . . . . . . . . . . . . . . . . . . . . . . . . . . . . . . . . . . . . . (5,018) (7,535) (8,747)Amortization of unrecognized net loss . . . . . . . . . . . . . . . . . . . . . . . . . . . . . . . . . 4,315 2,933 3,626Amortization of unrecognized prior service cost (benefit) . . . . . . . . . . . . . . . . . . 262 265 33Settlement loss (gain) and other . . . . . . . . . . . . . . . . . . . . . . . . . . . . . . . . . . . . . . . 708 859 (521)
Non-U.S. net pension expense . . . . . . . . . . . . . . . . . . . . . . . . . . . . . . . . . . . . . . . . $13,891 $11,117 $10,569
The following summarizes the net pension liability for non-U.S. plans:
December 31,
2020 2019
(Amounts in thousands)
Plan assets, at fair value . . . . . . . . . . . . . . . . . . . . . . . . . . . . . . . . . . . . . . . . . . . . . . . . . . . . $ 287,308 $ 262,559Benefit Obligation . . . . . . . . . . . . . . . . . . . . . . . . . . . . . . . . . . . . . . . . . . . . . . . . . . . . . . . . . (469,998) (425,617)
Funded status . . . . . . . . . . . . . . . . . . . . . . . . . . . . . . . . . . . . . . . . . . . . . . . . . . . . . . . . . . . . . $(182,690) $(163,058)
The following summarizes amounts recognized in the balance sheet for non-U.S. plans:
December 31,
2020 2019
\ (Amounts in thousands)
Noncurrent assets. . . . . . . . . . . . . . . . . . . . . . . . . . . . . . . . . . . . . . . . . . . . . . . . . . . . . . . . . . $ 18,910 $ 16,379Current liabilities . . . . . . . . . . . . . . . . . . . . . . . . . . . . . . . . . . . . . . . . . . . . . . . . . . . . . . . . . . (8,121) (7,609)Noncurrent liabilities . . . . . . . . . . . . . . . . . . . . . . . . . . . . . . . . . . . . . . . . . . . . . . . . . . . . . . . (193,479) (171,828)
Funded status . . . . . . . . . . . . . . . . . . . . . . . . . . . . . . . . . . . . . . . . . . . . . . . . . . . . . . . . . . . . . $(182,690) $(163,058)
The following is a reconciliation of the non-U.S. plans’ defined benefit pension obligations:
December 31,
2020 2019
(Amounts in thousands)
Balance — January 1 . . . . . . . . . . . . . . . . . . . . . . . . . . . . . . . . . . . . . . . . . . . . . . . . . . . . . . $425,617 $376,649Service cost . . . . . . . . . . . . . . . . . . . . . . . . . . . . . . . . . . . . . . . . . . . . . . . . . . . . . . . . . . . . . . 7,052 5,728Interest cost . . . . . . . . . . . . . . . . . . . . . . . . . . . . . . . . . . . . . . . . . . . . . . . . . . . . . . . . . . . . . . 6,572 8,867Employee contributions. . . . . . . . . . . . . . . . . . . . . . . . . . . . . . . . . . . . . . . . . . . . . . . . . . . . . 80 78Settlements and other . . . . . . . . . . . . . . . . . . . . . . . . . . . . . . . . . . . . . . . . . . . . . . . . . . . . . . (2,701) (3,713)Actuarial losses(1) . . . . . . . . . . . . . . . . . . . . . . . . . . . . . . . . . . . . . . . . . . . . . . . . . . . . . . . . . 23,781 48,888Net benefits and expenses paid. . . . . . . . . . . . . . . . . . . . . . . . . . . . . . . . . . . . . . . . . . . . . . . (15,700) (14,526)Currency translation impact(2). . . . . . . . . . . . . . . . . . . . . . . . . . . . . . . . . . . . . . . . . . . . . . . . 25,297 3,646
Balance — December 31 . . . . . . . . . . . . . . . . . . . . . . . . . . . . . . . . . . . . . . . . . . . . . . . . . . . $469,998 $425,617
Accumulated benefit obligations at December 31 . . . . . . . . . . . . . . . . . . . . . . . . . . . . . . . . $446,097 $404,035
(1) The 2019 actuarial loss primarily reflects the decrease in the discount rates for all plans.
(2) In 2020, the currency translation loss reflects the weakening of the U.S. dollar against the Euro and the British pound, while in 2019 thecurrency translation loss reflects the weakening of the U.S. dollar against the British pound, partially offset by the strengthening of the U.S.dollar against the Euro.
92

The following table summarizes the expected cash benefit payments for the non-U.S. defined benefit plans in
the future (amounts in millions):
2021. . . . . . . . . . . . . . . . . . . . . . . . . . . . . . . . . . . . . . . . . . . . . . . . . . . . . . . . . . . . . . . . . . . . . . . . . . . . . . $ 17.6
2022. . . . . . . . . . . . . . . . . . . . . . . . . . . . . . . . . . . . . . . . . . . . . . . . . . . . . . . . . . . . . . . . . . . . . . . . . . . . . . 18.1
2023. . . . . . . . . . . . . . . . . . . . . . . . . . . . . . . . . . . . . . . . . . . . . . . . . . . . . . . . . . . . . . . . . . . . . . . . . . . . . . 18.1
2024. . . . . . . . . . . . . . . . . . . . . . . . . . . . . . . . . . . . . . . . . . . . . . . . . . . . . . . . . . . . . . . . . . . . . . . . . . . . . . 19.1
2025. . . . . . . . . . . . . . . . . . . . . . . . . . . . . . . . . . . . . . . . . . . . . . . . . . . . . . . . . . . . . . . . . . . . . . . . . . . . . . 18.7
2026-2030 . . . . . . . . . . . . . . . . . . . . . . . . . . . . . . . . . . . . . . . . . . . . . . . . . . . . . . . . . . . . . . . . . . . . . . . . . 100.3
The following table shows the change in accumulated other comprehensive loss attributable to the components
of the net cost and the change in Benefit Obligations for non-U.S. plans, net of tax:
December 31,
2020 2019
(Amounts in thousands)
Balance — January 1 . . . . . . . . . . . . . . . . . . . . . . . . . . . . . . . . . . . . . . . . . . . . . . . . . . . . . . $(89,337) $(62,088)
Amortization of net loss . . . . . . . . . . . . . . . . . . . . . . . . . . . . . . . . . . . . . . . . . . . . . . . . . . 4,410 2,946
Net losses arising during the year . . . . . . . . . . . . . . . . . . . . . . . . . . . . . . . . . . . . . . . . . . (7,432) (29,910)
Settlement losses . . . . . . . . . . . . . . . . . . . . . . . . . . . . . . . . . . . . . . . . . . . . . . . . . . . . . . . . 681 746
Prior service cost arising during the year. . . . . . . . . . . . . . . . . . . . . . . . . . . . . . . . . . . . . (467) —
Currency translation impact and other . . . . . . . . . . . . . . . . . . . . . . . . . . . . . . . . . . . . . . . (5,101) (1,031)
Balance — December 31 . . . . . . . . . . . . . . . . . . . . . . . . . . . . . . . . . . . . . . . . . . . . . . . . . . . $(97,246) $(89,337)
Amounts recorded in accumulated other comprehensive loss consist of:
December 31,
2020 2019
(Amounts in thousands)
Unrecognized net loss . . . . . . . . . . . . . . . . . . . . . . . . . . . . . . . . . . . . . . . . . . . . . . . . . . . . . . $(93,417) $(85,891)
Unrecognized prior service cost . . . . . . . . . . . . . . . . . . . . . . . . . . . . . . . . . . . . . . . . . . . . . . (3,829) (3,446)
Accumulated other comprehensive loss, net of tax . . . . . . . . . . . . . . . . . . . . . . . . . . . . . . . $(97,246) $(89,337)
The following is a reconciliation of the non-U.S. plans’ defined benefit pension assets:
December 31,
2020 2019
(Amounts in thousands)
Balance — January 1 . . . . . . . . . . . . . . . . . . . . . . . . . . . . . . . . . . . . . . . . . . . . . . . . . . . . . . $262,559 $232,175
Return on plan assets . . . . . . . . . . . . . . . . . . . . . . . . . . . . . . . . . . . . . . . . . . . . . . . . . . . . 21,897 23,793
Employee contributions. . . . . . . . . . . . . . . . . . . . . . . . . . . . . . . . . . . . . . . . . . . . . . . . . . . 80 78
Company contributions . . . . . . . . . . . . . . . . . . . . . . . . . . . . . . . . . . . . . . . . . . . . . . . . . . . 11,279 16,782
Settlements. . . . . . . . . . . . . . . . . . . . . . . . . . . . . . . . . . . . . . . . . . . . . . . . . . . . . . . . . . . . . (2,939) (3,688)
Currency translation impact and other . . . . . . . . . . . . . . . . . . . . . . . . . . . . . . . . . . . . . . . 10,132 7,945
Net benefits and expenses paid. . . . . . . . . . . . . . . . . . . . . . . . . . . . . . . . . . . . . . . . . . . . . (15,700) (14,526)
Balance — December 31 . . . . . . . . . . . . . . . . . . . . . . . . . . . . . . . . . . . . . . . . . . . . . . . . . . . $287,308 $262,559
The 2020 and 2019 increase in the non-US plan assets is due to strong asset returns for UK assets. Our
contributions to non-U.S. defined benefit pension plans in 2021 are expected to be approximately $2 million,
excluding direct benefits paid.
93

The asset allocations for the non-U.S. defined benefit pension plans at the end of 2020 and 2019 are as follows:
Target Allocation atDecember 31,
Percentage of Actual PlanAssets at December 31,
Asset category 2020 2019 2020 2019
Cash and cash equivalents. . . . . . . . . . . . . . . . . . . . . . . . . . . . . . . . . . 1% 2% 1% 2%
Cash and cash equivalents. . . . . . . . . . . . . . . . . . . . . . . . . . . . . . . . 1% 2% 1% 2%
North American Companies . . . . . . . . . . . . . . . . . . . . . . . . . . . . . . . . 1% 1% 1% 1%
Global Equity . . . . . . . . . . . . . . . . . . . . . . . . . . . . . . . . . . . . . . . . . . . . 1% 1% 1% 1%
Equity securities. . . . . . . . . . . . . . . . . . . . . . . . . . . . . . . . . . . . . . . . 2% 2% 2% 2%
U.K. Government Gilt Index. . . . . . . . . . . . . . . . . . . . . . . . . . . . . . . . 39% 43% 39% 43%
Liability-Driven Investment. . . . . . . . . . . . . . . . . . . . . . . . . . . . . . . . . 12% 7% 12% 7%
Fixed income . . . . . . . . . . . . . . . . . . . . . . . . . . . . . . . . . . . . . . . . . . 51% 50% 51% 50%
Multi-asset . . . . . . . . . . . . . . . . . . . . . . . . . . . . . . . . . . . . . . . . . . . . . . 20% 19% 20% 19%
Buy-in Contracts . . . . . . . . . . . . . . . . . . . . . . . . . . . . . . . . . . . . . . . . . 20% 21% 20% 21%
Other. . . . . . . . . . . . . . . . . . . . . . . . . . . . . . . . . . . . . . . . . . . . . . . . . . . 6% 6% 6% 6%
Other types . . . . . . . . . . . . . . . . . . . . . . . . . . . . . . . . . . . . . . . . . . . . 46% 46% 46% 46%
None of our common stock is held directly by these plans. In all cases, our investment strategy for these plans
is to earn a long-term rate of return consistent with an acceptable degree of risk and minimize our cash contributions
over the life of the plan, while taking into account the liquidity needs of the plan and the legal requirements of the
particular country. We preserve capital through diversified investments in high quality securities.
Asset allocation differs by plan based upon the plan’s benefit obligation to participants, as well as the results of
asset and liability studies that are conducted for each plan and in consideration of our future cash flow needs.
Professional money management firms manage plan assets and we engage a consultant in the U.K. to assist in
evaluation of these activities. The assets of the U.K. plans are overseen by a group of Trustees who review the
investment strategy, asset allocation and fund selection. These assets are passively managed as they are invested in
index funds that attempt to match the performance of the specified benchmark index.
The fair values of the non-U.S. assets were:
At December 31, 2020 At December 31, 2019
Hierarchical Levels Hierarchical Levels
Total I II III Total I II III
(Amounts in thousands) (Amounts in thousands)
Cash . . . . . . . . . . . . . . . . . . . . . . . . . . . $ 2,304 $2,304 $ — — $ 5,026 $5,026 $ — $ —
Commingled Funds:
Equity securities
North American Companies(a) . . . 2,555 — 2,555 — 2,501 — 2,501 —
Global Equity(b) . . . . . . . . . . . . . . 2,451 — 2,451 — 2,411 — 2,411 —
Fixed income securities
U.K. Government Gilt Index(c) . . 112,298 — 112,298 — 113,855 — 113,855 —
Liability-Driven Investment(d) . . . 34,543 — 34,543 — 20,011 — 20,011 —
Other Types of Investments:
Multi-asset(e). . . . . . . . . . . . . . . . . 57,205 — 57,205 — 48,964 — 48,964 —
Buy-in Contracts(f) . . . . . . . . . . . . 59,249 — — 59,249 54,544 — — 54,544
Other(g) . . . . . . . . . . . . . . . . . . . . . 16,703 — — 16,703 15,247 — — 15,247
$287,308 $2,304 $209,052 $75,952 $262,559 $5,026 $187,742 $69,791
(a) North American Companies represents U.S. and Canadian large cap equity funds, which are managed to track their respective benchmarks
(FTSE All-World USA Index and FTSE All-World Canada Index).
(b) Global Equity represents actively managed global equity funds, taking a top-down strategic view on the different regions by analyzing
companies based on fundamentals, market-driven, thematic and quantitative factors to generate alpha.
94
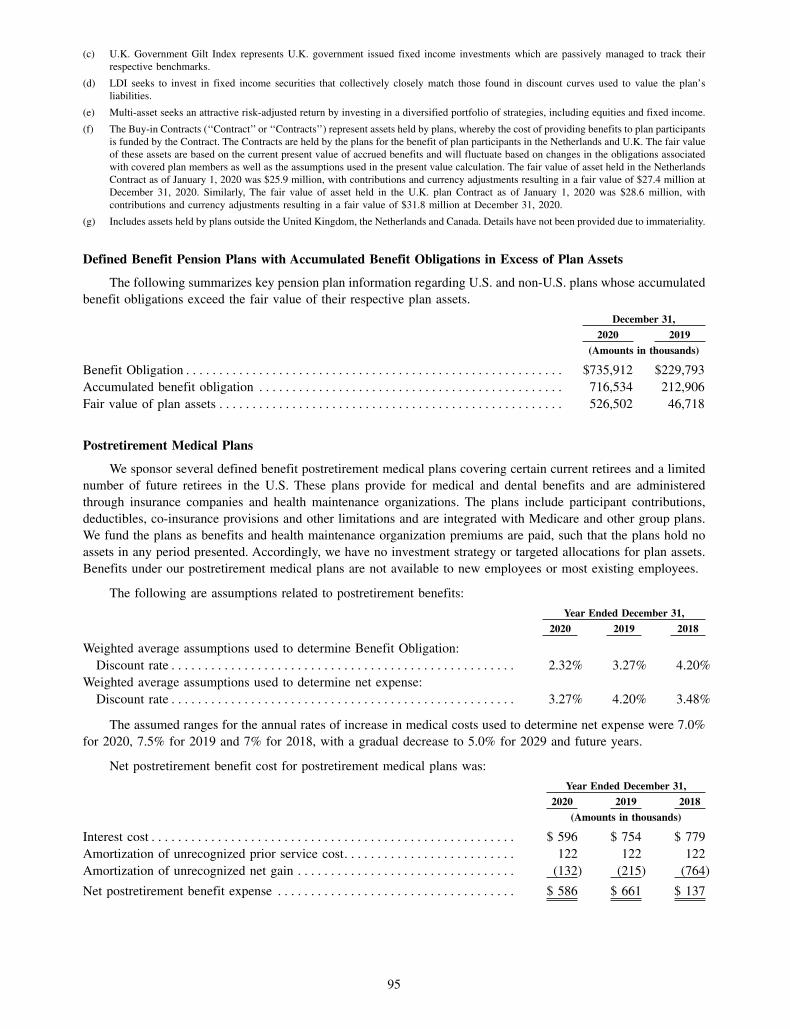
(c) U.K. Government Gilt Index represents U.K. government issued fixed income investments which are passively managed to track their
respective benchmarks.
(d) LDI seeks to invest in fixed income securities that collectively closely match those found in discount curves used to value the plan’s
liabilities.
(e) Multi-asset seeks an attractive risk-adjusted return by investing in a diversified portfolio of strategies, including equities and fixed income.
(f) The Buy-in Contracts (‘‘Contract’’ or ‘‘Contracts’’) represent assets held by plans, whereby the cost of providing benefits to plan participants
is funded by the Contract. The Contracts are held by the plans for the benefit of plan participants in the Netherlands and U.K. The fair value
of these assets are based on the current present value of accrued benefits and will fluctuate based on changes in the obligations associated
with covered plan members as well as the assumptions used in the present value calculation. The fair value of asset held in the Netherlands
Contract as of January 1, 2020 was $25.9 million, with contributions and currency adjustments resulting in a fair value of $27.4 million at
December 31, 2020. Similarly, The fair value of asset held in the U.K. plan Contract as of January 1, 2020 was $28.6 million, with
contributions and currency adjustments resulting in a fair value of $31.8 million at December 31, 2020.
(g) Includes assets held by plans outside the United Kingdom, the Netherlands and Canada. Details have not been provided due to immateriality.
Defined Benefit Pension Plans with Accumulated Benefit Obligations in Excess of Plan Assets
The following summarizes key pension plan information regarding U.S. and non-U.S. plans whose accumulated
benefit obligations exceed the fair value of their respective plan assets.
December 31,
2020 2019
(Amounts in thousands)
Benefit Obligation . . . . . . . . . . . . . . . . . . . . . . . . . . . . . . . . . . . . . . . . . . . . . . . . . . . . . . . . . $735,912 $229,793
Accumulated benefit obligation . . . . . . . . . . . . . . . . . . . . . . . . . . . . . . . . . . . . . . . . . . . . . . 716,534 212,906
Fair value of plan assets . . . . . . . . . . . . . . . . . . . . . . . . . . . . . . . . . . . . . . . . . . . . . . . . . . . . 526,502 46,718
Postretirement Medical Plans
We sponsor several defined benefit postretirement medical plans covering certain current retirees and a limited
number of future retirees in the U.S. These plans provide for medical and dental benefits and are administered
through insurance companies and health maintenance organizations. The plans include participant contributions,
deductibles, co-insurance provisions and other limitations and are integrated with Medicare and other group plans.
We fund the plans as benefits and health maintenance organization premiums are paid, such that the plans hold no
assets in any period presented. Accordingly, we have no investment strategy or targeted allocations for plan assets.
Benefits under our postretirement medical plans are not available to new employees or most existing employees.
The following are assumptions related to postretirement benefits:
Year Ended December 31,
2020 2019 2018
Weighted average assumptions used to determine Benefit Obligation:
Discount rate . . . . . . . . . . . . . . . . . . . . . . . . . . . . . . . . . . . . . . . . . . . . . . . . . . . . 2.32% 3.27% 4.20%
Weighted average assumptions used to determine net expense:
Discount rate . . . . . . . . . . . . . . . . . . . . . . . . . . . . . . . . . . . . . . . . . . . . . . . . . . . . 3.27% 4.20% 3.48%
The assumed ranges for the annual rates of increase in medical costs used to determine net expense were 7.0%
for 2020, 7.5% for 2019 and 7% for 2018, with a gradual decrease to 5.0% for 2029 and future years.
Net postretirement benefit cost for postretirement medical plans was:
Year Ended December 31,
2020 2019 2018
(Amounts in thousands)
Interest cost . . . . . . . . . . . . . . . . . . . . . . . . . . . . . . . . . . . . . . . . . . . . . . . . . . . . . . . $ 596 $ 754 $ 779
Amortization of unrecognized prior service cost. . . . . . . . . . . . . . . . . . . . . . . . . . 122 122 122
Amortization of unrecognized net gain . . . . . . . . . . . . . . . . . . . . . . . . . . . . . . . . . (132) (215) (764)
Net postretirement benefit expense . . . . . . . . . . . . . . . . . . . . . . . . . . . . . . . . . . . . $ 586 $ 661 $ 137
95

The following summarizes the accrued postretirement benefits liability for the postretirement medical plans:
December 31,
2020 2019
(Amounts in thousands)
Postretirement Benefit Obligation . . . . . . . . . . . . . . . . . . . . . . . . . . . . . . . . . . . . . $ 18,648 $ 18,862
Funded status. . . . . . . . . . . . . . . . . . . . . . . . . . . . . . . . . . . . . . . . . . . . . . . . . . . . . . $(18,648) $(18,862)
The following summarizes amounts recognized in the balance sheet for postretirement Benefit Obligation:
December 31,
2020 2019
(Amounts in thousands)
Current liabilities. . . . . . . . . . . . . . . . . . . . . . . . . . . . . . . . . . . . . . . . . . . . . . . . . . . $ (2,342) $ (2,370)Noncurrent liabilities. . . . . . . . . . . . . . . . . . . . . . . . . . . . . . . . . . . . . . . . . . . . . . . . (16,306) (16,492)
Funded status. . . . . . . . . . . . . . . . . . . . . . . . . . . . . . . . . . . . . . . . . . . . . . . . . . . . . . $(18,648) $(18,862)
The following is a reconciliation of the postretirement Benefit Obligation:
December 31,
2020 2019
(Amounts in thousands)
Balance — January 1 . . . . . . . . . . . . . . . . . . . . . . . . . . . . . . . . . . . . . . . . . . . . . . . $18,862 $18,810Interest cost . . . . . . . . . . . . . . . . . . . . . . . . . . . . . . . . . . . . . . . . . . . . . . . . . . . . . 596 754Employee contributions . . . . . . . . . . . . . . . . . . . . . . . . . . . . . . . . . . . . . . . . . . . 916 964Medicare subsidies receivable . . . . . . . . . . . . . . . . . . . . . . . . . . . . . . . . . . . . . . 7 14Actuarial losses . . . . . . . . . . . . . . . . . . . . . . . . . . . . . . . . . . . . . . . . . . . . . . . . . . 2,434 2,222Net benefits and expenses paid . . . . . . . . . . . . . . . . . . . . . . . . . . . . . . . . . . . . . (4,167) (3,902)
Balance — December 31 . . . . . . . . . . . . . . . . . . . . . . . . . . . . . . . . . . . . . . . . . . . . $18,648 $18,862
The following presents expected benefit payments for future periods (amounts in millions):
ExpectedPayments
2021. . . . . . . . . . . . . . . . . . . . . . . . . . . . . . . . . . . . . . . . . . . . . . . . . . . . . . . . . . . . . . . . . . . . . . . . . . . . . . $2.42022. . . . . . . . . . . . . . . . . . . . . . . . . . . . . . . . . . . . . . . . . . . . . . . . . . . . . . . . . . . . . . . . . . . . . . . . . . . . . . 2.22023. . . . . . . . . . . . . . . . . . . . . . . . . . . . . . . . . . . . . . . . . . . . . . . . . . . . . . . . . . . . . . . . . . . . . . . . . . . . . . 2.02024. . . . . . . . . . . . . . . . . . . . . . . . . . . . . . . . . . . . . . . . . . . . . . . . . . . . . . . . . . . . . . . . . . . . . . . . . . . . . . 1.82025. . . . . . . . . . . . . . . . . . . . . . . . . . . . . . . . . . . . . . . . . . . . . . . . . . . . . . . . . . . . . . . . . . . . . . . . . . . . . . 1.62026-2030 . . . . . . . . . . . . . . . . . . . . . . . . . . . . . . . . . . . . . . . . . . . . . . . . . . . . . . . . . . . . . . . . . . . . . . . . . 6.1
The following table shows the change in accumulated other comprehensive loss attributable to the components
of the net cost and the change in Benefit Obligations for postretirement benefits, net of tax:
2020 2019
(Amounts in thousands)
Balance — January 1 . . . . . . . . . . . . . . . . . . . . . . . . . . . . . . . . . . . . . . . . . . . . . . . . . . . . . . $ 656 $ 2,425Amortization of net gain . . . . . . . . . . . . . . . . . . . . . . . . . . . . . . . . . . . . . . . . . . . . . . . . . . (101) (164)Amortization of prior service cost . . . . . . . . . . . . . . . . . . . . . . . . . . . . . . . . . . . . . . . . . . 94 94Net losses arising during the year . . . . . . . . . . . . . . . . . . . . . . . . . . . . . . . . . . . . . . . . . . (1,862) (1,699)
Balance — December 31 . . . . . . . . . . . . . . . . . . . . . . . . . . . . . . . . . . . . . . . . . . . . . . . . . . . $(1,213) $ 656
Amounts recorded in accumulated other comprehensive loss consist of:
December 31,
2020 2019
(Amounts in thousands)
Unrecognized net gain (loss) . . . . . . . . . . . . . . . . . . . . . . . . . . . . . . . . . . . . . . . . . . . . . . . . $ (470) $1,512Unrecognized prior service cost . . . . . . . . . . . . . . . . . . . . . . . . . . . . . . . . . . . . . . . . . . . . . . (743) (856)
Accumulated other comprehensive income, net of tax . . . . . . . . . . . . . . . . . . . . . . . . . . . . $(1,213) $ 656
96
We made contributions to the postretirement medical plans to pay benefits of $3.2 million in 2020, $2.9 million
in 2019 and $3.2 million in 2018. Because the postretirement medical plans are unfunded, we make contributions as
the covered individuals’ claims are approved for payment. Accordingly, contributions during any period are directly
correlated to the benefits paid.
Defined Contribution Plans
We sponsor several defined contribution plans covering substantially all U.S. and Canadian employees and
certain other non-U.S. employees. Employees may contribute to these plans, and these contributions are matched in
varying amounts by us, including opportunities for discretionary matching contributions by us. Defined contribution
plan expense was $20.0 million in 2020, $20.4 million in 2019 and $18.7 million in 2018.
15. EARNINGS PER SHARE
The following is a reconciliation of net earnings of Flowserve Corporation and weighted average shares for
calculating net earnings per common share. Earnings per weighted average common share outstanding was calculated
as follows:
Year Ended December 31,
2020 2019 2018
(Amounts in thousands, except per share data)
Net earnings of Flowserve Corporation . . . . . . . . . . . . . . . . . . . . . . . . . . . . $116,326 $238,828 $104,508
Dividends on restricted shares not expected to vest . . . . . . . . . . . . . . . . . . — — —
Earnings attributable to common and participating shareholders . . . . . . . . $116,326 $238,828 $104,508
Weighted average shares:
Common stock. . . . . . . . . . . . . . . . . . . . . . . . . . . . . . . . . . . . . . . . . . . . . . . . 130,373 131,012 130,794
Participating securities. . . . . . . . . . . . . . . . . . . . . . . . . . . . . . . . . . . . . . . . . . 22 22 29
Denominator for basic earnings per common share . . . . . . . . . . . . . . . . . . 130,395 131,034 130,823
Effect of potentially dilutive securities. . . . . . . . . . . . . . . . . . . . . . . . . . . . . 655 685 448
Denominator for diluted earnings per common share . . . . . . . . . . . . . . . . . 131,050 131,719 131,271
Net earnings per share attributable to Flowserve Corporation common
shareholders:
Basic. . . . . . . . . . . . . . . . . . . . . . . . . . . . . . . . . . . . . . . . . . . . . . . . . . . . . . $ 0.89 $ 1.82 $ 0.80
Diluted . . . . . . . . . . . . . . . . . . . . . . . . . . . . . . . . . . . . . . . . . . . . . . . . . . . . 0.89 1.81 0.80
Diluted earnings per share is based upon the weighted average number of shares as determined for basic earnings
per share plus shares potentially issuable in conjunction with stock options, restricted shares, restricted share units
and performance share units.
For the years ended ending December 31, 2020, 2019 and 2018, unvested restricted shares of 375,203, 140,459,
and 88,656, respectively, were excluded from the computation of diluted earnings per share because the effect of their
exercise would be anti-dilutive.
16. LEGAL MATTERS AND CONTINGENCIES
Asbestos-Related Claims
We are a defendant in a substantial number of lawsuits that seek to recover damages for personal injury allegedly
caused by exposure to asbestos-containing products manufactured and/or distributed by our heritage companies in the
past. Typically, these lawsuits have been brought against multiple defendants in state and federal courts. While the
overall number of asbestos-related claims in which we or our predecessors have been named has generally declined
in recent years, there can be no assurance that this trend will continue, or that the average cost per claim to us will
not further increase. Asbestos-containing materials incorporated into any such products were encapsulated and used
as internal components of process equipment, and we do not believe that significant emission of asbestos fibers
occurred during the use of this equipment.
97

Our practice is to vigorously contest and resolve these claims, and we have been successful in resolving a
majority of claims with little or no payment, other than legal fees. Activity related to asbestos claims during the
periods indicated was as follows:
December 31,
2020 2019 2018
Beginning claims(1) . . . . . . . . . . . . . . . . . . . . . . . . . . . . . . . . . . . . . . . . . . . . . . . . 8,345 8,666 12,447
New claims . . . . . . . . . . . . . . . . . . . . . . . . . . . . . . . . . . . . . . . . . . . . . . . . . . . . . . . 2,140 2,314 2,766
Resolved claims . . . . . . . . . . . . . . . . . . . . . . . . . . . . . . . . . . . . . . . . . . . . . . . . . . . (2,203) (2,601) (5,980)
Other(2) . . . . . . . . . . . . . . . . . . . . . . . . . . . . . . . . . . . . . . . . . . . . . . . . . . . . . . . . . . 84 (34) (567)
Ending claims(1) . . . . . . . . . . . . . . . . . . . . . . . . . . . . . . . . . . . . . . . . . . . . . . . . . . . 8,366 8,345 8,666
(1) Beginning and ending claims data in each period excludes inactive claims, as the Company considers it unlikely that inactive cases will bepursued further by the respective plaintiffs. A claim is classified as inactive either due to inactivity over a period of time or if designatedas inactive by the applicable court.
(2) Represents the net change in claims as a result of the reclassification of active cases as inactive and inactive cases as active during the periodindicated. Cases moved from active to inactive status are removed from the claims count without being accounted for as a ‘‘Resolved claim’’,and cases moved from inactive status to active status are added back to the claims count without being accounted for as a ‘‘New claim’’.
The Company incurred expenses of approximately $15.5 million, $21.8 million and $24.8 million during the
periods ending December 31, 2020, 2019 and 2018, respectively, to defend, resolve or otherwise dispose of
outstanding claims, including legal and other related expenses. These expenses are included within SG&A in the
Consolidated Statements of Income.
The Company had cash (inflows)/outflows (net of insurance and/or indemnity) to defend, resolve or otherwise
dispose of outstanding claims, including legal and other related expenses of approximately $(5.5) million,
$12.2 million and $12.6 million during the periods ending December 31, 2020, 2019 and 2018, respectively.
Historically, a high percentage of resolved claims have been covered by applicable insurance or indemnities
from other companies, and we believe that a substantial majority of existing claims should continue to be covered
by insurance or indemnities, in whole or in part.
We believe that our reserve for asbestos claims and the receivable for recoveries from insurance carriers that we
have recorded for these claims reflects reasonable and probable estimates of these amounts. Our estimate of our
ultimate exposure for asbestos claims, however, is subject to significant uncertainties, including the timing and
number and types of new claims, unfavorable court rulings, judgments or settlement terms and ultimate costs to settle.
Additionally, including the continued viability of carriers, may also impact the amount of probable insurance
recoveries. We believe that these uncertainties could have a material adverse impact on our business, financial
condition, results of operations and cash flows, though we currently believe the likelihood is remote.
Additionally, we have claims pending against certain insurers that, if in future periods are resolved more
favorably than reflected in the recorded receivables, would result in discrete gains in the applicable year.
Other
We are currently involved as a potentially responsible party at four former public waste disposal sites in various
stages of evaluation or remediation. The projected cost of remediation at these sites, as well as our alleged ‘‘fair
share’’ allocation, will remain uncertain until all studies have been completed and the parties have either negotiated
an amicable resolution or the matter has been judicially resolved. At each site, there are many other parties who have
similarly been identified. Many of the other parties identified are financially strong and solvent companies that appear
able to pay their share of the remediation costs. Based on our information about the waste disposal practices at these
sites and the environmental regulatory process in general, we believe that it is likely that ultimate remediation liability
costs for each site will be apportioned among all liable parties, including site owners and waste transporters,
according to the volumes and/or toxicity of the wastes shown to have been disposed of at the sites. We believe that
our financial exposure for existing disposal sites will not be materially in excess of accrued reserves.
We are also a defendant in a number of other lawsuits, including product liability claims, that are insured, subject
to the applicable deductibles, arising in the ordinary course of business, and we are also involved in other uninsured
routine litigation incidental to our business. We currently believe none of such litigation, either individually or in the
aggregate, is material to our business, operations or overall financial condition. However, litigation is inherently
98

unpredictable, and resolutions or dispositions of claims or lawsuits by settlement or otherwise could have an adverse
impact on our financial position, results of operations or cash flows for the reporting period in which any such
resolution or disposition occurs.
Although none of the aforementioned potential liabilities can be quantified with absolute certainty except as
otherwise indicated above, we have established or adjusted reserves covering exposures relating to contingencies, to
the extent believed to be reasonably estimable and probable based on past experience and available facts. While
additional exposures beyond these reserves could exist, they currently cannot be estimated. We will continue to
evaluate and update the reserves as necessary and appropriate.
17. WARRANTY RESERVE
We have recorded reserves for product warranty claims that are included in current liabilities. The following is
a summary of the activity in the warranty reserve:
Year Ended December 31,
2020 2019 2018
(Amounts in thousands)
Balance — January 1 . . . . . . . . . . . . . . . . . . . . . . . . . . . . . . . . . . . . . . . . . . . . . . . $ 30,854 $ 32,033 $ 33,601Accruals for warranty expense, net of adjustments. . . . . . . . . . . . . . . . . . . . . . 21,701 26,215 28,454Settlements made . . . . . . . . . . . . . . . . . . . . . . . . . . . . . . . . . . . . . . . . . . . . . . . . (24,611) (27,394) (30,022)
Balance — December 31 . . . . . . . . . . . . . . . . . . . . . . . . . . . . . . . . . . . . . . . . . . . . $ 27,944 $ 30,854 $ 32,033
18. SHAREHOLDERS’ EQUITY
Dividends – Generally, our dividend date-of-record is in the last month of the quarter, and the dividend is paid
the following month. Any subsequent dividends will be reviewed by our Board of Directors and declared in its
discretion.
Dividends declared per share were as follows:
Year Ended December 31,
2020 2019 2018
Dividends declared per share . . . . . . . . . . . . . . . . . . . . . . . . . . . . . . . . . . . . . . . . . $0.80 $0.76 $0.76
Share Repurchase Program – in 2014, our Board of Directors approved a $500.0 million share repurchase
authorization. Our share repurchase program does not have an expiration date, and we reserve the right to limit or
terminate the repurchase program at any time without notice.
We repurchased 1,057,115 shares of our outstanding common stock for $32.1 million and 324,889 shares of our
outstanding common stock for $15.0 million during the year ended December 31, 2020 and 2019, respectively. We
had no repurchases of shares of our outstanding common stock for the year ended December 31, 2018. As of
December 31, 2020, we have $113.6 million of remaining capacity under our current share repurchase program.
19. INCOME TAXES
The provision for income taxes consists of the following:
Year Ended December 31,
2020 2019 2018
(Amounts in thousands)
Current:U.S. federal . . . . . . . . . . . . . . . . . . . . . . . . . . . . . . . . . . . . . . . . . . . . . . . . . . . . . $ 40,234 $ 22,001 $12,079Foreign. . . . . . . . . . . . . . . . . . . . . . . . . . . . . . . . . . . . . . . . . . . . . . . . . . . . . . . . . 42,487 61,976 29,968State and local . . . . . . . . . . . . . . . . . . . . . . . . . . . . . . . . . . . . . . . . . . . . . . . . . . . 5,894 4,506 2,647
Total current . . . . . . . . . . . . . . . . . . . . . . . . . . . . . . . . . . . . . . . . . . . . . . . . . . 88,615 88,483 44,694Deferred:
U.S. federal . . . . . . . . . . . . . . . . . . . . . . . . . . . . . . . . . . . . . . . . . . . . . . . . . . . . . (50,038) (1,644) 6,567Foreign. . . . . . . . . . . . . . . . . . . . . . . . . . . . . . . . . . . . . . . . . . . . . . . . . . . . . . . . . 25,356 (12,243) (4,585)State and local . . . . . . . . . . . . . . . . . . . . . . . . . . . . . . . . . . . . . . . . . . . . . . . . . . . (3,902) 897 (126)
Total deferred . . . . . . . . . . . . . . . . . . . . . . . . . . . . . . . . . . . . . . . . . . . . . . . . . (28,584) (12,990) 1,856
Total provision . . . . . . . . . . . . . . . . . . . . . . . . . . . . . . . . . . . . . . . . . . . . . . . . . . . . $ 60,031 $ 75,493 $46,550
99

The provision for income taxes differs from the statutory corporate rate due to the following:
Year Ended December 31,
2020 2019 2018
(Amounts in millions)
Statutory federal income tax at 21% . . . . . . . . . . . . . . . . . . . . . . . . . . . . . . . . . . . $39.2 $67.7 $32.9Foreign impact, net . . . . . . . . . . . . . . . . . . . . . . . . . . . . . . . . . . . . . . . . . . . . . . . . . (1.3) 4.5 (5.9)Impact of U.S. Tax Reform Act . . . . . . . . . . . . . . . . . . . . . . . . . . . . . . . . . . . . . . . — — (5.7)Change in valuation allowances . . . . . . . . . . . . . . . . . . . . . . . . . . . . . . . . . . . . . . . 26.9 0.3 15.7State and local income taxes, net . . . . . . . . . . . . . . . . . . . . . . . . . . . . . . . . . . . . . . 2.0 5.4 3.7Research and development credit . . . . . . . . . . . . . . . . . . . . . . . . . . . . . . . . . . . . . . (5.2) (5.4) —Other, net . . . . . . . . . . . . . . . . . . . . . . . . . . . . . . . . . . . . . . . . . . . . . . . . . . . . . . . . . (1.6) 3.0 5.9
Total . . . . . . . . . . . . . . . . . . . . . . . . . . . . . . . . . . . . . . . . . . . . . . . . . . . . . . . . . . . . . $60.0 $75.5 $46.6
Effective tax rate . . . . . . . . . . . . . . . . . . . . . . . . . . . . . . . . . . . . . . . . . . . . . . . . . . . 32.1% 23.4% 29.8%
In response to the COVID-19 pandemic, many governments have enacted or are contemplating measures to
provide aid and economic stimulus. These measures may include deferring the due dates of tax payments or other
changes to their income and non-income-based tax laws. The Coronavirus Aid, Relief, and Economic Security Act
(‘‘CARES Act’’), which was enacted on March 27, 2020 in the U.S., includes measures to assist companies, including
temporary changes to income and non-income-based tax laws. For the year ended December 31, 2020, there were no
material tax impacts to our condensed consolidated financial statements as they relate to the CARES Act or any other
global COVID-19 measures. We continue to monitor additional guidance issued by the U.S. Treasury Department,
the Internal Revenue Service and others.
For the years ended December 31, 2020, 2019 and 2018 we have asserted indefinite reinvestment on certain
earnings of our foreign subsidiaries. As of December 31, 2020, we have not recorded approximately $19.1 million
of deferred tax liabilities associated with remaining unremitted earnings considered indefinitely reinvested, primarily
related to foreign withholding taxes that would be due upon repatriation of the designated earnings to the U.S.
Deferred income taxes reflect the net tax effects of temporary differences between the carrying amounts of assets
and liabilities for financial reporting purposes and the amounts used for income tax purposes. Significant components
of the consolidated deferred tax assets and liabilities were:
December 31,
2020 2019
(Amounts in thousands)
Deferred tax assets related to:Retirement benefits . . . . . . . . . . . . . . . . . . . . . . . . . . . . . . . . . . . . . . . . . . . . . . . . . . . . . . $ 29,754 $ 25,214Net operating loss carryforwards . . . . . . . . . . . . . . . . . . . . . . . . . . . . . . . . . . . . . . . . . . . 109,020 101,193Compensation accruals . . . . . . . . . . . . . . . . . . . . . . . . . . . . . . . . . . . . . . . . . . . . . . . . . . . 20,290 24,685Inventories . . . . . . . . . . . . . . . . . . . . . . . . . . . . . . . . . . . . . . . . . . . . . . . . . . . . . . . . . . . . . 36,402 34,846Credit and capital loss carryforwards . . . . . . . . . . . . . . . . . . . . . . . . . . . . . . . . . . . . . . . . 136,956 131,744Warranty and accrued liabilities . . . . . . . . . . . . . . . . . . . . . . . . . . . . . . . . . . . . . . . . . . . . 27,483 18,741Bad debt reserve . . . . . . . . . . . . . . . . . . . . . . . . . . . . . . . . . . . . . . . . . . . . . . . . . . . . . . . . 17,455 30,884Operating lease liability . . . . . . . . . . . . . . . . . . . . . . . . . . . . . . . . . . . . . . . . . . . . . . . . . . 25,446 27,799Other . . . . . . . . . . . . . . . . . . . . . . . . . . . . . . . . . . . . . . . . . . . . . . . . . . . . . . . . . . . . . . . . . 38,457 25,339
Total deferred tax assets . . . . . . . . . . . . . . . . . . . . . . . . . . . . . . . . . . . . . . . . . . . . . . . . 441,263 420,445Valuation allowances . . . . . . . . . . . . . . . . . . . . . . . . . . . . . . . . . . . . . . . . . . . . . . . . . . . . . . . (287,787) (266,414)
Net deferred tax assets . . . . . . . . . . . . . . . . . . . . . . . . . . . . . . . . . . . . . . . . . . . . . . . . . . . . . 153,476 154,031
Deferred tax liabilities related to:Property, plant and equipment . . . . . . . . . . . . . . . . . . . . . . . . . . . . . . . . . . . . . . . . . . . . . (11,714) (26,311)Goodwill and intangibles . . . . . . . . . . . . . . . . . . . . . . . . . . . . . . . . . . . . . . . . . . . . . . . . . (101,818) (114,122)Foreign undistributed earnings . . . . . . . . . . . . . . . . . . . . . . . . . . . . . . . . . . . . . . . . . . . . . (50,332) (67,930)Operating lease right-of-use-assets . . . . . . . . . . . . . . . . . . . . . . . . . . . . . . . . . . . . . . . . . . (25,799) (27,799)Other . . . . . . . . . . . . . . . . . . . . . . . . . . . . . . . . . . . . . . . . . . . . . . . . . . . . . . . . . . . . . . . . . (17,621) (12,623)
Total deferred tax liabilities . . . . . . . . . . . . . . . . . . . . . . . . . . . . . . . . . . . . . . . . . . . . . (207,284) (248,785)
Deferred tax liabilities, net . . . . . . . . . . . . . . . . . . . . . . . . . . . . . . . . . . . . . . . . . . . . . . . . . . $ (53,808) $ (94,754)
100

We have $481.7 million of U.S. and foreign net operating loss carryforwards at December 31, 2020. Of this total,
$33.1 million are state net operating losses. Net operating losses generated in the U.S., if unused, will expire in 2024
through 2026 tax years. The majority of our foreign net operating losses carry forward without expiration.
Additionally, we have $35.9 million of foreign tax credit carryforwards at December 31, 2020. The foreign tax credit
carryforwards, if unused, will expire in 2026, 2028-2030 tax years.
Our valuation allowances primarily relate to the deferred tax assets established for U.S. foreign tax credit
carryforwards of $35.9 million, a foreign capital loss carryforward of $97.8 million, and other foreign deferred tax
assets of $154.1 million. The foreign capital loss carryforward was the result of a reorganization of certain foreign
subsidiaries in the current year. Due to its capital nature, it is uncertain if the loss will be utilized within its ten year
carryforward period and, therefore, has a full valuation allowance.
Earnings before income taxes comprised:
Year Ended December 31,
2020 2019 2018
(Amounts in thousands)
U.S. . . . . . . . . . . . . . . . . . . . . . . . . . . . . . . . . . . . . . . . . . . . . . . . . . . . . . . . . . . . . . $ 73,109 $110,500 $ 68,838
Foreign. . . . . . . . . . . . . . . . . . . . . . . . . . . . . . . . . . . . . . . . . . . . . . . . . . . . . . . . . . . 113,703 211,933 87,600
Total . . . . . . . . . . . . . . . . . . . . . . . . . . . . . . . . . . . . . . . . . . . . . . . . . . . . . . . . . . . . . $186,812 $322,433 $156,438
A tabular reconciliation of the total gross amount of unrecognized tax benefits, excluding interest and penalties,
is as follows (in millions):
2020 2019 2018
Balance — January 1 . . . . . . . . . . . . . . . . . . . . . . . . . . . . . . . . . . . . . . . . . . . . . . . $40.6 $ 41.2 $51.5
Gross amount of increase (decrease) in unrecognized tax benefits resulting
from tax positions taken:
During a prior year . . . . . . . . . . . . . . . . . . . . . . . . . . . . . . . . . . . . . . . . . . . . . 3.8 8.8 (6.6)
During the current period . . . . . . . . . . . . . . . . . . . . . . . . . . . . . . . . . . . . . . . . 11.1 6.3 4.0
Decreases in unrecognized tax benefits relating to:
Settlements with taxing authorities . . . . . . . . . . . . . . . . . . . . . . . . . . . . . . . . (0.2) (11.4) (2.7)
Lapse of the applicable statute of limitations . . . . . . . . . . . . . . . . . . . . . . . . (2.5) (3.2) (3.7)
Increase (decrease) in unrecognized tax benefits relating to foreign currency
translation adjustments . . . . . . . . . . . . . . . . . . . . . . . . . . . . . . . . . . . . . . . . . . 2.0 (1.1) (1.3)
Balance — December 31 . . . . . . . . . . . . . . . . . . . . . . . . . . . . . . . . . . . . . . . . . . . . $54.8 $ 40.6 $41.2
The amount of gross unrecognized tax benefits at December 31, 2020, was $73.4 million, which includes
$18.6 million of accrued interest and penalties. Of this amount $62.3 million, if recognized, would favorably impact
our effective tax rate.
With limited exception, we are no longer subject to U.S. federal income tax audits for years through 2017, state
and local income tax audits for years through 2014 or foreign income tax audits for years through 2013. We are
currently under examination for various years in Canada, Germany, India, Indonesia, Italy, Mexico, the Netherlands,
Philippines, Saudi Arabia, the U.S., and Venezuela.
It is reasonably possible that within the next 12 months the effective tax rate will be impacted by the resolution
of some or all of the matters audited by various taxing authorities. It is also reasonably possible that we will have
the statute of limitations close in various taxing jurisdictions within the next 12 months. As such, we estimate we
could record a reduction in our tax expense up to approximately $8 million within the next 12 months.
20. BUSINESS SEGMENT INFORMATION
Our business segments share a focus on industrial flow control technology and have a high number of common
customers. These segments also have complementary product offerings and technologies that are often combined in
applications that provide us a net competitive advantage. Our segments also benefit from our global footprint and our
economies of scale in reducing administrative and overhead costs to serve customers more cost effectively.
101

We conduct our operations through two business segments based on type of product and how we manage the
business:
• FPD for custom, highly-engineered pumps, pre-configured industrial pumps, pump systems, mechanical
seals, auxiliary systems and replacement parts and related services; and
• FCD for engineered and industrial valves, control valves, actuators and controls and related services.
Our corporate headquarters does not constitute a separate division or business segment. Amounts classified as
‘‘Eliminations and All Other’’ include corporate headquarters costs and other minor entities that do not constitute
separate segments. Intersegment sales and transfers are recorded at cost plus a profit margin, with the sales and
related margin on such sales eliminated in consolidation.
The following is a summary of the financial information of our reportable segments as of and for the years ended
December 31, 2020, 2019 and 2018 reconciled to the amounts reported in the consolidated financial statements.
FPD FCD
Subtotal—ReportableSegments
Eliminationsand All Other
ConsolidatedTotal
(Amounts in thousands)
Year Ended December 31, 2020:
Sales to external customers . . . . . . . . . . . . . . . . . . $2,673,705 $1,054,429 $3,728,134 $ — $3,728,134
Intersegment sales . . . . . . . . . . . . . . . . . . . . . . . . . . 1,965 3,120 5,085 (5,085) —
Segment operating income (loss) . . . . . . . . . . . . . . 270,960 125,573 396,533 (146,256) 250,277
Depreciation and amortization . . . . . . . . . . . . . . . . 52,390 21,949 74,339 26,414 100,753
Identifiable assets . . . . . . . . . . . . . . . . . . . . . . . . . . 3,039,069 1,308,136 4,347,205 967,472 5,314,677
Capital expenditures . . . . . . . . . . . . . . . . . . . . . . . . 21,714 14,043 35,757 21,648 57,405
FPD FCD
Subtotal—ReportableSegments
Eliminationsand All Other
ConsolidatedTotal
(Amounts in thousands)
Year Ended December 31, 2019:
Sales to external customers . . . . . . . . . . . . . . . . . . $2,704,445 $1,235,252 $3,939,697 $ — $3,939,697
Intersegment sales . . . . . . . . . . . . . . . . . . . . . . . . . . 1,833 3,631 5,464 (5,464) —
Segment operating income (loss) . . . . . . . . . . . . . . 343,514 191,945 535,459 (148,836) 386,623
Depreciation and amortization . . . . . . . . . . . . . . . . 50,845 23,577 74,422 31,482 105,904
Identifiable assets . . . . . . . . . . . . . . . . . . . . . . . . . . 2,974,161 1,333,926 4,308,087 630,190 4,938,277
Capital expenditures . . . . . . . . . . . . . . . . . . . . . . . . 26,450 14,449 40,899 34,817 75,716
FPD FCD
Subtotal—ReportableSegments
Eliminationsand All Other
ConsolidatedTotal
(Amounts in thousands)
Year Ended December 31, 2018:
Sales to external customers . . . . . . . . . . . . . . . . . . $2,620,488 $1,215,211 $3,835,699 $ — $3,835,699
Intersegment sales . . . . . . . . . . . . . . . . . . . . . . . . . . 2,816 3,637 6,453 (6,453) —
Segment operating income (loss) . . . . . . . . . . . . . . 200,981 204,250 405,231 (177,530) 227,701
Depreciation and amortization . . . . . . . . . . . . . . . . 68,148 26,585 94,733 17,740 112,473
Identifiable assets . . . . . . . . . . . . . . . . . . . . . . . . . . 2,768,879 1,269,435 4,038,314 611,055 4,649,369
Capital expenditures . . . . . . . . . . . . . . . . . . . . . . . . 40,648 14,458 55,106 28,887 83,993
102

Geographic Information — We attribute sales to different geographic areas based on our facilities’ locations.
Long-lived assets are classified based on the geographic area in which the assets are located and exclude deferred
taxes, goodwill and intangible assets. Sales and long-lived assets by geographic area are as follows:
Year Ended December 31, 2020
Sales PercentageLong-Lived
Assets(a) Percentage
(Amounts in thousands, except percentages)
United States . . . . . . . . . . . . . . . . . . . . . . . . . . . . . . . . . . . . . . . . . . . . $1,463,680 39.3% $455,622 46.2%
EMA(1) . . . . . . . . . . . . . . . . . . . . . . . . . . . . . . . . . . . . . . . . . . . . . . . . . 1,385,245 37.2% 336,577 34.1%
Asia(2) . . . . . . . . . . . . . . . . . . . . . . . . . . . . . . . . . . . . . . . . . . . . . . . . . . 535,440 14.4% 138,947 14.1%
Other(3) . . . . . . . . . . . . . . . . . . . . . . . . . . . . . . . . . . . . . . . . . . . . . . . . . 343,769 9.1% 55,278 5.6%
Consolidated total . . . . . . . . . . . . . . . . . . . . . . . . . . . . . . . . . . . . . . . . $3,728,134 100.0% $986,424 100.0%
Year Ended December 31, 2019
Sales PercentageLong-Lived
Assets Percentage
(Amounts in thousands, except percentages)
United States . . . . . . . . . . . . . . . . . . . . . . . . . . . . . . . . . . . . . . . . . . . . $1,632,582 41.4% $ 481,474 48.0%
EMA(1) . . . . . . . . . . . . . . . . . . . . . . . . . . . . . . . . . . . . . . . . . . . . . . . . . 1,397,308 35.5% 312,668 31.2%
Asia(2) . . . . . . . . . . . . . . . . . . . . . . . . . . . . . . . . . . . . . . . . . . . . . . . . . . 551,759 14.0% 143,848 14.3%
Other(3) . . . . . . . . . . . . . . . . . . . . . . . . . . . . . . . . . . . . . . . . . . . . . . . . . 358,048 9.1% 64,846 6.5%
Consolidated total . . . . . . . . . . . . . . . . . . . . . . . . . . . . . . . . . . . . . . . . $3,939,697 100.0% $1,002,836 100.0%
Year Ended December 31, 2018
Sales PercentageLong-Lived
Assets Percentage
(Amounts in thousands, except percentages)
United States . . . . . . . . . . . . . . . . . . . . . . . . . . . . . . . . . . . . . . . . . . . . $1,528,963 39.9% $353,767 42.6%
EMA(1) . . . . . . . . . . . . . . . . . . . . . . . . . . . . . . . . . . . . . . . . . . . . . . . . . 1,424,498 37.1% 280,549 33.8%
Asia(2) . . . . . . . . . . . . . . . . . . . . . . . . . . . . . . . . . . . . . . . . . . . . . . . . . . 539,898 14.1% 132,667 16.0%
Other(3) . . . . . . . . . . . . . . . . . . . . . . . . . . . . . . . . . . . . . . . . . . . . . . . . . 342,340 8.9% 63,161 7.6%
Consolidated total . . . . . . . . . . . . . . . . . . . . . . . . . . . . . . . . . . . . . . . . $3,835,699 100.0% $830,144 100.0%
(1) ‘‘EMA’’ includes Europe, the Middle East and Africa. Germany accounted for approximately 7% for 2020, 6% for 2019 and 7% in 2018,
of consolidated long-lived assets. No other individual country within this group represents 10% or more of consolidated totals for any period
presented.
(2) ‘‘Asia’’ includes Asia and Australia. No individual country within this group represents 10% or more of consolidated totals for any period
presented.
(3) ‘‘Other’’ includes Canada and Latin America. No individual country within this group represents 10% or more of consolidated totals for any
period presented.
Net sales to international customers, including export sales from the U.S., represented approximately 65% of
total sales in 2020 and 63% of total sales in both 2019 and 2018.
Major Customer Information — We have a large number of customers across a large number of manufacturing
and service facilities and do not have sales to any individual customer that represent 10% or more of consolidated
sales for any of the years presented.
103

21. ACCUMULATED OTHER COMPREHENSIVE LOSS
The following presents the components of accumulated other comprehensive loss (AOCL), net of related tax
effects:
2020 2019
(Amounts in thousands)
Foreigncurrency
translationitems(1)
Pension andother post-retirement
effects
Cash flowhedgingactivity Total(1)
Foreigncurrency
translationitems(1)
Pension andother post-retirement
effects
Cash flowhedgingactivity Total(1)
Balance - January 1 . . . . . . . . $(441,364) $(137,161) $(671) $(579,196) $(447,925) $(120,647) $(858) $(569,430)Other comprehensive
income (loss) beforereclassifications . . . . . . . 388 (18,979) 183 (18,408) 6,561 (22,523) 187 (15,775)
Amounts reclassified fromAOCL . . . . . . . . . . . . . . . . — 9,417 — 9,417 — 6,009 — 6,009
Net current-period othercomprehensive income(loss). . . . . . . . . . . . . . . 388 (9,562) 183 (8,991) 6,561 (16,514) 187 (9,766)
Balance - December 31 . . . . . $(440,976) $(146,723) $(488) $(588,187) $(441,364) $(137,161) $(671) $(579,196)
(1) Includes foreign currency translation adjustments attributable to noncontrolling interests of $5.9 million, $5.1 million and $4.5 million for
December 31, 2020, 2019 and 2018, respectively. For the year ended December 31, 2020, foreign currency translation impacts primarily
represented the strengthening of the Euro, Chinese yuan, British pound and Canadian dollar exchange rates versus the U.S. dollar for theperiod. For the year ended December 31, 2019, foreign currency translation impacts primarily represented the weakening of the Euro, Britishpound, Chinese yuan and Indian rupee exchange rates versus the U.S. dollar for the period. Includes net investment hedge cumulative lossesof $48.8 million and $12.1 million, net of deferred taxes, at December 31, 2020 and 2019, respectively. Amounts in parentheses indicatedebits.
The following table presents the reclassifications out of AOCL:
(Amounts in thousands)Affected line item in the
statement of income 2020(1) 2019(1)
Pension and other postretirement effects. . . . . . . . . . . . . . . . . .
Amortization of actuarial losses(2). . . . . . . . . . . . . . . . . . . . . . . Other income (expense), net $(11,161) $(6,608)
Prior service costs(2). . . . . . . . . . . . . . . . . . . . . . . . . . . . . . . . . . Other income (expense), net (568) (429)
Settlements and other(2) . . . . . . . . . . . . . . . . . . . . . . . . . . . . . . . Other income (expense), net (836) (859)
Tax benefit 3,148 1,887
Net of tax $ (9,417) $(6,009)
(1) Amounts in parentheses indicate decreases to income. None of the reclassification amounts have a noncontrolling interest component.
(2) These accumulated other comprehensive loss components are included in the computation of net periodic pension cost. See Note 14 foradditional details.
22. REALIGNMENT AND TRANSFORMATION PROGRAMS
In the second quarter of 2020, we identified and initiated certain realignment activities resulting from our
Flowserve 2.0 Transformation Program (defined below) to right-size our organizational operations based on the
current business environment, with the overall objective to reduce our workforce costs, including manufacturing
optimization through the consolidation of certain facilities (‘‘2020 Realignment Program’’). The realignment
activities consist of restructuring and non-restructuring charges. Restructuring charges represent costs associated with
the relocation of certain business activities and facility closures and include related severance costs. Non-
restructuring charges are primarily employee severance associated with the workforce reductions. Expenses are
primarily reported in cost of sales (‘‘COS’’) or selling, general and administrative (‘‘SG&A’’), as applicable, in our
consolidated statements of income. We anticipate a total investment in these initiated realignment activities of
approximately $80 million and that the majority of the charges were incurred in 2020 with the remainder to be
incurred in early 2021. There are certain other realignment activities that are currently being evaluated, but have not
yet been finalized. The realignment programs initiated in 2015 (‘‘2015 Realignment Programs’’), which consisted of
both restructuring and non-restructuring charges, were substantially complete as of March 31, 2020, resulting in
$362.4 million of total charges incurred through the completion of the programs.
104

In the second quarter of 2018, we launched and committed resources to our Flowserve 2.0 Transformation
(‘‘Flowserve 2.0 Transformation’’), a program designed to transform our business model to drive operational
excellence, reduce complexity, accelerate growth, improve organizational health and better leverage our existing
global platform. The Flowserve 2.0 Transformation expenses incurred primarily consist of professional services,
project management and related travel costs recorded in SG&A.
Generally, the aforementioned charges will be paid in cash, except for asset write-downs, which are non-cash
charges. The following is a summary of total charges, net of adjustments, related to our realignment activities and
Flowserve 2.0 Transformation charges. Realignment charges incurred in 2020 related to our 2020 Realignment
Program and realignment charges incurred in 2019 related to our 2015 Realignment Programs:
December 31, 2020
(Amounts in thousands) FPD FCD
Subtotal–ReportableSegments All Other
ConsolidatedTotal
Restructuring Charges
COS . . . . . . . . . . . . . . . . . . . . . . . . . . . . . . . . . . . $19,510 $ 1,122 $20,632 $ — $ 20,632
SG&A(1) . . . . . . . . . . . . . . . . . . . . . . . . . . . . . . . 156 335 491 (16) 475
$19,666 $ 1,457 $21,123 $ (16) $ 21,107
Non-Restructuring Charges
COS . . . . . . . . . . . . . . . . . . . . . . . . . . . . . . . . . . . $19,328 $ 7,285 $26,613 $ 52 $ 26,665
SG&A . . . . . . . . . . . . . . . . . . . . . . . . . . . . . . . . . 11,166 4,605 15,771 18,527 34,298
$30,494 $11,890 $42,384 $18,579 $ 60,963
Transformation Charges
SG&A . . . . . . . . . . . . . . . . . . . . . . . . . . . . . . . . . $ — $ — $ — $22,719 $ 22,719
$ — $ — $ — $22,719 $ 22,719
Total Realignment and Transformation
Charges
COS . . . . . . . . . . . . . . . . . . . . . . . . . . . . . . . . . . . $38,838 $ 8,407 $47,245 $ 52 $ 47,297
SG&A . . . . . . . . . . . . . . . . . . . . . . . . . . . . . . . . . 11,322 4,940 16,262 41,230 57,492
Total . . . . . . . . . . . . . . . . . . . . . . . . . . . . . . . . . $50,160 $13,347 $63,507 $41,282 $104,789
December 31, 2019
(Amounts in thousands) FPD FCD
Subtotal–ReportableSegments All Other
ConsolidatedTotal
Restructuring Charges
COS . . . . . . . . . . . . . . . . . . . . . . . . . . . . . . . . . . . $ 1,149 $2,653 $ 3,802 $ — $ 3,802
SG&A(1) . . . . . . . . . . . . . . . . . . . . . . . . . . . . . . . (16,610) 556 (16,054) — (16,054)
Income tax expense(2) . . . . . . . . . . . . . . . . . . . . . (4,000) — (4,000) — (4,000)
$(19,461) $3,209 $(16,252) $ — $(16,252)
Non-Restructuring Charges
COS . . . . . . . . . . . . . . . . . . . . . . . . . . . . . . . . . . . 11,438 $1,742 $ 13,180 $ 255 $ 13,435
SG&A . . . . . . . . . . . . . . . . . . . . . . . . . . . . . . . . . 2,104 218 2,322 4,428 6,750
$ 13,542 $1,960 $ 15,502 $ 4,683 $ 20,185
Transformation Charges
SG&A . . . . . . . . . . . . . . . . . . . . . . . . . . . . . . . . . $ — $ — $ — 28,039 $ 28,039
$ — $ — $ — $28,039 $ 28,039
105

December 31, 2019
(Amounts in thousands) FPD FCD
Subtotal–ReportableSegments All Other
ConsolidatedTotal
Total Realignment and Transformation
Charges
COS . . . . . . . . . . . . . . . . . . . . . . . . . . . . . . . . . . . $ 12,587 $4,395 $ 16,982 $ 255 $17,237
SG&A . . . . . . . . . . . . . . . . . . . . . . . . . . . . . . . . . (14,506) 774 (13,732) 32,467 18,735
Income tax expense(2) . . . . . . . . . . . . . . . . . . . . . (4,000) — (4,000) — (4,000)
Total . . . . . . . . . . . . . . . . . . . . . . . . . . . . . . . . . . . $ (5,919) $5,169 $ (750) $32,722 $31,972
(1) Includes gains from the sales of non-strategic manufacturing facilities that are included in our Realignment Programs.
(2) Income tax expense (benefit) includes exit taxes.
The following is a summary of total inception to date charges, net of adjustments, related to the 2020
Realignment Program initiated in 2020:
2020 Realignment Program Inception to Date
(Amounts in thousands) FPD FCD
Subtotal–ReportableSegments All Other
ConsolidatedTotal
Restructuring Charges
COS . . . . . . . . . . . . . . . . . . . . . . . . . . . . . . . . . . . $17,829 $1,227 $19,056 $ — $19,056
SG&A . . . . . . . . . . . . . . . . . . . . . . . . . . . . . . . . . 51 325 376 — 376
$17,880 $1,552 $19,432 $ — $19,432
Non-Restructuring Charges
COS . . . . . . . . . . . . . . . . . . . . . . . . . . . . . . . . . . . $19,203 $ (473) $18,730 $ 52 $18,782
SG&A . . . . . . . . . . . . . . . . . . . . . . . . . . . . . . . . . 10,681 4,554 15,235 17,882 33,117
$29,884 $4,081 $33,965 $17,934 $51,899
Total Realignment Charges
COS . . . . . . . . . . . . . . . . . . . . . . . . . . . . . . . . . . . $37,032 $ 754 $37,786 $ 52 $37,838
SG&A . . . . . . . . . . . . . . . . . . . . . . . . . . . . . . . . . 10,732 4,879 15,611 17,882 33,493
Total . . . . . . . . . . . . . . . . . . . . . . . . . . . . . . . . . $47,764 $5,633 $53,397 $17,934 $71,331
Restructuring charges represent costs associated with the relocation or reorganization of certain business
activities and facility closures and include costs related to employee severance at closed facilities, contract
termination costs, asset write-downs and other costs. Severance costs primarily include costs associated with
involuntary termination benefits. Contract termination costs include costs related to the termination of operating
leases or other contract termination costs. Asset write-downs include accelerated depreciation of fixed assets,
accelerated amortization of intangible assets, divestiture of certain non-strategic assets and inventory write-downs.
Other costs generally include costs related to employee relocation, asset relocation, vacant facility costs (i.e., taxes
and insurance) and other charges.
The following is a summary of restructuring charges, net of adjustments, for our restructuring activities.
Restructuring charges incurred in 2020 related to our 2020 Realignment Program and restructuring charges incurred
in 2019 related to our 2015 Realignment Programs:
December 31, 2020
(Amounts in thousands) SeveranceContract
TerminationAsset Write-
Downs Other Total
COS . . . . . . . . . . . . . . . . . . . . . . . . . . . . . . . . . . . . . . . . . . . . $16,927 $52 $1,409 $2,244 $20,632
SG&A . . . . . . . . . . . . . . . . . . . . . . . . . . . . . . . . . . . . . . . . . . 223 — 11 241 475
Total . . . . . . . . . . . . . . . . . . . . . . . . . . . . . . . . . . . . . . . . . . $17,150 $52 $1,420 $2,485 $21,107
106

December 31, 2019
(Amounts in thousands) SeveranceContract
TerminationAsset Write-
Downs/(Gains) Other Total
COS . . . . . . . . . . . . . . . . . . . . . . . . . . . . . . . . . . . . . . . . . . . . $2,183 $58 $ (1,782) $ 3,343 $ 3,802SG&A(1) . . . . . . . . . . . . . . . . . . . . . . . . . . . . . . . . . . . . . . . . . 2,211 — (18,429) 164 (16,054)Income tax expense(2) . . . . . . . . . . . . . . . . . . . . . . . . . . . . . . — — — (4,000) (4,000)
Total . . . . . . . . . . . . . . . . . . . . . . . . . . . . . . . . . . . . . . . . . . $4,394 $58 $(20,211) $ (493) $(16,252)
(1) Primarily consists of gains from the sales of non-strategic manufacturing facilities that are included in our Realignment Programs.
(2) Income tax expense (benefit) includes exit taxes as well as non-deductible costs.
The following is a summary of total inception to date charges, net of adjustments, related to the 2020
Realignment Program initiated in 2020:
2020 Realignment Program Inception to Date
(Amounts in thousands) SeveranceContract
TerminationAsset Write-
Downs Other Total
COS . . . . . . . . . . . . . . . . . . . . . . . . . . . . . . . . . . . . . . . . . . . . $15,244 $52 $1,412 $2,348 $19,056SG&A . . . . . . . . . . . . . . . . . . . . . . . . . . . . . . . . . . . . . . . . . . 84 — 14 278 376
Total . . . . . . . . . . . . . . . . . . . . . . . . . . . . . . . . . . . . . . . . $15,328 $52 $1,426 $2,626 $19,432
The following represents the activity, primarily severance, related to the restructuring reserve for the
Realignment Programs for the years ended December 31, 2020 and 2019:
(Amounts in thousands) 2020 2019
Balance at January 1, . . . . . . . . . . . . . . . . . . . . . . . . . . . . . . . . . . . . . . . . . . . . . . . . . . . . . . $ 6,703 $ 11,927Charges . . . . . . . . . . . . . . . . . . . . . . . . . . . . . . . . . . . . . . . . . . . . . . . . . . . . . . . . . . . . . . . 19,686 7,958Cash expenditures . . . . . . . . . . . . . . . . . . . . . . . . . . . . . . . . . . . . . . . . . . . . . . . . . . . . . . . (9,146) (12,865)Other non-cash adjustments, including currency . . . . . . . . . . . . . . . . . . . . . . . . . . . . . . . 1,012 (317)
Balance at December 31, . . . . . . . . . . . . . . . . . . . . . . . . . . . . . . . . . . . . . . . . . . . . . . . . . . . $18,255 $ 6,703
23. QUARTERLY FINANCIAL DATA (UNAUDITED)
The following presents a summary of the unaudited quarterly data for 2020 and 2019 (amounts in millions,
except per share data):
2020
Quarter 4th 3rd 2nd 1st
Sales . . . . . . . . . . . . . . . . . . . . . . . . . . . . . . . . . . . . . . . . . . . . . . . . . . . $985.3 $924.3 $925.0 $893.5Gross profit . . . . . . . . . . . . . . . . . . . . . . . . . . . . . . . . . . . . . . . . . . . . . 295.4 285.2 269.7 266.5Earnings before income taxes . . . . . . . . . . . . . . . . . . . . . . . . . . . . . . . 61.3 72.3 16.7 36.5Net earnings (loss) attributable to Flowserve Corporation . . . . . . . . 56.9 51.0 9.7 (1.3)Earnings (loss) per share(1):
Basic . . . . . . . . . . . . . . . . . . . . . . . . . . . . . . . . . . . . . . . . . . . . . . . . . $ 0.44 $ 0.39 $ 0.07 $ (0.01)Diluted . . . . . . . . . . . . . . . . . . . . . . . . . . . . . . . . . . . . . . . . . . . . . . . 0.43 0.39 0.07 (0.01)
2019
Quarter 4th 3rd 2nd 1st
Sales . . . . . . . . . . . . . . . . . . . . . . . . . . . . . . . . . . . . . . . . . . . . . . . . . . . $1,068.2 $995.7 $990.0 $885.8Gross profit . . . . . . . . . . . . . . . . . . . . . . . . . . . . . . . . . . . . . . . . . . . . . 349.5 332.9 317.9 289.0Earnings before income taxes . . . . . . . . . . . . . . . . . . . . . . . . . . . . . . . 90.9 84.4 77.4 69.7Net earnings attributable to Flowserve Corporation. . . . . . . . . . . . . . 72.6 59.8 54.0 52.4Earnings per share(1):
Basic . . . . . . . . . . . . . . . . . . . . . . . . . . . . . . . . . . . . . . . . . . . . . . . . . $ 0.55 $ 0.46 $ 0.41 $ 0.40Diluted . . . . . . . . . . . . . . . . . . . . . . . . . . . . . . . . . . . . . . . . . . . . . . . 0.55 0.45 0.41 0.40
(1) Earnings per share is computed independently for each of the quarters presented. The sum of the quarters may not equal the total year amountdue to the impact of changes in weighted average quarterly shares outstanding.
107

We have revised our consolidated financial statements for the annual periods 2019 and 2018, herein to correct
errors, as further discussed in Note 2 to the consolidated financial statements. We previously revised our consolidated
financial statements as of and for the quarterly period ended September 30, 2019 in connection with filing of the Form
10-Q for the period ended September 30, 2020 as filed on November 9, 2020. Other periods above have been derived
from our Quarterly Reports on Form 10-Q filed for the respective period, in each case adjusted to reflect the impact
of the revisions as described in Note 2 of this Annual Report. The consolidated financial statements for the quarterly
periods ended March 31, 2020 and June 30, 2020 will be revised in connection with the filing of each respective
period in 2021.
108

ITEM 9. CHANGES IN AND DISAGREEMENTS WITH ACCOUNTANTS ON ACCOUNTING ANDFINANCIAL DISCLOSURE
None.
ITEM 9A. CONTROLS AND PROCEDURES
Disclosure Controls and Procedures
Our disclosure controls and procedures (as defined in Rules 13a-15(e) and 15d-15(e) under the SecuritiesExchange Act of 1934, as amended (the ‘‘Exchange Act’’) are designed to provide reasonable assurance that theinformation, which we are required to disclose in the reports that we file or submit under the Exchange Act, isrecorded, processed, summarized and reported within the time periods specified in the U.S. SEC rules and forms, andthat such information is accumulated and communicated to our management, including our Principal ExecutiveOfficer and Principal Financial Officer, as appropriate to allow timely decisions regarding required disclosure.
In connection with the preparation of this Annual Report on Form 10-K for the year ended December 31, 2020,our management, under the supervision and with the participation of our Principal Executive Officer and ourPrincipal Financial Officer, carried out an evaluation of the effectiveness of the design and operation of our disclosurecontrols and procedures as of December 31, 2020. Based on this evaluation, our Principal Executive Officer andPrincipal Financial Officer concluded that our disclosure controls and procedures were effective at the reasonableassurance level as of December 31, 2020.
Management’s Report on Internal Control Over Financial Reporting
Our management, under the supervision and with the participation of our Principal Executive Officer andPrincipal Financial Officer, is responsible for establishing and maintaining adequate internal control over financialreporting, as such term is defined in Rules 13a-15(f) and 15d-15(f) under the Exchange Act. Internal control overfinancial reporting is a process designed to provide reasonable assurance regarding the reliability of financialreporting and the preparation of financial statements for external purposes in accordance with generally acceptedaccounting principles in the United States (‘‘U.S. GAAP’’). Internal control over financial reporting includes policiesand procedures that: (i) pertain to the maintenance of records that, in reasonable detail, accurately and fairly reflectthe transactions and dispositions of our assets; (ii) provide reasonable assurance that transactions are recorded asnecessary to permit preparation of financial statements in accordance with U.S. GAAP, and that our receipts andexpenditures are being made only in accordance with authorizations of our management and directors; and(iii) provide reasonable assurance regarding prevention or timely detection of unauthorized acquisition, use ordisposition of our assets that could have a material effect on the financial statements.
Under the supervision and with the participation of our Principal Executive Officer and Principal FinancialOfficer, our management conducted an assessment of our internal control over financial reporting as of December 31,2020, based on the criteria established in Internal Control - Integrated Framework (2013), issued by the Committeeof Sponsoring Organizations of the Treadway Commission (COSO). Based on this evaluation, our managementconcluded our internal control over financial reporting was effective as of December 31, 2020, based on criteria inInternal Control - Integrated Framework (2013) issued by the COSO.
The effectiveness of our internal control over financial reporting as of December 31, 2020, has been audited byPricewaterhouseCoopers LLP, our independent registered public accounting firm, as stated in their report, which isincluded herein.
Changes in Internal Control Over Financial Reporting
There were no changes in our internal control over financial reporting (as defined in Rules 13a-15(f) and15d-15(f) of the Exchange Act) during the quarter ended December 31, 2020 that have materially affected, or arereasonably likely to materially affect our internal control over financial reporting.
Other
Because of its inherent limitations, internal control over financial reporting may not prevent or detectmisstatements. Also, projections of any evaluation of effectiveness to future periods are subject to the risk thatcontrols may become inadequate because of changes in conditions, or that the degree of compliance with existingpolicies or procedures may deteriorate.
ITEM 9B. OTHER INFORMATION
None.
109

PART III
ITEM 10. DIRECTORS, EXECUTIVE OFFICERS AND CORPORATE GOVERNANCE
The information required in this Item 10 is incorporated by reference to all information under the captions
‘‘Security Ownership of Directors and Certain Executive Officers,’’ ‘‘Security Ownership of Certain Beneficial
Owners,’’ ‘‘Proposal One: Election of Directors,’’ ‘‘Executive Officers,’’ ‘‘Shareholder Proposals and Nominations,’’
‘‘Delinquent Section 16(a) Reports,’’ to the extent applicable, and ‘‘Certain Relationships and Related Transactions’’
in our definitive Proxy Statement relating to our 2021 annual meeting of shareholders.
We have adopted a Code of Conduct that applies to all of our directors, officers and employees, including our
Principal Executive, Principal Financial and Principal Accounting Officers, or persons performing similar functions.
Our Code of Conduct is available on the Company’s website at www.flowserve.com under the ‘‘Investors - Corporate
Governance’’ caption. We intend to disclose future amendments to certain provisions of the Code of Conduct, and
waivers of the Code of Conduct granted to executive officers and directors, on the website within four business days
following the date of the amendment or waiver.
ITEM 11. EXECUTIVE COMPENSATION
The information required in this Item 11 is incorporated by reference to all information under the captions
‘‘Executive Compensation,’’ ‘‘Proposal Two: Advisory Vote to Approve Executive Compensation,’’ ‘‘Delinquent
Section 16(a) Reports,’’ to the extent applicable, ‘‘Security Ownership of Directors and Certain Executive Officers,’’
‘‘Compensation Committee Interlocks and Insider Participation’’ and ‘‘Certain Relationships and Related
Transactions’’ in our definitive Proxy Statement relating to our 2021 annual meeting of shareholders.
ITEM 12. SECURITY OWNERSHIP OF CERTAIN BENEFICIAL OWNERS AND MANAGEMENT AND
RELATED STOCKHOLDER MATTERS
The information required in this Item 12 is incorporated by reference to all information under the captions
‘‘Security Ownership of Directors and Certain Executive Officers,’’ ‘‘Security Ownership of Certain Beneficial
Owners,’’ ‘‘Equity Compensation Plan Information’’ and ‘‘Executive Compensation’’ in our definitive Proxy
Statement relating to our 2021 annual meeting of shareholders.
ITEM 13. CERTAIN RELATIONSHIPS AND RELATED TRANSACTIONS, AND DIRECTOR
INDEPENDENCE
The information required in this Item 13 is incorporated by reference to all information under the captions ‘‘Role
of the Board; Corporate Governance Matters,’’ ‘‘Board Committees’’ and ‘‘Certain Relationships and Related
Transactions’’ in our definitive Proxy Statement relating to our 2021 annual meeting of shareholders.
ITEM 14. PRINCIPAL ACCOUNTANT FEES AND SERVICES
The information required in this Item 14 is incorporated by reference to all information under the caption ‘‘Other
Audit Information’’ in our definitive Proxy Statement relating to our 2021 annual meeting of shareholders.
110

PART IV
ITEM 15. EXHIBITS AND FINANCIAL STATEMENT SCHEDULES
(a) Documents filed as a part of this Annual Report:
1. Consolidated Financial Statements
The following consolidated financial statements and notes thereto are filed as part of this Annual Report:
Report of Independent Registered Public Accounting Firm
Flowserve Corporation Consolidated Financial Statements:
Consolidated Balance Sheets at December 31, 2020 and 2019:
For each of the three years in the period ended December 31, 2020:
Consolidated Statements of Income
Consolidated Statements of Comprehensive Income
Consolidated Statements of Shareholders’ Equity
Consolidated Statements of Cash Flows
Notes to Consolidated Financial Statements
2. Consolidated Financial Statement Schedules
The following consolidated financial statement schedule is filed as part of this Annual Report:
Schedule II — Valuation and Qualifying Accounts For each of the three years in the period ended
December 31, 2020: . . . . . . . . . . . . . . . . . . . . . . . . . . . . . . . . . . . . . . . . . . . . . . . . . . . . . . . . . . . . . . . . . . . 116
Financial statement schedules not included in this Annual Report have been omitted because they are not
applicable or the required information is shown in the consolidated financial statements or notes thereto.
3. Exhibits
ExhibitNo. Description
3.1 Restated Certificate of Incorporation of Flowserve Corporation, as amended and restated effective
May 26, 2020 (incorporated by reference to Exhibit 3.1 to the Registrant’s Current Report on Form 8-K
(File No. 001-13179) dated May 26, 2020).
3.2 Flowserve Corporation By-Laws, as amended and restated effective August 12, 2020 (incorporated by
reference to Exhibit 3.1 to the Registrant’s Current Report on Form 8-K (File No. 001-13179) dated
August 12, 2020).
4.1 Senior Indenture, dated September 11, 2012, by and between Flowserve Corporation and U.S. Bank
National Association, as trustee (incorporated by reference to Exhibit 4.1 to the Registrant’s Current
Report on Form 8-K (File No. 001-13179) dated September 11, 2012).
4.2 First Supplemental Indenture, dated September 11, 2012, by and among Flowserve Corporation, certain
of its subsidiaries and U.S. Bank National Association, as trustee (incorporated by reference to
Exhibit 4.2 to the Registrant’s Current Report on Form 8-K (File No. 001-13179) dated September 11,
2012).
4.3 Second Supplemental Indenture, dated November 1, 2013, by and among Flowserve Corporation, certain
of its subsidiaries and U.S. Bank National Association, as trustee (incorporated by reference to
Exhibit 4.2 to the Registrant’s Current Report on Form 8-K (File No. 001-13179) dated November 1,
2013).
4.4 Third Supplemental Indenture, dated March 17, 2015, by and among Flowserve Corporation, certain of
its subsidiaries and U.S. Bank National Association, as trustee (incorporated by reference to Exhibit 4.2
to the Registrant’s Current Report on Form 8-K (File No. 001-13179) dated March 17, 2015).
111

ExhibitNo. Description
4.5 Fourth Supplemental Indenture, dated September 21, 2020, between Flowserve Corporation and U.S.
Bank National Association, as trustee (incorporated by reference to Exhibit 4.2 to the Registrant’s
Current Report on Form 8-K dated September 22, 2020).
4.6 Description of Registrant’s Securities (incorporated by reference to Exhibit 4.5 to the Registrant’s Annual
Report on Form 10-K (File No. 001-13179) dated February 18 2020).
10.1 Credit Agreement, dated July 16, 2019, among Flowserve Corporation, Bank of America, N.A., as
swingline lender, letter of credit issuer and administrative agent and the other lenders referred to therein
(incorporated by reference to Exhibit 10.1 to the Registrant’s Current Report on Form 8-K (File No. 001-
13179) dated July 16, 2019).
10.2 First Amendment to Credit Agreement, dated September 4, 2020, among Flowserve Corporation, Bank
of America, N.A., as administrative agent, and the other lenders referred to therein (incorporated by
reference to Exhibit 10.1 to the Registrant’s Current Report on Form 8-K dated September 8, 2020).
10.3 Amended and Restated Flowserve Corporation Director Cash Deferral Plan, effective January 1, 2009
(incorporated by reference to Exhibit 10.7 to the Registrant’s Annual Report on Form 10-K (File No. 001-
13179) for the year ended December 31, 2008).*
10.4 Amended and Restated Flowserve Corporation Director Stock Deferral Plan, dated effective January 1,
2009 (incorporated by reference to Exhibit 10.8 to the Registrant’s Annual Report on Form 10-K (File
No. 001-13179) for the year ended December 31, 2008).*
10.5 Trust for Non-Qualified Deferred Compensation Benefit Plans, dated February 11, 2011 (incorporated by
reference to Exhibit 10.8 to the Registrant’s Annual Report on Form 10-K (File No. 001-13179) for the
year ended December 31, 2010).*
10.6 Flowserve Corporation Deferred Compensation Plan (incorporated by reference to Exhibit 10.23 to the
Registrant’s Annual Report on Form 10-K (File No. 001-13179) for the year ended December 31, 2000).*
10.7 Amendment No. 1 to the Flowserve Corporation Deferred Compensation Plan, as amended and restated,
effective June 1, 2000 (incorporated by reference to Exhibit 10.50 to the Registrant’s Annual Report on
Form 10-K (File No. 001-13179) for the year ended December 31, 2002).*
10.8 Amendment to the Flowserve Corporation Deferred Compensation Plan, dated December 14, 2005
(incorporated by reference to Exhibit 10.70 to the Registrant’s Annual Report on Form 10-K
(File No. 001-13179) for the year ended December 31, 2004).*
10.9 Amendment No. 3 to the Flowserve Corporation Deferred Compensation Plan, as amended and restated
effective June 1, 2000 (incorporated by reference to Exhibit 10.22 to the Registrant’s Annual Report on
Form 10-K (File No. 001-13179) for the year ended December 31, 2007).*
10.10 Flowserve Corporation Senior Management Retirement Plan, amended and restated effective
November 2, 2018 (incorporated by reference to Exhibit 10.13 to the Registrant’s Annual Report on Form
10-K (File No. 001-13179) for the year ended December 31, 2018).*
10.11 Flowserve Corporation Supplemental Executive Retirement Plan, amended and restated effective
November 2, 2018 (incorporated by reference to Exhibit 10.14 to the Registrant’s Annual Report on Form
10-K (File No. 001-13179) for the year ended December 31, 2018).*
10.12 Flowserve Corporation Equity and Incentive Compensation Plan (incorporated by reference to Appendix
A to the Registrant’s Proxy Statement on Schedule 14A (File No. 001-13179) dated April 3, 2009).*
10.13 Flowserve Corporation 2020 Long-Term Incentive Plan (incorporated by reference to Appendix A to the
Registrant’s Proxy Statement on Schedule 14A (File No. 001-13179) dated April 11, 2019).*
10.14 Form of Restrictive Covenants Agreement for Officers (incorporated by reference to Exhibit 10.1 to the
Registrant’s Current Report on Form 8-K (File No. 001-13179) dated as of March 9, 2006).*
10.15 Form of Indemnification Agreement for all Directors and Officers (incorporated by reference to Exhibit
10.47 to the Registrant’s Annual Report on Form 10-K (File No. 001-13179) for the year ended
December 31, 2015).
10.16 Offer Letter, dated as of February 6, 2017, by and between Flowserve Corporation and R. Scott Rowe
(incorporated by reference to Exhibit 10.1 to the Registrant’s Current Report on Form 8-K (File No. 001-
13179) dated as of February 8, 2017).*
112

ExhibitNo. Description
10.17 Flowserve Corporation Change In Control Severance Plan, amended and restated effective November 2,
2018 (incorporated by reference to Exhibit 10.1 to the Registrant’s Quarterly Report on Form 10-Q
(File No. 001-13179) for the quarter ended September 30, 2018).*
10.18 Flowserve Corporation Executive Officer Severance Plan, as amended and restated effective
November 2, 2018 (incorporated by reference to Exhibit 10.20 to the Registrant’s Annual Report on
Form 10-K (File No. 001-13179) for the year ended December 31, 2018).*
10.19 Flowserve Corporation Annual Incentive Plan, as amended and restated effective February 14, 2017
(incorporated by reference to Exhibit 10.44 to the Registrant’s Annual Report on Form 10-K
(File No. 001-13179) for the year ended December 31, 2016).*
10.20 Amendment to Flowserve Corporation Annual Incentive Plan (incorporated by reference to Exhibit 10.1
to the Registrant’s Quarterly Report on Form 10-Q (File No. 001-13179) for the quarter ended March 31,
2020).*
10.21 Form of Restrictive Covenants Agreement for Officer (incorporated by reference to Exhibit 10.1 to the
Registrant’s Quarterly Report on Form 10-Q (File No. 001-13179) for the quarter ended June 30, 2020).*
10.22 Form of Restricted Stock Unit Agreement for certain officers pursuant to the Flowserve Corporation 2020
Long-Term Incentive Plan (incorporated by reference to Exhibit 10.2 to the Registrant’s Quarterly Report
on Form 10-Q (File No. 001-13179) for the quarter ended June 30, 2020).*
10.23 Form of Performance Restricted Stock Unit Agreement for certain officers pursuant to the Flowserve
Corporation 2020 Long-Term Incentive Plan (TSR) (incorporated by reference to Exhibit 10.3 to the
Registrant’s Quarterly Report on Form 10-Q (File No. 001-13179) for the quarter ended June 30, 2020).*
10.24 Form of Performance Restricted Stock Unit Agreement for certain officers pursuant to the Flowserve
Corporation 2020 Long-Term Incentive Plan (ROIC) (incorporated by reference to Exhibit 10.4 to the
Registrant’s Quarterly Report on Form 10-Q (File No. 001-13179) for the quarter ended June 30, 2020).*
14.1 Flowserve Corporation Employee Code of Conduct (incorporated by reference to Exhibit 14.1 to the
Registrant’s Current Report on Form 8-K (File No. 001-13179) dated as of August 15, 2019).
21.1+ Subsidiaries of the Registrant.
23.1+ Consent of PricewaterhouseCoopers LLP.
31.1+ Certification of Principal Executive Officer pursuant to Exchange Act Rules 13a-14(a) and 15d-14(a), as
adopted pursuant to Section 302 of the Sarbanes-Oxley Act of 2002.
31.2+ Certification of Principal Financial Officer pursuant to Exchange Act Rules 13a-14(a) and 15d-14(a), as
adopted pursuant to Section 302 of the Sarbanes-Oxley Act of 2002.
32.1++ Certification of Principal Executive Officer pursuant to 18 U.S.C. Section 1350, as adopted pursuant to
Section 906 of the Sarbanes-Oxley Act of 2002.
32.2++ Certification of Principal Financial Officer pursuant to 18 U.S.C. Section 1350, as adopted pursuant to
Section 906 of the Sarbanes-Oxley Act of 2002.
101.INS Inline XBRL Instance Document - the instance document does not appear in the Interactive Data File
because its XBRL tags are embedded within the Inline XBRL document.
101.SCH Inline XBRL Taxonomy Extension Schema Document
101.CAL Inline XBRL Taxonomy Extension Calculation Linkbase Document
101.DEF Inline XBRL Taxonomy Extension Definition Linkbase Document
101.LAB Inline XBRL Taxonomy Extension Label Linkbase Document
101.PRE Inline XBRL Taxonomy Extension Presentation Linkbase Document
104 The cover page from the Company’s Annual Report on Form 10-K for the year ended December 31,
2020, formatted in Inline XBRL (included as Exhibit 101).
* Management contracts and compensatory plans and arrangements required to be filed as exhibits to this Annual Report on Form 10-K.
+ Filed herewith.
++ Furnished herewith.
ITEM 16. FORM 10-K SUMMARY
None
113

SIGNATURES
Pursuant to the requirements of Section 13 or 15(d) of the Securities Exchange Act of 1934, the registrant has
duly caused this report to be signed on its behalf by the undersigned, thereunto duly authorized.
FLOWSERVE CORPORATION
By: /s/ R. Scott Rowe
R. Scott Rowe
President and Chief Executive Officer
Date: February 23, 2021
114

Pursuant to the requirements of the Securities Exchange Act of 1934, this report has been signed below by the
following persons on behalf of the registrant and in the capacities and on the date indicated.
Signature Title Date
/s/ Roger L. Fix Non-Executive Chairman of the Board February 23, 2021
Roger L. Fix
/s/ R. Scott Rowe President, Chief Executive Officer and
Director (Principal Executive Officer)
February 23, 2021
R. Scott Rowe
/s/ Amy B. Schwetz Senior Vice President and Chief Financial
Officer (Principal Financial Officer)
February 23, 2021
Amy B. Schwetz
/s/ Scott K. Vopni Vice President and Chief Accounting Officer
(Principal Accounting Officer)
February 23, 2021
Scott K. Vopni
/s/ Sujeet Chand Director February 23, 2021
Sujeet Chand
/s/ Ruby R. Chandy Director February 23, 2021
Ruby R. Chandy
/s/ Gayla J. Delly Director February 23, 2021
Gayla J. Delly
/s/ John R. Friedery Director February 23, 2021
John R. Friedery
/s/ John L. Garrison Director February 23, 2021
John L. Garrison
/s/ Michael C. McMurray Director February 23, 2021
Michael C. McMurray
/s/ David E. Roberts Director February 23, 2021
David E. Roberts
/s/ Carlyn R. Taylor Director February 23, 2021
Carlyn R. Taylor
115

FLOWSERVE CORPORATION
Schedule II — Valuation and Qualifying Accounts
For the Years Ended December 31, 2020, 2019 and 2018
Description
Balance atBeginning of
Year
AdditionsCharged toCost andExpenses
AdditionsCharged to
OtherAccounts—Acquisitionsand RelatedAdjustments
DeductionsFrom
ReserveBalance at
End of Year
(Amounts in thousands)
Year Ended December 31, 2020
Allowance for doubtful accounts(a): . . . . . . . . . . . . $ 47,269 18,929 — (6,918) $ 59,280
Allowance for other short-term receivables . . . . . . 6,144 9,753 — — 15,897
Allowance for long-term receivables . . . . . . . . . . . 198,957 3,557 — (15) 202,499
Deferred tax asset valuation allowance(b): . . . . . . . 266,414 50,327 (529) (28,425) 287,787
Year Ended December 31, 2019
Allowance for doubtful accounts(a): . . . . . . . . . . . . 51,501 3,762 — (7,994) 47,269
Allowance for other short-term receivables . . . . . . — 6,144 — — 6,144
Allowance for long-term receivables . . . . . . . . . . . 182,872 16,161 — (76) 198,957
Deferred tax asset valuation allowance(b): . . . . . . . 133,929 145,010 1,832 (14,357) 266,414
Year Ended December 31, 2018
Allowance for doubtful accounts(a): . . . . . . . . . . . . 59,113 8,050 — (15,662) 51,501
Allowance for long-term receivables . . . . . . . . . . . 171,340 13,099 — (1,567) 182,872
Deferred tax asset valuation allowance(b): . . . . . . . 119,309 32,157 (7,551) (9,986) 133,929
(a) Deductions from reserve represent accounts written off and recoveries related to trade accounts receivables.
(b) Deductions from reserve result from the expiration or utilization of net operating losses and foreign tax credits previously reserved.
Additions in 2020 includes capital loss carryforward. Refer to Note 19 to our consolidated financial statements included in Item 8 of this
Annual Report.
116

CORPORATE INFORMATION
Board of Directors
Roger L. FixNon-Executive Chairman of the Board Former President, Chief Executive Officer, Standex International Corporation
R. Scott RowePresident and CEO, Flowserve Corporation
Sujeet ChandSenior Vice President and Chief Technology Officer, Rockwell Automation
AUDIT COMMITTEE FINANCE & RISK COMMITTEE
Ruby R. ChandyFormer President, Industrial Division, Pall Corporation
ORGANIZATION & COMPENSATION COMMITTEE FINANCE & RISK COMMITTEE (CHAIR)
Gayla J. DellyFormer President and CEO, Benchmark Electronics, Inc.
ORGANIZATION & COMPENSATION COMMITTEE CORPORATE GOVERNANCE & NOMINATING COMMITTEEE
John R. FriederyFormer Senior Vice President, Ball Corporation President, Metal Beverage Packaging, Americas & Asia
AUDIT COMMITTEE CORPORATE GOVERNANCE & NOMINATING COMMITTEE (CHAIR)
John L. GarrisonChairman, President and CEO, Terex Corporation
ORGANIZATION & COMPENSATION COMMITTEE CORPORATE GOVERNANCE & NOMINATING COMMITTEE
Michael C. McMurrayExecutive Vice President and Chief Financial Officer, LyondellBasell Industries N.V.
AUDIT COMMITTEE (CHAIR) FINANCE & RISK COMMITTEE
David E. RobertsFormer Chief Executive Officer, Gavilan Resources, LLC
ORGANIZATION & COMPENSATION COMMITTEE (CHAIR) FINANCE & RISK COMMITTEE
Carlyn R. TaylorGlobal Co-Leader of Corporate Finance of FTI Consulting, Chairperson of FTI Capital Advisors
AUDIT COMMITTEE CORPORATE GOVERNANCE & NOMINATING COMMITTEE
Executive OfficersR. Scott Rowe President and Chief Executive Officer
Elizabeth L. Burger Senior Vice President, Chief Human Resources Officer
Sanjay K. Chowbey President, Aftermarket Services & Solutions
Keith E. Gillespie Senior Vice President, Chief Sales Officer
Lanesha T. Minnix Senior Vice President, Chief Legal Officer and Corporate Secretary
Tamara M. Morytko President, Flowserve Pumps Division
Amy B. Schwetz Senior Vice President, Chief Financial Officer
Kirk R. Wilson President, Flow Control Division
John (Jay) E. Roueche, III Vice President, Treasurer and Investor Relations
Scott K. Vopni Vice President, Chief Accounting Officer
Corporate InformationWorld Headquarters 5215 North O’Connor Blvd Suite 2300 Irving, Texas 75039 Telephone: 972-443-6500 Facsimile: 972-443-6800
Transfer Agent For stock and legal transfers, changes of address, lost stock certificates, elimination of duplicate mailings of shareholder information or general inquiries about stock ownership, contact:
EQ Shareowner Services 1110 Centre Point Curve, Suite 101 Mendota Heights, MN 55120-4100
Stock Exchange Listing Flowserve Corporation common stock is listed on the New York Stock Exchange (NYSE) and traded under the symbol FLS. The company’s records show that at March 26, 2021, 130,568,916 shares of Flowserve common stock were outstanding
(excluding treasury shares). On March 26, 2021, the company’s records showed approximately 965 shareholders of record.
Availability of Forms Filed with the Securities and Exchange Commission Shareholders may obtain, without charge, copies of the following documents as filed with the Securities and Exchange Commission:
• Annual Reports on Form 10-K• Quarterly Reports on Form 10-Q• Current Reports on Form 8-K• Changes in Beneficial Ownership• Proxy Statements
Copies may be obtained by accessing the company’s website or by providing a written request for such copies or additional information about Flowserve operating or financial performance to:
Investor Relations Flowserve Corporation 5215 North O’Connor Blvd, Suite 2300 Irving, Texas 75039 972-443-6500 [email protected]
To obtain additional information on Flowserve, please visit the company’s website at www.flowserve.com.
Firms That Have Provided Equity Research Coverage on Flowserve Include:Bank of America Merrill LynchCitiCowen & Co.Credit SuisseJeffriesGoldman Sachs & Co.Morgan StanleyOppenheimer & Co.RBC Capital MarketsRobert W. Baird & Co.Stifel Nicolaus & Co.UBS EquitiesVertical Research Partners
Flowserve, Accord, Anchor Darling, Argus, Atomac, Automax, BW Seals,
Byron Jackson, Calder, Durametallic, Durco, Edward, GASPAC, IDP,
INNOMAG, Interseal, IPS, Kämmer, Lawrence, Limitorque, Logix, McCANNA,
NAF, Niigata Worthington, Noble Alloy, Norbro, Nordstrom, Pac-Seal,
Pacific Wietz, PMV, Scienco, Serck Audco, SIHI, TKL, United Centrifugal,
Valbart, Valtek, Worcester Controls and Worthington are all trademarks
of Flowserve Corporation.

FLOWSER
VE
20
20 AN
NU
AL R
EPO
RT
North America
Latin America
Europe
Middle East
Africa
Asia Pacific
Flowserve Corporation5215 North O’Connor Blvd
Suite 2300
Irving, Texas 75039
flowserve.com
FLS-AR-2020