R.graphicsinterface.org/wp-content/uploads/gi1989-37.pdf · The PDMS also manages fluid bal ......
8
275 An Intensive Care Unit Patient Data Management System J. F. Panisset . S. Malowany. N. Khoury. D. Lambidonis, A.S. Malowany F .A. Carnevalet , R. Gottesman t, and A. Rousseau t Computer Vision and Robotics Lab oratory Department of Electrical Engin eerin g McGill Univer sity Montreal. Qu e bec. Canada Abstract A Patient Data Management System is being developed for the intensive care unit at the Montreal Children's Hos- pital. A number of bed s ide instrumentation monitors are linked by a local ar ea ne twork to a personal computer for acquisition of real time data and the interactive graphical display of their trend s. The PDMS also manages fluid bal- ance data , medical dosag e computat ions based on the pa - tient data , and medical obs ervations. Th e data is managed and intera ctively displayed for on - line use by the medical pro- fessionals . is printed for the generation of spec ial forms and summary reports , and is archived for s torage and retrieval. The project involves de signing and developing software for an IBM PS/2 equipp ed with an 8514/ A high resolution color video display , and runn ing under the OS / 2 multitasking op- erating system . The de s ign and implementation of the basic components of the system are outlined, with emphasis on their user interface . Future extensions are al so discussed . KEYWORDS : Data Management Sys tem , User Inter- face, Mult itasking Operating System , Intensive Care Unit. Resume Un Systeme de Ge stion de Donnees Medicales est en cours de de velopement 11 I'unite de soins intensifs de I'H6pital pour Enfants de Montr eal. Plusieurs moniteurs de son des medicales places au chevet des patients sont relies par un reseau local de communication 11 un ordinateur personnel pour I'acquisition de donnees en temps reel et pour I'affi- chage graphique interactif de leur tendances . Le SGDM gere aussi les donnes de balance des fluides , les calculs de dosages medicaux bases sur le s donnees des patients et les observa- tions medicales . Les donnes sont geres et interactivement presentees pour I' utilisation en direct du personnel medical. Elles sont imprimees pour la generation de formulaires spe- ciaux et de rapports re capitulatifs et sont achivees pour un rangement et un rappel faciles . Le projet implique la concep- tion et le developement de logiciel pour un ordinateur IBM PS/2 equippe d ' un e cran 8514/A de haute resolution gra- phique, et fonctionnant s ous le syseme d'exploitation OS/ 2 11 traitement multit1khe . La conception et la realisation des composants de base du s ysteme sont decrites , souligna nt t Pediatric Intensive Care Unit Montr ea l Children 's Hospital 2300 Tupper St.. Montreal. Qu ebec .. H3H lP 3 I'interface avec I'usager . Les extensions envisagees sont aussi discutees . I- Introduction In the critical environment of hospital Intensive Care Units (ICU) , trends are shifting toward s a higher degree of automation , at least for patient informat ion management. Such trends are refle cted in the opinions of professionals [REPL85 , CARN86, NOLA87) as we ll as of manufactur- ers [HPMP87) . As a result , a variety of works are being carried out in different hospitals and companies , and have been described for example in [MARU83 , DEAN85 , DAVE87, EMTE88) . In this paper , we shall outline the Patient Data Management System (PDMS) being developed for the ICU at the Montreal Children's Ho spital. with spec ial e mpha s is on the graphical user interface being in c orporated into its design. II- Background The Patient Data Management Sys tem is a computer based information management system for handling patient data in the intensive care unit at th e hospital. Th e PDMS must accommodate the needs of patients ranging from new- born s to adolescents , handling data measured electronically with physiological monitoring equipment , data measured at the bedsid e, and data made available from other departments such as lab test results . The function of the PDMS is to monitor and record all patient data , to facilitate the review and interpretation of the data by presenting CRT displays of trends , plots , charts , and to assist in the hard copy docu - mentation requirements by generating useful form s and re- quired reports [SHAB86) . The main motivation for the development of the PDMS stems from the severe limitations of the current manual charting methods . Data must be read periodically by the nursing staff from on-line instruments and from infusion and drainag e systems . This data is then plotted as points on a graph or ente red as numbers in tables which must be ac- cumulat ed for meaningful interpretat ion . This proce dure is te dious and error prone because of th e stressful nature of the IC U environment. Furthermore, taking a single or a few Graphics Interface '89
-
Upload
doannguyet -
Category
Documents
-
view
218 -
download
0
Transcript of R.graphicsinterface.org/wp-content/uploads/gi1989-37.pdf · The PDMS also manages fluid bal ......

275
An Intensive Care Unit Patient Data Management System
J. F. Panisset . S . Malowany. N. Khoury. D. Lambidonis , A.S. Malowany
F .A. Carnevalet , R. Gottesmant , and A. Rousseau t
Computer Vision and Robotics Laboratory Department of Electrical Engineering
McGill University Montreal. Quebec. Canada
Abstract
A Patient Data Management System is being developed for the intensive care unit at the Montreal Children 's Hospital. A number of beds ide instrumentation monitors are linked by a local area network to a personal computer for acquisition of real time data and the interactive graphical display of their trends . The PDMS also manages fluid balance data , medical dosage computations based on the patient data , and medical observations . The data is managed and interactively displayed for on-line use by the medical professionals . is printed fo r the generation of s pecial forms and summary reports , and is archived for s torage and retrieval. The project involves des igning and developing software for an IBM PS/2 equipp ed with an 8514/ A high resolution color video display, and runn ing under the OS / 2 multitasking operating system. The des ign and implementation of the basic components of the system are outlined , with emphasis on their user interface. Future extensions are al so discussed .
KEYWORDS: Data Management System , User Interface, Mult itasking Operating System , Intensive Care Unit.
Resume
Un Systeme de Gestion de Donnees Medicales est en cours de developement 11 I'unite de soins intens ifs de I'H6pital pour Enfants de Montreal. Plusieurs moniteurs de son des medicales places au chevet des patients sont relies par un reseau local de communication 11 un ordinateur personnel pour I'acquisition de donnees en temps reel et pour I'affichage graphique interactif de leur tendances . Le SGDM gere aussi les donnes de balance des fluides , les calculs de dosages medicaux bases sur les donnees des patients et les observations medicales . Les donnes sont geres et interactivement presentees pour I' utilisation en direct du personnel medical. Elles sont imprimees pour la generation de formulaires speciaux et de rapports recapitulatifs et sont ach ivees pour un rangement et un rappel faciles . Le projet implique la conception et le developement de logiciel pour un ordinateur IBM PS/2 equippe d ' un ecran 8514/A de haute resolution graphique , et fonctionnant sous le syseme d 'exploitation OS / 2 11 traitement multit1khe . La conception et la realisation des composants de base du s ysteme sont decrites , souligna nt
t Pediatric Intensive Care Unit Montrea l Children 's Hospital
2300 Tupper St.. Montreal. Quebec .. H3H lP3
I'interface avec I'usager . Les extensions envisagees sont aussi discutees .
I- Introduction
In the critical environment of hospital Intensive Care Units (ICU) , trends are shifting towards a higher degree of automation , at least for patient information management. Such trends are reflected in the opinions of professionals [REPL85 , CARN86 , NOLA87) as well as of manufacturers [HPMP87) . As a result , a var iety of works are being carried out in different hospitals and companies , and have been described for example in [MARU83 , DEAN85 , DAVE87 , EMTE88) . In this paper , we shall outline the Patient Data Management System (PDMS) being developed for the ICU at the Montreal Children 's Hos pital. with special emphas is on the graphical user interface being incorporated into its design.
II- Background
The Patient Data Management System is a computer based information management system for handling patient data in the intensive care unit at the hos pital. The PDMS must accommodate the needs of patients ranging from newborns to adolescents , handling data meas ured electronically with physiological monitoring equipment , data measured at the bedside, and data made available from other departments such as lab test results . The function of the PDMS is to monitor and record all patient data , to facilitate the review and interpretation of the data by presenting CRT displays of trends , plots , charts , and to assist in the hard copy documentation requirements by generating useful form s and required reports [SHAB86) .
The main motivation for the development of the PDMS stems from the severe limitations of the current manual charting methods . Data must be read periodically by the nursing staff from on-line instruments and from infusion and drainage systems. This data is then plotted as points on a graph or entered as numbers in tables which must be accumulated for meaningful interpretation . This procedure is tedious and error prone because of the s tressful nature of the IC U environment. Furthermore , taking a single or a few
Graphics Interface '89

readings at a given time may not reflect accurately the behavior over the previous time interval. Finally. such results as paper graphs cannot be manipulated easily. and hence limits their use as diagnostic tools .
Since most of this data is coming in real time from electronic measuring equipment. it is desired to collect this raw data so that in can be stored for later retrieval. By interfacing directly to the electronic monitoring system. the PDMS will eliminate the burden and errors of manual data recording and computation. freing the staff to give better patient care. A dedicated computer system can continuously monitor and log the patient data . allowing the replay of data which otherwise could be lost. Furthermore. the PDMS can help correlate this bedside data with data from other sources . It would undoubtedly improve the quality of patient care.
A number of commercial systems are available to address the needs of a hospital ICU but they all suffer from criticisms . The most frequent one relates to their user interface : it must always be kept in mind that in a stressful environment such as the ICU . the primary users (nurses) will have no tolerance for a system which is difficult to use or that does not address their needs explicitly. Thus the use of a flexible graphical user interface is justified to promote acceptance of the system by the users . Another aspect concerns the integration with the hospital computing facilities and the lack of customization capabilities of many commercial systems . Finally. some commercial systems have imposing hardware requirements. roughly the equivalent of an engineering workstation at every bedside [EMTE88] .
Ill. Basic System Requirements
The following objectives were incorporated in the PDMS being developed:
1. Meeting the need of the heal th care professional and developing a system that is both powerful and easy to use .
2. Facilitating the interactive review of patient data .
3. Collecting the physiological data directly from the bedside monitors .
4 . Providing convenient access for manual data input and retrieval.
5. Integrating the PDMS with the hospital computer network .
6. Providing a backup mechanism and hardware redundancy.
IV. The System Hardware
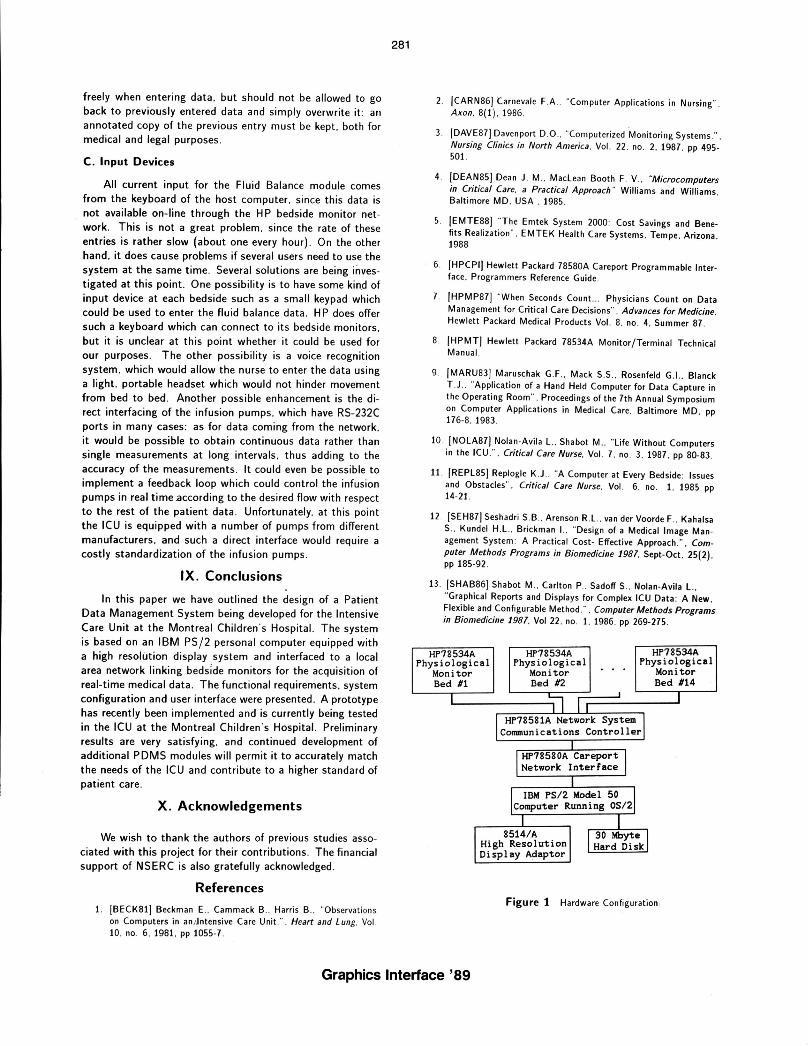
The hardware configurat ion is presented in figure 1. It is based on the Hewlett- Packard CareNet system which provides a local area network for linking multiple HP 78532A Physiological Monitor / Terminals [HPMT] to a HP 78581A Network System Communications Controller . The HP 78580A Careport is used as a programmable interface between the
276
network controller and the host computer system . converting the proprietary format signals of the network to standard RS-232C messages which can be understood by the host [HPCPI] .
Fourteen such bedside monitors have been installed and in operation for over two years . providing stand- alone data management capabilities including automatic smoothing of measured parameters . real-time display of measured data and analysis of some parameters (such as arrythmia analysis for the heart rate trend) . Optional measurement modules can be plugged in as well as a keypad for manual data entry. The network controller and interface have been recently installed . and are being used in the development of the system .
The host computer system presently consists of an I BM PS/2 model 50 computer with an 80286 processor . 5 Mbytes of memory. a 30 Mbyte hard disk. the IBM 8514/A high resolution (1024x768) display adapter . and running version 1.0 of the IBM OS / 2 operating s ystem. The final configuration of this system will use two such computers running in parallel to ensure fault -tolerant operation . The first implementation of the PDMS was developed for an EGA screen. The high resolution display adapter was only recently acquired but supports the previously used EGA/VGA modes . Because of this. the transition to high resolution only affected the graphical modules . The iss ues involved in this conversion will be discussed further .
V. Software Environment
A. Operating System Considerations
Although this project has been in the design stages for some time now . previous efforts have been hampered by the lack of availability of a proper multitasking operating system for IBM personal computers. The release of the OS/2 system in late 1987 has changed this situation : the benefits of a multitasking operating system are so great that it was decided to modify the design of the PDMS to implement it under OS / 2. Clearly. instead of having to design the PDMS as a si ngle program to perform all the necessary tasks . it is now possible to write sepa rate programs to implement the required functions such as network data acquisition. graphical trend display. fluid intake/output management . Each of these modules runs separately. and the interfaces between them are defined in terms of such operating system structures as pipes. semaphores and shared memory segments. thus minimizing the possibility of harmful interaction between these modules . Furthermore . it then becomes easy to add more modules as the design progresses. In this case. the addition of an expert system shell which can make decisions on the basis of the available patient data is planned . With the choice of OS /2 as an operating system. the preferred language for this project was C. in this case the Microsoft C 5.1 compiler . Some assembly language procedures were a lso used .
Graphics Interface '89

B. PDMS Modules
As outlined above . the availability of a multitasking operating system has allowed the design of the PDMS as a series of interacting modules. The modules which have been implemented as of now are:
1. The System Manager. which starts up the other modules and acts as a main menu to allow the user to go from one module to the next.
2. The Data Link Controller . which interfaces to the network of bedside monitors through the Careport network interface and an RS-232 link . This module is responsible for data acquisition . data storage. and transmitting commands from other modules to the network (such as when adding a new patient to the network) . This module requires no user interaction . and thus can run in the background. .
3. The Patient Registration Module. which takes care of admitting and discharging patients and managing "admin is trative" patient information such as name. hospital number etc .. . This information is made available to the other modules of the system .
4 . The Trend Display Module . which allows the health care professional to review the data acquired from the bedside monitors as graphical trends .
5. The Fluid Balance Modul e. which uses a spreadsheet format to manage the recording of all substances which are taken in (ingesta) and put out (excreta) by a given patient .
C. Overall System Organization
The overall organization of these modules into a coherent system presenting a cohsistent user interface was dictated at least partly by the constraints of the currently available version of the OS/2 operating system (i .e. version 1.0) . This organization of the variou s modules is summarized in figure 2. Contrary to the true graphics-based windowing environment (the P resentation Manager) recently available with release 1.1. OS /2 version 1.0 supports only text modes of operation . Thus to allow several applications running concurrently to share the display without conflicts . OS/2 introduces the concept of a screen group : each applicalion runs in its own screen group . which can be either in the foreground (currently displayed on the screen) or in the background (invisible . but yet still able to run) . Tasks can be swapped in and out of the foreground through the use of a "hot-key" combination. Only the screen group currently in the foreground has access to the input devices (keyboard . mouse) . but tasks in the background can still output to the display : their output is routed to a Logical Video Buffer (LVB) which is redrawn on the screen when the task is brought to the foreground .
Each of the PDMS modules outlined previously runs as a separate screen group . The Data Link Controller is run as
277
a detached process (i .e. it cannot be brought to the foreground) since it does not require user interaction . This is represented by the absence of an arrow to the Screen Display box in fig 2. The Manager module is first started . and it takes care of starting up the other modules as "children" screen groups . The Manager presents a menu which allows the user to select which module is to be used . It then brings this module to the foreground . where the user can interact ' with it. When the user wants to return to the Manager menu . the appropriate command is selected inside the module. which then s ignals the Manager by raising a semaphore that it is ready to return to the background . The Manager then brings itself back to the foreground and awaits further action by the user . This mechan ism is needed since a child screen group cannot affect the foreground/background status of its parent.
The screen swapping needed to implement the screen group concept is entirely managed by OS/2: unfortunately. this is only completely true for text modes of operation. For now. text mode is being used for the Manager module. the Patient Registration module and the Fluid Balance module : clearly. these modules deal mainly with textual data . and thus are not hampered by this restriction . As for the graphics needed to implement the Trends Display module . they involve more complex system programming issues . The only support OS/2 version 1.0 has for graphics mode programming is a system call to set the current graphics mode: everything else is up to the programmer . This topic will be discussed further .
By implementing each module as a separate screen . the PDMS retains a hierarchical structure which facilitates its comprehension : users become accustomed to having to pass through the ma in Manager menu to access any module. On the other hand . a more flexible arrangement could ' prove to be more productive by minimizing such "menu navigation": one way to implement this would be through the use of a windowing environment . such as the Presentation Manager (version 1.1 of OS / 2) . Each module could thus reside in its own window. which could be freely moved around and resized . The Manager menu . as well as other menus could be implemented as pull-down menus from a standard "menu bar". Although s uch a window-menu-mouse paradigm has proven to be useful in helping new users master complex software systems. it is unclear whether it could really enhance the function of the PDMS . It can safely be assumed that the users of the PDMS would each receive adequate training . and thus could be taught to use a more traditional user interface based on function keys and menus effectively. Too much freedom and flexibility might cause more confusion than necessary. Furthermore. the large overhead generated by a windowing environment must be kept in mind . especially since response time is always a critical factor in the acceptance of any software system by its users. This issue is currently being investigated .
VI. Overall System User Interface
Careful design of the system user interface is seen as the key to the success of this project. as most of the sys-
Graphics Interface '89
tems used in ICUs have met with very limited success mainly because of a poor user interface design . The principal criticism by nurses and physicians of alternate packages was their lack of "user-friendliness" . In fact, nurses were asked to think like engineers or computer experts in order to take advantage of this new technology. Also, the lack of involvement of the users in the initial planning caused some serious limitations as software packages could not be corrected or modified [BECK81] . All of these factors contributed to resistance to the technological innovations available for ICUs as PDMSs came short of fulfilling their initial objective of relieving the workload of nurses and doctors. It must always be kept in mind that if the PDMS is actually harder to use and slower than the current manual techniques , then it simply will not be accepted .
The goal of the current design of the user interface is to correct previous criticisms , by accommodating the personnel needs at the Montreal Children's Hospital. The format of the modules is kept flexible to allow easy modification to adapt to the future needs of the hospital. Furthermore, a "userfriendly " interface is being designed by taking advantage of the PS / 2's improved EGA/VGA color graphics (which make the use of color displays possible even over long periods of time , as opposed to the crude quality of previous CGA color displays) , and using the capabilities ofthe IBM 8514/A highresolution display adapter . An on line HELP facility is being designed to provide assistance and training for the users . The HELP command is to be ava ilable at any point in the program and will return the user to the same point in the executing program when help was requested .
In a stressful environment such as the hospital's ICU , using a program with "immediate action" keys can lead to command errors which must then be recovered. Therefore , all command keys must be followed by pressing the ENTER key for confirmation or ESC to cancel it. To make the general "look and feel" of the package consistent across the different modules , a single menuing procedure wa s developed, which can run both .in text modes and graphics modes . This procedure allows the dis play of any number of menu items in a column or a row-column format. If more items are specified than can fit inside the given menu box , the menu can scroll upwards and downwards to reveal the extra selections . The cursor keys are used to navigate a color highlight which indicates the current selection . The procedure also accepts a list of "shortcut" keys , which can move the pointer directly to the desired selection without having to use the arrow keys . Such shortcut key s are us ually the funct ion keys, but could also be different key combinations (such as the first letter of a selection) if need be . Again , any selection must be confirmed with the use of the ENTER key, and hitting the ESC key will return the user to the previous menu level without making any selection . An example of one of the text screens is given in figure 3, where the Registration module is being used to admit a patient to the ICU. Once all the relevant data has been entered and the patient has been assigned to a bed , the Registration module will tell the Data Link Controller to add this new patient to the li s t and request the corresponding data from the network . Communication be-
278
tween ·these two modules is done via a pair of semaphores and a shared memory segment .
This software package will undergo several reviews by hospital staff during the various stages of the project, so the end result will be a very customized design. Hence, the design will have been considered from the user 's point of view as suggested by many experts in the field [SEH87] . Even at this stage, with a prototype version of the system installed in the ICU for development purposes , reaction from the medical staff has been enthusiastic , as they look forward to being able to use this new tool to give better care to their patients .
VII. The Trend Display Module
A, Background
The interactive display of graphical trends constitutes one of the most important aspect of the PDMS . The visual correlation of selected parameter trends is a major feature and much effort has been invested in the design of the display screen structure. A consistent use of function keys, menu highlighting and cursor control was selected to make the system easy to learn and use. It was decided to maintain a basic resemblance to the current manual charts for familiarity and user acceptance. The displays are available on a "bed basis" just as is the case for the present patient folders .
Clearly, most of the data needed in the ICU is much more relevant in graphical than in numerical form . For the case of vital sign data coming in from the network , the user can interactively select what data sets to display at the same time on the screen , and thus be able to observe the relations between these . Wave data (such as ECG) can be displayed in real-time for a remote location , or can be played back from storage. Parameter data (such as heart rate , blood pressure) can be measured much more accurately, since trend analysis no longer depends on single observations at long intervals , which can be subject to errors due to momentary variations . Once displayed in graphics format , it is easy to see whether a trend is developing or is only temporary.
B , Graphics Hardware
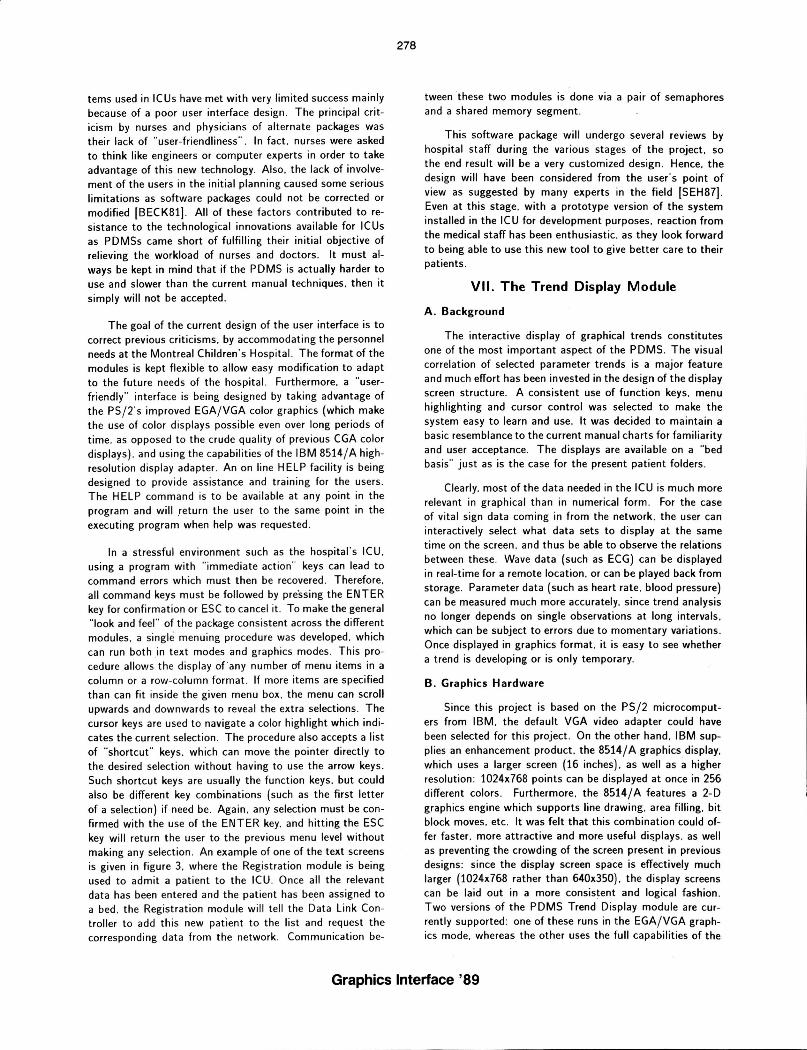
Since this project is based on the PS/2 microcomputers from IBM , the default VGA video adapter could have been selected for this project . On the other hand , I BM supplies an enhancement product, the 8514/ A graphics display, which uses a larger screen (16 inches) , as well as a higher resolution : 1024x768 points can be displayed at once in 256 different colors . Furthermore, the 8514/ A features a 2-D graphics engine which supports line drawing, area filling , bit block moves , etc. It was felt that this combination could offer faster , more attractive and more useful di~plays, as well as preventing the crowding of the screen present in previous designs : since the display screen space is effectively much larger (1024x768 rather than 640x350) , the display screens can be laid out in a more consistent and logical fashion . Two versions of the PDMS Trend Display module are currently supported : one of these runs in the EGA/VGA graphics mode, whereas the other uses the full capabilities of the
Graphics Interface '89

8514/ A adapter. New enhancements of the PDMS are now only implemented for the 8514/A display.
C . Software
To compensate for the lack of graphics support under release 1.0 of OS/2. a library of graphics primitives for the EGA/VGA display was developed to allow graphics mode switching. drawing pixels and lines. drawing text and moving blocks of pixel data (bit block moves) . To achieve the best possible performance. these routines were written in assembly language and linked to the C-Ianguage PDMS code. As for the 8514/A adapter . it is supplied with a library of interface procedures which can be called directly from any high-level language. thus eliminating the need for assemblylanguage procedures to handle the graphics display. Paradoxically. using the more complex display adapter has proved much simpler than using the comparatively primitive EGA/VGA. This approach will be discussed further as it addresses some important issues of graphics programming under the OS/2 system .
D. OS/2 1.'0 and Graphics
Although OS /2 is a multitasking system. it is still primarily intended as an operating system for micro computers . which means that it must allow some degree of control of the hardware by application programs . On the other hand. it cannot let applications freely modify the state of the hardware as in MS-DOS' if reliable operation is to be assured. The OS/2 API (Application Program Interface) thus provides a set of function calls which allows applications to gain control of the hardware in an organized fashion which prevents conflicts between co-resident applications .
Since OS/2 operates under the protected mode of the 80286 or 80386 CPU. absolute addresses cannot be used to address the video buffer: rather. the application has to request an address selector to this buffer from the operating system. This. selector (a P9inter to a ta~le of segment descriptors. which contain . among other information. the physical address of a segment) is only valid while the application runs in the foreground : when in the background. it is invalidated. and any reference to it activates a protection violation trap. Once an application has obtained a selector to the screen buffer . it must ask the operating system to "lock" the screen buffer for its exclusive use during direct access . When it has finished. the application "unlocks" the screen to allow other programs access to it. Note that although the 8514/ A software interface takes care of hiding such low-level accesses from the user. locking and unlocking the screen is still needed to avoid different applications from writing to the display buffer at the same time. On the other hand. bracing every function call in a "lock-unlock" pair wastes too much CPU time: thus the proper "granularity" of blocks of direct video updates has to be determined .
As noted before. as OS/2 swaps applications in and out of the screen. it saves and restores the content of text screens . Unfortunately. it does not do the same for graphics
279
displays . but it does provide a mechan is m to allow the application to handle this task. Thi s allows the application to best decide what strategy to use when saving and restoring a graphics display. Thus for instance if a simple bar graph is currently being displayed on the screen. it might make more sense not to try to save it when the application is being swapped out . but rather to redraw it when it is swapped back in . This is especially true with the 8514/ A display. where a single screen in 1024x768 mode takes almost 800K to save.
To take care of saving and restoring the screen . the application must start a thread (the thread is the basic unit of program execution in OS/2). and register it to the system as a SaveRedrawWait thread . When the system is about to swap the application out of the screen . it sends an appropriate signal to this thread . which takes care of the actual screen saving . The same is done when the screen is to be restored : the thread is responsible for using the optimal way to save and restore the graphical screen. Note that when an 8514/A adapter is installed into a PS / 2 computer. the builtin VGA adapter remains functional. and in fact generates the video output whenever one of the EGA/VGA text or graphics modes are selected . In our design . only two modules require the use of the 8514/ A high resolution mode: the Trend Display module and the Fluid Balance module. Since each of these modules only uses 16 different colors. they can actually share the 8514/A display buffer at the same time. This is possible since this buffer has 8 bit planes which can be selectively enabled . Thus the Trend Display information can use four of these bit planes . while the Fluid Balance uses the other four . When either of these modules is swapped in or out . it is the responsibility of their respective SaveRedrawWait threads to enable the proper set of bit planes. In this way. it is not necessary to save the screen contents to main memory when swapping one of these modules to the background . nor is it necessa ry to red raw the content of the screen when bringing it back to the foreground .
E. User Interface
The same general-purpose menuing sub-routine used in the other modules under text mode has been adapted to run here under graphics mode: one of currently eight options can be selected using either the arrow keys (to move a "highlight" region around the menu) or the function keys (used here as "shortcut" keys). An example of this screen layout can be seen in figure 4. To confirm a selection. the ENTER key has to be pressed: once selected. a function can always be aborted by the use of the ESC key. Some of these functions call further sub menus : here again. the user input is limited to the use of the function keys and arrow keys: such a sub-menu is used to select the physiological parameters to be displayed as graphical trends . Although a "command line" approach might yield more flexibility to this design . it was decided that a more rigid approach could minimize the possibility of adverse results due to user error. Note that since the Trend Dis play module is used purely for data viewing purposes . users cannot permanently modify the acquired data . and thus are free to try any of the options at will.
Graphics Interface '89
Clearly. there is only a limited quantity of data which can be represented using an EGA/ VGA display : thus the screen .3ppears as a sliding window which can be used to view any part of the trend data . There are two modes of operation : in the minute data mode. the screen can display the equivalent of 50 consecutive minutes of data points. whereas in the half-hour data mode . it can display 24 hours of half-hour data points. Note that for now the Trend Display module is limited to viewing the data currently in memory (i.e . the last two hours of minute data and the last two days of half hour data) . Each possible phy siological parameter is assigned a distinct color and symbol pattern combination . which allows the simultaneous display of several trends . Some trends result from triple-valued parameters (i .e . systolic. diastolic and mean values) : such para meters are displayed as three traces using the same color and symbol. s ince by definition the three will almost never cross and will always have the same order. The black traces in figure 4 show an example of a triple-valued parameter being displayed .
One of the main concerns in developing the Trend Display module was to use a format which is s imilar to the written fo rmat the medical personnel were used to handling . A result of this is th at all the trends are normalized to a scale from 0 to 240. although the actual parameters can have a somewhat larger range (they come in as 10 bit val ues . and can also have a n exponent). Thi s greatly facilitates the graphics display of these trends . since they all share the same vertical scale. Thi s sca le is set by defa ult to 0-240 . but can be reduced in order to "zoom- in" onto a particular trend . If two trends happen to overlap too much (which does not happen often) . one of them ca n be turned off via the trend select ion menu .
F. Enhancements using the 8514/ A Adapter
As of now. the Tre nd Dis play module has been ported over to the 8514/ A ada pter . but it does not yet exploit the extra screen space ava ilable . One way to make use of it is to allow a wider range of data points to be displayed at the same time: by being able to view data for the last two days at a time (ins tead of only for one day) . the evolution of the state of the patient can be seen more clearly. It could also be possible to dis play on the same screen both minute data points and half-hour data points . Since the line drawing function of the adapter s upports different line styles . different trend s can be further differentiated us ing different line styles : instead of removing some trends from the display to avoid cluttering. it is poss ible to use a "ghosting" process where some of the trend s are dis played us ing a fainter line style to avoid confu s ion . Fin ally. since the di s play hardware is capable of fast line drawing and bit block moves . it is possible to implement real -time di s play of wave data (i .e . 500 Hz data coming off the network . such as an electr()-cardiogram) inside a window without tying up all the processing capabilities of the system.
280
VIII. Fluid Balance
A. Background
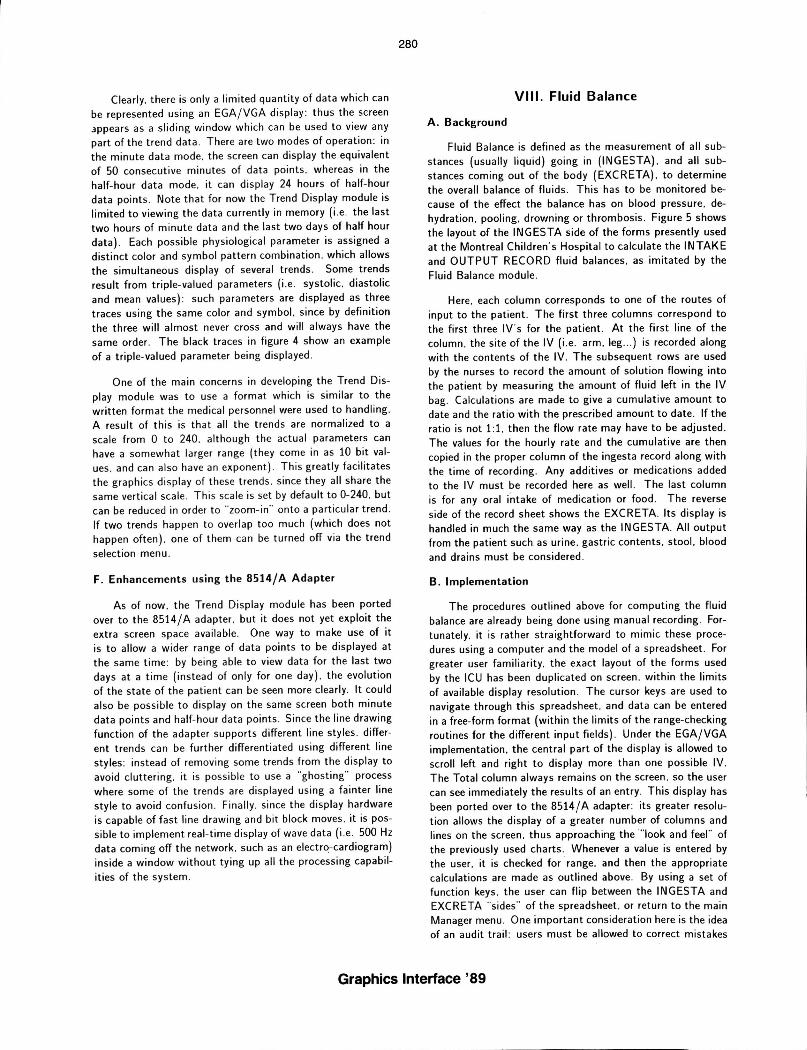
Fluid Balance is defined as the measurement of all substances (usually liquid) going in (INGESTA) . and all substances coming out of the body (EXCRETA) . to determine the overall balance of fluid s . This has to be monitored because of the effect the balance has on blood pressure. dehydration . pooling. drowning or thrombosis . Figure 5 shows the layout of the INGESTA side of the forms presently used at the Montreal Children 's Hospital to calculate the INTAKE and OUTPUT RECORD fluid balances . as imitated by the Fluid Balance module .
Here . each column corresponds to one of the routes of input to the patient. The first three columns correspond to the first three IV 's for the patient. At the first line of the column . the site of the IV (i .e . arm . leg ... ) is recorded along with the contents of the IV. The subsequent rows are used by the nurses to record the amount of solution flowing into the patient by measuring the amount of fluid left in the IV bag. Ca lculations are made to give a cumulative amount to date and the ratio with the prescribed amount to date . If the ratio is not 1:1. then the flow rate may have to be adjusted . The values for the hourly rate and the cumulative are then copied in the proper column of the ingesta record along with the time of recording . Any additives or medications added to the IV must be recorded here as well. The last column is for any oral intake of medication or food . The reverse side of the record sheet shows the EXCRETA. Its display is handled in much the same way as the INGESTA. All output from the patient such as urine. gastric contents. stool. blood and drains must be considered .
B. Implementation
The procedures outlined above for computing the fluid balance are already being done using manual recording. Fortunately. it is rather straightforward to mimic these procedures using a computer and the model of a spreadsheet. For greater user familiar ity. the exact layout of the fo rms used by the ICU has been duplicated on screen . within the limits of available display resolution . The cursor keys are used to navigate through this spreadsheet. and data can be entered in a free-form format (within the limits of the range-checking routines for the different input fields). Under the EGA/VGA implementation . the central part of the display is allowed to scroll left and right to display more than one possible IV. The Total column always remains on the screen . so the user can see immediately the results of an entry. This display has been ported over to the 8514 / A adapter : its greater resolution allows the display of a greater number of columns and lines on the screen . thus approaching the "look and feel" of the previously used charts. Whenever a value is entered by the user. it is checked for range. and then the appropriate calculations are made as outlined above . By using a set of function keys . the user can flip between the INGESTA and EXCRETA "sides" of the spreadsheet . or return to the main Manager menu . One important consideration here is the idea of an audit trail : users must be allowed to correct mistakes
Graphics Interface '89
freely when entering data , but should not be allowed to go back to previously entered data and simply overwrite it : an annotated copy of the previous entry must be kept, both for medical and legal purposes .
C. Input Devices
All current input for the Fluid Balance module comes from the keyboard of the host computer, since this data is not available on- line through the HP bedside monitor network. This is not a great problem, since the rate of these entries is rather slow (about one every hour). On the other hand , it does cause problems if several users need to use the system at the same time . Several solutions are being irlVestigated at this point. One possibility is to have some kin.d of input device at each bedside such as a small key pad which could be used to enter the fluid balance data . HP does offer such a keyboard which can connect to its bedside monitors , but it is unclear at this point whether it could be used for our purposes. The other possibility is a voice recognition system, which would allow the nurse to enter the data using a light. portable headset which would not hinder movement from bed to bed . Another possible enhancement is the direct interfacing of the infusion pumps , which have RS-232C ports in many cases: as for data coming from the network, it would be possible to obtain continuous data rather than single measurements at long intervals , thus adding to the accuracy of the measurements . It could even be possible to implement a feedback loop which could control the infusion pumps in real time .according to the desired flow with respect to the rest of the patient data . Unfortunately, at this point the ICU is equipped with a number of pumps from different manufacturers, and such a direct interface would require a costly standardization of the infusion pumps .
IX. Conclusions
In this paper we have outlined the design of a Patient Data Management System being developed for the Intensive Care Unit at the Montreal Children's Hospital. The system is based on an IBM PS/2 personal computer equipped with a high resolution display system and interfaced to a local area network linking bedside monitors for the acquisition of real-time medical data. The functional requirements , system configuration and user interface were presented. A prototype has recently been implemented and is currently being tested in the ICU at the Montreal Children's Hospital. Preliminary results are very satisfying, and continued development of additional PDMS modules will permit it to accurately match the needs of the ICU and contribute to a higher standard of patient care .
X. Acknowledgements
We wish to thank the authors of previous studies associated with this project for their contributions. The financial support of NSERC is also gratefully acknowledged.
References
1. IBECK81] Beckman E .. Cammack B .. Harris B .. "Observations on Computers in an /"ntensive Care Unit.". Heart and Lung , Vol. 10 . no . 6. 1981. pp 1055·7.
281
2. /CARN86] Carnevale FA . "Computer Applications in Nursing". Axon, 8(1) . 1986.
3. /DAVE87] Davenport 0 .0 .. "Computerized Monitoring Systems .". Nursing Clinics in North America. Vol. 22. no . 2, 1987, pp 495· 501.
4. /DEAN85] Dean J . M .. MacLean Booth F. V .. "Microcomputers in Critical Care. a Practical Approach " Williams and Williams . Baltimore MD. USA . 1985.
5. /EMTE881 "The Emtek System 2000 : Cost Savings and Benefits Realization" . EMTEK Health Care Systems. Tempe, Arizona , 1988
6. /HPCPI] Hewlett Packard 78580A Careport Programmable Inter· face , Programmers Reference Guide .
7. /HPMP871 "When Seconds Count .. Physicians Count on Data Management for Critical Care Decisions" . Advances for Medicine. Hewlett Packard Medical Products Vol. 8. no . 4. Summer 87 .
8. IHPMTI Hewlett Packard 78534A Monitor/Terminal Technical Manual.
9. jMARU831 Maruschak G.F .. Mack S.S .. Rosenfeld G.I .. Blanck T .J .. "Application of a Hand Held Computer for Data Capture in the Operating Room" . Proceedings of the 7th Annual Symposium on Computer Applications in Medical Care. Baltimore MD , pp 176-8. 1983.
10 . INOLA871 Nolan-Avila L .. Shabot M .. "Life Without Computers in the ICU ." , Critical Care Nurse, Vol. 7. no . 3. 1987. pp 80.83.
11. /REPL85] Replogle K.J.. "A Computer at Every Bedside : Issues and Obstacles". Critical Care Nurse, Vol. 6. no . 1. 1985 pp 14·21.
12 . jSEH87] Seshadri S.B .. Arenson R.L .. van der Voorde F .. Kahalsa S .. Kundel H.L .. Brickman I. . "Design of a Medical Image Man· agement System : A Practical Cost· Effective Approach .", Computer Methods Programs in Biomedicine 1981, Sept-Oct, 25(2) , pp 185·92.
13 . jSHAB861 Shabot M .. Carlton P .. Sadoff S .. Nolan-Avila L .. "Graphical Reports and Displays for Complex ICU Data : ANew . Flexible and Configurable Method .". Computer Methods Programs in Biomedicine 1981, Vol 22 . no . 1. 1986. pp 269·275 .
HP78534A HP78534A HP78534A Physiological Physiological Physiological
Monitor Monitor Monitor Bed #1 Bed #2 Bed #14
I -111 J
I HP78581A Network System J Communications Controller
I HP78580A Careport J Network InterFace
I IBM PS/2 Model 50
Computer Running OS/2
I 1 I 8514/A J 30 Mbyte J High Resolution Hard Disk Display Adaptor
Figure 1 Hardware Configuration,
Graphics Interface '89

SHARED MEMORY
LEGEND :
MODULE WRITING OUT f-Q MODULE READING IN -{]
MODULE CONTROLLING -c=J-
f'ATIENT REGISTRATION
MODULE
1 RS-232C 1 LINK
Figure 2 Block Diagram of PDMS Software
Figure 3 Screen Display from Patient Registration Module
282
Figure 4 Screen Display from Trend Module
Figure 5 Screen Display from Fluid B'alance Module
Graphics Interface '89