QUOVADIS Project Organization of Validation...
191
EUR 23552 - 2008 QUOVADIS Project Organization of Validation Exercises S. Vaccaro, G. Locoro, S. Contini, G. Roebben, H. Emteborg, G. Ciceri, A. Giove, S. Iacobellis, S. Flamme, J. Maier, B. M. Gawlik
Transcript of QUOVADIS Project Organization of Validation...

EUR 23552 - 2008
QUOVADIS ProjectOrganization of Validation Exercises
S. Vaccaro, G. Locoro, S. Contini, G. Roebben, H. Emteborg, G. Ciceri,A. Giove, S. Iacobellis, S. Flamme, J. Maier, B. M. Gawlik

The mission of the Institute for Environment and Sustainability is to provide scientific-technical support to the European Union’s Policies for the protection and sustainable development of the European and global environment. European Commission Joint Research Centre Institute for Environment and Sustainability Contact information Address: via Fermi, 2749 – 21027 Ispra (VA) , Italy E-mail: [email protected] Tel.: +39 0332 789487 Fax: +39 0332 789158 http://ies.jrc.ec.europa.eu/ http://www.jrc.ec.europa.eu/ Legal Notice Neither the European Commission nor any person acting on behalf of the Commission is responsible for the use which might be made of this publication. Europe Direct is a service to help you find answers to your questions about the European Union Freephone number (*): 00 800 6 7 8 9 10 11 (*) Certain mobile telephone operators do not allow access to 00 800 numbers or these calls may be billed. A great deal of additional information on the European Union is available on the Internet. It can be accessed through the Europa server http://europa.eu/ JRC 47145 EUR 23552 EN ISBN 978-92-79-10396-4 ISSN 1018-5593 DOI 10.2788/2229 Luxembourg: Office for Official Publications of the European Communities © European Communities, 2008 Reproduction is authorised provided the source is acknowledged Printed in Luxembourg

QUOVADIS Project Organization of Validation Exercises
Affiliation of authors
Stefano VACCARO, Giovanni LOCORO, Serafino CONTINI, Bernd Manfred GAWLIK European Commission – Joint Research Centre
Institute for Environment and Sustainability, 21020 Ispra, Italy
Gert ROEBBEN, Håkan EMTEBORG European Commission – Joint Research Centre
Institute for Reference Materials and Measurements, 2440 Geel, Belgium
Giovanni CICERI CESIRICERCA
20134 Milan, Italy
Aldo GIOVE, Silvana IACOBELLIS ENEL GEM Area Tecnica - Ricerca
72020 Tuturano (Brindisi), Italy
Sabine FLAMME Fachhochschule Münste
Institut für Abfall, Abwasser und Infrastruktur-Management GmbH 48149 Münster, Germany
Jörg MAIER Universität Stuttgart
Institut für Verfahrenstechnik und Dampfkesselwesen, 70569 Stuttgart, Germany


Table of Contents TABLE OF CONTENTS ___________________________________________________________________________ I
SYMBOLS AND ABBREVIATIONS _______________________________________________________________ III
SUMMARY _____________________________________________________________________________________ II
1 OVERVIEW ON THE QUOVADIS PROJECT____________________________________________________3 1.1 INTRODUCTION TO THE USE OF SRF ___________________________________________________________3 1.2 SRF IN THE EUROPEAN CONTEXT – SOME BACKGROUND INFORMATION________________________________3 1.3 PROJECT DESCRIPTION _____________________________________________________________________5
1.3.1 Description of the main activities __________________________________________________________5 1.3.1.1 A holistic approach towards quality management and classification ____________________________________5 1.3.1.2 Validation exercises – production of testing materials, validation intercomparisons and statistical evaluation____6 1.3.1.3 Sampling of SRFs ___________________________________________________________________________6 1.3.1.4 Physical and chemical parameters of SRF ________________________________________________________7 1.3.1.5 Biological Parameters ________________________________________________________________________7 1.3.1.6 Waste management and solid-recovered fuel potential in the New Member States of the EU_________________7
1.4 ROLE OF A SET OF VALIDATED STANDARDS FOR SRFS _____________________________________________8 2 PREPARATION OF THE VALIDATION EXERCISES ___________________________________________10
2.1 IDENTIFICATION AND SAMPLING OF REPRESENTATIVE SRF FOR THE PRODUCTION OF TEST MATERIALS _______10 2.1.1 Sample type A – SRF produced from shredded tyres___________________________________________11 2.1.2 Sample type B – SRF produced from demolition wood ________________________________________12 2.1.3 Sample type C – SRF produced from sewage sludge___________________________________________13 2.1.4 Sample type D – SRF produced from Municipal waste _________________________________________13 2.1.5 Sample type E – SRF produced from Municipal waste (paper and plastic rich)______________________14 2.1.6 Sample type F – Acid-digested SRF for sample preparation effect assessment. ______________________15
2.2 PRODUCTION AND CHARACTERISATION OF THE TEST MATERIALS FOR VALIDATION STUDIES _______________15 2.3 STATISTICAL DATA TREATMENT CONCEPT FOR THE VALIDATION EXERCISE BASED ON ISO 5725 ____________18
2.3.1 Statistical model ______________________________________________________________________20 2.3.2 Outliers scrutiny and rejection ___________________________________________________________22
3 ORGANIZATION OF THE VALIDATION EXERCISES __________________________________________23 3.1 PARTICIPANTS ___________________________________________________________________________23 3.2 OVERVIEW ON SUBMITTED DATASETS_________________________________________________________27 3.3 RESULTS OF THE VALIDATION EXERCISES: PHYSICAL PARAMETERS __________________________________33
3.3.1 TS 15400 (Calorific value) ______________________________________________________________33 3.3.2 TS 15402 (Volatile matter) ______________________________________________________________36 3.3.3 TS 15403 (Ash content) _________________________________________________________________39 3.3.4 TS 15414 (Moisture content) _____________________________________________________________42
3.4 RESULTS OF THE VALIDATION EXERCISES: BIOGENIC CONTENT _____________________________________45 3.4.1 TS 15440 B (Biomass content)____________________________________________________________45 3.4.2 TS 15440 B (Non-biomass content) ________________________________________________________47 3.4.3 TS 15440-D (Biomass content) ___________________________________________________________49 3.4.4 TS 15440-E (Biomass content) ___________________________________________________________51
3.5 RESULTS OF THE VALIDATION EXERCISES: CHEMICAL PARAMETERS__________________________________53 3.5.1 TS 15407 (CHN Flash Combustion: Carbon) ________________________________________________53 3.5.2 TS 15407 (CHN Flash Combustion: Hydrogen) ______________________________________________56 3.5.3 TS 15407 (CHN Flash Combustion: Nitrogen) _______________________________________________59 3.5.4 TS 15408 (Cl, F, S, Br by oxygen combustion and IC: Sulfur) ___________________________________62 3.5.5 TS 15408 (Cl, F, S, Br by oxygen combustion and IC: Chlorine) _________________________________65 3.5.6 TS 15408 (Cl, F, S, Br by oxygen combustion and IC: Bromine) _________________________________69 3.5.7 TS 15408 (Cl, F, S, Br by oxygen combustion and IC: Fluorine) _________________________________72 3.5.8 Digestion verification: Analysis of pre-digested SRF sample QV-F _______________________________75 3.5.9 TS 15410 A - EN 13656 (aqua regia, HF, boric acid, micro-wave assisted digestion: Aluminium) _______76 3.5.10 TS 15410 A - EN 13656 (aqua regia, HF, boric acid, micro-wave assisted digestion: Calcium) ______79 3.5.11 TS 15410 A - EN 13656 (aqua regia, HF, boric acid, micro-wave assisted digestion: Iron) __________82 3.5.12 TS 15410 A - EN 13656 (aqua regia, HF, boric acid, micro-wave assisted digestion: Potassium) _____85 3.5.13 TS 15410 A - EN 13656 (aqua regia, HF, boric acid, micro-wave assisted digestion: Magnesium) ____88
3.5.14 TS 15410 A - EN 13656 (aqua regia, HF, boric acid, micro-wave assisted digestion: Sodium) _______91 3.5.15 TS 15410 A - EN 13656 (aqua regia, HF, boric acid, micro-wave assisted digestion: Phosphorus)____94 3.5.16 TS 15410 A - EN 13656 (aqua regia, HF, boric acid, micro-wave assisted digestion: Silicon)________97 3.5.17 TS 15410 A - EN 13656 (aqua regia, HF, boric acid, micro-wave assisted digestion: Titanium) _____100 3.5.18 TS 15410 B (Ashing (ASTM D6722 and XRF): Aluminium)__________________________________103 3.5.19 TS 15410 B (Ashing (ASTM D6722 + XRF): Calcium) _____________________________________106 3.5.20 TS 15410 B (Ashing (ASTM D6722 + XRF): Iron)_________________________________________109 3.5.21 TS 15410 B (Ashing (ASTM D6722 + XRF): Potassium)____________________________________112 3.5.22 TS 15410 B (Ashing (ASTM D6722 + XRF): Magnesium)___________________________________115 3.5.23 TS 15410 B (Ashing (ASTM D6722 + XRF): Phosphorus)___________________________________118 3.5.24 TS 15410 B(Ashing (ASTM D6722 + XRF): Silicon) _______________________________________121 3.5.25 TS 15410 B (Ashing (ASTM D6722 + XRF): Titanium) _____________________________________124 3.5.26 TS 15411 (Mercury by automatic analyzer) ______________________________________________127 3.5.27 TS 15411 A - EN 13656 (aqua regia, HF, boric acid and micro-wave assisted digestion: Arsenic) ___131 3.5.28 TS 15411 A - EN 13656 (aqua regia, HF, boric acid and micro-wave assisted digestion: Barium) ___134 3.5.29 TS 15411 A - EN 13656 (aqua regia, HF, boric acid and micro-wave assisted digestion: Beryllium) _137 3.5.30 TS 15411 A - EN 13656 (aqua regia, HF, boric acid and micro-wave assisted digestion: Cadmium)__140 3.5.31 TS 15411 A - EN 13656 (aqua regia, HF, boric acid and micro-wave assisted digestion: Chromium)_143 3.5.32 TS 15411 A - EN 13656 (aqua regia, HF, boric acid and micro-wave assisted digestion: Cobalt) ____146 3.5.33 TS 15411 A - EN 13656 (aqua regia, HF, boric acid and micro-wave assisted digestion: Copper) ___149 3.5.34 TS 15411 A - EN 13656 (aqua regia, HF, boric acid and micro-wave assisted digestion: Mercury) __152 3.5.35 TS 15411 A - EN 13656 (aqua regia, HF, boric acid and micro-wave assisted digestion: Manganese) 155 3.5.36 TS 15411 A - EN 13656 (aqua regia, HF, boric acid and micro-wave assisted digestion: Molybdenum) 158 3.5.37 TS 15411 A - EN 13656 (aqua regia, HF, boric acid and micro-wave assisted digestion: Nickel) ____161 3.5.38 TS 15411 A - EN 13656 (aqua regia, HF, boric acid and micro-wave assisted digestion: Lead) _____164 3.5.39 TS 15411 A - EN 13656 (aqua regia, HF, boric acid and micro-wave assisted digestion: Antimony)__167 3.5.40 TS 15411 A - EN 13656 (aqua regia, HF, boric acid and micro-wave assisted digestion: Selenium) __170 3.5.41 TS 15411 A - EN 13656 (aqua regia, HF, boric acid and micro-wave assisted digestion: Vanadium) _173 3.5.42 TS 15411 A - EN 13656 (aqua regia, HF, boric acid and micro-wave assisted digestion: Zinc)______176
4 REFERENCES_____________________________________________________________________________179
5 ANNEX 1 – REPORTING FORMS USED FOR DATA SUBMISSION ______________________________181

Symbols and abbreviations Throughout this report the symbols, abbreviations and conventions are adopted:
Conventions
− subscript i represents the laboratory (i = 1,2, ..., p);
− subscript j represents the level (j = 1, 2, ..., q);
− subscript t represents the sample (t = 1, 2, ..., g);
− subscript k represents the test result (k = 1, 2, ..., n);
− unless otherwise stated letters after a dot are equivalent to a subscript (ex. B.ij is the same of Bij).
Symbols
The following symbols are used:
yijtk each measurement result
zijtk the residual (value – model) associated to each results
mj general mean of the level j (m.j)
Bij laboratory component of bias under repeatability conditions in a particular laboratory i = 1, ..., p at a particular level j = 1, ..., q
Hijt term taking into account the variation between bottles (homogeneity)
SSLj sums of squares for laboratory effects (SS.L)
SSHj sums of squares for between-bottle effects (SS.H)
SSrj sums of squares for repeatability (SS.r)
σLj standard deviation for laboratory effects (s.Lj)
σHj standard deviation for between-bottle effects (s.Hj)
σrj standard deviation for repeatability (s.rj)
σRj standard deviation for reproducibility (s.Rj)
ni indicates the degrees of freedom (ν)
K, K’ and K’’ are the factors for each level
When not at subscript h and k indicate Mandel’s statistics.
C value of Cochran’s test
G value of Grubbs’ test

Abbreviations
ANOVA analysis of variances
AQC analytical quality control
CBA cost-benefit analysis
CEN European Committee for Standardisation
d.m. dry matter
EC European Commission
EU European Union
IES Institute for Environment and Sustainability
IC ion chromatography
ICP inductively coupled plasma
IRMM Institute for Reference Materials and Measurements
ISO International Standardisation Organisation
JRC Joint Research Centre
LOD limit of detection
NMS new member state
NCV net calorific value
PE polyethylene
QA quality assurance
QC quality control
QM quality management
QR QUOVADIS material for ruggedness testing
QV QUOVADIS material for validation studies
r: repeatability as defined by ISO 5725
R: within-lab reproducibility as defined by ISO 5725
RDF refuse-derived fuels
SRF solid recovered fuel
WEEE waste electronic and electrical equipment
WP work package

Summary Waste-to-energy Solid Recovered Fuels (SRF) are prepared from non-hazardous waste. Their use is regulated under EU legislation and requires specifications for commercial or regulatory purposes. SRFs are seen as important contributors to a sustainable EU waste management. Directive 2001/77/EC includes in its scope the production of electricity from biomass, being defined as the biodegradable fraction of products, waste and residues from agriculture, forestry and related industries, as well as the biodegradable fraction of industrial and municipal waste. In this context the European Commission (EC) gave a mandate to the European Committee for Standardisation (CEN) to develop and validate Technical Specification (TS) concerning SRF for energy recovery and to transform these TS into European Standards. To meet these requests, a holistic validation programme covering quality management and the validation exercises for the pre-standards of CEN’s Technical Committee on Solid Recovered Fuels (CEN TC 343) was designed and carried out by various members of CEN TC 343, interested Non-Governmental Organisations (NGOs) and the European Commission’s Joint Research Centre (JRC).
This report gives an overview about the validation program called QUOVADIS (from QUality Management Organisation, VAlidation of Standards, Developments and Inquiries for Solid-Recovered Fuels). In particular the results stemming from the validation intercomparisons, which were carried out according to the requirements of the ISO Standard 5725 are shown. Upon statistical treatment the respective performance characteristics in terms of repeatability and reproducibility could be obtained.

1 Overview on the QUOVADIS Project
1.1 Introduction to the use of SRF Waste incineration practices are currently being diversified and optimised in terms of the
efficiency of the recovery of the energy embedded in the waste. One of these tendencies is the conversion of non-hazardous waste into an more adequate or better upgraded form for utilisation in an efficient combustion process (Chiaramonti et al., 2007; Moustakas et al., 2005), e.g. characterised in terms of homogeneity, being an essential parameter for the control of the combustion process. The European Directive 2000/76/EC on the incineration of waste (WID) is an indicative of the gaining recognition of this process. However, strict standards for the use of waste are essential due to the variability and presence of potentially harmful species in its composition. This is also explicitly in recital (7) of this Directive. In addition, standards for the characterisation of SRF are important, if they are to be established as tradeable goods to be used in commercial transactions.
In Europe, in the last ten years, energy policy targets and waste management legislation gave an impetus to the usage of waste derived fuels based on non hazardous wastes. These fuels, having an average content of 50 - 60% on biogenics, may contribute considerably to the reduction of CO2 emission and the doubling of the share of renewable energy (Odenberger and Johnsson, 2007). Moreover, due to the permanent need for cost reduction, industry is interested in less expensive homogenous substitute fuels of a specified quality. The recent increase of costs of fossil energy carriers has emphasized this driving force.
At present, the main end-users of SRF are the cement and lime industry. However, the market chances in the potential bigger market of the power generation sector are increasing also due to concerns about climate change and energy security. The standardisation effort undertaken is an effect of this, as SRF standards are a useful tool to convert non-hazardous waste into a “product” for the changing energy market. Furthermore, the waste management sectors of the New Member States and Acceding Countries are characterised by an increase of residual wastes quantities within the municipal solid wastes. At the moment these countries are still characterised by a large disparity between landfilling, which is the major disposal option for all categories of waste, and incineration (Streimikiene and Klevas, 2007; Patlitzianas et al., 2007). This applies to many of the old Member States such as the UK, Spain, Portugal, Italy, Ireland, Greece and Finland. In addition to this, the strong public opposition against waste incineration emphasises the need to implement SRF as waste management option.
In this framework the European Commission’s Joint Research Centre together with CEN and various stakeholders launched the QUOVADIS Project dealing with quality management organisation, validation of standards, developments and inquiries for solid-recovered fuels.
1.2 SRF in the European context – Some background information In Europe, the recovery of energy from waste has been adopted by the European Commission as
one of the sustainable waste management options, with the scope to decrease the amount of non-hazardous waste going to landfill. In this context, the use of so-called Solid Recovered Fuels (SRF) and their development as suitable alternatives for classical fuels such as coal or lignite has become an interesting option. SRF are prepared from non-hazardous waste and composed of a variety of materials of which some, although recyclable in theory, may have become available in forms that made their recycling an environmentally an unsound option (De Vriesa et al., 2007). It is obtained usually shredding municipal solid waste (MSW) or steam pressure treating in an autoclave. Consequently, SRF consists largely of organic and polymeric components of municipal waste such as plastics and

biodegradable waste. SRF processing facilities are normally located near a source of MSW, while an optional combustion facility is normally close to the processing facility, it may also be located at a remote location. The SRF has been introduced to distinguish it from classical refuse-derived fuels (RDF) – as a matter of fact to qualify for the SRF label, RDF must comply with a series of environmental and process-relevant standards such as minimum requirements concerning contents of some critical trace elements (mercury, thallium, cadmium), corroding capacity and net caloric value.
One may argue that incineration with energy recovery of the raw non-hazardous waste would suffice to divert waste from landfill. However, this requires the construction of dedicated incinerators, having besides a direct environmental impact also a poor acceptance in the public. Thus, co-incineration offers an additional viable waste management option. However, in order to be acceptable and usable as a replacement for classical fuels, for instance in power generation, it is of utmost importance to achieve a good quality in terms of homogeneity, energy efficiency and environmental parameters. Compared to untreated non-hazardous waste, SRF has less moisture content, a higher calorific value and a more homogenous form (frequently as pellets). As a result SRF burns more efficiently than untreated non-hazardous waste.
The use of SRF is regulated under EU legislation, and requires specifications for commercial and regulatory purposes. Thus, Directive 2001/77/EC () includes in its scope the production of electricity from biomass (Orecchini and Bocci, 2007; Athanasiou et al., 2007), being defined as the biodegradable fraction of products, wastes and residues from agriculture, forestry and related industries, as well as the biodegradable fraction of industrial and municipal waste (Zamorano et al., 2007; Autret et al., 2007; Consonni et al., 2005).
Standards for measurement and testing are fundamental instruments for the successful implementation of environmental legislation. However, the development of these tools requires a joint effort of pre-normative and co-normative research. In this context, the European Commission’s Directorate-General Joint Research Centre plays an important role in supporting European Standardisation work.
Thus, the European Commission (EC) gave upon input from the JRC a specific mandate (M325) to CEN, the European standardisation body, to develop and validate Technical Specification (TS) for SRF, and then to transform these Technical Specifications into full European Standards (EN) in collaboration with the JRC. To meet these requirements, a thorough programme of validation covering (a) examination of the implementation of quality-management to the whole production process of SRF, and (b) validation exercises based on Round Robins for single Technical Specifications agreed in the various working groups of CEN TC 343 was setup under the umbrella of the QUOVADIS-Project. The Technical Specifications to be validated so as to guarantee the quality of the produced SRF, can be grouped as follows:
- Sampling: statistical considerations, preparation of a laboratory sample, reduction of a laboratory sample arriving at the lab to a test sample used to execute a specific measurement;
- Tests for chemical properties such as major and minor constituents (Cl, F, Br, S, N, C, H), heavy metals and trace elements, (As, Cd, Hg, Pb, Co, Cr, Cu, Mn, Ni, Sb, V, Zn, Al, K, Na, P, Si, Ca);
- Physical properties, such as moisture- and ash-content, volatiles and parameters such as lower heating value, grain-size/particle-size distribution;
- Biological parameters (biodegradable fraction).

The results from the validation tests are a requirement to finalise the European Standards, which will then be implemented via European Legislation. Another aspect of QUOVADIS is the gathering of information about production and use of SRF by the New EU-Member States (Nilsson et al., 2006).
1.3 Project description QUOVADIS-Project aims to deliver the methodological/performance characteristics of CEN
standards for SRF, taking account of the proposed procedures for QM and classification, by assessing the various contributors of uncertainty. A synthetic scheme of the structure is set out here:
- WP 1 – Co-ordination and Management
- WP 2 – A holistic approach towards quality management and classification
- WP 3 – Organisation of validation exercises
- WP 4 – Sampling
- WP 5 – Physical parameters
- WP 6 – Chemical parameters
- WP 7 – Biological parameters
- WP 8 – Data collection
- WP 9 – Dissemination
The main aim of QUOVADIS is the validation of the draft technical specification prepared by the European Standardisation Body CEN within its Technical Committee 343. As validation is the main aim of QUOVADIS, a very important step is the production of the testing materials to be used for ruggedness testing and laboratory intercomparisons. Another important objective of QUOVADIS is the collection of information on waste-management and market-potential for SRF in the New Member States of the EU.
1.3.1 Description of the main activities
1.3.1.1 A holistic approach towards quality management and classification
The main aim of this activity is to validate the draft standard for specification and classification and Quality Management of SRF that CEN is currently finalising. Such validation is necessary to demonstrate that the future standards are fit-for-purpose. Other related objectives are:
- to develop an European database on quality of SRF according to the classification system introduced;
- to develop QM guidelines and model manuals to facilitate the later application in plants producing SRF.
To fulfil these main objectives, four tasks have been conceived:
- Assessment of current status on quality assurance of SRFs and methods for Cost Benefit Analysis (CBA)
- Establishment of a European Database on the quality of SRF and validation of the draft standard on classification
- Production of QM Guidelines and model-manuals for the application of QM systems
- Implementation and validation of the draft standard on QM
1.3.1.2 Validation exercises – production of testing materials, validation intercomparisons and statistical evaluation
This activity has the following objectives:
- identification of representative SRF for the production of test materials;
- production and characterisation of test materials for validation studies;
- to perform ruggedness testing and validation exercises according to ISO-Standard 5725;
- to perform a statistical evaluation of validation intercomparisons (performance characteristics of methods).
This activity is divided into four tasks:
- Identification of representative SRFs for production of test materials including gathering of existing analytical data
- Characterisation and dispatch of five EU-representative SRF-test materials for validation studies and experiments in compliance with the respective ISO-Standards
- Design of ruggedness testing and validation exercises
- Statistical evaluation of validation results and determination of method performance characteristics from the intercomparison data
1.3.1.3 Sampling of SRFs
This part of the project has the following main objectives:
- drafting of a reference document for the validation of sampling;
- validation of the draft standards for the sampling of SRFs;

The respective work comprises the following tasks
- The design of a reference document for the validation for sampling of SRF
- Ruggedness testing of sampling procedures down to the step of the production of a representative sample with the required sample size using collaborative field trials
- Validation exercise of sampling procedures down to the step of the production of a representative sample with the required sample size using collaborative field trials
1.3.1.4 Physical and chemical parameters of SRF
For this activity the overall objective is the evaluation of standards’ robustness for the measurement and testing of physical properties. To this end, the following tasks were defined:
- Ruggedness testing of procedures for physical properties
- Set-up of the respective intercomparisons
- Validation of the sample-reduction procedure from laboratory sample to test portion comparing different milling techniques and considering different final dimensions
1.3.1.5 Biological Parameters
Main objective is the determination of biomass content of SRF in relationship CO2-Trading and the Biomass Action plan established by the European Commission. This work package is divided into the following tasks:
- Carry out determination of the content of biodegradable material using the manual sorting and the selective dissolving methods.
- Work out information on the ruggedness of procedures for biological parameters
- Design a draft reference document for determining the biodegradable fraction of SRF
1.3.1.6 Waste management and solid-recovered fuel potential in the New Member States of the EU
The main scope is to collect information about waste-management and the market-potential for SRF in the NMS, taking account of relevant waste-streams, waste-management strategies and policy, and relevant organisations in NMS. The following activities are envisaged:
- collecting information on current and expected waste-management strategies in NMS and analysing how implementation of standards for SRF might affect those strategies to maximise the use of SRF;
- gathering and updating information about current practices in waste-management in NMS;

- determining data about the waste-streams that are relevant for SRF-production in NMS. Considering how NMS could influence the perspective of the-production and use of SRF in the enlarged EU;
- foster the application of the new standards so that SRF will contribute to lower-cost energy production, and reduce specific investments in infrastructure, e.g. by substituting co-combustion for incineration.
The work is focused on an overview of relevant waste streams and waste-management strategies in the NMS compared to Europe-15, with regard to:
- laws, standards and time table for application of EU legislation;
- overview of waste-management policies in Central Eastern Europe in the context of the production and utilisation of SRF;
- overview of waste-management policies in Europe-25;
- study comparing future directions of waste management strategies in Europe-25;
Consequently, this activity is divided into two tasks:
- Information gathering on waste management in the NMS
- Assess the potential of SRF in the New EU accession MS
1.4 Role of a set of validated standards for SRFs Waste-to-fuel-production for a later energy conversion is one option of waste management when
done properly and not in competition with environmentally sound material recovery options. The potential of waste-to-fuel production to reduce pressure on landfill is generally acknowledged. Solid recovered fuels represent a significant potential storable source of indigenous energy and therefore contribute to the security of energy supply for the EU (Lund, 2007; Caspary et al., 2007).
Standards and specifications help promote their use while ensuring a level of environmental protection at least equivalent to the traditional energy sources they are replacing, subject to criteria and definitions of the Waste Framework Directive. In this context, solid recovered fuels (SRFs) have a potential application for the substitution of traditional fossil energy carriers such as hard coal or lignite. Generally, SRFs can be considered “clean” fuels, from an emissions perspective if their content of heavy metals is below certain levels. As a general rule heavy metal concentrations therefore need to be kept as low as possible.
Not all refuse-derived fuels can be seen automatically as SRFs. Here the upcoming CEN standards have a role to clarify the situation. To be defined as a SRF, the fuel shall comply with certain minimum requirements concerning their homogeneity as well as their net calorific value (NCV).
An optimal waste management strategy has to consider strongly local requirements and particularities (Lopez Gonzales et al., 2007; Terrados, 2007). Hence, the availability of a possibly broad range of different technological and systems solutions besides sheer material re-cycling (for example waste prevention and reuse) may enable a better waste management. In this context it has to be stressed that the volume of waste plastics which cannot be sensibly recycled as a material represents 15% of imported solid fuels into EU-15.

Public confidence into thermal waste treatment is still a critical issue. On one hand, steps towards an integrated quality management for SRF-producers, including a proper documentation of incoming waste streams, are of paramount importance to gain confidence. Generally, transparency and guaranteeing a high level of environmental protection is seen as a key element in this discussion. In any assessment of environmental impacts it is important to consider overall fossil fuel energy balances and associated climate change effects. Thus, it was stated that Solid recovered fuels produce lower greenhouse gas emissions than conventional fuels and therefore contribute to the important climate change objectives of the EU (Bomb et al., 2007; Clift, 2007).
Standardisation work as accomplished in the QUOVADIS-Project can contribute to increase public confidence as well as market opportunities. Concerning the latter point, the discussion, if and when a waste-derived material can be qualified as a product, remains controversial. If materials as SRFs are subject to trading, i.e. the exchange of goods against money, they are de facto handled as such.
Unfortunately, this has a series of legal implications, which are not yet fully clarified at least in the EU. However as a matter of fact there is a lot of waste handled as a product under the waste regime and there are relevant environmental protection reasons for this.
In addition to that there are still large discrepancies in the environmental legislation in the various Member States and Acceding Countries (Streimikiene et al., 2007), which should be overcome. For instance, Bulgaria and Poland reported on difficulties in environmental legislation unification in respect to waste-to-fuel production. The need of informing the potential customers and the society in the New Member States and Acceding Countries on the subject of waste-to-fuel production is apparent.
Many synergies are possible between renewable biomass resources and other waste in the production of SRF, (e.g. paper/plastic mixtures from municipal waste, as in the Sub-coal process in the Netherlands (Ptasinski et al., 2007)).

2 Preparation of the validation exercises The validation exercises organized in the context of the QUOVADIS Project were necessary in order to establish the so-called performance characteristics of the various standards for measurement and testing of chemical, physical and biological properties of solid recovered fuels (SRF). To this end, QUOVADIS incorporated a own work package (WP 3) with the following tasks
- identification and sampling of representative SRF for the production of test materials
- production and characterisation of test materials for validation studies;
- to perform ruggedness testing and validation exercises according to ISO-Standard 5725;
- to perform a statistical evaluation of validation intercomparisons (performance characteristics of methods).
2.1 Identification and sampling of representative SRF for the production of test materials In order to cover the needs for representative SRF samples for the ruggedness testing and
validation a set of five different SRF materials had to be identified. Many different qualities of SRF are produced within the European Union, some in small quantities, some in very large quantities, some for very specific purposes and some for more general applications, some used internationally and some only at regional level. Therefore, the selection of the five representative SRF to be used as basis material for the validation of the TS defined by the CEN TC 343 was limited to materials satisfying the following principles:
- The SRF must comply at least with one of the classes as defined in the TS established by CEN TC WG2 for NCV, Cl and Hg content;
- Due to the small number of SRF materials to be selected compared to those available, only widely produced (industrial production must exist) and/or used SRF (i.e. SRF which meet the requirements of the main final users) should be taken into account;
- The selected SRF needed to be produced and sampled in different EU member states, so that five countries could be involved, thus widening the interest at European level for the project and helping the diffusion of the awareness about SRF;
- Data about the composition, behaviour and production processes must be available;
- The five SRF should represent a good panel of usual physical aspects of SRF;
- Availability and possibilities of delivery to the JRC has been considered;
It should be noted that, with just five selected types of SRF materials, it was impossible to cover the five classes for NCV, five classes for chlorine content and five classes for the mercury content. This implies that some classes for some parameters will not be represented in the SRF selected, even if such SRF materials might exist in practice. In fact, the restrictions due to the limited human, technical and financial possibilities of the QUOVADIS project had to be taken into account. The decision on this point was to try, to cover as far as possible different classes, when complying as far as possible with

the selection principles defined above. Based on the above considerations, the resulting set was composed by the SRF materials described here below.
2.1.1 Sample type A – SRF produced from shredded tyres
This kind of SRF is used in most of the European countries, mainly in cement plants. It has a high calorific value compared to other, so that it is a good test material for the high NCV classes. The selected country for the sampling of this SRF was France and the samples were collected at the Norvalo Centre de Valorisation des Pneumatiques at Dompierre-Bequincourt, near Amiens (Fig. 1-2).
After plant inspection, five 60 litres PE barrels have been filled with the tyre pieces (which are composite materials containing of iron, rubber and cotton textile) from the open air stocks of semi-processed material. In order to preserve representativeness, samples were collected in different parts of the stocks.
Figure 1: Shredded end-of-life tyres
Figure 2: Manual sampling of SRF

2.1.2 Sample type B – SRF produced from demolition wood
This kind of SRF is widely used in the Nordic countries, Germany and in other European countries at a smaller scale. It is used mainly in district heating and power plants, but can also be used in cement and lime plants. The selected country for the sampling of this SRF was Finland, where the material was collected at the Lassila & Tikanoja’s plant in Kerava (about 30 km north from Helsinki) (Fig. 3-4).
This waste management plant processes different types of waste such as waste electrical and electronic equipment (WEEE), plastic waste (so-called “light fraction”) as well as demolition wood. Twelve 60 litres PE barrels have been filled from the process output after plant inspection. Impressions from the sampling can be gained below.
Figure 3: SRF derived from demolition wood Figure 4: Sampled demolition wood
Figure 5: SRF pre-treatment centre of SCORIBEL in Seneffe, Belgium
Figure 6: SRF produced by SCORIBEL

2.1.3 Sample type C – SRF produced from sewage sludge
SRF produced with dried waste water sewage sludge, filter cake and coal or lignite residues. This SRF usually presents a low NCV compared to other. It is mainly used in cement plants to substitute fuel (through its the calorific value) and to save raw materials (through its ash content). Use in power plants is also possible, but depends of the mineral contents. Some 100 kg of suitable sludge SRF were obtained from SCORIBEL in Seneffe, Belgium (Fig. 5 – 6). After collection this material was delivered to IRMM in Geel, Belgium, for storage and processing.
2.1.4 Sample type D – SRF produced from Municipal waste
This SRF is produced from the combustible fraction of municipal solid waste. Those SRF are produced in Germany, Finland, Sweden, Belgium, Italy, The Netherlands and probably also in other member states. The physical aspect of this SRF is small pieces of some centimetres. The sampling of this kind of material was carried out at the ECODECO plant near Milan, Italy, where 6 PE barrels of SRF (soft pellets) were sampled and shipped to the JRC for further processing. Impressions from the sampling site can be gained from the pictures below (Fig 7 – 8).
Figure 7: ECODECO SRF Processing plant, Milan, Italy
Figure 8: Scheme of automatic sampler used at ECODECO
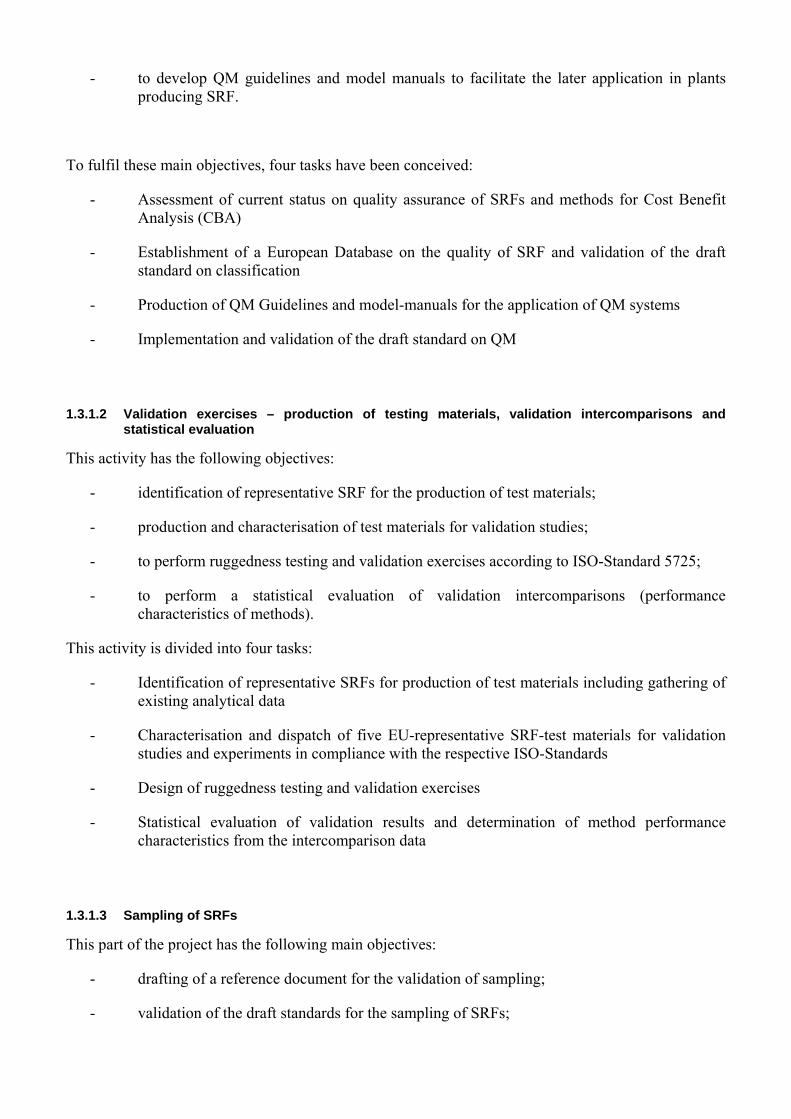
2.1.5 Sample type E – SRF produced from Municipal waste (paper and plastic rich)
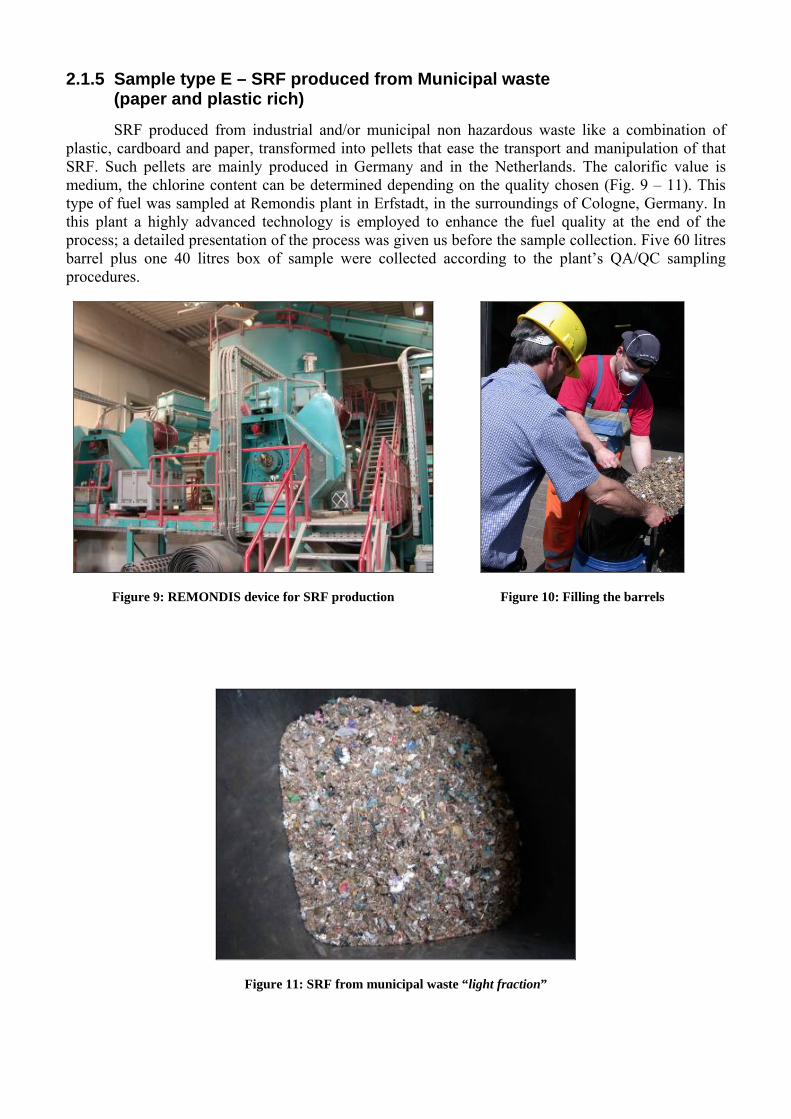
SRF produced from industrial and/or municipal non hazardous waste like a combination of plastic, cardboard and paper, transformed into pellets that ease the transport and manipulation of that SRF. Such pellets are mainly produced in Germany and in the Netherlands. The calorific value is medium, the chlorine content can be determined depending on the quality chosen (Fig. 9 – 11). This type of fuel was sampled at Remondis plant in Erfstadt, in the surroundings of Cologne, Germany. In this plant a highly advanced technology is employed to enhance the fuel quality at the end of the process; a detailed presentation of the process was given us before the sample collection. Five 60 litres barrel plus one 40 litres box of sample were collected according to the plant’s QA/QC sampling procedures.
Figure 9: REMONDIS device for SRF production Figure 10: Filling the barrels
Figure 11: SRF from municipal waste “light fraction”

2.1.6 Sample type F – Acid-digested SRF for sample preparation effect assessment.
Two PE barrels of SRF from the Pirelli IDEA GRANDA plant were sampled in Cuneo, Italy and transported to JRC IES for further processing (Fig. 12). From this material 5 L of acidic digest were produced following the draft TS for mineralization (Fig. 13). The digest was sent to JRC’s Institute for Reference Materials and Measurements in Geel, Belgium (IRMM) for ampouling.
Figure 12: Sub-sample from the IDEA GRANDA plant Figure 13: Production of Acidic Digest from SRF by open-vessel digestion under reflux condition
2.2 Production and characterisation of the test materials for validation studies
The processing of the sampled raw SRF into samples ready for distribution to the laboratories participating in the validation study, was co-ordinated at IRMM.
After an initial period of process optimisation, ruggedness test materials were prepared and homogeneity tests were carried out jointly by the WP partners. Homogeneity of the ruggedness test materials was assessed in terms of ash content (IVD, Stuttgart), calorific value (SLU, Umeå), and content of Al, S, Cl and Cr by XRF (IES-JRC-EC, Ispra). The chemical properties (Hg, XRF) were tested on 0.5, 1.0 and 1.5 mm nominal granulometries, the physical properties (ash, moisture, calorific value) were measured on 1.0 and 6.0 mm nominal granulometries. The expected trend of having more uniform analysis data with decreasing granulometry is confirmed. On the other hand, the effect of the additional processing to obtain a smaller granulometry does not seem to affect significantly the level of the measured analytes, except moisture. All QR-materials (QR-A, QR-A2, QR-B, QR-C, QR-E) met the agreed ‘between-sample’ homogeneity criterion (30 %) using a 1 mm sieve insert in the mill. This result was a prerequisite for processing the validation test materials along the same protocol. Based on these results, the final validation materials were produced (Fig. 14 – 19). An example of homogeneity testing results is shown in Fig. 20.
The materials QV-D and QV-E2 were judged potentially unstable during transport. Therefore, samples of these materials were submitted to a dedicated stability study. Based on the test results obtained [ash content (IVD, Stuttgart), calorific value (SLU, Umeå), elements by XRF (IES-JRC-EC, Ispra),

biogenic fraction (INFA)] the materials could be declared stable during transport, at least with respect to the tested parameters.
Furthermore, 5 L of an acidic digest were produced as AQC samples for the validation exercise on the critical heavy metals. The automated flame-seal ampouling from a stirred solution assured the homogeneity and stability of this material (QV-F).
Thus, in total 6 classes of materials were prepared, in 11 processing batches (5 QR materials and 6 QV materials), and requiring 60 filling sequences. (On average 5 different sample sizes were prepared per batch). In total 3382 individually numbered samples were obtained, a considerable number of which were used in homogeneity and stability tests. Finally, 1982 samples were distributed to the 28 laboratories participating in the validation study. Average processing time for all materials from receipt of raw materials to dispatch of QRmaterials and from receipt of homogeneity test results to packing of validation test materials, was less than 8 weeks.
Figure 14: Equipment used for the processing of the SRFs
Figure 15: Ruggedness test materials produced
2
Shredded tyre
Six raw materials used for Ruggedness and Validation
Demolition wood
Dried sludgeDried SBS-1®
Paper/plastic Fluff
Acidic Digest
Figure 16: Problems encountered during production
Figure 17: Overview on the materials used

4
Four of the materials were cooled in LNFour of the materials were cooled in LN22
Shredded tyre Demolition wood
Dried SBS-1®
Paper/plastic Fluff
8
Ruggedness (QR) and Validation Test Samples (QV)
QR-A2QV-A3
Shredded tyre
QR-BQV-B
Demolition wood
QR-CQV-C
Dried sludge
QV-D Dried SBS-1®
QR-EQV-E2
Paper/plasticFluff
QV-FAcidic Digest
Figure 18: Nitrogen cooling of material prior to grinding operations
Figure 19: Ready materials
The homogeneity of the test materials was investigated in terms of different properties: ash content, Hg content, moisture, calorific value, and overall composition (by XRF). The chemical properties (Hg, XRF) were tested on 0.5, 1.0 and 1.5 mm nominal granulometries, the physical properties (ash, moisture, calorific value) were measured on 1.0 and 6.0 mm nominal granulometries. The expected trend of having more uniform analysis data with decreasing granulometry is confirmed. On the other hand, the effect of the additional processing to obtain a smaller granulometry does not seem to affect significantly the level of the measured analytes, except moisture.
The target level of between-bottle homogeneity (set at 30 %) has been met in the materials and for all properties evaluated. One can proceed to the processing of the validation study test samples. From the results of the homogeneity tests, the 1.0 mm nominal granulometry is sufficiently fine to obtain the required repeatability. An example of homogeneity testing results is shown in Fig. 20.
Figure 20: Ash content homogeneity test for sample type E

2.3 Statistical data treatment concept for the validation exercise based on ISO 5725
After the selection of the participants in the intercomparisons, validation samples have been delivered to the laboratories. A Microsoft® Excel® template has been prepared, in cooperation with CESI-Ricerca, in order to speed up final collection of data for the validation experiment. A specific database management system has been prepared in order to minimize the interferences on the dataset subsequent to manual data manipulation. The data received on the data recording template have been processed through a macro script and then imported automatically into the database. Once constituted and consolidated the dataset, the data have been pre-processed in order to discard the values below the respective limits of detection (LOD), as their use may bring to an artifact in the statistical treatment.
The statistical data analysis was based on the international standard ISO 5725-2 ‘Accuracy (trueness and precision) of measurement methods and results – part 2: Basic method for determination of repeatability and reproducibility of a standard measurement method’ (ISO, 1994a), as generalized in chapter 5 of the ISO 5725-5 ‘Accuracy (trueness and precision) of measurement methods and results – part 5: Alternative methods for the determination of precision of a standard measurement method’ (ISO, 1994b) . Data analysis was carried out by means of the statistical software package R, by a dedicated script developed on purpose. This specific approach chosen has the following paybacks:
a. The high flexibility allows to deal in an automatic way with missing replicates and outliers;
b. The procedure is in principle iterative. The presence of very deviant outliers can distort the view of the whole distribution. Multiple outliers can mask each other; by eliminating outliers, new outliers and stragglers may pop up. During each iteration outliers are eliminated and the statistical analysis is repeated to study the distributions in order to trace ‘new’ outliers or stragglers. This iterative procedure continues until no new outliers are found or, if the iterative approach brings the program to instability or to senseless results, then the number of iterations is limited by scrutiny of the data by the Mandel statistics. A scheme of the iterative procedure is shown in the flowchart below (Fig. 21).
c. The design for heterogeneous materials proposed in clause 5 of ISO 5725-5 yields information about the variability between samples that is not obtainable simply from the uniform level design described in IS0 5725-2. Therefore valuable information may be gathered by this approach, with an associated cost related to the fact that: the proposed design requires more samples to be tested.

Mandel h and k
Clear outlying labs?
Yes
No
Reject
Cochran Between Test Results
Cochran Between Sample
Grubbs
Clear outlying labs?
Yes
No
End
Figure 21: Iterative procedure for statistical data treatment
The assumptions made to chose the statistical design are that, with inhomogeneous materials like SRF, experiments should involve (for each level of the parameters) three factors arranged in a hierarchy: with a factor "laboratories" at the highest level in the hierarchy, a factor "samples within laboratories" as the next level in the hierarchy, and a factor "test results within samples" as the lowest level of the hierarchy.
The general formulas from paragraph 5.9 of the above mentioned ISO standard have been employed, because in the chosen design the number of replicates per sample bottle was 6 for certain key parameters and 3 for the others, therefore the fixed design formulas of paragraph 5.4 (two bottles, two replicates per bottle) was not appropriate. Each of the data from the design for a heterogeneous material is represented by:
yijtk
where
subscript i represents the laboratory (i = 1,2, ..., p);
subscript j represents the level (j = 1, 2, ..., q);
subscript t represents the sample (t = 1, 2, ..., g);
subscript k represents the test result (k = 1, 2, ..., n).

In the QUOVADIS project, after a cost/benefit evaluation, we have chosen a design where q=5, g=2 and n=6 for key parameters (Calorific Value, Hg, Cl and related elements) and n=3 for the others. Anyway, after the rejection of outliers and <LOD this values may not be a fixed constant anymore, nor it is p for the various levels, and the script for the statistical computation has to take this into account. The number of responding laboratories, including those who found <LOD and outliers, is indicated at the beginning of the part of the report concerning the statistical calculations for each specific parameter.
2.3.1 Statistical model
The basic statistical model used for an experiment with a heterogeneous material is similar to the classical ANOVA approach given in equation (1) in clause 5 of IS0 5725-1:1994, expanded to become:
y ijtk = m j + Bij + H ijt + e ijtk (1) Where
m j represents the general mean of the level j, defined by
∑∑∑i t k j
ijtkj n
y=m (2)
where nj is the total number of test results included in the sum;
B ij represents the laboratory component of bias under repeatability conditions in a particular
laboratory i = 1, ..., p at a particular level j = 1, ..., q, defined by
( )
∑∑−
i t ij
jijtkij n
my=B = laboratory average – general average (3)
where nij is the total number of test results included in the sum;
H ijt represents the extra term taking into account the variation between samples (t=1,…,g) for the laboratory I at the level j, defined by
( )
∑−−
i ijt
ijjijtkijt n
Bmy=H = bottle average – laboratory average (4)
where nijt is the number of results included in the sum;
e ijtk represents the random error of test result k = 1, ..., n , obtained for sample t in laboratory i at level j, under repeatability conditions, represented by the residual
z ijtk = y ijtk− m j− B ij− H ijk = test result - sample average. (5)
It is reasonable to assume that the variation between samples is random, it does not depend on the laboratory, but it may depend on the level of the experiment, so the term H ijt has a zero expectation, and a variance:
( ) 2σ=HjHijtvar (6)

Based on the described model, the statistics m, B, H and z are calculated according to the formulas (2)-(5), then the following sums of squares are calculated:
∑i
ijLj Bn=SS 2ij )( (7)
which represents the sums of squares for laboratory effects;
∑∑i t
ijtHj Hn=SS 2ijt )( (8)
which represents the sums of squares for sample effects;
∑∑∑i t k
ijtkHj z=SS 2)( (9)
which represents the sums of squares for repeatability.
The degrees of freedom, respectively for laboratory effects, for sample effects and for repeatability are calculated according to the following formulas:
1−jLj p=ν jjHj pg=ν − jjHj gn=ν − (10)
where pj is the number of laboratories which report at least one valid test result, gj is the number of samples for which at least one test result is reported and nj is the total number of test results.
For each laboratory i the following factors are calculated:
n ij=∑ t n ijt
K ij=∑ t n ijt
2
(11)
For each level j the following factors are calculated:
K j=∑ i n ij
2
(12)
K ' j=∑ i K ij (13)
K '' j=∑ i K ij /n ij (14)
The repeatability standard deviation srj , between-samples standard deviation sHj , between-laboratory standard deviation sLj ,and reproducibility standard deviations sRj , are calculated using:
rjrj2rj νSS=s / (15)

[ ]( )jj
2rjHjHj2
Hj 'K'nsνSS
=s−
∗− (16)
( )[ ]
( )jjj
2rjLj
2HjjjjLj2
Lj nKnsνsnK''K'SS
=s/
/−
∗−∗−− (17)
2Lj
2rj
2Rj s+s=s (18)
2.3.2 Outliers scrutiny and rejection
The dataset for each parameter is screened at first by a graphical approach based on Mandel h and k statistics, aimed at the rejection of clearly outlying laboratories. The formulation of the Mandel statistics comprising the homogeneity effects can be found in paragraph 5.6.1 of ISO 5725-5.
The stragglers and outliers data are the scrutinised according to Cochran’s and Grubbs’ tests, as generalised for inhomogeneous samples in 5.6.2. The former one is aimed at the rejection of anomalous range intervals, both between test results and between sample, while the latter tests for stragglers and outliers in the cell averages, corresponding to one participating laboratory i at one single level j.
These tests have been acted as in the scheme on the following page. As it becomes apparent from the flowchart, the procedure can be in principle iterated until no further outliers are found. Actually this black-box approach is not straightforwardly applicable to this kind of dataset because of the following limitations:
− The statistical models underlying the computation are based the assumption of normality of the statistical distributions of the results, but the relatively small number of repetitions can bring to distorted distributions with consequent excessive rejection of the extremes, especially for the within-bottle variation Cochran test;
− The presence of a single too strong outlier can have a major influence on the standard deviation of the statistical distribution, therefore avoiding the rejection of the outlier itself purely according to the Cochran test;
− Finally, the presence of several laboratories with very precise test results can cause a very tiny distribution and the consequent rejection of data by laboratories whose results are only a bit more broadly distributed and whose range is still within reasonable values.
To cope with these limitations the iterative procedure is applied manually and the Mandel h and k statistics are used as check whether it makes sense or not to stop the iterations.

3 Organization of the validation exercises
3.1 Participants In total, a group of 28 European laboratories had been selected for the intercomparison
experiments. The analyses carried out by each of those laboratories are listed in the following pages.
Table 1 – List of participants
Affiliation Measured parameter
Analytica Srl Corte Olona (PV) – Italy
- Major Elements after acid dissolution - Minor Elements after acid dissolution
Analytical srl Arzignano (Vicenza) – Italy
- Major Elements after acid dissolution - Ash content - Volatile Matter - Minor Elements after acid dissolution
Camera di Commercio, Industria, Artigianato e Agricoltura di Trieste (C.C.I.A.A.) Trieste – Italy
- Cl, F, S, Br by oxygen combustion + IC - B - ashing (ASTM D6722 + XRF) - Major Elements after acid dissolution - Minor Elements after acid dissolution - Moisture Content - Biomass/biodegradable - Calorific Value - Ash content - Volatile Matter
Consiglio Nazionale Delle Ricerche (CNR) Istituto Ricerche sulla Combustione Naples – Italy
- Bridging Properties
Dresden University of Technology Department of Waste Management Dresden – Germany
- Cl, F, S, Br by oxygen combustion + IC - Major Elements after acid dissolution - Volatile Matter - Minor Elements after acid dissolution - Moisture Content - Calorific Value - B - ashing (ASTM D6722 + XRF) - C-H-N Flash Combustion - Ash content
ENEL Produzione Ricerca Tuturano (Brindisi) – Italy
- Major Elements after acid dissolution - Ash content - Moisture Content - B - ashing (ASTM D6722 + XRF) - Minor Elements after acid dissolution
Energy research Centre of the Netherlands (ECN) SF-CA Petten – The Netherlands
- trace elements - 5 - Cl, F, S, Br by oxygen combustion + IC - Volatile Matter - Major Elements after acid dissolution - Biomass/biodegradable - Moisture Content - Calorific Value - Ash content - Minor Elements after acid dissolution - C-H-N Flash Combustion
Fachhochschule Münster Labor für Abfallwirtschaft, Siedlungswasserwirtschaft, Umweltchemie (LASU) Münster – Germany
- Calorific Value - Major Elements after acid dissolution - Moisture Content - Ash content - C-H-N Flash Combustion - Minor Elements after acid dissolution - trace elements - 5 - Cl, F, S, Br by oxygen combustion + IC - B - ashing (ASTM D6722 + XRF) - Bulk Density - Biomass/biodegradable
IMAT-UVE GmbH Mönchengladbach – Germany
- Particle dimesion & Particle size distribution - Ash content - Density of pellets and briquettes - Moisture Content

Affiliation Measured parameter
- Bulk Density - Durability - Volatile Matter - Calorific Value
Institute for Chemical Processing of Coal - ICHPW Zabrze – Poland
- Biomass/biodegradable - Major Elements after acid dissolution - Volatile Matter - Ash content - ash melting behaviour - Calorific Value - Moisture Content - C-H-N Flash Combustion - B - ashing (ASTM D6722 + XRF)
Institute of Power Engineering Warsaw – Poland
- Bulk Density - Calorific Value - Volatile Matter - Moisture Content - Bridging Properties - Durability - Biomass/biodegradable - Ash content - Density of pellets and briquettes - Particle dimesion & Particle size distribution
Labanalysis Casanova Lonati (PV) – Italy
- Cl, F, S, Br by oxygen combustion + IC - Major Elements after acid dissolution - Minor Elements after acid dissolution - trace elements - 5
Montanuniversität Leoben Institut für Nachhaltige Abfallwirtschaft und Entsorgungstechnik, Leoben – Austria
- Biomass/biodegradable; - Major Elements after acid dissolution - B - ashing (ASTM D6722 + XRF) - Ash content - Minor Elements after acid dissolution - Cl, F, S, Br by oxygen combustion + IC - Calorific Value - Moisture Content
Montanuniversität Leoben Lehrstuhl für Thermoprozesstechnik, Leoben – Austria
- Volatile Matter - Ash content - ash melting behaviour - C-H-N Flash Combustion - Calorific Value - Density of pellets and briquettes - Moisture Content - Bulk Density
Ofi Österreichisches Forschungsinstitut für Chemie und Technik Vienna – Austria
- Durability - A - nitric acid + ICP - Moisture Content - Cl, F, S, Br by oxygen combustion + IC - Major Elements after acid dissolution - Calorific Value - Minor Elements after acid dissolution - Volatile Matter - Bulk Density - Density of pellets and briquettes - C-H-N Flash Combustion - Ash content
Politecnico di Milano DIAAR Milan – Italy
- Major Elements after acid dissolution - Moisture Content - B - ashing (ASTM D6722 + XRF) - Minor Elements after acid dissolution - Cl, F, S, Br by oxygen combustion + IC
Ramboll Finland Oy Espoo – Finland
- Ash content - Volatile Matter - Moisture Content - Major Elements after acid dissolution - Calorific Value - C-H-N Flash Combustion - Cl, F, S, Br by oxygen combustion + IC - B - ashing (ASTM D6722 + XRF) - Biomass/biodegradable
S.A.F.A.S. Srl Divisione Analitica Ferrara – Italy
- Calorific Value - C-H-N Flash Combustion - B - ashing (ASTM D6722 + XRF) - Ash content - Cl, F, S, Br by oxygen combustion + IC - Major Elements after acid dissolution

Affiliation Measured parameter
- Minor Elements after acid dissolution
SGS INSTITUT FRESENIUS GmbH Environmental Services Berlin – Germany
- Minor Elements after acid dissolution - C-H-N Flash Combustion - Calorific Value - Bulk Density - Density of pellets and briquettes - Particle dimesion & Particle size distribution - Volatile Matter - Ash content - Moisture Content - Biomass/biodegradable - Cl, F, S, Br by oxygen combustion + IC
SP – Swedish National Testing and Research Institute Boras – Sweden
- A - nitric acid + ICP - Cl, F, S, Br by oxygen combustion + IC - Ash content - Minor Elements after acid dissolution - Calorific Value - C-H-N Flash Combustion - ash melting behaviour - trace elements - 5 - Moisture Content
TL Energopomiar Centralne Gliwice – Poland
- C-H-N Flash Combustion - Cl, F, S, Br by oxygen combustion + IC - Calorific Value - Moisture Content - trace elements - 5 - Major Elements after acid dissolution - B - ashing + DTA - A - nitric acid + ICP - Minor Elements after acid dissolution - Ash content - Volatile Matter
Umwelt Control Labor GmbH (UCL) Lünen – Germany
- Ash content - Moisture Content - Volatile Matter - Calorific Value - Major Elements after acid dissolution - Minor Elements after acid dissolution - Cl, F, S, Br by oxygen combustion + IC - Biomass/biodegradable - B - ashing (ASTM D6722 + XRF) - C-H-N Flash Combustion
Università politecnica delle Marche IAAN- Area di Ingegneria Agraria Ancona – Italy
- Calorific Value - Cl, F, S, Br by oxygen combustion + IC - Bulk Density - Major Elements after acid dissolution - Density of pellets and briquettes - Ash content - B - ashing (ASTM D6722 + XRF) - Moisture Content - C-H-N Flash Combustion - B - ashing + DTA - Bridging Properties - Particle dimesion & Particle size distribution - Volatile Matter - Minor Elements after acid dissolution - Durability - Biomass/biodegradable - A - nitric acid + ICP - trace elements - 5 - ash melting behaviour
Universität Stuttgart Institut für Verfahrenstechnik und Dampfkesselwesen (IVD) Stuttgart – Germany
- Major Elements after acid dissolution - B - ashing (ASTM D6722 + XRF) - C-H-N Flash Combustion - Biomass/biodegradable - Calorific Value - Particle dimesion & Particle size distribution - Ash content - Volatile Matter - Cl, F, S, Br by oxygen combustion + IC - Moisture Content - Minor Elements after acid dissolution - ash melting behaviour
University of Wolverhampton School of Applied Sciences
- C-H-N Flash Combustion - B - ashing + DTA

Affiliation Measured parameter
Wolverhampton – United Kingdom
- Cl, F, S, Br by oxygen combustion + IC - Minor Elements after acid dissolution - B - ashing (ASTM D6722 + XRF) - A - nitric acid + ICP - trace elements - 5
Veolia Eau Centre d'Analyses Environnementales (CAE) - Laboratoire CENTRAL Saint-Maurice – France
- Biomass/biodegradable - Bulk Density - Ash content - Major Elements after acid dissolution - Moisture Content - Calorific Value - Particle dimesion & Particle size distribution - B - ashing (ASTM D6722 + XRF) - Density of pellets and briquettes - Minor Elements after acid dissolution - Volatile Matter - Cl, F, S, Br by oxygen combustion + IC - C-H-N Flash Combustion
Verein Deutscher Zementwerke e.V. Forschungszentrum Düsseldorf – Germany
- Major Elements after acid dissolution - Cl, F, S, Br by oxygen combustion + IC - trace elements - 5 - Moisture Content - Ash content - B - ashing (ASTM D6722 + XRF) - Biomass/biodegradable - Minor Elements after acid dissolution - Calorific Value - Volatile Matter - C-H-N Flash Combustion
VTT Technical Research Centre of Finland Espoo – Finland
- Cl, F, S, Br by oxygen combustion + IC - B - ashing + DTA - A - nitric acid + ICP - ash melting behaviour - Volatile Matter - Density of pellets and briquettes - Ash content - Major Elements after acid dissolution - C-H-N Flash Combustion - Moisture Content - Calorific Value - Minor Elements after acid dissolution - Biomass/biodegradable
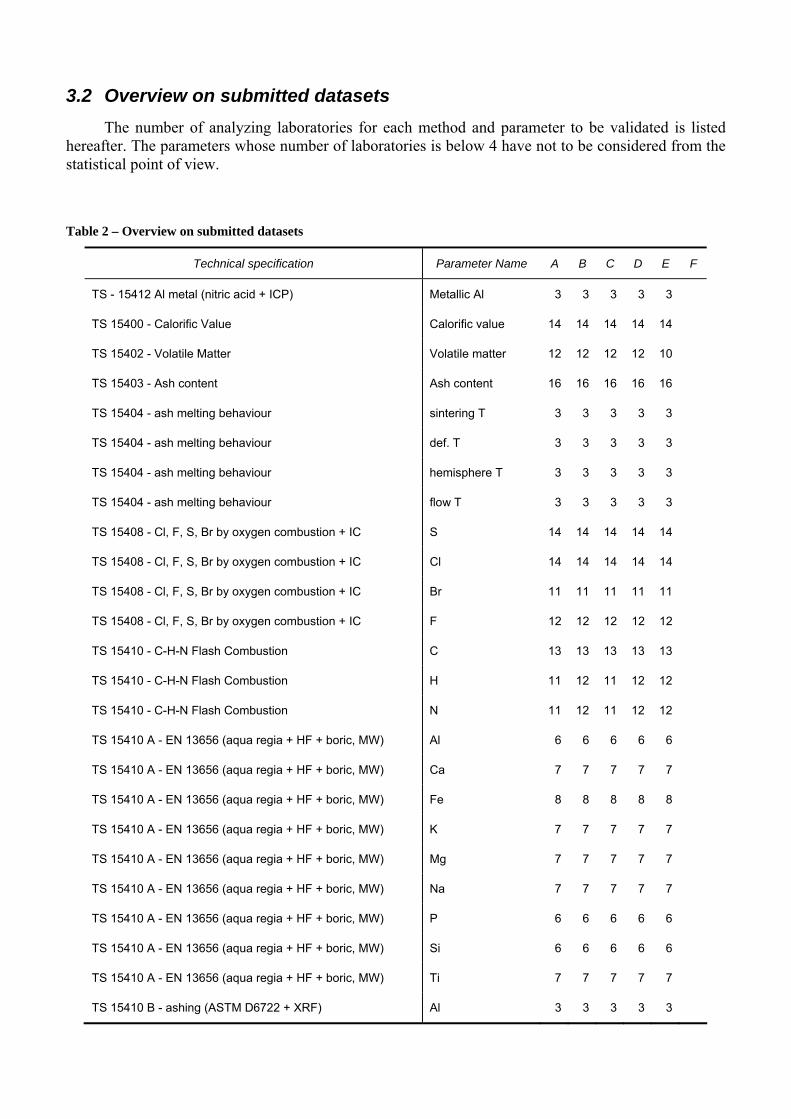
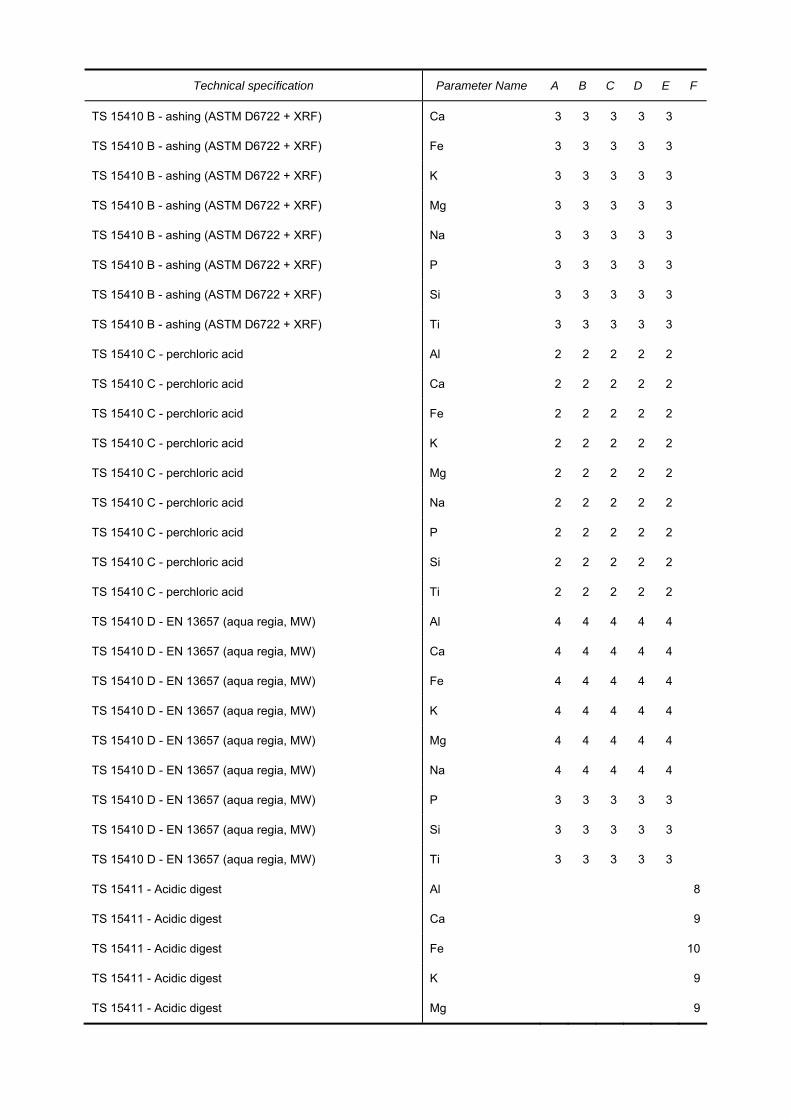
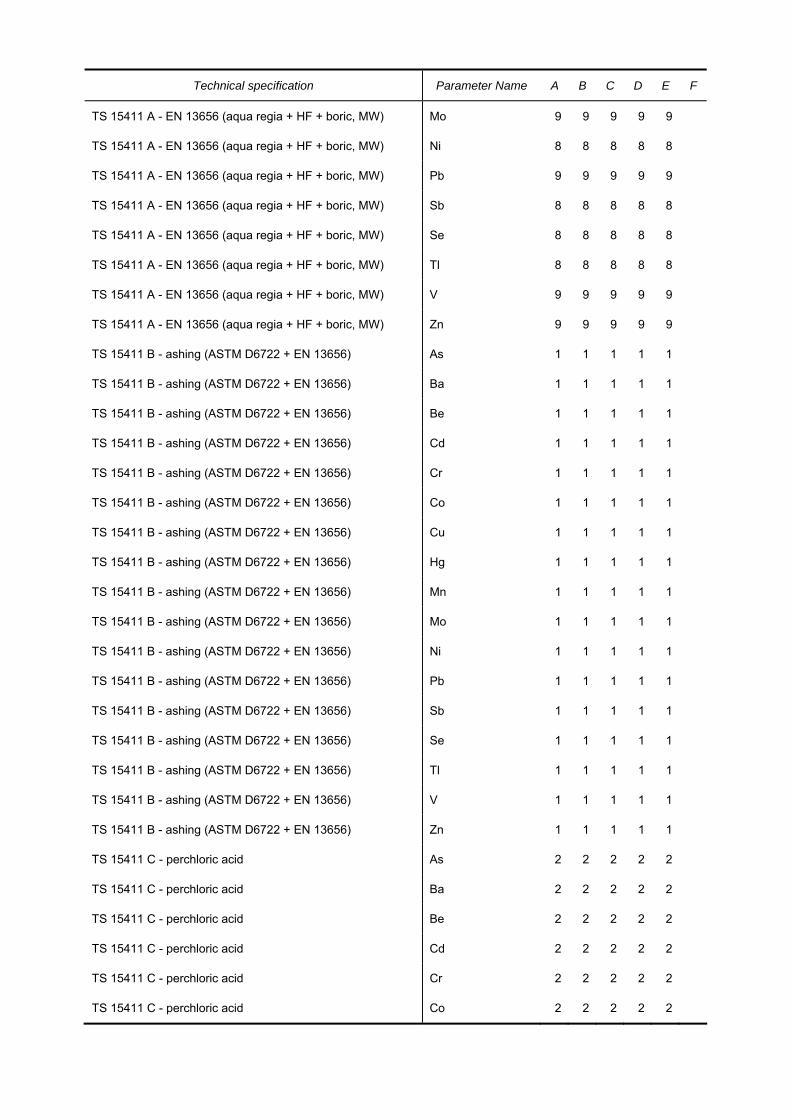
3.2 Overview on submitted datasets The number of analyzing laboratories for each method and parameter to be validated is listed
hereafter. The parameters whose number of laboratories is below 4 have not to be considered from the statistical point of view.
Table 2 – Overview on submitted datasets
Technical specification Parameter Name A B C D E F
TS - 15412 Al metal (nitric acid + ICP) Metallic Al 3 3 3 3 3
TS 15400 - Calorific Value Calorific value 14 14 14 14 14
TS 15402 - Volatile Matter Volatile matter 12 12 12 12 10
TS 15403 - Ash content Ash content 16 16 16 16 16
TS 15404 - ash melting behaviour sintering T 3 3 3 3 3
TS 15404 - ash melting behaviour def. T 3 3 3 3 3
TS 15404 - ash melting behaviour hemisphere T 3 3 3 3 3
TS 15404 - ash melting behaviour flow T 3 3 3 3 3
TS 15408 - Cl, F, S, Br by oxygen combustion + IC S 14 14 14 14 14
TS 15408 - Cl, F, S, Br by oxygen combustion + IC Cl 14 14 14 14 14
TS 15408 - Cl, F, S, Br by oxygen combustion + IC Br 11 11 11 11 11
TS 15408 - Cl, F, S, Br by oxygen combustion + IC F 12 12 12 12 12
TS 15410 - C-H-N Flash Combustion C 13 13 13 13 13
TS 15410 - C-H-N Flash Combustion H 11 12 11 12 12
TS 15410 - C-H-N Flash Combustion N 11 12 11 12 12
TS 15410 A - EN 13656 (aqua regia + HF + boric, MW) Al 6 6 6 6 6
TS 15410 A - EN 13656 (aqua regia + HF + boric, MW) Ca 7 7 7 7 7
TS 15410 A - EN 13656 (aqua regia + HF + boric, MW) Fe 8 8 8 8 8
TS 15410 A - EN 13656 (aqua regia + HF + boric, MW) K 7 7 7 7 7
TS 15410 A - EN 13656 (aqua regia + HF + boric, MW) Mg 7 7 7 7 7
TS 15410 A - EN 13656 (aqua regia + HF + boric, MW) Na 7 7 7 7 7
TS 15410 A - EN 13656 (aqua regia + HF + boric, MW) P 6 6 6 6 6
TS 15410 A - EN 13656 (aqua regia + HF + boric, MW) Si 6 6 6 6 6
TS 15410 A - EN 13656 (aqua regia + HF + boric, MW) Ti 7 7 7 7 7
TS 15410 B - ashing (ASTM D6722 + XRF) Al 3 3 3 3 3
Technical specification Parameter Name A B C D E F
TS 15410 B - ashing (ASTM D6722 + XRF) Ca 3 3 3 3 3
TS 15410 B - ashing (ASTM D6722 + XRF) Fe 3 3 3 3 3
TS 15410 B - ashing (ASTM D6722 + XRF) K 3 3 3 3 3
TS 15410 B - ashing (ASTM D6722 + XRF) Mg 3 3 3 3 3
TS 15410 B - ashing (ASTM D6722 + XRF) Na 3 3 3 3 3
TS 15410 B - ashing (ASTM D6722 + XRF) P 3 3 3 3 3
TS 15410 B - ashing (ASTM D6722 + XRF) Si 3 3 3 3 3
TS 15410 B - ashing (ASTM D6722 + XRF) Ti 3 3 3 3 3
TS 15410 C - perchloric acid Al 2 2 2 2 2
TS 15410 C - perchloric acid Ca 2 2 2 2 2
TS 15410 C - perchloric acid Fe 2 2 2 2 2
TS 15410 C - perchloric acid K 2 2 2 2 2
TS 15410 C - perchloric acid Mg 2 2 2 2 2
TS 15410 C - perchloric acid Na 2 2 2 2 2
TS 15410 C - perchloric acid P 2 2 2 2 2
TS 15410 C - perchloric acid Si 2 2 2 2 2
TS 15410 C - perchloric acid Ti 2 2 2 2 2
TS 15410 D - EN 13657 (aqua regia, MW) Al 4 4 4 4 4
TS 15410 D - EN 13657 (aqua regia, MW) Ca 4 4 4 4 4
TS 15410 D - EN 13657 (aqua regia, MW) Fe 4 4 4 4 4
TS 15410 D - EN 13657 (aqua regia, MW) K 4 4 4 4 4
TS 15410 D - EN 13657 (aqua regia, MW) Mg 4 4 4 4 4
TS 15410 D - EN 13657 (aqua regia, MW) Na 4 4 4 4 4
TS 15410 D - EN 13657 (aqua regia, MW) P 3 3 3 3 3
TS 15410 D - EN 13657 (aqua regia, MW) Si 3 3 3 3 3
TS 15410 D - EN 13657 (aqua regia, MW) Ti 3 3 3 3 3
TS 15411 - Acidic digest Al 8
TS 15411 - Acidic digest Ca 9
TS 15411 - Acidic digest Fe 10
TS 15411 - Acidic digest K 9
TS 15411 - Acidic digest Mg 9

Technical specification Parameter Name A B C D E F
TS 15411 - Acidic digest Na 9
TS 15411 - Acidic digest P 7
TS 15411 - Acidic digest Si 8
TS 15411 - Acidic digest Ti 8
TS 15411 - Acidic digest As 12
TS 15411 - Acidic digest Ba 11
TS 15411 - Acidic digest Be 10
TS 15411 - Acidic digest Cd 12
TS 15411 - Acidic digest Cr 11
TS 15411 - Acidic digest Co 10
TS 15411 - Acidic digest Cu 12
TS 15411 - Acidic digest Hg 10
TS 15411 - Acidic digest Mn 12
TS 15411 - Acidic digest Mo 11
TS 15411 - Acidic digest Ni 11
TS 15411 - Acidic digest Pb 12
TS 15411 - Acidic digest Sb 11
TS 15411 - Acidic digest Se 11
TS 15411 - Acidic digest Tl 11
TS 15411 - Acidic digest V 12
TS 15411 - Acidic digest Zn 12
TS 15411 - Hg by automatic analizer Hg 2 2 2 2 2
TS 15411 A - EN 13656 (aqua regia + HF + boric, MW) As 9 9 9 9 9
TS 15411 A - EN 13656 (aqua regia + HF + boric, MW) Ba 9 9 9 9 9
TS 15411 A - EN 13656 (aqua regia + HF + boric, MW) Be 7 7 7 7 7
TS 15411 A - EN 13656 (aqua regia + HF + boric, MW) Cd 9 9 9 9 9
TS 15411 A - EN 13656 (aqua regia + HF + boric, MW) Cr 9 9 9 9 9
TS 15411 A - EN 13656 (aqua regia + HF + boric, MW) Co 8 8 8 8 8
TS 15411 A - EN 13656 (aqua regia + HF + boric, MW) Cu 9 9 9 9 9
TS 15411 A - EN 13656 (aqua regia + HF + boric, MW) Hg 8 8 8 8 8
TS 15411 A - EN 13656 (aqua regia + HF + boric, MW) Mn 9 9 9 9 9
Technical specification Parameter Name A B C D E F
TS 15411 A - EN 13656 (aqua regia + HF + boric, MW) Mo 9 9 9 9 9
TS 15411 A - EN 13656 (aqua regia + HF + boric, MW) Ni 8 8 8 8 8
TS 15411 A - EN 13656 (aqua regia + HF + boric, MW) Pb 9 9 9 9 9
TS 15411 A - EN 13656 (aqua regia + HF + boric, MW) Sb 8 8 8 8 8
TS 15411 A - EN 13656 (aqua regia + HF + boric, MW) Se 8 8 8 8 8
TS 15411 A - EN 13656 (aqua regia + HF + boric, MW) Tl 8 8 8 8 8
TS 15411 A - EN 13656 (aqua regia + HF + boric, MW) V 9 9 9 9 9
TS 15411 A - EN 13656 (aqua regia + HF + boric, MW) Zn 9 9 9 9 9
TS 15411 B - ashing (ASTM D6722 + EN 13656) As 1 1 1 1 1
TS 15411 B - ashing (ASTM D6722 + EN 13656) Ba 1 1 1 1 1
TS 15411 B - ashing (ASTM D6722 + EN 13656) Be 1 1 1 1 1
TS 15411 B - ashing (ASTM D6722 + EN 13656) Cd 1 1 1 1 1
TS 15411 B - ashing (ASTM D6722 + EN 13656) Cr 1 1 1 1 1
TS 15411 B - ashing (ASTM D6722 + EN 13656) Co 1 1 1 1 1
TS 15411 B - ashing (ASTM D6722 + EN 13656) Cu 1 1 1 1 1
TS 15411 B - ashing (ASTM D6722 + EN 13656) Hg 1 1 1 1 1
TS 15411 B - ashing (ASTM D6722 + EN 13656) Mn 1 1 1 1 1
TS 15411 B - ashing (ASTM D6722 + EN 13656) Mo 1 1 1 1 1
TS 15411 B - ashing (ASTM D6722 + EN 13656) Ni 1 1 1 1 1
TS 15411 B - ashing (ASTM D6722 + EN 13656) Pb 1 1 1 1 1
TS 15411 B - ashing (ASTM D6722 + EN 13656) Sb 1 1 1 1 1
TS 15411 B - ashing (ASTM D6722 + EN 13656) Se 1 1 1 1 1
TS 15411 B - ashing (ASTM D6722 + EN 13656) Tl 1 1 1 1 1
TS 15411 B - ashing (ASTM D6722 + EN 13656) V 1 1 1 1 1
TS 15411 B - ashing (ASTM D6722 + EN 13656) Zn 1 1 1 1 1
TS 15411 C - perchloric acid As 2 2 2 2 2
TS 15411 C - perchloric acid Ba 2 2 2 2 2
TS 15411 C - perchloric acid Be 2 2 2 2 2
TS 15411 C - perchloric acid Cd 2 2 2 2 2
TS 15411 C - perchloric acid Cr 2 2 2 2 2
TS 15411 C - perchloric acid Co 2 2 2 2 2

Technical specification Parameter Name A B C D E F
TS 15411 C - perchloric acid Cu 2 2 2 2 2
TS 15411 C - perchloric acid Hg 1 1 1 1 1
TS 15411 C - perchloric acid Mn 2 2 2 2 2
TS 15411 C - perchloric acid Mo 2 2 2 2 2
TS 15411 C - perchloric acid Ni 2 2 2 2 2
TS 15411 C - perchloric acid Pb 2 2 2 2 2
TS 15411 C - perchloric acid Sb 2 2 2 2 2
TS 15411 C - perchloric acid Se 2 2 2 2 2
TS 15411 C - perchloric acid Tl 2 2 2 2 2
TS 15411 C - perchloric acid V 2 2 2 2 2
TS 15411 C - perchloric acid Zn 2 2 2 2 2
TS 15411 D - EN 13657 (aqua regia, MW) As 3 3 3 3 3
TS 15411 D - EN 13657 (aqua regia, MW) Ba 3 3 3 3 3
TS 15411 D - EN 13657 (aqua regia, MW) Be 3 3 3 3 3
TS 15411 D - EN 13657 (aqua regia, MW) Cd 3 3 3 3 3
TS 15411 D - EN 13657 (aqua regia, MW) Cr 3 3 3 3 3
TS 15411 D - EN 13657 (aqua regia, MW) Co 4 3 3 3 3
TS 15411 D - EN 13657 (aqua regia, MW) Cu 4 4 4 4 4
TS 15411 D - EN 13657 (aqua regia, MW) Hg 3 3 3 3 3
TS 15411 D - EN 13657 (aqua regia, MW) Mn 4 4 4 4 4
TS 15411 D - EN 13657 (aqua regia, MW) Mo 3 3 3 3 3
TS 15411 D - EN 13657 (aqua regia, MW) Ni 4 3 4 3 4
TS 15411 D - EN 13657 (aqua regia, MW) Pb 4 3 4 4 4
TS 15411 D - EN 13657 (aqua regia, MW) Sb 3 3 3 3 3
TS 15411 D - EN 13657 (aqua regia, MW) Se 3 3 3 3 3
TS 15411 D - EN 13657 (aqua regia, MW) Tl 3 3 3 3 3
TS 15411 D - EN 13657 (aqua regia, MW) V 3 3 3 3 3
TS 15411 D - EN 13657 (aqua regia, MW) Zn 4 4 4 4 4
TS 15414 - Moisture Content Moisture 14 14 14 14 14
TS 15415 - Particle dimesion & Particle size distribution 3.15 mm 3 4 3 4 4
TS 15415 - Particle dimesion & Particle size distribution 1.6 mm 3 4 3 4 4

Technical specification Parameter Name A B C D E F
TS 15415 - Particle dimesion & Particle size distribution 800 um 3 4 3 4 4
TS 15415 - Particle dimesion & Particle size distribution 400 um 3 4 3 4 4
TS 15415 - Particle dimesion & Particle size distribution 200 um 3 4 3 4 4
TS 15415 - Particle dimesion & Particle size distribution <200 um 3 4 3 4 4
TS 15440-B XB: Biomass 9 9 9
TS 15440-B XNB: Non Biomass 8 8 8
TS 15440-D XB: Biomass 3 4 4
TS 15440-D XNB: Non Biomass 2 3 3
TS 15440-E XB: Biomass 3 4 4
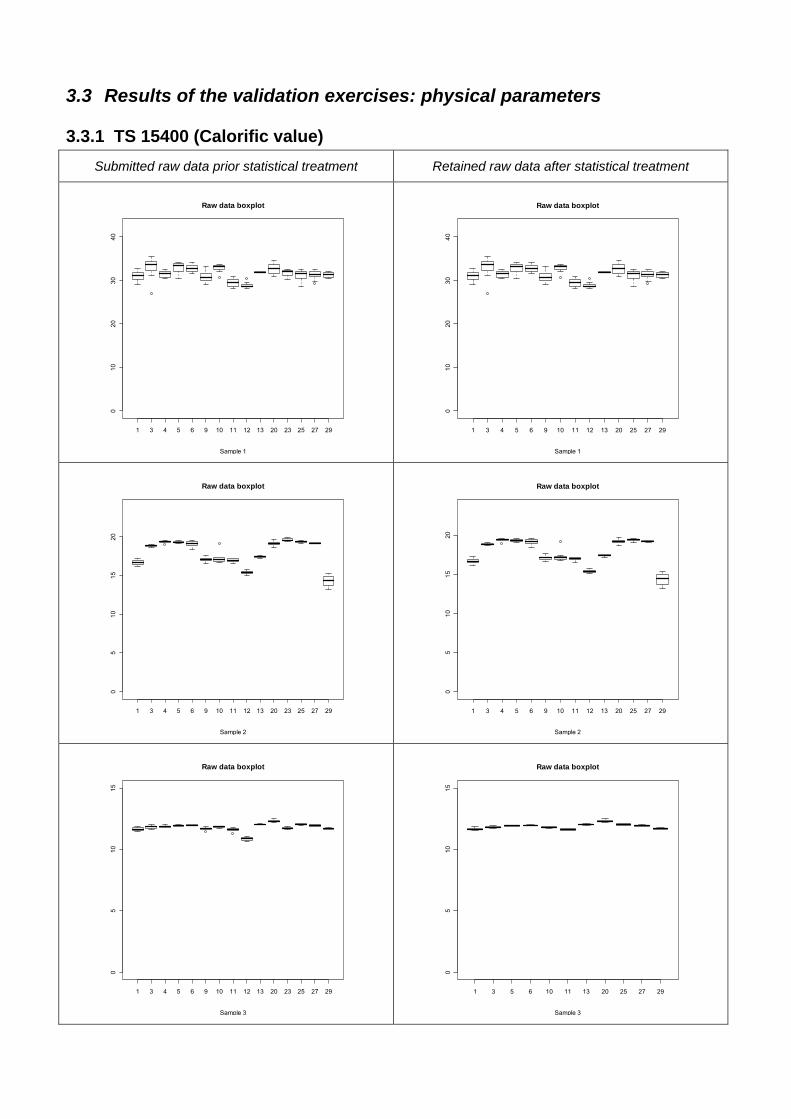
3.3 Results of the validation exercises: physical parameters
3.3.1 TS 15400 (Calorific value) Submitted raw data prior statistical treatment Retained raw data after statistical treatment
1 3 4 5 6 9 10 11 12 13 20 23 25 27 29
010
2030
40
Raw data boxplot
Sample 1 1 3 4 5 6 9 10 11 12 13 20 25 27 29
010
2030
40
Raw data boxplot
Sample 1
1 3 4 5 6 9 10 11 12 13 20 23 25 27 29
05
1015
20
Raw data boxplot
Sample 2 1 3 4 5 6 9 10 11 12 13 20 25 27 29
05
1015
20
Raw data boxplot
Sample 2
1 3 4 5 6 9 10 11 12 13 20 23 25 27 29
05
1015
Raw data boxplot
Sample 3 1 3 5 6 10 11 13 20 25 27 29
05
1015
Raw data boxplot
Sample 3

Submitted raw data prior statistical treatment Retained raw data after statistical treatment
1 3 4 5 6 9 10 11 12 13 20 23 25 27 29
05
1015
2025
Raw data boxplot
Sample 4 1 3 4 5 6 9 10 11 13 20 25 27 29
05
1015
2025
Raw data boxplot
Sample 4
1 3 4 5 6 9 10 11 12 13 20 23 25 27 29
05
1015
2025
Raw data boxplot
Sample 5 1 3 4 5 6 9 10 11 12 13 20 25 27 29
05
1015
2025
Raw data boxplot
Sample 5
All results are expressed in MJ/kg

Table 3: Validation of TS 15400 (Calorific value) - General Averages. Results are expressed in MJ/kg.
Level mj Number of valid results
1 31.55 174
2 18.07 172
3 11.88 138
4 19.82 168
5 19.38 180
Table 4: Validation of TS 15400 (Calorific value) - Sums of squares and degrees of freedom for laboratory effects (SSLj, niLj), for bottle effects (SS.Hj, niHj) and for repeatability (SS.rj, nirj)
Level SSLj niLj SSHj niHj SSrj nirj Kj K’j K’’j
1 256.35 14 36.62 14 161.26 145 2052 1044 90
2 370.39 14 1.30 14 5.70 143 2008 1024 89.2
3 5.24 11 0.06 17 0.46 139 1920 984 87.6
4 46.14 13 3.63 15 10.62 145 2052 1044 90
5 132.31 14 8.03 15 47.76 150 2160 1080 90
Table 5: Validation of TS 15404 (Calorific value) - Standard deviations for laboratory effects (sLj), for between-bottle effects (sHj), for repeatability (srj) and for reproducibility (sRj). Results are expressed in MJ/kg.
Level sLj sHj srj r sRj R
1 1.16 0.5 1.05 2.94 1.57 4.396
2 1.52 0.09 0.2 0.56 1.53 4.284
3 0.18 0.01 0.06 0.168 0.19 0.532
4 0.51 0.17 0.27 0.756 0.58 1.624
5 0.86 0.19 0.56 1.568 1.03 2.884

3.3.2 TS 15402 (Volatile matter) Submitted raw data prior statistical treatment Retained raw data after statistical treatment
3 4 5 9 10 11 12 13 23 25 27 29 30
020
4060
Raw data boxplot
Sample 1 3 4 5 9 10 11 12 13 23 25 27 29
010
2030
4050
6070
Raw data boxplot
Sample 1
3 4 5 9 10 11 12 13 23 25 27 29 30
020
4060
8010
0
Raw data boxplot
Sample 2 3 4 5 9 10 11 12 13 23 25 27 29
020
4060
8010
0Raw data boxplot
Sample 2
3 4 5 9 10 11 12 13 23 25 27 29 30
010
2030
40
Raw data boxplot
Sample 3 3 4 5 9 10 11 12 13 23 25 27 29
05
1015
2025
3035
Raw data boxplot
Sample 3

Submitted raw data prior statistical treatment Retained raw data after statistical treatment
3 4 5 9 10 11 12 13 23 25 27 29 30
020
4060
8010
0Raw data boxplot
Sample 4 3 4 5 9 10 11 12 13 23 25 27 29
020
4060
80
Raw data boxplot
Sample 4
4 5 9 10 11 12 23 25 27 29 30
020
4060
8010
0
Raw data boxplot
Sample 5 4 5 9 10 11 12 23 25 27 29
020
4060
80
Raw data boxplot
Sample 5
Results are expressed in percentage of weight (%)
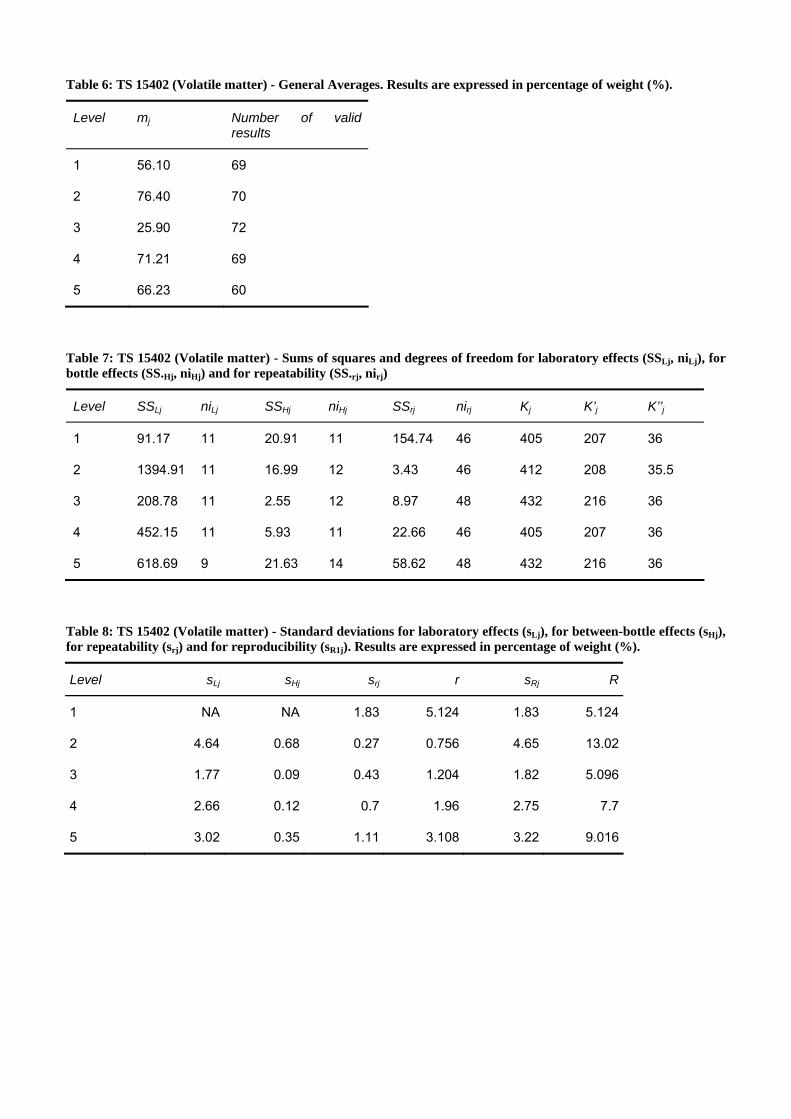
Table 6: TS 15402 (Volatile matter) - General Averages. Results are expressed in percentage of weight (%).
Level mj Number of valid results
1 56.10 69
2 76.40 70
3 25.90 72
4 71.21 69
5 66.23 60
Table 7: TS 15402 (Volatile matter) - Sums of squares and degrees of freedom for laboratory effects (SSLj, niLj), for bottle effects (SS.Hj, niHj) and for repeatability (SS.rj, nirj)
Level SSLj niLj SSHj niHj SSrj nirj Kj K’j K’’j
1 91.17 11 20.91 11 154.74 46 405 207 36
2 1394.91 11 16.99 12 3.43 46 412 208 35.5
3 208.78 11 2.55 12 8.97 48 432 216 36
4 452.15 11 5.93 11 22.66 46 405 207 36
5 618.69 9 21.63 14 58.62 48 432 216 36
Table 8: TS 15402 (Volatile matter) - Standard deviations for laboratory effects (sLj), for between-bottle effects (sHj), for repeatability (srj) and for reproducibility (sR1j). Results are expressed in percentage of weight (%).
Level sLj sHj srj r sRj R
1 NA NA 1.83 5.124 1.83 5.124
2 4.64 0.68 0.27 0.756 4.65 13.02
3 1.77 0.09 0.43 1.204 1.82 5.096
4 2.66 0.12 0.7 1.96 2.75 7.7
5 3.02 0.35 1.11 3.108 3.22 9.016

3.3.3 TS 15403 (Ash content) Submitted raw data prior statistical treatment Retained raw data after statistical treatment
1 3 4 5 6 9 10 12 19 23 27 30
05
1015
2025
3035
Raw data boxplot
Sample 1 1 3 4 5 6 9 10 11 12 19 20 23 25 27 29 30
05
1015
2025
3035
Raw data boxplot
Sample 1
1 3 4 5 6 9 10 12 19 23 27 30
01
23
45
6
Raw data boxplot
Sample 2
1 3 4 5 6 9 10 12 19 23 27 30
01
23
45
Raw data boxplot
Sample 2
1 3 4 5 6 9 10 12 19 23 27 30
020
4060
Raw data boxplot
Sample 3 1 3 4 6 9 10 12 13 19 20 23 25 27 29 30
020
4060
Raw data boxplot
Sample 3

1 3 4 5 6 9 10 12 19 23 27 30
05
1015
2025
Raw data boxplot
Sample 4
1 3 4 5 6 9 10 12 19 23 27 30
05
1015
2025
Raw data boxplot
Sample 4
1 3 4 5 6 9 10 12 19 23 27 30
05
1015
2025
30
Raw data boxplot
Sample 5
1 3 4 5 6 9 10 12 19 23 27 30
05
1015
2025
30
Raw data boxplot
Sample 5
Results are expressed in percentage of weight (%) d.m.

Table 9: TS 15403 (Ash content) - General Averages. Results are expressed in percentage of weight (%) d.m..
Level mj Number of valid results
1 20.98 96
2 3.38 102
3 60.80 90
4 14.89 96
5 23.39 102
Table 10: TS 15403 (Ash content) - Sums of squares and degrees of freedom, for laboratory effects (SSLj, niLj), for bottle effects (SS.Hj, niHj) and for repeatability (SS.rj, nirj)
Level SSLj niLj SSHj niHj SSrj nirj Kj K’j K’’j
1 293.38 15 265.48 18 573.83 62 576 288 48
2 14.78 16 10.48 17 4.03 68 612 306 51
3 55.32 14 4.80 19 4.80 68 612 306 51
4 87.05 15 15.83 18 39.30 68 612 306 51
5 136.37 16 43.12 17 156.00 68 612 306 51
Table 11: TS 15403 (Ash content) - Standard deviations for laboratory effects (sLj), for between-bottle effects (sHj) , for repeatability (srj) and for reproducibility (sRj). Results are expressed in percentage of weight (%) d.m.
Level sLj sHj srj r sRj R
1 0.83 1.44 3.04 8.512 3.15 8.82
2 0.23 0.43 0.24 0.672 0.33 0.924
3 0.73 0.26 0.27 0.756 0.78 2.184
4 0.87 0.33 0.76 2.128 1.16 3.248
5 1 0.28 1.51 4.228 1.81 5.068

3.3.4 TS 15414 (Moisture content) Submitted raw data prior statistical treatment Retained raw data after statistical treatment
1 3 4 5 10 11 13 15 18 20 22 23 24 25 27 29
01
23
45
6
Raw data boxplot
Sample 1 1 3 4 5 10 11 13 15 18 20 22 23 24 25 27 29
01
23
45
6
Raw data boxplot
Sample 1
1 3 4 5 10 11 13 15 18 20 22 23 24 25 27 29
05
1015
Raw data boxplot
Sample 2 1 4 5 10 11 15 20 22 23 24 25 27 29
05
1015
Raw data boxplot
Sample 2
1 3 4 5 10 11 13 15 18 20 22 23 24 25 27 29
01
23
4
Raw data boxplot
Sample 3 1 3 4 5 10 11 13 15 18 20 22 23 24 25 27 29
01
23
4
Raw data boxplot
Sample 3
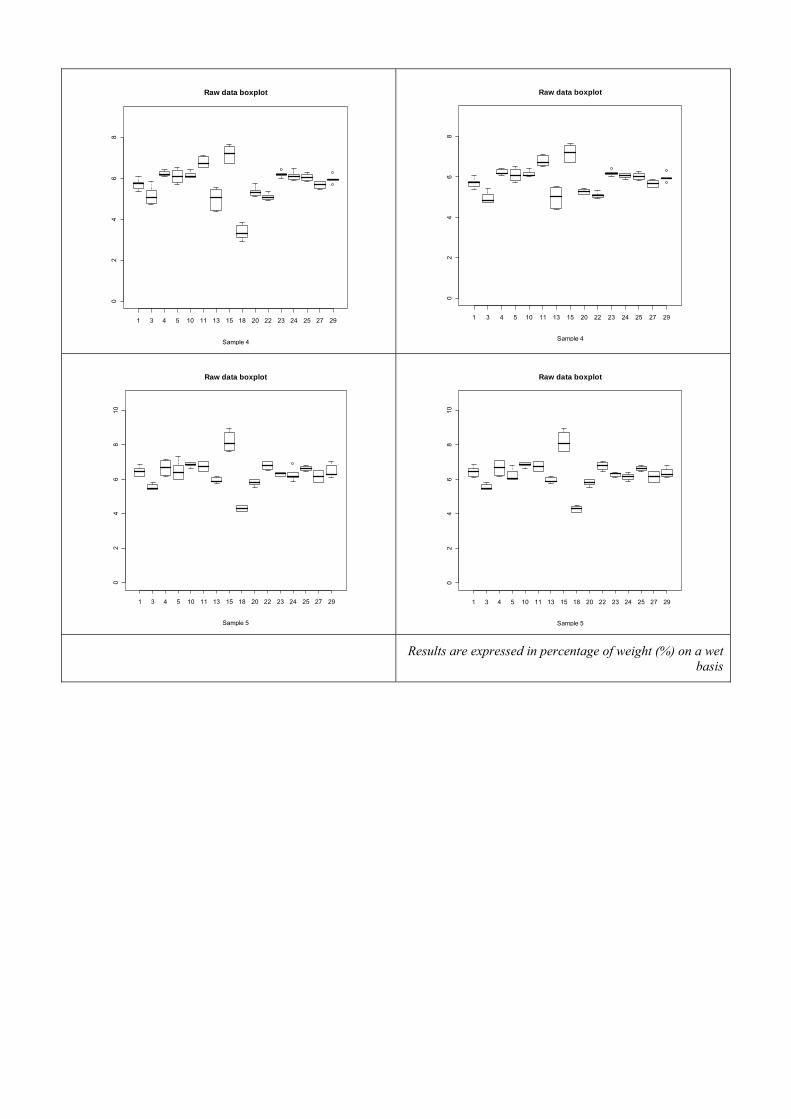
1 3 4 5 10 11 13 15 18 20 22 23 24 25 27 29
02
46
8
Raw data boxplot
Sample 4
1 3 4 5 10 11 13 15 20 22 23 24 25 27 29
02
46
8
Raw data boxplot
Sample 4
1 3 4 5 10 11 13 15 18 20 22 23 24 25 27 29
02
46
810
Raw data boxplot
Sample 5 1 3 4 5 10 11 13 15 18 20 22 23 24 25 27 29
02
46
810
Raw data boxplot
Sample 5
Results are expressed in percentage of weight (%) on a wet basis

Table 12: TS 15414 (Moisture content) - General Averages. Results are expressed in percentage of weight (%) on a wet basis
Level mj Number of valid results
1 2.48 50
2 11.79 50
3 2.13 50
4 5.96 52
5 6.49 50
Table 13: TS 15414 (Moisture content) - Sums of squares and degrees of freedom, for laboratory effects (SSLj, niLj), for bottle effects (SS.Hj, niHj) and for repeatability (SS.rj, nirj)
Level SSLj niLj SSHj niHj SSrj nirj Kj K’j K’’j
1 5.66 8 5.78 9 1.15 32 292 146 25
2 2.72 8 0.53 9 2.75 32 284 146 26
3 8.71 8 0.54 9 0.22 32 284 146 26
4 10.23 8 0.85 9 0.64 34 304 154 26.5
5 3.09 8 1.68 9 0.67 32 284 146 26
Table 14: TS 15414 (Moisture content) - Standard deviations for laboratory effects (sLj), for between-bottle effects (sHj) , for repeatability (srj) and for reproducibility (sRj). Results are expressed in percentage of weight (%) on a wet basis
Level sLj sHj srj r sRj R
1 0.11 0.47 0.19 0.532 0.22 0.616
2 NA NA 0.29 0.812 0.29 0.812
3 0.43 0.14 0.08 0.224 0.44 1.232
4 0.45 0.16 0.14 0.392 0.47 1.316
5 0.18 0.25 0.14 0.392 0.23 0.644

3.4 Results of the validation exercises: Biogenic content
3.4.1 TS 15440 B (Biomass content) Submitted raw data prior statistical treatment Retained raw data after statistical treatment
4 5 6 10 11 12 13 23 27 29
020
4060
8010
012
0
Raw data boxplot
Sample 2 4 5 6 10 12 13 23 27 29
020
4060
8010
012
0
Raw data boxplot
Sample 2
4 5 6 10 11 12 13 23 27 29
020
4060
80
Raw data boxplot
Sample 4
4 5 6 10 11 12 13 23 27 29
020
4060
80
Raw data boxplot
Sample 4

4 5 6 10 11 12 13 27 29
020
4060
Raw data boxplot
Sample 5 4 5 6 10 11 12 13 27 29
020
4060
Raw data boxplot
Sample 5
Results are expressed in percentage of weight (%) d.m.
Table 15: TS 15440 B (Biomass content) - General Averages. Results are expressed in percentage of weight (%) d.m.
Level mj Number of valid results
2 95.92823 54
4 67.79178 57
5 54.17492 54
Table 16: TS 15440 B (Biomass content) - Sums of squares and degrees of freedom for laboratory effects (SSLj, niLj), for bottle effects (SS.Hj, niHj) and for repeatability (SS.rj, nirj)
Level SSLj niLj SSHj niHj SSrj nirj Kj K’j K’’j
2 47.05 8 41.17 11 21.43 34 324 162 27
4 182.97 9 34.51 9 96.14 38 333 171 30
5 737.42 8 53.39 11 65.13 40 360 180 30
Table 17: TS 15440 B (Biomass content) - Standard deviations for laboratory effects (sLj), for between-bottle effects (sHj) , for repeatability (srj) and for reproducibility (sRj). Results are expressed in percentage of weight (%) d.m.
Level sLj sHj srj r sRj R
2 0.49 1.13 0.79 2.212 0.93 2.604
4 1.7 0.66 1.59 4.452 2.33 6.524
5 3.58 1.09 1.28 3.584 3.8 10.64

3.4.2 TS 15440 B (Non-biomass content) Submitted raw data prior statistical treatment Retained raw data after statistical treatment
4 5 6 10 12 13 23 27 29
02
46
8
Raw data boxplot
Sample 2
4 5 6 10 12 13 23 27
0.0
0.5
1.0
1.5
2.0
2.5
3.0
Raw data boxplot
Sample 2
4 5 6 10 12 13 23 27 29
010
2030
Raw data boxplot
Sample 4 4 5 6 10 12 13 23 27
05
1015
2025
Raw data boxplot
Sample 4
4 5 6 10 12 13 27 29
010
2030
40
Raw data boxplot
Sample 5 4 5 6 10 12 13 27
010
2030
Raw data boxplot
Sample 5
Results are expressed in percentage of weight (%) d.m.

Table 18: (Non-biomass content) - General Averages. Results are expressed in percentage of weight (%) d.m.
Level mj Number of valid results
2 0.93 41
4 15.99 45
5 23.52 42
Table 19: (Non-biomass content) - Sums of squares and degrees of freedom, for laboratory effects (SSLj, niLj), for bottle effects (SS.Hj, niHj) and for repeatability (SS.rj, nirj)
Level SSLj niLj SSHj niHj SSrj nirj Kj K’j K’’j
2 11.27 7 1.34 8 1.92 25 221 113 21.167
4 211.61 7 5.64 7 92.82 30 261 135 24
5 253.06 6 75.76 9 103.15 32 288 144 24
Table 20: (Non-biomass content) - Standard deviations for laboratory effects (sLj), for between-bottle effects (sHj) , for repeatability (srj) and for reproducibility (sRj). Results are expressed in percentage of weight (%) d.m.
Level sLj sHj srj r sRj R
2 0.53 0.19 0.28 0.784 0.6 1.68
4 NA NA 1.76 4.928 1.76 4.928
5 2.14 1.4 1.8 5.04 2.8 7.84
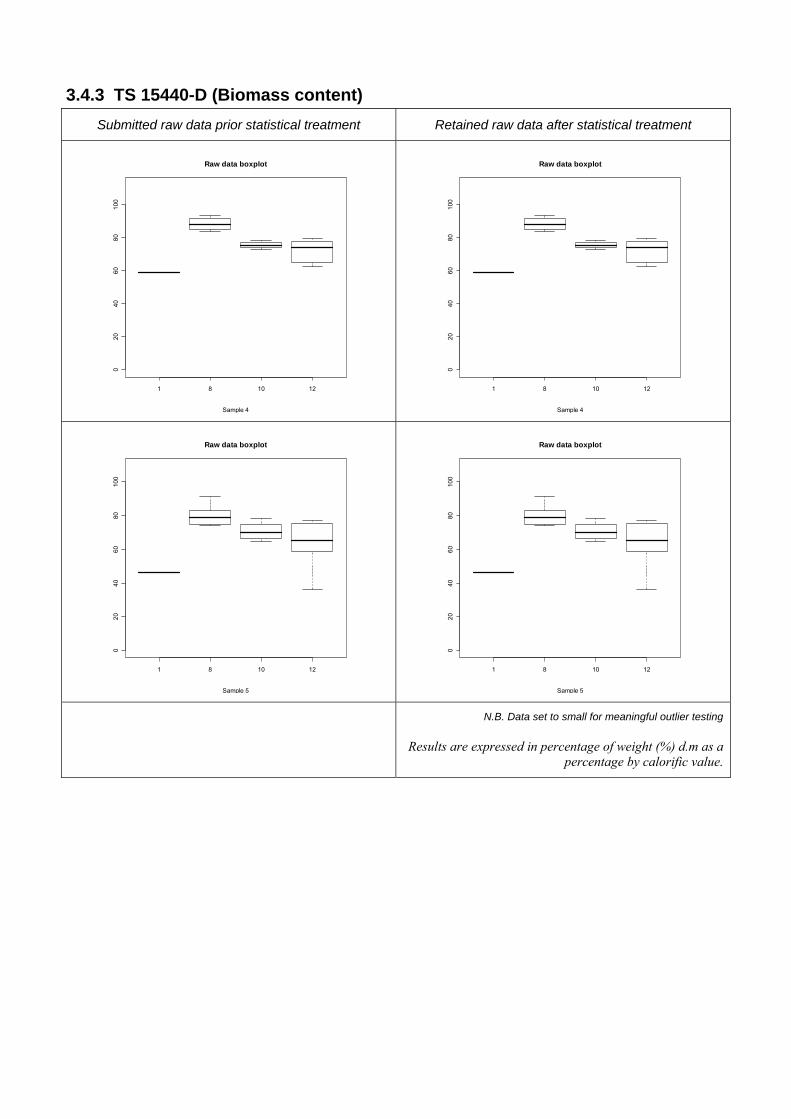
3.4.3 TS 15440-D (Biomass content) Submitted raw data prior statistical treatment Retained raw data after statistical treatment
1 8 10 12
020
4060
8010
0
Raw data boxplot
Sample 4 1 8 10 12
020
4060
8010
0
Raw data boxplot
Sample 4
1 8 10 12
020
4060
8010
0
Raw data boxplot
Sample 5 1 8 10 12
020
4060
8010
0Raw data boxplot
Sample 5
N.B. Data set to small for meaningful outlier testing
Results are expressed in percentage of weight (%) d.m as a percentage by calorific value.

Table 21: TS 15440-D (Biomass content) - General Averages. Results are expressed in percentage of weight (%) d.m as a percentage by calorific value.
Level mj Number of valid results
2 99.03 7
4 77.53 19
5 69.92 19
Table 22: TS 15440-D (Biomass content) - Sums of squares and degrees of freedom, for laboratory effects (SSLj, niLj), for bottle effects (SS.Hj, niHj) and for repeatability (SS.rj, nirj)
Level SSLj niLj SSHj niHj SSrj nirj Kj K’j K’’j
2 39.6 1 0 5 0 0 37 19 4
4 1258.6 3 48.7 3 282.2 12 109 55 10
5 1497.9 3 245.0 3 1206.9 12 109 55 10
Table 23: TS 15440-D (Biomass content) - Standard deviations for laboratory effects (sLj), for between-bottle effects (sHj) , for repeatability (srj) and for reproducibility (sRj). Results are expressed in percentage of weight (%) d.m as a percentage by calorific value.
Level sLj sHj srj r sRj R
2 NA NA NA NA
4 NA NA 4.85 13.58 4.85 13.58
5 NA NA 10.03 28.084 10.03 28.084

3.4.4 TS 15440-E (Biomass content) Submitted raw data prior statistical treatment Retained raw data after statistical treatment
10 12 13
020
4060
8010
012
0
Raw data boxplot
Sample 2 10 12 13
020
4060
8010
012
0
Raw data boxplot
Sample 2
6 10 12 13
020
4060
80
Raw data boxplot
Sample 4 6 10 12 13
020
4060
80Raw data boxplot
Sample 4
6 10 12 13
020
4060
80
Raw data boxplot
Sample 5 6 10 12 13
020
4060
80
Raw data boxplot
Sample 5

N.B. Data set to small for meaningful outlier testing
Results are expressed in percentage of weight (%) by carbon content
Table 24: TS 15440-E (Biomass content) - General Averages. Results are expressed in percentage of weight (%) by carbon content
Level mj Number of valid results
2 99.47 16
4 71.94 24
5 54.31 24
Table 25: TS 15440-E (Biomass content) - Sums of squares and degrees of freedom, for laboratory effects (SSLj, niLj), for bottle effects (SS.Hj, niHj) and for repeatability (SS.rj, nirj)
Level SSLj niLj SSHj niHj SSrj nirj Kj K’j K’’j
2 2.84 2 1.05 5 2.06 8 88 44 8
4 160.84 3 123.21 4 284.20 16 144 72 12
5 30.96 3 446.47 4 752.73 16 144 72 12
Table 26: TS 15440-E (Biomass content) - Standard deviations for laboratory effects (sLj), for between-bottle effects (sHj) , for repeatability (srj) and for reproducibility (sRj). Results are expressed in percentage of weight (%) by carbon content
Level sLj sHj srj r sRj R
2 NA NA 0.51 1.428 0.51 1.428
4 1.95 2.08 4.21 11.788 4.64 12.992
5 NA 4.64 6.86 19.208 6.86 19.208

3.5 Results of the validation exercises: Chemical parameters
3.5.1 TS 15407 (CHN Flash Combustion: Carbon) Submitted raw data prior statistical treatment Retained raw data after statistical treatment
3 4 5 6 10 11 12 13 15 16 20 23 25 27
020
4060
8010
0
Raw data boxplot
Sample 1 3 4 5 6 10 11 12 13 15 16 20 23 25 27
020
4060
8010
0
Raw data boxplot
Sample 1
3 4 5 6 10 11 12 13 15 16 20 23 25 27
010
2030
4050
60
Raw data boxplot
Sample 2 3 4 5 6 10 11 12 13 15 16 20 23 25 27
010
2030
4050
60
Raw data boxplot
Sample 2
3 4 5 6 10 11 12 13 15 16 20 23 25 27
010
2030
Raw data boxplot
Sample 3 3 4 5 6 10 11 12 13 15 16 20 23 25 27
010
2030
Raw data boxplot
Sample 3

3 4 5 6 10 11 12 13 15 16 20 23 25 27
010
2030
4050
60
Raw data boxplot
Sample 4 3 4 5 6 10 11 12 13 15 16 20 23 25 27
010
2030
4050
60
Raw data boxplot
Sample 4
3 4 5 6 10 11 12 13 15 16 20 23 25 27
010
2030
4050
60
Raw data boxplot
Sample 5 3 4 5 6 10 11 12 13 15 16 20 23 25 27
010
2030
4050
60
Raw data boxplot
Sample 5
Results are expressed in % d.m.

Table 27: TS 15407 (CHN Flash Combustion: Carbon) - General Averages. Results are expressed in % d.m..
Level mj Number of valid results
1 71.6 81
2 47.7 80
3 30.5 84
4 46.4 84
5 45.4 84
Table 28: TS 15407 (CHN Flash Combustion: Carbon) - Sums of squares and degrees of freedom for laboratory effects (SSLj, niLj), for bottle effects (SS.Hj, niHj) and for repeatability (SS.rj, nirj)
Level SSLj niLj SSHj niHj SSrj nirj Kj K’j K’’j
1 5.66 8 5.78 9 1.15 32 292 146 25
2 2.72 8 0.53 9 2.75 32 284 146 26
3 8.71 8 0.54 9 0.22 32 284 146 26
4 10.23 8 0.85 9 0.64 34 304 154 26.5
5 3.09 8 1.68 9 0.67 32 284 146 26
Table 29: TS 15407 (CHN Flash Combustion: Carbon) - Standard deviations for laboratory effects (sLj), for between-bottle effects (sHj) , for repeatability (srj) and for reproducibility (sRj). Results are expressed in % d.m.
Level sLj sHj srj r sRj R
1 NA NA 5.12 14.336 5.12 14.336
2 2.31 0.4 0.26 0.728 2.33 6.524
3 NA NA 0.43 1.204 0.43 1.204
4 1.52 1.09 1.63 4.564 2.23 6.244
5 2.42 1.18 1.71 4.788 2.97 8.316

3.5.2 TS 15407 (CHN Flash Combustion: Hydrogen) Submitted raw data prior statistical treatment Retained raw data after statistical treatment
3 5 10 11 12 13 15 16 20 23 25 27
02
46
810
Raw data boxplot
Sample 1
3 5 10 11 12 13 15 16 20 23 25 27
02
46
810
Raw data boxplot
Sample 1
3 5 6 10 11 12 13 15 16 20 23 25 27
02
46
810
Raw data boxplot
Sample 2
3 5 10 11 12 13 15 20 23 25 27
02
46
8Raw data boxplot
Sample 2
3 5 10 11 12 13 15 16 20 23 25 27
0.0
0.5
1.0
1.5
2.0
2.5
3.0
Raw data boxplot
Sample 3 3 5 10 11 13 15 16 20 23 25
0.0
0.5
1.0
1.5
2.0
2.5
3.0
Raw data boxplot
Sample 3

3 5 6 10 11 12 13 15 16 20 23 25 27
02
46
810
Raw data boxplot
Sample 4 3 5 6 10 11 12 13 16 20 23 25 27
02
46
810
Raw data boxplot
Sample 4
3 5 6 10 11 12 13 15 16 20 23 25 27
02
46
810
12
Raw data boxplot
Sample 5 3 5 6 10 11 12 13 15 16 20 23 25 27
02
46
810
12
Raw data boxplot
Sample 5
Results are expressed in % d.m.

Table 30: TS 15407 (CHN Flash Combustion: Hydrogen) - General Averages. Results are expressed in % d.m.
Level mj Number of valid results
1 6.83 63
2 6.14 66
3 2.28 60
4 6.53 70
5 6.73 72
Table 31: TS 15407 (CHN Flash Combustion: Hydrogen) - Sums of squares and degrees of freedom, for laboratory effects (SSLj, niLj), for bottle effects (SS.Hj, niHj) and for repeatability (SS.rj, nirj)
Level SSLj niLj SSHj niHj SSrj nirj Kj K’j K’’j
1 43.28 10 1.46 12 3.69 40 369 189 33
2 32.19 10 0.08 13 0.20 42 396 198 33
3 1.01 9 0.02 14 0.08 42 396 198 33
4 36.05 11 3.00 12 2.62 46 412 208 35.5
5 85.30 11 2.64 12 8.99 48 432 216 36
Table 32: TS 15407 (CHN Flash Combustion: Hydrogen) - Standard deviations for laboratory effects (sLj), for between-bottle effects (sHj) , for repeatability (srj) and for reproducibility (sRj). Results are expressed in % d.m.
Level sLj sHj srj r sRj R
1 0.86 0.11 0.3 0.84 0.91 2.548
2 0.73 0.02 0.07 0.196 0.73 2.044
3 NA NA 0.04 0.112 0.04 0.112
4 0.72 0.26 0.24 0.672 0.76 2.128
5 1.12 0.1 0.43 1.204 1.2 3.36

3.5.3 TS 15407 (CHN Flash Combustion: Nitrogen) Submitted raw data prior statistical treatment Retained raw data after statistical treatment
3 5 10 11 12 13 15 16 20 23 25 27
0.0
0.5
1.0
1.5
Raw data boxplot
Sample 1 3 5 11 12 13 15 20 23 27
0.0
0.2
0.4
0.6
0.8
1.0
1.2
Raw data boxplot
Sample 1
3 5 6 10 11 12 13 15 16 20 23 25 27
0.0
0.5
1.0
1.5
2.0
2.5
Raw data boxplot
Sample 2 3 5 6 11 12 13 15 16 25 27
0.0
0.2
0.4
0.6
0.8
1.0
1.2
Raw data boxplot
Sample 2
3 5 10 11 12 13 15 16 20 23 25 27
0.0
0.5
1.0
1.5
Raw data boxplot
Sample 3 3 5 10 11 12 15 16 20 23
0.0
0.2
0.4
0.6
0.8
1.0
1.2
1.4
Raw data boxplot
Sample 3

3 5 6 10 11 12 13 15 16 20 23 25 27
0.0
0.5
1.0
1.5
2.0
2.5
3.0
Raw data boxplot
Sample 4 3 5 11 12 13 15 20 23 25 27
0.0
0.5
1.0
1.5
2.0
2.5
3.0
Raw data boxplot
Sample 4
3 5 6 10 11 12 13 15 16 20 23 25 27
0.0
0.5
1.0
1.5
2.0
Raw data boxplot
Sample 5
3 5 11 12 13 16 23 25 27
0.0
0.2
0.4
0.6
0.8
1.0
1.2
1.4
Raw data boxplot
Sample 5
Results are expressed in % d.m.

Table 33: TS 15407 (CHN Flash Combustion: Nitrogen) - General Averages. Results are expressed in % d.m.
Level mj Number of valid results
1 0.55 53
2 0.71 64
3 1.02 58
4 1.83 62
5 0.95 58
Table 34: TS 15407 (CHN Flash Combustion: Nitrogen) - Sums of squares and degrees of freedom for laboratory effects (SSLj, niLj), for bottle effects (SS.Hj, niHj) and for repeatability (SS.rj, nirj)
Level SSLj niLj SSHj niHj SSrj nirj Kj K’j K’’j
1 1.68 9 0.10 11 0.17 32 301 155 28
2 1.78 10 0.12 11 0.16 42 376 190 32.5
3 0.39 9 0.00 12 0.02 42 376 190 32.5
4 5.48 10 0.16 11 0.60 40 364 182 31
5 0.96 9 0.08 12 0.16 42 376 190 32.5
Table 35: TS 15407 – (CHN Flash Combustion: Nitrogen) - Standard deviations for laboratory effects (sLj), for between-bottle effects (sHj) , for repeatability (srj) and for reproducibility (sRj). Results are expressed in % d.m.
Level sLj sHj srj r sRj R
1 0.18 0.04 0.07 0.196 0.2 0.56
2 0.17 0.05 0.06 0.168 0.18 0.504
3 NA NA 0.02 0.056 0.02 0.056
4 NA NA 0.12 0.336 0.12 0.336
5 0.12 0.03 0.06 0.168 0.14 0.392

3.5.4 TS 15408 (Cl, F, S, Br by oxygen combustion and IC: Sulfur) Submitted raw data prior statistical treatment Retained raw data after statistical treatment
1 3 4 5 6 10 11 12 13 14 20 25 27 29
0.0
0.5
1.0
1.5
2.0
2.5
Raw data boxplot
Sample 1 1 3 4 5 6 10 11 12 13 14 20 25 27 29
0.0
0.5
1.0
1.5
2.0
2.5
Raw data boxplot
Sample 1
1 3 4 5 10 11 12 13 14 20 25 27 29
0.00
0.05
0.10
0.15
0.20
0.25
Raw data boxplot
Sample 2 1 3 4 5 10 11 13 14 20 25 27 29
0.00
0.02
0.04
0.06
0.08
0.10
Raw data boxplot
Sample 2
1 3 4 5 6 10 11 12 13 14 20 25 27 29
0.0
0.5
1.0
1.5
Raw data boxplot
Sample 3 1 3 4 5 6 10 11 12 13 20 25 27 29
0.0
0.5
1.0
1.5
Raw data boxplot
Sample 3

1 3 4 5 6 10 11 12 13 14 20 25 27 29
0.0
0.1
0.2
0.3
0.4
Raw data boxplot
Sample 4 1 3 4 5 6 10 11 12 13 14 25 27 29
0.0
0.1
0.2
0.3
0.4
Raw data boxplot
Sample 4
1 3 4 5 6 10 11 12 13 14 20 25 27 29
0.00
0.05
0.10
0.15
0.20
Raw data boxplot
Sample 5 1 3 4 5 6 10 11 12 13 14 20 27 29
0.00
0.05
0.10
0.15
0.20
Raw data boxplot
Sample 5
Results are expressed in % d.m.

Table 36: TS 15408 (Cl, F, S, Br by oxygen combustion and IC: Sulfur) - General Averages. Results are expressed in % d.m.
Level mj Number of valid results
1 1.42 160
2 0.03 144
3 1.06 156
4 0.25 154
5 0.13 154
Table 37: TS 15408 (Cl, F, S, Br by oxygen combustion and IC: Sulfur) - Sums of squares and degrees of freedom for laboratory effects (SSLj, niLj), for bottle effects (SS.Hj, niHj) and for repeatability (SS.rj, nirj)
Level SSLj niLj SSHj niHj SSrj nirj Kj K’j K’’j
1 4.51 13 1.25 13 1.41 133 1864 952 83.2
2 0.02 11 0.00 16 0.01 140 2016 1008 84
3 2.77 12 0.07 15 0.48 140 2016 1008 84
4 0.21 12 0.01 15 0.12 138 1972 988 83.2
5 0.08 12 0.00 15 0.03 138 1972 988 83.2
Table 38: TS 15408 (Cl, F, S, Br by oxygen combustion and IC: Sulfur) - Standard deviations for laboratory effects (sLj), for between-bottle effects (sHj) , for repeatability (srj) and for reproducibility (sRj). Results are expressed in % d.m.
Level sLj sHj srj r sRj R
1 0.148 0.12 0.103 0.2884 0.181 0.5068
2 0.011 0.004 0.007 0.0196 0.013 0.0364
3 0.132 0.016 0.059 0.1652 0.144 0.4032
4 NA NA 0.029 0.0812 0.029 0.0812
5 0.022 0.002 0.013 0.0364 0.026 0.0728
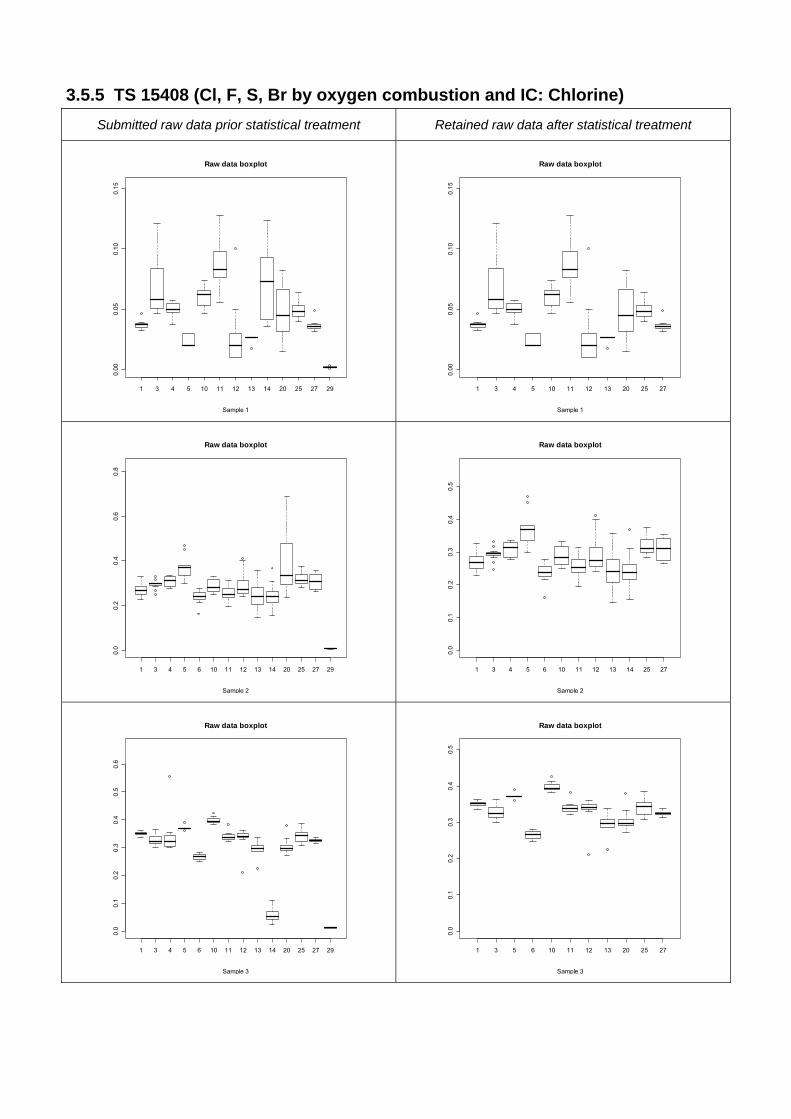
3.5.5 TS 15408 (Cl, F, S, Br by oxygen combustion and IC: Chlorine) Submitted raw data prior statistical treatment Retained raw data after statistical treatment
1 3 4 5 10 11 12 13 14 20 25 27 29
0.00
0.05
0.10
0.15
Raw data boxplot
Sample 1 1 3 4 5 10 11 12 13 20 25 27
0.00
0.05
0.10
0.15
Raw data boxplot
Sample 1
1 3 4 5 6 10 11 12 13 14 20 25 27 29
0.0
0.2
0.4
0.6
0.8
Raw data boxplot
Sample 2 1 3 4 5 6 10 11 12 13 14 25 27
0.0
0.1
0.2
0.3
0.4
0.5
Raw data boxplot
Sample 2
1 3 4 5 6 10 11 12 13 14 20 25 27 29
0.0
0.1
0.2
0.3
0.4
0.5
0.6
Raw data boxplot
Sample 3 1 3 5 6 10 11 12 13 20 25 27
0.0
0.1
0.2
0.3
0.4
0.5
Raw data boxplot
Sample 3
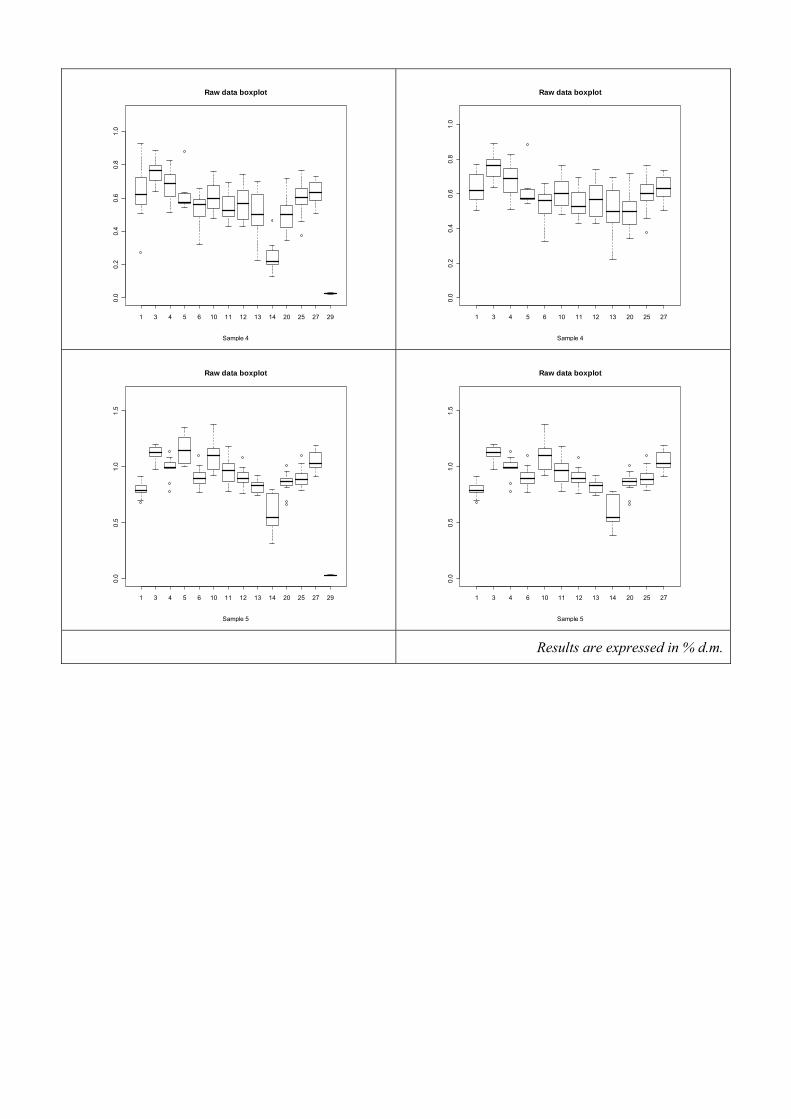
1 3 4 5 6 10 11 12 13 14 20 25 27 29
0.0
0.2
0.4
0.6
0.8
1.0
Raw data boxplot
Sample 4 1 3 4 5 6 10 11 12 13 20 25 27
0.0
0.2
0.4
0.6
0.8
1.0
Raw data boxplot
Sample 4
1 3 4 5 6 10 11 12 13 14 20 25 27 29
0.0
0.5
1.0
1.5
Raw data boxplot
Sample 5 1 3 4 6 10 11 12 13 14 20 25 27
0.0
0.5
1.0
1.5
Raw data boxplot
Sample 5
Results are expressed in % d.m.

Table 39: TS 15408 (Cl, F, S, Br by oxygen combustion and IC: Chlorine) - General Averages. Results are expressed in % d.m.
Level mj Number of valid results
1 0.049955 138
2 0.294215 156
3 0.31127 156
4 0.570634 156
5 0.931919 156
Table 40: TS 15408 (Cl, F, S, Br by oxygen combustion and IC: Chlorine) - Sums of squares and degrees of freedom for laboratory effects (SSLj, niLj), for bottle effects (SS.Hj, niHj) and for repeatability (SS.rj, nirj)
Level SSLj niLj SSHj niHj SSrj nirj Kj K’j K’’j
1 0.051197 11 0.009629 13 0.027162 113 1620 828 72
2 0.328162 12 0.173844 13 0.254496 130 1872 936 78
3 0.991389 12 0.015776 13 0.096359 130 1872 936 78
4 2.081723 12 0.244242 13 1.351699 130 1872 936 78
5 3.46214 12 0.188359 13 1.285999 130 1872 936 78
Table 41: TS 15408 (Cl, F, S, Br by oxygen combustion and IC: Chlorine) - Standard deviations for laboratory effects (sLj), for between-bottle effects (sHj) , for repeatability (srj) and for reproducibility (sRj). Results are expressed in % d.m.
Level sLj sHj srj r sRj R
1 0.018 0.01 0.016 0.0448 0.024 0.0672
2 0.034 0.044 0.044 0.1232 0.056 0.1568
3 0.082 0.009 0.027 0.0756 0.087 0.2436
4 0.114 0.037 0.102 0.2856 0.153 0.4284
5 0.151 0.028 0.099 0.2772 0.181 0.5068

y = 0.1883x + 0.0188R2 = 0.9237
0.000
0.050
0.100
0.150
0.200
0.250
0 0.1 0.2 0.3 0.4 0.5 0.6 0.7 0.8 0.9 1
Concentration (mg/kg)
s.R
i (m
g/kg
)
Figure 22: TS 15408 (Cl, F, S, Br by oxygen combustion and IC: Chlorine) - Concentration dependence of reproducibility. Error bars represent the homogeneity effects-related standard deviation (sHi)

3.5.6 TS 15408 (Cl, F, S, Br by oxygen combustion and IC: Bromine) Submitted raw data prior statistical treatment Retained raw data after statistical treatment
1 3 4 5 10 11 12 13 25 27
0.00
0.02
0.04
0.06
0.08
0.10
Raw data boxplot
Sample 1 1 3 4 5 10 11 12 13 25 27
0.00
0.02
0.04
0.06
0.08
0.10
Raw data boxplot
Sample 1
1 4 11 25 27
0.00
00.
005
0.01
00.
015
Raw data boxplot
Sample 2 1 4 11 25 27
0.00
00.
005
0.01
00.
015
Raw data boxplot
Sample 2
1 4 10 11 25 27
0.00
0.01
0.02
0.03
0.04
0.05
Raw data boxplot
Sample 3 1 4 10 25 27
0.00
00.
001
0.00
20.
003
0.00
40.
005
0.00
6
Raw data boxplot
Sample 3

1 4 5 11 12 25 27
0.00
00.
005
0.01
00.
015
0.02
00.
025
0.03
00.
035
Raw data boxplot
Sample 4 1 4 5 11 12 25 27
0.00
00.
005
0.01
00.
015
0.02
00.
025
0.03
00.
035
Raw data boxplot
Sample 4
1 4 5 11 12 25 27
0.00
0.01
0.02
0.03
0.04
0.05
0.06
Raw data boxplot
Sample 5 1 4 5 11 12 25 27
0.00
0.01
0.02
0.03
0.04
0.05
0.06
Raw data boxplot
Sample 5
Results are expressed in % d.m.

Table 42: TS 15408 (Cl, F, S, Br by oxygen combustion and IC: Bromine) - General Averages. Results are expressed in % d.m.
Level mj Number of valid results
1 0.030 114
2 0.0027 49
3 0.0029 60
4 0.0065 65
5 0.0110 76
Table 43: TS 15408 (Cl, F, S, Br by oxygen combustion and IC: Bromine) - Sums of squares and degrees of freedom for laboratory effects (SSLj, niLj), for bottle effects (SS.Hj, niHj) and for repeatability (SS.rj, nirj)
Level SSLj niLj SSHj niHj SSrj nirj Kj K’j K’’j
1 0.0157 9 0.00081 9 0.00433 95 1332 684 60
2 0.0003 4 0.00018 13 0.00003 85 1189 613 55
3 0.0001 4 0.00001 14 0.00001 95 1332 684 60
4 0.0017 6 0.00003 10 0.00044 78 1057 553 53
5 0.0046 6 0.00002 12 0.00153 87 1204 620 56
Table 44: TS 15408 (Cl, F, S, Br by oxygen combustion and IC: Bromine) - Standard deviations for laboratory effects (sLj), for between-bottle effects (sHj) , for repeatability (srj) and for reproducibility (sRj). Results are expressed in % d.m.
Level sLj sHj srj r sRj R
1 0.012 0.0027 0.0067 0.01876 0.0138 0.03864
2 0.001 0.0019 0.0006 0.00168 0.0012 0.00336
3 0.0007 0.0003 0.0003 0.00084 0.0008 0.00224
4 NA NA 0.0024 0.00672 0.0024 0.00672
5 NA NA 0.0042 0.01176 0.0042 0.01176
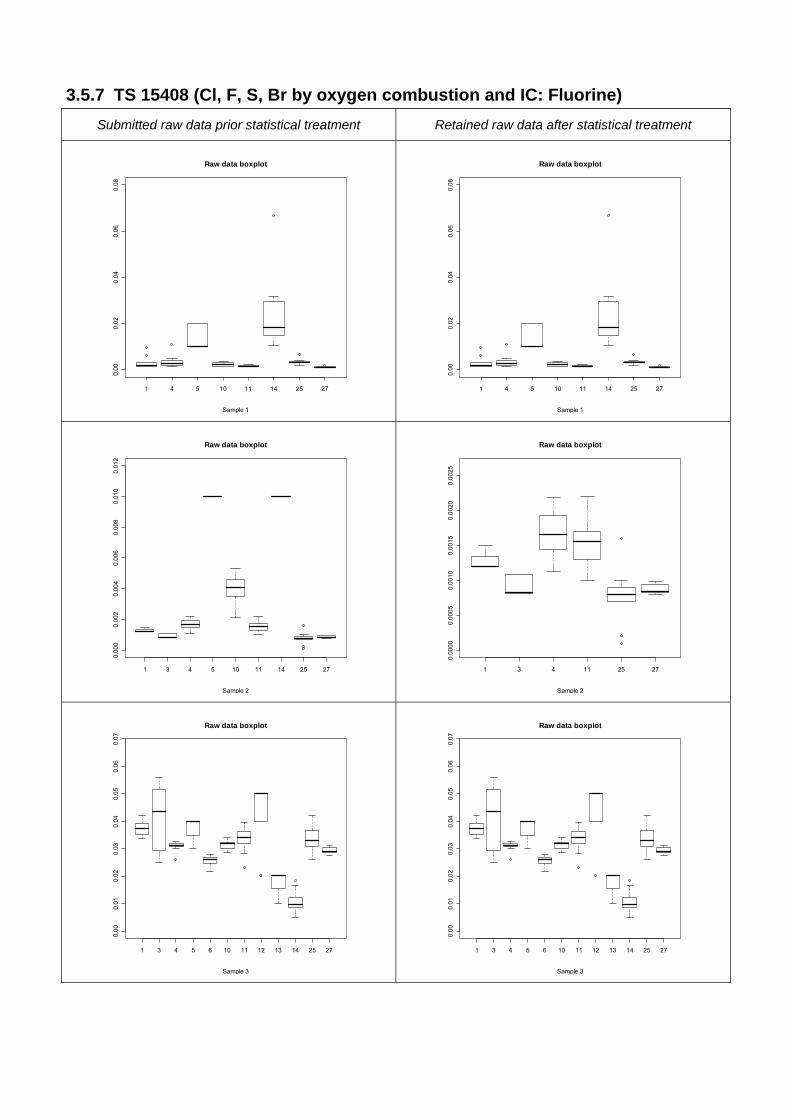
3.5.7 TS 15408 (Cl, F, S, Br by oxygen combustion and IC: Fluorine) Submitted raw data prior statistical treatment Retained raw data after statistical treatment
1 4 5 10 11 14 25 27
0.00
0.02
0.04
0.06
0.08
Raw data boxplot
Sample 1 1 4 5 10 11 14 25 27
0.00
0.02
0.04
0.06
0.08
Raw data boxplot
Sample 1
1 3 4 5 10 11 14 25 27
0.00
00.
002
0.00
40.
006
0.00
80.
010
0.01
2
Raw data boxplot
Sample 2 1 3 4 11 25 27
0.00
000.
0005
0.00
100.
0015
0.00
200.
0025
Raw data boxplot
Sample 2
1 3 4 5 6 10 11 12 13 14 25 27
0.00
0.01
0.02
0.03
0.04
0.05
0.06
0.07
Raw data boxplot
Sample 3 1 3 4 5 6 10 11 12 13 14 25 27
0.00
0.01
0.02
0.03
0.04
0.05
0.06
0.07
Raw data boxplot
Sample 3

1 3 4 5 6 10 11 12 14 25 27
0.00
0.01
0.02
0.03
0.04
Raw data boxplot
Sample 4 1 3 4 5 6 10 11 12 25 27
0.00
00.
005
0.01
00.
015
0.02
0
Raw data boxplot
Sample 4
1 3 4 5 6 10 11 12 14 25 27
0.00
0.02
0.04
0.06
0.08
Raw data boxplot
Sample 5 1 3 4 5 6 11 12 14 25 27
0.00
0.01
0.02
0.03
0.04
0.05
0.06
Raw data boxplot
Sample 5
Results are expressed in % d.m.

Table 45: TS 15408 (Cl, F, S, Br by oxygen combustion and IC: Fluorine) - General Averages. Results are expressed in % d.m.
Level mj Number of valid results
1 0.0063 92
2 0.0027 86
3 0.0311 144
4 0.0098 118
5 0.0100 117
Table 46: TS 15408 (Cl, F, S, Br by oxygen combustion and IC: Fluorine) - Sums of squares and degrees of freedom for laboratory effects (SSLj, niLj), for bottle effects (SS.Hj, niHj) and for repeatability (SS.rj, nirj)
Level SSLj niLj SSHj niHj SSrj nirj Kj K’j K’’j
1 0.00518 7 0.000561 16 0.002341 68 1064 534 46.2
2 0.000763 8 4.88E-07 14 1.35E-05 63 974 490 43.867
3 0.01201 11 0.000457 12 0.003071 120 1728 864 72
4 0.000458 9 5.12E-05 14 0.000427 118 1684 844 71.2
5 0.000866 9 0.000369 14 0.002723 117 1665 833 70.56
Table 47: TS 15408 (Cl, F, S, Br by oxygen combustion and IC: Fluorine) - Standard deviations for laboratory effects (sLj), for between-bottle effects (sHj) , for repeatability (srj) and for reproducibility (sRj). Results are expressed in % d.m.
Level sLj sHj srj r sRj R
1 0.0078 0.0005 0.0059 0.01652 0.0098 0.02744
2 NA NA 0.0005 0.0014 0.0005 0.0014
3 0.0094 0.0014 0.0051 0.01428 0.0106 0.02968
4 0.0018 0.0001 0.0019 0.00532 0.0026 0.00728
5 0.0022 0.0008 0.0048 0.01344 0.0053 0.01484

3.5.8 Digestion verification: Analysis of pre-digested SRF sample QV-F Table 48: Analysis of pre-digested SRF sample QV-F - Average values per laboratory on QV-F analysis. Results are expressed in mg/L.
Laboratory Al Ca Fe K Mg Na P Si Ti
1 163.8 32.0
4 48.8
12 179.2 36.1
13 4.1
14 173.0 417.2 50.1 41.3 33.1 60.6 18.4 20.0 0.66
16 164.8 419.5 45.5 37.1 33.1 51.0 151.5 0.61
19 172.9 436.7 46.2 31.1 36.8 55.8 29.9 0.64
20 173.4 495.4 53.6 47.4 37.2 58.8 18.0 82.7 0.58
21 175.5 36.7
22 145.7 32.9 36.9
27 172.0 450.4 47.5 47.3 34.9 66.2 14.9 0.63
29 226.5 48.7 43.4 21.9 66.2
1 12 14 16 19 20 21 22 25 27
050
000
1000
0015
0000
2000
0025
0000
Raw data boxplot
Sample 6
Figure 23: Box-and-Wiskers plot for Al in the acidic digested SRF. Laboratory 25 has been discarded as a clear outlier, the same situation occurring for all the other elements. Results are expressed in mg/L.

3.5.9 TS 15410 A - EN 13656 (aqua regia, HF, boric acid, micro-wave assisted digestion: Aluminium)
Submitted raw data prior statistical treatment Retained raw data after statistical treatment
1 16 19 20 21 25 30
020
0040
0060
00
Raw data boxplot
Sample 1 1 16 19 20 21 25
020
040
060
080
010
00
Raw data boxplot
Sample 1
1 16 19 20 21 25 30
020
000
4000
060
000
8000
0
Raw data boxplot
Sample 2 1 16 19 20 21 25
010
0020
0030
00Raw data boxplot
Sample 2
1 16 19 20 21 25 30
010
000
2000
030
000
4000
050
000
6000
0
Raw data boxplot
Sample 3 1 16 19 20 21 25 30
010
000
2000
030
000
4000
050
000
6000
0
Raw data boxplot
Sample 3

1 16 19 20 21 25 30
050
0010
000
1500
0
Raw data boxplot
Sample 4 1 16 19 20 21 25 30
050
0010
000
1500
0
Raw data boxplot
Sample 4
1 16 19 20 21 25 30
050
0010
000
1500
020
000
2500
0
Raw data boxplot
Sample 5 1 16 19 20 21 25 30
050
0010
000
1500
020
000
2500
0
Raw data boxplot
Sample 5
Results are expressed in mg/kg d.m.

Table 49: TS 15410 A (aqua regia, HF, boric acid, micro-wave assisted digestion: Aluminium) - General Averages. Results are expressed in mg/kg d.m.
Level mj Number of valid results
1 428.2 36
2 693.4 36
3 31630.3 42
4 6014.5 42
5 10475.3 42
Table 50: TS 15410 A (aqua regia, HF, boric acid, micro-wave assisted digestion: Aluminium) - Sums of squares and degrees of freedom for laboratory effects (SSLj, niLj), for bottle effects (SS.Hj, niHj) and for repeatability (SS.rj, nirj)
Level SSLj niLj SSHj niHj SSrj nirj Kj K’j K’’j
1 423193.6 5 174036.5 8 169810.4 22 216 108 18
2 4841448 5 4372266 8 6699168 22 216 108 18
3 1.61E+10 6 2.49E+08 7 2.28E+08 28 252 126 21
4 1.07E+08 6 19404890 7 1.01E+08 28 252 126 21
5 6.88E+08 6 34478170 7 2.24E+08 28 252 126 21
Table 51: TS 15410 A (aqua regia, HF, boric acid, micro-wave assisted digestion: Aluminium) - Standard deviations for laboratory effects (sLj), for between-bottle effects (sHj) , for repeatability (srj) and for reproducibility (sRj). Results are expressed in mg/kg d.m.
Level sLj sHj srj r sRj R
1 98 79 88 246.4 132 369.6
2 238 328 552 1545.6 601 1682.8
3 21026 3028 2851 7982.8 21219 59413.2
4 NA NA 1898 5314.4 1898 5314.4
5 NA NA 2826 7912.8 2826 7912.8

3.5.10 TS 15410 A - EN 13656 (aqua regia, HF, boric acid, micro-wave assisted digestion: Calcium)
Submitted raw data prior statistical treatment Retained raw data after statistical treatment
1 14 16 19 20 21 25 30
010
0020
0030
0040
0050
0060
00
Raw data boxplot
Sample 1 1 14 16 19 20 21 25 30
010
0020
0030
0040
0050
0060
00
Raw data boxplot
Sample 1
1 14 16 19 20 21 25 30
050
000
1000
0015
0000
2000
0025
0000
Raw data boxplot
Sample 2 1 14 16 19 20 21 25
010
0020
0030
0040
0050
00
Raw data boxplot
Sample 2
1 14 16 19 20 21 25 30
020
000
4000
060
000
8000
010
0000
1200
0014
0000
Raw data boxplot
Sample 3 1 14 16 19 20 21 25 30
020
000
4000
060
000
8000
010
0000
1200
0014
0000
Raw data boxplot
Sample 3
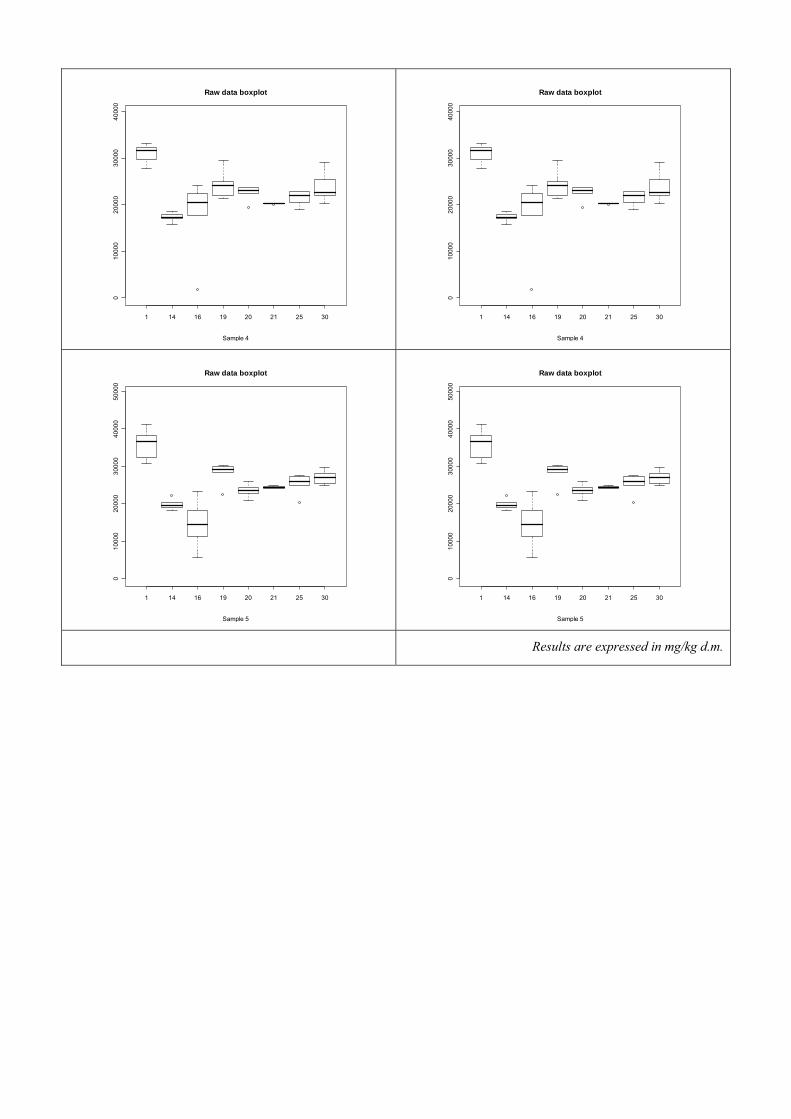
1 14 16 19 20 21 25 30
010
000
2000
030
000
4000
0
Raw data boxplot
Sample 4 1 14 16 19 20 21 25 30
010
000
2000
030
000
4000
0
Raw data boxplot
Sample 4
1 14 16 19 20 21 25 30
010
000
2000
030
000
4000
050
000
Raw data boxplot
Sample 5 1 14 16 19 20 21 25 30
010
000
2000
030
000
4000
050
000
Raw data boxplot
Sample 5
Results are expressed in mg/kg d.m.

Table 52: TS 15410 A (aqua regia, HF, boric acid, micro-wave assisted digestion: Calcium) - General Averages. Results are expressed in mg/kg d.m.
Level mj Number of valid results
1 2385 48
2 2870 42
3 67564 48
4 22272 48
5 24836 48
Table 53: TS 15410 A (aqua regia, HF, boric acid, micro-wave assisted digestion: Calcium) - Sums of squares and degrees of freedom for laboratory effects (SSLj, niLj), for bottle effects (SS.Hj, niHj) and for repeatability (SS.rj, nirj)
Level SSLj niLj SSHj niHj SSrj nirj Kj K’j K’’j
1 45452477 7 6445511 8 20818393 32 288 144 24
2 8055680 6 2155786 9 4693195 32 288 144 24
3 4.72E+10 7 5.74E+08 8 6.84E+08 32 288 144 24
4 7.97E+08 7 97672575 8 3.76E+08 32 288 144 24
5 1.64E+09 7 60903760 8 3.17E+08 32 288 144 24
Table 54: TS 15410 A (aqua regia, HF, boric acid, micro-wave assisted digestion: Calcium) - Standard deviations for laboratory effects (sLj), for between-bottle effects (sHj) , for repeatability (srj) and for reproducibility (sRj). Results are expressed in mg/kg d.m.
Level sLj sHj srj r sRj R
1 973.612 227.3866 806.5822 2258.43016 1264.316 3540.0848
2 391.7105 186.6173 382.9652 1072.30256 547.8134 1533.87752
3 33337.29 4100.14 4622.112 12941.9136 33656.19 94237.332
4 4115.79 393.4193 3427.059 9595.7652 5355.788 14996.2064
5 NA NA 3145.137 8806.3836 3145.137 8806.3836

3.5.11 TS 15410 A - EN 13656 (aqua regia, HF, boric acid, micro-wave assisted digestion: Iron)
Submitted raw data prior statistical treatment Retained raw data after statistical treatment
1 4 14 16 19 20 21 25 30
0e+0
01e
+05
2e+0
53e
+05
4e+0
5
Raw data boxplot
Sample 1 1 4 14 16 20 21 25 30
050
000
1000
0015
0000
2000
0025
0000
3000
00
Raw data boxplot
Sample 1
1 4 14 16 19 20 21 25 30
010
000
2000
030
000
4000
050
000
6000
0
Raw data boxplot
Sample 2 1 4 14 16 20 21 25
050
010
0015
0020
0025
00
Raw data boxplot
Sample 2
1 4 14 16 19 20 21 25 30
010
000
2000
030
000
4000
0
Raw data boxplot
Sample 3 1 4 14 16 19 20 21 25
010
000
2000
030
000
4000
0
Raw data boxplot
Sample 3

1 4 14 16 19 20 21 25 30
020
0040
0060
0080
0010
000
Raw data boxplot
Sample 4 1 4 14 16 20 21 25 30
010
0020
0030
0040
0050
0060
00
Raw data boxplot
Sample 4
1 4 14 16 19 20 21 25 30
050
0010
000
1500
020
000
2500
0
Raw data boxplot
Sample 5 1 4 14 19 20 21 25 30
020
0040
0060
0080
0010
000
1200
0
Raw data boxplot
Sample 5
Results are expressed in mg/kg d.m.

Table 55: TS 15410 A (aqua regia, HF, boric acid, micro-wave assisted digestion: Iron) - General Averages. Results are expressed in mg/kg d.m.
Level mj Number of valid results
1 106166 48
2 558 48
3 30761 48
4 2606 48
5 4818 48
Table 56: TS 15410 A (aqua regia, HF, boric acid, micro-wave assisted digestion: Iron) - Sums of squares and degrees of freedom for laboratory effects (SSLj, niLj), for bottle effects (SS.Hj, niHj) and for repeatability (SS.rj, nirj)
Level SSLj niLj SSHj niHj SSrj nirj Kj K’j K’’j
1 9.84E+09 7 7.62E+09 8 7.4E+10 32 288 144 24
2 4882021 7 5419162 8 17483056 32 288 144 24
3 5.07E+08 7 15617730 8 77213147 32 288 144 24
4 3042296 7 3773619 8 12872600 32 288 144 24
5 4697614 7 14053039 8 47213998 32 288 144 24
Table 57: TS 15410 A (aqua regia, HF, boric acid, micro-wave assisted digestion: Iron) - Standard deviations for laboratory effects (sLj), for between-bottle effects (sHj) , for repeatability (srj) and for reproducibility (sRj). Results are expressed in mg/kg d.m.
Level sLj sHj srj r sRj R
1 NA NA 48077 134615.6 48077 134615.6
2 57.8 209 739 2069.2 741 2074.8
3 NA NA 1553 4348.4 1553 4348.4
4 0 152.1333 634 1775.2 634 1775.2
5 0 306.1549 1215 3402 1215 3402
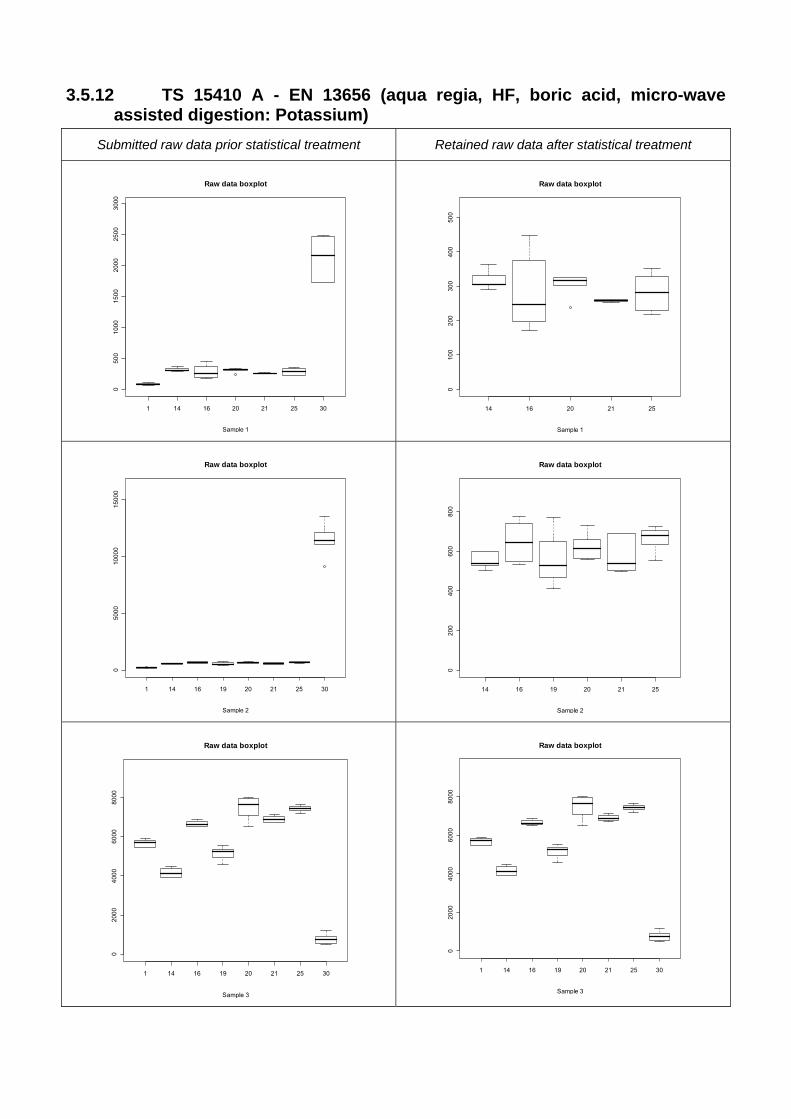
3.5.12 TS 15410 A - EN 13656 (aqua regia, HF, boric acid, micro-wave assisted digestion: Potassium)
Submitted raw data prior statistical treatment Retained raw data after statistical treatment
1 14 16 20 21 25 30
050
010
0015
0020
0025
0030
00
Raw data boxplot
Sample 1 14 16 20 21 25
010
020
030
040
050
0
Raw data boxplot
Sample 1
1 14 16 19 20 21 25 30
050
0010
000
1500
0
Raw data boxplot
Sample 2 14 16 19 20 21 25
020
040
060
080
0
Raw data boxplot
Sample 2
1 14 16 19 20 21 25 30
020
0040
0060
0080
00
Raw data boxplot
Sample 3
1 14 16 19 20 21 25 30
020
0040
0060
0080
00
Raw data boxplot
Sample 3

1 14 16 19 20 21 25 30
010
0020
0030
00
Raw data boxplot
Sample 4 1 14 16 19 20 21 25 30
010
0020
0030
00
Raw data boxplot
Sample 4
1 14 16 19 20 21 25 30
010
0020
0030
0040
0050
00
Raw data boxplot
Sample 5 1 14 16 19 20 21 25 30
010
0020
0030
0040
0050
00
Raw data boxplot
Sample 5
Results are expressed in mg/kg d.m.

Table 58: TS 15410 A (aqua regia, HF, boric acid, micro-wave assisted digestion: Potassium) - General Averages. Results are expressed in mg/kg d.m.
Level mj Number of valid results
1 520 42
2 1994 45
3 5527 48
4 2367 48
5 3502 48
Table 59: TS 15410 A (aqua regia, HF, boric acid, micro-wave assisted digestion: Potassium) - Sums of squares and degrees of freedom for laboratory effects (SSLj, niLj), for bottle effects (SS.Hj, niHj) and for repeatability (SS.rj, nirj)
Level SSLj niLj SSHj niHj SSrj nirj Kj K’j K’’j
1 18115057 6 131627.4 9 706299.4 26 252 126 21
2 6.15E+08 7 345520.3 8 10354646 29 261 131 22.67
3 2.12E+08 7 764412.3 8 2748212 32 288 144 24
4 11544038 7 229397.2 8 1793305 32 288 144 24
5 27375338 7 669275.2 8 4273014 32 288 144 24
Table 60: TS 15410 A (aqua regia, HF, boric acid, micro-wave assisted digestion: Potassium) - Standard deviations for laboratory effects (sLj), for between-bottle effects (sHj) , for repeatability (srj) and for reproducibility (sRj). Results are expressed in mg/kg d.m.
Level sLj sHj srj r sRj R
1 NA NA 165 462 165 462
2 NA NA 598 1674.4 598 1674.4
3 2241 57 293 820.4 2260 6328
4 NA NA 237 663.6 237 663.6
5 NA NA 365 1022 365 1022

3.5.13 TS 15410 A - EN 13656 (aqua regia, HF, boric acid, micro-wave assisted digestion: Magnesium)
Submitted raw data prior statistical treatment Retained raw data after statistical treatment
1 14 16 19 20 21 25 30
010
020
030
040
050
060
0
Raw data boxplot
Sample 1 1 14 16 19 20 21 25 30
010
020
030
040
050
060
0
Raw data boxplot
Sample 1
1 14 16 19 20 21 25 30
050
0010
000
1500
0
Raw data boxplot
Sample 2 1 14 16 19 20 21 25 30
050
0010
000
1500
0
Raw data boxplot
Sample 2
1 14 16 19 20 21 25 30
020
0040
0060
0080
0010
000
Raw data boxplot
Sample 3 1 14 16 19 20 21 25 30
020
0040
0060
0080
0010
000
Raw data boxplot
Sample 3

1 14 16 19 20 21 25 30
010
0020
0030
0040
00
Raw data boxplot
Sample 4 1 14 16 19 20 21 25 30
010
0020
0030
0040
00
Raw data boxplot
Sample 4
1 14 16 19 20 21 25 30
010
0020
0030
0040
0050
00
Raw data boxplot
Sample 5 1 14 16 19 20 21 25 30
010
0020
0030
0040
0050
00
Raw data boxplot
Sample 5
Results are expressed in mg/kg d.m.
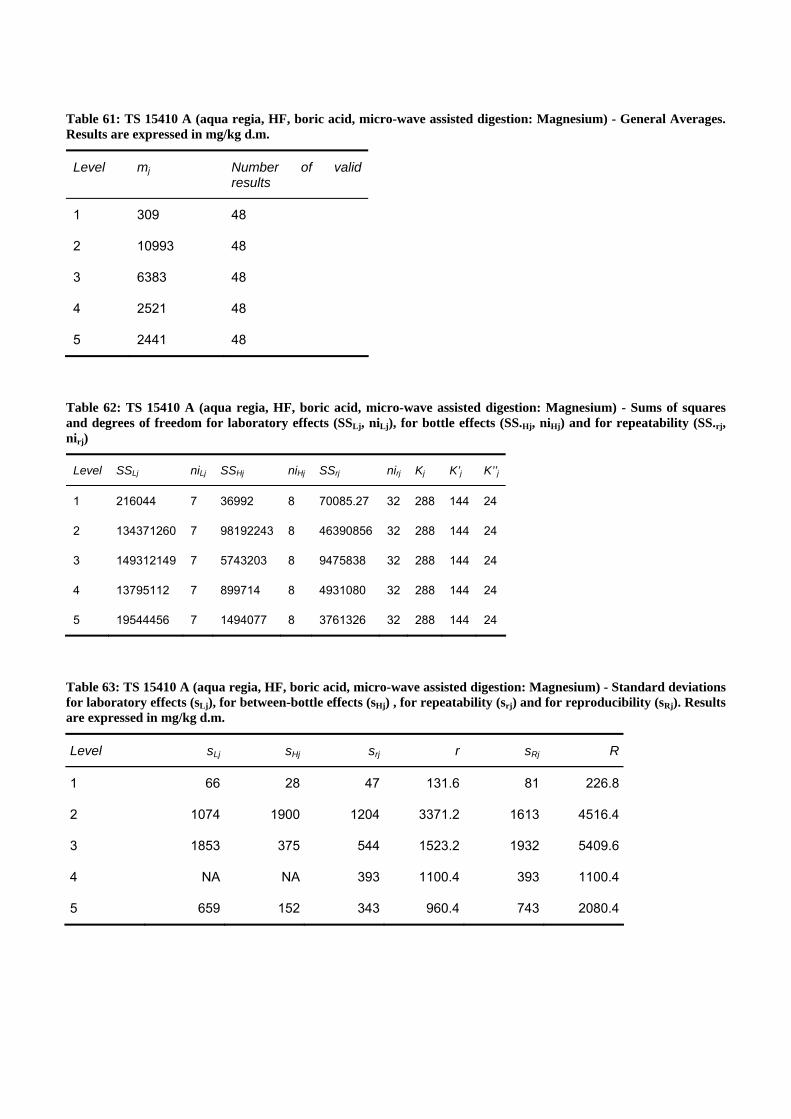
Table 61: TS 15410 A (aqua regia, HF, boric acid, micro-wave assisted digestion: Magnesium) - General Averages. Results are expressed in mg/kg d.m.
Level mj Number of valid results
1 309 48
2 10993 48
3 6383 48
4 2521 48
5 2441 48
Table 62: TS 15410 A (aqua regia, HF, boric acid, micro-wave assisted digestion: Magnesium) - Sums of squares and degrees of freedom for laboratory effects (SSLj, niLj), for bottle effects (SS.Hj, niHj) and for repeatability (SS.rj, nirj)
Level SSLj niLj SSHj niHj SSrj nirj Kj K’j K’’j
1 216044 7 36992 8 70085.27 32 288 144 24
2 134371260 7 98192243 8 46390856 32 288 144 24
3 149312149 7 5743203 8 9475838 32 288 144 24
4 13795112 7 899714 8 4931080 32 288 144 24
5 19544456 7 1494077 8 3761326 32 288 144 24
Table 63: TS 15410 A (aqua regia, HF, boric acid, micro-wave assisted digestion: Magnesium) - Standard deviations for laboratory effects (sLj), for between-bottle effects (sHj) , for repeatability (srj) and for reproducibility (sRj). Results are expressed in mg/kg d.m.
Level sLj sHj srj r sRj R
1 66 28 47 131.6 81 226.8
2 1074 1900 1204 3371.2 1613 4516.4
3 1853 375 544 1523.2 1932 5409.6
4 NA NA 393 1100.4 393 1100.4
5 659 152 343 960.4 743 2080.4

3.5.14 TS 15410 A - EN 13656 (aqua regia, HF, boric acid, micro-wave assisted digestion: Sodium)
Submitted raw data prior statistical treatment Retained raw data after statistical treatment
1 14 16 19 20 21 25 30
020
0040
0060
0080
0010
000
Raw data boxplot
Sample 1 1 14 16 19 20 21 25
020
040
060
080
0
Raw data boxplot
Sample 1
1 14 16 19 20 21 25 30
020
0040
0060
0080
0010
000
Raw data boxplot
Sample 2 1 14 16 19 20 21 25
020
040
060
080
0
Raw data boxplot
Sample 2
1 14 16 19 20 21 25 30
020
0040
0060
0080
00
Raw data boxplot
Sample 3 1 14 16 19 20 21 25 30
020
0040
0060
0080
00
Raw data boxplot
Sample 3

1 14 16 19 20 21 25 30
020
0040
0060
0080
00
Raw data boxplot
Sample 4 1 16 19 20 21 25 30
020
0040
0060
0080
00
Raw data boxplot
Sample 4
1 14 16 19 20 21 25 30
050
0010
000
1500
0
Raw data boxplot
Sample 5 1 16 19 20 21 25 30
050
0010
000
1500
0
Raw data boxplot
Sample 5
Results are expressed in mg/kg d.m.

Table 64: TS 15410 A (aqua regia, HF, boric acid, micro-wave assisted digestion: Sodium) - General Averages. Results are expressed in mg/kg d.m.
Level mj Number of valid results
1 409 42
2 474 42
3 5136 48
4 5165 42
5 10112 42
Table 65: TS 15410 A (aqua regia, HF, boric acid, micro-wave assisted digestion: Sodium) - Sums of squares and degrees of freedom for laboratory effects (SSLj, niLj), for bottle effects (SS.Hj, niHj) and for repeatability (SS.rj, nirj)
Level SSLj niLj SSHj niHj SSrj nirj Kj K’j K’’j
1 574896 6 109490 9 98736.95 26 252 126 21
2 376789 6 112711.9 9 58609.17 26 252 126 21
3 62069135 7 2695133 8 2319611 32 288 144 24
4 7286446 6 567972.3 9 8566132 32 288 144 24
5 48936559 6 30605200 9 70912702 32 288 144 24
Table 66: TS 15410 A (aqua regia, HF, boric acid, micro-wave assisted digestion: Sodium) - Standard deviations for laboratory effects (sLj), for between-bottle effects (sHj) , for repeatability (srj) and for reproducibility (sRj). Results are expressed in mg/kg d.m.
Level sLj sHj srj r sRj R
1 116 60 62 173.6 132 369.6
2 89 66 47 131.6 101 282.8
3 1192 297 269 753.2 1222 3421.6
4 NA NA 517 1447.6 517 1447.6
5 792 666 1489 4169.2 1686 4720.8

3.5.15 TS 15410 A - EN 13656 (aqua regia, HF, boric acid, micro-wave assisted digestion: Phosphorus)
Submitted raw data prior statistical treatment Retained raw data after statistical treatment
1 14 16 20 30
020
040
060
080
0
Raw data boxplot
Sample 1 1 14 16 20 30
020
040
060
080
0
Raw data boxplot
Sample 1
1 14 16 20 25 30
010
000
2000
030
000
4000
050
000
Raw data boxplot
Sample 2 1 14 16 20 25
050
100
150
200
Raw data boxplot
Sample 2
1 14 16 20 21 25 30
010
0020
0030
0040
0050
0060
0070
00
Raw data boxplot
Sample 3 1 14 16 20 21 25 30
010
0020
0030
0040
0050
0060
0070
00
Raw data boxplot
Sample 3

1 14 16 20 21 25 30
010
0020
0030
0040
0050
0060
0070
00
Raw data boxplot
Sample 4 1 14 16 20 21 25
020
040
060
080
010
00
Raw data boxplot
Sample 4
1 14 16 20 21 25 30
050
0010
000
1500
0
Raw data boxplot
Sample 5 1 14 16 20 21 25
050
010
0015
0020
00
Raw data boxplot
Sample 5
Results are expressed in mg/kg d.m.

Table 67: TS 15410 A (aqua regia, HF, boric acid, micro-wave assisted digestion: Phosphorus) - General Averages. Results are expressed in mg/kg d.m.
Level mj Number of valid results
1 209 30
2 86 30
3 3701 42
4 618 36
5 991 36
Table 68: TS 15410 A (aqua regia, HF, boric acid, micro-wave assisted digestion: Phosphorus) - Sums of squares and degrees of freedom for laboratory effects (SSLj, niLj), for bottle effects (SS.Hj, niHj) and for repeatability (SS.rj, nirj)
Level SSLj niLj SSHj niHj SSrj nirj Kj K’j K’’j
1 736712.3 4 16453.71 9 61286.92 16 180 90 15
2 57526.19 4 6910.412 9 5150.9 16 180 90 15
3 1.04E+08 6 456651 7 1656682 28 252 126 21
4 652398.3 5 58576.75 8 252815.3 28 252 126 21
5 1656797 5 89536.74 8 667330.6 28 252 126 21
Table 69: TS 15410 A (aqua regia, HF, boric acid, micro-wave assisted digestion: Phosphorus) - Standard deviations for laboratory effects (sLj), for between-bottle effects (sHj) , for repeatability (srj) and for reproducibility (sRj). Results are expressed in mg/kg d.m.
Level sLj sHj srj r sRj R
1 NA NA 61.9 173.32 61.9 173.32
2 47 16.4 17.9 50.12 50.3 140.84
3 1699 45 243.2 680.96 1716.3 4805.64
4 NA NA 95 266 95 266
5 NA NA 154.4 432.32 154.4 432.32

3.5.16 TS 15410 A - EN 13656 (aqua regia, HF, boric acid, micro-wave assisted digestion: Silicon)
Submitted raw data prior statistical treatment Retained raw data after statistical treatment
1 16 19 20 21 25 30
050
000
1000
0015
0000
Raw data boxplot
Sample 1 1 16 19 20 21 25
050
0010
000
1500
020
000
2500
030
000
Raw data boxplot
Sample 1
1 16 19 20 21 25 30
050
000
1000
0015
0000
2000
00
Raw data boxplot
Sample 2 1 16 19 20 21 25
010
0020
0030
0040
00
Raw data boxplot
Sample 2
1 16 19 20 21 25 30
020
000
4000
060
000
8000
010
0000
1200
00
Raw data boxplot
Sample 3 1 16 19 20 21 25 30
020
000
4000
060
000
8000
010
0000
1200
00
Raw data boxplot
Sample 3
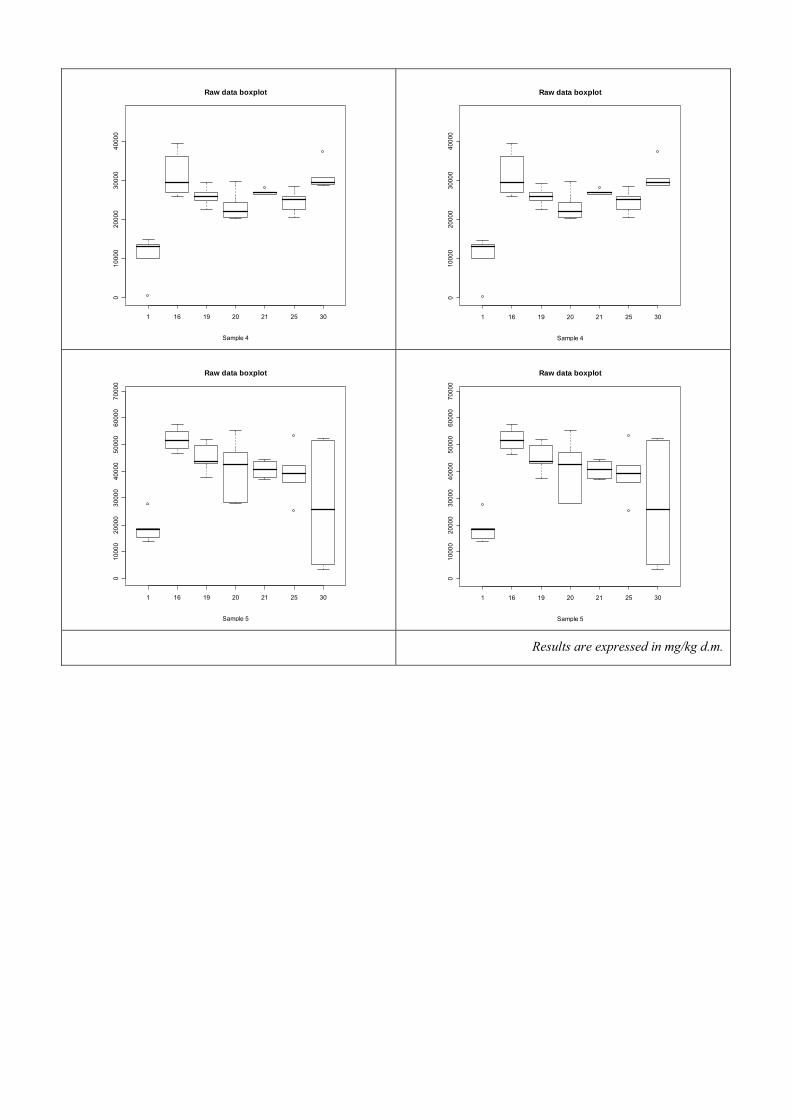
1 16 19 20 21 25 30
010
000
2000
030
000
4000
0
Raw data boxplot
Sample 4 1 16 19 20 21 25 30
010
000
2000
030
000
4000
0
Raw data boxplot
Sample 4
1 16 19 20 21 25 30
010
000
2000
030
000
4000
050
000
6000
070
000
Raw data boxplot
Sample 5 1 16 19 20 21 25 30
010
000
2000
030
000
4000
050
000
6000
070
000
Raw data boxplot
Sample 5
Results are expressed in mg/kg d.m.

Table 70: TS 15410 A (aqua regia, HF, boric acid, micro-wave assisted digestion: Silicon) - General Averages. Results are expressed in mg/kg d.m.
Level mj Number of valid results
1 16266 35
2 1650 35
3 73228 42
4 24713 42
5 37587 42
Table 71: TS 15410 A (aqua regia, HF, boric acid, micro-wave assisted digestion: Silicon) - Sums of squares and degrees of freedom for laboratory effects (SSLj, niLj), for bottle effects (SS.Hj, niHj) and for repeatability (SS.rj, nirj)
Level SSLj niLj SSHj niHj SSrj nirj Kj K’j K’’j
1 9.04E+08 5 64186202 8 71004151 21 205 103 17.6
2 13218821 5 11475002 8 2343616 21 205 103 17.6
3 1.92E+10 6 5.4E+08 7 1E+09 28 252 126 21
4 1.67E+09 6 34938121 7 4.37E+08 28 252 126 21
5 4.44E+09 6 3.48E+09 7 1.09E+09 28 252 126 21
Table 72: TS 15410 A (aqua regia, HF, boric acid, micro-wave assisted digestion: Silicon) - Standard deviations for laboratory effects (sLj), for between-bottle effects (sHj) , for repeatability (srj) and for reproducibility (sRj). Results are expressed in mg/kg d.m.
Level sLj sHj srj r sRj R
1 5420 1461 1839 5149.2 5723 16024.4
2 359 780 334 935.2 490 1372
3 22811 3714 5979 16741.2 23582 66029.6
4 NA NA 3952 11065.6 3952 11065.6
5 6362 12351 6236 17460.8 8909 24945.2
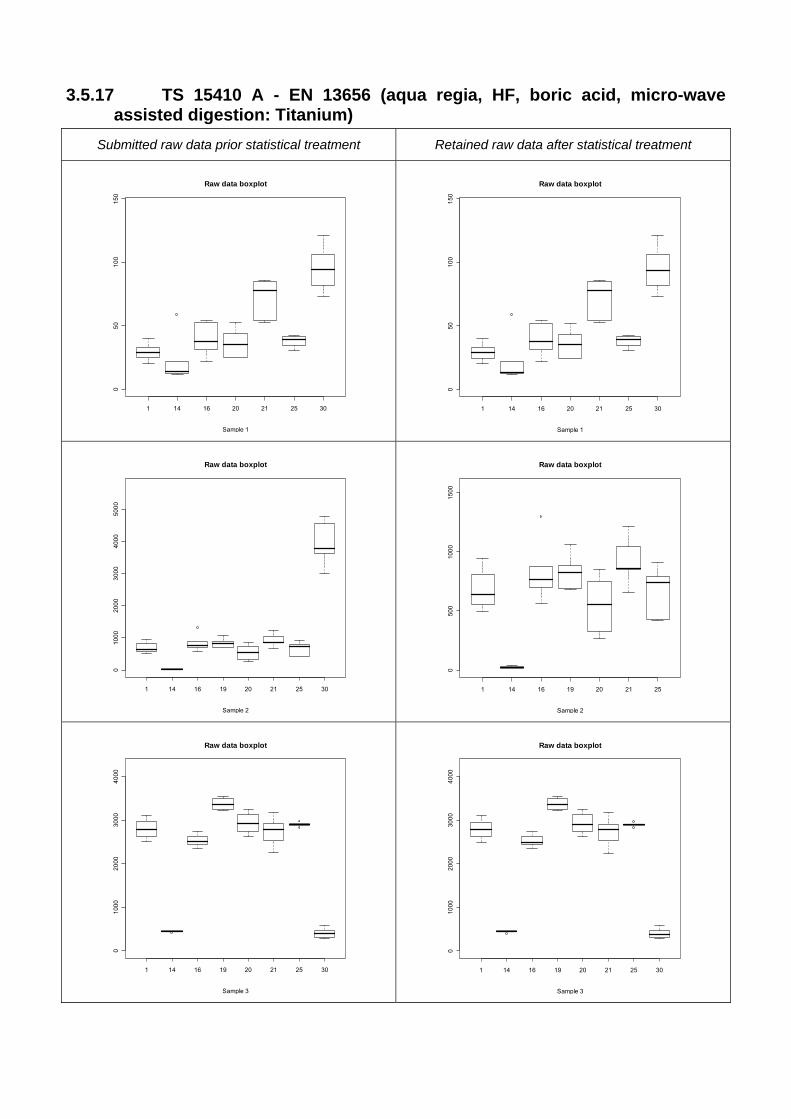
3.5.17 TS 15410 A - EN 13656 (aqua regia, HF, boric acid, micro-wave assisted digestion: Titanium)
Submitted raw data prior statistical treatment Retained raw data after statistical treatment
1 14 16 20 21 25 30
050
100
150
Raw data boxplot
Sample 1 1 14 16 20 21 25 30
050
100
150
Raw data boxplot
Sample 1
1 14 16 19 20 21 25 30
010
0020
0030
0040
0050
00
Raw data boxplot
Sample 2 1 14 16 19 20 21 25
050
010
0015
00
Raw data boxplot
Sample 2
1 14 16 19 20 21 25 30
010
0020
0030
0040
00
Raw data boxplot
Sample 3 1 14 16 19 20 21 25 30
010
0020
0030
0040
00
Raw data boxplot
Sample 3

1 14 16 19 20 21 25 30
050
010
0015
0020
00
Raw data boxplot
Sample 4 1 16 19 20 21 25 30
050
010
0015
0020
00
Raw data boxplot
Sample 4
1 14 16 19 20 21 25 30
050
010
0015
00
Raw data boxplot
Sample 5 1 14 16 19 20 21 25 30
050
010
0015
00
Raw data boxplot
Sample 5
Results are expressed in mg/kg d.m.

Table 73: TS 15410 A (aqua regia, HF, boric acid, micro-wave assisted digestion: Silicon: Titanium) - General Averages. Results are expressed in mg/kg d.m.
Level mj Number of valid results
1 47 42
2 643 42
3 2262 48
4 1374 42
5 784 48
Table 74: TS 15410 A (aqua regia, HF, boric acid, micro-wave assisted digestion: Silicon: Titanium) - Sums of squares and degrees of freedom for laboratory effects (SSLj, niLj), for bottle effects (SS.Hj, niHj) and for repeatability (SS.rj, nirj)
Level SSLj niLj SSHj niHj SSrj nirj Kj K’j K’’j
1 24823 6 2122.4 9 4001.5 26 252 126 21
2 3216120 6 733678.7 9 506631.2 26 252 126 21
3 56590761 7 610586 8 706873.9 32 288 144 24
4 546347.3 6 207794.1 9 3167053 32 288 144 24
5 4448069 7 155929 8 564772.7 32 288 144 24
Table 75: TS 15410 A (aqua regia, HF, boric acid, micro-wave assisted digestion: Silicon: Titanium) - Standard deviations for laboratory effects (sLj), for between-bottle effects (sHj) , for repeatability (srj) and for reproducibility (sRj). Results are expressed in mg/kg d.m.
Level sLj sHj srj r sRj R
1 25 6 12 33.6 28 78.4
2 270 163 140 392 304 851.2
3 1155 134 149 417.2 1165 3262
4 NA NA 315 882 315 882
5 320 25 133 372.4 347 971.6

3.5.18 TS 15410 B (Ashing (ASTM D6722 and XRF): Aluminium) Submitted raw data prior statistical treatment Retained raw data after statistical treatment
10 13 23
050
010
0015
0020
00
Raw data boxplot
Sample 1
10 13 23
050
010
0015
0020
00
Raw data boxplot
Sample 1
10 13 23
010
020
030
040
050
060
0
Raw data boxplot
Sample 2
10 13 23
010
020
030
040
050
060
0Raw data boxplot
Sample 2
10 13 16 23
010
000
2000
030
000
4000
050
000
Raw data boxplot
Sample 3
10 13 16 23
010
000
2000
030
000
4000
050
000
Raw data boxplot
Sample 3

10 13 16 23
010
0020
0030
0040
0050
0060
00
Raw data boxplot
Sample 4
10 13 16 23
010
0020
0030
0040
0050
0060
00
Raw data boxplot
Sample 4
10 13 16 23
020
0040
0060
0080
00
Raw data boxplot
Sample 5
10 13 16 23
020
0040
0060
0080
00
Raw data boxplot
Sample 5
N.B. Data set to small for meaningful outlier testing
Results are expressed in mg/kg d.m.

Table 76: TS 15410 B (Ashing (ASTM D6722 and XRF): Aluminium) - General Averages. Results are expressed in mg/kg d.m.
Level mj Number of valid results
1 626 15
2 204 14
3 19132 24
4 1936 24
5 3446 24
Table 77: TS 15410 B (Ashing (ASTM D6722 and XRF): Aluminium) - Sums of squares and degrees of freedom for laboratory effects (SSLj, niLj), for bottle effects (SS.Hj, niHj) and for repeatability (SS.rj, nirj) .
Level SSLj niLj SSHj niHj SSrj nirj Kj K’j K’’j
1 8796090 2 136504.2 4 13346.67 8 81 45 9
2 743687.6 2 14018.65 5 717.34 6 76 38 7
3 8.85E+09 3 5783100 4 4697960 16 144 72 12
4 96100231 3 353016.4 4 151487.1 16 144 72 12
5 2.83E+08 3 486802.9 4 1012914 16 144 72 12
Table 78: TS 15410 B (Ashing (ASTM D6722 and XRF): Aluminium) - Standard deviations for laboratory effects (sLj), for between-bottle effects (sHj) , for repeatability (srj) and for reproducibility (sRj). Results are expressed in mg/kg d.m.
Level sLj sHj srj r sRj R
1 950 147 41 114.8 951 2662.8
2 293 44 11 30.8 293 820.4
3 22165 620 542 1517.6 22172 62081.6
4 2307 162 97 271.6 2309 6465.2
5 3964 140 252 705.6 3972 11121.6

3.5.19 TS 15410 B (Ashing (ASTM D6722 + XRF): Calcium) Submitted raw data prior statistical treatment Retained raw data after statistical treatment
10 13 16 23
020
0040
0060
0080
0010
000
Raw data boxplot
Sample 1
10 13 16 23
020
0040
0060
0080
0010
000
Raw data boxplot
Sample 1
10 13 16 23
050
010
0015
0020
0025
0030
0035
00
Raw data boxplot
Sample 2
10 13 16 23
050
010
0015
0020
0025
0030
0035
00Raw data boxplot
Sample 2
10 13 16 23
020
000
4000
060
000
8000
010
0000
1200
00
Raw data boxplot
Sample 3
10 13 16 23
020
000
4000
060
000
8000
010
0000
1200
00
Raw data boxplot
Sample 3

10 13 16 23
010
000
2000
030
000
4000
0
Raw data boxplot
Sample 4
10 13 16 23
010
000
2000
030
000
4000
0
Raw data boxplot
Sample 4
10 13 16 23
010
000
2000
030
000
4000
0
Raw data boxplot
Sample 5
10 13 16 23
010
000
2000
030
000
4000
0
Raw data boxplot
Sample 5
N.B. Data set to small for meaningful outlier testing
Results are expressed in mg/kg d.m.

Table 79: TS 15410 B (Ashing (ASTM D6722 + XRF): Calcium) - General Averages. Results are expressed in mg/kg d.m.
Level mj Number of valid results
1 4545 21
2 1423 16
3 45368 24
4 15076 24
5 17113 24
Table 80: TS 15410 B (Ashing (ASTM D6722 + XRF): Calcium) - Sums of squares and degrees of freedom for laboratory effects (SSLj, niLj), for bottle effects (SS.Hj, niHj) and for repeatability (SS.rj, nirj)
Level SSLj niLj SSHj niHj SSrj nirj Kj K’j K’’j
1 3.35E+08 3 3462440 3 2090907 14 117 63 12
2 31929229 3 76276.17 4 23466.67 8 80 40 8
3 5.03E+10 3 5364729 4 3144986 16 144 72 12
4 5.47E+09 3 13426993 4 2183622 16 144 72 12
5 7.02E+09 3 5189427 4 1558624 16 144 72 12
Table 81: TS 15410 B (Ashing (ASTM D6722 + XRF): Calcium) - Standard deviations for laboratory effects (sLj), for between-bottle effects (sHj) , for repeatability (srj) and for reproducibility (sRj). Results are expressed in mg/kg d.m.
Level sLj sHj srj r sRj R
1 4636 579 386 1080.8 4652 13025.6
2 1702 90 54 151.2 1703 4768.4
3 52843 618 443 1240.4 52845 147966
4 17423 1036 369 1033.2 17427 48795.6
5 19749 632 312 873.6 19752 55305.6

3.5.20 TS 15410 B (Ashing (ASTM D6722 + XRF): Iron) Submitted raw data prior statistical treatment Retained raw data after statistical treatment
10 13 16 23
010
000
2000
030
000
4000
050
000
6000
070
000
Raw data boxplot
Sample 1
10 13 16 23
010
000
2000
030
000
4000
050
000
6000
070
000
Raw data boxplot
Sample 1
10 13 16 23
010
020
030
040
050
060
0
Raw data boxplot
Sample 2
10 13 16 23
010
020
030
040
050
060
0Raw data boxplot
Sample 2
10 13 16 23
010
000
2000
030
000
4000
050
000
Raw data boxplot
Sample 3
10 13 16 23
010
000
2000
030
000
4000
050
000
Raw data boxplot
Sample 3

10 13 16 23
010
0020
0030
0040
0050
00
Raw data boxplot
Sample 4
10 13 16 23
010
0020
0030
0040
0050
00
Raw data boxplot
Sample 4
10 13 16 23
020
0040
0060
0080
0010
000
Raw data boxplot
Sample 5
10 13 16 23
020
0040
0060
0080
0010
000
Raw data boxplot
Sample 5
N.B. Data set to small for meaningful outlier testing
Results are expressed in mg/kg d.m.

Table 82: TS 15410 B (Ashing (ASTM D6722 + XRF): Iron) - General Averages. Results are expressed in mg/kg d.m.
Level mj Number of valid results
1 20374 21
2 211 16
3 16710 24
4 1331 24
5 2758 24
Table 83: TS 15410 B (Ashing (ASTM D6722 + XRF): Iron) - Sums of squares and degrees of freedom for laboratory effects (SSLj, niLj), for bottle effects (SS.Hj, niHj) and for repeatability (SS.rj, nirj)
Level SSLj niLj SSHj niHj SSrj nirj Kj K’j K’’j
1 1.14E+10 3 20181416 3 28256558 14 117 63 12
2 882034.1 3 2354.466 4 946.6667 8 80 40 8
3 7.62E+09 3 149636.8 4 400846.3 16 144 72 12
4 58777057 3 37489.99 4 56330.38 16 144 72 12
5 2.51E+08 3 393623.5 4 144416.2 16 144 72 12
Table 84: TS 15410 B (Ashing (ASTM D6722 + XRF): Iron) - Standard deviations for laboratory effects (sLj), for between-bottle effects (sHj) , for repeatability (srj) and for reproducibility (sRj). Results are expressed in mg/kg d.m.
Level sLj sHj srj r sRj R
1 27207 1253 1421 3978.8 27245 76286
2 283 15 11 30.8 283 792.4
3 20569 64 158 442.4 20570 57596
4 1807 44 59 165.2 1808 5062.4
5 3735 173 95 266 3736 10460.8
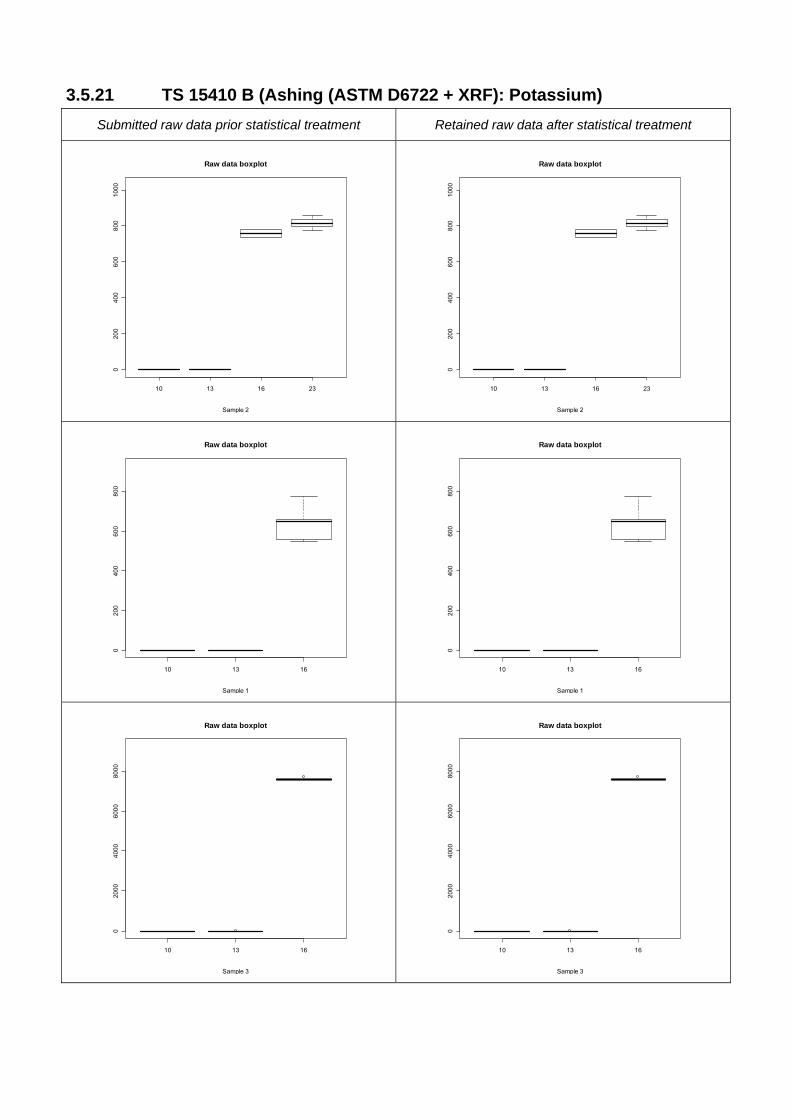
3.5.21 TS 15410 B (Ashing (ASTM D6722 + XRF): Potassium) Submitted raw data prior statistical treatment Retained raw data after statistical treatment
10 13 16 23
020
040
060
080
010
00
Raw data boxplot
Sample 2
10 13 16 23
020
040
060
080
010
00
Raw data boxplot
Sample 2
10 13 16
020
040
060
080
0
Raw data boxplot
Sample 1
10 13 16
020
040
060
080
0Raw data boxplot
Sample 1
10 13 16
020
0040
0060
0080
00
Raw data boxplot
Sample 3
10 13 16
020
0040
0060
0080
00
Raw data boxplot
Sample 3
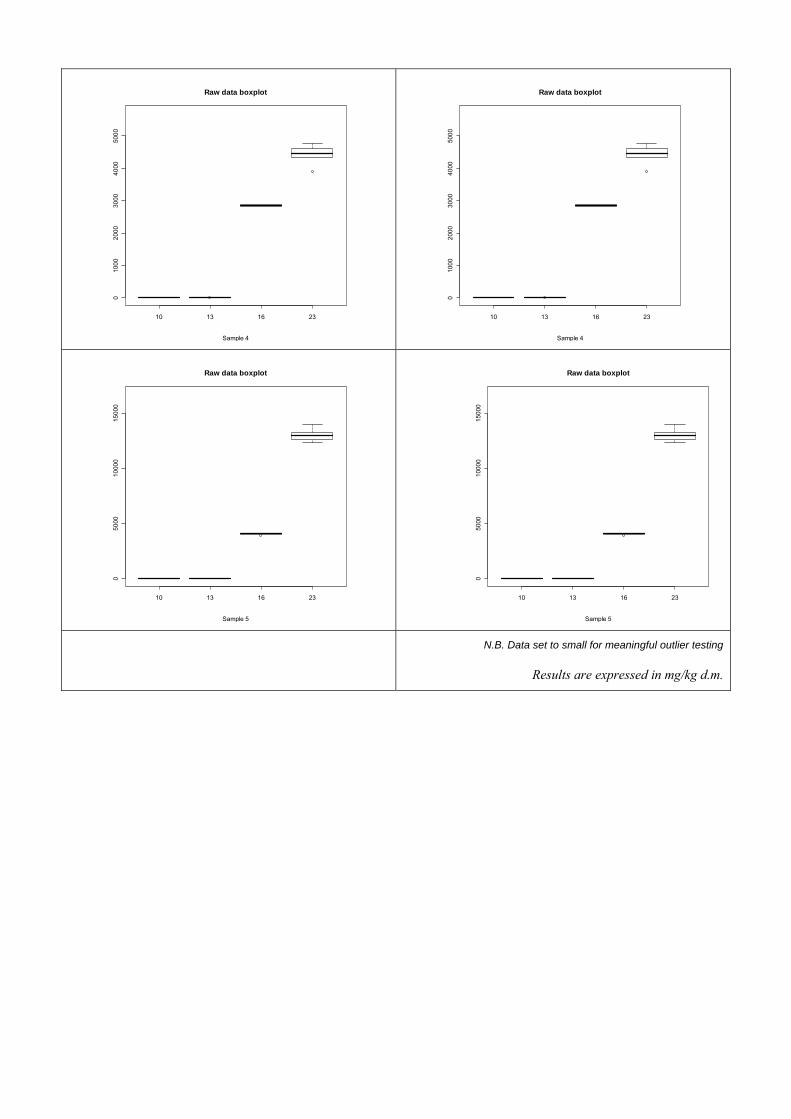
10 13 16 23
010
0020
0030
0040
0050
00
Raw data boxplot
Sample 4
10 13 16 23
010
0020
0030
0040
0050
00
Raw data boxplot
Sample 4
10 13 16 23
050
0010
000
1500
0
Raw data boxplot
Sample 5
10 13 16 23
050
0010
000
1500
0
Raw data boxplot
Sample 5
N.B. Data set to small for meaningful outlier testing
Results are expressed in mg/kg d.m.

Table 85: TS 15410 B (Ashing (ASTM D6722 + XRF): Potassium) - General Averages. Results are expressed in mg/kg d.m.
Level mj Number of valid results
1 256 15
2 401 16
3 2529 18
4 1821 24
5 4268 24
Table 86: TS 15410 B (Ashing (ASTM D6722 + XRF): Potassium) - Sums of squares and degrees of freedom for laboratory effects (SSLj, niLj), for bottle effects (SS.Hj, niHj) and for repeatability (SS.rj, nirj)
Level SSLj niLj SSHj niHj SSrj nirj Kj K’j K’’j
1 1470699 2 777.7281 4 32451.67 8 81 45 9
2 2556425 3 3827.169 4 1371.333 8 80 40 8
3 2.3E+08 2 6209.876 5 12045.26 16 144 72 12
4 86748539 3 44711.45 4 391122.7 16 144 72 12
5 6.78E+08 3 1170795 4 472707.3 16 144 72 12
Table 87: TS 15410 B (Ashing (ASTM D6722 + XRF): Potassium) - Standard deviations for laboratory effects (sLj), for between-bottle effects (sHj) , for repeatability (srj) and for reproducibility (sRj). Results are expressed in mg/kg d.m.
Level sLj sHj srj r sRj R
1 NA NA 64 179.2 64 179.2
2 482 20 13 36.4 482 1349.6
3 3574 14 27 75.6 3574 10007.2
4 NA NA 156 436.8 156 436.8
5 6135 296 172 481.6 6137 17183.6
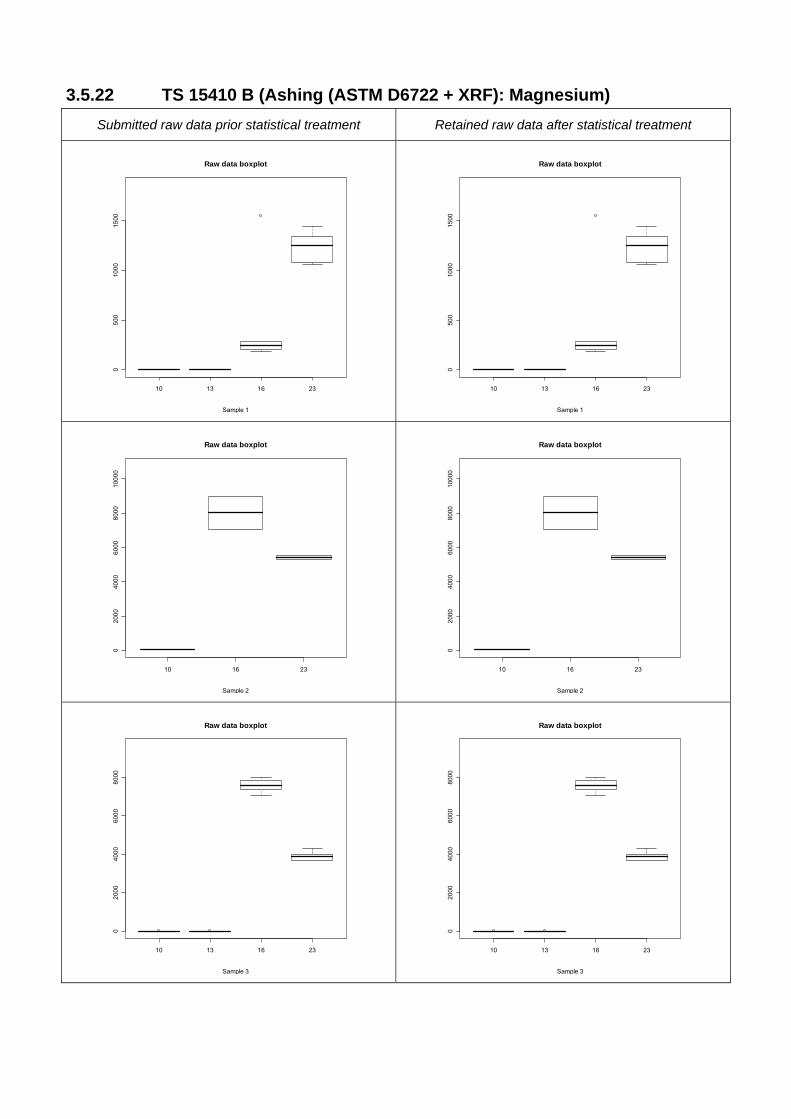
3.5.22 TS 15410 B (Ashing (ASTM D6722 + XRF): Magnesium) Submitted raw data prior statistical treatment Retained raw data after statistical treatment
10 13 16 23
050
010
0015
00
Raw data boxplot
Sample 1
10 13 16 23
050
010
0015
00
Raw data boxplot
Sample 1
10 16 23
020
0040
0060
0080
0010
000
Raw data boxplot
Sample 2
10 16 23
020
0040
0060
0080
0010
000
Raw data boxplot
Sample 2
10 13 16 23
020
0040
0060
0080
00
Raw data boxplot
Sample 3
10 13 16 23
020
0040
0060
0080
00
Raw data boxplot
Sample 3

10 13 16 23
050
0010
000
1500
0
Raw data boxplot
Sample 4
10 13 16 23
050
0010
000
1500
0
Raw data boxplot
Sample 4
10 13 16 23
010
0020
0030
0040
00
Raw data boxplot
Sample 5
10 13 16 23
010
0020
0030
0040
00
Raw data boxplot
Sample 5
N.B. Data set to small for meaningful outlier testing
Results are expressed in mg/kg d.m.
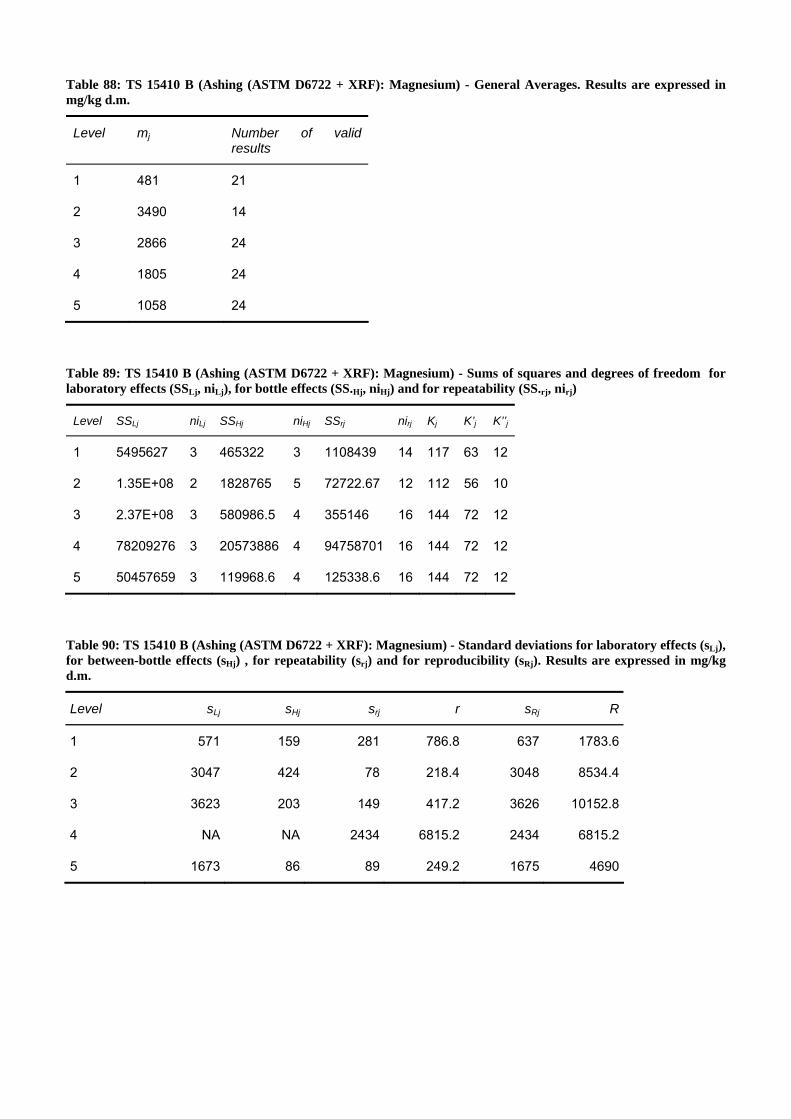
Table 88: TS 15410 B (Ashing (ASTM D6722 + XRF): Magnesium) - General Averages. Results are expressed in mg/kg d.m.
Level mj Number of valid results
1 481 21
2 3490 14
3 2866 24
4 1805 24
5 1058 24
Table 89: TS 15410 B (Ashing (ASTM D6722 + XRF): Magnesium) - Sums of squares and degrees of freedom for laboratory effects (SSLj, niLj), for bottle effects (SS.Hj, niHj) and for repeatability (SS.rj, nirj)
Level SSLj niLj SSHj niHj SSrj nirj Kj K’j K’’j
1 5495627 3 465322 3 1108439 14 117 63 12
2 1.35E+08 2 1828765 5 72722.67 12 112 56 10
3 2.37E+08 3 580986.5 4 355146 16 144 72 12
4 78209276 3 20573886 4 94758701 16 144 72 12
5 50457659 3 119968.6 4 125338.6 16 144 72 12
Table 90: TS 15410 B (Ashing (ASTM D6722 + XRF): Magnesium) - Standard deviations for laboratory effects (sLj), for between-bottle effects (sHj) , for repeatability (srj) and for reproducibility (sRj). Results are expressed in mg/kg d.m.
Level sLj sHj srj r sRj R
1 571 159 281 786.8 637 1783.6
2 3047 424 78 218.4 3048 8534.4
3 3623 203 149 417.2 3626 10152.8
4 NA NA 2434 6815.2 2434 6815.2
5 1673 86 89 249.2 1675 4690

3.5.23 TS 15410 B (Ashing (ASTM D6722 + XRF): Phosphorus) Submitted raw data prior statistical treatment Retained raw data after statistical treatment
10 13 16 23
010
020
030
040
0
Raw data boxplot
Sample 1
10 13 16 23
010
020
030
040
0
Raw data boxplot
Sample 1
10 13 16 23
050
100
150
Raw data boxplot
Sample 2
10 13 16 23
050
100
150
Raw data boxplot
Sample 2
10 13 16 23
010
0020
0030
0040
0050
0060
00
Raw data boxplot
Sample 3
10 13 16 23
010
0020
0030
0040
0050
0060
00
Raw data boxplot
Sample 3

10 13 16 23
020
040
060
080
010
0012
00
Raw data boxplot
Sample 4
10 13 16 23
020
040
060
080
010
0012
00
Raw data boxplot
Sample 4
10 13 16 23
050
010
0015
0020
00
Raw data boxplot
Sample 5
10 13 16 23
050
010
0015
0020
00
Raw data boxplot
Sample 5
N.B. Data set to small for meaningful outlier testing
Results are expressed in mg/kg d.m.

Table 91: TS 15410 B (Ashing (ASTM D6722 + XRF): Phosphorus) - General Averages. Results are expressed in mg/kg d.m.
Level mj Number of valid results
1 158 21
2 59 16
3 2426 24
4 415 24
5 845 24
Table 92: TS 15410 B (Ashing (ASTM D6722 + XRF): Phosphorus) - Sums of squares and degrees of freedom for laboratory effects (SSLj, niLj), for bottle effects (SS.Hj, niHj) and for repeatability (SS.rj, nirj)
Level SSLj niLj SSHj niHj SSrj nirj Kj K’j K’’j
1 397113.3 3 6340.519 3 2186 14 117 63 12
2 57815.82 3 105.1123 4 366.6668 8 80 40 8
3 1.44E+08 3 130162.9 4 126096.5 16 144 72 12
4 4361560 3 996.9596 4 5000.794 16 144 72 12
5 17705345 3 26201.76 4 17180.34 16 144 72 12
Table 93: TS 15410 B (Ashing (ASTM D6722 + XRF): Phosphorus) - Standard deviations for laboratory effects (sLj), for between-bottle effects (sHj) , for repeatability (srj) and for reproducibility (sRj). Results are expressed in mg/kg d.m.
Level sLj sHj srj r sRj R
1 159 26 12 33.6 160 448
2 NA NA 7 19.6 7 19.6
3 2827 91 89 249.2 2829 7921.2
4 NA NA 18 50.4 18 50.4
5 991 43 33 92.4 992 2777.6

3.5.24 TS 15410 B(Ashing (ASTM D6722 + XRF): Silicon) Submitted raw data prior statistical treatment Retained raw data after statistical treatment
10 13 16 23
010
000
2000
030
000
4000
050
000
6000
070
000
Raw data boxplot
Sample 1
10 13 16 23
010
000
2000
030
000
4000
050
000
6000
070
000
Raw data boxplot
Sample 1
10 13 16 23
050
010
0015
0020
0025
0030
0035
00
Raw data boxplot
Sample 2
10 13 16 23
050
010
0015
0020
0025
0030
0035
00Raw data boxplot
Sample 2
10 13 16 23
020
000
4000
060
000
8000
010
0000
1200
00
Raw data boxplot
Sample 3
10 13 16 23
020
000
4000
060
000
8000
010
0000
1200
00
Raw data boxplot
Sample 3

10 13 16 23
050
0010
000
1500
020
000
2500
030
000
Raw data boxplot
Sample 4
10 13 16 23
050
0010
000
1500
020
000
2500
030
000
Raw data boxplot
Sample 4
10 13 16 23
010
000
2000
030
000
4000
050
000
Raw data boxplot
Sample 5
10 13 16 23
010
000
2000
030
000
4000
050
000
Raw data boxplot
Sample 5
N.B. Data set to small for meaningful outlier testing
Results are expressed in mg/kg d.m.

Table 94: TS 15410 B (Ashing (ASTM D6722 + XRF): Silicon) - General Averages. Results are expressed in mg/kg d.m.
Level mj Number of valid results
1 26016 21
2 1286 16
3 39553 24
4 10062 24
5 13913 24
Table 95: TS 15410 B(Ashing (ASTM D6722 + XRF): Silicon) - Sums of squares and degrees of freedom for laboratory effects (SSLj, niLj), for bottle effects (SS.Hj, niHj) and for repeatability (SS.rj, nirj)
Level SSLj niLj SSHj niHj SSrj nirj Kj K’j K’’j
1 1.21E+10 3 1.02E+08 3 5039613 14 117 63 12
2 25786807 3 158245.1 4 2309.35 8 80 40 8
3 4.06E+10 3 12819199 4 7737947 16 144 72 12
4 2.83E+09 3 1803870 4 595262 16 144 72 12
5 5.94E+09 3 19132774 4 2464531 16 144 72 12
Table 96: TS 15410 B(Ashing (ASTM D6722 + XRF): Silicon) - Standard deviations for laboratory effects (sLj), for between-bottle effects (sHj) , for repeatability (srj) and for reproducibility (sRj). Results are expressed in mg/kg d.m.
Level sLj sHj srj r sRj R
1 27829 3341 600 1680 27835 77938
2 1528 140 17 47.6 1528 4278.4
3 47494 952 695 1946 47499 132997.2
4 12540 371 193 540.4 12542 35117.6
5 18148 1242 392 1097.6 18152 50825.6

3.5.25 TS 15410 B (Ashing (ASTM D6722 + XRF): Titanium) Submitted raw data prior statistical treatment Retained raw data after statistical treatment
10 13 16 23
050
100
150
200
250
300
Raw data boxplot
Sample 1
10 13 16 23
050
100
150
200
250
300
Raw data boxplot
Sample 1
10 13 16 23
020
040
060
080
010
00
Raw data boxplot
Sample 2
10 13 16 23
020
040
060
080
010
00Raw data boxplot
Sample 2
10 13 16 23
050
010
0015
0020
0025
00
Raw data boxplot
Sample 3
10 13 16 23
050
010
0015
0020
0025
00
Raw data boxplot
Sample 3

10 13 16 23
050
010
0015
00
Raw data boxplot
Sample 4
10 13 16 23
050
010
0015
00
Raw data boxplot
Sample 4
10 13 16 23
020
040
060
080
010
0012
00
Raw data boxplot
Sample 5
10 13 16 23
020
040
060
080
010
0012
00
Raw data boxplot
Sample 5
N.B. Data set to small for meaningful outlier testing
Results are expressed in mg/kg d.m.

Table 97: TS 15410 B (Ashing (ASTM D6722 + XRF): Titanium) - General Averages. Results are expressed in mg/kg d.m.
Level mj Number of valid results
1 84 21
2 318 16
3 868 24
4 527 24
5 382 24
Table 98: TS 15410 B (Ashing (ASTM D6722 + XRF): Titanium) - Sums of squares and degrees of freedom for laboratory effects (SSLj, niLj), for bottle effects (SS.Hj, niHj) and for repeatability (SS.rj, nirj)
Level SSLj niLj SSHj niHj SSrj nirj Kj K’j K’’j
1 123021.8 3 3631 3 5514 14 117 63 12
2 1702340 3 108227 4 593 8 80 40 8
3 20556086 3 856 4 10782 16 144 72 12
4 8175078 3 10768 4 2098 16 144 72 12
5 3973179 3 17064 4 2196 16 144 72 12
Table 99: TS 15410 B (Ashing (ASTM D6722 + XRF): Titanium) - Standard deviations for laboratory effects (sLj), for between-bottle effects (sHj) , for repeatability (srj) and for reproducibility (sRj). Results are expressed in mg/kg d.m.
Level sLj sHj srj r sRj R
1 88 16 20 56 90 252
2 385 116 9 25.2 385 1078
3 0 NA 26 72.8 26 72.8
4 674 29 11 30.8 674 1887.2
5 469 37 12 33.6 469 1313.2

3.5.26 TS 15411 (Mercury by automatic analyzer) Submitted raw data prior statistical treatment Retained raw data after statistical treatment
15 16 22 25
0.00
0.01
0.02
0.03
0.04
0.05
0.06
0.07
Raw data boxplot
Sample 1
15 16 22 25
0.00
0.01
0.02
0.03
0.04
0.05
0.06
0.07
Raw data boxplot
Sample 1
15 16 22 25
0.00
0.01
0.02
0.03
0.04
Raw data boxplot
Sample 2
15 16 22 25
0.00
0.01
0.02
0.03
0.04
Raw data boxplot
Sample 2
15 16 22 25
0.0
0.5
1.0
1.5
Raw data boxplot
Sample 3
15 16 22 25
0.0
0.5
1.0
1.5
Raw data boxplot
Sample 3

15 16 22 25
0.0
0.1
0.2
0.3
0.4
0.5
0.6
Raw data boxplot
Sample 4
15 16 22 25
0.0
0.1
0.2
0.3
0.4
0.5
0.6
Raw data boxplot
Sample 4
15 16 22 25
0.0
0.2
0.4
0.6
0.8
1.0
Raw data boxplot
Sample 5
15 16 22 25
0.0
0.2
0.4
0.6
0.8
1.0
Raw data boxplot
Sample 5
N.B. Data set to small for meaningful outlier testing
Results are expressed in mg/kg d.m.

Table 100: TS 15411 (Mercury by automatic analyzer) - General Averages. Results are expressed in mg/kg d.m.
Level mj Number of valid results
1 0.02 48
2 0.01 48
3 1.00 48
4 0.28 48
5 0.62 48
Table 101: TS 15411 (Mercury by automatic analyzer) - Sums of squares and degrees of freedom for laboratory effects (SSLj, niLj), for bottle effects (SS.Hj, niHj) and for repeatability (SS.rj, nirj)
Level SSLj niLj SSHj niHj SSrj nirj Kj K’j K’’j
1 0.002 3 0.0004 4 0.004 40 576 288 24
2 0.001 3 0.0002 4 0.001 40 576 288 24
3 0.595 3 0.0381 4 0.246 40 576 288 24
4 0.018 3 0.0337 4 0.126 40 576 288 24
5 0.277 3 0.0691 4 0.303 40 576 288 24
Table 102: TS 15411 (Mercury by automatic analyzer) - Standard deviations for laboratory effects (sLj), for between-bottle effects (sHj) , for repeatability (srj) and for reproducibility (sRj). Results are expressed in mg/kg d.m.
Level sLj sHj srj r sRj R
1 NA NA 0.01 0.028 0.01 0.028
2 0.004 0.003 0.004 0.0112 0.006 0.0168
3 0.125 0.024 0.078 0.2184 0.148 0.4144
4 0 0.03 0.056 0.1568 0.056 0.1568
5 0.079 0.04 0.087 0.2436 0.118 0.3304

y = 0.1488x + 0.0096R2 = 0.973
0.000
0.020
0.040
0.060
0.080
0.100
0.120
0.140
0.160
0.180
0.00 0.20 0.40 0.60 0.80 1.00 1.20
Figure 24: TS 15411 (Mercury by automatic analyzer) - Concentration dependence (in mg/kg d.m.) of reproducibility.

3.5.27 TS 15411 A - EN 13656 (aqua regia, HF, boric acid and micro-wave assisted digestion: Arsenic)
Submitted raw data prior statistical treatment Retained raw data after statistical treatment
1 14 16 19 20
05
1015
2025
Raw data boxplot
Sample 1 1 14 16 19 20
05
1015
2025
Raw data boxplot
Sample 1
1 4 5 14 16 19 20 21 25
010
2030
4050
Raw data boxplot
Sample 2 1 4 5 14 16 19 20 21 25
010
2030
4050
Raw data boxplot
Sample 2
1 5 14 16 19 20 25 30
010
2030
40
Raw data boxplot
Sample 3 1 14 16 19 20 25 30
05
1015
Raw data boxplot
Sample 3

1 14 16 19 20 25 30
02
46
810
Raw data boxplot
Sample 4 1 14 16 19 20 25 30
02
46
810
Raw data boxplot
Sample 4
1 14 16 19 25
05
1015
Raw data boxplot
Sample 5 1 14 16 19 25
05
1015
Raw data boxplot
Sample 5
Results are expressed in mg/kg d.m.

Table 103: TS 15411 A (aqua regia, HF, boric acid and micro-wave assisted digestion: Arsenic) - General Averages. Results are expressed in mg/kg d.m.
Level mj Number of valid results
1 4.3 28
2 22.6 54
3 8.6 42
4 2.4 32
5 2.5 25
Table 104: TS 15411 A (aqua regia, HF, boric acid and micro-wave assisted digestion: Arsenic) - Sums of squares and degrees of freedom for laboratory effects (SSLj, niLj), for bottle effects (SS.Hj, niHj) and for repeatability (SS.rj, nirj)
Level SSLj niLj SSHj niHj SSrj nirj Kj K’j K’’j
1 125.6 4 85.4 13 286.7 10 158 80 14.2
2 1449.6 8 556.6 9 482.8 36 324 162 27
3 541.1 6 49.2 11 103.7 36 324 162 27
4 14.3 6 7.0 11 60.4 26 232 118 22.467
5 28.7 4 29.5 13 85.3 29 255 129 23.867
Table 105: TS 15411 A (aqua regia, HF, boric acid and micro-wave assisted digestion: Arsenic) - Standard deviations for laboratory effects (sLj), for between-bottle effects (sHj) , for repeatability (srj) and for reproducibility (sRj). Results are expressed in mg/kg d.m.
Level sLj sHj srj r sRj R
1 0 NA 5.4 15.12 5.4 15.12
2 4.5 4 3.7 10.36 5.8 16.24
3 3.3 0.8 1.7 4.76 3.7 10.36
4 0 NA 1.5 4.2 1.5 4.2
5 0 NA 1.7 4.76 1.7 4.76

3.5.28 TS 15411 A - EN 13656 (aqua regia, HF, boric acid and micro-wave assisted digestion: Barium)
Submitted raw data prior statistical treatment Retained raw data after statistical treatment
1 4 5 14 16 19 20 21 25 30
010
2030
40
Raw data boxplot
Sample 1 1 4 5 14 16 19 20 21 25
05
1015
20
Raw data boxplot
Sample 1
1 4 5 14 16 19 20 21 25 30
050
010
0015
0020
0025
0030
0035
00
Raw data boxplot
Sample 2 1 5 14 16 19 20 21 25
010
020
030
040
0
Raw data boxplot
Sample 2
1 4 5 14 16 19 20 21 25 30
050
010
0015
0020
0025
00
Raw data boxplot
Sample 3 1 4 5 14 16 19 20 21 25 30
050
010
0015
0020
0025
00
Raw data boxplot
Sample 3

Submitted raw data prior statistical treatment Retained raw data after statistical treatment
1 4 5 14 16 19 20 21 25 30
020
040
060
080
0
Raw data boxplot
Sample 4 1 4 5 14 16 19 20 21 25 30
020
040
060
080
0
Raw data boxplot
Sample 4
1 4 5 14 16 19 20 21 25 30
020
040
060
0
Raw data boxplot
Sample 5 1 4 5 14 16 19 20 21 25 30
020
040
060
0
Raw data boxplot
Sample 5
Results are expressed in mg/kg d.m.
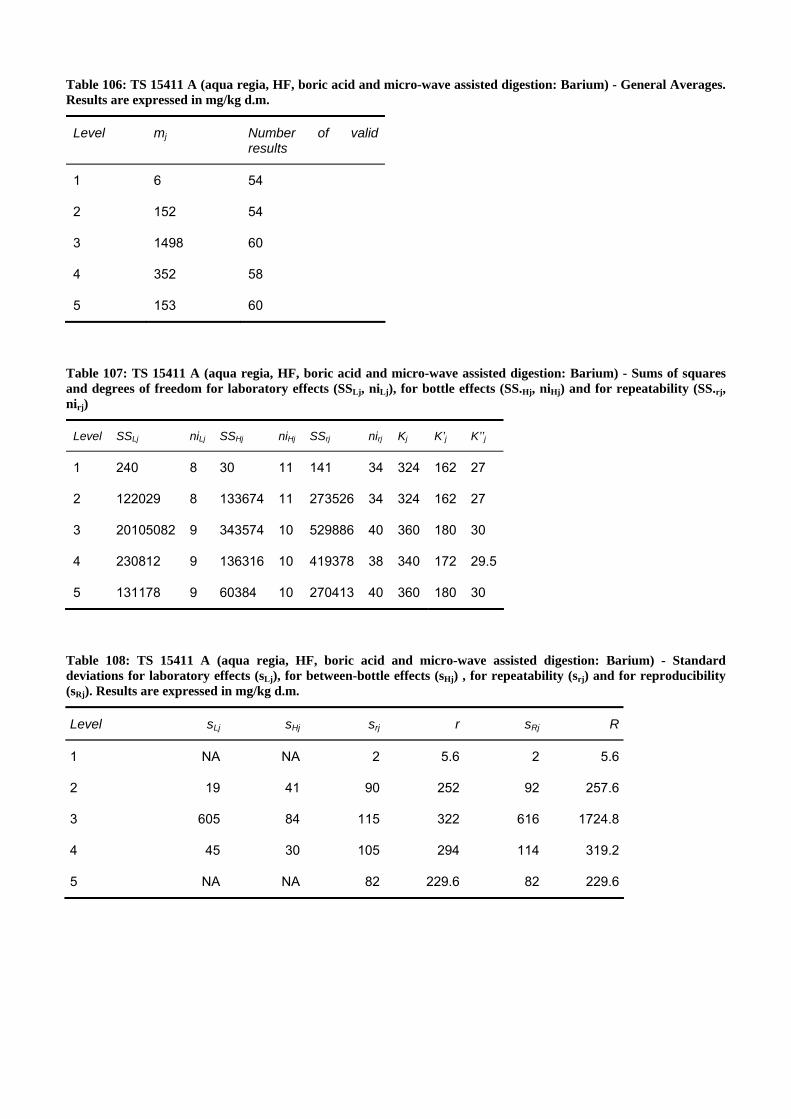
Table 106: TS 15411 A (aqua regia, HF, boric acid and micro-wave assisted digestion: Barium) - General Averages. Results are expressed in mg/kg d.m.
Level mj Number of valid results
1 6 54
2 152 54
3 1498 60
4 352 58
5 153 60
Table 107: TS 15411 A (aqua regia, HF, boric acid and micro-wave assisted digestion: Barium) - Sums of squares and degrees of freedom for laboratory effects (SSLj, niLj), for bottle effects (SS.Hj, niHj) and for repeatability (SS.rj, nirj)
Level SSLj niLj SSHj niHj SSrj nirj Kj K’j K’’j
1 240 8 30 11 141 34 324 162 27
2 122029 8 133674 11 273526 34 324 162 27
3 20105082 9 343574 10 529886 40 360 180 30
4 230812 9 136316 10 419378 38 340 172 29.5
5 131178 9 60384 10 270413 40 360 180 30
Table 108: TS 15411 A (aqua regia, HF, boric acid and micro-wave assisted digestion: Barium) - Standard deviations for laboratory effects (sLj), for between-bottle effects (sHj) , for repeatability (srj) and for reproducibility (sRj). Results are expressed in mg/kg d.m.
Level sLj sHj srj r sRj R
1 NA NA 2 5.6 2 5.6
2 19 41 90 252 92 257.6
3 605 84 115 322 616 1724.8
4 45 30 105 294 114 319.2
5 NA NA 82 229.6 82 229.6
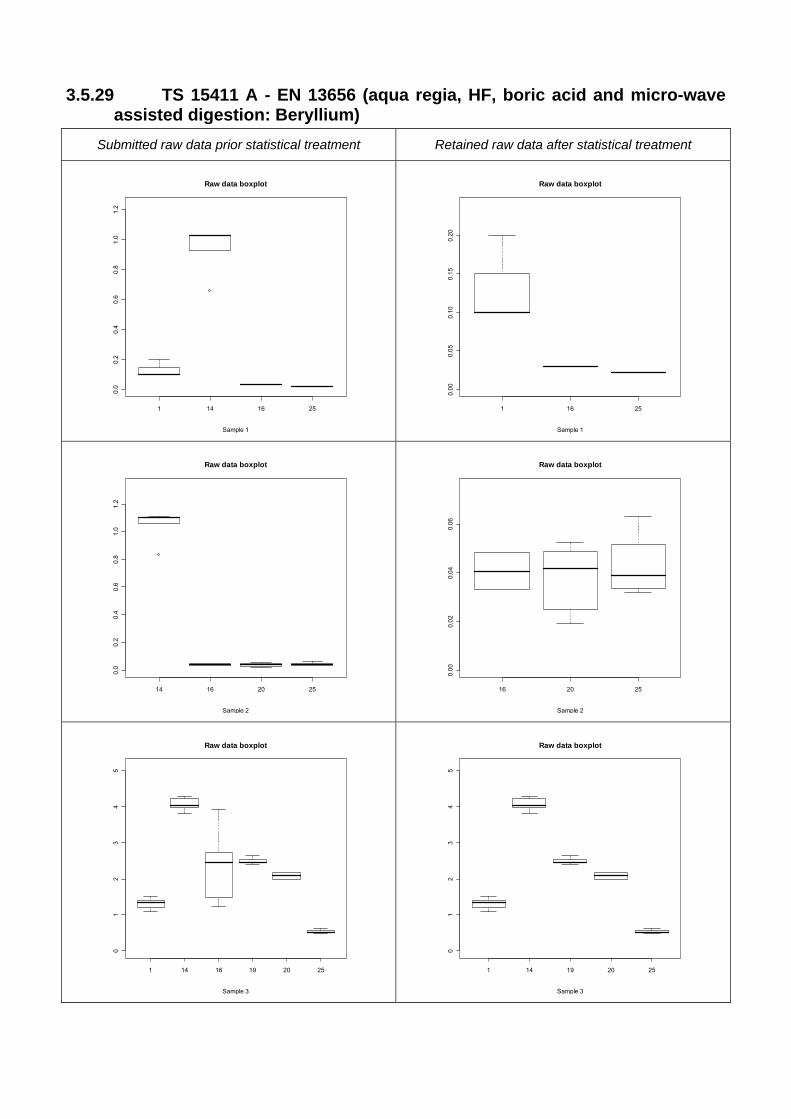
3.5.29 TS 15411 A - EN 13656 (aqua regia, HF, boric acid and micro-wave assisted digestion: Beryllium)
Submitted raw data prior statistical treatment Retained raw data after statistical treatment
1 14 16 25
0.0
0.2
0.4
0.6
0.8
1.0
1.2
Raw data boxplot
Sample 1 1 16 25
0.00
0.05
0.10
0.15
0.20
Raw data boxplot
Sample 1
14 16 20 25
0.0
0.2
0.4
0.6
0.8
1.0
1.2
Raw data boxplot
Sample 2 16 20 25
0.00
0.02
0.04
0.06
Raw data boxplot
Sample 2
1 14 16 19 20 25
01
23
45
Raw data boxplot
Sample 3 1 14 19 20 25
01
23
45
Raw data boxplot
Sample 3

1 14 16 20 25
0.0
0.2
0.4
0.6
0.8
1.0
1.2
Raw data boxplot
Sample 4 1 16 20 25
0.00
0.05
0.10
0.15
0.20
0.25
Raw data boxplot
Sample 4
1 14 16 20 25
0.0
0.5
1.0
1.5
Raw data boxplot
Sample 5 1 20 25
0.00
0.05
0.10
0.15
0.20
0.25
0.30
0.35
Raw data boxplot
Sample 5
Results are expressed in mg/kg d.m.

Table 109: TS 15411 A (aqua regia, HF, boric acid and micro-wave assisted digestion: Beryllium) - General Averages. Results are expressed in mg/kg d.m.
Level mj Number of valid results
1 0.56 11
2 0.34 20
3 2.14 36
4 0.36 24
5 0.38 29
Table 110: TS 15411 A (aqua regia, HF, boric acid and micro-wave assisted digestion: Beryllium) - Sums of squares and degrees of freedom for laboratory effects (SSLj, niLj), for bottle effects (SS.Hj, niHj) and for repeatability (SS.rj, nirj)
Level SSLj niLj SSHj niHj SSrj nirj Kj K’j K’’j
1 2.0 3 0.0365 5 0.08 2 47 29 8
2 4.3 3 0.0153 7 0.04 21 184 94 17
3 42.7 5 0.2175 6 4.79 24 216 108 18
4 3.8 4 0.0007 6 0.01 19 170 86 15.6
5 3.4 4 0.5897 7 0.17 23 205 103 17.6
Table 111: TS 15411 A (aqua regia, HF, boric acid and micro-wave assisted digestion: Beryllium) - Standard deviations for laboratory effects (sLj), for between-bottle effects (sHj) , for repeatability (srj) and for reproducibility (sRj). Results are expressed in mg/kg d.m.
Level sLj sHj srj r sRj R
1 NA NA 0.197 0.5516 0.197 0.5516
2 0.404 0.007 0.045 0.126 0.406 1.1368
3 NA NA 0.447 1.2516 0.447 1.2516
4 NA NA 0.024 0.0672 0.024 0.0672
5 0.316 0.176 0.087 0.2436 0.327 0.9156
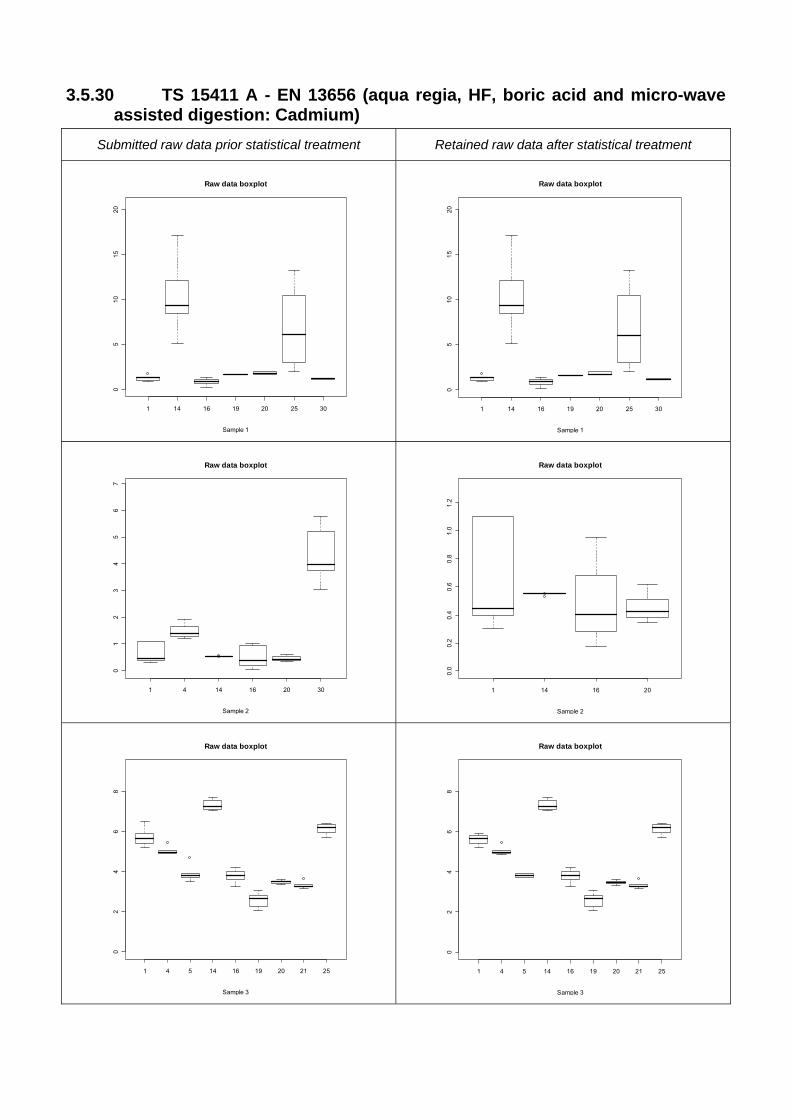
3.5.30 TS 15411 A - EN 13656 (aqua regia, HF, boric acid and micro-wave assisted digestion: Cadmium)
Submitted raw data prior statistical treatment Retained raw data after statistical treatment
1 14 16 19 20 25 30
05
1015
20
Raw data boxplot
Sample 1 1 14 16 19 20 25 30
05
1015
20
Raw data boxplot
Sample 1
1 4 14 16 20 30
01
23
45
67
Raw data boxplot
Sample 2 1 14 16 20
0.0
0.2
0.4
0.6
0.8
1.0
1.2
Raw data boxplot
Sample 2
1 4 5 14 16 19 20 21 25
02
46
8
Raw data boxplot
Sample 3 1 4 5 14 16 19 20 21 25
02
46
8
Raw data boxplot
Sample 3

1 4 5 14 16 19 20 25 30
02
46
8
Raw data boxplot
Sample 4 1 4 5 14 16 19 20 25 30
02
46
8
Raw data boxplot
Sample 4
1 4 5 14 16 19 20 25 30
01
23
45
67
Raw data boxplot
Sample 5 1 4 5 14 16 19 20 25 30
01
23
45
67
Raw data boxplot
Sample 5
Results are expressed in mg/kg d.m.
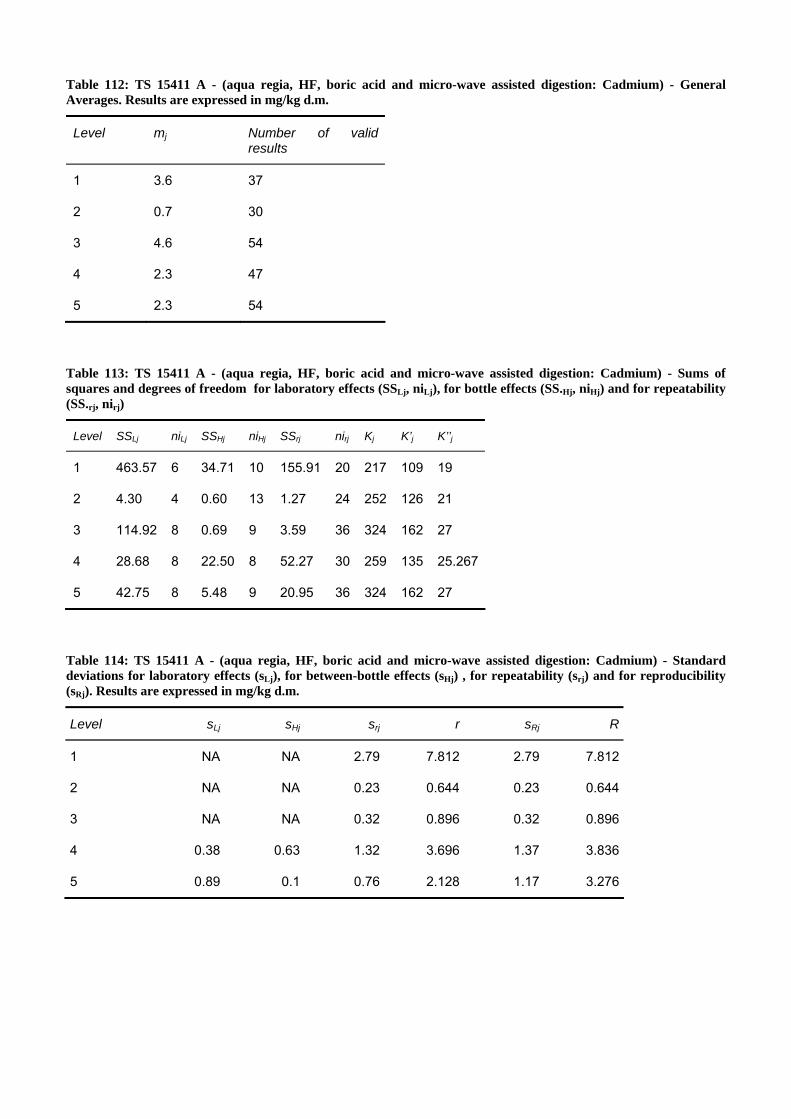
Table 112: TS 15411 A - (aqua regia, HF, boric acid and micro-wave assisted digestion: Cadmium) - General Averages. Results are expressed in mg/kg d.m.
Level mj Number of valid results
1 3.6 37
2 0.7 30
3 4.6 54
4 2.3 47
5 2.3 54
Table 113: TS 15411 A - (aqua regia, HF, boric acid and micro-wave assisted digestion: Cadmium) - Sums of squares and degrees of freedom for laboratory effects (SSLj, niLj), for bottle effects (SS.Hj, niHj) and for repeatability (SS.rj, nirj)
Level SSLj niLj SSHj niHj SSrj nirj Kj K’j K’’j
1 463.57 6 34.71 10 155.91 20 217 109 19
2 4.30 4 0.60 13 1.27 24 252 126 21
3 114.92 8 0.69 9 3.59 36 324 162 27
4 28.68 8 22.50 8 52.27 30 259 135 25.267
5 42.75 8 5.48 9 20.95 36 324 162 27
Table 114: TS 15411 A - (aqua regia, HF, boric acid and micro-wave assisted digestion: Cadmium) - Standard deviations for laboratory effects (sLj), for between-bottle effects (sHj) , for repeatability (srj) and for reproducibility (sRj). Results are expressed in mg/kg d.m.
Level sLj sHj srj r sRj R
1 NA NA 2.79 7.812 2.79 7.812
2 NA NA 0.23 0.644 0.23 0.644
3 NA NA 0.32 0.896 0.32 0.896
4 0.38 0.63 1.32 3.696 1.37 3.836
5 0.89 0.1 0.76 2.128 1.17 3.276
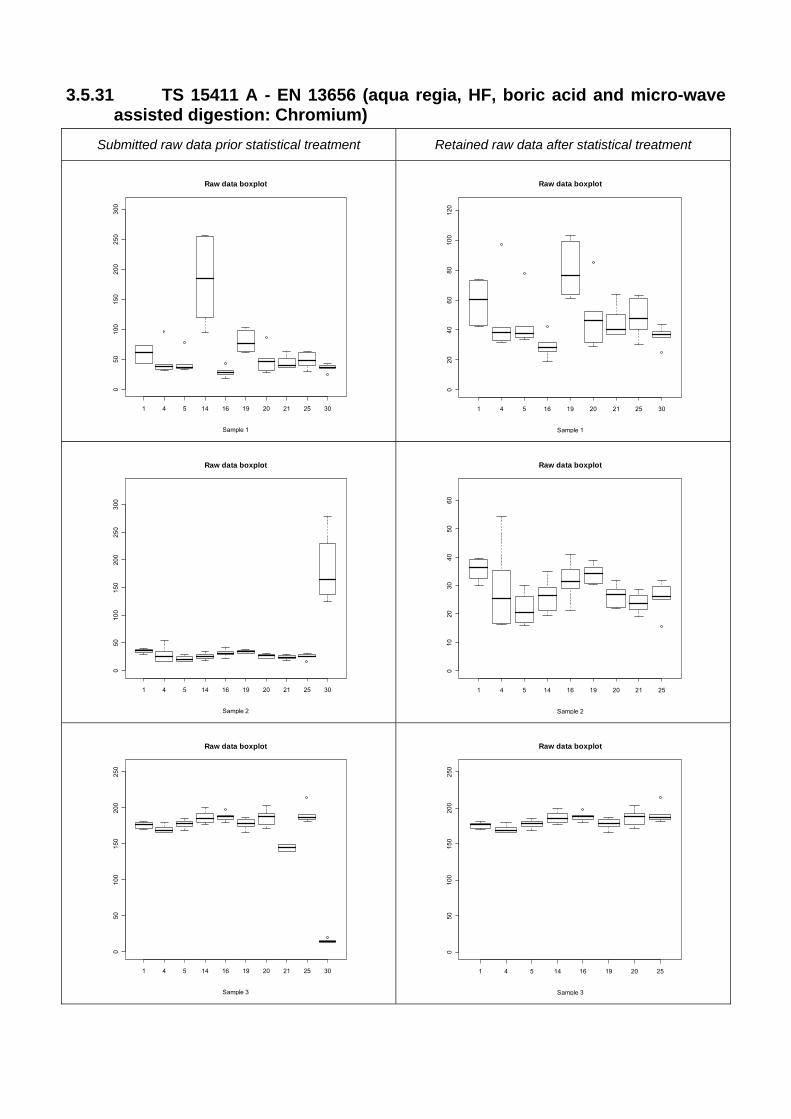
3.5.31 TS 15411 A - EN 13656 (aqua regia, HF, boric acid and micro-wave assisted digestion: Chromium)
Submitted raw data prior statistical treatment Retained raw data after statistical treatment
1 4 5 14 16 19 20 21 25 30
050
100
150
200
250
300
Raw data boxplot
Sample 1 1 4 5 16 19 20 21 25 30
020
4060
8010
012
0
Raw data boxplot
Sample 1
1 4 5 14 16 19 20 21 25 30
050
100
150
200
250
300
Raw data boxplot
Sample 2 1 4 5 14 16 19 20 21 25
010
2030
4050
60
Raw data boxplot
Sample 2
1 4 5 14 16 19 20 21 25 30
050
100
150
200
250
Raw data boxplot
Sample 3 1 4 5 14 16 19 20 25
050
100
150
200
250
Raw data boxplot
Sample 3

1 4 5 14 16 19 20 21 25 30
050
010
0015
00
Raw data boxplot
Sample 4 1 4 5 14 16 20 21 25 30
050
100
150
Raw data boxplot
Sample 4
1 4 5 14 16 19 20 21 25 30
010
0020
0030
0040
0050
00
Raw data boxplot
Sample 5 1 4 14 19 20 21 25 30
050
100
150
200
250
300
Raw data boxplot
Sample 5
Results are expressed in mg/kg d.m.

Table 115: TS 15411 A - EN 13656 (aqua regia, HF, boric acid and micro-wave assisted digestion: Chromium) - General Averages. Results are expressed in mg/kg d.m.
Level mj Number of valid results
1 48 54
2 28 54
3 178 54
4 89 53
5 132 54
Table 116: TS 15411 A - EN 13656 (aqua regia, HF, boric acid and micro-wave assisted digestion: Chromium) - Sums of squares and degrees of freedom for laboratory effects (SSLj, niLj), for bottle effects (SS.Hj, niHj) and for repeatability (SS.rj, nirj)
Level SSLj niLj SSHj niHj SSrj nirj Kj K’j K’’j
1 9957 8 2774 9 8279 36 324 162 27
2 1061 8 1265 9 850 36 324 162 27
3 9469 8 419 9 2218 36 324 162 27
4 3027 8 2687 9 10438 35 313 157 26.6
5 362290 8 409378 9 1564967 36 324 162 27
Table 117: TS 15411 A - EN 13656 (aqua regia, HF, boric acid and micro-wave assisted digestion: Chromium) - Standard deviations for laboratory effects (sLj), for between-bottle effects (sHj) , for repeatability (srj) and for reproducibility (sRj). Results are expressed in mg/kg d.m.
Level sLj sHj srj r sRj R
1 12 5 15 42 20 56
2 NA 6 5 14 5 14
3 NA NA 8 22.4 8 22.4
4 4 0 17 47.6 18 50.4
5 NA 26 208 582.4 208 582.4
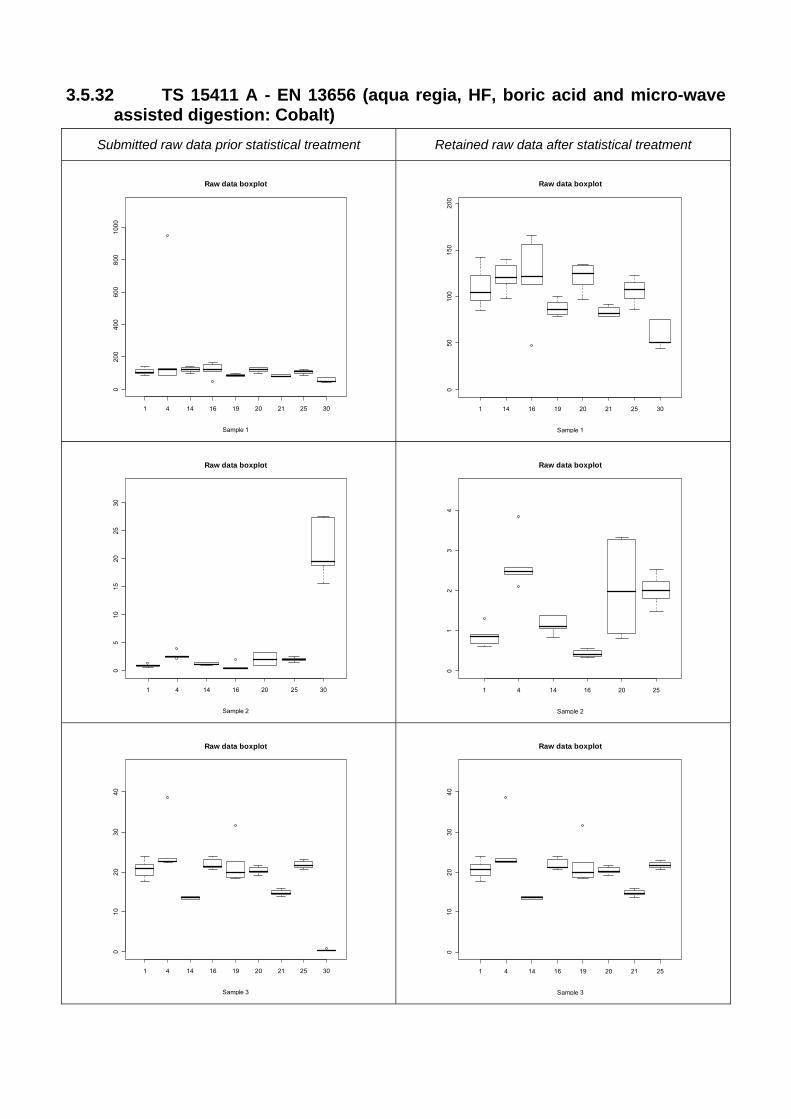
3.5.32 TS 15411 A - EN 13656 (aqua regia, HF, boric acid and micro-wave assisted digestion: Cobalt)
Submitted raw data prior statistical treatment Retained raw data after statistical treatment
1 4 14 16 19 20 21 25 30
020
040
060
080
010
00
Raw data boxplot
Sample 1 1 14 16 19 20 21 25 30
050
100
150
200
Raw data boxplot
Sample 1
1 4 14 16 20 25 30
05
1015
2025
30
Raw data boxplot
Sample 2 1 4 14 16 20 25
01
23
4
Raw data boxplot
Sample 2
1 4 14 16 19 20 21 25 30
010
2030
40
Raw data boxplot
Sample 3 1 4 14 16 19 20 21 25
010
2030
40
Raw data boxplot
Sample 3

1 4 14 16 19 20 21 25 30
02
46
810
1214
Raw data boxplot
Sample 4 1 4 14 16 20 21 25 30
02
46
810
Raw data boxplot
Sample 4
1 4 14 16 20 21 25 30
010
2030
40
Raw data boxplot
Sample 5 1 4 14 16 20 21 25 30
010
2030
40
Raw data boxplot
Sample 5
Results are expressed in mg/kg d.m.

Table 118: TS 15411 A - EN 13656 (aqua regia, HF, boric acid and micro-wave assisted digestion: Cobalt) - General Averages. Results are expressed in mg/kg d.m.
Level mj Number of valid results
1 100.9 48
2 1.5 35
3 20.0 48
4 4.6 42
5 5.1 43
Table 119: TS 15411 A - EN 13656 (aqua regia, HF, boric acid and micro-wave assisted digestion: Cobalt) - Sums of squares and degrees of freedom for laboratory effects (SSLj, niLj), for bottle effects (SS.Hj, niHj) and for repeatability (SS.rj, nirj)
Level SSLj niLj SSHj niHj SSrj nirj Kj K’j K’’j
1 22121 7 2971 8 12256 32 288 144 24
2 18 5 7 10 4 31 277 139 23.6
3 645 7 69 8 310 32 288 144 24
4 62 7 13 7 29 27 242 122 21.6
5 168 7 238 7 640 28 253 127 22
Table 120: TS 15411 A - EN 13656 (aqua regia, HF, boric acid and micro-wave assisted digestion: Cobalt) - Standard deviations for laboratory effects (sLj), for between-bottle effects (sHj) , for repeatability (srj) and for reproducibility (sRj). Results are expressed in mg/kg d.m.
Level sLj sHj srj r sRj R
1 NA NA 19.57 54.796 19.57 54.796
2 0.53 0.51 0.36 1.008 0.64 1.792
3 NA NA 3.11 8.708 3.11 8.708
4 1.16 0.54 1.04 2.912 1.56 4.368
5 0 1.93 4.78 13.384 4.78 13.384

3.5.33 TS 15411 A - EN 13656 (aqua regia, HF, boric acid and micro-wave assisted digestion: Copper)
Submitted raw data prior statistical treatment Retained raw data after statistical treatment
1 4 5 14 16 19 20 21 25 30
020
040
060
0
Raw data boxplot
Sample 1 1 4 5 14 16 19 20 21 25 30
020
040
060
0
Raw data boxplot
Sample 1
1 4 5 14 16 19 20 21 25 30
020
0040
0060
0080
0010
000
Raw data boxplot
Sample 2 1 5 14 16 19 20 21 25
010
020
030
040
0
Raw data boxplot
Sample 2
1 4 5 14 16 19 20 21 25 30
050
100
150
200
250
Raw data boxplot
Sample 3 1 4 5 14 16 19 20 21 25
050
100
150
200
250
Raw data boxplot
Sample 3

1 4 5 14 16 19 20 21 25 30
050
0010
000
1500
0
Raw data boxplot
Sample 4 1 4 5 14 16 19 20 21 25 30
050
0010
000
1500
0
Raw data boxplot
Sample 4
1 4 5 14 16 19 20 21 25 30
020
0040
0060
0080
0010
000
Raw data boxplot
Sample 5 1 4 5 14 16 19 20 21 25 30
020
0040
0060
0080
0010
000
Raw data boxplot
Sample 5
Results are expressed in mg/kg d.m.
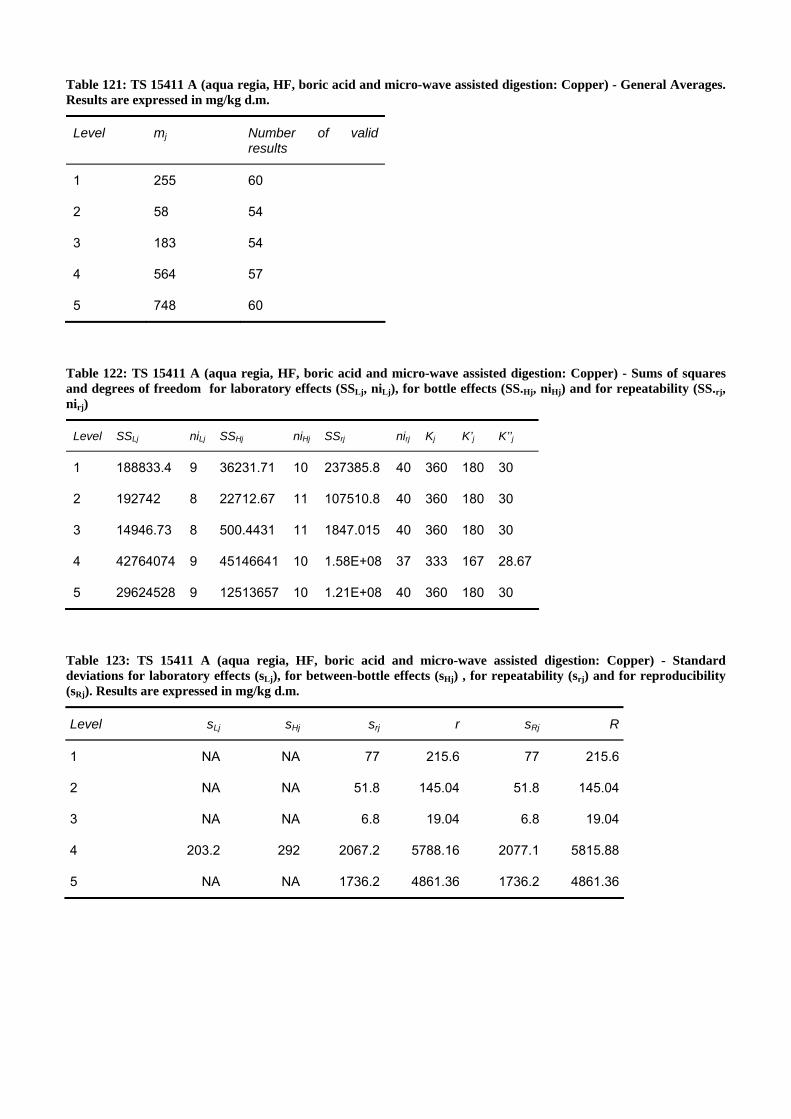
Table 121: TS 15411 A (aqua regia, HF, boric acid and micro-wave assisted digestion: Copper) - General Averages. Results are expressed in mg/kg d.m.
Level mj Number of valid results
1 255 60
2 58 54
3 183 54
4 564 57
5 748 60
Table 122: TS 15411 A (aqua regia, HF, boric acid and micro-wave assisted digestion: Copper) - Sums of squares and degrees of freedom for laboratory effects (SSLj, niLj), for bottle effects (SS.Hj, niHj) and for repeatability (SS.rj, nirj)
Level SSLj niLj SSHj niHj SSrj nirj Kj K’j K’’j
1 188833.4 9 36231.71 10 237385.8 40 360 180 30
2 192742 8 22712.67 11 107510.8 40 360 180 30
3 14946.73 8 500.4431 11 1847.015 40 360 180 30
4 42764074 9 45146641 10 1.58E+08 37 333 167 28.67
5 29624528 9 12513657 10 1.21E+08 40 360 180 30
Table 123: TS 15411 A (aqua regia, HF, boric acid and micro-wave assisted digestion: Copper) - Standard deviations for laboratory effects (sLj), for between-bottle effects (sHj) , for repeatability (srj) and for reproducibility (sRj). Results are expressed in mg/kg d.m.
Level sLj sHj srj r sRj R
1 NA NA 77 215.6 77 215.6
2 NA NA 51.8 145.04 51.8 145.04
3 NA NA 6.8 19.04 6.8 19.04
4 203.2 292 2067.2 5788.16 2077.1 5815.88
5 NA NA 1736.2 4861.36 1736.2 4861.36

3.5.34 TS 15411 A - EN 13656 (aqua regia, HF, boric acid and micro-wave assisted digestion: Mercury)
Submitted raw data prior statistical treatment Retained raw data after statistical treatment
1 5 14
0.0
0.5
1.0
1.5
Raw data boxplot
Sample 1 5 14
0.0
0.2
0.4
0.6
0.8
1.0
Raw data boxplot
Sample 1
1 14 20
0.0
0.1
0.2
0.3
0.4
0.5
Raw data boxplot
Sample 2 1 14
0.00
0.05
0.10
0.15
0.20
0.25
0.30
0.35
Raw data boxplot
Sample 2
1 4 5 14 19 20 21
02
46
810
12
Raw data boxplot
Sample 3 1 4 5 14 19 20 21
02
46
810
12
Raw data boxplot
Sample 3

1 4 5 14 19 20
01
23
4
Raw data boxplot
Sample 4 1 4 5 14 19 20
0.0
0.2
0.4
0.6
0.8
1.0
1.2
1.4
Raw data boxplot
Sample 4
1 4 5 14 19 21
0.0
0.5
1.0
1.5
Raw data boxplot
Sample 5 1 5 14 19 21
0.0
0.2
0.4
0.6
0.8
1.0
1.2
1.4
Raw data boxplot
Sample 5
Results are expressed in mg/kg d.m.
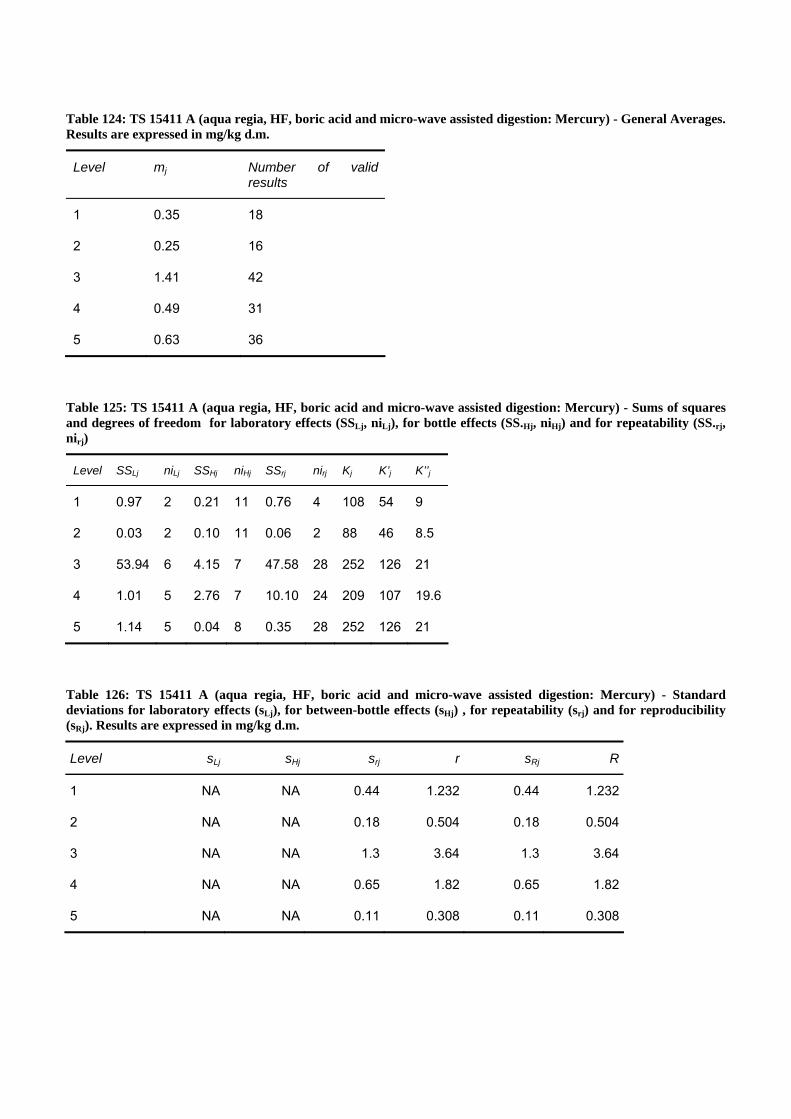
Table 124: TS 15411 A (aqua regia, HF, boric acid and micro-wave assisted digestion: Mercury) - General Averages. Results are expressed in mg/kg d.m.
Level mj Number of valid results
1 0.35 18
2 0.25 16
3 1.41 42
4 0.49 31
5 0.63 36
Table 125: TS 15411 A (aqua regia, HF, boric acid and micro-wave assisted digestion: Mercury) - Sums of squares and degrees of freedom for laboratory effects (SSLj, niLj), for bottle effects (SS.Hj, niHj) and for repeatability (SS.rj, nirj)
Level SSLj niLj SSHj niHj SSrj nirj Kj K’j K’’j
1 0.97 2 0.21 11 0.76 4 108 54 9
2 0.03 2 0.10 11 0.06 2 88 46 8.5
3 53.94 6 4.15 7 47.58 28 252 126 21
4 1.01 5 2.76 7 10.10 24 209 107 19.6
5 1.14 5 0.04 8 0.35 28 252 126 21
Table 126: TS 15411 A (aqua regia, HF, boric acid and micro-wave assisted digestion: Mercury) - Standard deviations for laboratory effects (sLj), for between-bottle effects (sHj) , for repeatability (srj) and for reproducibility (sRj). Results are expressed in mg/kg d.m.
Level sLj sHj srj r sRj R
1 NA NA 0.44 1.232 0.44 1.232
2 NA NA 0.18 0.504 0.18 0.504
3 NA NA 1.3 3.64 1.3 3.64
4 NA NA 0.65 1.82 0.65 1.82
5 NA NA 0.11 0.308 0.11 0.308

3.5.35 TS 15411 A - EN 13656 (aqua regia, HF, boric acid and micro-wave assisted digestion: Manganese)
Submitted raw data prior statistical treatment Retained raw data after statistical treatment
1 4 5 14 16 19 20 21 25 30
050
010
0015
0020
0025
00
Raw data boxplot
Sample 1 1 4 5 14 16 20 21 25 30
050
010
0015
00
Raw data boxplot
Sample 1
1 4 5 14 16 19 20 21 25 30
020
040
060
080
010
0012
00
Raw data boxplot
Sample 2 1 4 5 14 16 19 20 21 25
020
4060
8010
012
0
Raw data boxplot
Sample 2
1 4 5 14 16 19 20 21 25 30
020
040
060
0
Raw data boxplot
Sample 3 1 4 5 14 16 19 20 21 25
020
040
060
0
Raw data boxplot
Sample 3

1 4 5 14 16 19 20 21 25 30
050
100
150
200
250
Raw data boxplot
Sample 4 1 4 5 14 16 19 20 21 25 30
050
100
150
200
250
Raw data boxplot
Sample 4
1 4 5 14 16 19 20 21 25 30
050
010
0015
0020
0025
00
Raw data boxplot
Sample 5 1 4 14 16 19 20 21 25 30
020
040
060
080
0
Raw data boxplot
Sample 5
Results are expressed in mg/kg d.m.

Table 127: TS 15411 A (aqua regia, HF, boric acid and micro-wave assisted digestion: Manganese) - General Averages. Results are expressed in mg/kg d.m.
Level mj Number of valid results
1 560 54
2 73 54
3 529 54
4 152 60
5 195 54
Table 128: TS 15411 A (aqua regia, HF, boric acid and micro-wave assisted digestion: Manganese) - Sums of squares and degrees of freedom for laboratory effects (SSLj, niLj), for bottle effects (SS.Hj, niHj) and for repeatability (SS.rj, nirj)
Level SSLj niLj SSHj niHj SSrj nirj Kj K’j K’’j
1 514356 8 256761 11 2372456 34 324 162 27
2 4777 8 140 11 969 34 324 162 27
3 116404 8 1470 11 11221 34 324 162 27
4 33261 9 3527 10 16887 40 360 180 30
5 166163 8 89343 11 313470 40 360 180 30
Table 129: TS 15411 A (aqua regia, HF, boric acid and micro-wave assisted digestion: Manganese) - Standard deviations for laboratory effects (sLj), for between-bottle effects (sHj) , for repeatability (srj) and for reproducibility (sRj). Results are expressed in mg/kg d.m.
Level sLj sHj srj r sRj R
1 NA NA 264 739.2 264 739.2
2 NA NA 5 14 5 14
3 NA NA 18 50.4 18 50.4
4 NA NA 21 58.8 21 58.8
5 43 10 89 249.2 98 274.4
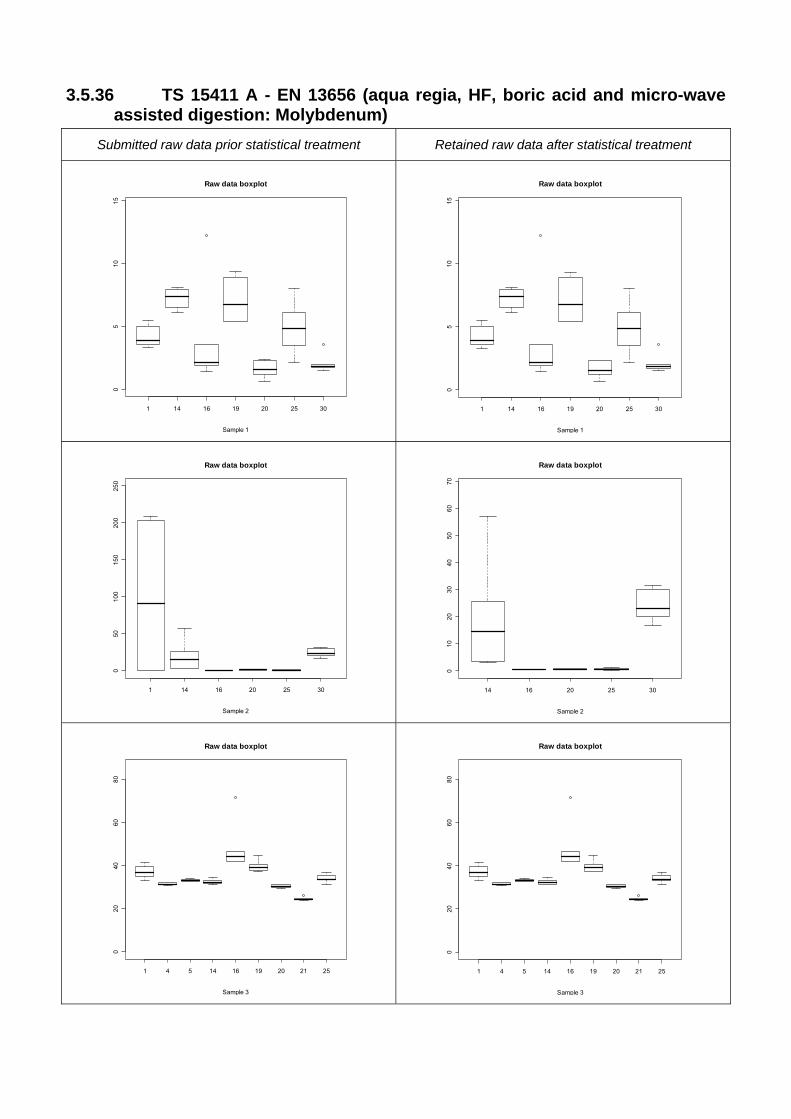
3.5.36 TS 15411 A - EN 13656 (aqua regia, HF, boric acid and micro-wave assisted digestion: Molybdenum)
Submitted raw data prior statistical treatment Retained raw data after statistical treatment
1 14 16 19 20 25 30
05
1015
Raw data boxplot
Sample 1 1 14 16 19 20 25 30
05
1015
Raw data boxplot
Sample 1
1 14 16 20 25 30
050
100
150
200
250
Raw data boxplot
Sample 2 14 16 20 25 30
010
2030
4050
6070
Raw data boxplot
Sample 2
1 4 5 14 16 19 20 21 25
020
4060
80
Raw data boxplot
Sample 3 1 4 5 14 16 19 20 21 25
020
4060
80
Raw data boxplot
Sample 3

1 14 16 19 20 25 30
010
2030
4050
60
Raw data boxplot
Sample 4 1 14 16 20 25 30
01
23
45
Raw data boxplot
Sample 4
1 14 16 19 20 25 30
020
4060
80
Raw data boxplot
Sample 5 1 14 19 20 25 30
02
46
8
Raw data boxplot
Sample 5
Results are expressed in mg/kg d.m.
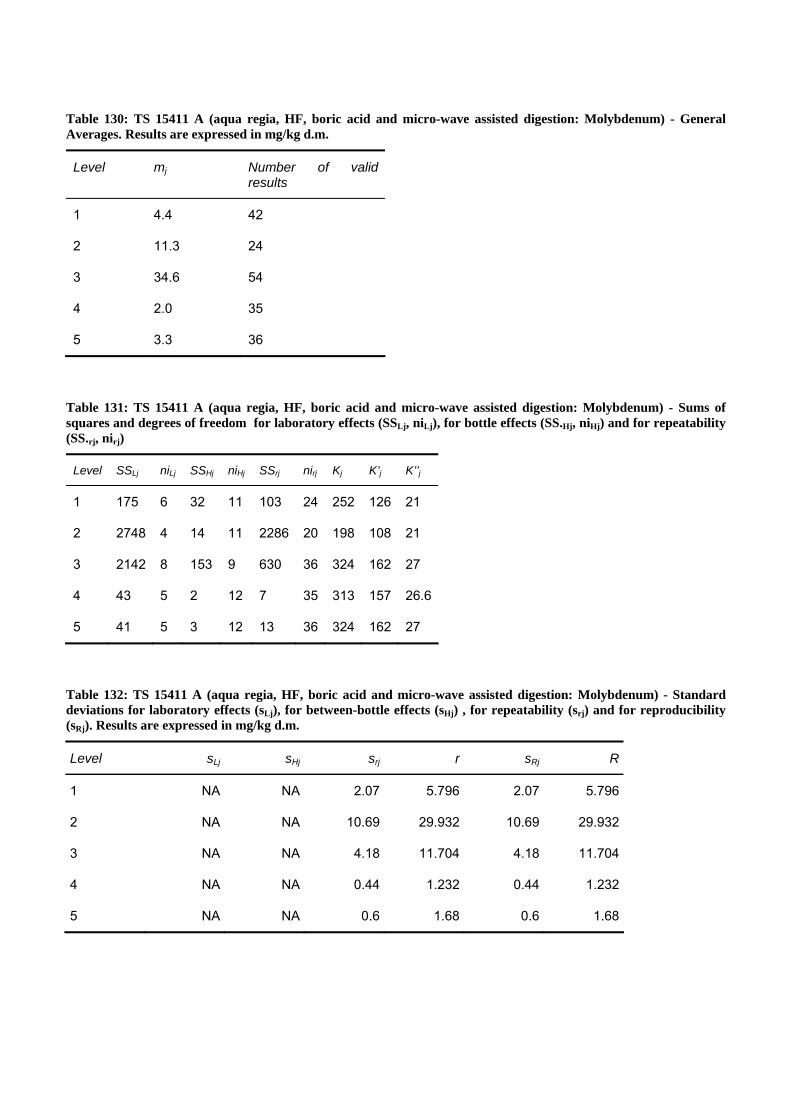
Table 130: TS 15411 A (aqua regia, HF, boric acid and micro-wave assisted digestion: Molybdenum) - General Averages. Results are expressed in mg/kg d.m.
Level mj Number of valid results
1 4.4 42
2 11.3 24
3 34.6 54
4 2.0 35
5 3.3 36
Table 131: TS 15411 A (aqua regia, HF, boric acid and micro-wave assisted digestion: Molybdenum) - Sums of squares and degrees of freedom for laboratory effects (SSLj, niLj), for bottle effects (SS.Hj, niHj) and for repeatability (SS.rj, nirj)
Level SSLj niLj SSHj niHj SSrj nirj Kj K’j K’’j
1 175 6 32 11 103 24 252 126 21
2 2748 4 14 11 2286 20 198 108 21
3 2142 8 153 9 630 36 324 162 27
4 43 5 2 12 7 35 313 157 26.6
5 41 5 3 12 13 36 324 162 27
Table 132: TS 15411 A (aqua regia, HF, boric acid and micro-wave assisted digestion: Molybdenum) - Standard deviations for laboratory effects (sLj), for between-bottle effects (sHj) , for repeatability (srj) and for reproducibility (sRj). Results are expressed in mg/kg d.m.
Level sLj sHj srj r sRj R
1 NA NA 2.07 5.796 2.07 5.796
2 NA NA 10.69 29.932 10.69 29.932
3 NA NA 4.18 11.704 4.18 11.704
4 NA NA 0.44 1.232 0.44 1.232
5 NA NA 0.6 1.68 0.6 1.68

3.5.37 TS 15411 A - EN 13656 (aqua regia, HF, boric acid and micro-wave assisted digestion: Nickel)
Submitted raw data prior statistical treatment Retained raw data after statistical treatment
1 4 14 19 20 21 25 30
050
100
150
200
250
300
Raw data boxplot
Sample 1 1 4 14 20 21 25 30
010
2030
4050
6070
Raw data boxplot
Sample 1
1 4 14 16 19 20 25 30
050
100
150
200
250
300
350
Raw data boxplot
Sample 2 1 4 14 16 19 20 25 30
050
100
150
200
250
300
350
Raw data boxplot
Sample 2
1 4 14 19 20 21 25 30
010
020
030
040
0
Raw data boxplot
Sample 3 1 4 14 19 20 21 25
010
020
030
040
0
Raw data boxplot
Sample 3

1 4 14 19 20 21 25 30
020
040
060
080
010
00
Raw data boxplot
Sample 4 1 4 14 20 21 25 30
020
4060
80
Raw data boxplot
Sample 4
1 4 14 16 19 20 21 25 30
020
040
060
080
010
0012
00
Raw data boxplot
Sample 5
1 4 14 19 20 21 25 30
010
2030
4050
60
Raw data boxplot
Sample 5
Results are expressed in mg/kg d.m.

Table 133: TS 15411 A (aqua regia, HF, boric acid and micro-wave assisted digestion: Nickel) - General Averages. Results are expressed in mg/kg d.m.
Level mj Number of valid results
1 31.2 42
2 55.2 35
3 184.9 42
4 18.6 42
5 34.9 48
Table 134: TS 15411 A (aqua regia, HF, boric acid and micro-wave assisted digestion: Nickel) - Sums of squares and degrees of freedom for laboratory effects (SSLj, niLj), for bottle effects (SS.Hj, niHj) and for repeatability (SS.rj, nirj)
Level SSLj niLj SSHj niHj SSrj nirj Kj K’j K’’j
1 492 6 442 9 2730 26 252 126 21
2 184755 7 47189 6 17624 21 191 97 18.66667
3 36118 6 2325 9 18649 32 288 144 24
4 2064 6 904 9 8214 32 288 144 24
5 852 7 445 8 1517 32 288 144 24
Table 135: TS 15411 A (aqua regia, HF, boric acid and micro-wave assisted digestion: Nickel) - Standard deviations for laboratory effects (sLj), for between-bottle effects (sHj) , for repeatability (srj) and for reproducibility (sRj). Results are expressed in mg/kg d.m.
Level sLj sHj srj r sRj R
1 NA NA 10 28 10 28
2 68 51 29 81.2 74 207.2
3 NA NA 24 67.2 24 67.2
4 NA NA 16 44.8 16 44.8
5 3 2 7 19.6 8 22.4

3.5.38 TS 15411 A - EN 13656 (aqua regia, HF, boric acid and micro-wave assisted digestion: Lead)
Submitted raw data prior statistical treatment Retained raw data after statistical treatment
1 4 5 14 16 19 20 25 30
010
2030
Raw data boxplot
Sample 1 1 4 5 14 16 19 20 25 30
010
2030
Raw data boxplot
Sample 1
1 4 5 14 16 19 20 25 30
050
100
150
Raw data boxplot
Sample 2 1 4 5 14 16 19 20 25
020
4060
80
Raw data boxplot
Sample 2
1 4 5 14 16 19 20 21 25 30
050
100
150
Raw data boxplot
Sample 3 1 4 5 14 16 19 20 21 25
050
100
150
Raw data boxplot
Sample 3

1 4 5 14 16 19 20 21 25 30
050
010
0015
00
Raw data boxplot
Sample 4
1 4 5 14 16 19 20 21 25 30
050
010
0015
00
Raw data boxplot
Sample 4
1 4 5 14 16 19 20 21 25 30
050
010
0015
00
Raw data boxplot
Sample 5
1 4 5 14 16 20 21 25 30
010
020
030
040
050
060
0
Raw data boxplot
Sample 5
Results are expressed in mg/kg d.m.

Table 136: TS 15411 A (a aqua regia, HF, boric acid and micro-wave assisted digestion: Lead) - General Averages. Results are expressed in mg/kg d.m.
Level mj Number of valid results
1 18 54
2 17 47
3 117 54
4 163 60
5 145 54
Table 137: TS 15411 A (a aqua regia, HF, boric acid and micro-wave assisted digestion: Lead) - Sums of squares and degrees of freedom for laboratory effects (SSLj, niLj), for bottle effects (SS.Hj, niHj) and for repeatability (SS.rj, nirj)
Level SSLj niLj SSHj niHj SSrj nirj Kj K’j K’’j
1 1772 8 56 11 449 34 324 162 27
2 2062 7 826 12 3952 33 313 157 26.6
3 20864 8 147 11 911 34 324 162 27
4 536311 9 450890 10 2650868 40 360 180 30
5 94902 8 95711 11 237987 40 360 180 30
Table 138: TS 15411 A (a aqua regia, HF, boric acid and micro-wave assisted digestion: Lead) - Standard deviations for laboratory effects (sLj), for between-bottle effects (sHj) , for repeatability (srj) and for reproducibility (sRj). Results are expressed in mg/kg d.m.
Level sLj sHj srj r sRj R
1 NA NA 4 11.2 4 11.2
2 NA NA 11 30.8 11 30.8
3 NA NA 5 14 5 14
4 NA NA 257 719.6 257 719.6
5 19 32 77 215.6 80 224

3.5.39 TS 15411 A - EN 13656 (aqua regia, HF, boric acid and micro-wave assisted digestion: Antimony)
Submitted raw data prior statistical treatment Retained raw data after statistical treatment
1 14 16 19 20 21 25
05
1015
20
Raw data boxplot
Sample 1
1 14 16 19 20 25
01
23
45
Raw data boxplot
Sample 2
1 14 16 19 20 21 25
05
1015
2025
3035
Raw data boxplot
Sample 3

1 4 14 16 19 20 21 25
020
4060
80
Raw data boxplot
Sample 4
1 4 14 16 19 20 21 25
050
100
150
200
Raw data boxplot
Sample 5
Results are expressed in mg/kg d.m.

Table 139: TS 15411 A (a a aqua regia, HF, boric acid and micro-wave assisted digestion: Antimony) - General Averages. Results are expressed in mg/kg d.m.
Level mj Number of valid results
1 7.28 39
2 1.46 29
3 10.31 42
4 18.20 43
5 22.71 47
Table 140: TS 15411 A (a a aqua regia, HF, boric acid and micro-wave assisted digestion: Antimony) - Sums of squares and degrees of freedom for laboratory effects (SSLj, niLj), for bottle effects (SS.Hj, niHj) and for repeatability (SS.rj, nirj)
Level SSLj niLj SSHj niHj SSrj nirj Kj K’j K’’j
1 365 6 81 9 288 23 225 113 19.667
2 17 5 13 9 9 17 170 88 17.167
3 700 6 179 9 206 26 252 126 21
4 2883 7 407 7 6012 28 253 127 22
5 3657 7 6831 8 26385 31 277 139 23.6
Table 141: TS 15411 A (a a aqua regia, HF, boric acid and micro-wave assisted digestion: Antimony) - Standard deviations for laboratory effects (sLj), for between-bottle effects (sHj) , for repeatability (srj) and for reproducibility (sRj). Results are expressed in mg/kg d.m.
Level sLj sHj srj r sRj R
1 NA NA 3.54 9.912 3.54 9.912
2 0.5 0.75 0.74 2.072 0.89 2.492
3 3.95 2.26 2.82 7.896 4.85 13.58
4 NA NA 14.65 41.02 14.65 41.02
5 NA 0.97 29.17 81.676 29.17 81.676

3.5.40 TS 15411 A - EN 13656 (aqua regia, HF, boric acid and micro-wave assisted digestion: Selenium)
Submitted raw data prior statistical treatment Retained raw data after statistical treatment
1 4 14 16 19 20
05
1015
2025
30
Raw data boxplot
Sample 1 1 4 14 16 19 20
05
1015
2025
30
Raw data boxplot
Sample 1
1 14 16 20 25
01
23
45
Raw data boxplot
Sample 2 1 14 16 20 25
01
23
45
Raw data boxplot
Sample 2
1 14 16 19 20
01
23
45
Raw data boxplot
Sample 3 1 14 16 19 20
01
23
45
Raw data boxplot
Sample 3

1 14 20 25
01
23
45
6
Raw data boxplot
Sample 4 1 14 20 25
01
23
45
6
Raw data boxplot
Sample 4
1 14 16 20
0.0
0.5
1.0
1.5
2.0
2.5
Raw data boxplot
Sample 5 1 14 16 20
0.0
0.5
1.0
1.5
2.0
2.5
Raw data boxplot
Sample 5
N.B. Data set to small for meaningful outlier testing
Results are expressed in mg/kg d.m.
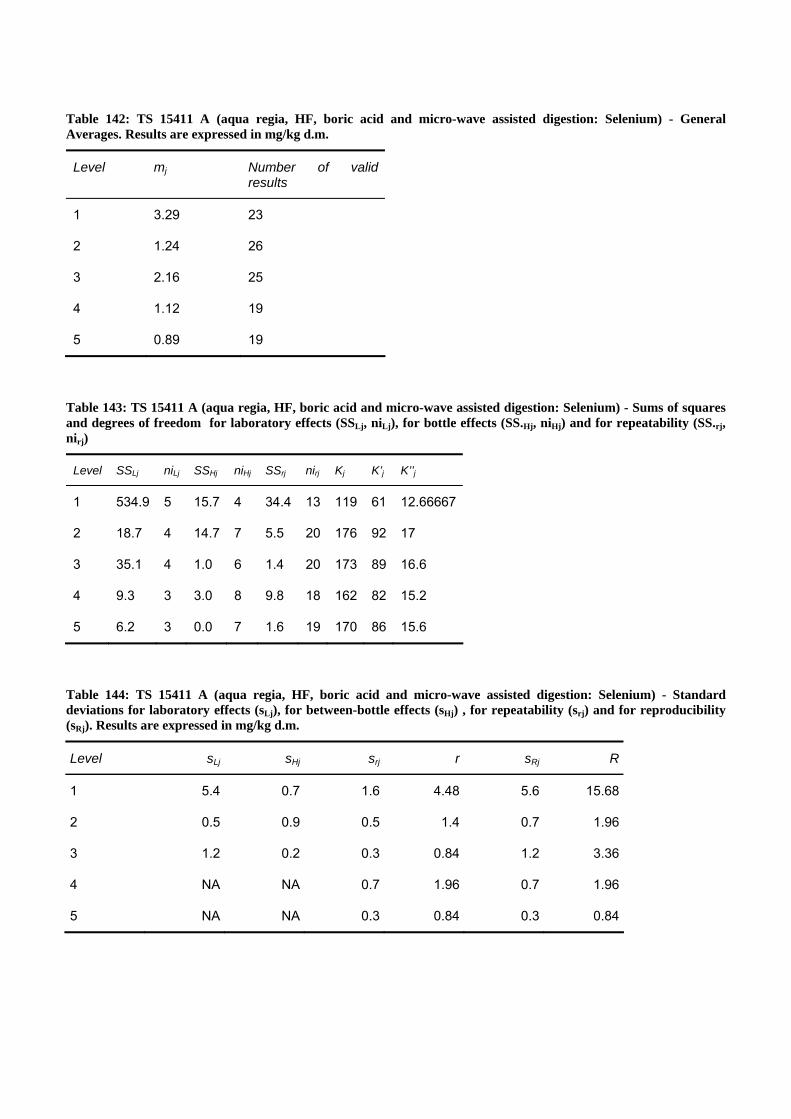
Table 142: TS 15411 A (aqua regia, HF, boric acid and micro-wave assisted digestion: Selenium) - General Averages. Results are expressed in mg/kg d.m.
Level mj Number of valid results
1 3.29 23
2 1.24 26
3 2.16 25
4 1.12 19
5 0.89 19
Table 143: TS 15411 A (aqua regia, HF, boric acid and micro-wave assisted digestion: Selenium) - Sums of squares and degrees of freedom for laboratory effects (SSLj, niLj), for bottle effects (SS.Hj, niHj) and for repeatability (SS.rj, nirj)
Level SSLj niLj SSHj niHj SSrj nirj Kj K’j K’’j
1 534.9 5 15.7 4 34.4 13 119 61 12.66667
2 18.7 4 14.7 7 5.5 20 176 92 17
3 35.1 4 1.0 6 1.4 20 173 89 16.6
4 9.3 3 3.0 8 9.8 18 162 82 15.2
5 6.2 3 0.0 7 1.6 19 170 86 15.6
Table 144: TS 15411 A (aqua regia, HF, boric acid and micro-wave assisted digestion: Selenium) - Standard deviations for laboratory effects (sLj), for between-bottle effects (sHj) , for repeatability (srj) and for reproducibility (sRj). Results are expressed in mg/kg d.m.
Level sLj sHj srj r sRj R
1 5.4 0.7 1.6 4.48 5.6 15.68
2 0.5 0.9 0.5 1.4 0.7 1.96
3 1.2 0.2 0.3 0.84 1.2 3.36
4 NA NA 0.7 1.96 0.7 1.96
5 NA NA 0.3 0.84 0.3 0.84

3.5.41 TS 15411 A - EN 13656 (aqua regia, HF, boric acid and micro-wave assisted digestion: Vanadium)
Submitted raw data prior statistical treatment Retained raw data after statistical treatment
1 4 14 20 25 30
02
46
810
12
Raw data boxplot
Sample 1 1 4 14 20 25 30
02
46
810
12
Raw data boxplot
Sample 1
1 14 16 20 30
020
040
060
080
010
0012
00
Raw data boxplot
Sample 2 1 14 16 20
05
1015
2025
30
Raw data boxplot
Sample 2
1 4 5 14 16 19 20 21 25 30
020
040
060
080
0
Raw data boxplot
Sample 3 1 4 5 14 16 19 20 21 25
020
040
060
080
0
Raw data boxplot
Sample 3
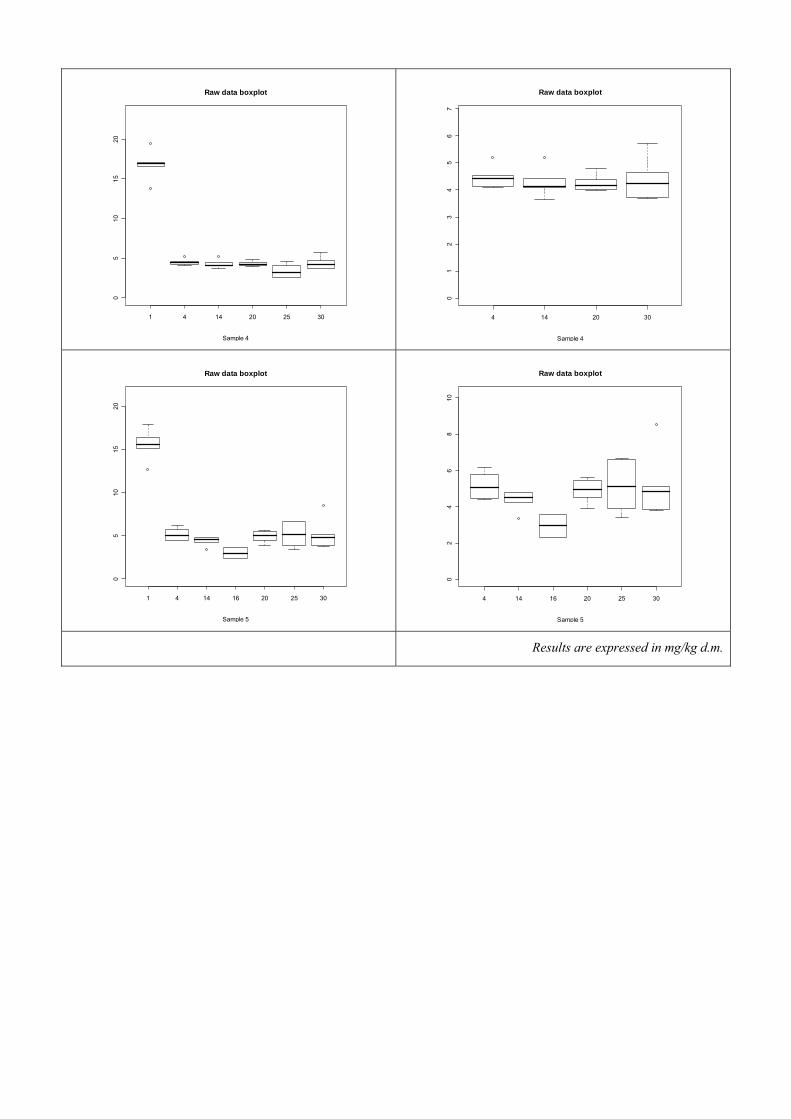
1 4 14 20 25 30
05
1015
20
Raw data boxplot
Sample 4 4 14 20 30
01
23
45
67
Raw data boxplot
Sample 4
1 4 14 16 20 25 30
05
1015
20
Raw data boxplot
Sample 5 4 14 16 20 25 30
02
46
810
Raw data boxplot
Sample 5
Results are expressed in mg/kg d.m.

Table 145: TS 15411 A (aqua regia, HF, boric acid and micro-wave assisted digestion: Vanadium) - General Averages. Results are expressed in mg/kg d.m.
Level mj Number of valid results
1 4.8 27
2 5.9 23
3 611.6 54
4 4.1 29
5 4.8 32
Table 146: TS 15411 A (aqua regia, HF, boric acid and micro-wave assisted digestion: Vanadium) - Sums of squares and degrees of freedom for laboratory effects (SSLj, niLj), for bottle effects (SS.Hj, niHj) and for repeatability (SS.rj, nirj)
Level SSLj niLj SSHj niHj SSrj nirj Kj K’j K’’j
1 215 5 2 10 18 11 149 77 15
2 611 3 122 13 150 13 170 86 15.6
3 328910 8 19477 9 76646 36 324 162 27
4 5 4 1 13 7 35 313 157 26.6
5 10 5 11 12 21 32 292 146 25
Table 147: TS 15411 A (aqua regia, HF, boric acid and micro-wave assisted digestion: Vanadium) - Standard deviations for laboratory effects (sLj), for between-bottle effects (sHj) , for repeatability (srj) and for reproducibility (sRj). Results are expressed in mg/kg d.m.
Level sLj sHj srj r sRj R
1 NA NA 1.28 3.584 1.28 3.584
2 NA NA 3.39 9.492 3.39 9.492
3 80.57 3.42 46.14 129.192 92.85 259.98
4 NA NA 0.46 1.288 0.46 1.288
5 0.31 0.33 0.82 2.296 0.88 2.464

3.5.42 TS 15411 A - EN 13656 (aqua regia, HF, boric acid and micro-wave assisted digestion: Zinc)
Submitted raw data prior statistical treatment Retained raw data after statistical treatment
1 4 5 14 16 19 20 21 25 30
050
0010
000
1500
0
Raw data boxplot
Sample 1 1 4 5 14 16 19 20 21 25 30
050
0010
000
1500
0
Raw data boxplot
Sample 1
1 4 5 14 16 19 20 21 25 30
050
010
0015
0020
0025
0030
00
Raw data boxplot
Sample 2 1 5 14 16 19 20 21 25
050
100
150
200
250
Raw data boxplot
Sample 2
1 4 5 14 16 19 20 21 25 30
050
010
0015
0020
00
Raw data boxplot
Sample 3
1 4 5 14 16 19 20 21 25
050
010
0015
0020
00
Raw data boxplot
Sample 3

1 4 5 14 16 19 20 21 25 30
020
0040
0060
0080
0010
000
Raw data boxplot
Sample 4
1 4 5 14 16 19 20 21 25 30
020
0040
0060
0080
0010
000
Raw data boxplot
Sample 4
1 4 5 14 16 19 20 21 25 30
010
0020
0030
0040
0050
0060
00
Raw data boxplot
Sample 5
1 4 14 16 19 20 21 25 30
050
010
0015
0020
00
Raw data boxplot
Sample 5
Results are expressed in mg/kg d.m.

Table 148: TS 15411 A (aqua regia, HF, boric acid and micro-wave assisted digestion: Zinc) - General Averages. Results are expressed in mg/kg d.m.
Level mj Number of valid results
1 11020 60
2 147 54
3 1183 54
4 573 60
5 431 54
Table 149: TS 15411 A (aqua regia, HF, boric acid and micro-wave assisted digestion: Zinc) - Sums of squares and degrees of freedom for laboratory effects (SSLj, niLj), for bottle effects (SS.Hj, niHj) and for repeatability (SS.rj, nirj)
Level SSLj niLj SSHj niHj SSrj nirj Kj K’j K’’j
1 3.22E+08 9 58576414 10 1.5E+08 40 360 180 30
2 252931.6 8 87232.98 11 542494.1 40 360 180 30
3 621873.1 8 178401 11 193006.4 40 360 180 30
4 16374777 9 20087057 10 75161106 40 360 180 30
5 635117.8 8 830130.1 11 2854582 40 360 180 30
Table 150: TS 15411 A (aqua regia, HF, boric acid and micro-wave assisted digestion: Zinc) - Standard deviations for laboratory effects (sLj), for between-bottle effects (sHj) , for repeatability (srj) and for reproducibility (sRj). Results are expressed in mg/kg d.m.
Level sLj sHj srj r sRj R
1 2234 839 1935 5418 2956 8276.8
2 NA NA 116 324.8 116 324.8
3 93 65 69 193.2 116 324.8
4 NA 208 1371 3838.8 1371 3838.8
5 21 39 267 747.6 268 750.4
4 References Athanasiou, C., Coutelieris, F., Vakouftsi, E., Skoulou, V., Antonakou, E., Marnellos, G., Zabaniotou, A., 2007. From
biomass to electricity through integrated gasification/SOFC system-optimization and energy balance. International Journal of Hydrogen Energy (32) 337 – 342.
Autret, E., Berthier, F., Luszezanec, A., Nicolas F., 2007. Incineration of municipal and assimilated wastes in France: Assessment of latest energy and material recovery performances. Journal of Hazardous Materials B (139), 569–574.
Bomb, Ch., McCormick, K., Deurwaarder, E., Kaberger, T., 2007. Biofuels for transport in Europe: Lessons from Germany and the UK. Energy Policy (35), 2256–2267.
Caspary, G., Evans, M., Buxtorf L., 2007. Stabilising energy-related greenhouse gas emissions: Making ‘‘technology wedges’’ feasible. Renewable Energy (32), 713–726.
Chiaramonti, D., Oasmaa, A., Solantausta Y., 2007. Power generation using fast pyrolysis liquids from biomass. Renewable and Sustainable Energy Reviews (11), 1056–1086.
Clift, R., Climate change and energy policy: The importance of sustainability arguments. Energy (32), 262–268.
Consonni, S., Giugliano, M., Grosso M., 2005. Alternative strategies for energy recovery from municipal solid waste Part B: Emission and cost estimates. Waste Management (25), 137–148.
De Vriesa, B.J.M., Van Vuuren, D.P., Hoogwijk, M.M., 2007. Renewable energy sources: Their global potential for the first-half of the 21st century at a global level: An integrated approach. Energy Policy (35), 2590–2610.
Directive 2001/77/EC, 2001. The promotion of electricity produced from renewable energy sources in the internal electricity market, OJ L 283, European Parliament and the Council
ISO, 1994a. ISO Standard 5725-2: Accuracy (trueness and precision) of measurement methods and results – Part 2: Basic method for the determination of repeatability and reproducibility of a standard measurement method.
ISO 1994b. ISO Standard 5725-5: Accuracy (trueness and precision) of measurement methods and results – Part 5: Alternative methods for the determination of the precision of a standard measurement method.
Lopez Gonzalez, L.M., Sala Lizarraga, J.M., Miguez Tabares, J.L., Lopez Ochoa, L.M., 2007. Contribution of renewable energy sources to electricity production in the La Rioja Autonomous Community, Spain. A review. Renewable and Sustainable Energy Reviews (11), 1244–1259.
Lund H., 2007. Renewable energy strategies for sustainable development. Energy (32) 912–919.
Moustakas, K., Fatta, D., Malamis, S., Haralambous, K., Loizidou, M., 2005. Demonstration plasma gasification/vitrification system for effective hazardous waste treatment. Journal of Hazardous Materials B (123), 120–126.
Nilsson, L.J., Pisarek, M., Buriak, J., Oniszk - Poplawska, A., Bucko, P., Ericsson, K., Jaworski, L., 2006. Energy policy and the role of bioenergy in Poland. Energy Policy (34), 2263–2278.
Odenberger, M., Johnsson, F., 2007. Achieving 60% CO2 reductions within the UK energy system—Implications for the electricity generation sector. Energy Policy (35), 2433–2452.
Orecchini, F., Bocci E., 2007. Biomass to hydrogen for the realization of closed cycles of energy resources. Energy (32), 1006–1011.
Patlitzianas, K.D., Ntotas, K., Doukas, H., Psarras, J., 2007. Assessing the renewable energy producers’ environment in EU accession member states. Energy Conversion and Management (48), 890–897.
Ptasinski, K.J., Prins, M.J., Pierik, A., 2007. Exergetic evaluation of biomass gasification. Energy (32), 568–574.
Streimikiene, D., Klevas, V., 2007. Promotion of renewable energy in Baltic States. Renewable and Sustainable Energy Reviews (11), 672–687.

Streimikiene, D., Klevas, V., Bubeliene, J., 2007. Use of EU structural funds for sustainable energy development in new EU member states. Renewable and Sustainable Energy Reviews (11), 1167–1187.
Terrados, J., Almonacid, G., Hontoria, L., 2007. Regional energy planning through SWOT analysis and strategic planning tools. Impact on renewables development. Renewable and Sustainable Energy Reviews (11), 1275–1287.
Zamorano, M., Perez Perez, J.I., Aguilar Paves, I., Ramos Ridao, A., 2007. Study of the energy potential of the biogas produced by an urban waste landfill in Southern Spain. Renewable and Sustainable Energy Reviews (11), 909–922.

5 ANNEX 1 – Reporting forms used for data submission

European Commission EUR 23552 EN – Joint Research Centre – Institute for Environment and Sustainability Title: QUOVADIS Project - Organization of Validation Exercises Author(s): VACCARO S, LOCORO G, CONTINI S, ROEBBEN G, EMTEBORG P, CICERI G, GIOVE A, IACOBELLIS S, FLAMME S, MAIER J, GAWLIK B Luxembourg: Office for Official Publications of the European Communities 2008 – 191 pp. – 21.0 x 29.7 cm EUR – Scientific and Technical Research series – ISSN 1018-5593 ISBN 978-92-79-10396-4 DOI 10.2788/2229

How to obtain EU publications
Our priced publications are available from EU Bookshop (http://bookshop.europa.eu), where you can place an order with the sales agent of your choice.
The Publications Office has a worldwide network of sales agents. You can obtain their contact details by sending a fax to (352) 29 29-42758.

The mission of the JRC is to provide customer-driven scientific and technical support for the conception, development, implementation and monitoring of EU policies. As aservice of the European Commission, the JRC functions as a reference centre ofscience and technology for the Union. Close to the policy-making process, it serves the common interest of the Member States, while being independent of specialinterests, whether private or national.
© European Communities, 2008
LB
-NA
-23552-EN-C