Quos audem que tu sultore inatio ur, escesso iciam autem ... · Table 8-6. Year of Entry into the...
104
CALIFORNIA 2011 AMERICAN COMMUNITY SURVEY 1-YEAR REPORT State of California, Department of Finance Demographic Research Unit 915 L Street Sacramento, CA 95814 http://www.dof.ca.gov/research/demographic/
-
Upload
phungkhanh -
Category
Documents
-
view
212 -
download
0
Transcript of Quos audem que tu sultore inatio ur, escesso iciam autem ... · Table 8-6. Year of Entry into the...

CALIFORNIA 2011 AMERICAN COMMUNITY SURVEY
1-YEAR REPORT
State of California, Department of Finance Demographic Research Unit
915 L Street Sacramento, CA 95814
http://www.dof.ca.gov/research/demographic/

2011 American Community Survey 1-Year Report: California i
ACKNOWLEDGMENTS
This report was prepared by Karen Duong. Jonathan Buttle validated input data and formulas, and Nancy Gemignani made methodological suggestions. Julie Hoang, Research Manager over the State Data Center coordinated and directed the report. Bill Schooling, Chief of the Demographic Research Unit, provided overall guidance.
SUGGESTED CITATION State of California, Department of Finance, 2011 American Community Survey 1-Year Report: California, Sacramento, California, October 2013, Rev. April 2014.
2011 American Community Survey 1-Year Report: California ii
CALIFORNIA
2011 AMERICAN COMMUNITY SURVEY 1-YEAR REPORT
The American Community Survey (ACS) is a nationwide survey conducted by the U.S. Census Bureau to provide communities with demographic, social, economic, and housing data every year. The ACS was fully implemented in 2005 and sampled approximately 2.9 million housing unit addresses in the United States annually. Beginning in June 2011 the sample size was increased to correspond to a 3.54 million annual level, resulting in a total sample size of 3.3 million housing unit addresses for the 2011 ACS. The ACS provides estimates each year that cover 1-year, 3-year, and 5-year periods. For each period, the U.S. Census Bureau produces two data files: the Summary File and the Public Use Microdata Sample (PUMS). The Summary Files are a set of basic and detailed tables of predetermined cross-tabulations. The Public Use Microdata Sample is for advanced data users who need to create tabulations not available in the Summary File. The PUMS file contains a sample of survey returns with all personal identification removed. PUMS data are available for only regions, divisions, states and Public Use Microdata Areas (PUMAs), which are predefined geographic areas with a minimum population of 100,000. Estimates in this report are from the 2011 ACS 1-year PUMS file.
USER NOTES
The primary purpose of the American Community Survey is to describe the average characteristics of the U.S. population in a given area over a specific time period. The ACS does not provide the official estimates of the population and housing units used for state planning and budgeting in California. For these official estimates, the source is the California Department of Finance.
All estimates from the ACS are subject to sampling error. The degree of uncertainty for an estimate arising from sampling variability is represented in this report through the use of a 90 percent margin of error. This can be roughly interpreted as providing the 90 percent probability that the interval defined by the estimate minus and plus the margin of error (the lower and upper confidence bounds) contains the true value. The margins of error for medians were calculated using design factors (a type of generalized variance function) provided by the U.S. Census Bureau. All other margins of error were calculated using replicate weights in the PUMS file. Estimates with a relative margin of error of 33 percent or greater are denoted with bold italic type.
Race/ethnicity tables were constructed using mutually exclusive categories. The response to the Hispanic, Latino, or Spanish origin question took priority when determining race/ethnicity, resulting in Hispanic and non-Hispanic categories. The non-Hispanic categories are as follows:
• White, Not Hispanic
• Black, Not Hispanic
• Asian, Not Hispanic
• American Indian & Alaskan Native, Not Hispanic
• Hawaiian/Pacific Islander, Not Hispanic
• Some Other Race, Not Hispanic
• Two or More Races, Not Hispanic

2011 American Community Survey 1-Year Report: California iii
The Hispanic category includes persons of Hispanic, Latino, or Spanish origin who may be of any race. For all tables in this report except for Table 1, racial-ethnic groups do not add up to the total population because only major race categories and Hispanic origin were examined.
Income and earnings were reported for the 12 months preceding the interview month. Monthly Consumer Price Indices (CPI) factors were used to inflation-adjust the dollars to the 2011 calendar year. For example, a householder interviewed in March 2011 would have reported their income for March 2010 through February 2011. To adjust their response to the 2011 calendar year, the reported income was multiplied by the 2011 average annual CPI (January 2011 - December 2011) and then divided by the average CPI for the reported income period (March 2010 - February 2011).
When comparing estimates from the ACS, the U.S. Census Bureau recommends comparing data from similar period lengths, e.g. 5-year to 5-year, and comparing estimates from non-overlapping periods, e.g. 2006-2008 ACS 3-year estimates to 2009-2011 ACS 3-year estimates. Because the strength of the ACS is in estimating distributions of characteristics, the U.S. Census Bureau also recommends that users compare derived measures such as percentages, means, medians, and rates rather than estimates of population totals. Differences in an estimate over time may be due to sampling error rather than actual change and should be statistically tested. Guidance on making data comparisons are provided in Appendix 4 of the ACS General Data Users Handbook available at:
http://www.census.gov/acs/www/Downloads/handbooks/ACSGeneralHandbook.pdf.
PUMS estimates are expected to be different from ACS estimates published by the U.S. Census Bureau. ACS published estimates are based on the full sample survey, while PUMS estimates are based on a subset of the full ACS records.
More information on the American Community Survey is available at: http://www.census.gov/acs.

Table of Contents 2011 American Community Survey 1-Year Report: California iv
TABLE OF CONTENTS
ACKNOWLEDGMENTS ..................................................................................................................................... i
USER NOTES .................................................................................................................................................... ii
TABLE OF CONTENTS ................................................................................................................................... iv
SECTION 1. GENERAL DEMOGRAPHIC CHARACTERISTICS ................................................................... 1
Table 1-1. Race/Ethnicity ....................................................................................................................... 3 Figure 1-1. Race/Ethnicity ....................................................................................................................... 3 Table 1-2. Age by Race/Ethnicity and Sex ............................................................................................ 4 Figure 1-2. Median Age by Race/Ethnicity and Sex ............................................................................... 5 Table 1-3. Marital Status by Sex ............................................................................................................ 5 Table 1-4. Marital Status by Race/Ethnicity ........................................................................................... 6 Figure 1-3. Marital Status by Race/Ethnicity ........................................................................................... 6 Table 1-5. Household Size by Race/Ethnicity of Householder .............................................................. 7 Figure 1-4. Household Size by Race/Ethnicity of Householder .............................................................. 8 Table 1-6. Household Size by Sex for the Population 65 Years and Over ............................................ 8 Table 1-7. Household Size by Tenure ................................................................................................... 9 Table 1-8. Household Type by Presence of Related Children............................................................... 9 Table 1-9. Presence of Parents in Family for Related Children Under 18 Years .................................. 9 Figure 1-5. Presence of Parents in Family for Related Children Under 18 Years ................................ 10 Table 1-10. Grandchildren Living with a Grandparent Householder by Grandparent
Responsibility and Presence of Parent ............................................................................... 10
SECTION 2. LABOR FORCE ......................................................................................................................... 11
Table 2-1. Civilian Labor Force Participation by Age and Sex ............................................................ 12 Table 2-2. Employment Status by Age and Sex .................................................................................. 13 Figure 2-1. Civilian Labor Force Participation by Age and Sex ............................................................ 14 Table 2-3. Civilian Labor Force Participation and Employment Status by Race/Ethnicity .................. 14 Figure 2-2. Unemployment by Race/Ethnicity ....................................................................................... 15 Table 2-4. Civilian Labor Force Participation by Race/Ethnicity for Persons 16 to 64 Years .............. 15 Table 2-5. Major Industry Group by Sex .............................................................................................. 16 Table 2-6. Median Earnings (In 2011 Inflation-Adjusted Dollars) by Major Industry Group ................ 16 Table 2-7. Major Occupation Group by Sex......................................................................................... 17 Table 2-8. Median Earnings (In 2011 Inflation-Adjusted Dollars) by Major Occupation
Group .................................................................................................................................. 17 Table 2-9. Families by Number of Workers and Median Family Income ............................................. 18 Table 2-10. Means of Transportation to Work ....................................................................................... 18 Table 2-11. Travel Time to Work ........................................................................................................... 18
SECTION 3. INCOME ..................................................................................................................................... 19
Table 3-1. Family Income by Race/Ethnicity of Householder and Household Income ........................ 19 Table 3-2. Families by Size of Family and Median Family Income (In 2011 Inflation-
Adjusted Dollars) ................................................................................................................ 20 Table 3-3. Households by Size of Household and Median Household Income (In 2011
Inflation-Adjusted Dollars) ................................................................................................... 21
Table of Contents 2011 American Community Survey 1-Year Report: California v
Table 3-4. Households by Age of Householder and Median Household Income (In 2011 Inflation-Adjusted Dollars) ................................................................................................... 21
Figure 3-1. Households by Age of Householder and Median Household Income (In 2011 Inflation-Adjusted Dollars) ................................................................................................... 22
Table 3-5. Households by Selected Types of Income (In 2011 Inflation-Adjusted Dollars) ................ 22 Table 3-6. Personal Income by Sex (In 2011 Inflation-Adjusted Dollars) ............................................ 23 Figure 3-2. Personal Income by Sex (In 2011 Inflation-Adjusted Dollars) ............................................ 23 Table 3-7. Selected Types of Income (In 2011 Inflation-Adjusted Dollars) by Sex for the
Population 65 Years and Over............................................................................................ 24 Table 3-8. Per Capita Income (In 2011 Inflation-Adjusted Dollars) ..................................................... 24
SECTION 4. POVERTY .................................................................................................................................. 25
Table 4-1. Race/Ethnicity by Poverty Status ................................................................................................ 25 Figure 4-1. Race/Ethnicity by Poverty Status ................................................................................................ 26 Table 4-2. Age by Poverty Status................................................................................................................... 26 Table 4-3. Families by Family Type and Poverty Status ............................................................................ 27 Table 4-4. Presence of Parent in Family by Poverty Status for Related Children Under 18
Years ............................................................................................................................................... 27 Figure 4-2. Poverty Status by Selected Characteristics ............................................................................... 28
SECTION 5. EDUCATIONAL ATTAINMENT ................................................................................................ 29
Table 5-1. Educational Attainment by Sex .................................................................................................... 30 Table 5-2. Educational Attainment by Race/Ethnicity ................................................................................. 30 Figure 5-1. Educational Attainment by Race/Ethnicity ................................................................................. 31 Table 5-3. Educational Attainment by Nativity .............................................................................................. 31 Table 5-4. High School Diploma or Higher by Age and Sex ...................................................................... 32 Table 5-5. Bachelor's Degree or Higher by Age and Sex ........................................................................... 32 Table 5-6. Earnings (In 2011 Inflation-Adjusted Dollars) by Educational Attainment ............................. 32 Figure 5-2. Earnings (In 2011 Inflation-Adjusted Dollars) by Educational Attainment ............................. 33 Table 5-7. Median Earnings (In 2011 Inflation-Adjusted Dollars) by Educational Attainment
and Race/Ethnicity ......................................................................................................................... 34 Table 5-8. Median Earnings (In 2011 Inflation-Adjusted Dollars) by Educational Attainment
and Sex ........................................................................................................................................... 34
SECTION 6. HEALTH INSURANCE .............................................................................................................. 35
Table 6-1. Health Insurance Coverage Status by Selected Characteristics ............................................ 36 Figure 6-1. Percent Uninsured by Selected Characteristics ........................................................................ 37 Table 6-2. Health Insurance Coverage by Type .......................................................................................... 37 Figure 6-2. Health Insurance Coverage by Type .......................................................................................... 38 Table 6-3. Private Health Insurance Coverage by Age ............................................................................... 38 Table 6-4. Medicaid (“Medi-Cal”) Coverage by Age .................................................................................... 39 Table 6-5. Medicare Coverage by Age .......................................................................................................... 39
SECTION 7. GEOGRAPHIC MOBILITY ........................................................................................................ 40
Table 7-1. Geographic Mobility in the Past Year by Type of Move ........................................................... 41 Figure 7-1. Median Age by Geographic Mobility ........................................................................................... 41 Table 7-2. Geographic Mobility in the Past Year by Selected Characteristics ........................................ 42
Table 7-3. Interstate Geographic Mobility in the Past Year by Selected Characteristics ....................... 43

Table of Contents 2011 American Community Survey 1-Year Report: California vi
Figure 7-2. Interstate Geographic Mobility in the Past Year by Household Income ................................ 44 Table 7-4. Geographic Mobility in the Past Year by U.S. Region of Former Residence ....................... 45
SECTION 8. FOREIGN BORN ....................................................................................................................... 46
Table 8-1. Age by Nativity and Sex ................................................................................................................ 47 Figure 8-1. Age by Nativity and Sex ................................................................................................................ 47 Table 8-2. Race/Ethnicity by Nativity ............................................................................................................. 48 Table 8-3. World Region of Birth .................................................................................................................... 48 Figure 8-2. World Region of Birth .................................................................................................................... 49 Table 8-4. Top Five Countries of Birth by Citizenship Status .................................................................... 49 Table 8-5. Year of Entry into the U.S. by Citizenship Status for California’s Foreign-Born
Population ....................................................................................................................................... 50 Table 8-6. Year of Entry into the U.S. by Citizenship Status for California’s Mexican-Born
Population ....................................................................................................................................... 50
SECTION 9. LANGUAGE ............................................................................................................................... 51
Table 9-1. Language Spoken at Home and Ability to Speak English by Age .......................................... 52 Table 9-2. Top Ten Languages Spoken at Home Other than English by Ability to Speak
English ............................................................................................................................................. 52 Table 9-3. Language Spoken at Home by Age and Poverty Status in the Past 12 Months .................. 52 Table 9-4. Language Spoken at Home and Ability to Speak English by Educational
Attainment ....................................................................................................................................... 53 Figure 9-1. Language Spoken at Home and Ability to Speak English by Educational
Attainment ....................................................................................................................................... 53
SECTION 10. DISABILITY ............................................................................................................................. 54
Table 10-1. Age by Sex and Disability Status ................................................................................................ 54 Table 10-2. Age by Type of Disability .............................................................................................................. 55 Figure 10-1. Age by Type of Disability .............................................................................................................. 56 Table 10-3. Race/Ethnicity by Disability Status .............................................................................................. 56
SECTION 11. VETERANS.............................................................................................................................. 57
Table 11-1. Age by Sex and Veteran Status .................................................................................................. 57 Table 11-2. Race/Ethnicity by Veteran Status ................................................................................................ 58 Table 11-3. Veterans by Period of Service ..................................................................................................... 58 Table 11-4. Veterans by Period of Service and Poverty Status ................................................................... 58
SECTION 12. FERTILITY ............................................................................................................................... 59
Table 12-1. Women who had a Birth in the Past 12 Months by Marital Status and Age ......................... 59 Figure 12-1. Women who had a Birth in the Past 12 Months by Marital Status and Age ......................... 60 Table 12-2. Women who had a Birth in the Past 12 Months by Marital Status and
Race/Ethnicity ................................................................................................................................ 60
APPENDICES: MARGINS OF ERROR (MOE) .............................................................................................. 61

Table of Contents 2011 American Community Survey 1-Year Report: California vii
Appendix 1. General Demographics – Margins of Error ......................................................................... 61 Appendix 2. Labor Force – Margins of Error........................................................................................... 66 Appendix 3. Income – Margins of Error .................................................................................................. 71 Appendix 4. Poverty – Margins of Error .................................................................................................. 75 Appendix 5. Educational Attainment – Margins of Error ......................................................................... 77 Appendix 6. Health Insurance – Margins of Error ................................................................................... 81 Appendix 7. Geographic Mobility – Margins of Error .............................................................................. 84 Appendix 8. Foreign Born – Margins of Error ......................................................................................... 88 Appendix 9. Language – Margins of Error .............................................................................................. 91 Appendix 10. Disability – Margins of Error ................................................................................................ 93 Appendix 11. Veterans – Margins of Error ................................................................................................ 94 Appendix 12. Fertility – Margins of Error .................................................................................................. 96

Section 1. General Demographics, 2011 American Community Survey 1-Year Report: California 1
SECTION 1. GENERAL DEMOGRAPHIC CHARACTERISTICS
In 2011, California had a total population of 37.7 million (Table 1-1). California was a majority-minority state where no racial or ethnic group constituted the majority of the population. Non-Hispanic Whites were the largest racial-ethnic group (39.6 percent), exceeding the number of Hispanics by 557,000 people, or the equivalent of 1.5 percent of California’s population (Figure 1-1). However, the latest projection series (January 2013) from the California Department of Finance indicated that the number of Hispanics will be even with the number of non-Hispanic Whites in mid-2013. Early in 2014, the Hispanic population will become the plurality in California for the first time since California became a state. About a quarter (24.6 percent) of California’s population in 2011 was under 18 years and 11.6 percent was 65 years and over (Table 1-2). The remaining 63.8 percent of the population was comprised of the traditional working age group of persons 18 to 64 years old. Hispanics accounted for more than half (51.7 percent) of the children under age 18 and non-Hispanic Whites, 26.9 percent. Among the working-age population, non-Hispanic Whites represented the largest group (40.5 percent), followed by Hispanics (36.5 percent). Non-Hispanic Whites were also the majority (61.3 percent) of the population 65 years and over and had the highest median age of all groups, 44.9 years (Figure 1-2). Hispanics had the lowest median age, 27.4 years. The median age for California was 35.4 years. California’s population consisted of 18.8 million (49.8 percent) males and 18.9 million (50.2 percent) females (Table 1-2). The male-female sex ratio was 99 males for every 100 females. Hispanics had the highest male-female ratio (102.4 males for every 100 females); non-Hispanic Asians had the lowest (90.2 males for every 100 females). In 2011, California had 12.5 million households (Table 1-5). The average household size was 2.96 persons. The most common household size was a two-person household (29.9 percent) and the least common was a household with six or more persons (6.5 percent). Hispanics had the greatest proportion of households consisting of six or more persons (14.9 percent), surpassing the proportion for non-Hispanic Asians (6.7 percent), non-Hispanic Blacks (4.1 percent), and non-Hispanic Whites (2.2 percent) (Figure 1-4). Persons 65 years and over usually lived in a two-person household (46.9 percent) (Table 1-6). However, subgoups within this range, across gender, revealed different patterns. A greater proportion of females 75 years and over lived in single-person households (38.9 percent) than in two-person households (34.5 percent). In contrast, 20.3 percent of males 75 years and over lived alone and 54.8 percent lived in a two-person household. One reason for the difference in the proportion of elderly females and males who were living alone is that females tend to outlive their husbands as they have a longer life expectancy; the number of females 75 years and over was almost one and half times larger than the number of males 75 years and over in 2011 (Table 1-2). Of all households, 55 percent were owner-occupied and 45 percent were renter-occupied (Table 1-7). More single-person households were renter-occupied (54.6 percent) than owner-occupied (45.4 percent), whereas households of all other sizes had a higher percentage of owner-occupancy than renter-occupancy. The average household size was 3.00 for owner-occupied households and 2.91 for renter-occupied households.

Section 1. General Demographics, 2011 American Community Survey 1-Year Report: California 2
Families represented 68.3 percent of the households in California (Table 1-8). Family households included married couple families (48.5 percent), male householder families with no spouse present (6 percent), and female householder families with no spouse present (13.8 percent). The remaining 31.7 percent of households were nonfamily households, of which 77.4 percent were single-person households. In 2011, nearly all of the 9.3 million children under 18 years in California lived in households (Table 1-2, Table 1-9). Of these children1, 62.5 percent lived with both parents, 33.1 percent lived with one parent, 2.7 percent lived with neither parent, and 1.7 percent was not related to the householder and had an unknown status2 (Figure 1-5). Over three-quarters of the children who lived with one parent were living with their mother. Approximately 8.4 percent of all children lived in grandparent-headed households (Tables 1-2, Table 1-10). For 40 percent of these children, a grandparent was the primary caregiver for the children. Among the children living with grandparent householders who were responsible for them, 73.8 percent had a least one parent present in the household and 26.2 percent did not have either parent living with them. In other words, about 229,000 children, or 2.5 percent of all children living in households, resided with at least one parent but had their basic needs provided by a grandparent householder.
1 Persons under 18 years who were householders, spouses of householders, or unmarried partners of
householders represented less than 5,000 people, and were not included in the data for children by presence of parents. 2 In the ACS, data on the presence of parent was collected only for persons related to the householder.

Section 1. General Demographics, 2011 American Community Survey 1-Year Report: California 3
Table 1-1. Race/Ethnicity
Universe: Total Population
Race/Ethnicity Number Percent
White, Not Hispanic 14,915,716 39.6%
Black, Not Hispanic 2,152,501 5.7%
American Indian and Alaska Native, Not Hispanic 146,688 0.4%
Asian, Not Hispanic 4,914,826 13.0%
Native Hawaiian and Other Pacific Islander, Not Hispanic 132,827 0.4%
Some Other Race, Not Hispanic 76,412 0.2%
Two or More Races, Not Hispanic 994,549 2.6%
Hispanic 14,358,393 38.1%
Total 37,691,912 100.0%
Figure 1-1. Race/Ethnicity
Universe: Total Population

Section 1. General Demographics, 2011 American Community Survey 1-Year Report: California 4
Table 1-2. Age by Race/Ethnicity and Sex
Universe: Total Population
Age Group
White, Not Hispanic Black, Not Hispanic
Male Female Total Percent Male Female Total Percent
Under 18 1,280,050 1,216,268 2,496,318 16.7% 264,838 240,071 504,909 23.5%
18-24 662,247 606,859 1,269,106 8.5% 128,675 119,356 248,031 11.5%
25-34 964,755 892,574 1,857,329 12.5% 147,363 146,217 293,580 13.6%
35-49 1,538,496 1,472,053 3,010,549 20.2% 231,809 232,602 464,411 21.6%
50-64 1,787,528 1,800,170 3,587,698 24.1% 196,105 213,118 409,223 19.0%
65-74 668,063 730,865 1,398,928 9.4% 60,176 75,153 135,329 6.3%
75+ 527,194 768,594 1,295,788 8.7% 37,369 59,649 97,018 4.5%
Total 7,428,333 7,487,383 14,915,716 100% 1,066,335 1,086,166 2,152,501 100%
Median Age 43.5 46.1 44.9 34.5 37.7 36.0
-----------Table 1-2. Continued-----------
Age Group
Asian, Not Hispanic Hispanic
Male Female Total Percent Male Female Total Percent
Under 18 501,998 469,112 971,110 19.8% 2,448,478 2,338,251 4,786,729 33.3%
18-24 242,317 231,059 473,376 9.6% 951,819 870,670 1,822,489 12.7%
25-34 355,174 393,337 748,511 15.2% 1,199,582 1,102,719 2,302,301 16.0%
35-49 542,318 628,010 1,170,328 23.8% 1,510,646 1,461,408 2,972,054 20.7%
50-64 436,218 519,933 956,151 19.5% 815,992 865,702 1,681,694 11.7%
65-74 147,618 185,778 333,396 6.8% 206,200 256,506 462,706 3.2%
75+ 105,140 156,814 261,954 5.3% 130,591 199,829 330,420 2.3%
Total 2,330,783 2,584,043 4,914,826 100% 7,263,308 7,095,085 14,358,393 100%
Median Age 36.7 39.7 38.3 26.8 28.1 27.4
-----------Table 1-2. Continued-----------
Age Group
Total*
Male Female Total Percent
Under 18 4,748,346 4,515,069 9,263,415 24.6%
18-24 2,069,847 1,906,931 3,976,778 10.6%
25-34 2,761,941 2,634,917 5,396,858 14.3%
35-49 3,933,122 3,912,498 7,845,620 20.8%
50-64 3,320,154 3,491,281 6,811,435 18.1%
65-74 1,106,066 1,275,616 2,381,682 6.3%
75+ 813,731 1,202,393 2,016,124 5.3%
Total 18,753,207 18,938,705 37,691,912 100%
Median Age 34.2 36.6 35.4
*Total includes all race/ethnic groups.

Section 1. General Demographics, 2011 American Community Survey 1-Year Report: California 5
Figure 1-2. Median Age by Race/Ethnicity and Sex
Universe: Total Population
Table 1-3. Marital Status by Sex
Universe: Population 15 years and over
Marital Status
Male Female Total
Number Percent Number Percent Number Percent
Never Married 5,966,914 40.2% 4,959,794 32.6% 10,926,708 36.3%
Married 7,062,823 47.5% 6,887,075 45.3% 13,949,898 46.4%
Separated 292,926 2.0% 415,467 2.7% 708,393 2.4%
Widowed 316,553 2.1% 1,241,584 8.2% 1,558,137 5.2%
Divorced 1,215,439 8.2% 1,706,468 11.2% 2,921,907 9.7%
Total 14,854,655 100.0% 15,210,388 100.0% 30,065,043 100.0%

Section 1. General Demographics, 2011 American Community Survey 1-Year Report: California 6
Table 1-4. Marital Status by Race/Ethnicity
Universe: Population 15 years and over
Marital Status
White, Not Hispanic Black, Not Hispanic Asian, Not Hispanic Hispanic
Number Percent Number Percent Number Percent Number Percent
Never Married 3,810,339 29.5% 851,249 48.7% 1,310,471 31.8% 4,533,244 43.7%
Married 6,330,100 49.1% 493,208 28.2% 2,299,522 55.9% 4,471,229 43.1%
Separated 231,274 1.8% 64,425 3.7% 60,570 1.5% 331,559 3.2%
Widowed 878,907 6.8% 103,358 5.9% 214,755 5.2% 329,565 3.2%
Divorced 1,644,604 12.8% 236,351 13.5% 230,536 5.6% 715,496 6.9%
Total 12,895,224 100.0% 1,748,591 100.0% 4,115,854 100.0% 10,381,093 100.0%
-----------Table 1-4. Continued-----------
Marital Status
Total*
Number Percent
Never Married 10,926,708 36.3%
Married 13,949,898 46.4%
Separated 708,393 2.4%
Widowed 1,558,137 5.2%
Divorced 2,921,907 9.7%
Total 30,065,043 100.0%
*Total includes all race/ethnic groups.
Figure 1-3. Marital Status by Race/Ethnicity
Universe: Population 15 years and over

Section 1. General Demographics, 2011 American Community Survey 1-Year Report: California 7
Table 1-5. Household Size by Race/Ethnicity of Householder
Universe: Households
Household Size
White, Not Hispanic Black, Not Hispanic Asian, Not Hispanic
Number Percent Number Percent Number Percent
1 1,974,900 31.2% 268,524 33.8% 285,043 18.8%
2 2,318,223 36.6% 223,152 28.1% 403,194 26.6%
3 921,550 14.5% 130,863 16.5% 310,763 20.5%
4 711,241 11.2% 95,513 12.0% 292,205 19.3%
5 272,321 4.3% 44,249 5.6% 123,808 8.2%
6+ 139,060 2.2% 32,461 4.1% 101,384 6.7%
Total Households 6,337,295 100.0% 794,762 100.0% 1,516,397 100.0%
Mean Household Size 2.42 2.58 3.20
-----------Table 1-5. Continued-----------
Household Size
Hispanic Total*
Number Percent Number Percent
1 438,587 12.7% 3,057,110 24.5%
2 679,499 19.6% 3,728,747 29.9%
3 622,508 18.0% 2,048,645 16.4%
4 686,104 19.8% 1,838,060 14.7%
5 521,466 15.1% 985,238 7.9%
6+ 515,571 14.9% 810,944 6.5%
Total Households 3,463,735 100.0% 12,468,744 100.0%
Mean Household Size 3.93 2.96
*Total includes all race/ethnic groups.

Section 1. General Demographics, 2011 American Community Survey 1-Year Report: California 8
Figure 1-4. Household Size by Race/Ethnicity of Householder
Universe: Households
Table 1-6. Household Size by Sex for the Population 65 Years and Over
Universe: Household population 65 years and over
Household Size
Age 65-74 years Age 75 and Over Total
Number Percent
Male Percent Female Number
Percent Male
Percent Female Number Percent
1 460,493 34.9% 65.1% 600,067 26.6% 73.4% 1,060,560 24.8%
2 1,181,800 50.3% 49.7% 822,385 52.5% 47.5% 2,004,185 46.9%
3+ 707,164 47.0% 53.0% 498,875 39.3% 60.7% 1,206,039 28.2%
Total 2,349,457 46.3% 53.7% 1,921,327 41.0% 59.0% 4,270,784 100.0%

Section 1. General Demographics, 2011 American Community Survey 1-Year Report: California 9
Table 1-7. Household Size by Tenure
Universe: Household population and Households
Household Size
Households Persons
Number Percent
Percent Owner
Occupied
Percent Renter
Occupied Number Percent
1 3,057,110 24.5% 45.4% 54.6% 3,057,083 8.3%
2 3,728,747 29.9% 62.2% 37.8% 7,780,429 21.1%
3 2,048,645 16.4% 54.7% 45.3% 6,666,062 18.1%
4 1,838,060 14.7% 58.2% 41.8% 7,881,939 21.4%
5 985,238 7.9% 53.6% 46.4% 5,300,653 14.4%
6+ 810,944 6.5% 53.3% 46.7% 6,185,352 16.8%
Total 12,468,744 100.0% 55.0% 45.0% 36,871,518 100.0%
Mean Household Size 2.96 3.00 2.91
Table 1-8. Household Type by Presence of Related Children
Universe: Households
Household Type Number Percent
Families
Married Couple With Related Children 3,008,165 24.1%
Without Related Children 3,046,310 24.4%
Male Householder, No Spouse Present
With Related Children 416,840 3.3%
Without Related Children 331,523 2.7%
Female Householder, No Spouse Present
With Related Children 1,099,339 8.8%
Without Related Children 618,569 5.0%
One Person, Nonfamily Male 1,364,779 10.9%
Female 1,692,331 13.6%
2+ Persons, Nonfamily 890,888 7.1%
Total 12,468,744 100.0%
Table 1-9. Presence of Parents in Family for Related Children Under 18 Years
Universe: Household population under 18 years, excluding householders and spouses/unmarried partners of householders
Age Group
Related Children Unrelated Children Total Both Parents Father Only Mother Only No Parent
Under 5 1,553,260 229,790 650,126 52,398 37,854 2,523,428
5-9 1,608,314 205,544 603,358 59,717 34,816 2,511,749
10-14 1,624,052 203,965 640,024 70,581 43,335 2,581,957
15-17 987,190 115,687 410,405 65,657 38,947 1,617,886
Total 5,772,816 754,986 2,303,913 248,353 154,952 9,235,020
Percent 62.5% 8.2% 24.9% 2.7% 1.7% 100.0%

Section 1. General Demographics, 2011 American Community Survey 1-Year Report: California 10
Figure 1-5. Presence of Parents in Family for Related Children Under 18 Years
Universe: Household population under 18 years, excluding householders and spouses/unmarried partners of
householders
Table 1-10. Grandchildren Living with a Grandparent Householder by Grandparent Responsibility and Presence of Parent
Universe: Grandchildren under 18 years living with grandparent householder
Grandparent Householder Responsibility for Own Grandchildren Number Percent
Responsible 310,107 40.0%
Parent Present 228,819 29.5%
No Parent Present 81,288 10.5%
Not Responsible 464,786 60.0%
Total 774,893 100.0%

Section 2. Labor Force, 2011 American Community Survey 1-Year Report: California 11
SECTION 2. LABOR FORCE
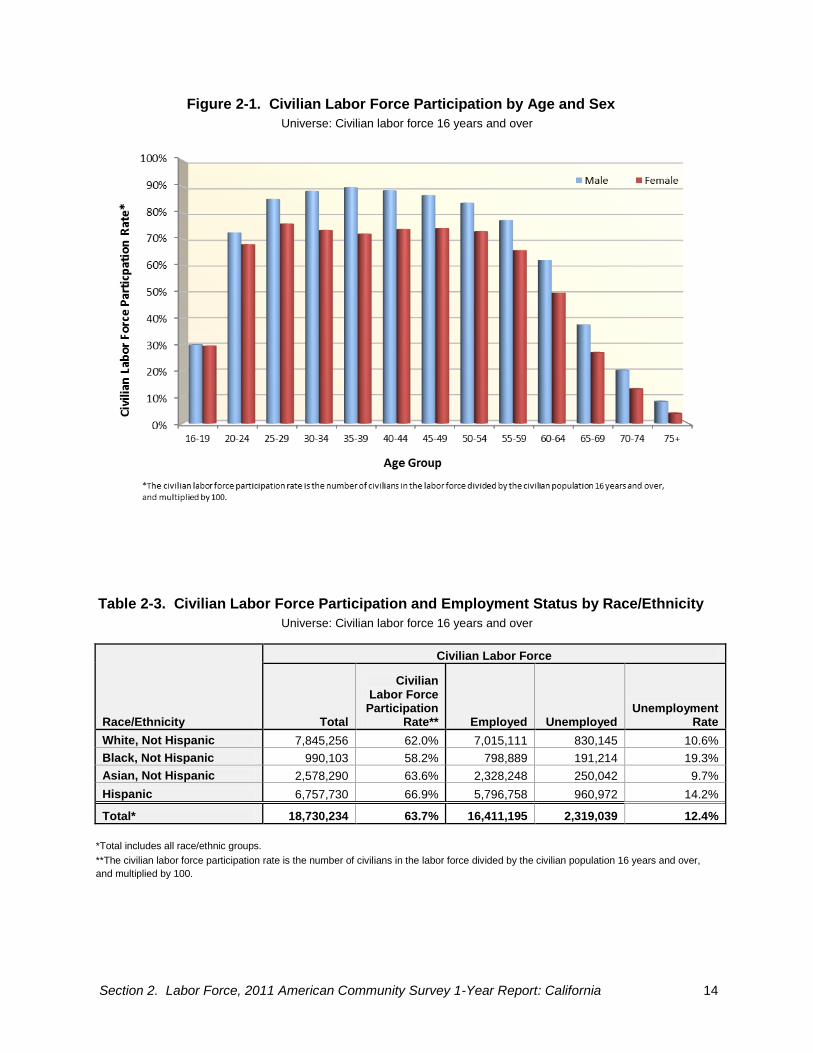
In 2011, 18.7 million Californians were in the civilian labor force, or 63.7 percent of the civilian population age 16 and over (Table 2-1). The civilian labor force was comprised of 54 percent males and 46 percent females. Males were more likely to participate than females across all age groups, as the civilian labor force participation rate was 69.9 percent for men and 57.7 percent for women (Figure 2-1). Persons in the prime working age (25 to 54 years old) had the highest labor force participation rate, 80.4 percent (Table 2-1). The participation rate for persons 16 to 24 years old was significantly lower (52.5 percent), which is largely attributed to school enrollment. For persons 55 years and over, participation rates decreased as age increased and retirement became more likely. This group’s labor force participation rate dropped from 71.3 percent for those 55 to 59 years old to 5.6 percent for those 75 years and over. Among racial-ethnic groups, Hispanics had the highest civilian labor force participation rate (66.9 percent) followed by non-Hispanic Asians (63.6 percent), non-Hispanic Whites (62 percent), and non-Hispanic Blacks (58.2 percent) (Table 2-3). However, when comparing labor force participation rates, the age distribution is an important consideration. Non-Hispanic Whites had a larger proportion of persons ages 65 and over who were likely to have retired and dropped out of the labor force, lowering the overall non-Hispanic White participation rate. By examining only the traditional working ages of 18 to 64 years, the labor force participation rate increased for all racial-ethnic groups and relative rankings changed as well. Non-Hispanic Whites moved from having the third highest participation rate to having the highest (74.1 percent) and Hispanics fell to third rank (71.4 percent) behind non-Hispanic Asians (72.2 percent) (Table 2-4). Non-Hispanic Blacks continued to have the lowest participation rate (64.9 percent). As a whole, the participation rate was 72.1 percent. In 2011, the unemployment rate in California was 12.4 percent (Table 2-3, Figure 2-2). Non-Hispanic Asians had the lowest unemployment rate (9.7 percent), followed by non-Hispanic Whites (10.6 percent). Unemployment rates for Hispanics and non-Hispanic Blacks were significantly higher at 14.2 percent and 19.3 percent respectively. The top major industry group in terms of employment was education and health services, which accounted for 21.1 percent of jobs in California (Table 2-5). Below education and health services were professional and business services (12.6 percent), retail trade (11.2 percent), and manufacturing (10 percent). Full-time year-round workers in the information industry had the highest median earnings ($66,185), followed by public administration ($64,149), and mining ($61,094) (Table 2-6). Those working in agriculture, forestry, fishing, and hunting had the lowest median earnings ($25,456). Across occupations, management, business, and financial services represented the largest share of jobs (14.9 percent) (Table 2-7). Office and administrative support accounted for the second largest share (13.2 percent), followed by sales and related occupations (11.1 percent). Other occupations each represented less than 7 percent of jobs in California. Median earnings for full-time year-round workers were highest for computer, engineering, and science occupations ($83,495), healthcare practitioners and technicians ($76,368), and management, business, and financial services ($71,277) (Table 2-8). Median earnings were lowest for the food preparation and service occupations ($21,179).

Section 2. Labor Force, 2011 American Community Survey 1-Year Report: California 12
About three-quarters of California families (74.3 percent) included one or two workers (Table 2-9). About 14 percent of families did not have any workers and 12 percent had three or more workers. Median family income increased with the number of workers, ranging from $28,103 for families with no workers to $97,751 for families with three or more workers. The state median family income was $65,676. The primary means of transportation to work for workers 16 years and over was a car, truck, or van (84.3 percent) (Table 2-10). Approximately 73 percent of workers drove to work alone and 11 percent carpooled. Public transportation excluding taxicabs was the next most common means of transportation (5.2 percent). Persons who worked at home accounted for 5.4 percent of all workers. Among those commuting to work, the trip took them an average of 27 minutes (Table 2-11).
Table 2-1. Civilian Labor Force Participation by Age and Sex
Universe: Civilian population 16 years and over
Age group
Civilian Population 16
Years and Over
Civilian Labor Force
Total
Civilian Labor Force
Participation Rate* Male
Male Civilian Labor Force
Participation Rate* Female
Female Civilian
Labor Force Participation
Rate*
16-19 2,196,832 651,082 29.6% 339,494 29.9% 311,588 29.4%
20-24 2,822,126 1,985,866 70.4% 1,050,426 72.5% 935,440 68.1%
25-29 2,727,153 2,198,259 80.6% 1,185,645 85.2% 1,012,614 75.9%
30-34 2,620,900 2,122,811 81.0% 1,172,297 88.3% 950,514 73.5%
35-39 2,545,891 2,059,698 80.9% 1,141,421 89.7% 918,277 72.1%
40-44 2,638,751 2,141,493 81.2% 1,169,751 88.5% 971,742 73.8%
45-49 2,639,018 2,123,278 80.5% 1,144,604 86.7% 978,674 74.2%
50-54 2,591,864 2,031,287 78.4% 1,076,557 83.8% 954,730 73.0%
55-59 2,275,885 1,623,349 71.3% 851,884 77.2% 771,465 65.8%
60-64 1,942,288 1,079,789 55.6% 578,195 62.1% 501,594 49.6%
65-69 1,355,741 433,093 31.9% 239,709 37.5% 193,384 27.0%
70-74 1,025,941 167,767 16.4% 94,333 20.2% 73,434 13.1%
75+ 2,016,124 112,462 5.6% 67,158 8.3% 45,304 3.8%
Total 29,398,514 18,730,234 63.7% 10,111,474 69.9% 8,618,760 57.7%
*The civilian labor force participation rate is the number of civilians in the labor force divided by the civilian population 16 years and over, and multiplied by 100.

Section 2. Labor Force, 2011 American Community Survey 1-Year Report: California 13
Table 2-2. Employment Status by Age and Sex
Universe: Civilian labor force 16 years and over
Age Group
Male Civilian Labor Force Female Civilian Labor Force
Employed Unemployed Unemployment
Rate Employed Unemployed Unemployment
Rate
16-19 201,348 138,146 40.7% 206,565 105,023 33.7%
20-24 827,466 222,960 21.2% 771,822 163,618 17.5%
25-29 1,022,841 162,804 13.7% 886,877 125,737 12.4%
30-34 1,045,973 126,324 10.8% 851,768 98,746 10.4%
35-39 1,037,240 104,181 9.1% 820,141 98,136 10.7%
40-44 1,055,980 113,771 9.7% 869,014 102,728 10.6%
45-49 1,032,576 112,028 9.8% 872,896 105,778 10.8%
50-54 969,079 107,478 10.0% 853,546 101,184 10.6%
55-59 765,921 85,963 10.1% 702,482 68,983 8.9%
60-64 512,144 66,051 11.4% 456,323 45,271 9.0%
65-69 216,450 23,259 9.7% 175,012 18,372 9.5%
70-74 85,938 8,395 8.9% 67,767 5,667 7.7%
75+ 62,187 4,971 7.4% 41,839 3,465 7.6%
Total 8,835,143 1,276,331 12.6% 7,576,052 1,042,708 12.1%
-----------Table 2-2. Continued-----------
Age Group
Total Civilian Labor Force
Employed Unemployed Unemployment
Rate
16-19 407,913 243,169 37.3%
20-24 1,599,288 386,578 19.5%
25-29 1,909,718 288,541 13.1%
30-34 1,897,741 225,070 10.6%
35-39 1,857,381 202,317 9.8%
40-44 1,924,994 216,499 10.1%
45-49 1,905,472 217,806 10.3%
50-54 1,822,625 208,662 10.3%
55-59 1,468,403 154,946 9.5%
60-64 968,467 111,322 10.3%
65-69 391,462 41,631 9.6%
70-74 153,705 14,062 8.4%
75+ 104,026 8,436 7.5%
Total 16,411,195 2,319,039 12.4%
Section 2. Labor Force, 2011 American Community Survey 1-Year Report: California 14
Figure 2-1. Civilian Labor Force Participation by Age and Sex
Universe: Civilian labor force 16 years and over
Table 2-3. Civilian Labor Force Participation and Employment Status by Race/Ethnicity
Universe: Civilian labor force 16 years and over
Race/Ethnicity
Civilian Labor Force
Total
Civilian Labor Force
Participation Rate** Employed Unemployed
Unemployment Rate
White, Not Hispanic 7,845,256 62.0% 7,015,111 830,145 10.6%
Black, Not Hispanic 990,103 58.2% 798,889 191,214 19.3%
Asian, Not Hispanic 2,578,290 63.6% 2,328,248 250,042 9.7%
Hispanic 6,757,730 66.9% 5,796,758 960,972 14.2%
Total* 18,730,234 63.7% 16,411,195 2,319,039 12.4%
*Total includes all race/ethnic groups.
**The civilian labor force participation rate is the number of civilians in the labor force divided by the civilian population 16 years and over,
and multiplied by 100.

Section 2. Labor Force, 2011 American Community Survey 1-Year Report: California 15
Figure 2-2. Unemployment by Race/Ethnicity
Universe: Civilian labor force 16 years and over
Table 2-4. Civilian Labor Force Participation by Race/Ethnicity for Persons 16 to 64 Years
Universe: Civilian population 16 to 64 years
Race/Ethnicity
Civilian Population 16 to 64 Years
Total Civilian Labor
Force
Civilian Labor Force
Participation Rate**
White, Not Hispanic 9,966,207 7,381,258 74.1%
Black, Not Hispanic 1,468,220 952,403 64.9%
Asian, Not Hispanic 3,456,957 2,495,674 72.2%
Hispanic 9,304,547 6,642,266 71.4%
Total* 25,000,708 18,016,912 72.1%
*Total includes all race/ethnic groups.
**The civilian labor force participation rate is the number of civilians in the labor force divided by the civilian population 16 years and over,
and multiplied by 100.

Section 2. Labor Force, 2011 American Community Survey 1-Year Report: California 16
Table 2-5. Major Industry Group by Sex
Universe: Civilian employed population 16 years and over
Major Industry Group
Male Female Total
Number Percent Number Percent Number Percent
Agriculture, Forestry, Fishing, and Hunting 272,083 3.1% 87,859 1.2% 359,942 2.2%
Mining 27,588 0.3% 4,623 0.1% 32,211 0.2%
Construction 863,176 9.8% 76,786 1.0% 939,962 5.7%
Manufacturing 1,099,031 12.4% 537,071 7.1% 1,636,102 10.0%
Wholesale Trade 338,914 3.8% 179,546 2.4% 518,460 3.2%
Retail Trade 971,969 11.0% 870,985 11.5% 1,842,954 11.2%
Transportation and Utilities 576,206 6.5% 171,467 2.3% 747,673 4.6%
Information 286,124 3.2% 164,072 2.2% 450,196 2.7%
Financial Activities 477,426 5.4% 562,399 7.4% 1,039,825 6.3%
Professional and Business Services 1,256,596 14.2% 813,952 10.7% 2,070,548 12.6%
Educational and Health Services 986,258 11.2% 2,482,679 32.8% 3,468,937 21.1%
Leisure and Hospitality 824,988 9.3% 784,835 10.4% 1,609,823 9.8%
Other Services 424,903 4.8% 474,411 6.3% 899,314 5.5%
Public Administration* 429,881 4.9% 365,367 4.8% 795,248 4.8%
Total 8,835,143 100.0% 7,576,052 100.0% 16,411,195 100.0% *The industry category, “Public Administration,” is limited to regular government functions such as legislative, judicial, administrative, and regulatory activities. Other government organizations such as public schools, public hospitals, and bus lines are classified by industry according to the activity in which they are engaged.
Table 2-6. Median Earnings (In 2011 Inflation-Adjusted Dollars) by Major Industry Group
Universe: Civilian employed population 16 years and over
Major Industry Group All Workers* Full-Time, Year-Round Workers
Agriculture, Forestry, Fishing, and Hunting $18,125 $25,456
Mining $56,003 $61,094
Construction $32,584 $44,802
Manufacturing $40,729 $50,912
Wholesale Trade $36,147 $42,766
Retail Trade $21,688 $34,620
Transportation and Utilities $40,729 $48,875
Information $52,948 $66,185
Financial Activities $45,821 $50,912
Professional and Business Services $40,729 $56,003
Educational and Health Services $36,657 $48,875
Leisure and Hospitality $17,106 $26,881
Other Services $20,365 $30,547
Public Administration $59,058 $64,149
Total $32,584 $45,821
*Includes both full- and part-time workers. **The industry category, “Public Administration,” is limited to regular government functions such as legislative, judicial, administrative, and regulatory activities. Other government organizations such as public schools, public hospitals, and bus lines are classified by industry according to the activity in which they are engaged.

Section 2. Labor Force, 2011 American Community Survey 1-Year Report: California 17
Table 2-7. Major Occupation Group by Sex
Universe: Civilian employed population 16 years and over
Major Occupation Group
Male Female Total
Number Percent Number Percent Number Percent
Management, Business, and Financial 1,318,088 14.9% 1,122,815 14.8% 2,440,903 14.9%
Computer, Engineering, and Science 744,182 8.4% 252,880 3.3% 997,062 6.1%
Education 268,040 3.0% 632,643 8.4% 900,683 5.5%
Legal, Community Service, Arts, and Media 455,562 5.2% 439,425 5.8% 894,987 5.5%
Healthcare Practitioners and Technicians 238,610 2.7% 542,088 7.2% 780,698 4.8%
Healthcare Support 63,971 0.7% 289,444 3.8% 353,415 2.2%
Protective Service 296,878 3.4% 70,397 0.9% 367,275 2.2%
Food Preparation and Service 456,197 5.2% 433,523 5.7% 889,720 5.4%
Building and Grounds Cleaning and Maintenance 456,277 5.2% 295,265 3.9% 751,542 4.6%
Personal Care and Service 170,894 1.9% 566,869 7.5% 737,763 4.5%
Sales and Related 919,368 10.4% 904,891 11.9% 1,824,259 11.1%
Office and Administrative Support 667,325 7.6% 1,496,767 19.8% 2,164,092 13.2%
Farming, Fishing and Forestry 211,929 2.4% 69,679 0.9% 281,608 1.7%
Construction and Extraction 729,715 8.3% 16,909 0.2% 746,624 4.5%
Installation, Maintenance, and Repair 469,479 5.3% 18,258 0.2% 487,737 3.0%
Production 587,738 6.7% 273,429 3.6% 861,167 5.2%
Transportation and Material Moving 780,890 8.8% 150,770 2.0% 931,660 5.7%
Total 8,835,143 100.0% 7,576,052 100.0% 16,411,195 100.0%
Table 2-8. Median Earnings (In 2011 Inflation-Adjusted Dollars) by Major Occupation Group
Universe: Civilian employed population 16 years and over
Major Occupation Group All Workers* Full-Time, Year-Round Workers
Management, Business, and Financial $63,131 $71,277
Computer, Engineering, and Science $77,386 $83,495
Education $36,657 $59,058
Legal, Community Service, Arts, and Media $47,857 $61,094
Healthcare Practitioners and Technicians $68,222 $76,368
Healthcare Support $24,132 $30,547
Protective Service $50,912 $69,240
Food Preparation and Service $14,663 $21,179
Building and Grounds Cleaning and Maintenance $17,819 $24,947
Personal Care and Service $14,255 $24,438
Sales and Related $25,456 $40,729
Office and Administrative Support $30,547 $38,693
Farming, Fishing and Forestry $15,274 $21,383
Construction and Extraction $30,547 $40,729
Installation, Maintenance, and Repair $36,657 $42,766
Production $25,456 $30,547
Transportation and Material Moving $24,438 $31,565
Total $32,584 $45,821
*Includes both full- and part-time workers.

Section 2. Labor Force, 2011 American Community Survey 1-Year Report: California 18
Table 2-9. Families by Number of Workers and Median Family Income
(In 2011 Inflation-Adjusted Dollars)
Universe: Families
Number of Workers* Families Percent
Median Family
Income
Zero 1,156,663 13.6% $28,103
One 2,988,552 35.1% $47,348
Two 3,343,089 39.2% $88,587
Three or More 1,032,442 12.1% $97,751
Total 8,520,746 100.0% $65,676 *Workers are persons age 16 and over who worked for pay or profit (including paid vacation and paid sick leave) or worked without pay on a family farm or in a family business for 1 or more weeks in the past 12 months. Weeks of active service in the Armed Forces are also considered as weeks worked.
Table 2-10. Means of Transportation to Work
Universe: Workers 16 years and over
Means of Transportation Number Percent
Car, Truck, or Van 13,515,802 84.3%
Drove Alone 11,745,734 73.3%
Carpooled 1,770,068 11.0%
2-Person Carpool 1,343,771 8.4%
3-or-more Person Carpool 426,297 2.7%
Public Transportation (Excluding Taxicab) 832,336 5.2%
Bicycle 172,917 1.1%
Walked 453,027 2.8%
Taxicab, Motorcycle, or Other Means 200,503 1.3%
Worked at Home 860,071 5.4%
Total 16,034,656 100.0%
Table 2-11. Travel Time to Work
Universe: Workers 16 years and over who did not work at home
Travel Time (In Minutes) Number Percent
Less than 15 3,709,693 24.4%
15 to 29 5,457,309 36.0%
30 to 44 3,248,450 21.4%
45 to 59 1,232,443 8.1%
60 to 89 1,054,544 6.9%
90+ 472,146 3.1%
Total Workers 15,174,585 100.0%
Mean Travel Time 27.2

Section 3. Income, 2011 American Community Survey 1-Year Report: California 19
SECTION 3. INCOME
In 2011, California’s median family income was $65,676 (Table 3-1). Median family income was above the state median for non-Hispanic Whites ($84,921) and non-Hispanic Asians ($81,459), and below for non-Hispanic Blacks ($49,588) and Hispanics ($44,701). By family size, families of four persons had the highest median family income ($74,331); two-person and six-person families had the lowest ($61,603) (Table 3-2). The state median household income was $57,021 (Table 3-1, Figure 3-1). Median household income was highest for households consisting of four persons ($75,757) and households headed by persons ages 45 to 54 ($71,277) (Table 3-3, Table 3-4). Wage or salary income was the most common type, representing a source of income for about three-quarters of households (75.6 percent) (Table 3-5). Median personal income for persons 15 years and over was $25,456 (Table 3-6). Females had a significantly lower median personal income ($20,772) than males ($30,547). Forty-one percent of females were in the bottom three income brackets (no income, loss of income, and $1 to $9,999); only 28.7 percent of males were in these brackets (Figure 3-2). On the high end of the income range, $100,000 or more, the proportion of males (10.5 percent) was more than double the proportion of females (4.3 percent). For persons 65 years and over with income, median personal income was $19,856 (Table 3-7). Median personal income for males ($28,511) was greater than that of females ($15,274). The most common sources of income were: Social Security, received by 84.6 percent of persons age 65 and over with income; retirement, survivor, or disability income, 35.3 percent; interest, dividends, or net rental income, 28 percent; and wage or salary, 15.6 percent.
Table 3-1. Family Income by Race/Ethnicity of Householder and Household Income
Universe: Families and Households
Income
Families by Race/Ethnicity of Householder
White, Not Hispanic Percent
Black, Not Hispanic Percent
Asian, Not Hispanic Percent
Less than $10,000 108,378 2.8% 49,358 10.2% 43,725 3.8%
$10,000 - $19,999 187,800 4.9% 57,210 11.9% 76,945 6.7%
$20,000 - $29,999 229,506 6.0% 49,576 10.3% 75,176 6.6%
$30,000 - $39,999 253,813 6.6% 44,147 9.2% 76,979 6.7%
$40,000 - $49,999 265,634 6.9% 42,697 8.9% 73,333 6.4%
$50,000 - $74,999 628,527 16.4% 82,616 17.1% 184,812 16.2%
$75,000 - $99,999 552,027 14.4% 59,679 12.4% 144,485 12.6%
$100,000 - $149,999 758,049 19.8% 61,421 12.7% 221,876 19.4%
$150,000 - $199,999 365,410 9.5% 20,334 4.2% 115,302 10.1%
$200,000 and over 484,754 12.6% 14,841 3.1% 131,091 11.5%
Total 3,833,898 100.0% 481,879 100.0% 1,143,724 100.0%
Median Income $84,921 $49,588 $81,459
-----------Continued on next page-----------

Section 3. Income, 2011 American Community Survey 1-Year Report: California 20
-----------Table 3-1. Continued-----------
Family Income by Race/Ethnicity of Householder and Household Income
Universe: Families and Households
Income
Families by Race/Ethnicity of Householder Households
Hispanic Percent Total* Percent Number Percent
Less than $10,000 185,555 6.6% 400,765 4.7% 775,304 6.2%
$10,000 - $19,999 354,713 12.5% 695,654 8.2% 1,338,898 10.7%
$20,000 - $29,999 385,459 13.6% 759,985 8.9% 1,235,577 9.9%
$30,000 - $39,999 345,542 12.2% 740,580 8.7% 1,143,541 9.2%
$40,000 - $49,999 301,894 10.7% 702,815 8.2% 1,055,934 8.5%
$50,000 - $74,999 528,021 18.7% 1,460,721 17.1% 2,097,721 16.8%
$75,000 - $99,999 312,673 11.1% 1,102,550 12.9% 1,494,396 12.0%
$100,000 - $149,999 282,279 10.0% 1,360,792 16.0% 1,741,086 14.0%
$150,000 - $199,999 82,823 2.9% 600,964 7.1% 741,934 6.0%
$200,000 and over 48,381 1.7% 695,920 8.2% 844,353 6.8%
Total 2,827,340 100.0% 8,520,746 100.0% 12,468,744 100.0%
Median Income $44,701 $65,676 $57,021
*Total includes all race/ethnic groups.
Table 3-2. Families by Size of Family and Median Family Income (In 2011 Inflation-Adjusted Dollars)
Universe: Families
Family Size
Families
Number Percent Median Income
2 3,304,744 38.8% $61,603
3 1,904,935 22.4% $66,185
4 1,721,696 20.2% $74,331
5 903,580 10.6% $63,131
6 387,751 4.6% $61,603
7+ 298,040 3.5% $67,407
Total 8,520,746 100.0% $65,676

Section 3. Income, 2011 American Community Survey 1-Year Report: California 21
Table 3-3. Households by Size of Household and Median Household Income (In 2011 Inflation-Adjusted Dollars)
Universe: Households
Household Size
Households
Number Percent Median Income
1 3,057,110 24.5% $31,362
2 3,728,747 29.9% $64,658
3 2,048,645 16.4% $68,426
4 1,838,060 14.7% $75,757
5 985,238 7.9% $63,131
6 445,860 3.6% $64,149
7+ 365,084 2.9% $71,073
Total 12,468,744 100.0% $57,021
Table 3-4. Households by Age of Householder and Median Household Income (In 2011 Inflation-Adjusted Dollars)
Universe: Households
Age of Householder
Households
Number Percent Median Income
Under 35 2,432,011 19.5% $48,468
35-44 2,486,086 19.9% $66,185
45-54 2,730,333 21.9% $71,277
55-64 2,279,428 18.3% $67,102
65+ 2,540,886 20.4% $40,729
Total 12,468,744 100.0% $57,021

Section 3. Income, 2011 American Community Survey 1-Year Report: California 22
Figure 3-1. Households by Age of Householder and Median Household Income (In 2011 Inflation-Adjusted Dollars)
Universe: Households
Table 3-5. Households by Selected Types of Income (In 2011 Inflation-Adjusted Dollars)
Universe: Households
Type of Income*
Households
Number Percent Median Income
Wage or Salary 9,426,597 75.6% $58,243
Self Employment 1,683,827 13.5% $19,856
Interest, Dividends, or Net Rental Income 2,557,829 20.5% $3,869
Social Security 3,167,230 25.4% $14,663
Supplemental Security Income (SSI) 772,893 6.2% $9,470
Public Assistance 515,730 4.1% $4,175
Retirement, Survivor, or Disability Income 1,936,594 15.5% $17,106
*Households are counted in more than one income category if they have multiple types of income.

Section 3. Income, 2011 American Community Survey 1-Year Report: California 23
Table 3-6. Personal Income by Sex (In 2011 Inflation-Adjusted Dollars)
Universe: Population 15 years and over
Personal Income
Male Female Total
Number Percent Number Percent Number Percent
No Income 2,190,123 14.7% 3,231,023 21.2% 5,421,146 18.0%
Loss 14,112 0.1% 12,088 0.1% 26,200 0.1%
$1 - $9,999 2,068,705 13.9% 2,989,877 19.7% 5,058,582 16.8%
$10,000 - $19,999 2,344,869 15.8% 2,706,564 17.8% 5,051,433 16.8%
$20,000 - $29,999 1,776,251 12.0% 1,640,422 10.8% 3,416,673 11.4%
$30,000 - $39,999 1,286,273 8.7% 1,166,965 7.7% 2,453,238 8.2%
$40,000 - $49,999 1,005,456 6.8% 866,132 5.7% 1,871,588 6.2%
$50,000 - $74,999 1,695,024 11.4% 1,306,201 8.6% 3,001,225 10.0%
$75,000 - $99,999 915,814 6.2% 630,784 4.1% 1,546,598 5.1%
$100,000 - $149,999 877,435 5.9% 432,322 2.8% 1,309,757 4.4%
$150,000 - $199,999 280,886 1.9% 102,372 0.7% 383,258 1.3%
$200,000 and Over 399,707 2.7% 125,638 0.8% 525,345 1.7%
Total 14,854,655 100.0% 15,210,388 100.0% 30,065,043 100.0%
Median Income* $30,547 $20,772 $25,456
*The median income is based on individuals 15 years and over with income.
Figure 3-2. Personal Income by Sex (In 2011 Inflation-Adjusted Dollars)
Universe: Population 15 years and over

Section 3. Income, 2011 American Community Survey 1-Year Report: California 24
Table 3-7. Selected Types of Income (In 2011 Inflation-Adjusted Dollars) by Sex for the Population 65 Years and Over
Universe: Population 65 years and over with income
Type of Income*
Males 65+ Females 65+
Number Percent Median Income Number Percent
Median Income
All Income Types 1,846,480 100.0% $28,511 2,319,620 100.0% $15,274
Wage or Salary 351,581 19.0% $30,547 296,602 12.8% $20,365
Self Employment 118,624 6.4% $20,365 66,597 2.9% $10,182
Interest, Dividends, or Net Rental Income 602,776 32.6% $7,026 564,768 24.3% $5,091
Social Security 1,563,005 84.6% $14,561 1,960,495 84.5% $10,284
Supplemental Security 139,554 7.6% $7,433 246,450 10.6% $7,331
Retirement, Survivor, or Disability Income 754,465 40.9% $18,837 716,544 30.9% $11,608
-----------Table 3-7. Continued-----------
Type of Income*
Total 65+
Number Percent Median Income
All Income Types 4,166,100 100.0% $19,856
Wage or Salary 648,183 15.6% $25,456
Self Employment 185,221 4.4% $15,274
Interest, Dividends, or Net Rental Income 1,167,544 28.0% $5,906
Social Security 3,523,500 84.6% $12,219
Supplemental Security 386,004 9.3% $7,331
Retirement, Survivor, or Disability Income 1,471,009 35.3% $14,663
*Persons are counted in more than one income category if they have multiple types of income.
Table 3-8. Per Capita Income (In 2011 Inflation-Adjusted Dollars)
Universe: Total Population
Per Capita Income
$27,831

Section 4. Poverty, 2011 American Community Survey 1-Year Report: California 25
SECTION 4. POVERTY
California’s poverty rate in 2011 was 16.6 percent (Table 4-1). Among racial-ethnic groups, non-Hispanic Whites and non-Hispanic Asians had the lowest percentages of persons living below poverty, at 10.1 percent and 12.5 percent respectively. Poverty rates for non-Hispanic Blacks (25 percent) and Hispanics (23.6 percent) were significantly higher. Over half of the Hispanic population (54 percent) and 45.8 percent of non-Hispanic Blacks were living below poverty, or near poverty (between 100 and 199 percent of poverty) (Figure 4-1). In contrast, less than one-quarter of non-Hispanic Whites (23.5 percent) had incomes below 200 percent of the poverty level. Poverty rates varied by age and family type as well (Figure 4-2). The youngest age group experienced the highest poverty rate and the oldest age group had the lowest; 22.9 percent of children under 18 years were living in poverty compared to only 10 percent of persons 65 years and over (Table 4-2). By family type, families headed by females with no husband present had the highest poverty rate (27.6 percent) (Table 4-3). Female-headed families, however, represented only one-fifth (20.2 percent) of families in California. The majority of families were married-couple families (71.1 percent), of which 7.6 percent were living below poverty. Male-headed families with no wife present accounted for 8.8 percent of families and had a poverty rate of 17.1 percent. Across all family types, families with no related children had lower poverty rates than those living with related children. Only 5.5 percent of families with no related children were living below poverty compared to 18.6 percent of families with related children. Related children who lived with both parents had a poverty rate of 14 percent and were less likely to live in poverty than those who lived with their mother only (41.7 percent), father only (28.8 percent), or neither parent (26.4 percent) (Table 4-4).
Table 4-1. Race/Ethnicity by Poverty Status
Universe: Population for whom poverty status is determined
Race/Ethnicity Total
Poverty Level
Below 100%
Poverty Rate
Below 150%
Below 200%
Below 300%
White, Not Hispanic 14,625,052 1,480,627 10.1% 2,460,757 3,444,480 5,378,967
Black, Not Hispanic 2,046,337 511,166 25.0% 740,450 936,542 1,247,617
Asian, Not Hispanic 4,849,558 606,688 12.5% 989,506 1,361,455 2,050,797
Hispanic 14,108,903 3,323,567 23.6% 5,620,734 7,607,962 10,230,738
Total* 36,941,039 6,138,590 16.6% 10,144,015 13,787,105 19,530,959 *Total includes all race/ethnic groups.

Section 4. Poverty, 2011 American Community Survey 1-Year Report: California 26
Figure 4-1. Race/Ethnicity by Poverty Status
Universe: Population for whom poverty status is determined
Table 4-2. Age by Poverty Status
Universe: Population for whom poverty status is determined
Age Group Total
Poverty Level
Below 100%
Poverty Rate
Below 150%
Below 200%
Below 300%
Under 18 9,123,946 2,092,787 22.9% 3,315,756 4,345,925 5,740,601
18-34 9,021,735 1,741,426 19.3% 2,777,077 3,750,832 5,312,566
35-49 7,743,302 1,105,039 14.3% 1,823,757 2,529,551 3,682,854
50-64 6,750,441 770,531 11.4% 1,313,770 1,823,677 2,721,888
65+ 4,301,615 428,807 10.0% 913,655 1,337,120 2,073,050
Total 36,941,039 6,138,590 16.6% 10,144,015 13,787,105 19,530,959

Section 4. Poverty, 2011 American Community Survey 1-Year Report: California 27
Table 4-3. Families by Family Type and Poverty Status
Universe: Families
Family Type
Families
Total Below
Poverty Poverty
Rate
Married-Couple Families 6,054,475 461,097 7.6%
With Related Children 3,008,165 336,375 11.2%
Without Related Children 3,046,310 124,722 4.1%
Male Householder, No Wife Present 748,363 127,764 17.1%
With Related Children 416,840 99,217 23.8%
Without Related Children 331,523 28,547 8.6%
Female Householder, No Husband Present 1,717,908 474,385 27.6%
With Related Children 1,099,339 406,776 37.0%
Without Related Children 618,569 67,609 10.9%
Total Families 8,520,746 1,063,246 12.5%
With Related Children 4,524,344 842,368 18.6%
Without Related Children 3,996,402 220,878 5.5%
Table 4-4. Presence of Parent in Family by Poverty Status for Related Children Under 18 Years
Universe: Household population under 18 years for whom poverty status is determined, excluding householders and spouses/unmarried partners of householders
Presence of Parent Total Below
Poverty Poverty
Rate
Both Parents 5,772,816 809,413 14.0%
Father Only 754,986 217,196 28.8%
Mother Only 2,303,913 959,825 41.7%
Neither 248,353 65,640 26.4%
Unrelated Child 38,947 37,205 95.5%
Total 9,119,015 2,089,279 22.9%

Section 4. Poverty, 2011 American Community Survey 1-Year Report: California 28
Figure 4-2. Poverty Status by Selected Characteristics

Section 5. Educational Attainment, 2011 American Community Survey 1-Year Report: California 29
SECTION 5. EDUCATIONAL ATTAINMENT
In 2011, approximately 81 percent of California’s 24.5 million residents age 25 and over were high school graduates or higher (Table 5-2). Over 30 percent had a Bachelor’s degree or higher and 11.1 percent had a Master’s degree or higher. Non-Hispanic Whites had the largest percentage of persons who were high school graduates or higher (93.9 percent); Hispanics had the lowest percentage (58.5 percent) (Figure 5-1). The median level of educational attainment was highest for non-Hispanic Asians (Associate’s degree), and lowest for Hispanics (high school graduate). The median level of educational attainment for California was one or more years of college, but no degree. Differences in educational attainment by nativity existed as well. Native residents had higher levels of educational attainment than the foreign born population (Table 5-3). Most natives (91.5 percent) had at least a high school diploma and 33.2 percent had a Bachelor’s degree or higher. For the foreign born, these percentages were 63.2 percent and 25.4 percent, respectively. About three-quarters of the foreign born who were naturalized citizens had a high school diploma or higher compared to slightly over half of noncitizens. The proportion of naturalized citizens who had a Bachelor’s degree (33.3 percent) was essentially the same as the proportion of native residents, whereas only 17.4 percent of noncitizens had a Bachelor’s degree. Educational attainment is highly correlated with earnings (Figure 5-2). In 2011, median earnings for full-time, year-round workers age 25 and over were lowest for the group without a high school diploma ($24,438) and increased with each additional level of educational attainment (Table 5-6). However, there was an earnings premium for attaining an advanced degree. The difference in median earnings between each of the three least educated groups was about $11,000, but increased to almost $20,000 with the completion of a Bachelor’s degree. Moreover, this difference increased to $26,000 between having a Bachelor’s Degree ($66,185) and having a Master’s degree or higher ($92,660). In addition, the earnings premium for attaining a Master’s degree or higher varied by race and ethnicity. This premium was substantially higher for non-Hispanic Asians ($41,000), exceeding the next highest premium for non-Hispanic Whites by $18,000. Across all levels of educational attainment except for a Master’s degree or higher, median earnings were highest for non-Hispanic Whites (Table 5-7). Non-Hispanic Asians had the highest median earnings ($101,824) among those with a Master’s degree or higher. At levels of educational attainment below a Bachelor’s degree, non-Hispanic Asians and Hispanics had the lowest median earnings. Hispanics also had the lowest median earnings among the most educated groups (Bachelor’s degree and Master’s degree or higher).

Section 5. Educational Attainment, 2011 American Community Survey 1-Year Report: California 30
Table 5-1. Educational Attainment by Sex
Universe: Population 25 years and over
Educational Attainment
Male Female Total
Number Percent Number Percent Number Percent
Not a High School Graduate 2,281,115 19.1% 2,340,416 18.7% 4,621,531 18.9%
High School Graduate 2,567,538 21.5% 2,579,685 20.6% 5,147,223 21.1%
Some College, No Degree 2,603,123 21.8% 2,792,043 22.3% 5,395,166 22.1%
Associate's Degree 824,551 6.9% 1,046,371 8.4% 1,870,922 7.7%
Bachelor's Degree 2,261,679 18.9% 2,442,647 19.5% 4,704,326 19.2%
Master's Degree 865,663 7.3% 939,807 7.5% 1,805,470 7.4%
Professional or Doctorate Degree 531,345 4.5% 375,736 3.0% 907,081 3.7%
Total 11,935,014 100.0% 12,516,705 100.0% 24,451,719 100.0%
Table 5-2. Educational Attainment by Race/Ethnicity
Universe: Population 25 years and over
Educational Attainment
White, Not Hispanic Black, Not Hispanic Asian, Not Hispanic
Number Percent Number Percent Number Percent
Not a High School Graduate 676,366 6.1% 159,797 11.4% 493,741 14.2%
High School Graduate 2,232,658 20.0% 339,838 24.3% 512,497 14.8%
Some College or Associate's Degree 3,854,122 34.6% 578,483 41.3% 775,277 22.3%
Bachelor's Degree 2,669,820 23.9% 205,542 14.7% 1,103,229 31.8%
Master's Degree or Higher 1,717,326 15.4% 115,901 8.3% 585,596 16.9%
Total 11,150,292 100.0% 1,399,561 100.0% 3,470,340 100.0%
High School Graduate or Higher 10,473,926 93.9% 1,239,764 88.6% 2,976,599 85.8%
Bachelor's Degree or Higher 4,387,146 39.3% 321,443 23.0% 1,688,825 48.7%
Median Level of Educational Attainment** 13.5 13.5 14.0
-----------Table 5-2. Continued-----------
Educational Attainment
Hispanic Total*
Number Percent Number Percent
Not a High School Graduate 3,213,100 41.5% 4,621,531 18.9%
High School Graduate 1,909,319 24.6% 5,147,223 21.1%
Some College or Associate's Degree 1,801,007 23.2% 7,266,088 29.7%
Bachelor's Degree 598,887 7.7% 4,704,326 19.2%
Master's Degree or Higher 226,862 2.9% 2,712,551 11.1%
Total 7,749,175 100.0% 24,451,719 100.0%
High School Graduate or Higher 4,536,075 58.5% 19,830,188 81.1%
Bachelor's Degree or Higher 825,749 10.7% 7,416,877 30.3%
Median Level of Educational Attainment** 12.0 13.5 *Total includes all race/ethnic groups. **A numeric value is assigned to each level of educational attainment. 12=High school graduate; 13.5=One or more years of college credit, but no degree; 14=Associate's degree. NOTE: This number does not represent the years of education completed.

Section 5. Educational Attainment, 2011 American Community Survey 1-Year Report: California 31
Figure 5-1. Educational Attainment by Race/Ethnicity
Universe: Population 25 years and over
Table 5-3. Educational Attainment by Nativity
Universe: Population 25 years and over
Educational Attainment
Native Foreign Born
Total Number Percent Naturalized Percent Noncitizen Percent
Not a High School Graduate 1,319,798 8.5% 1,127,683 24.9% 2,174,050 48.7% 4,621,531
High School Graduate 3,428,654 22.2% 818,860 18.1% 899,709 20.2% 5,147,223
Some College or Associate's Degree 5,587,665 36.1% 1,067,718 23.6% 610,705 13.7% 7,266,088
Bachelor's Degree 3,261,945 21.1% 964,820 21.3% 477,561 10.7% 4,704,326
Master's Degree or Higher 1,873,197 12.1% 540,701 12.0% 298,653 6.7% 2,712,551
Total 15,471,259 100.0% 4,519,782 100.0% 4,460,678 100.0% 24,451,719
High School Graduate or Higher 14,151,461 91.5% 3,392,099 75.1% 2,286,628 51.3% 19,830,188
Bachelor's Degree or Higher 5,135,142 33.2% 1,505,521 33.3% 776,214 17.4% 7,416,877
Median Level of Educational Attainment* 13.5 13.5 12.0 13.5
*A numeric value is assigned to each level of educational attainment. 12=High school graduate; 13.5=One or more years of college credit, but no degree. NOTE: This number does not represent the years of education completed.

Section 5. Educational Attainment, 2011 American Community Survey 1-Year Report: California 32
Table 5-4. High School Diploma or Higher by Age and Sex
Universe: Population 25 years and over
Age Group
Male Female Total
Number Percent
of Age Number Percent
of Age Number Percent
of Age
25-34 2,270,325 82.2% 2,265,697 86.0% 4,536,022 84.0%
35-49 3,118,292 79.3% 3,176,600 81.2% 6,294,892 80.2%
50-64 2,744,331 82.7% 2,876,870 82.4% 5,621,201 82.5%
65+ 1,520,951 79.2% 1,857,122 74.9% 3,378,073 76.8%
Total 9,653,899 80.9% 10,176,289 81.3% 19,830,188 81.1%
Table 5-5. Bachelor's Degree or Higher by Age and Sex
Universe: Population 25 years and over
Age Group
Male Female Total
Number Percent of
Age Number Percent of
Age Number Percent of
Age
25-34 737,690 26.7% 916,032 34.8% 1,653,722 30.6%
35-49 1,186,031 30.2% 1,271,344 32.5% 2,457,375 31.3%
50-64 1,077,050 32.4% 1,037,372 29.7% 2,114,422 31.0%
65+ 657,916 34.3% 533,442 21.5% 1,191,358 27.1%
Total 3,658,687 30.7% 3,758,190 30.0% 7,416,877 30.3%
Table 5-6. Earnings (In 2011 Inflation-Adjusted Dollars) by Educational Attainment
Universe: Full-time, year-round employed population 25 years and over with earnings
Earnings
Not a High School Graduate High School Graduate
Some College or Associate's Degree
Number Percent Number Percent Number Percent
Less than $10,000 40,470 3.4% 39,920 2.2% 48,311 1.7%
$10,000-$24,999 565,792 47.0% 423,959 23.4% 358,608 12.5%
$25,000-$39,999 350,429 29.1% 541,894 29.9% 670,505 23.4%
$40,000-$59,999 168,099 14.0% 450,877 24.9% 791,788 27.6%
$60,000-$79,999 51,569 4.3% 196,384 10.8% 475,717 16.6%
$80,000-$99,999 13,754 1.1% 75,815 4.2% 244,736 8.5%
$100,000 and Over 14,585 1.2% 82,952 4.6% 277,285 9.7%
Total 1,204,698 100.0% 1,811,801 100.0% 2,866,950 100.0%
Median Earnings $24,438 $35,740 $46,839
-----------Continued on next page-----------

Section 5. Educational Attainment, 2011 American Community Survey 1-Year Report: California 33
-----------Table 5-6. Continued-----------
Table 5-6. Earnings (In 2011 Inflation-Adjusted Dollars) by Educational Attainment
Universe: Full-time, year-round employed population 25 years and over with earnings
Earnings
Bachelor's Degree Master's Degree or
Higher Total
Number Percent Number Percent Number Percent
Less than $10,000 21,661 0.9% 11,117 0.8% 161,479 1.7%
$10,000-$24,999 154,720 6.7% 46,913 3.3% 1,549,992 16.1%
$25,000-$39,999 274,403 11.9% 75,584 5.4% 1,912,815 19.9%
$40,000-$59,999 509,116 22.0% 189,376 13.4% 2,109,256 21.9%
$60,000-$79,999 441,177 19.1% 223,567 15.8% 1,388,414 14.4%
$80,000-$99,999 294,769 12.7% 206,942 14.7% 836,016 8.7%
$100,000 and Over 619,259 26.7% 658,444 46.6% 1,652,525 17.2%
Total 2,315,105 100.0% 1,411,943 100.0% 9,610,497 100.0%
Median Earnings $66,185 $92,660 $50,810
Figure 5-2. Earnings (In 2011 Inflation-Adjusted Dollars) by Educational Attainment
Universe: Full-time, year-round employed population 25 years and over with earnings

Section 5. Educational Attainment, 2011 American Community Survey 1-Year Report: California 34
Table 5-7. Median Earnings (In 2011 Inflation-Adjusted Dollars) by Educational Attainment and Race/Ethnicity
Universe: Full-time, year-round employed population 25 years and over with earnings
Educational Attainment White, Not
Hispanic Black, Not
Hispanic Asian, Not
Hispanic Hispanic Total*
Not a High School Graduate $36,657 $30,547 $24,438 $24,438 $24,438
High School Graduate $44,701 $36,657 $30,547 $30,547 $35,740
Some College or Associate's Degree $52,948 $44,802 $40,729 $40,729 $46,839
Bachelor's Degree $76,368 $61,094 $61,094 $56,003 $66,185
Master's Degree or Higher $99,380 $78,404 $101,824 $71,277 $92,660
Total $61,094 $48,875 $53,967 $33,093 $50,810 *Total includes all race/ethnic groups.
Table 5-8. Median Earnings (In 2011 Inflation-Adjusted Dollars) by Educational Attainment and Sex
Universe: Full-time, year-round employed population 25 years and over with earnings
Educational Attainment Male Female Total
Less than High School $24,438 $20,365 $23,419
Some High School $28,511 $24,438 $26,983
High School Graduate $38,693 $32,584 $35,740
Some College, No Degree $50,912 $40,729 $45,821
Associate's Degree $56,003 $45,821 $50,912
Bachelor's Degree $76,368 $60,076 $66,185
Master's Degree $101,824 $75,350 $87,568
Professional Degree $125,141 $91,641 $112,006
Doctorate Degree $118,115 $88,587 $101,824
Total $50,912 $45,821 $50,810
Section 6. Health Insurance, 2011 American Community Survey 1-Year Report: California 35
SECTION 6. HEALTH INSURANCE
Among the civilian noninstitutionalized population in California, 82 percent had health insurance coverage and 18 percent did not have health insurance coverage (Table 6-1). The traditional working age group (18 to 64 years old) represented 87.9 percent of the total uninsured population. The youngest and oldest age groups (children under 18 years and persons 65 years and over) had the lowest rates of uninsured persons at 8 percent and 1.7 percent respectively. Government programs that provide medical and health-related services for specific populations, e.g. Medicaid (called “Medi-Cal” in California) and Medicare, were contributing factors for the relatively low percentages of uninsured persons in these age groups. Approximately 52 percent of persons covered by Medicaid were under 19 years old (Table 6-4) and 86 percent of persons covered by Medicare were 65 years and older (Table 6-5). Hispanics had the highest percentage of uninsured persons (27.8 percent) compared to the other major racial-ethnic groups with uninsured rates of less than 15 percent (Figure 6-1). The non-Hispanic White population had the lowest percentage of uninsured at 10.7 percent. Higher rates of health insurance coverage were associated with higher levels of educational attainment. For the population 25 years and over, there was a 32.9 percent disparity in the uninsured rates between persons with a Master’s degree or higher (5.1 percent) and persons with less than a high school degree (38 percent) (Figure 6-1). U.S. citizens were more likely to have health insurance coverage than non-citizens. Only 13.4 percent of U.S. citizens were uninsured compared to 45.8 percent of non-citizens (Figure 6-1). Of the civilian noninstitutionalized population that had health insurance coverage, 59 percent had a private health plan, 19.7 percent had Medicaid, and 12.7 percent had Medicare (Table 6-2, Figure 6-2).

Section 6. Health Insurance, 2011 American Community Survey 1-Year Report: California 36
Table 6-1. Health Insurance Coverage Status by Selected Characteristics
Universe: Civilian noninstitutionalized population
Characteristic Total Covered Not
Covered
Percent Not
Covered
Civilian Noninstitutionalized Population 37,158,528 30,428,864 6,729,664 18.1%
Age Group
Under 18 9,248,443 8,510,428 738,015 8.0%
18-26 4,969,554 3,410,701 1,558,853 31.4%
27-34 4,163,681 2,904,040 1,259,641 30.3%
35-49 7,725,610 5,868,153 1,857,457 24.0%
50-64 6,749,625 5,509,059 1,240,566 18.4%
65-74 2,360,163 2,304,855 55,308 2.3%
75+ 1,941,452 1,921,628 19,824 1.0%
Sex
Male 18,337,825 14,663,473 3,674,352 20.0%
Female 18,820,703 15,765,391 3,055,312 16.2%
Race/Ethnicity
White, Not Hispanic 14,689,671 13,112,790 1,576,881 10.7%
Black, Not Hispanic 2,057,170 1,751,063 306,107 14.9%
Asian, Not Hispanic 4,888,661 4,169,845 718,816 14.7%
Hispanic 14,198,904 10,255,467 3,943,437 27.8%
Educational Attainment (Persons Age 25+)
Not a High School Graduate 4,500,617 2,789,714 1,710,903 38.0%
High School Graduate 5,031,977 3,770,407 1,261,570 25.1%
Some College or Associate's Degree 7,139,046 5,929,150 1,209,896 16.9%
Bachelor’s Degree 4,675,984 4,182,936 493,048 10.5%
Master’s Degree or Higher 2,694,911 2,557,070 137,841 5.1%
Citizenship
U.S. Citizen 31,763,720 27,503,728 4,259,992 13.4%
Native 27,015,009 23,538,498 3,476,511 12.9%
Naturalized 4,748,711 3,965,230 783,481 16.5%
Not a U.S. Citizen 5,394,808 2,925,136 2,469,672 45.8%
Poverty Status
Below Poverty 6,137,196 4,339,503 1,797,693 29.3%
At or Above Poverty 30,725,631 25,815,438 4,910,193 16.0%

Section 6. Health Insurance, 2011 American Community Survey 1-Year Report: California 37
Figure 6-1. Percent Uninsured by Selected Characteristics
Table 6-2. Health Insurance Coverage by Type
Universe: Civilian noninstitutionalized population
Health Plan Type* Covered
Percent of Civilian Noninstitutionalized
Population
Private 21,939,923 59.0%
Medicaid (“Medi-Cal”) 7,325,496 19.7%
Medicare 4,725,748 12.7%
TRICARE, VA, or Other Military 1,080,517 2.9%
*Persons are counted in more than one health plan type if they have multiple types of health insurance coverage.

Section 6. Health Insurance, 2011 American Community Survey 1-Year Report: California 38
Figure 6-2. Health Insurance Coverage by Type
Universe: Civilian noninstitutionalized population
Table 6-3. Private Health Insurance Coverage by Age
Universe: Civilian noninstitutionalized population
Age Group Total Covered Percent
Covered
Under 18 9,248,443 4,995,417 54.0%
18-26 4,969,554 2,695,775 54.2%
27-34 4,163,681 2,399,709 57.6%
35-49 7,725,610 5,027,671 65.1%
50-64 6,749,625 4,612,083 68.3%
65-74 2,360,163 1,217,297 51.6%
75+ 1,941,452 991,971 51.1%
Total 37,158,528 21,939,923 59.0%

Section 6. Health Insurance, 2011 American Community Survey 1-Year Report: California 39
Table 6-4. Medicaid (“Medi-Cal”) Coverage by Age
Universe: Civilian noninstitutionalized population
Age Group Total Covered Percent
Covered
Under 19 9,824,871 3,819,742 38.9%
19-26 4,393,126 543,732 12.4%
27-34 4,163,681 495,802 11.9%
35-49 7,725,610 847,413 11.0%
50-64 6,749,625 756,262 11.2%
65-74 2,360,163 410,585 17.4%
75+ 1,941,452 451,960 23.3%
Total 37,158,528 7,325,496 19.7%
Table 6-5. Medicare Coverage by Age
Universe: Civilian noninstitutionalized population
Age Group Total Covered Percent
Covered
Under 65 32,856,913 646,909 2.0%
65-74 2,360,163 2,184,930 92.6%
75+ 1,941,452 1,893,909 97.6%
Total 37,158,528 4,725,748 12.7%

Section 7. Geographic Mobility, 2011 American Community Survey 1-Year Report: California 40
SECTION 7. GEOGRAPHIC MOBILITY
In 2011, 16.1 percent of Californians 1 year old and over were living in a different residence one year earlier (Table 7-2). The vast majority of the moves (87.7 percent) were within the state, i.e. persons who moved within the same county or moved to a different county in California (Table 7-1). About 8 percent of movers came to California from a different state and 5 percent came from abroad.
As a group, movers were younger than nonmovers. The median age was 28.1 years for movers and 38.2 years for nonmovers (Figure 7-1). Excluding children 1 to 17 years old whose mobility is generally dependent on their families’ decision to move, the propensity to move declined with age. Mobility rates were highest (over 26 percent) for young adults or persons who were between 18 and 34 years old – ages during which one is likely to undergo pivotal life events such as attending college, seeking or changing employment, starting a family, and establishing a household (Table 7-2). For each subsequent age group, mobility rates decreased, falling below 7 percent for persons 65 years and over.
With a mobility rate of almost 20 percent, non-Hispanic Blacks were the racial-ethnic group most likely to have moved. Hispanics were the next most mobile group (16.2 percent). Natives were also more likely to move (16.6 percent) than the foreign born (14.9 percent). For persons 15 years and over, those who were separated were the most mobile (23.9 percent), followed by those who were never married (21.1 percent) and those who were divorced (17.1 percent). Married persons (11.8 percent) and widows (9.6 percent) were significantly less likely to move.
In comparison to the large differences in mobility rates by marital status, differences by educational attainment were small (a maximum difference of 1.4 percent). Persons with the lowest level of educational attainment (not a high school graduate) and the highest level of educational attainment (Master’s Degree or higher) had the lowest mobility rates at 13.8 percent and 13.6 percent respectively. The mobility rate peaked at 15 percent for persons with a Bachelor’s Degree. Unemployment impacted mobility as well. Persons age 16 and over who were unemployed were more likely to move (19.8 percent) than those who were employed (16 percent).
During 2011, California experienced a net domestic outflow or loss of 102,000 people (Table 7-3). Within every household income group except $75,000 to $124,999, more people left California for other states than came to California. However, net outflow was largest in the lowest household income groups (Figure 7-2). Persons with household incomes less than $75,000 comprised 69 percent of movers who left California for other states and 58.8 percent of movers who came to California, resulting in a net loss of 117,000 people in this income group. Persons who left California were also more likely to be living in poverty than those who came to California. The poverty rate for domestic out-migrants was 22.6 percent compared to 18.7 percent for in-migrants (Table 7-3). California had a net outflow of residents for every major racial-ethnic group except for a small net inflow of 677 non-Hispanic Asians. Non-Hispanic Whites represented the largest share of domestic movers both to and from California (interstate migrants), at 58.4 percent and 56.5 percent respectively, followed by Hispanics at 18.5 percent of in-migrants and 21.4 percent of out-migrants.

Section 7. Geographic Mobility, 2011 American Community Survey 1-Year Report: California 41
Interstate migrants who came to California tended to have higher levels of educational attainment than those who left. Persons with a Bachelor’s degree or higher represented a larger share of domestic in-migrants (47.7 percent) than of out-migrants (40.6 percent). One likely attraction for these college-educated individuals is California’s high demand for skilled labor, particularly in the science, technology, engineering and math (STEM) fields. Movers coming to California were primarily from states in the West and South regions (70.7 percent); similarly, most movers from California went to states in the same regions (74.8 percent) (Table 7-4). California had a net outflow of 57,000 people to the West region, and 38,000 people to the South.
Table 7-1. Geographic Mobility in the Past Year by Type of Move
Universe: Population 1 year and over in California who had a change of residence from 1 year ago
Type of Move Number Percent
From Abroad 281,791 4.7%
From a Different State 453,168 7.6%
Within California 5,257,783 87.7%
Total 5,992,742 100.0%
Figure 7-1. Median Age by Geographic Mobility
Universe: Population 1 year and over in California

Section 7. Geographic Mobility, 2011 American Community Survey 1-Year Report: California 42
Table 7-2. Geographic Mobility in the Past Year by Selected Characteristics
Universe: Population 1 year and over in California
Characteristic Total Nonmover Mover Percent Moved
Population 1 Year and Over 37,222,039 31,229,297 5,992,742 16.1%
Age
1-17 8,793,542 7,354,808 1,438,734 16.4%
18-24 3,976,778 2,914,021 1,062,757 26.7%
25-34 5,396,858 3,990,787 1,406,071 26.1%
35-49 7,845,620 6,686,203 1,159,417 14.8%
50-64 6,811,435 6,181,391 630,044 9.2%
65-74 2,381,682 2,222,439 159,243 6.7%
75+ 2,016,124 1,879,648 136,476 6.8%
Median Age 35.8 38.2 28.1
Sex
Male 18,513,568 15,462,687 3,050,881 16.5%
Female 18,708,471 15,766,610 2,941,861 15.7%
Race/Ethnicity
White, Not Hispanic 14,790,643 12,517,403 2,273,240 15.4%
Black, Not Hispanic 2,130,378 1,705,875 424,503 19.9%
Asian, Not Hispanic 4,868,991 4,125,450 743,541 15.3%
Hispanic 14,113,187 11,825,953 2,287,234 16.2%
Nativity
Native - Born in California 19,978,336 16,639,490 3,338,846 16.7%
Native - Born Elsewhere 7,024,704 5,893,678 1,131,026 16.1%
Foreign Born 10,218,999 8,696,129 1,522,870 14.9%
Marital Status (Persons Age 15+)
Never Married 10,926,708 8,618,591 2,308,117 21.1%
Married 13,949,898 12,308,723 1,641,175 11.8%
Separated 708,393 538,737 169,656 23.9%
Widowed 1,558,137 1,407,782 150,355 9.6%
Divorced 2,921,907 2,422,662 499,245 17.1%
Educational Attainment (Persons Age 25+)
Not a High School Graduate 4,621,531 3,985,437 636,094 13.8%
High School Graduate 5,147,223 4,417,380 729,843 14.2%
Some College or Associate's Degree 7,266,088 6,215,757 1,050,331 14.5%
Bachelor's Degree 4,704,326 3,998,783 705,543 15.0%
Master's Degree or Higher 2,712,551 2,343,111 369,440 13.6%
Employment Status (Persons Age 16+)
Civilian Labor Force - Employed 16,411,195 13,789,555 2,621,640 16.0%
Civilian Labor Force - Unemployed 2,319,039 1,859,085 459,954 19.8%
Armed Forces 135,526 72,276 63,250 46.7%
Not in the Labor Force 10,668,280 9,115,650 1,552,630 14.6%

Section 7. Geographic Mobility, 2011 American Community Survey 1-Year Report: California 43
Table 7-3. Interstate Geographic Mobility in the Past Year by Selected Characteristics
Universe: Population 1 year and over and Households in the U.S. who moved to or from California 1 year ago
Characteristic
To: California From: California
From: Another State To: Another State
Number Percent Number Percent
Total Movers 453,168 100.0% 555,007 100.0%
Age Group
1-17 77,600 17.1% 93,649 16.9%
18-24 107,997 23.8% 131,225 23.6%
25-34 116,040 25.6% 131,803 23.7%
35-49 75,826 16.7% 99,344 17.9%
50-64 47,757 10.5% 65,809 11.9%
65+ 27,948 6.2% 33,177 6.0%
Sex
Male 241,891 53.4% 290,741 52.4%
Female 211,277 46.6% 264,266 47.6%
Race/Ethnicity
White, Not Hispanic 264,821 58.4% 313,594 56.5%
Black, Not Hispanic 36,080 8.0% 46,838 8.4%
Asian, Not Hispanic 45,863 10.1% 45,186 8.1%
Hispanic 83,937 18.5% 118,775 21.4%
Nativity
Native 381,415 84.2% 471,924 85.0%
Foreign born 71,753 15.8% 83,083 15.0%
Household Income
Less than $20,000 108,827 24.0% 155,219 28.0%
$20,000 - $49,999 98,269 21.7% 138,390 24.9%
$50,000 - $74,999 59,501 13.1% 89,573 16.1%
$75,000 - $124,999 112,992 24.9% 89,523 16.1%
$125,000 - $199,999 46,174 10.2% 47,739 8.6%
$200,000+ 27,405 6.0% 34,563 6.2%
Poverty Status (Persons for whom Poverty Status is Determined) 411,914 100.0% 485,275 100.0%
Below Poverty 76,861 18.7% 109,853 22.6%
At or Above Poverty 335,053 81.3% 375,422 77.4%
Marital Status (Persons Age 15+) 387,989 100.0% 475,099 100.0%
Never Married 194,827 50.2% 232,622 49.0%
Married 134,347 34.6% 168,487 35.5%
Separated, Widowed, or Divorced 58,815 15.2% 73,990 15.6%
-----------Continued on next page-----------

Section 7. Geographic Mobility, 2011 American Community Survey 1-Year Report: California 44
-----------Table 7-3. Continued-----------
Interstate Geographic Mobility in the Past Year by Selected Characteristics
Universe: Population 1 year and over and Households in the U.S. who moved to or from California 1 year ago
Characteristic
To: California From: California
From: Another State To: Another State
Number Percent Number Percent
Educational Attainment (Persons Age 25+) 267,571 100.0% 330,133 100.0%
Less than a Bachelor's Degree 139,855 52.3% 195,975 59.4%
Bachelor's Degree or Higher 127,716 47.7% 134,158 40.6%
Households* 150,918 100.0% 176,010 100.0%
Family Households 69,070 45.8% 89,674 50.9%
Nonfamily Households 81,848 54.2% 86,336 49.1%
*Mover status for households are based on the householder.
Figure 7-2. Interstate Geographic Mobility in the Past Year by Household Income
Universe: Population 1 year and over in the U.S. who moved to or from California 1 year ago

Section 7. Geographic Mobility, 2011 American Community Survey 1-Year Report: California 45
Table 7-4. Geographic Mobility in the Past Year by U.S. Region of Former Residence
Universe: Population 1 year and over in the U.S. who moved to or from California 1 year ago
U.S. Region
To California From California
From Other States in: To Other States in:
Number Percent Number Percent
Midwest 77,299 17.1% 79,618 14.3%
Northeast 55,528 12.3% 60,437 10.9%
South 141,700 31.3% 179,694 32.4%
West 178,641 39.4% 235,258 42.4%
Total 453,168 100.0% 555,007 100.0%
Section 8. Foreign Born, 2011 American Community Survey 1-Year Report: California 46
SECTION 8. FOREIGN BORN
California is a gateway state for immigrants coming to the United States. In 2011, the foreign-born population accounted for 10.2 million people in California out of a total population of 37.7 million (Table 8-1). The share of foreign-born residents in Californian’s population (27.1 percent) was more than double the share of the United States population (13 percent3). California’s foreign born had a notably different age distribution than the distribution for native residents (Figure 8-1). The foreign born were concentrated in working age groups, with persons ages 40 to 49 years comprising the largest group (21.8 percent). For native residents, the two youngest age groups represented the largest population shares; children under 10 years old constituted 17.8 percent and persons 10 to 19 years old, 17.5 percent. Persons under 20 years old represented 35.3 percent of natives and only 6.5 percent of the foreign-born population. Among racial-ethnic groups, Hispanics made up the greatest share of the foreign born (52.3 percent), followed by non-Hispanic Asians (31.3 percent) (Table 8-2). Half of the foreign born (50.2 percent) were born in Central America and 36.8 percent were born in Asia (Table 8-3, Figure 8-2). Mexico was the top country of birth (41.7 percent) and exceeded the next leading country, the Philippines (8 percent), by over 3.4 million people (Table 8-4). Following the Philippines were China (5 percent) and Vietnam (4.8 percent); these three countries combined accounted for 48.3 percent of the foreign born from Asia. The majority of California’s foreign born (78.3 percent) arrived in the United States since 1980 and 29 percent arrived since 2000 (Table 8-5). Of those who entered the U.S. in 2000 or later, 60 percent arrived from 2000 to 2005, and 40 percent from 2006 to 2011. The noticeable decrease in the number of foreign-born arrivals between the two periods, from 1.8 million in 2000 to 2005, to 1.2 million in 2006 to 2011, exhibits the effects of the employment decline during the Great Recession that began in December 2007. The impact was especially prominent for the foreign born from Mexico, with a 59 percent decrease from 2000 to 2005 (792,000 people) and 2006 to 2011 (324,000 people) (Table 8-6).
3 Of the 311,591,919 people who resided in the United States in 2011, 40,377,860 were foreign born.
Source: 2011 American Community Survey (1-Year), Table DP02 - Selected Social Characteristics.

Section 8. Foreign Born, 2011 American Community Survey 1-Year Report: California 47
Table 8-1. Age by Nativity and Sex
Universe: Total population
Age Group
Native Foreign Born Percent Foreign
Born Male Female Total Male Female Total
Under 10 2,506,557 2,387,876 4,894,433 71,419 74,917 146,336 2.9%
10-19 2,471,716 2,333,885 4,805,601 275,140 245,417 520,557 9.8%
20-29 2,156,040 2,056,180 4,212,220 756,575 662,516 1,419,091 25.2%
30-39 1,557,817 1,482,186 3,040,003 1,066,505 1,088,702 2,155,207 41.5%
40-49 1,552,042 1,509,377 3,061,419 1,099,445 1,128,359 2,227,804 42.1%
50-59 1,565,925 1,589,755 3,155,680 823,152 890,190 1,713,342 35.2%
60-69 1,077,768 1,139,105 2,216,873 493,293 587,988 1,081,281 32.8%
70-79 549,307 622,384 1,171,691 259,805 356,673 616,478 34.5%
80+ 346,883 564,429 911,312 123,818 218,766 342,584 27.3%
Total 13,784,055 13,685,177 27,469,232 4,969,152 5,253,528 10,222,680 27.1%
Figure 8-1. Age by Nativity and Sex
Universe: Total population

Section 8. Foreign Born, 2011 American Community Survey 1-Year Report: California 48
Table 8-2. Race/Ethnicity by Nativity
Universe: Total population
Race/Ethnicity Native
Foreign Born Percent Foreign
Born Naturalized Noncitizen Percent
Noncitizen Total
White, Not Hispanic 13,568,178 862,209 485,329 36.0% 1,347,538 9.0%
Black, Not Hispanic 2,018,358 74,953 59,190 44.1% 134,143 6.2%
Asian, Not Hispanic 1,713,595 2,028,801 1,172,430 36.6% 3,201,231 65.1%
Hispanic 9,008,876 1,709,355 3,640,162 68.0% 5,349,517 37.3%
Total* 27,469,232 4,785,234 5,437,446 53.2% 10,222,680 27.1%
*Total includes all race/ethnic groups.
Table 8-3. World Region of Birth
Universe: Foreign-born population
Region of Birth Number Percent
Africa 164,697 1.6%
Central America 5,127,386 50.2%
North America 115,255 1.1%
South America 237,014 2.3%
Eastern Asia 1,202,101 11.8%
South Central Asia 714,935 7.0%
South Eastern Asia 1,589,845 15.6%
Western Asia (Middle East) 254,445 2.5%
Europe 671,534 6.6%
Other* 145,468 1.4%
Total 10,222,680 100.0%
*Includes the Caribbean, Oceania, other U.S. Island Areas, and at Sea.

Section 8. Foreign Born, 2011 American Community Survey 1-Year Report: California 49
Figure 8-2. World Region of Birth
Universe: Foreign-born population
Table 8-4. Top Five Countries of Birth by Citizenship Status
Universe: Foreign-born population
Country of Birth Naturalized Percent
Naturalized Noncitizen Percent
Noncitizen
Total Foreign
Born
All Countries 4,785,234 46.8% 5,437,446 53.2% 10,222,680
Mexico 1,237,039 29.0% 3,026,365 71.0% 4,263,404
Philippines 550,889 67.2% 269,391 32.8% 820,280
China 303,791 59.9% 203,019 40.1% 506,810
Vietnam 395,538 81.0% 93,034 19.0% 488,572
El Salvador 168,259 39.7% 255,310 60.3% 423,569
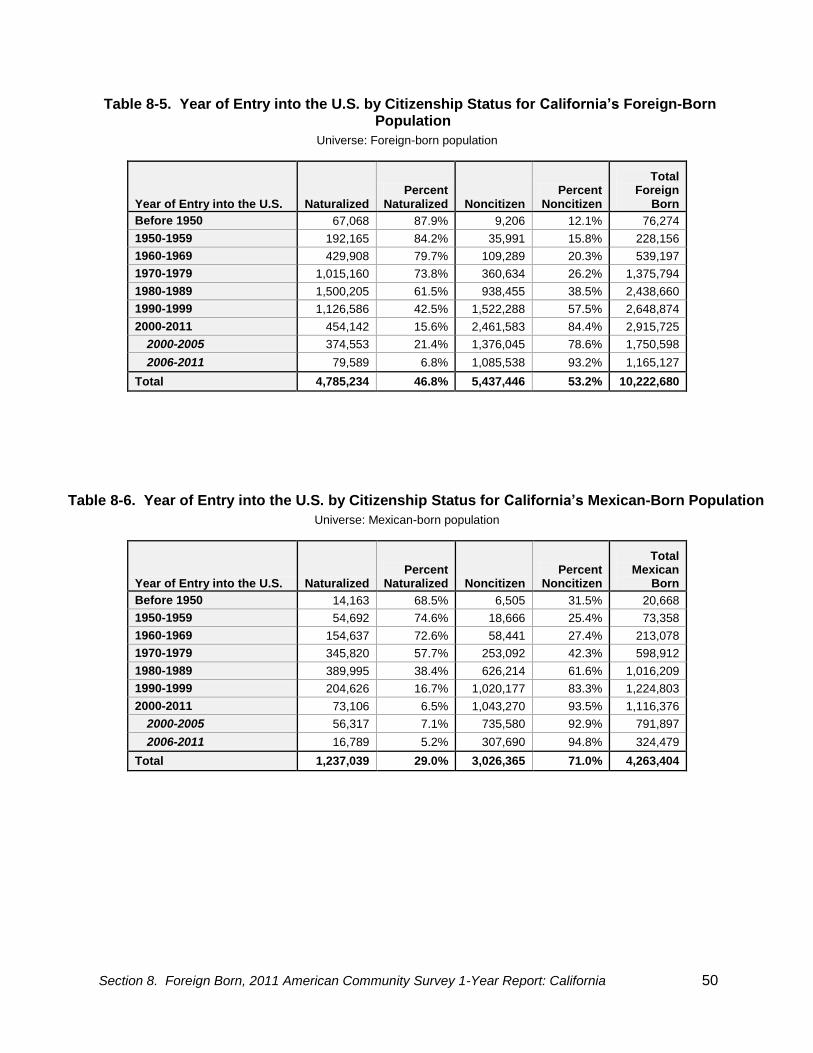
Section 8. Foreign Born, 2011 American Community Survey 1-Year Report: California 50
Table 8-5. Year of Entry into the U.S. by Citizenship Status for California’s Foreign-Born Population
Universe: Foreign-born population
Year of Entry into the U.S. Naturalized Percent
Naturalized Noncitizen Percent
Noncitizen
Total Foreign
Born
Before 1950 67,068 87.9% 9,206 12.1% 76,274
1950-1959 192,165 84.2% 35,991 15.8% 228,156
1960-1969 429,908 79.7% 109,289 20.3% 539,197
1970-1979 1,015,160 73.8% 360,634 26.2% 1,375,794
1980-1989 1,500,205 61.5% 938,455 38.5% 2,438,660
1990-1999 1,126,586 42.5% 1,522,288 57.5% 2,648,874
2000-2011 454,142 15.6% 2,461,583 84.4% 2,915,725
2000-2005 374,553 21.4% 1,376,045 78.6% 1,750,598
2006-2011 79,589 6.8% 1,085,538 93.2% 1,165,127
Total 4,785,234 46.8% 5,437,446 53.2% 10,222,680
Table 8-6. Year of Entry into the U.S. by Citizenship Status for California’s Mexican-Born Population
Universe: Mexican-born population
Year of Entry into the U.S. Naturalized Percent
Naturalized Noncitizen Percent
Noncitizen
Total Mexican
Born
Before 1950 14,163 68.5% 6,505 31.5% 20,668
1950-1959 54,692 74.6% 18,666 25.4% 73,358
1960-1969 154,637 72.6% 58,441 27.4% 213,078
1970-1979 345,820 57.7% 253,092 42.3% 598,912
1980-1989 389,995 38.4% 626,214 61.6% 1,016,209
1990-1999 204,626 16.7% 1,020,177 83.3% 1,224,803
2000-2011 73,106 6.5% 1,043,270 93.5% 1,116,376
2000-2005 56,317 7.1% 735,580 92.9% 791,897
2006-2011 16,789 5.2% 307,690 94.8% 324,479
Total 1,237,039 29.0% 3,026,365 71.0% 4,263,404

Section 9. Language, 2011 American Community Survey 1-Year Report: California 51
SECTION 9. LANGUAGE
Due to a large inflow of immigrants to California, the state is one of the most language-diverse in the nation. In 2011, 43.8 percent (15.4 million) of Californians ages 5 and over spoke a language other than English at home, and 10.9 percent (3.8 million) reported speaking English less than “well” (Table 9-1). Persons 65 years and over had the smallest share of persons who spoke a language other than English at home, 34.5 percent; all other age groups had shares over 44 percent. Among persons who spoke English less than “well,” persons 65 years and over had the largest share (16 percent) and 25 to 64 years olds had the next largest (13.8 percent). The two youngest age groups, 5 to 17 years and 18 to 24 years, had markedly lower shares, at 2.4 percent and 4.5 percent respectively. The majority of the population ages 5 and over who spoke a language other than English at home spoke Spanish (65.7 percent) (Table 9-2). The next most commonly spoken language was Tagalog (5 percent), followed by Chinese (3.8 percent), Vietnamese (3.4 percent), and Korean (2.4 percent). Among these top five languages, those who spoke Tagalog had the lowest share speaking English less than “well” (7.8 percent). The proportion who reported speaking English less than “well” was 27.2 percent for those who spoke Spanish and over 32 percent for the other three language groups. Persons who spoke a language other than English at home were more likely to be living in poverty (20.6 percent) than those who spoke English only (12.4 percent) (Table 9-3). The largest disproportion was for those ages 5 to 17 years and 65 years and over as individuals in these age groups were two times more likely to be in poverty if they spoke a language other than English at home. Educational attainment levels were lower for persons who spoke a language other than English at home (Table 9-4, Figure 9-1). About 35 percent of this group did not graduate from high school, compared to 7.3 percent of those who spoke English only. The percent not graduating from high school was even higher for persons who spoke English less than “well,” at 66.6 percent. Regarding higher levels of education, the share of those with a Bachelor’s degree or higher was 6.3 percent of those who spoke English less than “well”; 23.8 percent of those who spoke a language other than English at home; and 35.2 percent of those who spoke English only.

Section 9. Language, 2011 American Community Survey 1-Year Report: California 52
Table 9-1. Language Spoken at Home and Ability to Speak English by Age
Universe: Population 5 years and over
Age Group Total
Speaks a Language Other than English at Home
Number Percent of Age
Speaks English Less than
“Well” Percent of Age
5-17 6,736,128 3,058,109 45.4% 161,828 2.4%
18-24 3,976,778 1,872,784 47.1% 180,178 4.5%
25-64 20,053,913 8,945,108 44.6% 2,774,311 13.8%
65+ 4,397,806 1,517,026 34.5% 704,671 16.0%
Total 35,164,625 15,393,027 43.8% 3,820,988 10.9%
Table 9-2. Top Ten Languages Spoken at Home Other than English by Ability to Speak English
Universe: Population 5 years and over who speaks a language other than English at home
Language
Speaks a Language Other than English at Home
Number Percent
Speaks English Less than
“Well”
Percent Speaks English Less
than “Well”
All Languages 15,393,027 100.0% 3,820,988 24.8%
Spanish 10,105,866 65.7% 2,753,552 27.2%
Tagalog 763,121 5.0% 59,274 7.8%
Chinese 579,808 3.8% 194,186 33.5%
Vietnamese 526,747 3.4% 173,367 32.9%
Korean 371,273 2.4% 123,299 33.2%
Cantonese 222,565 1.4% 82,584 37.1%
Mandarin 215,708 1.4% 46,212 21.4%
Persian 205,196 1.3% 34,533 16.8%
Armenian 199,503 1.3% 53,966 27.1%
Arabic 157,871 1.0% 27,873 17.7%
Table 9-3. Language Spoken at Home by Age and Poverty Status in the Past 12 Months
Universe: Population 5 years and over for whom poverty status is determined
Age Group
Total Speaks Only English Speaks a Language Other than
English
Number Below
Poverty
Percent Below
Poverty Number Below
Poverty
Percent Below
Poverty Number Below
Poverty
Percent Below
Poverty
5-17 6,638,372 1,469,590 22.1% 3,619,813 545,493 15.1% 3,018,559 924,097 30.6%
18-24 3,723,705 907,652 24.4% 1,929,452 447,033 23.2% 1,794,253 460,619 25.7%
25-64 19,791,773 2,709,344 13.7% 10,936,803 1,201,576 11.0% 8,854,970 1,507,768 17.0%
65+ 4,301,615 428,807 10.0% 2,812,653 204,862 7.3% 1,488,962 223,945 15.0%
Total 34,455,465 5,515,393 16.0% 19,298,721 2,398,964 12.4% 15,156,744 3,116,429 20.6%

Section 9. Language, 2011 American Community Survey 1-Year Report: California 53
Table 9-4. Language Spoken at Home and Ability to Speak English by Educational Attainment
Universe: Population 25 years and over
Educational Attainment Total
Speaks Only English Speaks a Language Other than
English
Number Percent Number Percent
Not a High School Graduate 4,621,531 1,025,748 7.3% 3,595,783 34.4%
High School Graduate 5,147,223 2,992,558 21.4% 2,154,665 20.6%
Some College or Associate's Degree 7,266,088 5,047,145 36.1% 2,218,943 21.2%
Bachelor's Degree or Higher 7,416,877 4,924,134 35.2% 2,492,743 23.8%
Total 24,451,719 13,989,585 100.0% 10,462,134 100.0%
-----------Table 9-4. Continued-----------
Educational Attainment
Speaks a Language Other than English at Home and Speaks
English Less than “Well”
Number Percent
Not a High School Graduate 2,315,303 66.6%
High School Graduate 655,589 18.8%
Some College or Associate's Degree 288,308 8.3%
Bachelor's Degree or Higher 219,782 6.3%
Total 3,478,982 100.0%
Figure 9-1. Language Spoken at Home and Ability to Speak English by Educational Attainment
Universe: Population 25 years and over

Section 10. Disability, 2011 American Community Survey 1-Year Report: California 54
SECTION 10. DISABILITY
In 2011, one in ten Californians reported a disability, excluding those in armed forces and those who were institutionalized (Table 10-1). The likelihood of having a disability increased with age, ranging from 0.8 percent for persons under 5 years old to 52.1 percent for persons 75 years and over. The elderly, or persons 65 years and over, represented the largest age group with a disability (42.2 percent), followed by persons 35 to 64 years old (39.8 percent). Ambulatory and independent living difficulties were the most commonly reported types of disabilities; 5.3 percent of the civilian noninstitutionalized population reported having “serious difficulty walking or climbing stairs” (ambulatory) and 4.1 percent reported having “difficulty doing errands alone such as visiting a doctor’s office or shopping” (independent living) (Table 10-2, Figure 10-1). The likelihood of having a disability also differed by race and ethnicity. Non-Hispanic Blacks and non-Hispanic Whites had the highest proportion who reported a disability, at 15 percent and 12.9 percent respectively (Table 10-3). However, only 7.4 percent of non-Hispanic Asians and 7.5 percent of Hispanics reported having a disability.
Table 10-1. Age by Sex and Disability Status
Universe: Civilian noninstitutionalized population with a disability
Age Group
Male Female Total
With a Disability
Percent of Age
With a Disability
Percent of Age
With a Disability
Percent of Age
Under 5 9,476 0.7% 9,977 0.8% 19,453 0.8%
5-17 167,058 4.8% 97,471 3.0% 264,529 3.9%
18-34 220,823 4.8% 169,127 3.7% 389,950 4.3%
35-64 723,401 10.2% 770,865 10.4% 1,494,266 10.3%
65-74 266,215 24.3% 306,784 24.2% 572,999 24.3%
75+ 388,394 49.0% 623,855 54.3% 1,012,249 52.1%
Total 1,775,367 9.7% 1,978,079 10.5% 3,753,446 10.1%

Section 10. Disability, 2011 American Community Survey 1-Year Report: California 55
Table 10-2. Age by Type of Disability
Universe: Civilian noninstitutionalized population
Age Group
Civilian Noninstitutionalized
Population
Type of Disability
Hearing Difficulty
Percent of Age
Vision Difficulty
Percent of Age
Cognitive Difficulty
Percent of Age
Under 5* 2,526,758 15,134 0.6% 11,912 0.5%
5-17** 6,721,685 35,031 0.5% 49,685 0.7% 188,508 2.8%
18-64 23,608,470 365,088 1.5% 344,751 1.5% 793,504 3.4%
65+ 4,301,615 631,926 14.7% 298,095 6.9% 465,155 10.8%
Total 37,158,528 1,047,179 2.8% 704,443 1.9% 1,447,167 3.9%
-----------Table 10-2. Continued-----------
Age Group
Civilian Noninstitutionalized
Population
Type of Disability
Ambulatory Difficulty
Percent of Age
Self-care Difficulty
Percent of Age
Independent Living
Difficulty Percent of
Age
Under 5* 2,526,758
5-17** 6,721,685 38,702 0.6% 59,722 0.9%
18-64 23,608,470 912,407 3.9% 382,284 1.6% 698,077 3.0%
65+ 4,301,615 1,027,129 23.9% 457,078 10.6% 787,152 18.3%
Total 37,158,528 1,978,238 5.3% 899,084 2.4% 1,512,689 4.1%
*For children under 5 years old, only questions regarding hearing and vision difficulties were asked. **For children between the ages of 5 and 14, only questions regarding hearing, vision, cognitive, ambulatory, and self-care difficulties were asked.

Section 10. Disability, 2011 American Community Survey 1-Year Report: California 56
Figure 10-1. Age by Type of Disability
Universe: Civilian noninstitutionalized population with a disability
Table 10-3. Race/Ethnicity by Disability Status
Universe: Civilian noninstitutionalized population
Race/Ethnicity Total With a
Disability
Percent with a
Disability
White, Not Hispanic 14,689,671 1,890,330 12.9%
Black, Not Hispanic 2,057,170 309,055 15.0%
Asian, Not Hispanic 4,888,661 361,972 7.4%
Hispanic 14,198,904 1,060,159 7.5%
Total* 37,158,528 3,753,446 10.1%
*Total includes all race/ethnic groups.

Section 11. Veterans, 2011 American Community Survey 1-Year Report: California 57
SECTION 11. VETERANS
In 2011, 1.9 million Californians were veterans, representing 6.8 percent of the civilian population 18 years and over (Table 11-1). The majority of these veterans were male (93.1 percent) and were over 34 years old (90.8 percent). The likelihood of having previously served in active duty military service increased with age, increasing from 1.9 percent for those 18 to 34 years old to 23 percent for those 75 years and over. Among civilians, non-Hispanic Whites and non-Hispanic Blacks were more likely to be veterans (over 10 percent) than other racial-ethnic groups (Table 11-2). Only 2.5 percent of non-Hispanic Asians and 2.9 percent of Hispanics were veterans. Regarding the racial composition among veterans in California, the largest group was non-Hispanic Whites (68.6 percent), followed by Hispanics (14.3 percent), non-Hispanic Blacks (9 percent), and non-Hispanic Asians (5.1 percent). Over a third of veterans residing in California in 2011 had served during the Vietnam era (34.7 percent) and a quarter had served during periods between wars or conflicts (peacetime) (Table 11-3). Less than 15 percent of veterans served during each of the other periods: 14.7 percent served during the 1st Gulf War (August 1990 to August 2001); 12.1 percent, Korean War; 11.6 percent, 2nd Gulf War (September 2001 or later); 9.5 percent World War II; and 0.2 percent, pre-World War II. California veterans had a lower poverty rate (7.1 percent) than the state’s overall rate of 16.6 percent (Table 4-1, Table 11-4). The highest poverty rates were experienced by veterans who served during the 2nd Gulf War (September 2001 or later) (9 percent) and by those who served between wars or conflicts (8.3 percent); the lowest were for those who served pre-World War II (3.5 percent) and during the Korean War (4.5 percent).
Table 11-1. Age by Sex and Veteran Status
Universe: Civilian population 18 years and over
Age Group
Male Female Total
Number Veterans Percent
Veterans Number Veterans Percent
Veterans Number Veterans Percent
Veterans
18-34 4,733,345 145,621 3.1% 4,528,123 30,586 0.7% 9,261,468 176,207 1.9%
35-54 5,197,679 386,451 7.4% 5,217,845 54,104 1.0% 10,415,524 440,555 4.2%
55-64 2,034,958 405,810 19.9% 2,183,215 20,733 0.9% 4,218,173 426,543 10.1%
65-74 1,106,066 392,770 35.5% 1,275,616 9,441 0.7% 2,381,682 402,211 16.9%
75+ 813,731 447,134 54.9% 1,202,393 17,476 1.5% 2,016,124 464,610 23.0%
Total 13,885,779 1,777,786 12.8% 14,407,192 132,340 0.9% 28,292,971 1,910,126 6.8%

Section 11. Veterans, 2011 American Community Survey 1-Year Report: California 58
Table 11-2. Race/Ethnicity by Veteran Status
Universe: Civilian population 18 years and over
Race/Ethnicity Total Veterans Percent
Veterans
White, Not Hispanic 12,338,458 1,311,137 10.6%
Black, Not Hispanic 1,634,809 172,472 10.5%
Asian, Not Hispanic 3,935,379 97,970 2.5%
Hispanic 9,545,477 272,728 2.9%
Total* 28,292,971 1,910,126 6.8%
*Total includes all race/ethnic groups.
Table 11-3. Veterans by Period of Service
Universe: Veterans
Period of Service* Total Percent
Total Veterans 1,910,126 100.0%
2nd
Gulf War (9/2001 or Later) 220,935 11.6%
1st
Gulf War (8/1990 to 8/2001) 280,339 14.7%
Vietnam Era 661,887 34.7%
Korean War 230,896 12.1%
World War II 180,957 9.5%
Between Conflicts/Wars 479,502 25.1%
Pre-World War II 3,732 0.2%
*Veterans are counted in more than one period of service if they have served during multiple time periods.
Table 11-4. Veterans by Period of Service and Poverty Status
Universe: Veteran population for whom poverty status is determined
Period of Service* Total Below
Poverty Poverty
Rate
Total Veterans 1,877,550 133,025 7.1%
2nd
Gulf War (9/2001 or Later) 218,374 19,690 9.0%
1st
Gulf War (8/1990 to 8/2001) 276,087 15,531 5.6%
Vietnam Era 653,527 45,581 7.0%
Korean War 227,954 10,261 4.5%
World War II 176,255 10,114 5.7%
Between Conflicts/Wars 468,735 38,766 8.3%
Pre-World War II 3,145 111** 3.5%
*Veterans are counted in more than one period of service if they have served during multiple time periods.
**The Demographic Research Unit of the California Department of Finance considers this estimate unreliable as the relative margin of error is above 50 percent (see Appendix 11).

Section 12. Fertility, 2011 American Community Survey 1-Year Report: California 59
SECTION 12. FERTILITY
In 2011, 519,000 women in California between the ages of 15 and 49 years had a birth in the past 12 months4 (Table 12-1). More than half of these women were ages 25 to 34 years; 26.4 percent were 30 to 34 years old and 24 percent were 25 to 29 years old. Women ages 20 to 24 years comprised the next largest share of those with births (19.2 percent), followed by women ages 35 to 39 years (16 percent). The fertility rate, which is the number of live births per 1,000 women, increased with age from 22 for women 15 to 19 years old to 106 for women 30 to 34 years old. The fertility rate declined after age 34, dropping to 8 for women 45 to 49 years old. Based on these age-specific fertility rates, a woman in California would have on average 1.96 children by the time she lived through the typical childbearing years (ages 15 to 49 years). Of the women who had a birth in the past 12 months, those 15 to 19 years old were more likely to be unmarried than any other age group (87.1 percent) and those 35 to 39 years old were least likely to be unmarried (17.4 percent) (Figure 12-1). Overall, 36.6 percent of women who had a birth in the past 12 months were unmarried. By race and ethnicity, the percentage of unmarried women who had a birth was highest for non-Hispanic Blacks (67.3 percent) and lowest for non-Hispanic Asians (13.3 percent) (Table 12-2). These two racial-ethnic groups, however, comprised the smallest shares of women who had a birth in the past 12 months; 5.5 percent were non-Hispanic Blacks and 13.8 percent were non-Hispanic Asians. Hispanics women were the largest group (47.9 percent) and had the highest fertility rate (65 per 1,000). Non-Hispanic Whites were the second largest group (29.4 percent), but had the lowest fertility rate (48 per 1,000). Among women who had a birth in the past 12 months, 46.6 percent of Hispanics and 25.9 percent of non-Hispanic Whites were not married.
Table 12-1. Women who had a Birth in the Past 12 Months by Marital Status and Age
Universe: Women 15 to 49 years
Age Group Total
Women who had a birth in the past 12 months
Number Percent
Rate per 1,000
Women Percent
Unmarried
15-19 1,313,778 29,304 5.6% 22 87.1%
20-24 1,379,905 99,388 19.2% 72 62.3%
25-29 1,338,791 124,342 24.0% 93 37.3%
30-34 1,296,126 136,817 26.4% 106 21.8%
35-39 1,274,762 83,076 16.0% 65 17.4%
40-44 1,318,537 35,641 6.9% 27 26.3%
45-49 1,319,199 10,267 2.0% 8 25.9%
Total 9,241,098 518,835 100.0% 56 36.6%
4 The ACS interviews respondents throughout the calendar year, asking them whether they had a birth in the 12
months prior to the interview. Therefore, births reported in the 2011 ACS (1-year) data could have occurred as early as January 2010 or as late as December 2011.

Section 12. Fertility, 2011 American Community Survey 1-Year Report: California 60
Figure 12-1. Women who had a Birth in the Past 12 Months by Marital Status and Age
Universe: Women 15 to 49 years
Table 12-2. Women who had a Birth in the Past 12 Months by Marital Status and Race/Ethnicity
Universe: Women 15 to 49 years
Race/Ethnicity Total
Women who had a birth in the past 12 months
Number Percent
Rate per 1,000
Women Percent
Unmarried
White, Not Hispanic 3,200,920 152,290 29.4% 48 25.9%
Black, Not Hispanic 543,952 28,670 5.5% 53 67.3%
Asian, Not Hispanic 1,334,130 71,526 13.8% 54 13.3%
Hispanic 3,826,310 248,733 47.9% 65 46.6%
Total* 9,241,098 518,835 100.0% 56 36.6%
*Total includes all race/ethnic groups.

Appendix 1. General Demographics – Margins of Error 2011 American Community Survey 1-Year Report: California 61
APPENDICES: MARGINS OF ERROR (MOE)
APPENDIX 1. GENERAL DEMOGRAPHICS – MARGINS OF ERROR
Table 1-1. Race/Ethnicity – Margin of Error
Universe: Total Population
Race/Ethnicity Margin of
Error
White, Not Hispanic 11,022
Black, Not Hispanic 15,835
American Indian and Alaska Native, Not Hispanic 6,494
Asian, Not Hispanic 18,302
Native Hawaiian and Other Pacific Islander, Not Hispanic 5,225
Some Other Race, Not Hispanic 12,737
Two or More Races, Not Hispanic 24,611
Hispanic 4,201
Total N/A
Table 1-2. Age by Race/Ethnicity and Sex – Margin of Error
Universe: Total Population
Age Group
White, Not Hispanic Black, Not Hispanic Asian, Not Hispanic
Male Female Total Male Female Total Male Female Total
Under 18 4,174 4,900 3,343 6,796 8,124 9,080 8,397 8,125 10,846
18-24 4,373 3,794 5,607 5,324 4,917 7,166 5,349 5,260 8,075
25-34 4,335 3,832 6,253 6,139 5,080 8,382 6,105 5,662 9,275
35-49 4,753 3,316 6,525 5,730 5,185 7,872 6,183 5,179 7,948
50-64 3,064 2,388 4,077 4,924 4,682 7,103 5,155 4,525 7,571
65-74 1,587 1,473 2,115 2,551 2,485 3,799 2,845 3,158 4,791
75+ 1,764 2,069 2,722 2,143 2,257 3,356 3,020 2,806 4,570
Total 7,999 7,266 11,022 10,060 11,701 15,835 12,773 11,784 18,302
Median Age 0.4 0.3 0.3 0.9 1.0 0.7 0.5 0.5 0.4
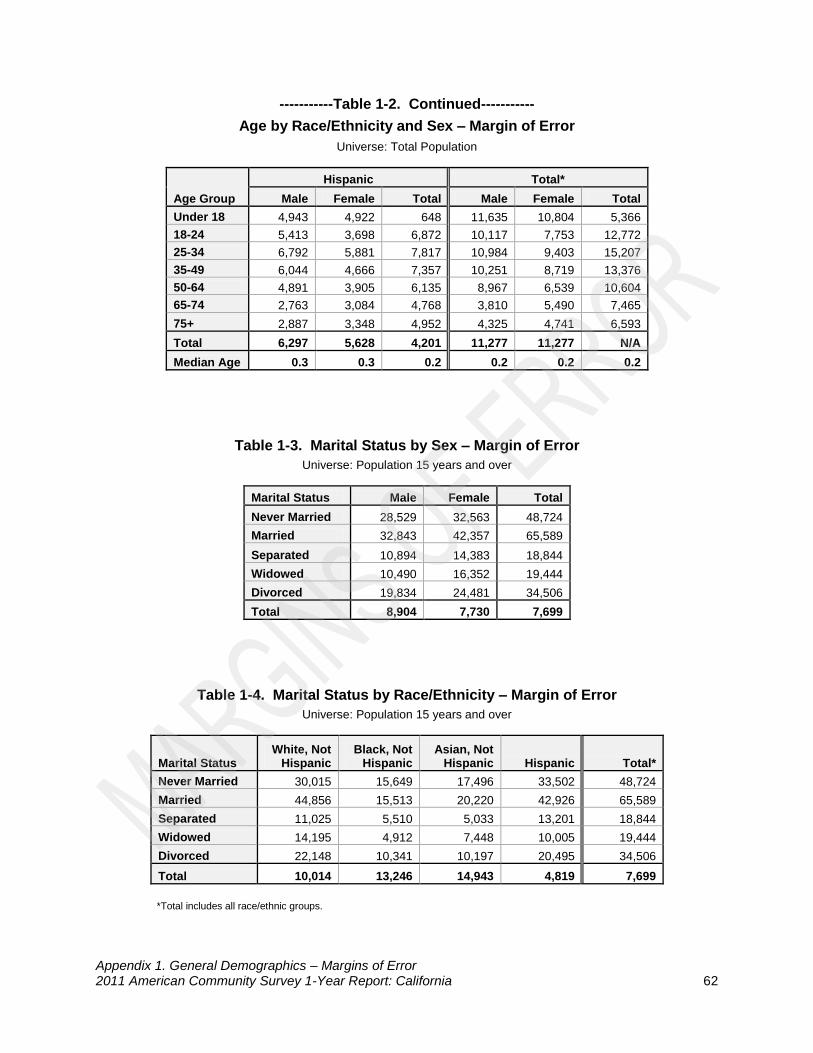
Appendix 1. General Demographics – Margins of Error 2011 American Community Survey 1-Year Report: California 62
-----------Table 1-2. Continued-----------
Age by Race/Ethnicity and Sex – Margin of Error
Universe: Total Population
Age Group
Hispanic Total*
Male Female Total Male Female Total
Under 18 4,943 4,922 648 11,635 10,804 5,366
18-24 5,413 3,698 6,872 10,117 7,753 12,772
25-34 6,792 5,881 7,817 10,984 9,403 15,207
35-49 6,044 4,666 7,357 10,251 8,719 13,376
50-64 4,891 3,905 6,135 8,967 6,539 10,604
65-74 2,763 3,084 4,768 3,810 5,490 7,465
75+ 2,887 3,348 4,952 4,325 4,741 6,593
Total 6,297 5,628 4,201 11,277 11,277 N/A
Median Age 0.3 0.3 0.2 0.2 0.2 0.2
Table 1-3. Marital Status by Sex – Margin of Error
Universe: Population 15 years and over
Marital Status Male Female Total
Never Married 28,529 32,563 48,724
Married 32,843 42,357 65,589
Separated 10,894 14,383 18,844
Widowed 10,490 16,352 19,444
Divorced 19,834 24,481 34,506
Total 8,904 7,730 7,699
Table 1-4. Marital Status by Race/Ethnicity – Margin of Error
Universe: Population 15 years and over
Marital Status White, Not
Hispanic Black, Not
Hispanic Asian, Not
Hispanic Hispanic Total*
Never Married 30,015 15,649 17,496 33,502 48,724
Married 44,856 15,513 20,220 42,926 65,589
Separated 11,025 5,510 5,033 13,201 18,844
Widowed 14,195 4,912 7,448 10,005 19,444
Divorced 22,148 10,341 10,197 20,495 34,506
Total 10,014 13,246 14,943 4,819 7,699
*Total includes all race/ethnic groups.

Appendix 1. General Demographics – Margins of Error 2011 American Community Survey 1-Year Report: California 63
Table 1-5. Household Size by Race/Ethnicity of Householder – Margin of Error
Universe: Households
Household Size White, Not
Hispanic Black, Not
Hispanic Asian, Not
Hispanic Hispanic Total*
1 23,668 11,378 9,831 14,904 25,956
2 20,064 8,970 11,039 17,406 30,885
3 18,076 6,694 8,998 16,327 27,791
4 15,253 5,891 10,474 12,304 24,130
5 10,543 4,634 5,926 14,630 19,754
6+ 7,454 3,761 5,580 12,816 18,119
Total Households 25,392 12,001 16,244 23,361 22,253
Mean Household Size 0.01 0.04 0.03 0.03 0.01
*Total includes all race/ethnic groups.
Table 1-6. Household Size by Sex for the Population 65 Years and Over – Margin of Error
Universe: Household population 65 years and over
Household Size Age 65-
74 years Age 75
and Over Total
1 11,281 11,617 15,868
2 16,570 14,165 22,576
3+ 16,383 12,203 20,292
Total 7,805 7,415 7,620
Table 1-7a. Household Size – Margin of Error
Universe: Household population and Households
Household Size Households Persons
1 25,956 26,046
2 30,885 65,190
3 27,791 81,534
4 24,130 86,019
5 19,754 101,259
6+ 18,119 116,256
Total 22,253 N/A

Appendix 1. General Demographics – Margins of Error 2011 American Community Survey 1-Year Report: California 64
Table 1-7b. Mean Household Size by Tenure – Margin of Error
Universe: Household population and Households
Household Size Total Owner
Occupied Renter
Occupied
Mean 0.01 0.01 0.01
Table 1-8. Household Type by Presence of Related Children – Margin of Error
Universe: Households
Household Type Margin of
Error
Families
Married Couple With Related Children 24,026
Without Related Children 30,967
Male Householder, No Spouse Present
With Related Children 14,301
Without Related Children 11,338
Female Householder, No Spouse Present
With Related Children 23,781
Without Related Children 15,296
One Person, Nonfamily Male 21,144
Female 20,397
2+ Persons, Nonfamily 19,974
Total 22,253
Table 1-9. Presence of Parents in Family for Related Children Under 18 Years – Margin of Error
Universe: Household population under 18 years, excluding householders, and spouses and unmarried partners of householders
Age Group
Related Children
Unrelated Children Total Both Parents Father Only Mother Only No Parent
Under 5 20,670 14,633 16,624 5,640 4,927 6,487
5-9 28,064 12,722 19,287 5,191 4,529 25,540
10-14 23,103 12,381 20,228 5,510 5,362 25,761
15-17 15,547 8,100 14,827 5,238 4,715 5,898
Total 50,368 31,595 46,695 11,257 10,751 6,080

Appendix 1. General Demographics – Margins of Error 2011 American Community Survey 1-Year Report: California 65
Table 1-10. Grandchildren Living with a Grandparent Householder by Grandparent Responsibility and Presence of Parent – Margin of Error
Universe: Grandchildren under 18 years living with grandparent householder
Grandparent Householder Responsibility for Own Grandchildren
Margin of Error
Responsible 14,455
Parent Present 13,440
No Parent Present 7,415
Not Responsible 17,887
Total 18,399

Appendix 2. Labor Force – Margins of Error 2011 American Community Survey 1-Year Report: California 66
APPENDIX 2. LABOR FORCE – MARGINS OF ERROR
Table 2-1. Civilian Labor Force Participation by Age and Sex – Margin of Error
Universe: Civilian population 16 years and over
Age group
Civilian Population 16
Years and Over
Civilian Labor Force
Total Male Female
16-19 20,424 14,327 10,888 10,367
20-24 15,464 17,855 14,065 11,189
25-29 11,809 14,947 10,546 11,814
30-34 11,576 15,996 9,189 11,879
35-39 30,487 28,581 20,100 16,173
40-44 27,255 27,477 19,937 15,705
45-49 10,829 15,395 8,664 11,572
50-54 8,198 14,871 10,034 10,741
55-59 23,073 20,468 12,557 13,225
60-64 21,900 21,692 13,849 12,628
65-69 16,170 9,881 7,224 7,206
70-74 16,350 7,138 4,973 4,949
75+ 6,593 5,788 4,378 4,119
Total 16,062 44,655 27,799 34,381
Table 2-2. Employment Status by Age and Sex – Margin of Error
Universe: Civilian labor force 16 years and over
Age Group
Male Civilian Labor Force Female Civilian Labor Force Total Civilian Labor Force
Employed Unemployed Employed Unemployed Employed Unemployed
16-19 9,830 7,931 9,087 6,591 12,859 10,903
20-24 14,112 9,367 12,259 7,751 18,751 13,097
25-29 11,646 8,888 11,831 7,791 16,621 11,927
30-34 9,202 7,271 12,269 6,698 15,829 10,436
35-39 19,752 6,737 15,972 6,350 27,610 9,227
40-44 20,620 6,259 15,131 7,072 27,300 9,354
45-49 9,560 6,374 11,888 7,501 15,696 10,131
50-54 10,236 6,951 10,769 5,836 15,809 9,079
55-59 13,397 5,319 13,795 4,610 21,345 6,927
60-64 13,279 5,596 12,406 3,434 20,051 6,570
65-69 6,854 3,100 6,782 2,615 9,698 3,699
70-74 4,753 1,321 4,948 1,229 7,070 1,749
75+ 4,153 1,200 3,830 920 5,416 1,422
Total 30,909 22,312 33,283 21,421 44,702 31,724

Appendix 2. Labor Force – Margins of Error 2011 American Community Survey 1-Year Report: California 67
Table 2-3. Civilian Labor Force Participation and Employment Status by Race/Ethnicity – Margin of Error
Universe: Civilian labor force 16 years and over
Race/Ethnicity
Civilian Labor Force
Total Employed Unemployed
White, Not Hispanic 31,923 32,666 17,409
Black, Not Hispanic 17,273 17,128 9,069
Asian, Not Hispanic 19,150 18,281 10,297
Hispanic 29,524 29,720 18,337
Total* 44,655 44,702 31,724
*Total includes all race/ethnic groups.
Table 2-4. Civilian Labor Force Participation by Race/Ethnicity for Persons 16 to 64 Years – Margin of Error
Universe: Civilian population 16 to 64 years
Race/Ethnicity
Civilian Population 16 to 64 Years
Total Civilian Labor
Force
White, Not Hispanic 12,541 29,648
Black, Not Hispanic 14,235 16,680
Asian, Not Hispanic 14,145 19,144
Hispanic 10,156 28,674
Total* 18,104 43,309
*Total includes all race/ethnic groups.

Appendix 2. Labor Force – Margins of Error 2011 American Community Survey 1-Year Report: California 68
Table 2-5. Major Industry Group by Sex – Margin of Error
Universe: Civilian employed population 16 years and over
Major Industry Group Male Female Total
Agriculture, Forestry, Fishing, and Hunting 13,269 5,644 16,571
Mining 4,242 1,417 4,522
Construction 19,600 4,544 20,275
Manufacturing 17,154 13,686 21,756
Wholesale Trade 13,436 8,589 16,953
Retail Trade 24,060 16,985 34,112
Transportation and Utilities 17,301 7,915 19,498
Information 12,163 9,001 15,819
Financial Activities 15,333 16,413 23,470
Professional and Business Services 22,344 17,213 31,094
Educational and Health Services 20,752 31,476 42,398
Leisure and Hospitality 18,376 21,192 29,437
Other Services 13,811 13,819 18,844
Public Administration 12,007 14,500 18,595
Total 30,909 33,283 44,702
Table 2-6. Median Earnings (In 2011 Inflation-Adjusted Dollars) by Major Industry Group – Margin of Error
Universe: Civilian employed population 16 years and over
Major Industry Group All Workers* Full-Time, Year-Round Workers
Agriculture, Forestry, Fishing, and Hunting $651 $984
Mining $7,813 $7,874
Construction $994 $1,458
Manufacturing $1,147 $1,331
Wholesale Trade $1,360 $1,683
Retail Trade $560 $768
Transportation and Utilities $1,315 $1,270
Information $2,090 $2,424
Financial Activities $1,081 $1,503
Professional and Business Services $1,137 $1,265
Educational and Health Services $587 $691
Leisure and Hospitality $363 $616
Other Services $812 $1,078
Public Administration $1,527 $1,451
Total $284 $341
*Includes both full- and part-time workers.

Appendix 2. Labor Force – Margins of Error 2011 American Community Survey 1-Year Report: California 69
Table 2-7. Major Occupation Group by Sex – Margin of Error
Universe: Civilian employed population 16 years and over
Major Occupation Group Male Female Total
Management, Business, and Financial 21,015 19,502 26,195
Computer, Engineering, and Science 16,140 9,419 18,261
Education 10,492 14,567 19,093
Legal, Community Service, Arts, and Media 13,429 12,706 19,260
Healthcare Practitioners and Technicians 10,678 13,550 18,263
Healthcare Support 5,205 12,399 13,253
Protective Service 12,569 5,137 12,936
Food Preparation and Service 16,739 14,537 22,754
Building and Grounds Cleaning and Maintenance 15,120 11,941 19,452
Personal Care and Service 7,166 14,652 16,470
Sales and Related 23,383 19,667 34,014
Office and Administrative Support 16,393 20,692 26,605
Farming, Fishing and Forestry 12,205 5,462 14,984
Construction and Extraction 17,576 2,510 18,083
Installation, Maintenance, and Repair 14,971 3,120 15,816
Production 16,606 11,053 21,300
Transportation and Material Moving 16,727 9,155 19,918
Total 30,909 33,283 44,702
Table 2-8. Median Earnings (In 2011 Inflation-Adjusted Dollars) by Major Occupation Group – Margin of Error
Universe: Civilian employed population 16 years and over
Major Occupation Group All Workers* Full-Time, Year-Round Workers
Management, Business, and Financial $975 $1,201
Computer, Engineering, and Science $1,475 $1,397
Education $1,635 $1,763
Legal, Community Service, Arts, and Media $1,287 $1,772
Healthcare Practitioners and Technicians $1,907 $2,049
Healthcare Support $900 $1,187
Protective Service $4,047 $2,524
Food Preparation and Service $383 $769
Building and Grounds Cleaning and Maintenance $472 $688
Personal Care and Service $526 $863
Sales and Related $693 $956
Office and Administrative Support $497 $483
Farming, Fishing and Forestry $606 $998
Construction and Extraction $1,056 $1,581
Installation, Maintenance, and Repair $1,212 $1,429
Production $640 $966
Transportation and Material Moving $639 $921
Total $284 $341
*Includes both full- and part-time workers.

Appendix 2. Labor Force – Margins of Error 2011 American Community Survey 1-Year Report: California 70
Table 2-9. Families by Number of Workers* and Median Family Income (In 2011 Inflation-Adjusted Dollars) – Margin of Error
Universe: Families
Number of Workers* Families Median Family
Income
Zero 16,126 $803
One 30,719 $712
Two 26,077 $1,045
Three or More 20,721 $1,736
Total 32,838 $631 *Workers are persons age 16 and over who worked for pay or profit (including paid vacation and paid sick leave) or worked without pay on a family farm or in a family business for 1 or more weeks in the past 12 months. Weeks of active service in the Armed Forces are also considered as weeks worked.
Table 2-10. Means of Transportation to Work – Margin of Error
Universe: Workers 16 years and over
Means of Transportation Margin of Error
Car, Truck, or Van 43,612
Drove Alone 52,150
Carpooled 30,827
2-Person Carpool 28,606
3-or-more Person Carpool 15,900
Public Transportation (Excluding Taxicab) 20,365
Bicycle 8,856
Walked 14,142
Taxicab, Motorcycle, or Other Means 11,097
Worked at Home 19,745
Total 43,075
Table 2-11. Travel Time to Work – Margin of Error
Universe: Workers 16 years and over who did not work at home
Travel Time (In Minutes) Margin of Error
Less than 15 38,877
15 to 29 48,214
30 to 44 40,174
45 to 59 24,837
60 to 89 23,434
90+ 18,544
Total Workers 43,373
Mean Travel Time 0.1

Appendix 3. Income – Margins of Error 2011 American Community Survey 1-Year Report: California 71
APPENDIX 3. INCOME – MARGINS OF ERROR
Table 3-1. Family Income by Race/Ethnicity of Householder and Household Income – Margin of Error
Universe: Families and Households
Income
Families by Race/Ethnicity of Householder
Households White, Not
Hispanic Black, Not
Hispanic Asian, Not
Hispanic Hispanic,
Not Hispanic Total*
Less than $10,000 5,995 4,495 3,936 8,304 11,271 15,523
$10,000 - $19,999 9,448 4,845 5,535 11,334 15,783 20,892
$20,000 - $29,999 8,532 5,161 4,740 11,795 16,173 18,564
$30,000 - $39,999 10,675 3,812 5,187 9,715 17,101 18,744
$40,000 - $49,999 9,567 4,244 5,159 9,237 15,827 22,255
$50,000 - $74,999 13,592 5,934 7,823 14,362 22,759 28,941
$75,000 - $99,999 14,818 4,596 8,228 11,366 21,732 22,678
$100,000 - $149,999 16,205 5,227 8,322 10,945 21,643 24,892
$150,000 - $199,999 11,876 2,743 6,300 5,586 13,015 15,777
$200,000 and over 10,830 2,605 6,046 4,424 11,954 13,437
Total 24,228 9,840 13,135 21,768 32,838 22,253
Median Income $1,251 $2,544 $2,585 $820 $757 $549
*Total includes all race/ethnic groups.
Table 3-2. Families by Size of Family and Median Family Income (In 2011 Inflation-Adjusted Dollars) – Margin of Error
Universe: Families
Family Size
Families
Number Median Income
2 33,436 $1,137
3 26,380 $1,635
4 24,319 $1,887
5 19,299 $2,135
6 13,159 $2,861
7+ 9,518 $2,867
Total 32,838 $715

Appendix 3. Income – Margins of Error 2011 American Community Survey 1-Year Report: California 72
Table 3-3. Households by Size of Household and Median Household Income (In 2011 Inflation-Adjusted Dollars) – Margin of Error
Universe: Households
Household Size
Households
Number Median Income
1 25,956 $755
2 30,885 $1,054
3 27,791 $1,519
4 24,130 $1,799
5 19,754 $2,015
6 14,301 $2,544
7+ 10,831 $2,873
Total 22,253 $549
Table 3-4. Households by Age of Householder and Median Household Income (In 2011 Inflation-Adjusted Dollars) – Margin of Error
Universe: Households
Age of Householder
Households
Number Median Income
Under 35 26,616 $811
35-44 21,269 $1,227
45-54 16,820 $1,211
55-64 17,237 $1,301
65+ 15,767 $843
Total 22,253 $485

Appendix 3. Income – Margins of Error 2011 American Community Survey 1-Year Report: California 73
Table 3-5. Households by Selected Types of Income (In 2011 Inflation-Adjusted Dollars) – Margin of Error
Universe: Households
Type of Income*
Households
Number Median Income
Wage or Salary 30,843 $746
Self Employment 24,356 $702
Interest, Dividends, or Net Rental Income 23,966 $80
Social Security 21,164 $151
Supplemental Security Income (SSI) 15,886 $201
Public Assistance 14,935 $161
Retirement, Survivor, or Disability Income 22,845 $510
*Households are counted in more than one income category if they have multiple types of income.
Table 3-6. Personal Income by Sex (In 2011 Inflation-Adjusted Dollars) – Margin of Error
Universe: Population 15 years and over
Personal Income Male Female Total
No Income 28,508 29,411 43,265
Loss 2,117 1,849 2,832
$1 - $9,999 30,044 30,589 40,540
$10,000 - $19,999 29,218 30,084 41,084
$20,000 - $29,999 25,617 22,575 37,399
$30,000 - $39,999 22,462 22,077 33,778
$40,000 - $49,999 19,968 21,769 29,666
$50,000 - $74,999 23,348 22,067 35,647
$75,000 - $99,999 19,756 14,837 27,699
$100,000 - $149,999 17,715 11,768 20,793
$150,000 - $199,999 10,381 6,643 12,404
$200,000 and Over 10,598 6,267 12,286
Total 8,904 7,730 7,699
Median Income* $362 $276 $190
*The median income is based on individuals 15 years and over with income.

Appendix 3. Income – Margins of Error 2011 American Community Survey 1-Year Report: California 74
Table 3-7. Selected Types of Income (In 2011 Inflation-Adjusted Dollars) by Sex for the Population 65 Years and Over – Margin of Error
Universe: Population 65 years and over with income
Type of Income*
Males 65+ Females 65+ Total 65+
Number Median Income Number
Median Income Number
Median Income
All Income Types 7,067 $744 9,116 $371 12,725 $317
Wage or Salary 8,733 $2,882 9,363 $1,794 12,828 $1,733
Self Employment 5,488 $2,814 4,396 $2,100 7,964 $2,306
Interest, Dividends, or Net Rental Income 10,009 $684 10,273 $562 15,310 $473
Social Security 10,545 $201 13,724 $154 17,973 $123
Supplemental Security 6,372 $381 9,882 $305 12,979 $238
Retirement, Survivor, or Disability Income 13,027 $762 13,366 $505 19,210 $407
*Persons are counted in more than one income category if they have multiple types of income.
Table 3-8. Per Capita Income (In 2011 Inflation-Adjusted Dollars) – Margin of Error
Universe: Total Population
Per Capita Income
$114

Appendix 4. Poverty – Margins of Error 2011 American Community Survey 1-Year Report: California 75
APPENDIX 4. POVERTY – MARGINS OF ERROR
Table 4-1. Race/Ethnicity by Poverty Status – Margin of Error
Universe: Population for whom poverty status is determined
Race/Ethnicity Total
Poverty Level
Below 100%
Below 150%
Below 200%
Below 300%
White, Not Hispanic 11,605 35,765 46,902 53,992 65,736
Black, Not Hispanic 16,651 20,311 23,934 22,845 21,302
Asian, Not Hispanic 18,802 23,952 33,038 40,061 40,450
Hispanic 9,792 59,369 72,826 83,506 75,828
Total* 10,225 82,763 105,136 114,673 104,964 *Total includes all race/ethnic groups.
Table 4-2. Age by Poverty Status – Margin of Error
Universe: Population for whom poverty status is determined
Age Group Total
Poverty Level
Below 100%
Below 150%
Below 200%
Below 300%
Under 18 11,586 37,734 43,464 45,316 41,168
18-34 12,857 32,329 38,504 42,300 41,126
35-49 12,728 25,562 29,997 31,983 35,997
50-64 10,533 20,443 25,412 27,998 29,181
65+ 7,577 11,741 19,130 18,823 18,789
Total 10,225 82,763 105,136 114,673 104,964

Appendix 4. Poverty – Margins of Error 2011 American Community Survey 1-Year Report: California 76
Table 4-3. Families by Family Type and Poverty Status – Margin of Error
Universe: Families
Family Type
Families
Total Below
Poverty
Married-Couple Families 36,152 13,902
With Related Children 24,026 11,738
Without Related Children 30,967 6,158
Male Householder, No Wife Present 17,361 7,411
With Related Children 14,301 6,311
Without Related Children 11,338 3,444
Female Householder, No Husband Present 26,674 15,124
With Related Children 23,781 14,131
Without Related Children 15,296 5,822
Total Families 32,838 19,371
With Related Children 24,993 15,631
Without Related Children 33,139 9,366
Table 4-4. Presence of Parent in Family by Poverty Status for Related Children Under 18 Years – Margin of Error
Universe: Household population under 18 years for whom poverty status is determined, excluding householders and spouses/unmarried partners of householders
Presence of Parents Total Below
Poverty
Both Parents 50,368 30,820
Father Only 31,595 17,435
Mother Only 46,695 34,387
Neither 11,257 5,781
Unrelated Child 4,715 4,588
Total 11,952 37,792

Appendix 5. Educational Attainment – Margins of Error 2011 American Community Survey 1-Year Report: California 77
APPENDIX 5. EDUCATIONAL ATTAINMENT – MARGINS OF ERROR
Table 5-1. Educational Attainment by Sex – Margin of Error
Universe: Population 25 years and over
Educational Attainment Male Female Total
Not a High School Graduate 23,493 22,855 40,142
High School Graduate 35,182 27,963 46,888
Some College, No Degree 30,414 28,500 41,539
Associate's Degree 18,495 20,586 29,875
Bachelor's Degree 28,440 26,647 43,268
Master's Degree 17,190 18,190 26,596
Professional or Doctorate Degree 16,107 12,280 21,891
Total 12,167 9,391 13,529
Table 5-2. Educational Attainment by Race/Ethnicity – Margin of Error
Universe: Population 25 years and over
Educational Attainment White, Not
Hispanic Black, Not
Hispanic Asian, Not
Hispanic Hispanic Total*
Not a High School Graduate 17,775 7,353 14,828 36,930 40,142
High School Graduate 28,072 11,821 16,854 24,889 46,888
Some College or Associate's Degree 28,404 14,081 17,107 28,219 41,990
Bachelor's Degree 27,941 10,436 19,261 20,352 43,268
Master's Degree or Higher 27,823 7,909 18,341 10,887 35,423
Total 8,318 13,615 11,740 7,396 13,529
High School Graduate or Higher 19,893 14,314 16,849 36,922 39,164
Bachelor's Degree or Higher 39,658 11,007 22,368 23,407 53,613

Appendix 5. Educational Attainment – Margins of Error 2011 American Community Survey 1-Year Report: California 78
Table 5-3. Educational Attainment by Nativity – Margin of Error
Universe: Population 25 years and over
Educational Attainment Native
Foreign Born
Total Naturalized Noncitizen
Not a High School Graduate 26,812 20,722 36,381 40,142
High School Graduate 40,012 18,405 23,597 46,888
Some College or Associate's Degree 38,803 22,448 15,703 41,990
Bachelor's Degree 34,884 20,247 17,232 43,268
Master's Degree or Higher 30,155 15,431 13,160 35,423
Total 50,786 41,271 45,060 13,529
High School Graduate or Higher 48,378 35,076 36,806 39,164
Bachelor's Degree or Higher 48,677 22,950 22,983 53,613
Table 5-4. High School Diploma or Higher by Age and Sex – Margin of Error
Universe: Population 25 years and over
Age Group Male Female Total
25-34 15,232 12,991 20,907
35-49 20,499 15,730 28,839
50-64 14,151 13,927 22,202
65+ 9,206 11,971 17,395
Total 23,336 23,630 39,164
Table 5-5. Bachelor's Degree or Higher by Age and Sex – Margin of Error
Universe: Population 25 years and over
Age Group Male Female Total
25-34 16,165 15,379 22,968
35-49 18,726 18,373 28,017
50-64 17,030 17,615 26,353
65+ 12,194 12,994 20,630
Total 35,899 30,238 53,613

Appendix 5. Educational Attainment – Margins of Error 2011 American Community Survey 1-Year Report: California 79
Table 5-6. Earnings (In 2011 Inflation-Adjusted Dollars) by Educational Attainment – Margin of Error
Universe: Full-time, year-round employed population 25 years and over with earnings
Earnings
Not a High
School Graduate
High School
Graduate
Some College or
Associate's Degree
Bachelor's Degree
Master's Degree or
Higher Total
Less than $10,000 4,563 4,442 4,882 2,803 2,150 8,781
$10,000-$24,999 16,016 14,864 12,289 9,195 4,489 27,357
$25,000-$39,999 14,155 14,642 20,159 11,995 5,561 29,998
$40,000-$59,999 7,547 12,131 19,175 14,815 10,140 25,636
$60,000-$79,999 4,767 11,442 14,716 13,921 9,921 24,774
$80,000-$99,999 2,122 5,587 10,877 10,890 8,735 18,473
$100,000 and Over 2,819 5,502 10,144 15,602 13,994 21,235
Total 23,458 28,055 33,924 32,435 25,129 46,718
Median Earnings $392 $489 $493 $852 $1,587 $407
Table 5-7. Median Earnings (In 2011 Inflation-Adjusted Dollars) by Educational Attainment and Race/Ethnicity – Margin of Error
Universe: Full-time, year-round employed population 25 years and over with earnings
Educational Attainment
White, Not
Hispanic Black, Not
Hispanic
Asian, Not
Hispanic Hispanic Total*
Not a High School Graduate $2,139 $4,837 $1,600 $411 $392
High School Graduate $996 $2,107 $1,516 $666 $489
Some College or Associate's Degree $904 $1,410 $1,393 $813 $493
Bachelor's Degree $1,315 $3,926 $1,701 $1,839 $852
Master's Degree or Higher $2,112 $6,276 $2,446 $3,855 $1,587
Total $676 $1,230 $1,078 $410 $407 *Total includes all race/ethnic groups.
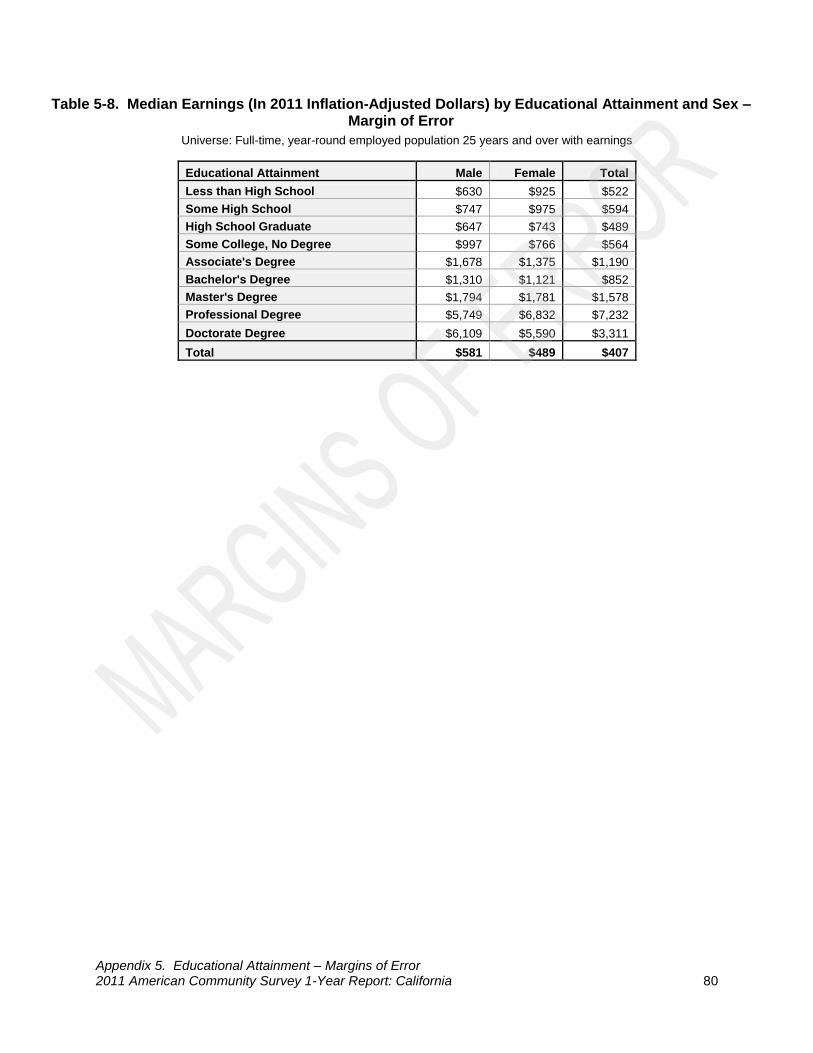
Appendix 5. Educational Attainment – Margins of Error 2011 American Community Survey 1-Year Report: California 80
Table 5-8. Median Earnings (In 2011 Inflation-Adjusted Dollars) by Educational Attainment and Sex – Margin of Error
Universe: Full-time, year-round employed population 25 years and over with earnings
Educational Attainment Male Female Total
Less than High School $630 $925 $522
Some High School $747 $975 $594
High School Graduate $647 $743 $489
Some College, No Degree $997 $766 $564
Associate's Degree $1,678 $1,375 $1,190
Bachelor's Degree $1,310 $1,121 $852
Master's Degree $1,794 $1,781 $1,578
Professional Degree $5,749 $6,832 $7,232
Doctorate Degree $6,109 $5,590 $3,311
Total $581 $489 $407

Appendix 6. Health Insurance – Margins of Error 2011 American Community Survey 1-Year Report: California 81
APPENDIX 6. HEALTH INSURANCE – MARGINS OF ERROR
Table 6-1. Health Insurance Coverage Status by Selected Characteristics – Margin of Error
Universe: Civilian noninstitutionalized population
Characteristic Total Covered Not
Covered
Civilian Noninstitutionalized Population 6,645 72,627 71,762
Age Group
Under 18 5,454 24,499 23,600
18-26 22,621 28,869 24,621
27-34 21,390 29,517 25,264
35-49 12,840 36,100 31,795
50-64 10,590 24,457 21,519
65-74 7,502 8,443 5,698
75+ 6,926 7,450 2,917
Sex
Male 12,111 43,437 42,780
Female 11,237 41,850 39,700
Race/Ethnicity
White, Not Hispanic 11,238 35,036 31,047
Black, Not Hispanic 16,735 19,887 14,412
Asian, Not Hispanic 18,951 25,903 19,183
Hispanic 6,365 49,161 50,193
Educational Attainment (Persons Age 25+)
Not a High School Graduate 39,401 29,807 34,223
High School Graduate 46,496 42,378 22,821
Some College or Associate's Degree 42,043 40,729 23,413
Bachelor’s Degree 42,461 39,390 13,798
Master’s Degree or Higher 34,799 34,154 8,977
Citizenship
U.S. Citizen 55,984 75,182 51,565
Native 56,209 74,757 45,638
Naturalized 45,946 39,445 17,872
Not a U.S. Citizen 54,972 43,168 42,860
Poverty Status
Below Poverty 82,560 62,996 47,332
At or Above Poverty 83,413 90,086 51,123

Appendix 6. Health Insurance – Margins of Error 2011 American Community Survey 1-Year Report: California 82
Table 6-2. Health Insurance Coverage by Type – Margin of Error
Universe: Civilian noninstitutionalized population
Health Plan Type* Margin of
Error
Private 92,529
Medicaid (“Medi-Cal”) 62,957
Medicare 26,973
TRICARE, VA, or Other Military 29,289
*Persons are counted in more than one health plan type if they have multiple types of health insurance coverage.
Table 6-3. Private Health Insurance Coverage by Age – Margin of Error
Universe: Civilian noninstitutionalized population
Age Group Total Covered
Under 18 5,454 41,957
18-26 22,621 30,929
27-34 21,390 30,614
35-49 12,840 35,051
50-64 10,590 27,172
65-74 7,502 15,841
75+ 6,926 11,253
Total 6,645 92,529
Table 6-4. Medicaid (“Medi-Cal”) Coverage by Age – Margin of Error
Universe: Civilian noninstitutionalized population
Age Group Total Covered
Under 19 13,449 39,506
19-26 25,384 18,192
27-34 21,390 16,479
35-49 12,840 18,641
50-64 10,590 17,704
65-74 7,502 11,280
75+ 6,926 11,432
Total 6,645 62,957

Appendix 6. Health Insurance – Margins of Error 2011 American Community Survey 1-Year Report: California 83
Table 6-5. Medicare Coverage by Age – Margin of Error
Universe: Civilian noninstitutionalized population
Age Group Total Covered
Under 65 10,355 21,588
65-74 7,502 10,456
75+ 6,926 7,906
Total 6,645 26,973

Appendix 7. Geographic Mobility – Margins of Error 2011 American Community Survey 1-Year Report: California 84
APPENDIX 7. GEOGRAPHIC MOBILITY – MARGINS OF ERROR
Table 7-1. Geographic Mobility in the Past Year by Type of Move – Margin of Error
Universe: Population 1 year and over in California who had a change of residence from 1 year ago
Type of Move Number
From Abroad 19,352
From a Different State 19,813
Within California 85,990
Total 88,062
Table 7-2. Geographic Mobility in the Past Year by Selected Characteristics – Margin of Error
Universe: Population 1 year and over in California
Characteristic Total Nonmover Mover
Population 1 Year and Over 12,835 87,657 88,062
Age
1-17 14,015 40,885 39,362
18-24 12,772 24,289 21,789
25-34 15,207 29,292 28,602
35-49 13,376 32,508 29,203
50-64 10,604 20,803 18,320
65-74 7,465 9,695 7,075
75+ 6,593 10,740 7,166
Median Age 0.3 0.3 0.4
Sex
Male 14,563 47,817 47,672
Female 12,490 50,731 48,562
Race/Ethnicity
White, Not Hispanic 13,186 43,389 43,116
Black, Not Hispanic 15,506 24,759 21,031
Asian, Not Hispanic 17,571 28,377 23,617
Hispanic 10,527 57,775 56,557
Nativity
Native - Born in California 62,019 86,660 62,144
Native - Born Elsewhere 52,476 45,227 30,531
Foreign Born 55,807 58,719 36,485
-----------Continued on next page-----------

Appendix 7. Geographic Mobility – Margins of Error 2011 American Community Survey 1-Year Report: California 85
-----------Table 7-2. Continued-----------
Geographic Mobility in the Past Year by Selected Characteristics – Margin of Error Universe: Population 1 year and over in California
Characteristic Total Nonmover Mover
Marital Status (Persons Age 15+)
Never Married 48,724 47,642 37,360
Married 65,589 68,168 34,772
Separated 18,844 16,872 10,445
Widowed 19,444 17,821 7,379
Divorced 34,506 29,541 15,550
Educational Attainment (Persons Age 25+)
Not a High School Graduate 40,142 43,064 20,332
High School Graduate 46,888 40,438 23,544
Some College or Associate's Degree 41,990 41,422 23,859
Bachelor's Degree 43,268 41,470 19,208
Master's Degree or Higher 35,423 32,917 13,897
Employment Status (Persons Age 16+)
Civilian Labor Force - Employed 44,702 60,266 47,569
Civilian Labor Force - Unemployed 31,724 29,434 15,019
Armed Forces 6,738 6,006 5,173
Not in the Labor Force 42,414 43,631 26,107

Appendix 7. Geographic Mobility – Margins of Error 2011 American Community Survey 1-Year Report: California 86
Table 7-3. Interstate Geographic Mobility in the Past Year by Selected Characteristics – Margin of Error
Universe: Population 1 year and over and Households in the U.S. who moved to or from California 1 year ago
Characteristic
To: California From: California
From: Another State To: Another State
Total Movers 19,813 24,359
Age Group
1-17 7,112 9,452
18-24 8,399 9,205
25-34 8,021 9,340
35-49 5,979 7,670
50-64 5,768 6,976
65+ 3,231 3,735
Sex
Male 11,540 15,101
Female 12,220 13,710
Race/Ethnicity
White, Not Hispanic 16,190 17,839
Black, Not Hispanic 5,464 5,929
Asian, Not Hispanic 5,436 5,375
Hispanic 9,092 13,823
Nativity
Native 17,762 23,320
Foreign born 6,686 8,091
Household Income
Less than $20,000 9,002 10,120
$20,000 - $49,999 8,499 14,280
$50,000 - $74,999 7,505 10,203
$75,000 - $124,999 13,025 10,862
$125,000 - $199,999 8,217 8,037
$200,000+ 5,410 5,574
Poverty Status (Persons for whom Poverty Status is Determined) 19,436 22,244
Below Poverty 7,965 9,118
At or Above Poverty 17,232 21,151
Marital Status (Persons Age 15+) 17,430 19,014
Never Married 11,708 11,737
Married 10,193 13,402
Separated, Widowed, or Divorced 5,442 5,694
Educational Attainment (Persons Age 25+) 13,749 14,484
Less than a Bachelor's Degree 9,294 10,264
Bachelor's Degree or Higher 8,925 9,558
Households* 8,708 9,423
Family Households 5,903 7,017
Nonfamily Households 6,339 7,009 *Mover status for households are based on the householder.

Appendix 7. Geographic Mobility – Margins of Error 2011 American Community Survey 1-Year Report: California 87
Table 7-4. Geographic Mobility in the Past Year by U.S. Region of Former Residence – Margin of Error
Universe: Population 1 year and over in the U.S. who moved to or from California 1 year ago
U.S. Region
To California From California
From Other States in: To Other States in:
Midwest 9,696 9,599
Northeast 6,172 7,076
South 12,018 12,609
West 13,105 16,056
Total 19,813 24,359

Appendix 8. Foreign Born – Margins of Error 2011 American Community Survey 1-Year Report: California 88
APPENDIX 8. FOREIGN BORN – MARGINS OF ERROR
Table 8-1. Age by Nativity and Sex – Margin of Error
Universe: Total population
Age Group
Native Foreign Born
Male Female Total Male Female Total
Under 10 18,579 19,737 25,504 5,594 6,231 8,738
10-19 25,377 21,485 34,349 13,276 9,761 19,183
20-29 21,769 16,645 29,105 17,175 16,652 26,039
30-39 19,794 17,600 30,907 18,612 17,644 28,908
40-49 20,059 14,837 28,114 17,806 16,368 27,638
50-59 14,724 12,814 21,265 14,959 15,061 24,973
60-69 15,632 18,679 27,876 11,847 12,200 20,250
70-79 12,634 12,324 18,868 8,665 9,813 13,736
80+ 7,997 9,543 12,173 5,071 7,224 9,444
Total 36,239 33,924 56,001 35,317 31,429 56,001
Table 8-2. Race/Ethnicity by Nativity – Margin of Error
Universe: Total population
Race/Ethnicity Native
Foreign Born
Naturalized Noncitizen Total
White, Not Hispanic 31,410 17,061 17,350 27,584
Black, Not Hispanic 18,506 7,368 6,841 10,467
Asian, Not Hispanic 21,443 25,841 26,717 21,071
Hispanic 50,210 29,038 48,454 49,255
Total* 56,001 44,981 55,264 56,001
*Total includes all race/ethnic groups.

Appendix 8. Foreign Born – Margins of Error 2011 American Community Survey 1-Year Report: California 89
Table 8-3. World Region of Birth – Margin of Error
Universe: Foreign-born population
Region of Birth Margin of
Error
Africa 12,521
Central America 52,836
North America 6,182
South America 15,671
Eastern Asia 24,225
South Central Asia 23,616
South Eastern Asia 26,551
Western Asia (Middle East) 14,066
Europe 21,237
Other* 10,708
Total 56,001
*Includes the Caribbean, Oceania, other U.S. Island Areas, and at Sea.
Table 8-4. Top Five Countries of Birth by Citizenship Status – Margin of Error
Universe: Foreign-born population
Country of Birth Naturalized Noncitizen
Total Foreign
Born
All Countries 44,981 55,264 56,001
Mexico 25,671 47,026 51,268
Philippines 18,754 15,102 24,477
China 12,170 13,547 18,317
Vietnam 15,504 9,079 18,466
El Salvador 11,495 15,348 20,859

Appendix 8. Foreign Born – Margins of Error 2011 American Community Survey 1-Year Report: California 90
Table 8-5. Year of Entry into the U.S. by Citizenship Status for California’s Foreign-Born Population – Margin of Error
Universe: Foreign-born population
Year of Entry into the U.S. Naturalized Noncitizen
Total Foreign
Born
Before 1950 4,649 2,396 5,147
1950-1959 8,924 3,883 10,588
1960-1969 14,120 7,346 16,405
1970-1979 22,601 14,272 25,353
1980-1989 30,241 21,704 35,247
1990-1999 30,563 29,379 41,978
2000-2011 14,812 42,399 41,731
2000-2005 13,962 31,283 31,992
2006-2011 5,945 29,181 30,280
Total 44,981 55,264 56,001
Table 8-6. Year of Entry into the U.S. by Citizenship Status for California’s Mexican-Born Population – Margin of Error
Universe: Mexican-born population
Year of Entry into the U.S. Naturalized Noncitizen
Total Foreign
Born
Before 1950 1,836 2,123 2,637
1950-1959 4,742 3,337 6,208
1960-1969 7,205 5,006 8,596
1970-1979 11,677 11,828 15,167
1980-1989 14,331 17,210 23,157
1990-1999 12,229 27,082 32,708
2000-2011 8,058 33,902 35,450
2000-2005 6,769 26,086 26,770
2006-2011 3,244 18,589 19,694
Total 25,671 47,026 51,268

Appendix 9. Language – Margins of Error 2011 American Community Survey 1-Year Report: California 91
APPENDIX 9. LANGUAGE – MARGINS OF ERROR
Table 9-1. Language Spoken at Home and Ability to Speak English by Age – Margin of Error
Universe: Population 5 years and over
Age Group Total
Speaks a Language Other than English at
Home
Speaks a Language Other than English at
Home and Speaks English
Less than “Well”
5-17 9,011 29,428 8,366
18-24 12,772 21,784 9,687
25-64 14,712 42,866 35,568
65+ 7,313 15,069 12,673
Total 6,687 72,686 42,318
Table 9-2. Top Ten Languages Spoken at Home Other than English by Ability to Speak English – Margin of Error
Universe: Population 5 years and over who speaks a language other than English at home
Language
Speaks a Language Other than English at
Home
Speaks a Language Other than English at
Home and Speaks English Less than
“Well”
All Languages 72,686 42,318
Spanish 61,148 34,749
Tagalog 27,898 6,351
Chinese 21,564 11,446
Vietnamese 21,769 10,766
Korean 17,620 7,279
Cantonese 15,160 7,936
Mandarin 14,584 6,277
Persian 17,448 4,835
Armenian 12,155 5,818
Arabic 14,398 5,109

Appendix 9. Language – Margins of Error 2011 American Community Survey 1-Year Report: California 92
Table 9-3. Language Spoken at Home by Age and Poverty Status in the Past 12 Months – Margin of Error
Universe: Population 5 years and over for whom poverty status is determined
Age Group
Total Speaks Only English Speaks a Language Other than
English
Number Below Poverty Number Below Poverty Number Below Poverty
5-17 11,594 29,830 31,497 21,335 29,106 24,634
18-24 12,153 22,589 22,564 13,193 21,291 17,739
25-64 14,523 46,649 43,887 28,892 42,840 32,078
65+ 7,577 11,741 15,927 7,563 15,200 9,703
Total 10,094 75,616 72,145 43,348 72,427 57,958
Table 9-4. Language Spoken at Home and Ability to Speak English by Educational Attainment – Margin of Error
Universe: Population 25 years and over
Educational Attainment Total Speaks Only
English
Speaks a Language Other than English at
Home
Speaks a Language Other than English at
Home and Speaks English
Less than “Well”
Not a High School Graduate 40,142 23,849 38,517 34,241
High School Graduate 46,888 36,478 33,968 19,943
Some College or Associate's Degree 41,990 36,723 30,142 10,861
Bachelor's Degree or Higher 53,613 44,213 31,447 11,559
Total 13,529 47,815 46,437 39,351

Appendix 10. Disability – Margins of Error 2011 American Community Survey 1-Year Report: California 93
APPENDIX 10. DISABILITY – MARGINS OF ERROR
Table 10-1. Age by Sex and Disability Status – Margin of Error
Universe: Civilian noninstitutionalized population with a disability
Age Group Male Female Total
Under 5 1,985 2,321 2,883
5-17 8,694 7,061 11,904
18-34 9,964 7,128 13,340
35-64 16,207 16,475 23,530
65-74 9,024 8,764 13,633
75+ 7,691 10,267 13,726
Total 22,841 21,395 32,812
Table 10-2. Age by Type of Disability – Margin of Error
Universe: Civilian noninstitutionalized population
Age Group
Civilian Noninstitutionalized
Population
Type of Disability
Hearing Difficulty
Vision Difficulty
Cognitive Difficulty
Ambulatory Difficulty
Self-care Difficulty
Independent Living
Difficulty
Under 5* 6,685 2,502 2,638
5-17** 9,048 3,557 4,556 10,739 4,293 5,304
18-64 10,939 12,663 13,153 18,108 19,206 12,191 15,626
65+ 7,577 14,642 11,257 12,127 17,404 13,555 15,630
Total 6,645 19,377 18,608 25,331 24,187 16,658 20,694
*For children under 5 years old, only questions regarding hearing and vision difficulties were asked. **For children between the ages of 5 and 14, only questions regarding hearing, vision, cognitive, ambulatory, and self-care difficulties were asked.
Table 10-3. Race/Ethnicity by Disability Status – Margin of Error
Universe: Civilian noninstitutionalized population
Race/Ethnicity Total With a
Disability
White, Not Hispanic 11,238 25,549
Black, Not Hispanic 16,735 11,275
Asian, Not Hispanic 18,951 10,514
Hispanic 6,365 22,185
Total* 6,645 32,812
*Total includes all race/ethnic groups.

Appendix 11. Veterans – Margins of Error 2011 American Community Survey 1-Year Report: California 94
APPENDIX 11. VETERANS – MARGINS OF ERROR
Table 11-1. Age by Sex and Veteran Status – Margin of Error
Universe: Civilian population 18 years and over
Age Group
Male Female Total
Number Veterans Number Veterans Number Veterans
18-34 11,074 8,083 7,396 3,742 13,566 9,585
35-54 9,329 13,230 7,484 4,059 12,291 12,887
55-64 4,764 12,277 5,361 3,789 7,099 12,837
65-74 3,810 7,643 5,490 1,583 7,465 7,722
75+ 4,325 9,102 4,741 2,453 6,593 9,643
Total 9,008 20,842 5,846 6,898 8,358 22,913
Table 11-2. Race/Ethnicity by Veteran Status – Margin of Error
Universe: Civilian population 18 years and over
Race/Ethnicity Total Veterans
White, Not Hispanic 10,185 18,482
Black, Not Hispanic 12,164 6,257
Asian, Not Hispanic 13,953 5,841
Hispanic 5,197 9,355
Total* 8,358 22,913
*Total includes all race/ethnic groups.
Table 11-3. Veterans by Period of Service – Margin of Error
Universe: Veterans
Period of Service* Margin of
Error
Total Veterans 22,913
2nd
Gulf War (9/2001 or Later) 10,163
1st
Gulf War (8/1990 to 8/2001) 12,859
Vietnam Era 13,065
Korean War 7,049
World War II 6,186
Between Conflicts/Wars 15,218
Pre-World War II 925
*Veterans are counted in more than one period of service if they have served during multiple time periods.

Appendix 11. Veterans – Margins of Error 2011 American Community Survey 1-Year Report: California 95
Table 11-4. Veterans by Period of Service and Poverty Status – Margin of Error
Universe: Veteran population for whom poverty status is determined
Period of Service* Total Below
Poverty
Total Veterans 22,789 7,143
2nd
Gulf War (9/2001 or Later) 10,240 3,440
1st
Gulf War (8/1990 to 8/2001) 12,870 2,545
Vietnam Era 13,280 4,460
Korean War 6,916 2,105
World War II 6,123 1,637
Between Conflicts/Wars 14,804 3,691
Pre-World War II 844 178
*Veterans are counted in more than one period of service if they have served during multiple time periods.

Appendix 12. Fertility – Margins of Error 2011 American Community Survey 1-Year Report: California 96
APPENDIX 12. FERTILITY – MARGINS OF ERROR
Table 12-1. Women who had a Birth in the Past 12 Months by Marital Status and Age – Margin of Error
Universe: Women 15 to 49 years
Age Group Total
Women who had a birth in the past 12
months
15-19 8,452 3,695
20-24 8,545 7,597
25-29 6,589 6,792
30-34 7,092 7,366
35-39 18,359 6,284
40-44 16,315 4,289
45-49 7,852 1,878
Total 7,208 16,209
Table 12-2. Women who had a Birth in the Past 12 Months by Marital Status and Race/Ethnicity – Margin of Error
Universe: Women 15 to 49 years
Race/Ethnicity Total
Women who had a birth in the past 12
months
White, Not Hispanic 4,531 8,496
Black, Not Hispanic 7,194 3,959
Asian, Not Hispanic 8,807 5,329
Hispanic 4,269 12,595
Total* 7,208 16,209
*Total includes all race/ethnic groups.