Quite possibly the busiest chemical company on the planet.
186
Quite possibly the busiest chemical company on the planet. 2010 ANNUAL REPORT
Transcript of Quite possibly the busiest chemical company on the planet.
Quite possibly the busiestchemical company on the planet.
2 0 1 0 A N N U A L R E P O R T

Let’s consider the facts. In 2010, LyondellBasell completed its restructuring, secured
$8.9 billion in exit financing, and established itself as a public company with a
successful listing on the New York Stock Exchange (NYSE). New, world class facilities
began production in Germany, China and Thailand. A renewed commitment to
operating excellence enabled our company to set production records at 60 percent of
our plants around the globe. While achieving these results, we improved our safety
performance and continued to implement disciplined cost controls.
2010 EBITDA totaled $4 billion, significantly more than anticipated and $1.8 billion greater than 2009. Led by a new
Board of Directors and new management team, both chosen for their proven abilities and industry experience, our
employees worked to create a culture that champions and rewards high performance. Even so, we know good is not
great. Our sights are set on becoming a truly great and enduring enterprise.
Looking ahead, we see a bright future. We enjoy an advantaged ethane feedstock position in the U.S. and have taken
steps to increase our ethane use and availability. We have improvements underway at locations like the Houston refinery
and are debottlenecking other assets to give us an opportunity to grow our capacity.
Our balance sheet is strong, and we are on track to optimize our financial structure for the long run. We have
demonstrated a significant ability to generate cash and earnings and have regained trade credit. We repaid $1.2 billion
in debt in the fourth quarter and still our liquidity remained at $6.1 billion with a year-end cash balance of $4.2 billion.
Last year we also restructured numerous sales contracts, enhanced our operating flexibility, and improved energy
efficiency. We invested in our internal capabilities—moving from multiple systems to a single global SAP system.
We have streamlined our workforce and continue to optimize to improve efficiency.
So, how are we positioned for the future? We believe our efforts will continue to be rewarded in a strengthening market.
The solid foundation we’ve built, when combined with our people, assets and technology is leverage for the future.
Our aim in 2011 will be to build upon and accelerate our successes in a few key focus areas including:
• Intensifying our focus on safety, reliability and costs,
• Completing major turnarounds at the Houston refinery and one of our Channelview olefins plants,
• Building on our 2010 SAP system consolidation, and
• Further optimizing our capital structure.
We sincerely appreciate the dedication and contributions of our employees. Their hard work in 2010 gives us
tremendous cause for optimism about the coming year. We pledge to continue to work together to maintain our focus
on operating excellence and to strengthen our portfolio for the benefit of you, our owners and stakeholders.
Thank you for your continued support of LyondellBasell. The best is still ahead.
James L. Gallogly, Chief Executive Officer
It’s a bold claim – ‘Quite possibly the busiest chemical company on the planet.’

Highlights of consolidated financial statements
2010 Performance
Annual EBITDA 2008-2010
EBITDA by segment Net debt
U.S. $ IN MILLIONS Jan.-April 2010 May-Dec. 2010 Combined 2010 2009
Sales and other operating revenues $13,467 $27,684 $41,151 $30,828
Operating income 690 2,254 2,944 317
Income from equity investments 84 86 170 (181)
Net income* 8,564 1,587 10,151 (2,865)
Diluted earnings per share (U.S. dollars)** NA 2.78 NA NA
Diluted share count (millions) NA 566 NA NA
EBITDA 1,088 2,947 4,035 2,236
Cash flow from operations (936) 2,957 2,021 (787)
Capital expenditures 226 466 692 779
* Net income attributable to the Company; includes income from continuing and discontinued operations.
** EPS from continued and discontinued operations.
We have included certain financial information for the full year 2010. For financial accounting purposes, periods on and before April 30, 2010 represent a different entity than for periods after our emergence from bankruptcy on that date. We have combined the two entities’ results for certain disclosures in this presentation; the combined information is considered non-GAAP because it combines two entities whose results are not accounted for in the same manner.
We also use EBITDA in this presentation, which is a non-GAAP measure. Our calculations of EBITDA may not be the same as similarly titled measures by other companies. Reconciliations of the non-GAAP measures we have used in this report can be found on our website at www.lyondellbasell.com/InvestorRelations.
$, m
illio
ns
5,000
4,000
3,000
2,000
1,000
0
2008 2009 2010
2,000
1,750
1,500
1,250
1,000
750
500
250
0
Ole
fins
& P
olyo
lefin
s -
Am
eric
as
Ole
fins
& P
olyo
lefin
s -
EAI
Inte
rmed
iate
s &
D
eriv
ativ
es
Refin
ing
& O
xyfu
els
Tech
nolo
gy
$, m
illio
ns
$5,000
$4,000
$3,000
$2,000
$1,000
0April 30
(Emergence)2Q10 3Q10 4Q10
$, m
illio
ns
LyondellBasell Portfolio
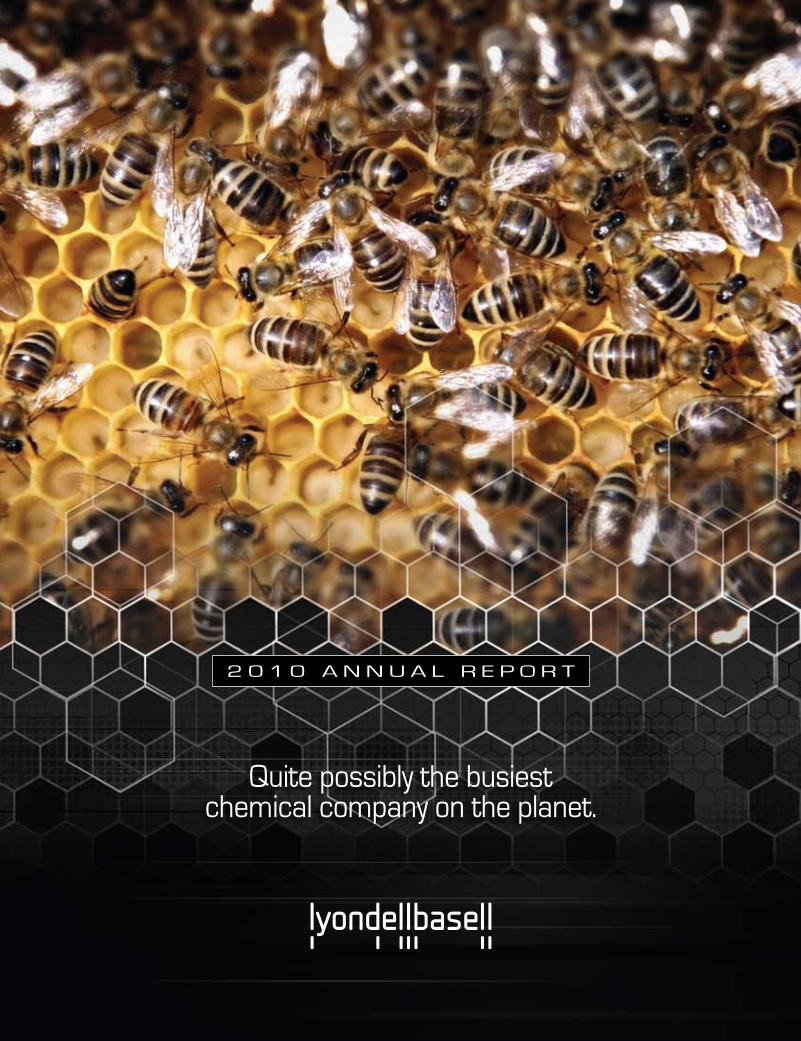
LyondellBasell has a balanced, integrated product portfolio comprising five major business segments: Olefins and Polyolefins—Americas, Olefins and Polyolefins—Europe, Asia and International (EAI), Intermediates and Derivatives, Refining and Oxyfuels, and Technology. Each plays a strategic role in creating stakeholder value.
Olefins and Polyolefins Intermediates and Derivatives
Americas Financials ($ in millions)Revenue: $12,589EBITDA: $1,685CapEx: $198
EAI Financials ($ in millions)Revenue: $12,834EBITDA: $818CapEx: $207
Financials ($ in millions)
Revenue: $5,574EBITDA: $851CapEx: $85
Global Capacity Positions
Polypropylene 1stPolypropylene compounds 1stPolyethylene 4thPropylene 4thEthylene 5th
Global capacity positions
High purity isobutylene 1stPropylene oxide 2ndAcetyls 4th
Key Products
Ethylene PropyleneButadiene
BenzenePolyethylenePolypropylene
Catalloy process resinsPB-1 resins
Key Products
Propylene oxide (PO)Propylene glycolPropylene glycol ethersButanediolStyrene monomer IsobutyleneTertiary butyl hydroperoxideAcetylsEthylene oxide
Business Strengths
• World’s largest producer of polypropylene and polypropylene compounds and a top worldwide producer of ethylene, propylene and polyethylene.
• Differentiated product offerings from key building blocks for basic plastics to high-value specialty products such as Catalloy process resins and PB-1 allowing for very specific tailoring of product properties.
• Large-scale operations and the operational flexibility to use the lowest-cost raw materials provide competitive advantages.
• U.S. feedstock processing flexibility enables us to process advantaged NGL’s, particularly ethane.
2010 Summary
2010 was a tremendous year for both O&P – Americas and O&P – EAI due in part to improved market conditions, a lighter feedstock slate in the Americas and improved olefins and polyolefins volumes and margins in the EAI segment.
2010 Summary
PO and PO derivatives volumes and margins benefitted from strong durable goods demand and industry leading reliability. Increases in PO co-product volumes coupled with a strong isobutylene market also contributed to a significant increase in segment profitability.
Business Strengths
• Second largest global producer of propylene oxide and one of the largest producers of styrene monomer, acetic acid and vinyl acetate monomer worldwide.
• Proprietary PO and acetyls production process technologies provide us with a cost advantaged position for these products and their derivatives.
• Vertically integrated facilities with global reach benefit from optimization opportunities across the entire value chain.
End Uses
PackagingBeverage cups and bottlesWire and cable compoundsAutomotive componentsHousehold appliances
ToysPipesIndustrial and consumer packagingand more...
End Uses
InsulationAutomotive seatingHome furnishingsPaints and coatingsAdhesives and sealants
CosmeticsCleanersSports equipmentCarpetingand more...
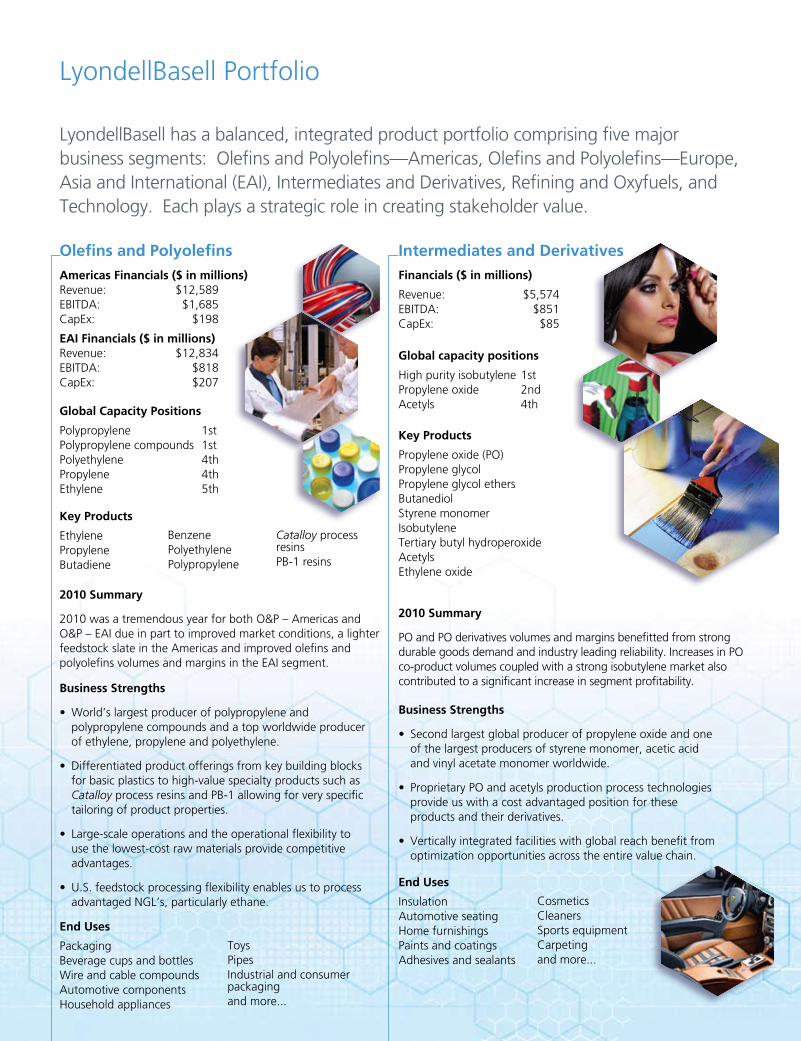
Refining and Oxyfuels Technology
Financials ($ in millions)
Revenue: $15,069EBITDA: $452CapEx: $157
Financials ($ in millions)
Revenue: $510EBITDA: $212CapEx: $31
Global Capacity Positions
Oxygenated fuels 1stRefining capacity 373,000 (barrels per day)
Global Capacity Positions
Polypropylene catalysts 1st
Key Products
GasolineDiesel fuelHeating oilJet fuelPetrochemical raw materialsMethyl tertiary butyl ether (MTBE)Ethyl tertiary butyl ether (ETBE)
Key Products
Polyolefin catalystsPolyolefin process technology licensesAssociated engineering and other services
2010 Summary
Houston refinery results improved primarily due to improved U.S. refining margins, particularly for refiners with the ability to process heavy crudes. The Berre refinery generated losses in an environment characterized by weak European refining conditions and a French port strike. Oxyfuels results declined following a record year in 2009, as a result of lower margins.
2010 Summary
The year was characterized by strengthened catalyst sales while licensing activity remained subdued as anticipated.
Business Strengths
• Our Houston refinery, among North America’s largest full conversion refineries, is a major refiner of heavy, high-sulfur crude oil and is strategically located on the U.S. Gulf Coast. The location provides access to interstate pipelines and the Port of Houston, providing access to multiple product markets and lower-cost feedstocks.
• Our Berre refinery enhances raw material integration for our operations in Europe and benefits from significant logistical assets including pipeline access, storage terminals and harbor access to the Mediterranean Sea.
• Our oxygenated fuel products ranked #1 in global capacity.
Business Strengths
• Leading global provider of technology licenses and supplier of catalysts for polyolefin production.
• Technology platform that facilitates investments in high-growth regions broadening our global reach.
• A complete PE and PP technology portfolio enabling polyolefin manufacturers the choice of a single provider for polyolefin process technologies and catalyst systems.
End Uses
Automotive fuelsAviation fuelsDiesel fuelsHeating oil
End Uses
Process licensingCatalyst salesTechnology services
Notes:
1. Segment revenues include intersegment revenues.
2. Global capacity positions include CMAI, Chemical Market Resources, DeWitt and LyondellBasell NV’s internal data as of December 31, 2010, except for Technology worldwide capacity position, which is as of December 31, 2008, and include our pro rata share of joint ventures.

Locations
At LyondellBasell, we are working hard to construct an exceptional global enterprise – a truly great and enduring company. Our mission is to become the top performer in our industry with a first and forever commitment to safety.
North AmericaIllinois Iowa Louisiana Mexico Michigan New Jersey Ohio Pennsylvania Tennessee Texas
South AmericaArgentina Brazil
Manufacturing Technology Centers
Owned and operated by LyondellBasell, its subsidiaries and/or joint ventures
EuropeFrance Germany Italy Netherlands Poland Spain UK
Asia PacificAustralia China Japan S. Korea Malaysia Thailand
AFMESaudi Arabia

UNITED STATES SECURITIES AND EXCHANGE COMMISSIONWashington, D.C. 20549
Form 10-K(Mark One)
¥ ANNUAL REPORT PURSUANT TO SECTION 13 OR 15(d)OF THE SECURITIES EXCHANGE ACT OF 1934For the fiscal year ended December 31, 2010
OR
n TRANSITION REPORT PURSUANT TO SECTION 13 OR 15(d)OF THE SECURITIES EXCHANGE ACT OF 1934For the transition period from to
Commission file number: 001-34726
LyondellBasell Industries N.V.(Exact name of registrant as specified in its charter)
The Netherlands 98-0646235(State or other jurisdiction of incorporation or organization) (I.R.S. Employer Identification No.)
Weena 7373013 AM Rotterdam
The Netherlands(Address of principal executive offices) (Zip Code)
Registrant’s telephone number, including area code: 31 30 275 5500Securities registered pursuant to Section 12(b) of the Act:
Title of Each Class Name of Each Exchange On Which Registered
Ordinary Shares, A0.04 Par Value New York Stock Exchange
Securities registered pursuant to Section 12(g) of the Act: NoneIndicate by check mark if the registrant is a well-known seasoned issuer, as defined in Rule 405 of the Securities
Act. n Yes ¥ No
Indicate by check mark if the registrant is not required to file reports pursuant to Section 13 or Section 15(d) of theAct. n Yes ¥ No
Indicate by check mark whether the registrant (1) has filed all reports required to be filed by Section 13 or 15(d) of theSecurities Exchange Act of 1934 during the preceding 12 months (or for such shorter period that the registrant was required to filesuch reports), and (2) has been subject to such filing requirements for the past 90 days. ¥ Yes n No
Indicate by check mark whether the registrant has submitted electronically and posted on its corporate Web site, if any, everyInteractive Data File required to be submitted and posted pursuant to Rule 405 of Regulation S-T during the preceding 12 months(or for such shorter period that the registrant was required to submit and post such files). ¥ Yes n No
Indicate by check mark if disclosure of delinquent filers pursuant to Item 405 of Regulation S-K is not contained herein, andwill not be contained, to the best of the registrant’s knowledge, in definitive proxy or information statements incorporated byreference in Part III of this Form 10-K or any amendment to this Form 10-K. ¥
Indicate by check mark whether the registrant is a large accelerated filer, an accelerated filer, a non-accelerated filer, or asmaller reporting company. See the definitions of “large accelerated filer,” “accelerated filer” and “smaller reporting company” inRule 12b-2 of the Exchange Act. (Check one):Large accelerated filer n Accelerated filer n Non-accelerated filer ¥
(Do not check if a smaller reporting company)Smaller reporting company n
Indicate by check mark whether the registrant is a shell company (as defined in Rule 12b-2 of the Act). n Yes ¥ No
The aggregate market value of common stock held by non-affiliates of the registrant on June 30, 2010, the last business dayof the registrant’s most recently completed second fiscal quarter, based on the closing price on that date of $16.15, was $5.4 billion.For purposes of this disclosure, the registrant has included Access Industries, LLC, Apollo Management Holdings, L.P. and AresManagement LLC and their affiliates as “affiliates.”
The registrant had 567,791,511 shares outstanding at March 15, 2011.
Documents incorporated by reference:Portions of the Proxy Statement for the Annual Meeting of Stockholders to be held on May 5, 2011 (Part III)

PART I1 and 2. Business and Properties . . . . . . . . . . . . . . . . . . . . . . . . . . . . . . . . . . . . . . . . . . . . . . . . . . . . 1
Corporate Structure & Overview . . . . . . . . . . . . . . . . . . . . . . . . . . . . . . . . . . . . . . . . . . . . . 1Segments . . . . . . . . . . . . . . . . . . . . . . . . . . . . . . . . . . . . . . . . . . . . . . . . . . . . . . . . . . . . . . 1
Olefins and Polyolefins Segments Generally . . . . . . . . . . . . . . . . . . . . . . . . . . . . . . . . . . . 2
Olefins and Polyolefins Americas . . . . . . . . . . . . . . . . . . . . . . . . . . . . . . . . . . . . . . . . . . . 3
Olefins and Polyolefins Europe, Asia and International . . . . . . . . . . . . . . . . . . . . . . . . . . . 8
Intermediates and Derivatives . . . . . . . . . . . . . . . . . . . . . . . . . . . . . . . . . . . . . . . . . . . . . . 13
Refining & Oxyfuels . . . . . . . . . . . . . . . . . . . . . . . . . . . . . . . . . . . . . . . . . . . . . . . . . . . . 19
Technology . . . . . . . . . . . . . . . . . . . . . . . . . . . . . . . . . . . . . . . . . . . . . . . . . . . . . . . . . . . 22
General . . . . . . . . . . . . . . . . . . . . . . . . . . . . . . . . . . . . . . . . . . . . . . . . . . . . . . . . . . . . . . . . 26
Research and Development . . . . . . . . . . . . . . . . . . . . . . . . . . . . . . . . . . . . . . . . . . . . . . .
Intellectual Property . . . . . . . . . . . . . . . . . . . . . . . . . . . . . . . . . . . . . . . . . . . . . . . . . . . . . 26
Environmental Regulation and Capital Expenditures . . . . . . . . . . . . . . . . . . . . . . . . . . . . . 26
Employee Relations . . . . . . . . . . . . . . . . . . . . . . . . . . . . . . . . . . . . . . . . . . . . . . . . . . . . . 27
Description of Properties . . . . . . . . . . . . . . . . . . . . . . . . . . . . . . . . . . . . . . . . . . . . . . . . . 27
Website Access to SEC Reports . . . . . . . . . . . . . . . . . . . . . . . . . . . . . . . . . . . . . . . . . . . . 31
1A. Risk Factors . . . . . . . . . . . . . . . . . . . . . . . . . . . . . . . . . . . . . . . . . . . . . . . . . . . . . . . . . . . . 31
1B. Unresolved Staff Comments . . . . . . . . . . . . . . . . . . . . . . . . . . . . . . . . . . . . . . . . . . . . . . . . . 41
3. Legal Proceedings . . . . . . . . . . . . . . . . . . . . . . . . . . . . . . . . . . . . . . . . . . . . . . . . . . . . . . . . 41
4. Submission of Matters to a Vote of Security Holders . . . . . . . . . . . . . . . . . . . . . . . . . . . . . .
PART II5. Market for Registrant’s Common Equity, Related Stockholder Matters and Issuer Purchases
of Equity Securities . . . . . . . . . . . . . . . . . . . . . . . . . . . . . . . . . . . . . . . . . . . . . . . . . . . . . . . 43
6. Selected Financial Data . . . . . . . . . . . . . . . . . . . . . . . . . . . . . . . . . . . . . . . . . . . . . . . . . . . . 46
7. Management’s Discussion and Analysis of Financial Condition and Results of Operations . . . 477A. Quantitative and Qualitative Disclosures About Market Risk . . . . . . . . . . . . . . . . . . . . . . . . . 76
8. Financial Statements and Supplementary Data . . . . . . . . . . . . . . . . . . . . . . . . . . . . . . . . . . . 78
9. Changes in and Disagreements With Accountants on Accounting and Financial Disclosure . . 170
9A. Controls and Procedures . . . . . . . . . . . . . . . . . . . . . . . . . . . . . . . . . . . . . . . . . . . . . . . . . . . 170
9B. Other Information . . . . . . . . . . . . . . . . . . . . . . . . . . . . . . . . . . . . . . . . . . . . . . . . . . . . . . . . 171
PART III10. Directors, Executive Officers and Corporate Governance. . . . . . . . . . . . . . . . . . . . . . . . . . . . 171
11. Executive Compensation . . . . . . . . . . . . . . . . . . . . . . . . . . . . . . . . . . . . . . . . . . . . . . . . . . . 171
12. Security Ownership of Certain Beneficial Owners and Management and Related StockholderMatters . . . . . . . . . . . . . . . . . . . . . . . . . . . . . . . . . . . . . . . . . . . . . . . . . . . . . . . . . . . . . . . . 172
13. Certain Relationships and Related Transactions, and Director Independence . . . . . . . . . . . . . 172
14. Principal Accounting Fees and Services . . . . . . . . . . . . . . . . . . . . . . . . . . . . . . . . . . . . . . . . 172
15. Exhibits, Financial Statement Schedules . . . . . . . . . . . . . . . . . . . . . . . . . . . . . . . . . . . . . . . . 173
Signatures . . . . . . . . . . . . . . . . . . . . . . . . . . . . . . . . . . . . . . . . . . . . . . . . . . . . . . . . . . . . . . . . . . . . . . 174

PART I
Items 1 and 2. BUSINESS AND PROPERTIES
CORPORATE STRUCTURE AND OVERVIEW
LyondellBasell Industries N.V. was incorporated under Dutch law by deed of incorporation datedOctober 15, 2009. The Company was formed to serve as the new parent holding company for certainsubsidiaries of LyondellBasell AF S.C.A. From January 2009 through April 2010, LyondellBasell AF and 93of its subsidiaries were debtors in jointly administered bankruptcy cases in U.S. Bankruptcy Court for theSouthern District of New York. As of April 30, 2010, the date of emergence from bankruptcy proceedings,LyondellBasell AF’s equity interests in its indirect subsidiaries terminated and LyondellBasell Industries N.V.now owns and operates, directly and indirectly, substantially the same business as LyondellBasell AF ownedand operated prior to emergence from the bankruptcy cases, including subsidiaries of LyondellBasell AF thatwere not involved in the bankruptcy cases.
Our Company is the successor to the combination in December 2007 of Lyondell Chemical Company(“Lyondell Chemical”) and Basell AF S.C.A. (“Basell”), which created one of the world’s largest privatepetrochemical companies with significant worldwide scale and leading product positions.
We are the world’s third largest independent chemical company based on revenues and an industry leaderin many of our product lines. We participate in the full petrochemical value chain, from refining to specializedend uses of petrochemical products, and we believe that our vertically integrated facilities, broad productportfolio, manufacturing flexibility, superior technology base and operational excellence allow us to extractvalue across the full value chain.
SEGMENTS
As of December 31, 2009, we began reporting our results of operations based on five business segmentsthrough which our operations are managed. Our reportable segments include:
• Olefins and Polyolefins — Americas (“O&P — Americas”). Our O&P — Americas segment producesand markets olefins, including ethylene and ethylene co-products, and polyolefins
• Olefins and Polyolefins — Europe, Asia, International (“O&P — EAI”). Our O&P — EAI segmentproduces and markets olefins, including ethylene and ethylene co-products, and polyolefins.
• Intermediates and Derivatives (“I&D”). Our I&D segment produces and markets propylene oxide(“PO”) and its co-products and derivatives, acetyls, ethylene oxide and its derivatives.
• Refining & Oxyfuels. Our Refining & Oxyfuels segment refines heavy, high-sulfur crude oil in theU.S. Gulf Coast, refines light and medium weight crude oil in southern France and produces oxyfuelsat several of our olefin and PO units.
• Technology. Our Technology segment develops and licenses polyolefin process technologies andprovides associated engineering and other services. Our Technology segment also develops, manufac-tures and sells polyolefin catalysts. We market our process technologies and our polyolefin catalysts toexternal customers and use them for our own manufacturing operations.
1

The following chart sets out our business segments’ key products:
O&P AmericasandO&P EAI I&D Refining & Oxyfuels Technology
Olefins— Ethylene— Propylene— Butadiene
Polyolefins— Polypropylene (PP)— Polyethylene (PE)
— High densitypolyethylene (HDPE)
— Low densitypolyethylene (LDPE)
— Linear low densitypolyethylene (LLDPE)
— Propylene-basedcompounds, materialsand alloys(PP compounds)*
— Catalloy process resins— Polybutene-1 (PB-1)*
Aromatics— Benzene— Toluene
Ethylene derivatives— Ethanol
Propylene oxide,co-products and derivatives
— Propylene oxide (PO)— Styrene monomer (SM)— Tertiary butyl alcohol (TBA)— Isobutylene— Tertiary butyl
hydro-peroxide (TBHP)— Propylene glycol (PG)— Propylene glycol ethers (PGE)— Butanediol (BDO)
Acetyls— Vinyl acetate monomer (VAM)— Acetic acid— Methanol
Ethylene derivatives— Ethylene oxide (EO)— Ethylene glycol (EG)— Ethylene Glycol Ethers
Flavor and fragrance chemicals**
GasolineUltra low sulfur dieselJet fuelLube oilsGasoline blendingcomponents
— Methyl tertiary butylether (MTBE)
— Ethyl tertiary butylether (ETBE)
AlkylateVacuum Gas Oil (VGO)Light crude oil
PP process technologies— Spheripol— Spherizone— Metocene
Polyethylene processtechnologies
— Lupotech— Spherilene— Hostalen
Polyolefin catalysts— Avant
Selected chemicaltechnologies
* O&P — EAI only.
** Through December 2010, when the flavor and fragrance business was sold.
Olefins and Polyolefins Segments Generally
We are a top worldwide producer of ethylene, propylene and PE, and the world’s largest producer of PPand PP compounds. We manage our olefin and polyolefin business in two reportable segments, O&P —Americas and O&P — EAI.
Ethylene is the most significant petrochemical in terms of worldwide production volume and is the keybuilding block for PE and a large number of other chemicals, plastics and synthetics. The production ofethylene results in co-products such as propylene, butadiene and aromatics, which include benzene andtoluene. Ethylene and its co-products are fundamental to many segments of the economy, including theproduction of consumer products, packaging, housing and automotive components and other durable andnondurable goods.
Polyolefins are thermoplastics and comprise approximately two-thirds of worldwide thermoplasticsdemand. Since their industrial commercialization, thermoplastics have found wide-ranging applications andcontinue to replace traditional materials such as metal, glass, paper and wood. Our products are used inconsumer, automotive and industrial applications ranging from food and beverage packaging to housewaresand construction materials. PE is the most widely used thermoplastic, measured on a production capacitybasis. We produce HDPE, LDPE, LLDPE and metallocene linear low density polyethylene. PP is the singlelargest polyolefin product produced worldwide, and we produce homopolymer, impact copolymer, randomcopolymer and metallocene PP.
2
We specialize in several specialty product lines: PP compounds; Catalloy process resins; and PB-1,focusing on specialty polyolefins and compounds that offer a wide range of performance characteristics.Typical properties of such specialty polyolefins and compounds include impact-stiffness balance, scratchresistance, soft touch and heat scalability. End uses include automotive and industrial products and materials.PP compounds consist of specialty products produced from blends of polyolefins and additives and are soldmainly to the automotive and home appliances industries.
We are the only manufacturer of Catalloy process resins, which are our proprietary products. TheCatalloy process resins business focuses on specialty polyolefins that offer a wide range of performancecharacteristics. Catalloy process resins compete with a number of other materials, such as other PP resins,flexible PVC, ethylene propylene rubber, acrylonitrile butadiene styrene (“ABS”), polycarbonate, metals andreinforced polyurethanes.
Sales of ethylene accounted for approximately 3% of our total revenues in 2010. Sales of PP accountedfor approximately 18% of our total revenues in 2010. Sales of PE (HDPE, LDPE and LLDPE, collectively)accounted for 16% of our total revenues in 2010.
Olefins and Polyolefins — Americas Segment
Overview
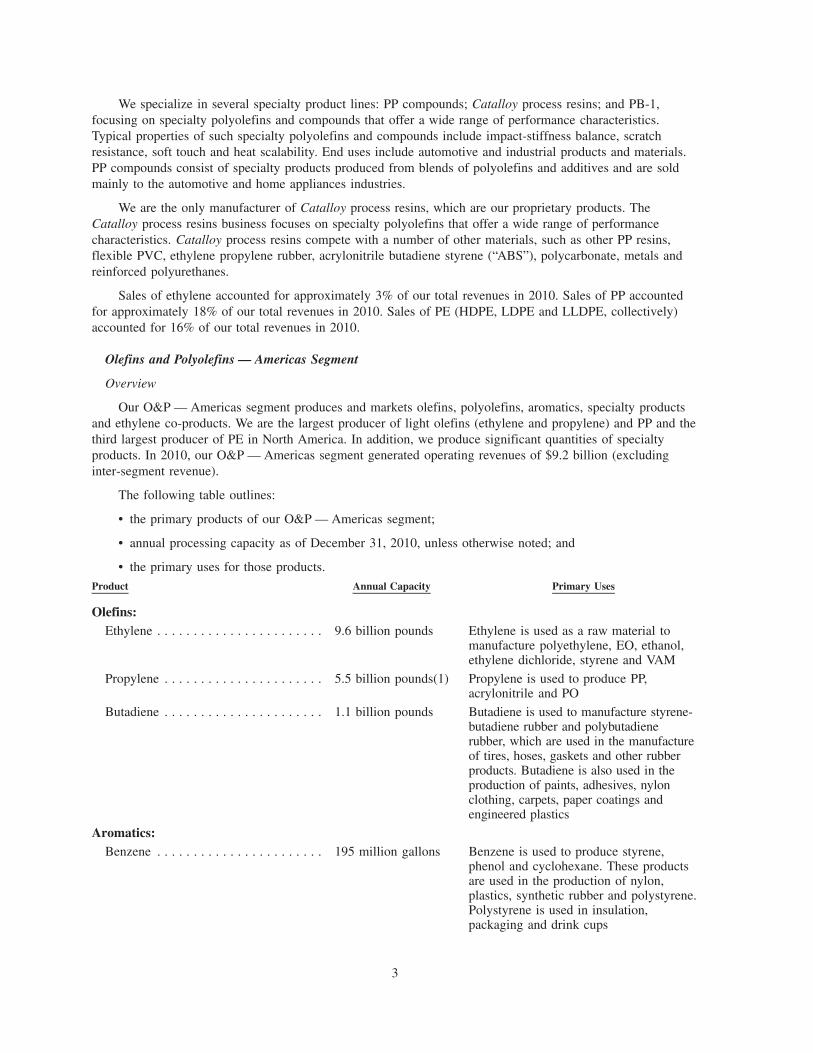
Our O&P — Americas segment produces and markets olefins, polyolefins, aromatics, specialty productsand ethylene co-products. We are the largest producer of light olefins (ethylene and propylene) and PP and thethird largest producer of PE in North America. In addition, we produce significant quantities of specialtyproducts. In 2010, our O&P — Americas segment generated operating revenues of $9.2 billion (excludinginter-segment revenue).
The following table outlines:
• the primary products of our O&P — Americas segment;
• annual processing capacity as of December 31, 2010, unless otherwise noted; and
• the primary uses for those products.
Product Annual Capacity Primary Uses
Olefins:Ethylene . . . . . . . . . . . . . . . . . . . . . . . 9.6 billion pounds Ethylene is used as a raw material to
manufacture polyethylene, EO, ethanol,ethylene dichloride, styrene and VAM
Propylene . . . . . . . . . . . . . . . . . . . . . . 5.5 billion pounds(1) Propylene is used to produce PP,acrylonitrile and PO
Butadiene . . . . . . . . . . . . . . . . . . . . . . 1.1 billion pounds Butadiene is used to manufacture styrene-butadiene rubber and polybutadienerubber, which are used in the manufactureof tires, hoses, gaskets and other rubberproducts. Butadiene is also used in theproduction of paints, adhesives, nylonclothing, carpets, paper coatings andengineered plastics
Aromatics:Benzene . . . . . . . . . . . . . . . . . . . . . . . 195 million gallons Benzene is used to produce styrene,
phenol and cyclohexane. These productsare used in the production of nylon,plastics, synthetic rubber and polystyrene.Polystyrene is used in insulation,packaging and drink cups
3

Product Annual Capacity Primary Uses
Toluene . . . . . . . . . . . . . . . . . . . . . . . . 40 million gallons Toluene is used as an octane enhancer ingasoline, as a chemical raw material forbenzene and/or paraxylene productionand as a core ingredient in toluenediisocyanate, a compound used inurethane production
Polyolefins:PP. . . . . . . . . . . . . . . . . . . . . . . . . . . . 4.4 billion pounds(2) PP is primarily used to manufacture
fibers for carpets, rugs and upholstery;housewares; medical products;automotive interior trim, fascia, runningboards, battery cases, and bumpers; toysand sporting goods; fishing tackle boxes;and bottle caps and closures
HDPE . . . . . . . . . . . . . . . . . . . . . . . . . 3.3 billion pounds HDPE is used to manufacture grocery,merchandise and trash bags; foodcontainers for items from frozen dessertsto margarine; plastic caps and closures;liners for boxes of cereal and crackers;plastic drink cups and toys; dairy crates;bread trays; pails for items from paint tofresh fruits and vegetables; safetyequipment, such as hard hats; house wrapfor insulation; bottles for household andindustrial chemicals and motor oil; milk,water, and juice bottles; large(rotomolded) tanks for storing liquidssuch as agricultural and lawn carechemicals; and pipe
LDPE . . . . . . . . . . . . . . . . . . . . . . . . . 1.3 billion pounds LDPE is used to manufacture foodpackaging films; plastic bottles forpackaging food and personal care items;dry cleaning bags; ice bags; pallet shrinkwrap; heavy-duty bags for mulch andpotting soil; boil-in-bags ; coatings onflexible packaging products; and coatingson paper board such as milk cartons.Ethylene vinyl acetate is a specializedform of LDPE used in foamed sheets,bag-in-box bags, vacuum cleaner hoses,medical tubing, clear sheet protectors andflexible binders
4

Product Annual Capacity Primary Uses
LLDPE . . . . . . . . . . . . . . . . . . . . . . . . 1.3 billion pounds LLDPE is used to manufacture garbageand lawn-leaf bags; industrial can liners;housewares; lids for coffee cans andmargarine tubs; dishpans, home plasticstorage containers, and kitchen trashcontainers; large (rotomolded) toys likeoutdoor gym sets; drip irrigation tubing;insulating resins and compounds used toinsulate copper and fiber optic wiring;shrink wrap for multi-packaging cannedfood, bag-in-box bags, produce bags, andpallet stretch wrap
Specialty Polyolefins:Catalloy process resins . . . . . . . . . . . . 600 million pounds Catalloy process resins are used primarily
in modifying polymer properties in filmapplications and molded products; forspecialty films, geomembranes, androofing materials; in bitumenmodification for roofing and asphaltapplications; and to manufactureautomotive bumpers
Ethylene Derivatives:Ethanol . . . . . . . . . . . . . . . . . . . . . . . . 50 million gallons Ethanol is used as a fuel and a fuel
additive and in the production of solventsas well as household, medicinal andpersonal care products
(1) Includes (i) refinery-grade material from the Houston Refinery and (ii) 1 billion pounds per year of capac-ity from the product flex unit at the Channelview facility, which can convert ethylene and other light petro-chemicals into propylene.
(2) Includes 100% of 1.31 billion pounds of capacity of our Indelpro joint venture (described below).
See “Description of Properties” for the locations where we produce the primary products of our O&P —Americas segment. Annual processing capacity as of December 31, 2010 was calculated by estimating theaverage number of days in a typical year that a production unit of a plant is expected to operate, after allowingfor downtime for regular maintenance, and multiplying that number by an amount equal to the unit’s optimaldaily output based on the design raw material mix. Because the processing capacity of a production unit is anestimated amount, actual production volumes may be more or less than the capacities set forth below.Capacities shown include 100% of the capacity of joint venture facilities.
Sales & Marketing / Customers
In 2010, no single external O&P — Americas segment customer accounted for 10% or more of our totalrevenues.
We currently produce ethylene at five sites in the U.S. Our ethylene production in the U.S. generally isconsumed internally as a raw material in the production of polymers and other derivatives, or is shipped bypipeline to customers. In North America, we are a net seller of ethylene.
We currently produce propylene at six sites in the U.S., which includes production from the HoustonRefinery’s fluid catalytic cracker coproduct stream. We use propylene as a raw material for production of PO,PP, and other derivatives. The propylene production within the U.S. that is not consumed internally is generallysold under multi-year contracts. In North America, we are a net seller of propylene.
5
We have butadiene and aromatics (benzene and toluene) production capabilities at two sites in the U.S. Wegenerally sell our butadiene under multi-year contracts. We use the benzene as a raw material for productionof styrene. In the U.S., we are a net purchaser of benzene. Our Refining & Oxyfuels business uses the tolueneto blend into gasoline. Of the toluene production that is not consumed internally, a majority is sold on a spotbasis.
We at times purchase ethylene, propylene, benzene and butadiene for resale, when necessary, to satisfycustomer demand for these products above production levels. Volumes of ethylene, propylene, benzene andbutadiene purchased for resale can vary significantly from period to period. However, purchased volumes havenot historically had a significant impact on profits.
In the U.S., most of the ethylene and propylene production of our Channelview, Corpus Christi andLa Porte facilities is shipped via a pipeline system, which has connections to numerous U.S. Gulf Coastconsumers. This pipeline system, some of which is owned and some of which is leased, extends from CorpusChristi to Mont Belvieu to Port Arthur, Texas, as well as into the Lake Charles, Louisiana area. In addition,exchange agreements with other ethylene and co-products producers allow access to customers who are notdirectly connected to this pipeline system. Some ethylene is shipped by rail car from Clinton, Iowa to Morris,Illinois and also to customers. A pipeline owned and operated by an unrelated party is used to transportethylene from Morris, Illinois to Tuscola, Illinois and is used as a raw material in the production of ethanol.Some propylene is shipped by ocean going vessel. Butadiene, benzene, toluene and other products aredistributed by pipeline, rail car, truck, barge or ocean going vessel.
We produce PP at three sites in North America, one of which is owned by our Mexican joint venture, andone site in South America. We manufacture PE using a variety of technologies at six sites in the U.S. Our PPand PE production is typically sold to an extensive base of established customers under annual contracts orunder customary terms and conditions without formal contracts. We also sell PP into our PP compoundsbusiness, which is managed worldwide by our O&P — EAI segment. We also have a facility in Ohio thatproduces performance polymer products, which include enhanced grades of PE. We believe that, over abusiness cycle, average selling prices and profit margins for specialty polymers tend to be higher than averageselling prices and profit margins for higher-volume commodity PEs.
The majority of our polyolefin products sold in North America are sold through our sales organization.We have regional sales offices in various locations throughout the U.S. Polyolefins primarily are distributed inNorth America by rail car or truck.
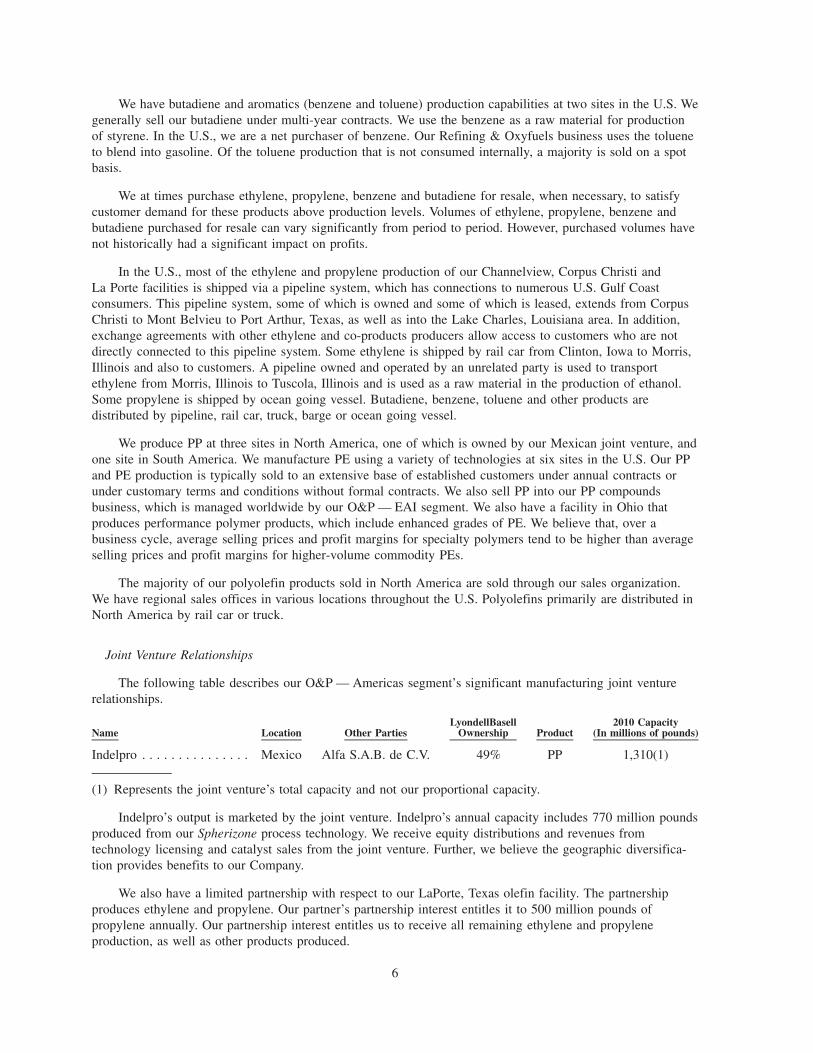
Joint Venture Relationships
The following table describes our O&P — Americas segment’s significant manufacturing joint venturerelationships.
Name Location Other PartiesLyondellBasell
Ownership Product2010 Capacity
(In millions of pounds)
Indelpro . . . . . . . . . . . . . . . Mexico Alfa S.A.B. de C.V. 49% PP 1,310(1)
(1) Represents the joint venture’s total capacity and not our proportional capacity.
Indelpro’s output is marketed by the joint venture. Indelpro’s annual capacity includes 770 million poundsproduced from our Spherizone process technology. We receive equity distributions and revenues fromtechnology licensing and catalyst sales from the joint venture. Further, we believe the geographic diversifica-tion provides benefits to our Company.
We also have a limited partnership with respect to our LaPorte, Texas olefin facility. The partnershipproduces ethylene and propylene. Our partner’s partnership interest entitles it to 500 million pounds ofpropylene annually. Our partnership interest entitles us to receive all remaining ethylene and propyleneproduction, as well as other products produced.
6

Raw Materials
Raw material cost is the largest component of the total cost for the production of ethylene and its co-products. The primary raw materials used are heavy liquids and natural gas liquids (“NGLs”). Heavy liquidsinclude crude oil-based naphtha and gas oil, as well as condensate, a very light crude oil resulting from naturalgas production (collectively referred to as “heavy liquids”). NGLs include ethane, propane and butane. Theuse of heavy liquid raw materials results in the production of a significant amount of co-products such aspropylene, butadiene, benzene and toluene, as well as gasoline blending components, while the use of NGLsresults in the production of a smaller amount of co-products.
Historically, facilities using heavy liquids as feedstock have generated higher margins than those usingethane. However, in recent years ethane has had a cost advantage for use as feedstock based on higher crudeoil prices relative to NGLs. As a result, a plant’s flexibility to consume a wide range of raw materialsgenerally will provide an advantage over plants that are restricted in processing capabilities over a number ofyears. We have the capability to process significant quantities of either heavy liquids or NGLs. We estimatethat in the U.S. we can process between 35% and 85% NGLs. Changes in the raw material feedstock willresult in variances in production capacities among products. We believe our raw material flexibility in theU.S. is a key advantage in the production of ethylene and its co-products.
We source our heavy liquids requirements worldwide via a mix of contractual and spot arrangements.Spot market purchases are made in order to maintain raw material flexibility and to take advantage of rawmaterial pricing opportunities. We purchase NGL requirements via long term and spot contractual arrange-ments from a variety of sources. A portion of the heavy liquids requirements for ethylene production are alsoobtained from our Refining & Oxyfuels segment. Heavy liquids generally are delivered by ship or barge, andNGLs are generally delivered via pipeline.
In North America, we also purchase large amounts of natural gas to be used for consumption (not as araw material) in our business via market-based contractual arrangements with a variety of sources.
The principal raw materials used by our polyolefin business are ethylene and propylene. During 2010, ourNorth American ethylene and propylene production exceeded the North American raw material requirementsof the polyolefin business of our O&P — Americas segment. However, not all raw material requirements forethylene and propylene in this region are sourced internally. Our Mexican joint venture, Indelpro, receives themajority of its chemical grade and refinery grade propylene needs from Pemex, the state owned oil companyof Mexico, under a long-term contract. We purchase ethylene and propylene on a spot and contract basis tomeet our internal and external demands as needed.
The raw materials for polyolefins and Catalloy process resins are, in general, commodity chemicals withnumerous bulk suppliers and ready availability at competitive prices.
Industry Dynamics / Competition
With respect to olefins and polyolefins, competition is based on price, product quality, product delivery,reliability of supply, product performance and customer service. Industry consolidation in North America hasled to fewer, although larger, competitors. Profitability is affected not only by supply and demand for olefinsand polyolefins, but also by raw material costs and price competition among producers. Price competition mayintensify due to, among other things, the addition of new capacity. In general, demand is a function ofworldwide economic growth, which fluctuates. It is not possible to accurately predict the changes in rawmaterial costs, market conditions, capacity utilization and other factors that will affect industry profitability inthe future.
Based on published rated production capacities, we were the second largest producer of ethylene in NorthAmerica as of December 31, 2010. North American ethylene rated capacity at December 31, 2010 wasapproximately 72 billion pounds per year, with approximately 84% of that North American capacity locatedalong the Gulf Coast. At December 31, 2010, our ethylene rated capacity in the U.S. was approximately9.6 billion pounds per year, or approximately 13% of total North American ethylene production capacity.
7
We compete in North America with other large marketers and producers for sales of ethylene and its co-products such as Dow, ExxonMobil, International Petroleum Investment Company (“IPIC”), Shell, INEOS,ChevronPhillips, TPC Group and others.
Based on published data regarding PP capacity, we believe that, including our proportionate share of theIndelpro joint venture, we are the largest producer of PP in North America as of December 31, 2010, with aproportionate share capacity of 3.3 billion pounds, or approximately 17% of the total North American capacity.Our largest competitors for sales of PP in North America are ExxonMobil, Total, Braskem, Formosa Plasticsand INEOS.
With respect to PE, we believe that we are the third largest producer in North America as of December 31,2010, with 5.8 billion pounds per year of capacity, or approximately 13% of North American capacity. Ourlargest competitors for sales of PE in North America are Dow, ExxonMobil, IPIC, Chevron Phillips, INEOSand Westlake.
Olefins and Polyolefins — Europe, Asia, International Segment
Overview
Our O&P — EAI segment produces and markets olefins (ethylene and ethylene co-products) andpolyolefins. We are the largest producer of PP and PE in Europe and the largest worldwide producer of PPcompounds. We also produce significant quantities of other specialty products such as Catalloy process resinsand PB-1. Our O&P — EAI segment manages our worldwide PP compound business (including our facilitiesin North and South America), our worldwide PB-1 business, and our Catalloy process resins produced inEurope and Asia. We have eight joint ventures located principally in regions with access to low cost feedstocksor access to growing markets. In 2010, our O&P — EAI segment generated operating revenues of $12.5 billion(excluding inter-segment revenue).
We currently produce ethylene, propylene and co-products at three sites in Europe and one joint venturesite in the Middle East. Butadiene is an important co-product of this production. We produce polyolefins (PPand PE) at 19 facilities in the EAI region, including 10 facilities located in Europe, four facilities located inEast Asia, three facilities located in the Middle East and two facilities located in Australia. Our joint venturesown one of the facilities in Europe, four of the facilities in East Asia and three in the Middle East.
PP compounds consist of specialty products produced from blends of polyolefins and additives and aresold mainly to the automotive and white goods industries. We manufacture PP compounds at 15 facilitiesworldwide (a number of which are the same facilities as the polyolefin facilities described above), consistingof four facilities in Europe, five facilities in East Asia, three in North America, two in South America and onefacility in Australia.
We produce Catalloy process resins at two sites in the EAI region, including one in The Netherlands andone in Italy. The process is proprietary technology that is not licensed to third parties, and as a result, we arethe only manufacturer of Catalloy process resins.
We produce PB-1 at one facility in Europe. We believe that we are the largest worldwide producer ofPB-1, a family of flexible, strong and durable butene-based polymers. A majority of the current PB-1 weproduce is used in pipe applications and for under-floor heating and thermo sanitary systems. PB-1 is beingdeveloped to target new opportunities in applications such as “easy-open” packaging (seal-peel film),construction, fibers and fabrics, compounds, adhesives and coatings.
The following table outlines:
• the primary products of our O&P — EAI segment;
• annual processing capacity as of December 31, 2010, unless otherwise noted; and
• the primary uses for those products.
8

Product Annual Capacity Primary Uses
OlefinsEthylene . . . . . . . . . . . . . . . . . . . . . 6.4 billion pounds(1) Ethylene is used as a raw material to
manufacture polyethylene, EO, ethanol,ethylene dichloride, styrene and VAM
Propylene . . . . . . . . . . . . . . . . . . . . 5.4 billion pounds(1)(2) Propylene is used to produce PP,acrylonitrile and PO
Butadiene . . . . . . . . . . . . . . . . . . . . 550 million pounds(1) Butadiene is used to manufacturestyrene-butadiene rubber andpolybutadiene rubber, which are usedin the manufacture of tires, hoses,gaskets and other rubber products.Butadiene is also used in theproduction of paints, adhesives, nylonclothing, carpets, paper coatings andengineered plastics
Polyolefins:PP . . . . . . . . . . . . . . . . . . . . . . . . . . 12.4 billion pounds(3)(4) PP is primarily used to manufacture
fibers for carpets, rugs and upholstery;housewares; medical products;automotive interior trim, fascia,running boards, battery cases, andbumpers; toys and sporting goods;fishing tackle boxes; and bottle capsand closures
HDPE . . . . . . . . . . . . . . . . . . . . . . . 4.4 billion pounds(4)(5) HDPE is used to manufacture grocery,merchandise and trash bags; foodcontainers for items from frozendesserts to margarine; plastic caps andclosures; liners for boxes of cereal andcrackers; plastic drink cups and toys;dairy crates; bread trays; pails foritems from paint to fresh fruits andvegetables; safety equipment, such ashard hats; house wrap for insulation;bottles for household and industrialchemicals and motor oil; milk, water,and juice bottles; large (rotomolded)tanks for storing liquids such asagricultural and lawn care chemicals;and pipe
LDPE . . . . . . . . . . . . . . . . . . . . . . . 2.8 billion pounds(4)(6) LDPE is used to manufacture foodpackaging films; plastic bottles forpackaging food and personal careitems; dry cleaning bags; ice bags;pallet shrink wrap; heavy-duty bags formulch and potting soil; boil-in-bagbags; coatings on flexible packagingproducts; and coatings on paper boardsuch as milk cartons. Ethylene vinylacetate is a specialized form of LDPEused in foamed sheets, bag-in-boxbags, vacuum cleaner hoses, medicaltubing, clear sheet protectors andflexible binders
9

Product Annual Capacity Primary Uses
Specialty Polyolefins:PP compounds . . . . . . . . . . . . . . . . . 2.4 billion pounds(7) PP compounds are used to manufacture
automotive interior and exterior trims,dashboards, bumpers and under-hoodapplications; base material for productsand parts used in appliances; anti-corrosion coatings for steel piping,wire and cable
Catalloy process resins. . . . . . . . . . . 600 million pounds Catalloy process resins are usedprimarily in modifying polymerproperties in film applications andmolded products; for specialty films,geomembranes, and roofing materials;in bitumen modification for roofingand asphalt applications; and tomanufacture automotive bumpers
PB-1 resins . . . . . . . . . . . . . . . . . . . 110 million pounds PB-1 resins are used in flexible pipes,resins for seal-peel film, filmmodification, hot melt and polyolefinmodification applications, consumerpackaging and adhesives
(1) Includes 100% of olefin capacity of SEPC (described below) of which we own 25%, which includes2.2 billion pounds of ethylene and 630 million pounds of propylene.
(2) Includes (i) refinery-grade material from our French refinery; (ii) 100% of the 1.015 billion pounds ofcapacity of the propane dehydrogenation (“PDH”) plant owned by SPC (described below) of which weown 25%; and (iii) 1.015 billion pounds of capacity from the Al-Waha joint venture (described below), ofwhich we currently own 21%. Excludes 660 million pounds of capacity of HMC (described below) thatcame on line in late 2010.
(3) Includes: (i) 100% of the 1.59 billion pounds of capacity at SPC; (ii) 100% of the 800 million pounds ofcapacity of SunAllomer (described below) of which we own 50%; (iii) 100% of the 880 million pounds ofcapacity of BOP (described below) of which we own 50%; (iv) 100% of the 990 million pounds of capac-ity of HMC (described below) of which we own 29%, but does not include 600 million pounds of expan-sion capacity that came on line in late 2010; (v) 100% of the 1.545 billion pounds of capacity ofPolyMirae (described below) of which we own 42%; and (vi) 100% of the 990 million pounds of capacityat Al Waha. Excludes all capacity at our Terni, Italy location, where production ceased in July 2010.
(4) Includes 100% of 880 million pounds of LDPE capacity and 880 million pounds of HDPE capacity fromSEPC.
(5) Includes 100% of the 705 million pounds of capacity of BOP. Also includes 705 million pounds of capac-ity at a site in Munchsmunster, Germany that was rebuilt following a fire in 2005 and started up in August2010
(6) Includes 100% of the 240 million pounds of capacity of BOP.
(7) Includes 100% of the 165 million pounds of capacity of PolyPacific Pty (described below) of which weown 50% and 110 million pounds of capacity of SunAllomer.
See “Description of Properties” for the locations where we produce the primary products of our O&P —EAI segment. Annual processing capacity as of December 31, 2010 was calculated by estimating the averagenumber of days in a typical year that a production unit of a plant is expected to operate, after allowing fordowntime for regular maintenance, and multiplying that number by an amount equal to the unit’s optimal dailyoutput based on the design raw material mix. Because the processing capacity of a production unit is an
10

estimated amount, actual production volumes may be more or less than the capacities set forth below.Capacities shown include 100% of the capacity of joint venture facilities.
Sales & Marketing / Customers
In 2010, no single external O&P — EAI segment customer accounted for 10% or more of our totalrevenues.
We currently produce ethylene at one site in France, two sites in Germany, and one joint venture site inthe Middle East. Our ethylene production is generally consumed internally as a raw material in the productionof polymers. In Western Europe, we are essentially balanced in our ethylene supply and demand.
We currently produce propylene at two sites in France, two sites in Germany and the three joint venturesites in the Middle East. We use propylene as a raw material for production of PO and PP. In Europe, we are anet purchaser of propylene.
We currently produce butadiene at one site in France and one site in Germany. We generally sell ourbutadiene under multi-year contracts.
We at times purchase ethylene, propylene, benzene and butadiene for resale, when necessary, to satisfycustomer demand for these products above production levels. Volumes of ethylene, propylene, benzene andbutadiene purchased for resale can vary significantly from period to period. However, purchased volumes havenot historically had a significant impact on profits.
European ethylene and propylene production is generally either fully integrated with, or is transported viapipeline to, our PE and PP facilities in Europe.
We produce PP at nine sites in Europe, four sites in East Asia, two sites in Australia and two sites in theMiddle East. All of the sites in East Asia and the Middle East and one of the sites in Europe (Poland) areowned by joint ventures.
We manufacture PE at five sites in Europe, including one joint venture facility in Poland, and one jointventure site in the Middle East.
With respect to PP and PE, our production is typically sold to an extensive base of established customersunder annual contracts or under customary terms and conditions without formal contracts. We believe that,over a business cycle, average selling prices and profit margins for specialty polymers tend to be higher thanaverage selling prices and profit margins for higher-volume commodity PPs.
For the O&P — EAI segment, we typically have marketing arrangements with our joint venture partnersto sell and market PP and PE outside the country where such a joint venture facility is located.
Polyolefins primarily are distributed in Europe by rail car or truck.
We and our joint ventures manufacture PP compounds at five sites in East Asia (two of which are ownedby joint ventures), four sites in Europe, three sites in North America, two sites in South America and one jointventure site in Australia. We manufacture Catalloy process resins at one facility in Italy and one facility inThe Netherlands. We also manufacture PB-1 at the facility in The Netherlands.
Our regional sales offices are located in various locations, including The Netherlands; Hong Kong, China;India; and United Arab Emirates. We also operate through a worldwide network of local sales andrepresentative offices in Europe, Asia and Africa. Our joint ventures typically manage their domestic sales andmarketing efforts independently, and we typically operate as their agent/distributor for exports.
11

Joint Venture Relationships
The following table describes our O&P — EAI segment’s significant manufacturing joint venturerelationships.
Name Location Other PartiesLyondellBasell
Ownership Product2010
Capacity(1)(In millionsof pounds)
SPC . . . . . . . . . . . . . . . . . . . Al-Jubail Industrial Tasnee 25% PP 1,590City, Saudi Arabia Propylene 1,015
SEPC . . . . . . . . . . . . . . . . . . Al-Jubail Industrial Tasnee, Sahara 25% Ethylene 2,200City, Saudi Arabia Petrochemical Propylene 630
Company HDPE 880LDPE 880
Al-Waha . . . . . . . . . . . . . . . . Al-Jubail Industrial Sahara Petrochemical 21%(2) PP 990City, Saudi Arabia Company and others Propylene 1,015
HMC . . . . . . . . . . . . . . . . . . Thailand PTT and others 29% PP 990Basell Orlen Polyolefins . . . . . Poland Orlen 50% PP 880
HDPE 705LDPE 240
PolyPacific . . . . . . . . . . . . . . Australia, Malaysia Mirlex Pty. 50% PP Compounding 165SunAllomer . . . . . . . . . . . . . . Japan Showa Denko, 50% PP 940
Nippon Oil PP Compounding 110Polymirae . . . . . . . . . . . . . . . South Korea Dailem, SunAllomer 42%(3) PP 1,540
(1) Represents the joint venture’s total capacity and not our proportional capacity.
(2) Reflects our current ownership percentage. Assuming the joint venture pays dividends over time, we antic-ipate our ownership will increase to a maximum of 25%.
(3) Reflects our 35% direct ownership and 7% indirect ownership through SunAllomer.
These joint ventures provide us with additional income streams from cash dividends, licensing revenues,catalyst sales and marketing fees from selling joint venture products, as well as geographical diversificationand access to local market skills and expertise. We generally license our polyolefin process technologies andsupply catalysts to our joint ventures. Some of our joint ventures source cost advantaged raw materials fromtheir local shareholders.
We market approximately 70% of the PP produced annually by SPC and are currently the exclusivemarketer for the PP produced by Al-Waha that is sold outside of Saudi Arabia. We also market all of BOP’sPP, HPDE and LDPE sales outside of Poland. Our PolyPacific Pty. Joint venture markets all of its PPcompounds production, and we market a portion of the PP produced by SunAllomer.
Raw Materials
Raw material cost is the largest component of the total cost for the production of ethylene and its co-products. The primary raw materials used in our European olefin facilities are heavy liquids and, for our Saudijoint venture facilities, NGLs, including include ethane, propane and butane. The principal raw materials usedby our polyolefin and Catalloy process resins businesses are propylene and ethylene. In Western Europe, wehave the capacity to produce approximately 50% of the propylene requirements of our European PP businessand nearly 90% of the ethylene requirements of our European PE business. European propylene and ethylenerequirements that are not produced internally generally are purchased pursuant to long-term contracts withthird-party suppliers and are delivered via pipeline. Prices under these third-party contracts are market relatedand are negotiated monthly, and are generally based on published market indicators, normally with discounts.
In our wholly owned operations in Australia, greater than 90% of our propylene normally comes fromthird-party refinery grade propylene purchased under long-term contracts linked to Saudi or Singapore fuelmarkers and is processed at our integrated splitters located on each manufacturing site. Some of our EAI joint
12

ventures receive propylene from their local shareholders under long-term contracts. The remaining supply forthe joint ventures is purchased from local suppliers under long-term contracts and some spot purchases. OurSaudi joint ventures, Al-Waha, SEPC and SPC, produce their own olefins utilizing cost advantaged SaudiArabian propane and ethane.
The raw materials for polyolefins are, in general, commodity chemicals with numerous bulk suppliers andready availability at competitive prices.
A significant portion of the raw materials for our PP compounds are PP and other polymers (primarilyCatalloy process resins). Our PP compounding facilities generally receive their PP and other polymers fromone of our wholly owned or joint venture facilities via truck or rail car. In addition, there are four sites (two inEurope, one in North America and one in South America) that have both PP and PP compounding operationsco-located, thereby minimizing product handling. PB-1 raw materials are sourced solely from external supply.
Industry Dynamics / Competition
Our ethylene rated capacity in Western Europe at December 31, 2010 was approximately 4.2 billionpounds per year, or approximately 8% of the 53 billion pounds per year of total Western Europe ethyleneproduction capacity. Based on these published rated production capacities, we are the seventh largest producerof ethylene in Western Europe. In Western Europe, key ethylene competitors include INEOS, Dow, PolimeriEuropa, Total, SABIC, Shell, BASF and ExxonMobil.
Based on published data regarding PP capacity, we believe that we are the largest producer of PP inWestern Europe as of December 31, 2010, with 5.7 billion pounds per year of capacity, or approximately 25%of the Western European capacity for PP. Our largest competitors for sales of PP are Polimeri Europa, Total,SABIC, INEOS and Dow.
Based on published data regarding PE capacity, we believe that we are the largest producer of PE inWestern Europe as of December 31, 2010, with 5.5 billion pounds per year of capacity, or approximately 16%of HDPE and LDPE Western European capacity. Our largest competitors for sales of PE are ExxonMobil,Dow, INEOS, SABIC, Total, Polimeri Europe, and Repsol.
We believe we are the largest PP compounds producer in the world with 2.3 billion pounds (whichincludes our proportionate share of joint ventures) of installed annual capacity as of December 31, 2010.Approximately 54% of our PP compounding capacity is in Europe, 20% is in North America, and 26% is inthe rest of the world (including the capacity of our joint ventures). Our competitors for sales of PP compoundsare Borealis, ExxonMobil, King Fa, Mitsubishi, Mitsui , SABIC, Sumitomo Chemical Co., Ltd., WashingtonPenn and many other independent companies.
Our 110 million pound PB-1 capacity competes with polybutene producers, of which Mitsui is the largest,and other polymers, plastomers and elastomers.
Intermediates and Derivatives Segment
Overview
Our I&D segment produces and markets PO and its co-products and derivatives; acetyls; and ethyleneoxide and its derivatives. PO co-products include SM and C4 chemicals (TBA, oxyfuels (which is managed inthe Refining & Oxyfuels segment), isobutylene and TBHP). PO derivatives include PG, PGE and BDO. Webelieve that our proprietary PO and acetyls production process technologies provide us with a cost advantagedposition for these products and their derivatives. In 2010, our I&D segment generated $5.5 billion of revenues(excluding inter-segment revenue).
We produce PO through two distinct technologies based on indirect oxidation processes that yield co-products. One process yields TBA as the co-product; the other process yields SM as the co-product. The twotechnologies are mutually exclusive, necessitating that a manufacturing facility be dedicated either to PO/TBAor to PO/SM. Isobutylene and TBHP are derivatives of TBA. MTBE and ETBE are derivatives of isobutyleneand are gasoline blending components reported in our Refining & Oxyfuels segment. PG, PGE and BDO are
13

derivatives of PO. PG collectively refers to mono-propylene glycol (“MPG”), which is PG meeting U.S. phar-macopeia standards, and several grades of dipropylene glycol (“DPG”) and tri-propylene glycol (“TPG”).
The following table outlines:
• the primary products of our I&D segment;
• annual processing capacity as of December 31, 2010, unless otherwise noted; and
• the primary uses for those products.
Product Annual Capacity Primary Uses
Propylene Oxide (PO) 5.2 billion pounds(1) PO is a key component of polyols, PG, PGE and BDOPO Co-Products:
Styrene Monomer (SM) 6.4 billion pounds(2) SM is used to produce plastics, such as expandablepolystyrene for packaging, foam cups and containers,insulation products and durables and engineering resins
TBA Derivative Isobutylene 1.4 billion pounds(3) Isobutylene is a derivative of TBA used in themanufacture of synthetic rubber as well as fuel andlubricant additives, such as MTBE and ETBE
PO Derivatives:Propylene Glycol (PG) 1.2 billion pounds(4) PG is used to produce unsaturated polyester resins for
bathroom fixtures and boat hulls; antifreeze, coolantsand aircraft deicers; and cosmetics and cleaners
Propylene Glycol Ethers (PGE) 545 million pounds(5) PGE are used as solvents for paints, coatings, cleanersand a variety of electronics applications
Butanediol (BDO) 395 million pounds BDO is used in the manufacture of engineering resins,films, personal care products, pharmaceuticals, coatings,solvents and adhesives
Acetyls:Methanol 190 million gallons(6) Methanol is a raw material used to produce acetic acid,
MTBE, formaldehyde and several other productsAcetic Acid 1.2 billion pounds Acetic acid is a raw material used to produce VAM,
terephthalic acid (used to produce polyester for textilesand plastic bottles), industrial solvents and a variety ofother chemicals
Vinyl Acetate Monomer (VAM) 700 million pounds VAM is used to produce a variety of polymers, productsused in adhesives, water-based paint, textile coatingsand paper coatings
Ethylene Derivatives:Ethylene Oxide (EO) 800 million pounds EO
equivalents; 400million poundsas pure EO
EO is used to produce surfactants, industrial cleaners,cosmetics, emulsifiers, paint, heat transfer fluids andethylene glycol
Ethylene Glycol (EG) 700 million pounds EG is used to produce polyester fibers and film,polyethylene terephthalate resin, heat transfer fluids andautomobile antifreeze
Ethylene Glycol Ethers 225 million pounds Ethylene glycol ethers are used to produce paint andcoatings, polishes, solvents and chemical intermediates
Other:Flavor and Fragrance Chemicals(7) Flavor and fragrance chemicals include terpene-based
fragrance ingredients and flavor ingredients, primarilyfor the oral care markets, and also include productsused in applications such as chemical reaction agents,or initiators, for the rubber industry and solvents andcleaners, such as pine oil, for the hard surface cleanermarkets
(1) Includes (i) 100% of the 385 million pounds of capacity of Nihon Oxirane (described below) of which weown 40%; (ii) 1.5 billion pounds of capacity that represents Bayer Corporation’s (“Bayer”) share of POproduction from the Channelview PO/SM I plant and the Bayport, Texas PO/TBA plants under the U.S.
14

PO Joint Venture (described below); (iii) 100% of the 690 million pounds of capacity of the MaasvlaktePO/SM plant owned by the European PO Joint Venture, as to which Bayer has the right to 50% of the pro-duction; and (iv) 100% of the 600 million pounds of capacity of Ningbo ZRCC (described below) ofwhich we own 27%.
(2) Includes (i) approximately 700 million pounds of SM production from the Channelview PO/SM II plantthat is committed to unrelated equity investors under processing agreements; (ii) 100% of the 830 millionpounds of capacity of Nihon Oxirane; (iii) 100% of the 1.5 billion pounds of capacity of the MaasvlaktePO/SM plant; and (iv) 1.3 billion pounds of capacity from Ningbo ZRCC.
(3) Represents total high-purity isobutylene capacity and purified isobutylene capacity.
(4) PG capacity includes 100% of the approximately 220 million pounds of capacity of Nihon Oxirane. Thecapacity stated is MPG capacity. Smaller quantities of DPG and TPG are co-produced with MPG.
(5) Includes 100% of the 110 million pounds associated with a tolling arrangement with Shiny Chemical Co.,Ltd. (“Shiny”).
(6) Represents 100% of the methanol capacity at the La Porte, Texas facility, which is owned by La PorteMethanol Company, a partnership owned 85% by us.
(7) The Flavor and Fragrance chemicals business was sold in December 2010.
See “Description of Properties” for the locations where we produce the primary products of our I&Dsegment. Annual processing capacity as of December 31, 2010 was calculated by estimating the averagenumber of days in a typical year that a production unit of a plant is expected to operate, after allowing fordowntime for regular maintenance, and multiplying that number by an amount equal to the unit’s optimal dailyoutput based on the design raw material mix. Because the processing capacity of a production unit is anestimated amount, actual production volumes may be more or less than the capacities set forth below. Exceptas indicated, capacities shown include 100% of the capacity of joint venture facilities.
Sales & Marketing / Customers
In 2010, no single I&D segment customer accounted for 10% or more of our total revenues.
We estimate, based in part on published data, that worldwide demand for PO was approximately15.1 billion pounds in 2010. More than 75% of that volume was consumed in the manufacture of threefamilies of PO derivative products: polyols, glycols and glycol ethers. The remainder was consumed in themanufacture of performance products, including BDO and its derivatives.
We produce and deliver our PO and PO co-products through sales agreements, processing agreements andspot sales as well as product exchanges. We have a number of multi-year processing (or tolling) and salesagreements. In addition, Bayer’s ownership interest in the U.S. PO Joint Venture, which operates four of theU.S. operating units, represents ownership of an in-kind portion of the PO production. Bayer also has the rightto 50% of the production of one of the facilities in The Netherlands. Our PO derivatives are sold throughmarket-based sales contracts and spot sales. PO sold in the merchant market accounted for less than 10% ofour total revenues in 2010.
Production levels at the PO/SM and PO/TBA co-product facilities are primarily determined by thedemand for PO and PO derivatives. As a result, production levels of SM and TBA and its derivatives,isobutylene, TBHP, MTBE, and ETBE is based primarily on the demand for PO and PO derivatives andsecondarily on the relative market demand for the co-products and the operational flexibility of our facilitiesin meeting this demand. MTBE and ETBE our reported in our Refining & Oxyfuels segment.
Based on published data, worldwide demand for SM in 2010 is estimated to have been approximately56 billion pounds. SM accounted for less than 10% of our total revenues in 2010. We sell most of our SMproduction into the North American and European merchant markets and to Asian and South American exportmarkets through long-term sales contracts and processing agreements.
15
We purchase SM for resale, when necessary, to satisfy customer demand above production levels.Volumes of SM purchases made for resale can vary significantly from period to period. However, purchasedvolumes have not historically had a significant impact on profits.
Our I&D segment converts most of its TBA, which is produced as a co-product to the PO process, toisobutylene and sells some of the TBA into the market. Over half of the isobutylene from the I&D segment isreacted with methanol or ethanol to produce MTBE and ETBE, which is marketed by the Refining & Oxyfuelssegment. The remaining isobutylene is sold as high purity and purity grade isobutylene by the I&D segment.Isobutylene sales accounted for less than 10% of our total revenues in 2010.
Sales of our PO, its co-products, and its derivatives are made by us, Nihon Oxirane (a joint venture ofwhich we own 40%) and their affiliates directly, and through distributors and independent agents located in theAmericas, Europe, the Middle East, Africa and the Asia Pacific region. We have centralized certain sales andorder fulfillment functions in regional customer service centers located in Houston, Texas; Rotterdam, TheNetherlands; and Hong Kong, China. PO, PG and SM are transported by barge, ocean going vessel, pipeline,rail car and tank truck. BDO is primarily transported by tank truck and rail car.
Acetic acid and VAM are manufactured at a facility in La Porte, Texas, and are consumed internally, soldworldwide generally under multi-year contracts and sold on a spot basis. Acetic acid and VAM are shipped bybarge, ocean going vessel, pipeline, rail car and tank truck. We have bulk storage arrangements in Europe andSouth America to serve our customers’ requirements in those regions. Sales are made through a direct salesforce, agents and distributors. Sales of acetyls, including acetic acid and VAM, collectively accounted for lessthan 10% of our total revenues in 2010.
We estimate, based on published data, that worldwide demand in 2010 for acetic acid and VAM was23.3 billion pounds and 11.4 billion pounds, respectively.
Methanol is produced at a La Porte, Texas facility owned by La Porte Methanol Company, our 85%owned joint venture with Linde. Each party to the joint venture receives its respective share of the methanolproduction. Our acetyls business uses the methanol as a raw material for acetic acid and also sells themethanol under annual contracts and on a spot basis to large U.S. customers. The product is shipped by bargeand pipeline.
Ethylene oxide (“EO”) or EO equivalents, and EO’s primary derivative, ethylene glycol (“EG”), areproduced at a wholly owned facility located in Bayport, Texas. The Bayport facility also produces otherderivatives of EO, principally glycol ethers.
EO and EG typically are sold under multi-year contracts, with market-based pricing. Glycol ethers andethanolamines are sold primarily into the solvent and distributor markets at market prices. EO is shipped byrail car, and its derivatives are shipped by rail car, truck, isotank or ocean-going vessel. EO and EG salesaccounted for less than 10% of our total revenues in 2010.
The vast majority of the ethylene derivative products are sold in North America and Asia, primarilythrough our sales organizations.
16

Joint Venture Relationships
The following table describes our I&D segment’s significant manufacturing joint venture relationships.
Name Location Other PartiesLyondellBasell
Ownership Product 2010 Capacity (1)(In millions of pounds)
U.S. PO Joint Venture . . . . . . Channelview, TX Bayer (2) Propylene Oxide 1,500(3)Bayport, TX
European PO Joint Venture. . . Rotterdam, Bayer 50% Propylene Oxide 690The Netherlands Styrene Monomer 1,480
PO/ SM II LP . . . . . . . . . . . . Channelview, TX IPIC & BASF (2) Styrene Monomer 700(3)
Nihon Oxirane . . . . . . . . . . . Chiba, Japan Sumitomo 40% Propylene Oxide 385Styrene Monomer 830Propylene Glycol 220
Ningbo ZRCC LCC Ltd.(4) . . Ningbo, China ZRCC 27% Propylene Oxide 600Styrene Monomer 1,300
La Porte Methanol. . . . . . . . . La Porte, TX Linde 85% Methanol 190 million gallons
(1) Unless otherwise noted, represents the joint venture’s total capacity and not our proportional capacity.
(2) The parties’ rights in the joint ventures are based on off-takes, as opposed to ownership percentages.
(3) Amount of off-take by other parties in the joint venture.
(4) Start-up occurred in mid-2010.
Bayer’s ownership interest in the U.S. PO Joint Venture represents its off-take of 1.5 billion pounds of thejoint venture’s PO production. We take, in-kind, the remaining PO production and all co-product (SM andTBA) production. Lyondell Chemical and Bayer have a separate joint venture, the PO Technology JointVenture, through which Bayer was granted a non-exclusive and non-transferable right to use certain of ourproprietary PO technology in the U.S. PO Joint Venture. Under the terms of operating and logisticsagreements, we operate the U.S. PO Joint Venture plants and arrange and coordinate the logistics of POdelivery from the plants. We do not share marketing or product sales with Bayer under the U.S. PO JointVenture.
Lyondell Chemical and Bayer also have a 50/50 joint venture, the European PO Joint Venture, for theownership of the Maasvlakte PO/SM plant near Rotterdam, The Netherlands. Each party takes in-kind 50% ofthe PO and SM production of the European PO Joint Venture.
Lyondell Chemical’s PO/SM II plant at the Channelview, Texas complex was created through a jointventure among Lyondell Chemical, BASF and IPIC. Lyondell Chemical retains a majority interest in the jointventure and is the operator of the plant. As of December 31, 2010, 700 million pounds of SM capacity wascommitted to BASF and IPIC under processing arrangements.
In addition to the Nihon Oxirane joint venture shown in the table above, we participate in marketing mostof the PO capacity from a 440 million pound facility in Rabigh, Saudi Arabia owned by Sumitomo and SaudiAramco, through NOC Asia Co. Ltd. in which we have a 40% equity interest.
We jointly market all of the PO manufactured by the Ningbo ZRCC joint venture.
We also have a multi-year processing agreement, entered into by Lyondell Chemical and Shiny, wherebywe provide the raw materials used to produce PGE at Shiny’s PGE plant in Tainan, Taiwan.
Raw Materials
The primary raw materials used for the production of PO and its co-products and derivatives arepropylene, isobutane, mixed butane, ethylene and benzene. The market prices of these raw materialshistorically have been related to the price of crude oil, NGLs and natural gas, as well as market conditions forthe raw materials. These raw materials are received in bulk quantities via pipeline or ocean going vessels.
17
In the U.S., we obtain a large portion of our propylene, benzene and ethylene raw materials needed forthe production of PO and its co-products and derivatives internally from our crackers. Raw materials for thenon-U.S. production of PO and its co-products and derivatives primarily are obtained from unrelated parties.We consume a significant portion of our internally-produced PO in the production of PO derivatives.
We consume large volumes of mixed butane for the production of PO and its co-products and derivatives.We have invested in facilities, or entered into processing agreements with unrelated parties, to convert thewidely available commodity, normal butane, to isobutane. We also are a large consumer of oxygen for our PO/TBA plants.
The cost of raw materials generally is the largest component of total production cost for PO and its co-products and derivatives. Generally, the raw material requirements for these businesses are purchased atmarket-based prices from numerous suppliers in the U.S. and Europe with which we have establishedcontractual relationships, as well as in the spot market. The raw materials for these businesses are, in general,commodity chemicals with ready availability at competitive prices. Historically, raw material availability hasnot been an issue. However, in order to enhance reliability and competitiveness of prices and rates for suppliesof raw materials, industrial gas and other utilities, we have long-term agreements and other arrangements for asubstantial portion of our production requirements.
The primary raw materials required for the production of acetic acid are carbon monoxide and methanol.We purchase the carbon monoxide from Linde pursuant to a long-term contract under which pricing is basedprimarily on cost of production. La Porte Methanol Company, our 85%-owned joint venture, supplies all of themethanol requirements for acetyls production. Natural gas is the primary raw material required for theproduction of methanol.
In addition to ethylene, acetic acid is a primary raw material for the production of VAM. For theproduction of VAM, we obtain our entire requirements for acetic acid and ethylene from our internalproduction. In 2010, we used a large percentage of our acetic acid production to produce VAM.
Industry Dynamics / Competition
With respect to PO, its co-products and derivatives, competition is based on a variety of factors, includingproduct quality and price, reliability of supply, technical support, customer service and potential substitutematerials. Profitability is affected by the worldwide level of demand along with price competition, which mayintensify due to, among other things, new industry capacity. It is expected that from 2011 to 2012,approximately 9% of the 2010 worldwide PO capacity will be added in China and Thailand. During the sameperiod, average world demand is expected to grow by approximately 6%. However, demand is a function ofworldwide economic growth, which fluctuates. The PO demand growth rate also could be impacted by furtherdevelopment of alternative bio-based PO derivatives. It is not possible to predict accurately the changes in rawmaterial costs, market conditions and other factors that will affect industry profitability in the future.
Based on published data regarding PO capacity, we believe that, including our share of Nihon Oxirane,Ningbo ZRCC and the European PO Joint Venture, we are the second largest producer of PO worldwide, withapproximately 19% of the total worldwide capacity for PO. Our major worldwide competitors for sales of POand its derivatives are Dow and Shell.
Based on published data regarding SM capacity, we believe that we are one of the largest producers ofSM worldwide, with approximately 5% of the total worldwide capacity for SM as of December 31, 2010. Wecompete worldwide for sales of SM with many marketers and producers, among which are BASF, Dow,INEOS, Shell and Total.
We believe that we are the fourth and sixth largest producer of acetic acid and VAM, respectively, eachwith approximately 4% and 5% of the total worldwide capacity as of December 31, 2010. Our primarycompetitors include Celanese and BP for acetic acid and Celanese, Dow and DuPont for VAM.
18

Refining & Oxyfuels Segment
Overview
Our Refining & Oxyfuels segment refines heavy, high-sulfur crude oil in the U.S. Gulf Coast, refineslight and medium weight crude oil in southern France and produces gasoline blending components at severalof our olefin and PO units. In 2010, our Refining & Oxyfuels segment generated operating revenues of$13.5 billion (excluding inter-segment revenue).
The Houston Refinery, which is located on the Houston Ship Channel in Houston, Texas, has a heavy,high-sulfur crude oil processing capacity of approximately 268,000 barrels per day on a calendar day basis(normal operating basis), or approximately 292,000 barrels per day on a stream day basis (maximumachievable over a 24 hour period). The Houston Refinery has a Nelson Complexity Index of 11.4. TheHouston Refinery is a full conversion refinery designed to refine heavy, high-sulfur crude oil. This crude oil ismore viscous and dense than traditional crude oil and contains higher concentrations of sulfur and heavymetals, making it more difficult to refine into gasoline and other high-value fuel products. However, this crudeoil has historically been less costly to purchase than light, low-sulfur crude oil. Processing heavy, high-sulfurcrude oil in significant quantities requires a refinery with extensive coking, catalytic cracking, hydrotreatingand desulfurization capabilities, i.e., a “complex refinery.” The Houston Refinery’s refined fuel productsinclude gasoline (including blendstocks for oxygenate blending), jet fuel and ultra low sulfur diesel. TheHouston Refinery’s products also include heating oil, lube oils (industrial lubricants, white oils and processoils), carbon black oil, refinery-grade propylene, petrochemical raw materials, sulfur, residual fuel andpetroleum coke.
The Berre Refinery is designed to run light to medium sulfur crude oil and has a current capacity ofapproximately 105,000 barrels per day. It produces naphtha, vacuum gas oil, liquefied petroleum gas, gasoline,aviation fuel, diesel, bitumen and heating oil. The Berre Refinery provides raw material and site integrationfor our operations in France and supports our polyolefin business in Europe. The Berre Refinery also providesus with access to significant logistics assets, including pipeline access, storage terminals and harbor access tothe Mediterranean Sea. The Berre Refinery has a Nelson Complexity Index of 6.7.
The Refining & Oxyfuels segment also includes gasoline blending components such as MTBE, ETBEand alkylate. MTBE and ETBE are produced as co-products of the PO and olefin production process at foursites located in the United States, France and The Netherlands. In 2009, we converted one of our MTBE unitsat Channelview, Texas to ETBE production. We currently have three sites that can produce either MTBE orETBE with a combined capacity to produce 59,000 barrels per day of MTBE or ETBE; the Company’s totalcapacity for MTBE or ETBE production is 75,000 barrels per day. Alkylate is produced at one facility locatedin Texas.
The following table outlines:
• the primary products of our Refining & Oxyfuels segment;
• capacity as of December 31, 2010, unless otherwise noted; and
• the primary uses for those products.
See “Description of Properties” for the locations where we produce the primary products of ourRefining & Oxyfuels segment.
19

Key Products Capacity(1) Primary Uses
Houston Refinery:Gasoline and components . . . . . . . . . 120,000 barrels per day Automotive fuel
Ultra Low Sulfur Diesel . . . . . . . . . . 95,000 barrels per day Diesel fuel for cars and trucks
Jet Fuel . . . . . . . . . . . . . . . . . . . . . . 25,000 barrels per day Aviation fuel
Lube Oils. . . . . . . . . . . . . . . . . . . . . 4,000 barrels per day Industrial lube oils, railroad engineadditives and white oils for food-gradeapplications
Berre Refinery:Diesel . . . . . . . . . . . . . . . . . . . . . . . 42,000 barrels per day Diesel fuel for cars and trucks
Cracker Feedstock . . . . . . . . . . . . . . 27,000 barrels per day Raw material for Olefin unit
Fuel Oil . . . . . . . . . . . . . . . . . . . . . . 12,000 barrels per day Heating fuel
Gasoline . . . . . . . . . . . . . . . . . . . . . 8,000 barrels per day Automotive fuel
Bitumen . . . . . . . . . . . . . . . . . . . . . . 7,000 barrels per day Asphalt
Gasoline Blending Components:MTBE/ ETBE . . . . . . . . . . . . . . . . . 75,000 barrels per day(2) MTBE is a high octane gasoline
blending component; ETBE is analternative gasoline blendingcomponent based on agriculturallyproduced ethanol
Alkylate . . . . . . . . . . . . . . . . . . . . . . 22,000 barrels per day Alkylate is a high octane gasolineblending component
(1) Only certain key products for the Houston Refinery and the Berre Refinery are identified. Thus, the sumof the capacities in this table will not equal either facility’s total capacity.
(2) Represents total combined MTBE and ETBE capacity.
Sales & Marketing / Customers
In 2010, no single Refining & Oxyfuels segment customer accounted for 10% or more of our totalrevenues.
In the U.S., we market and sell gasoline (including blendstocks for oxygenate blending), jet fuel, heatingoil, ultra low sulfur diesel fuel, lube oils, coke and sulfur produced at the Houston Refinery. These productsare sold in large commodity markets. The Houston Refinery evaluates and determines its optimal productoutput mix, based on market prices and conditions. As a result, we are subject to various risks associated withselling commodity products.
Gasoline sales accounted for 9% of our total revenues in 2010. The Houston Refinery’s products primarilyare sold in bulk on the U.S. Gulf Coast to other refiners, marketers, distributors and wholesalers at market-related prices. Diesel fuel is produced to meet ultra low sulfur specifications for the on-road transportationmarket. Most of the Houston Refinery’s products are sold under contracts with a term of one year or less orare sold in the spot market. The Houston Refinery’s products generally are transported to customers viapipelines and terminals owned and operated by other parties. Products also are transported via rail car, barge,truck and ocean going vessel. In addition to sales of refined products produced by the Houston Refinery, wealso sell refined products purchased or received on exchange from other parties. The exchange arrangementshelp optimize refinery supply operations and lower transportation costs. To meet market demands, we alsofrom time to time purchase refined products manufactured by others for resale to our customers. However,purchased volumes have not historically had a significant impact on profitability.
In Europe, the Berre Refinery provides a significant portion of the raw materials requirements for ournearby steam cracker. The remaining products are sold into local markets under market-based sales agreements
20
or in the spot market. Key customers of the Berre Refinery include other refiners, marketers and distributors,and its products are primarily transported via pipelines and other infrastructure assets owned by us.
MTBE and ETBE are derivatives of TBA, which is a co-product of the PO produced by our I&Dsegment. As described, production levels of the TBA derivatives MTBE and ETBE depend primarily on thedemand for PO and PO derivatives and secondarily on the relative market demand for MTBE and ETBE andthe operational flexibility of our multiple production facilities in meeting this demand. Separately, MTBE andalkylate are also produced as derivatives of the ethylene co-products produced by our O&P — Americassegment. When necessary, we purchase MTBE for resale to satisfy customer demand for MTBE above ourproduction levels. Volumes of MTBE purchased for resale can vary significantly from period to period.However, purchased volumes have not historically had a significant impact on profitability.
We sell our MTBE and ETBE production under market-based sales agreements and in the spot market.We blend our alkylate into gasoline and also sell alkylate under short-term contracts and in the spot market.Sales of MTBE and ETBE together, and alkylate each accounted for less than 10% of our total revenues in2010.
Substantially all refiners and blenders have discontinued the use of MTBE in the U.S., partly as a resultof governmental initiatives to increase use of bio-ethanol in gasoline and to reduce or effectively ban the useof MTBE. However, MTBE/ETBE demand for gasoline blending remains strong within most of the remainingworldwide market. Accordingly, we market MTBE and ETBE produced in the U.S. for use outside of theU.S. Our MTBE/ETBE plants generally have the flexibility to produce either MTBE or ETBE to accommodatemarket needs.
Japan has opted to use ETBE as a means of meeting its carbon dioxide reduction commitments under theKyoto Protocol, and we source a significant portion of Japan’s bio-fuels needs.
Sales of our MTBE, ETBE and alkylate are made by our marketing and sales personnel, and throughdistributors and independent agents located in the Americas, Europe, the Middle East, Africa and the AsiaPacific region. We have centralized certain sales and order fulfillment functions in regional customer servicecenters located in Houston, Texas; Rotterdam, The Netherlands; and Hong Kong, China. We also have long-term contracts for distribution and logistics to supply to our customers. MTBE, ETBE and alkylate aretransported by barge, ocean going vessel and tank truck.
Raw Materials
The largest source of the crude oil used as a raw material for the Houston Refinery in the past severalyears has been a crude supply agreement with PDVSA-Petroleo S.A., a corporation organized under the lawsof the Bolivarian Republic of Venezuela, which terminates in July 2011. During 2010, less than half of ourcrude supply was purchased under the crude supply agreement with PdVSA.
Most of the crude oil used as a raw material for the Berre Refinery is sourced from North Africa, theMiddle East, Russia and other areas generally available in the Mediterranean region.
We purchase our ethanol requirements for the production of ETBE from regional producers and importersin Europe at market-related prices. Additionally, we have entered into a supply contract with a Brazilianethanol producer to supply a significant portion of the ethanol used for the manufacture of ETBE at ourChannelview facility. For further discussion regarding the raw materials requirements for the production ofMTBE, ETBE and alkylate, see “— Intermediates and Derivatives — Raw Materials.”
Industry Dynamics / Competition
The markets for fuel products tend to be volatile as well as cyclical as a result of changing globaleconomic conditions and prices for crude oil and refined product prices. Crude oil prices are impacted byworldwide economic conditions and political events, the economics of exploration and production, refinedproducts demand and currency fluctuations. Prices and demand for fuel products are influenced by seasonaland short-term factors such as weather and driving patterns, as well as by longer term issues such as the
21
economy, energy conservation and alternative fuels. Industry fuel products supply is dependent on short-termindustry operating capabilities and on long-term refining capacity.
With a throughput capacity of approximately 268,000 barrels per day (on a calendar day basis), webelieve that the Houston Refinery is among North America’s largest full conversion refineries capable ofprocessing significant quantities of heavy, high-sulfur crude oil.
In North America, we compete for the purchase of heavy, high-sulfur crude oil based on price andquality. Our crude oil supply contract with PDVSA Oil terminates in July 2011, which will increase the needfor us to purchase crude oil competitively on the open market. We began diversifying our portfolio in 2010and expect to continue to purchase some of our crude oil from sources other than PDVSA on market-basedterms. We compete in gasoline and distillate markets as a bulk supplier of fungible products satisfying industryand government specifications. Competition is based on price and location. Our refining competitors are majorintegrated oil companies, refineries owned or controlled by foreign governments and independent domesticrefiners. Based on published data, as of January 2011, there were 148 operable crude oil refineries in the U.S.,and total U.S. refinery capacity was approximately 17.6 million barrels per day.
During 2010, the Houston Refinery processed an average of approximately 241,000 barrels per day ofcrude oil, representing approximately 1% of all U.S. crude processing capacity.
A crack spread is a benchmark indication of refining margins based on the processing of a specific typeof crude oil into an assumed selection of refined products. The Houston Refinery generally tracks the Maya 2-1-1 crack spread, which represents the difference between the first month futures price of two barrels of Mayacrude oil as set by Pemex and one barrel each of U.S. Gulf Coast 87 Octane Conventional Gasoline andU.S. Gulf Coast No. 2 Heating Oil (high-sulfur diesel). The Berre Refinery refining spreads generally track the4-1-2-1 Ural reported benchmark spread. This spread is calculated by adding the price of one barrel ofgasoline to the price of two barrels of diesel and one barrel of #6 fuel oil and subtracting the price of fourbarrels of Mediterranean crude oil. While these benchmark refining spreads are generally indicative of thelevel of profitability at both the Houston Refinery and the Berre Refinery, there are many other factors specificto each refinery that influence operating results.
We believe that we are the largest producer of MTBE/ETBE worldwide. We compete for sales of MTBEand ETBE with independent MTBE producers worldwide and independent ETBE producers mainly in Europe.The most significant MTBE competitor is Saudi Basic Industries Corp., and the most significant ETBEcompetitors are Repsol, Total, Neste and Braskem. MTBE and ETBE face competition from products such asethanol and other octane components. We compete with other refiners and olefin manufacturers for sales ofalkylate that we do not internally blend into gasoline.
Technology Segment
Overview
Our Technology segment develops and licenses polyolefin and other process technologies and providesassociated engineering and other services. Our Technology segment further develops, manufactures and sellspolyolefin catalysts. We market our process technologies and our polyolefin catalysts to external customersand also use them in our own manufacturing operations. In 2010, our Technology segment generated operatingrevenues of $395 million (excluding inter-segment revenue).
Our polyolefin process licenses are structured to provide a standard core technology, with individualcustomer needs met by adding customized modules that provide the required capabilities to produce thedefined production grade slate and plant capacity. For licenses involving proven technologies, we typicallyreceive the majority of our license fees in cash at or before the date of customer acceptance rather thanongoing royalties. For these licenses, we generally recognize revenue upon delivery of the process designpackage and the related license. Each license agreement includes long-term confidentiality provisions toprotect the technology. In addition to the basic license agreement, a range of services can also be provided,including project assistance; training; start-up assistance of the plant; and supply of resins from our productionfor pre-marketing by the licensee. We may also offer marketing and sales services. In addition, licensees
22
generally continue to purchase polyolefin catalysts that are consumed in the production process, generallyunder long-term catalyst supply agreements with us.
Process Technology Licensing
We are a leading licensor of polyolefin process technologies.
Our PP licensing portfolio includes our Spheripol and Spherizone process technologies as well asMetocene technology.
Our PE process licensing portfolio comprises the Lupotech T (high pressure tubular process for producingLDPE), the Lupotech A (autoclave process mainly for producing ethylene vinyl acetate (EVA) copolymers),Hostalen (slurry process for producing multimodal HDPE), and Spherilene (gas phase process for producingfull-density range of LLDPE to HDPE) processes.
In addition, we license a selective portfolio of chemical process technologies in the fields of olefinrecovery, olefin conversion, aromatics extraction and acetyls.
Since 2000, we have sold licenses representing approximately 25 million tons of polyolefin capacity,which represents about 40% of worldwide installed capacity. In 2010, we entered into licensing agreementsrepresenting about one million tons of polyolefin capacity. Process licenses accounted for less than 10% of ourtotal revenues in 2010.
Our Technology segment also provides technology services to our licensees. Such services include safetyreviews, training and start-up assistance, engineering services for process and product improvements andmanufacturing troubleshooting.
PP Process Technology
We license several PP process technologies, including Spheripol, Spherizone and Metocene.
Our Spheripol technology produces homopolymers and random copolymers in a single stage and impactcopolymers in a multi-stage process. We believe that the Spheripol process is the most widely used PPproduction process in the world.
The Spherizone process, our newest technology, commercialized in 2002 and introduced for licensing in2004, is able to produce higher quality PP, novel PP-based polyolefinic resins, and a wider product graderange than existing processes at similar operating cost. The Spherizone process introduces a single reactorconcept, in which bimodality is created within one single reactor operating at different conditions between thedifferent zones inside the reactor. The final product is a result of an intimate mixing of the different propertydetermining phases at a “macro molecular” level.
Metocene PP technology was introduced for licensing in 2006. This add-on technology for the productionof specialty PP products is based on using single-site catalyst systems. Metocene technology can be adapted tovirtually any PP process, and its versatility expands the end use product range of conventional PP. In 2009,Polymirae became the first licensee to commence commercial production of Metocene.
PE Processes Technology
The different families of PE (HDPE, LDPE and LLDPE) require specialized process technologies forproduction, which are available through our broad PE process licensing portfolio. The portfolio includesLupotech, Spherilene and Hostalen process technologies.
Lupotech T is a high pressure, tubular reactor process for the production of LDPE. This high pressuretechnology does not use a catalyst system typical for low pressure processes, but rather peroxide initiators topolymerize ethylene and optionally VAM for EVA-copolymers. By adjusting the temperature profile along thereactor and adding different peroxide mixtures, process conditions are modified to produce the desiredproducts. The process produces the entire melt flow ratio and density range with competitive investment costsand low utilities and raw material demand.
23

Lupotech A is a high pressure autoclave process using peroxide mixture for polymerization and is mainlyutilized for specialty LDPE and for the production of EVA copolymers with high VAM content.
Spherilene is a flexible gas-phase process for the production of the entire density range of PE productsfrom LLDPE and MDPE to HDPE. The flexibility of this technology, which is demonstrated by a broadportfolio of grades, enables licensees to effectively manage the continuously dynamic PE markets at lowinvestments costs and very low operating costs.
Hostalen is a low-pressure slurry process technology for the production of high-performance multimodalHDPE grades. This is desirable because a different product structure can be produced in each stage of thepolymerization process, yielding products that are tailored for demanding processing requirements andsophisticated end use applications such as film, blow molding and pipe applications.
Chemical Process Technologies
We also offer for licensing a selective number of chemical processes, including the group of Trans4mprocesses, Aromatics extractions, Glacido and Vacido technology.
The Trans4m portfolio of process technologies offers tailored solutions for C4 and higher olefin recoveryand conversion. These processes include separation, purification and skeletal isomerization of the C4 and C5olefin streams for the selective conversion of low-value, mixed olefin streams from crackers to isobutylene,isoamylenes, butadiene, isoprene, piperylene and Dicyclopentadiene (DCPD). This group of processes iscomplemented by Aromatics extractions technology, which enables LyondellBasell to offer a comprehensiveportfolio of processes to upgrade all olefinic streams from steam crackers to higher value products.
Glacido is a process technology for manufacturing of acetic acid by carbonylation of methanol. It utilizesa Rhodium-based homogeneous catalyst system. Vacido is a fixed-bed tubular process for the production ofhigh-quality VAM, from acetic acid and ethylene. It utilizes a proprietary heterogeneous catalyst system.
Superflex technology produces propylene and ethylene, and is based on a fluidized catalytic reactor. Theprocess technology is used for cracking less refined feedstock such as coker or fluid catalytic cracking unitlight gasoline as well as mixed C4 to C9 streams.
Polyolefin Catalysts
Under the Avant brand, we are a leading manufacturer and supplier of polyolefin catalysts. Polyolefincatalysts accounted for less than 10% of our total revenues in 2010. As a large polyolefin producer,approximately 30% of catalyst sales are inter-company. Polyolefin catalysts are packaged and shipped viaroad, sea or air to our customers.
We produce catalysts at two facilities in Germany, one facility in Italy and one facility in the U.S. Ourpolyolefin catalysts, which are consumed during the polyolefin production process and define the processingand mechanical properties of polyolefins, provide enhanced performance for our process technologies and arebeing developed to enhance performance when used in third-party process technologies. We also supplycatalysts for producing sophisticated PEs.
Customers using polyolefin catalysts must make continual purchases, because they are consumed duringthe polyolefin production process. New licensees generally elect to enter into long-term catalyst supplyagreements.
Sales & Marketing
In 2010, no single Technology segment customer accounted for 10% or more of our total revenues. Wemarket our process technologies and catalysts to external customers and also use them for our own polyolefinmanufacturing operations. We have a marketing and sales force dedicated to the Technology segment,including catalyst sales and customer technical support for licensees.
24

Industry Dynamics / Competition
We believe that competition in the polyolefin process licensing industry is based on the quality andefficiency of the process technology, product performance and product application, complemented by customerservice and technical support. Since the formation of Basell in 2000 through December 31, 2010, we havesold licenses representing approximately 25 million tons of capacity based on its six process technologies topolyolefin manufacturers. We estimate that approximately 40% of PP and 31% of PE worldwide licensedcapacity from 2003 through 2010 use our technologies. As of December 31, 2010, we estimate that over 200polyolefin production lines use our licensed process technologies. Our major competitors in PP technologieslicensing are Dow Chemical, INEOS, Novolene Technology Holdings and Mitsui Chemicals. Our majorcompetitors in PE technologies licensing are Chevronphillips, INEOS, Mitsui Chemicals and UnivationTechnologies.
We are one of the world’s largest manufacturers and suppliers of PP catalysts. We also supply catalystsfor producing PEs. Our major competitors in the worldwide catalyst business are Dow Chemical, BASF, MitsuiChemicals, Toho Catalyst and WR Grace.
Research and Development
Our research and development activities are designed to improve our existing products and discover andcommercialize new materials, catalysts and processes. These activities focus on product and applicationdevelopment, process development, catalyst development and fundamental polyolefin focused research.
We have four research and development facilities, each with a specific focus. Our facility in Frankfurt,Germany focuses on PE and metallocene catalysts. Our facility in Ferrara, Italy focuses on PP, PB-1, PPcompounds and Ziegler-Natta catalysts. Our facility in Cincinnati, Ohio focuses on polyolefin product andapplication development in North America. Our center in Newtown Square, Pennsylvania develops chemicalcatalysts and technologies.
Our financial performance and market position depend in substantial part on our ability to improve ourexisting products and discover and commercialize new materials, catalysts and processes. Our research anddevelopment is organized by core competence communities that manage and provide resources for projects,intellectual property and catalyst manufacturing. These include:
• Catalyst systems: catalyst research to enhance our polyolefin polymer properties, catalyst and processperformance, including Ziegler Natta, chromium and metallocene catalyst.
• Manufacturing platforms: research to advance process development and pilot plant integration toindustrialize technology with improved polymer properties.
• Product and application development: working directly with customers to provide new products withenhanced properties.
• Processing testing and characterization: research to increase knowledge on polymers from productionto processability.
• Process design and support: research to reduce production and investment costs while improvingprocessability.
• Chemicals and fuels technologies: research to develop and improve catalysts for existing chemicalprocesses and improve process unit operations.
• We have core research and development projects that focus on initiatives in line with our strategicdirection. These projects are closely aligned with our businesses and customers with a goal of commercializa-tion of identified opportunities. Core projects currently include research and development in areas such as:
• PP product development with emphasis on Spherizone process technology.
• Next generation products from existing and in-development processes, using advanced catalyst technol-ogies including metallocenes.
25

• Enhanced catalyst and process opportunities to extend gas phase PE technology.
• Enhanced catalysts and process opportunities for selected chemical technologies.
As of December 31, 2010, approximately 915 of our employees are directly engaged in research anddevelopment activities.
In addition to our research and development activities, we provide technical support to our customers.Our technical support centers are located in Bayreuth, Germany; Geelong, Australia; Lansing, Michigan; andTarragona, Spain.
In 2010, 2009 and 2008, our research and development expenditures were $154 million, $145 million and$194 million, respectively. A portion of these expenses are related to technical support and customer serviceand are allocated primarily to the segments.
GENERAL
Intellectual Property
We maintain an extensive patent portfolio and continue to file new patent applications in the U.S. andother countries. As of December 31, 2010, we owned approximately 6,500 patents and patent applicationsworldwide. Our patents and trade secrets cover our processes, products and catalysts and are significant to ourcompetitive position, particularly with regard to propylene oxide, intermediate chemicals, petrochemicals,polymers and our process technologies such as Spheripol, Spherizone, Hostalen, Spherilene, Lupotech,Glacido, Vacido, Isomplus and Avant catalysts. We own globally registered and unregistered trademarksincluding the “LyondellBasell,” “Lyondell,” “Equistar” and “Houston Refining” trade names. While we believethat our intellectual property provides competitive advantages, we do not regard our businesses as beingmaterially dependent upon any single patent, trade secret or trademark. Some of our heritage productioncapacity operates under licenses from third parties.
We rely on patent, copyright and trade secret laws of the countries in which we operate to protect ourinvestment in research and development, manufacturing and marketing. Our employees working on thesetechnologies are required to enter into agreements, or are covered by other arrangements such as collectivebargaining agreements, providing for confidentiality and the assignment of rights to inventions made by themwhile employed by us.
Environmental
Regulation
We are subject to extensive international, national, state, local and environmental laws, regulations,directives, rules and ordinances concerning, and are required to have permits and licenses regulating, emissionsto the air, discharges onto land or waters and the generation, handling, storage, transportation, treatment,disposal and remediation of hazardous substances and waste materials.
Under the European Union (“EU”) Integrated Pollution Prevention and Control Directive (“IPPC”), EUMember State governments are to adopt rules and implement an environmental permitting program relating toair, water and waste for individual facilities. The EU countries are at varying stages in their respectiveimplementation of the IPPC permit program. We do not know with certainty what future IPPC permits willrequire, or the future costs of compliance with the IPPC permit program. The EU also has passed legislationgoverning the registration, evaluation and authorization of chemicals, known as REACh, pursuant to which weare required to register chemicals and gain authorization for the use of certain substances. As an importer ofchemicals and materials from outside the EU, we are subject to additional registration obligations.
We also are subject to environmental laws that may have a significant effect on the nature and scope ofcleanup of contamination at current and former operating facilities and at other sites at which hazardoussubstances generated by our current or former subsidiaries were disposed, the costs of transportation andstorage of raw materials and finished products and the costs of the storage and disposal of wastewater. In the
26

U.S., the Comprehensive Environmental Response, Compensation and Liability Act of 1980, as amended andalso known as Superfund (“CERCLA”), imposes joint and several liability for the costs of remedialinvestigations and cleanup actions, as well as damages to natural resources, on entities that generatedhazardous substances, arranged for disposal of the hazardous substances, transported to or selected the disposalsites and the past and present owners and operators of such sites. All such responsible parties (or any one ofthem) can be required to bear all of such costs regardless of fault, the legality of the original disposal orownership of the disposal site. We are subject to potential liability under CERCLA as an owner or operator offacilities at which hazardous substances have been disposed or as a generator or transporter of hazardoussubstances disposed at other locations.
Under the EU Environmental Liability Directive, EU Member States can require the remediation of soiland groundwater contamination in certain circumstances, under the “polluter pays principle.” The scope ofevents and circumstances that could trigger remediation requirements and the level of remediation requiredvary from Member State to Member State.
Under the U.S. Resource Conservation and Recovery Act of 1976 (“RCRA”), various U.S. state andnon-U.S. government regulations regulate the handling, transporting and disposal of hazardous and non-hazardous waste. Our manufacturing sites have, and may in the future, handle on-site waste disposal,subjecting us to these laws and regulations.
Capital Expenditures
In some cases, compliance with environmental, health and safety laws and regulations can only beachieved by capital expenditures. Regulatory-related capital expenditures at our facilities were $121 million,$250 million and $209 million in 2010, 2009 and 2008, respectively, and we estimate such expenditures to beapproximately $243 million in 2011 and $221 million in 2012.
Our actual capital expenditures in 2010 primarily relate to projects designed to reduce and controlemissions from our plant operations in both the U.S. and Europe.
Stricter environmental, safety and health laws, regulations and enforcement policies could result inincreased environmental capital expenditures by us above current estimates.
Employee Relations
As of December 31, 2010, we had approximately 14,000 full-time and part-time employees. Of these,approximately 5,900 were located in North America, approximately 7,200 were located in Europe andapproximately 1,000 were in other locations.
As of December 31, 2010, approximately 900 of our employees located in North America are representedby labor unions. The vast majority of our employees in Europe and South America are subject to staff councilor works council coverage or collective bargaining agreements.
In addition to our own employees, we use the services of contractors in the routine conduct of ourbusinesses.
We believe our relations with our employees are good.
Description of Properties
Our principal manufacturing facilities as of December 31, 2010 are set forth below, and are identified bythe principal segment or segments using the facility. The facilities are wholly owned, except as otherwisenoted below.
Location Segment Principal Products
AmericasBayport (Pasadena), Texas* I&D Ethylene Oxide (EO), EG and other
EO derivatives
27
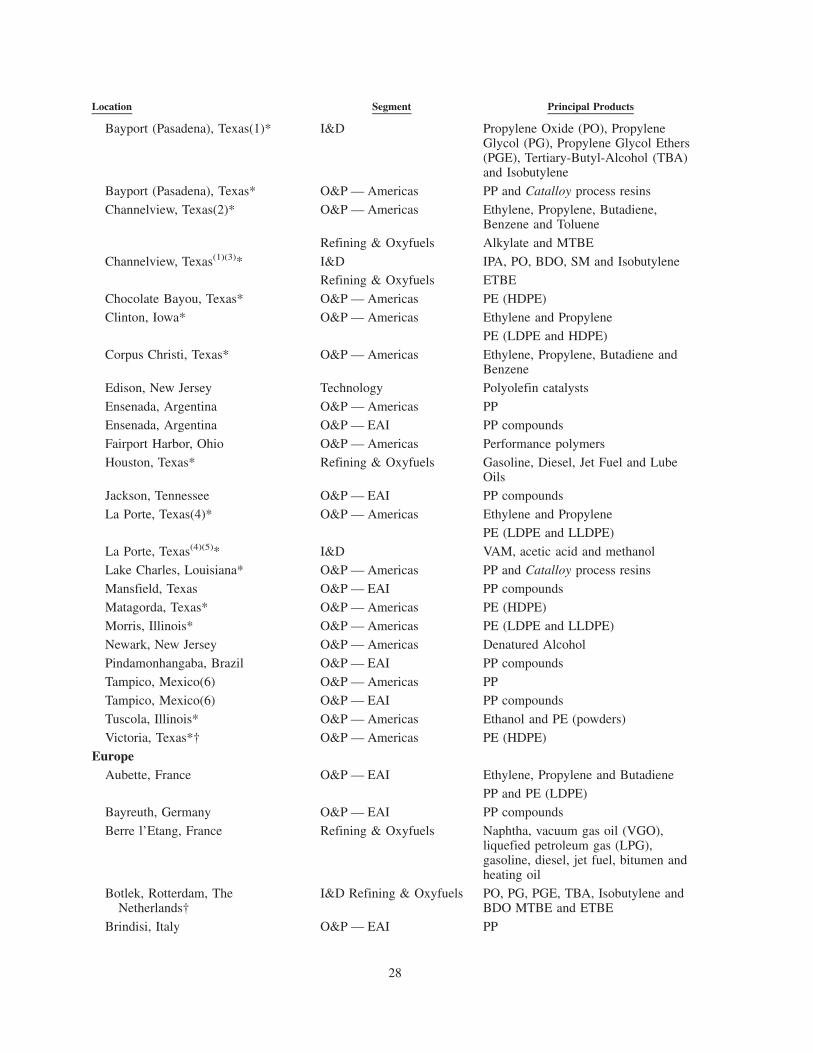
Location Segment Principal Products
Bayport (Pasadena), Texas(1)* I&D Propylene Oxide (PO), PropyleneGlycol (PG), Propylene Glycol Ethers(PGE), Tertiary-Butyl-Alcohol (TBA)and Isobutylene
Bayport (Pasadena), Texas* O&P — Americas PP and Catalloy process resins
Channelview, Texas(2)* O&P — Americas Ethylene, Propylene, Butadiene,Benzene and Toluene
Refining & Oxyfuels Alkylate and MTBE
Channelview, Texas(1)(3)* I&D IPA, PO, BDO, SM and Isobutylene
Refining & Oxyfuels ETBE
Chocolate Bayou, Texas* O&P — Americas PE (HDPE)
Clinton, Iowa* O&P — Americas Ethylene and Propylene
PE (LDPE and HDPE)
Corpus Christi, Texas* O&P — Americas Ethylene, Propylene, Butadiene andBenzene
Edison, New Jersey Technology Polyolefin catalysts
Ensenada, Argentina O&P — Americas PP
Ensenada, Argentina O&P — EAI PP compounds
Fairport Harbor, Ohio O&P — Americas Performance polymers
Houston, Texas* Refining & Oxyfuels Gasoline, Diesel, Jet Fuel and LubeOils
Jackson, Tennessee O&P — EAI PP compounds
La Porte, Texas(4)* O&P — Americas Ethylene and PropylenePE (LDPE and LLDPE)
La Porte, Texas(4)(5)* I&D VAM, acetic acid and methanol
Lake Charles, Louisiana* O&P — Americas PP and Catalloy process resins
Mansfield, Texas O&P — EAI PP compounds
Matagorda, Texas* O&P — Americas PE (HDPE)
Morris, Illinois* O&P — Americas PE (LDPE and LLDPE)
Newark, New Jersey O&P — Americas Denatured Alcohol
Pindamonhangaba, Brazil O&P — EAI PP compounds
Tampico, Mexico(6) O&P — Americas PP
Tampico, Mexico(6) O&P — EAI PP compounds
Tuscola, Illinois* O&P — Americas Ethanol and PE (powders)
Victoria, Texas*† O&P — Americas PE (HDPE)
EuropeAubette, France O&P — EAI Ethylene, Propylene and Butadiene
PP and PE (LDPE)
Bayreuth, Germany O&P — EAI PP compounds
Berre l’Etang, France Refining & Oxyfuels Naphtha, vacuum gas oil (VGO),liquefied petroleum gas (LPG),gasoline, diesel, jet fuel, bitumen andheating oil
Botlek, Rotterdam, TheNetherlands†
I&D Refining & Oxyfuels PO, PG, PGE, TBA, Isobutylene andBDO MTBE and ETBE
Brindisi, Italy O&P — EAI PP
28

Location Segment Principal Products
Carrington, U.K. O&P — EAI PP
Ferrara, Italy O&P — EAI PP and Catalloy process resins
Technology Polyolefin catalysts
Fos-sur-Mer, France† I&D PO, PG and TBA
Refining & Oxyfuels MTBE and ETBE
Frankfurt, Germany† O&P — EAI PE (HDPE)
Technology Polyolefin catalysts
Knapsack, Germany† O&P — EAI PP and PP compounds
Ludwigshafen, Germany† Technology Polyolefin catalysts
Maasvlakte (near Rotterdam), TheNetherlands(7)
I&D PO and SM
Milton Keynes, U.K. O&P — EAI PP compounds
Moerdijk, The Netherlands† O&P — EAI Catalloy process resins and PB-1Munchsmunster, Germany†(8) O&P — EAI Ethylene, Propylene
PE (HDPE)
Plock, Poland(9) O&P — EAI PP and PE (HDPE and LDPE)
Tarragona, Spain(10) O&P — EAI PP and PP compounds
Terni, Italy(11) O&P — EAI PP
Wesseling, Germany(12) O&P — EAI Ethylene, Propylene and Butadiene
PP and PE (HDPE and LDPE)
Asia PacificChiba, Japan(13) I&D PO, PG and SM
Clyde, Australia O&P — EAI PP
Geelong, Australia O&P — EAI PP
Guangzhou, China(14) O&P — EAI PP compounds
Kawasaki, Japan(15) O&P — EAI PP
Map Ta Phut, Thailand(16) O&P — EAI PP
Ningbo, China(17) I&D PO and SM
Oita, Japan(15) O&P — EAI PP and PP compounds
Port Klang, Malaysia(18) O&P — EAI PP compounds
Rayong, Thailand(19) O&P — EAI PP compounds
Suzhou, China O&P — EAI PP compounds
Victoria, Australia(18) O&P — EAI PP compounds
Yeochan, Korea(20) O&P — EAI PP
Middle EastJubail, Saudi Arabia(21) O&P — EAI Propylene and PP
Jubail, Saudi Arabia(22) O&P — EAI Propylene and PP
Jubail, Saudi Arabia(23) O&P — EAI Ethylene and PE (LDPE and HDPE)
* The facility, or portions of the facility, as applicable, owned by us are mortgaged as collateral forindebtedness.
† The facility is located on leased land.
(1) The Bayport PO/TBA plants and the Channelview PO/SM I plant are held by the U.S. PO Joint Venturebetween Bayer and Lyondell Chemical. These plants are located on land leased by the U.S. PO JointVenture.
29
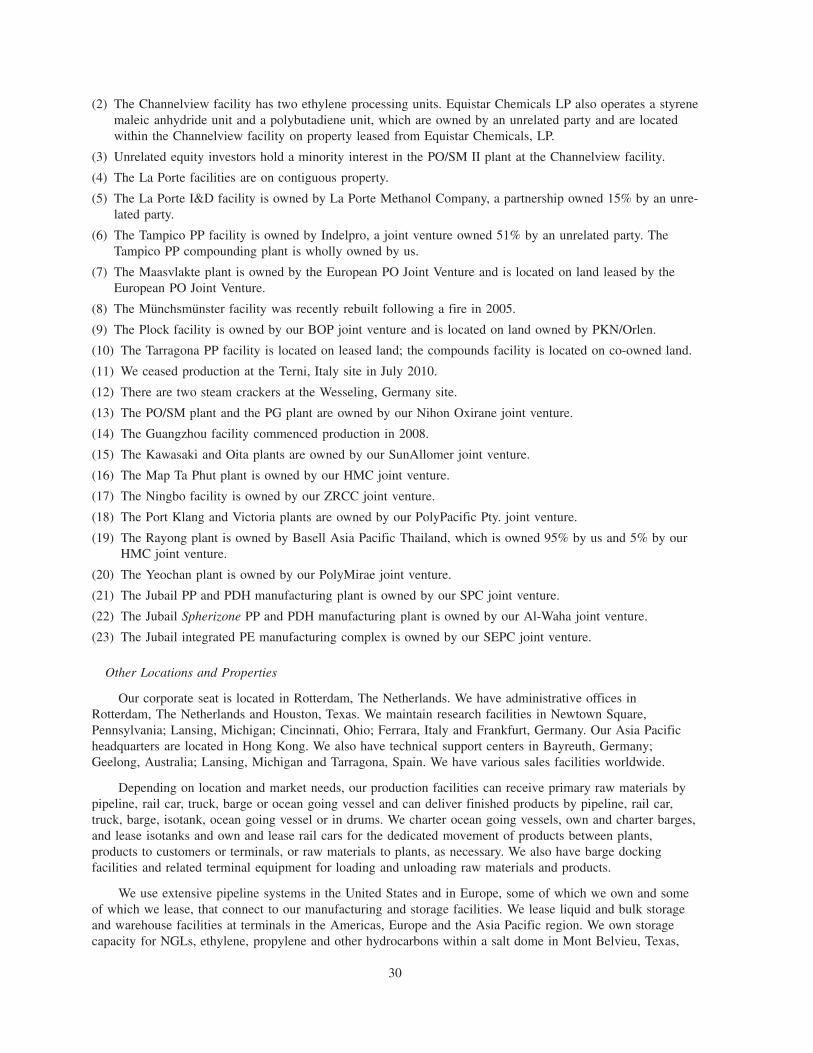
(2) The Channelview facility has two ethylene processing units. Equistar Chemicals LP also operates a styrenemaleic anhydride unit and a polybutadiene unit, which are owned by an unrelated party and are locatedwithin the Channelview facility on property leased from Equistar Chemicals, LP.
(3) Unrelated equity investors hold a minority interest in the PO/SM II plant at the Channelview facility.
(4) The La Porte facilities are on contiguous property.
(5) The La Porte I&D facility is owned by La Porte Methanol Company, a partnership owned 15% by an unre-lated party.
(6) The Tampico PP facility is owned by Indelpro, a joint venture owned 51% by an unrelated party. TheTampico PP compounding plant is wholly owned by us.
(7) The Maasvlakte plant is owned by the European PO Joint Venture and is located on land leased by theEuropean PO Joint Venture.
(8) The Munchsmunster facility was recently rebuilt following a fire in 2005.
(9) The Plock facility is owned by our BOP joint venture and is located on land owned by PKN/Orlen.
(10) The Tarragona PP facility is located on leased land; the compounds facility is located on co-owned land.
(11) We ceased production at the Terni, Italy site in July 2010.
(12) There are two steam crackers at the Wesseling, Germany site.
(13) The PO/SM plant and the PG plant are owned by our Nihon Oxirane joint venture.
(14) The Guangzhou facility commenced production in 2008.
(15) The Kawasaki and Oita plants are owned by our SunAllomer joint venture.
(16) The Map Ta Phut plant is owned by our HMC joint venture.
(17) The Ningbo facility is owned by our ZRCC joint venture.
(18) The Port Klang and Victoria plants are owned by our PolyPacific Pty. joint venture.
(19) The Rayong plant is owned by Basell Asia Pacific Thailand, which is owned 95% by us and 5% by ourHMC joint venture.
(20) The Yeochan plant is owned by our PolyMirae joint venture.
(21) The Jubail PP and PDH manufacturing plant is owned by our SPC joint venture.
(22) The Jubail Spherizone PP and PDH manufacturing plant is owned by our Al-Waha joint venture.
(23) The Jubail integrated PE manufacturing complex is owned by our SEPC joint venture.
Other Locations and Properties
Our corporate seat is located in Rotterdam, The Netherlands. We have administrative offices inRotterdam, The Netherlands and Houston, Texas. We maintain research facilities in Newtown Square,Pennsylvania; Lansing, Michigan; Cincinnati, Ohio; Ferrara, Italy and Frankfurt, Germany. Our Asia Pacificheadquarters are located in Hong Kong. We also have technical support centers in Bayreuth, Germany;Geelong, Australia; Lansing, Michigan and Tarragona, Spain. We have various sales facilities worldwide.
Depending on location and market needs, our production facilities can receive primary raw materials bypipeline, rail car, truck, barge or ocean going vessel and can deliver finished products by pipeline, rail car,truck, barge, isotank, ocean going vessel or in drums. We charter ocean going vessels, own and charter barges,and lease isotanks and own and lease rail cars for the dedicated movement of products between plants,products to customers or terminals, or raw materials to plants, as necessary. We also have barge dockingfacilities and related terminal equipment for loading and unloading raw materials and products.
We use extensive pipeline systems in the United States and in Europe, some of which we own and someof which we lease, that connect to our manufacturing and storage facilities. We lease liquid and bulk storageand warehouse facilities at terminals in the Americas, Europe and the Asia Pacific region. We own storagecapacity for NGLs, ethylene, propylene and other hydrocarbons within a salt dome in Mont Belvieu, Texas,
30

and operate additional ethylene and propylene storage facilities with related brine facilities on leased propertyin Markham, Texas.
Web Site Access to SEC Reports
Our Internet Web site address is http://www.lyondellbasell.com. Information contained on our InternetWeb site is not part of this report on Form 10-K.
Our Annual Reports on Form 10-K, Quarterly Reports on Form 10-Q, Current Reports on Form 8-K andany amendments to these reports filed or furnished pursuant to Section 13(a) or 15(d) of the SecuritiesExchange Act of 1934 are available on our Web site, free of charge, as soon as reasonably practicable aftersuch reports are filed with, or furnished to, the U.S. Securities and Exchange Commission. Alternatively, youmay access these reports at the SEC’s Web site at http://www.sec.gov.
Item 1A. RISK FACTORS
You should carefully consider the following risk factors in addition to the other information included inthis Annual Report on Form 10-K. Each of these risk factors could adversely affect our business, operatingresults and financial condition, as well as adversely affect the value of an investment in our common stock.
Economic downturns and disruptions in financial markets can adversely affect our business and resultsof operations.
Our results of operations can be materially affected by adverse conditions in the financial markets anddepressed economic conditions generally. Economic downturns in the businesses and geographic areas inwhich we sell our products substantially reduce demand for our products and result in decreased salesvolumes. Recessionary environments adversely affect our business because demand for our products isreduced, particularly from our customers in industrial markets generally and the automotive and housingindustries specifically.
Moreover, many of our customers and suppliers rely on access to credit to adequately fund theiroperations. Disruptions in financial markets and economic slowdown can adversely impact the ability of ourcustomers to finance the purchase of our products as well as the creditworthiness of those customers. Thesesame factors may also impact the ability and willingness of suppliers to provide us with raw materials for ourbusiness.
The cyclicality and volatility of the industries in which we participate may cause significant fluctuationsin our operating results.
Our business operations are subject to the cyclical and volatile nature of the supply-demand balance inthe chemical and refining industries. Our future operating results are expected to continue to be affected bythis cyclicality and volatility. The chemical and refining industries historically have experienced alternatingperiods of capacity shortages, causing prices and profit margins to increase, followed by periods of excesscapacity, resulting in oversupply, declining capacity utilization rates and declining prices and profit margins.
In addition to changes in the supply and demand for products, changes in energy prices and otherworldwide economic conditions can cause volatility. These factors result in significant fluctuations in profitsand cash flow from period to period and over business cycles.
In addition, new capacity additions, especially in Asia and the Middle East, are expected to lead to aperiod of oversupply and lower profitability. The timing and extent of any changes to currently prevailingmarket conditions is uncertain and supply and demand may be unbalanced at any time. As a consequence, weare unable to accurately predict the extent or duration of future industry cycles or their effect on our business,financial condition or results of operations. We can give no assurances as to any predictions we may makewith respect to the timing, extent or duration of future industry cycles.
31
Costs and limitations on supply of raw materials and energy may result in increased operating expenses.
The costs of raw materials and energy represent a substantial portion of our operating expenses. Energycosts generally follow price trends of crude oil and natural gas. These price trends may be highly volatile andcyclical. In the past, raw material and energy costs have experienced significant fluctuations that adverselyaffected our business segments’ results of operations. Moreover, fluctuations in currency exchange rates canadd to this volatility.
We are not always able to pass raw material and energy cost increases on to our customers. When we dohave the ability to pass on the cost increases, we are not always able to do so quickly enough to avoid adverseimpacts on our results of operations.
Cost increases also may increase working capital needs, which could reduce our liquidity and cash flow.Even if we increase our sales prices to reflect rising raw material and energy costs, demand for products maydecrease as customers reduce their consumption or use substitute products, which may have an adverse impacton our results of operations. In addition, producers in natural gas cost-advantaged regions, such as the MiddleEast, benefit from the lower prices of natural gas and NGLs. Competition from producers in these regions maycause us to reduce exports from North America and Europe. Any such reductions may increase competitionfor product sales within North America and Europe, which can result in lower margins in those regions.Additionally, there are a limited number of suppliers for some of our raw materials and utilities and, in somecases, the supplies are specific to the particular geographic region in which a facility is located.
It is also common in the chemical and refining industries for a facility to have a sole, dedicated sourcefor its utilities, such as steam, electricity and gas. Having a sole or limited number of suppliers may limit ournegotiating power, particularly in the case of rising raw material costs. Any new supply agreements we enterinto may not have terms as favorable as those contained in our current supply agreements.
If our raw material or utility supplies were disrupted, our businesses may incur increased costs to procurealternative supplies or incur excessive downtime, which would have a direct negative impact on plantoperations. For example, hurricanes have in the past negatively affected crude oil and natural gas supplies, aswell as supplies of other raw materials, utilities (such as electricity and steam), and industrial gases,contributing to increases in operating costs and, in some cases, disrupting production. In addition, hurricane-related disruption of vessel, barge, rail, truck and pipeline traffic in the U.S. Gulf Coast area would negativelyaffect shipments of raw materials and product.
In addition, with increased volatility in raw material costs, our suppliers could impose more onerousterms on us, resulting in shorter payment cycles and increasing our working capital requirements.
We sell products in highly competitive global markets and face significant price pressures.
We sell our products in highly competitive global markets. Due to the commodity nature of many of ourproducts, competition in these markets is based primarily on price and, to a lesser extent, on productperformance, product quality, product deliverability, reliability of supply and customer service. Generally, weare not able to protect our market position for these products by product differentiation and may not be able topass on cost increases to our customers.
In addition, we face increased competition from companies that may have greater financial resources anddifferent cost structures or strategic goals than us. These include large integrated oil companies (many ofwhich also have chemical businesses), government-owned businesses, and companies that receive subsidies orother government incentives to produce certain products in a specified geographic region. Increased competi-tion from these companies, especially in our olefin and refining businesses, could limit our ability to increaseproduct sales prices in response to raw material and other cost increases, or could cause us to reduce productsales prices to compete effectively, which could reduce our profitability. Competitors that have greaterfinancial resources than us may be able to invest significant capital into their businesses, includingexpenditures for research and development.
32
In addition, specialty products we produce may become commoditized over time. Increased competitioncould result in lower prices or lower sales volumes, which would have a negative impact on our results ofoperations.
Our ability to source raw materials, including crude oil, may be adversely affected by political instability,civil disturbances or other governmental actions.
We obtain a substantial portion of our principal raw materials from sources in North Africa, the MiddleEast, and South America that may be less politically stable than other areas in which we conduct business,such as Europe or the US.
Recently, increased incidents of civil unrest, including demonstrations which have been marked byviolence, have occurred in some countries in North Africa and the Middle East. Some political regimes inthese countries are threatened or have changed as a result of such unrest. Political instability and civil unrestcould continue to spread in the region and involve other areas. Such unrest, if it continues to spread or grow inintensity, could lead to civil wars, regional conflict, or regime changes resulting in governments that are hostileto countries in which we conduct substantial business, such as Europe, the US, or their respective allies.
We source a large portion of our crude oil from Venezuela. From time to time in the past, the Venezuelannational oil company, PDVSA, has declared itself in a force majeure situation and reduced deliveries of crudeoil purportedly based on announced OPEC production cuts. It is impossible to predict how possible changes ingovernmental policies may affect our sourcing. Any significant reduction in Venezuelan crude oil suppliescould negatively impact our ability to procure crude oil, from Venezuela or other sources, on economicallyadvantageous terms. Political instability, civil disturbances and actions by governments in North Africa, theMiddle East or South America are likely to substantially increase the price and decrease the supply offeedstocks necessary for our operations, which will have a material adverse effect on our results of operations.
Interruptions of operations at our facilities may result in liabilities or lower operating results.
We own and operate large-scale facilities. Our operating results are dependent on the continued operationof our various production facilities and the ability to complete construction and maintenance projects onschedule. Interruptions at our facilities may materially reduce the productivity and profitability of a particularmanufacturing facility, or our business as a whole, during and after the period of such operational difficulties.In the past, we had to shut down plants on the U.S. Gulf Coast, including the temporary shutdown of theHouston Refinery, as a result of hurricanes striking the Texas coast.
In addition, because the Houston Refinery is our only North American refining operation, an outage atthe refinery could have a particularly negative impact on our operating results. Unlike our chemical andpolymer production facilities, which may have sufficient excess capacity to mitigate the negative impact oflost production at other facilities, we do not have the ability to increase refining production elsewhere in theU.S.
Although we take precautions to enhance the safety of our operations and minimize the risk ofdisruptions, our operations are subject to hazards inherent in chemical manufacturing and refining and therelated storage and transportation of raw materials, products and wastes. These potential hazards include:
• pipeline leaks and ruptures;
• explosions;
• fires;
• severe weather and natural disasters;
• mechanical failure;
• unscheduled downtimes;
• supplier disruptions;
33
• labor shortages or other labor difficulties;
• transportation interruptions;
• remediation complications;
• chemical and oil spills;
• discharges or releases of toxic or hazardous substances or gases;
• storage tank leaks;
• other environmental risks; and
• terrorist acts.
Some of these hazards may cause severe damage to or destruction of property and equipment and mayresult in suspension of operations or the shutdown of affected facilities.
Our operations are subject to risks inherent in chemical and refining businesses, and we could be subjectto liabilities for which we are not fully insured or that are not otherwise mitigated.
We maintain property, business interruption, product, general liability, casualty and other types ofinsurance, including pollution and legal liability, that we believe are in accordance with customary industrypractices. However, we are not fully insured against all potential hazards incident to our business, includinglosses resulting from natural disasters, war risks or terrorist acts. Changes in insurance market conditions havecaused, and may in the future cause, premiums and deductibles for certain insurance policies to increasesubstantially and, in some instances, for certain insurance to become unavailable or available only for reducedamounts of coverage. If we were to incur a significant liability for which we were not fully insured, we mightnot be able to finance the amount of the uninsured liability on terms acceptable to us or at all, and might beobligated to divert a significant portion of our cash flow from normal business operations.
Further, because a part of our business involves licensing polyolefin process technology, our licensees areexposed to similar risks involved in the manufacture and marketing of polyolefins. Hazardous incidentsinvolving our licensees, if they do result or are perceived to result from use of our technologies, may harm ourreputation, threaten our relationships with other licensees and/or lead to customer attrition and financial losses.Our policy of covering these risks through contractual limitations of liability and indemnities and throughinsurance may not always be effective. As a result, our financial condition and results of operation would beadversely affected, and other companies with competing technologies may have the opportunity to secure acompetitive advantage.
Certain activities related to a former project raise compliance issues under U.S. law.
We have identified an agreement related to a former project in Kazakhstan under which a payment wasmade in late 2008 that raises compliance concerns under the U.S. Foreign Corrupt Practices Act (the “FCPA”).We have engaged outside counsel to investigate these activities, under the oversight of a special committeeestablished by the Supervisory Board, and to evaluate internal controls and compliance policies andprocedures. We made a voluntary disclosure of these matters to the U.S. Department of Justice in late 2009and are cooperating fully with that agency. In this respect, we may not have conducted our business incompliance with the FCPA and may not have had policies and procedures in place adequate to ensurecompliance. We cannot reasonably estimate any potential penalty that may arise from these matters. We haveadopted and are implementing more stringent policies and procedures designed to ensure compliance. Wecannot predict the ultimate outcome of these matters at this time since our investigations are ongoing.Violations of these laws could result in criminal and civil liabilities and other forms of relief that could bematerial to us.
34
Our non-U.S. operations conduct business in countries subject to U.S. economic sanctions and certainactivities raise compliance issues under U.S. law.
Certain of our non-U.S. subsidiaries conduct business in countries subject to U.S. economic sanctions,including Iran. U.S. and EU laws and regulations prohibit certain persons from engaging in business activities,in whole or in part, with sanctioned countries, organizations and individuals.
We have and continue to adopt more significant compliance policies and procedures to ensure compliancewith all applicable sanctions laws and regulations. In connection with our continuing review of compliancerisks in this area, we made a voluntary disclosure of certain matters to the U.S. Treasury Department andintend to continue cooperating fully with that agency. We cannot at this point in time predict the outcome ofthis matter because our investigation is ongoing, but there is a risk that we could be subject to civil andcriminal penalties.
We have made the decision to terminate all business by the Company and its direct and indirectsubsidiaries with the government, entities and individuals in Iran, Syria and Sudan. We have notified ourcounterparties in these countries of our decision and may be subject to legal actions to enforce agreementswith the counterparties. These activities present a potential risk that could subject the Company to private legalproceedings that could be material to us. At this time, we cannot predict the outcome because our withdrawalactivities are ongoing.
Our operations could be adversely affected by labor relations.
The vast majority of our employees located in Europe and South America are represented by labor unionsand work councils. Approximately 900 of our employees located in North America are represented by laborunions. Of the North American employees, approximately 50% include our employees that are covered by acollective bargaining agreement between Houston Refining LP and the United Steelworkers Union, whichexpires on January 31, 2012.
Our operations have been in the past, and may be in the future, significantly and adversely affected bystrikes, work stoppages and other labor disputes.
We cannot predict with certainty the extent of future costs under environmental, health and safety andother laws and regulations, and cannot guarantee they will not be material.
We may face liability arising out of the normal course of business, including alleged personal injury orproperty damage due to exposure to chemicals or other hazardous substances at our current or former facilitiesor chemicals that we manufacture, handle or own. In addition, because our products are components of avariety of other end-use products, we, along with other members of the chemical industry, are subject topotential claims related to those end-use products. Any substantial increase in the success of these types ofclaims could negatively affect our operating results.
We (together with the industries in which we operate) are subject to extensive national, regional, state andlocal environmental laws, regulations, directives, rules and ordinances concerning
• emissions to the air,
• discharges onto land or surface waters or into groundwater; and
• the generation, handling, storage, transportation, treatment, disposal and remediation of hazardoussubstances and waste materials.
Many of these laws and regulations provide for substantial fines and potential criminal sanctions forviolations. Some of these laws and regulations are subject to varying and conflicting interpretations. Inaddition, some of these laws and regulations require us to meet specific financial responsibility requirements.Any substantial liability for environmental damage could have a material adverse effect on our financialcondition, results of operations and cash flows.
35

Although we have compliance programs and other processes intended to ensure compliance with all suchregulations, we are subject to the risk that our compliance with such regulations could be challenged. Non-compliance with certain of these regulations could result in the incurrence of additional costs, penalties orassessments that could be material.
Our industry is subject to extensive government regulation, and existing or future regulations may restrictour operations, increase our costs of operations or require us to make additional capital expenditures.
Compliance with regulatory requirements could result in higher operating costs, such as regulatoryrequirements relating to emissions, the security of our facilities, and the transportation, export or registrationof our products. We generally expect that regulatory controls worldwide will become increasingly moredemanding, but cannot accurately predict future developments. Increasingly strict environmental laws andinspection and enforcement policies, could affect the handling, manufacture, use, emission or disposal ofproducts, other materials or hazardous and non-hazardous waste. Stricter environmental, safety and healthlaws, regulations and enforcement policies could result in increased operating costs. Additionally, we arerequired to have permits for our businesses and are subject to licensing regulations. These permits and licensesare subject to renewal, modification and in some circumstances, revocation. Further, the permits and licensesare often difficult, time consuming and costly to obtain and could contain conditions that limit our operations.
We may incur substantial costs to comply with climate change legislation and regulatory initiatives.
There has been a broad range of proposed or promulgated state, national and international laws focusingon greenhouse gas (“GHG”) reduction. These proposed or promulgated laws apply or could apply in countrieswhere we have interests or may have interests in the future. Laws in this field continue to evolve and, whilethey are likely to be increasingly widespread and stringent, at this stage it is not possible to accuratelyestimate either a timetable for implementation or our future compliance costs relating to implementation.Within the framework of EU emissions trading, we were allocated certain allowances of carbon dioxide peryear for the affected plants of our European sites for the 2005 to 2007 period. For the second trading period(2008 to 2012), a number of our plants are included in the Europe-wide trading system. We expect to incuradditional costs as a result of the existing emissions trading scheme and could incur additional costs in relationto any future carbon or other greenhouse gas emission trading schemes. The costs could be higher to theextent that we decide to sell credits that we need in the future.
In the U.S., the Environmental Protection Agency (the “EPA”) has promulgated federal GHG regulationsunder the Clean Air Act affecting certain sources. The EPA has issued mandatory GHG reporting requirementswhich could lead to further obligations. The recent EPA action could be a precursor to further federalregulation of carbon dioxide emissions and other greenhouse gases, and may affect the outcome of otherclimate change lawsuits pending in United States federal courts in a manner unfavorable to our industry. Inany event, additional regulation is likely to be forthcoming at the United States federal level or the state levelwith respect to GHG emissions, and such regulation could result in the creation of additional costs in the formof taxes or required acquisition or trading of emission allowances.
Compliance with these or other changes in laws, regulations and obligations that create a GHG emissionstrading scheme or GHG reduction policies generally could significantly increase our costs or reduce demandfor products we produce. Depending on the nature of potential regulations and legislation, any future laws andregulations could result in increased compliance costs or additional operating restrictions, and could have amaterial adverse effect on our business and results of operations.
Legislation and regulatory initiatives could lead to a decrease in demand for our products.
New or revised governmental regulations and independent studies relating to the effect of our products onhealth, safety and the environment may affect demand for our products and the cost of producing our products.Initiatives by governments and private interest groups will potentially require increased toxicological testingand risk assessments of a wide variety of chemicals, including chemicals used or produced by us. For example,in the United States, the National Toxicology Program (“NTP”) is a federal interagency program that seeks to
36

identify and select for study chemicals and other substances to evaluate potential human health hazards. In theEuropean Commission, REACh is regulation designed to identify the intrinsic properties of chemicalsubstances, assess hazards and risks of the substances, and identify and implement the risk managementmeasures to protect humans and the environment.
Assessments by the NTP, REACh or similar programs or regulations in other jurisdictions may result inheightened concerns about the chemicals we use or produce and may result in additional requirements beingplaced on the production, handling, labeling or use of those chemicals. Such concerns and additionalrequirements could also increase the cost incurred by our customers to use our chemical products andotherwise limit the use of these products, which could lead to a decrease in demand for these products. Such adecrease in demand could have an adverse impact on our business and results of operations.
We operate internationally and are subject to exchange rate fluctuations, exchange controls, politicalrisks and other risks relating to international operations.
We operate internationally and are subject to the risks of doing business on a global level, includingfluctuations in currency exchange rates, transportation delays and interruptions, war, terrorist activities,epidemics, pandemics, political and economic instability and disruptions, restrictions on the transfer of funds,the imposition of duties and tariffs, import and export controls, changes in governmental policies, labor unrestand current and changing regulatory environments. Recent demonstrations and popular unrest in portions ofthe Middle East are examples of these events.
These events could reduce the demand for our products, decrease the prices at which we can sell ourproducts, disrupt production or other operations, require substantial capital and other costs to comply, and/orincrease security costs or insurance premiums, all of which could reduce our operating results. In addition, weobtain a substantial portion of our principal raw materials from international sources that are subject to thesesame risks. Our compliance with applicable customs, currency exchange control regulations, transfer pricingregulations or any other laws or regulations to which we may be subject could be challenged. Furthermore,these laws may be modified, the result of which may be to prevent or limit subsidiaries from transferring cashto us.
Furthermore, we are subject to certain existing, and may be subject to possible future, laws that limit ormay limit our activities while some of our competitors may not be subject to such laws, which may adverselyaffect our competitiveness.
In addition, we generate revenues from export sales and operations that may be denominated in currenciesother than the relevant functional currency. Exchange rates between these currencies and functional currenciesin recent years have fluctuated significantly and may do so in the future. Future events, which maysignificantly increase or decrease the risk of future movement in currencies in which we conduct our business,cannot be predicted. We also may hedge certain revenues and costs using derivative instruments to minimizethe impact of changes in the exchange rates of those currencies compared to the respective functionalcurrencies. It is possible that fluctuations in exchange rates will result in reduced operating results.
Significant changes in pension fund investment performance or assumptions relating to pension costsmay adversely affect the valuation of pension obligations, the funded status of pension plans, and ourpension cost.
Our pension cost is materially affected by the discount rate used to measure pension obligations, the levelof plan assets available to fund those obligations at the measurement date and the expected long-term rate ofreturn on plan assets. Significant changes in investment performance or a change in the portfolio mix ofinvested assets may result in corresponding increases and decreases in the valuation of plan assets, particularlyequity securities, or in a change of the expected rate of return on plan assets. Any change in key actuarialassumptions, such as the discount rate, would impact the valuation of pension obligations, affecting thereported funded status of our pension plans as well as the net periodic pension cost in the following fiscalyears.
37

Certain of our current pension plans are underfunded. As of December 31, 2010, our pension plans wereunderfunded by $1,173 million. Any declines in the fair values of the pension plans assets could requireadditional payments by us in order to maintain specified funding levels.
Our pension plans are subject to legislative and regulatory requirements of applicable jurisdictions, whichcould include, under certain circumstances, local governmental authority to terminate the plan.
We may be required to record material charges against our earnings due to any number of events thatcould cause impairments to our assets.
We may be required to reduce production at or idle facilities for extended periods of time or exit certainbusinesses as a result of the cyclical nature of our industry. Specifically, oversupplies of or lack of demand forparticular products or high raw material prices may cause us to reduce production. We may choose to reduceproduction at certain facilities because we have off-take arrangements at other facilities, which makes anyreductions or idling unavailable at those facilities. Any decision to permanently close facilities or exit abusiness likely would result in impairment and other charges to earnings.
Temporary outages at our facilities can last for several quarters and sometimes longer. These outagescould cause us to incur significant costs, including the expenses of maintaining and restarting these facilities.In addition, even though we may reduce production at facilities, we may be required to continue to purchaseor pay for utilities or raw materials under take-or-pay supply agreements.
Many of our businesses depend on our intellectual property. Our future success will depend in part onour ability to protect our intellectual property rights, and our inability to do so could reduce our ability tomaintain our competitiveness and margins.
We have a significant worldwide patent portfolio of issued and pending patents. These patents, togetherwith proprietary technical know-how, are significant to our competitive position, particularly with regard toPO, performance chemicals, petrochemicals, and polymers, including process technologies such as Spheripol,Spherizone, Hostalen, Spherilene, Lupotech T and Lupotech G and Avant catalyst family technology rights. Werely on the patent, copyright and trade secret laws of the countries in which we operate to protect ourinvestment in research and development, manufacturing and marketing. However, we may be unable to preventthird parties from using our intellectual property without authorization. Proceedings to protect these rightscould be costly, and we may not prevail.
The protection afforded by patents varies from country to country and depends upon the type of patentand its scope of coverage. While a presumption of validity exists with respect to patents issued to us, ourpatents may be challenged, invalidated, circumvented or rendered unenforceable. As patents expire, theproducts and processes described and claimed under those patents become generally available for use bycompetitors.
Our continued growth strategy may bring us to regions of the world where intellectual property protectionmay be limited and difficult to enforce. In addition, patent rights may not prevent our competitors fromdeveloping, using or selling products that are similar or functionally equivalent to our products. Moreover, ourcompetitors or other third parties may obtain patents that restrict or preclude our ability to lawfully produce orsell our products in a competitive manner, which could result in significantly lower revenues, reduced profitmargins or loss of market share.
We also rely upon unpatented proprietary know-how and continuing technological innovation and othertrade secrets to develop and maintain our competitive position. While it is our policy to enter intoconfidentiality agreements with our employees and third parties to protect our intellectual property, theseconfidentiality agreements may be breached, may not provide meaningful protection or adequate remediesmay not be available. Additionally, others could obtain knowledge of our trade secrets through independentdevelopment or other access by legal or illegal means.
The failure of our patents or confidentiality agreements to protect our processes, apparatuses, technology, tradesecrets or proprietary know-how could result in significantly lower revenues, reduced profit margins and cash flows
38
and/or loss of market share. We also may be subject to claims that our technology, patents or other intellectualproperty infringes on a third party’s intellectual property rights. Unfavorable resolution of these claims could resultin restrictions on our ability to deliver the related service or in a settlement that could be material to us.
We may not be able to fully or successfully implement our ongoing plans to improve and globallyintegrate our business processes and functions.
We continue to seek ways to drive greater productivity, flexibility and cost savings. In particular, we areworking towards the improvement and global integration of our business processes and functions. As part ofthese efforts, we have been centralizing certain functions within the Company, implementing new informationtechnology, and integrating our existing information technology systems.
Our ongoing implementation of organizational improvements is made more difficult by our need tocoordinate geographically dispersed operations. Inabilities and delays in implementing improvements cannegatively affect our ability to realize projected or expected cost savings. In addition, the process oforganizational improvements may cause interruptions of, or loss of momentum in, the activities of theCompany’s businesses. It may also result in the loss of personnel or other labor issues. These issues, as well asany information technology systems failures, also could impede our ability to timely collect and reportfinancial results in accordance with applicable laws and regulations.
Shared control or lack of control of joint ventures may delay decisions or actions regarding the jointventures.
A portion of our operations are conducted through joint ventures, where control may be exercised by orshared with unaffiliated third parties. We cannot control the actions of our joint venture partners, including anynonperformance, default or bankruptcy of joint venture partners. The joint ventures that we do not control mayalso lack adequate internal controls systems.
In the event that any of our joint venture partners do not observe their obligations, it is possible that theaffected joint venture would not be able to operate in accordance with our business plans. As a result, wecould be required to increase our level of commitment in order to give effect to such plans. Differences inviews among the joint venture participants also may result in delayed decisions or in failures to agree onmajor matters, potentially adversely affecting the business and operations of the joint ventures and in turn ourbusiness and operations.
Litigation or governmental proceedings could result in material adverse consequences, includingjudgments or settlements.
We are involved in civil litigation in the ordinary course of our business and from time-to-time areinvolved in governmental proceedings relating to the conduct of our business. The timing of the finalresolutions to these types of matters is often uncertain. Additionally, the possible outcomes or resolutions tothese matters could include adverse judgments or settlements, either of which could require substantialpayments, adversely affecting our liquidity and earnings.
Our capital requirements could limit or cause us to change our growth and development plans.
At December 31, 2010, we have approximately $6.1 billion of total consolidated debt. Our debt and thelimitations imposed on us by our financing arrangements could:
• require us to dedicate a substantial portion, or all, of our cash flow from operations to payments ofprincipal and interest on our debt;
• make us more vulnerable during downturns , which could limit our ability to take advantage ofsignificant business opportunities and react to changes in our business and in market or industryconditions; and
• put us at a competitive disadvantage relative to competitors that have less debt.
39

If our cash flow from operations and capital resources were reduced, we may be forced to reduce or delayinvestments and capital expenditures or other planned uses of our cash due to our substantial debt serviceobligations. We could choose to sell assets, seek additional capital or restructure or refinance our indebtedness,but there can be no assurances that we would be able to do so on terms we deem acceptable, if at all.Additionally, our debt instruments may limit our ability to effect such actions.
Our debt or other financing arrangements contain a number of restrictive covenants that impose operatingand financial restrictions on us. There also is a minimum fixed charge coverage ratio contained in ourU.S. ABL Facility that is applicable if availability under the facility falls below certain levels. We currentlyare in compliance with all of our restrictive and financial covenants; however, the ability to meet financialrequirements can be affected by events beyond our control and, over time, these covenants may not besatisfied.
A breach of covenants of or the failure to pay principal and interest when due under our debt or otherfinancing could result in a default or cross-default under all or some of those instruments. Any such defaultcould result in an acceleration of all amounts outstanding under all facilities, and could relieve counterpartiesof their obligations to fund or otherwise make advances. Without waivers from the parties to our financingarrangements, any such default would have a material adverse effect on our ability to continue to operate.
A substantial portion of our shares are owned by a few persons, and their interests in LyondellBasellIndustries N.V. may conflict with other stakeholders’ interests.
Three shareholders collectively own approximately 52% of our outstanding ordinary shares. Under Dutchlaw, there are no quorum requirements for shareholder voting and most matters are approved or adopted by amajority of votes cast. As a result, as long as these shareholders or any other substantial shareholder own,directly or indirectly, a substantial portion of our outstanding shares, they will be able to significantlyinfluence all matters requiring shareholder approval, including amendments to our Articles of Association, theelection of directors, significant corporate transactions, dividend payments and other matters. These sharehold-ers may have interests that conflict with other shareholders and actions may be taken that other shareholdersdo not view as beneficial.
Additionally, each of these three shareholders is party to a nomination agreement that entitles theshareholder cause our Supervisory Board to nominate for election members to our Supervisory Board for solong as the shareholder owns specified percentages of our ordinary shares.
We are subject to Dutch law and the rights of our ordinary shareholders may be different from thoserights associated with companies governed by other laws.
As a result of being organized under the laws of The Netherlands, our corporate structure as well as therights and obligations of our ordinary shareholders may be different from the rights and obligations ofshareholders in companies incorporated in other jurisdictions. Resolutions of the general meeting of sharehold-ers may be taken with majorities different from the majorities required for adoption of equivalent resolutionsin, for example, Delaware companies. Additionally, like other Dutch companies, our articles of association andour board charter contain control-enhancing rights that may have the effect of preventing, discouraging ordelaying a change of control.
If we were classified as a controlled foreign corporation, any 10% U.S. shareholders may be responsiblefor U.S. income taxes on a pro-rata share of our income.
If the sum of the percentage ownership held by all of our 10% U.S. shareholders (as determined underthe Internal Revenue Code of 1986, as amended (“IRC”)) exceeds 50% of our ordinary shares, we would beclassified as a controlled foreign corporation for U.S. federal income tax purposes. In the event such aclassification were made, all 10% U.S. shareholders would be subject to taxation under Subpart F of the IRC,which could require such 10% U.S. shareholders to pay U.S. federal income taxes on a pro rata portion of ourincome, even in the absence of any distribution of such income.
40

Based on information currently available to us, we do not believe we are a controlled foreign corporationat this time.
U.S. anti-inversion rules may apply to LyondellBasell Industries N.V. resulting in certain adverse U.S.federal income tax consequences.
The United States Internal Revenue Service (“IRS”) could seek to apply Section 7874 of the IRC to treatLyondellBasell Industries N.V. as a U.S. corporation for U.S. federal income tax purposes or, alternatively, itcould seek to impose U.S. federal income tax on certain income of our U.S. subsidiaries. Such an applicationwould be based upon the value of stock issued in our emergence from Chapter 11 that the former creditorsand shareholders of our top U.S. holding company and its direct and indirect subsidiaries received by reasonof holding claims against those entities.
Treatment as a U.S. corporation could result in significantly increased U.S. federal income tax liability tous. Application of the alternative could impose U.S. federal income tax on our U.S. subsidiaries.
Although no assurance can be given that the IRS would not take a contrary position regardingSection 7874’s application or that such position, if asserted, would not be sustained, we believe that the stockissued in connection with our emergence from the Bankruptcy Cases that is attributable to the value of theclaims against our companies outside the U.S. Group makes a Section 7874 inapplicable to us. In addition, webelieve that strong arguments can be made that Section 7874 should not in any event apply to us because ofthe substantial business activities that we and our affiliates conduct and have historically conducted in TheNetherlands.
Item 1B. UNRESOLVED STAFF COMMENTS
None.
Item 3. LEGAL PROCEEDINGS
Bankruptcy Proceedings
On January 6, 2009, certain of LyondellBasell AF S.C.A.’s indirect U.S. subsidiaries, including LyondellChemical Company, and its German indirect subsidiary, Germany Holdings, voluntarily filed for protectionunder Chapter 11 in the Bankruptcy Court. In April and May of 2009, LyondellBasell AF and certain othersubsidiaries filed voluntary petitions for relief under Chapter 11 in the Bankruptcy Court. The BankruptcyCases were filed in response to a sudden loss of liquidity in the last quarter of 2008. The debtors operatedtheir businesses and managed their properties as debtors in possession during the Bankruptcy Cases. Ingeneral, this means that the Debtors operated in the ordinary course without Bankruptcy Court intervention.Bankruptcy Court approval was required, however, where the debtors sought authorization to engage in certaintransactions not in the ordinary course of business.
We emerged from bankruptcy on April 30, 2010. As of that date, all assets of the debtor entities vested inthe reorganized debtor entities free and clear of all claims, liens, encumbrances, charges, and other interests,except as provided in the Plan of Reorganization or the confirmation order entered on April 23, 2010 (the“Confirmation Order”). Except as otherwise expressly provided in the Plan of Reorganization or in theConfirmation Order, on April 30, 2010, each holder of a claim or equity interest is deemed to have foreverwaived, released, and discharged the debtor entities and the reorganized debtor entities, to the fullest extentpermitted by law, of and from any and all claims, equity interests, rights, and liabilities that arose prior to theconfirmation date.
BASF Lawsuit
On April 12, 2005, BASF filed a lawsuit against Lyondell Chemical in the Superior Court of New Jersey,Morris County, asserting various claims relating to alleged breaches of a propylene oxide toll manufacturingcontract and seeking damages in excess of $100 million. Lyondell Chemical denied breaching the contract andargued that at most it owed BASF nothing more than a refund of $22.5 million, which it has paid. On
41

August 13, 2007, a jury returned a verdict in favor of BASF in the amount of approximately $170 million(inclusive of the $22.5 million refund). On October 3, 2007, the judge in the state court case determined thatprejudgment interest on the verdict amounted to $36 million and issued a final judgment. Lyondell Chemicalappealed the judgment and has posted an appeal bond, which is collateralized by a $200 million letter ofcredit.
On April 21, 2010, oral arguments in the appeal were held before the Appellate Division and, onDecember 28, 2010, the judgment was reversed and the case remanded. The parties have filed motions withthe Bankruptcy Court for a determination as to whether the case will proceed in the Bankruptcy Court or NewJersey state court. We do not expect the ultimate resolution of this matter to have a material adverse effect onour consolidated financial position, liquidity, or results of operations, although it is possible that any suchresolution could have a material adverse effect on our results of operation for any period in which a resolutionoccurs.
Access Indemnity Demand
On December 20, 2010, one of our subsidiaries received demand letters from affiliates of AccessIndustries (collectively, “Access”), a more than five percent shareholder of the Company. We conducted aninitial investigation of the facts underlying the demand letters and engaged in discussions with Access. Werequested that Access withdraw its demands with prejudice and, on January 17, 2011, Access declined towithdraw the demands, with or without prejudice.
Specifically, Access affiliates Nell Limited (“Nell”) and BI S.á.r.l. (“BI”) have demanded thatLyondellBasell Industries Holdings B.V., a wholly-owned subsidiary of the Company (“LBIH”), indemnifythem and their shareholders, members, affiliates, officers, directors, employees and other related parties for alllosses, including attorney’s fees and expenses, arising out of a pending lawsuit styled Edward S. Weisfelner, asLitigation Trustee of the LB Litigation Trust v. Leonard Blavatnik, et al., Adversary Proceeding No. 09-1375(REG), in the United States Bankruptcy Court, Southern District of New York.
In the Weisfelner lawsuit, the plaintiffs seek to recover damages from numerous parties, including Nell,Access and its affiliates. The damages sought from Nell, Access and its affiliates include, among other things,the return of all amounts earned by them related to their acquisition of shares of Lyondell Chemical Companyprior to its acquisition by Basell AF S.C.A. in December 2007, distributions by Basell AF S.C.A. to itsshareholders before it acquired Lyondell Chemical Company, and management and transaction fees andexpenses. We cannot at this time determine the amount of liability, if any, that may be sought from LBIH byway of indemnity if a judgment is rendered or a settlement is paid in the Weisfelner lawsuit.
Nell and BI have also demanded that LBIH pay $50 million in management fees for the years 2009 and2010 and that LBIH pay other unspecified amounts relating to advice purportedly given in connection withfinancing and other strategic transactions.
Nell and BI assert that LBIH’s responsibility for indemnity and the claimed fees and expenses arises outof a management agreement entered into on December 11, 2007, between Nell and Basell AF S.C.A. Theyassert that LBIH, as a former subsidiary of Basell AF S.C.A., is jointly and severally liable for Basell AFS.C.A.’s obligations under the agreement, notwithstanding that LBIH was not a signatory to the agreement andthe liabilities of Basell AF S.C.A., which was a signatory, were discharged in the LyondellBasell bankruptcyproceedings.
We do not believe that the management agreement is in effect or that the Company, LBIH, or any otherCompany-affiliated entity owes any obligations under the management agreement. We intend to defendvigorously any proceedings, claims or demands that may be asserted.
Environmental Matters
From time to time we and our joint ventures receive notices or inquiries from federal, state or localgovernmental entities regarding alleged violations of environmental laws and regulations pertaining to, amongother things, the disposal, emission and storage of chemical and petroleum substances, including hazardous
42

wastes. Item 103 of the SEC’s Regulation S-K requires disclosure of certain environmental matters when agovernmental authority is a party to the proceedings and the proceedings involve potential monetary sanctionsthat we reasonably believe could exceed $100,000. The following matters pending as of December 31, 2010are disclosed in accordance with that requirement:
As part of the government settlement in the chapter 11 proceedings, the U.S., on behalf of EPA, wasallowed a general unsecured claim of $499,000 against Millennium Specialty Chemicals Inc. and $480,000against Houston Refining LP. These allowed claims settled the penalty amounts for alleged noncompliancebased upon pre-petition activities. In the case of the Houston refinery, the allegations arise from a 2007 EPAClean Air Act inspection. In the case of Millennium Specialty Chemicals, EPA conducted an inspection in2008 at the Colonels Island, Georgia facility and questions were raised concerning handling of contaminatedwastewater. Final resolution regarding these issues and any post-petition penalties is still subject to furthernegotiations with the government.
PART II
Item 5. MARKET FOR REGISTRANT’S COMMON EQUITY, RELATED STOCKHOLDER MATTERSAND ISSUER PURCHASES OF EQUITY SECURITIES
Our capital was issued effective April 30, 2010 in connection with our emergence from bankruptcyproceedings. Our shares have traded on the New York Stock Exchange, under the symbol “LYB,” sinceOctober 14, 2010. From April 30, 2010 until October 13, 2010, our shares they were quoted in the Pink OTCMarkets, Inc. (the “Pink Sheets”) under the symbols “LALLF” and “LBLLF.” The following table sets forththe range of the high and low per share sales prices for our shares as reported on the NYSE since October 14,2010 and on the Pink Sheets from April 30, 2010 through October 13, 2010.
2010 High Low
April 30, 2010 — June 30, 2010 . . . . . . . . . . . . . . . . . . . . . . . . . . . . . . . . . . . . . $23.25 $16.15
Third Quarter . . . . . . . . . . . . . . . . . . . . . . . . . . . . . . . . . . . . . . . . . . . . . . . . . . . 23.95 14.86
Fourth Quarter . . . . . . . . . . . . . . . . . . . . . . . . . . . . . . . . . . . . . . . . . . . . . . . . . . 34.54 23.71
2011First Quarter (through March 15, 2011) . . . . . . . . . . . . . . . . . . . . . . . . . . . . . . . . $40.90 $34.56
On March 15, 2011, the closing price of our stock on the NYSE was $38.28. As of March 15, 2011, wehad approximately 3,700 shareholders, based on the number of record holders on that date.
On April 30, 2010, when our capital was issued, we had both class A and class B shares. The two classeswere identical in all respects, other than a liquidation preference on the class B shares of an amount equal to$10.61 per share after payments to our creditors and certain supermajority voting rights with respect totransactions that would cause the class B shares to be purchased, converted or exchanged at a value less than$10.61 per share. The class B shares were convertible upon request of holders into class A shares on aone-for-one basis. Additionally, our Articles of Association provided that on the first day on which the closingprice per share exceeded $21.22 for 45 consecutive trading days in a 60 day period (provided that thethreshold was met on each of the first and last day of the 60 day period), the class B shares wouldautomatically, and without further action of the holders thereof, convert to class A shares. At the close ofbusiness on December 6, 2010, all class B shares converted to class A shares pursuant to the automaticconversion provision.
We have not yet paid any dividends on our shares. The payment of dividends in the future will be subjectto the requirements of Dutch law and the discretion of our shareholders (in the case of annual dividends), ourManagement Board and Supervisory Board. The declaration of any future cash dividends and, if declared, theamount of any such dividends, will depend upon general business conditions, our financial condition, ourearnings and cash flow, our capital requirements, financial covenants and other contractual restrictions on thepayment of dividends or distributions.
43
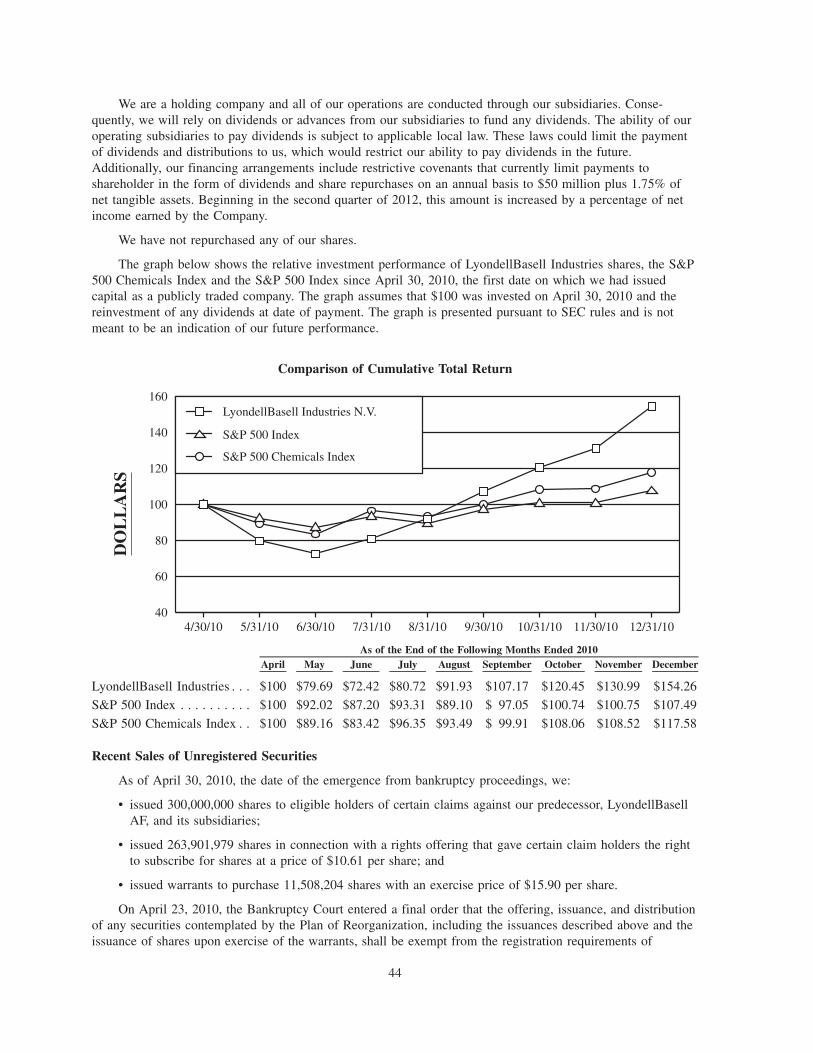
We are a holding company and all of our operations are conducted through our subsidiaries. Conse-quently, we will rely on dividends or advances from our subsidiaries to fund any dividends. The ability of ouroperating subsidiaries to pay dividends is subject to applicable local law. These laws could limit the paymentof dividends and distributions to us, which would restrict our ability to pay dividends in the future.Additionally, our financing arrangements include restrictive covenants that currently limit payments toshareholder in the form of dividends and share repurchases on an annual basis to $50 million plus 1.75% ofnet tangible assets. Beginning in the second quarter of 2012, this amount is increased by a percentage of netincome earned by the Company.
We have not repurchased any of our shares.
The graph below shows the relative investment performance of LyondellBasell Industries shares, the S&P500 Chemicals Index and the S&P 500 Index since April 30, 2010, the first date on which we had issuedcapital as a publicly traded company. The graph assumes that $100 was invested on April 30, 2010 and thereinvestment of any dividends at date of payment. The graph is presented pursuant to SEC rules and is notmeant to be an indication of our future performance.
Comparison of Cumulative Total Return
12/31/1011/30/1010/31/109/30/108/31/107/31/106/30/105/31/104/30/10
DO
LL
AR
S
LyondellBasell Industries N.V.
S&P 500 Index
S&P 500 Chemicals Index
40
60
80
100
120
140
160
April May June July August September October November DecemberAs of the End of the Following Months Ended 2010
LyondellBasell Industries . . . $100 $79.69 $72.42 $80.72 $91.93 $107.17 $120.45 $130.99 $154.26
S&P 500 Index . . . . . . . . . . $100 $92.02 $87.20 $93.31 $89.10 $ 97.05 $100.74 $100.75 $107.49
S&P 500 Chemicals Index . . $100 $89.16 $83.42 $96.35 $93.49 $ 99.91 $108.06 $108.52 $117.58
Recent Sales of Unregistered Securities
As of April 30, 2010, the date of the emergence from bankruptcy proceedings, we:
• issued 300,000,000 shares to eligible holders of certain claims against our predecessor, LyondellBasellAF, and its subsidiaries;
• issued 263,901,979 shares in connection with a rights offering that gave certain claim holders the rightto subscribe for shares at a price of $10.61 per share; and
• issued warrants to purchase 11,508,204 shares with an exercise price of $15.90 per share.
On April 23, 2010, the Bankruptcy Court entered a final order that the offering, issuance, and distributionof any securities contemplated by the Plan of Reorganization, including the issuances described above and theissuance of shares upon exercise of the warrants, shall be exempt from the registration requirements of
44
Section 5 of the Securities Act and any other applicable law requiring registration or qualification prior to theoffering, issuance, distribution, or sale of securities. An aggregate of 2,326,676 shares have been issued uponexercise of warrants.
Additionally, up to 22,000,000 shares are authorized for issuance to employees and directors ofLyondellBasell Industries N.V. and its subsidiaries pursuant to our incentive plan. Pursuant to LyondellBasellIndustries N.V.’s 2010 Long-Term Incentive Plan, and effective as of April 30, 2010, we issued Mr. Gallogly1,771,794 shares of restricted stock. The restricted shares vest on the fifth anniversary of the date ofMr. Gallogly’s employment agreement of May 14, 2009. We have issued an additional 2,036,582 restrictedstock units to certain senior level employees and members of the Supervisory Board. The employee restrictedstock units vest, subject to earlier forfeiture, on the fifth anniversary of the date of grant. Each of the directors’restricted stock unit awards vest on June 30 in the year of the expiration of his term as a director, which is2011, 2012 or 2013. All of these issuances were compensatory in nature and made without cost to theemployees or directors.
Effective April 30, 2010, we issued Mr. Gallogly options to purchase 5,639,020 shares at an exerciseprice of $17.61 per share. The options vest in equal annual increments over the five year period beginningMay 14, 2009. We have issued additional options to purchase up to 3,087,573 shares to certain senior levelemployees at exercise prices ranging from $16.45 to $26.75 per share. In each case, the exercise price is equalto the fair market value of our shares on the date of grant. These stock options vest in three equal annualincrements, beginning on the second anniversary of the date of grant. The grants of the stock options werecompensatory in nature and made without cost to the employees.
The grants of the restricted stock units and the stock options were made from time to time between April30 and December 31, 2010.
These grants were made in reliance on Section 4(2) and Rule 701 of the Securities Act related tosecurities issued not involving a public offering and pursuant to certain compensatory benefit plans andcontracts or are deemed to not be sales of securities under Section 2 of the Securities Act.
45

Item 6. SELECTED FINANCIAL DATA
See Management’s Discussion and Analysis of Financial Condition and Results of Operations for adiscussion of factors that will enhance an understanding of this data.
The following selected financial data of the Company and its predecessor, LyondellBasell AF S.C.A.(“LyondellBasell AF”) should be read in conjunction with the Consolidated Financial Statements and relatednotes thereto and “— Management’s Discussion and Analysis of Financial Condition and Results ofOperations,” below. The selected financial data of the Company and the Predecessor were derived from theiraudited consolidated financial statements. Those financial statements were prepared from the books andrecords of LyondellBasell AF for periods through April 30, 2010 and of the Company upon emergence frombankruptcy after that date. As discussed elsewhere in this annual report on Form 10-K, we became thesuccessor parent holding company of the subsidiaries of LyondellBasell AF and the reporting entity uponcompletion of the bankruptcy proceedings. Financial information is reported for the Company as the successoron a basis different from financial information of the predecessor, LyondellBasell AF. As a result of theapplication of fresh-start accounting and restructuring activities pursuant to the Plan of Reorganization, theSuccessor period is not comparable to the Predecessor period.
2010 2010 2009 2008 2007(a) 2006
May 1through
December 31,
January 1throughApril 30, For the Year Ended December 31,
Successor Predecessor
In millions of dollars
Results of Operations Data:Sales and other operating
revenues . . . . . . . . . . . . . . . . . . . $27,684 $13,467 $30,828 $50,706 $17,120 $13,175
Interest expense . . . . . . . . . . . . . . . (545) (713) (1,795) (2,476) (353) (332)
Income (loss) from equityinvestments(b) . . . . . . . . . . . . . . 86 84 (181) 38 162 130
Income (loss) from continuingoperations(c) . . . . . . . . . . . . . . . . 1,516 8,506 (2,872) (7,343) 661 396
Earnings per share from continuingoperations:
Basic . . . . . . . . . . . . . . . . . . . . . 2.68Diluted . . . . . . . . . . . . . . . . . . . . 2.67
Income (loss) from discontinuedoperations, net of tax . . . . . . . . . 64 (2) 1 15 — —
Earnings per share fromdiscontinued operations:
Basic . . . . . . . . . . . . . . . . . . . . . 0.11
Diluted . . . . . . . . . . . . . . . . . . . . 0.11
Balance Sheet Data:Total assets . . . . . . . . . . . . . . . . . . 25,494 27,761 28,651 39,728 9,549
Short-term debt . . . . . . . . . . . . . . . 42 6,182 774 2,415 779
Long-term debt(d) . . . . . . . . . . . . . 6,040 802 23,195 22,000 3,364
Cash and cash equivalents. . . . . . . . 4,222 558 858 560 830
Accounts receivable . . . . . . . . . . . . 3,747 3,287 2,585 4,165 2,041
Inventories . . . . . . . . . . . . . . . . . . . 4,824 3,277 3,314 5,178 1,339
Working capital . . . . . . . . . . . . . . . 5,810 4,436 3,237 5,019 1,900
Liabilities subject to compromise . . — 22,494 — — —
46
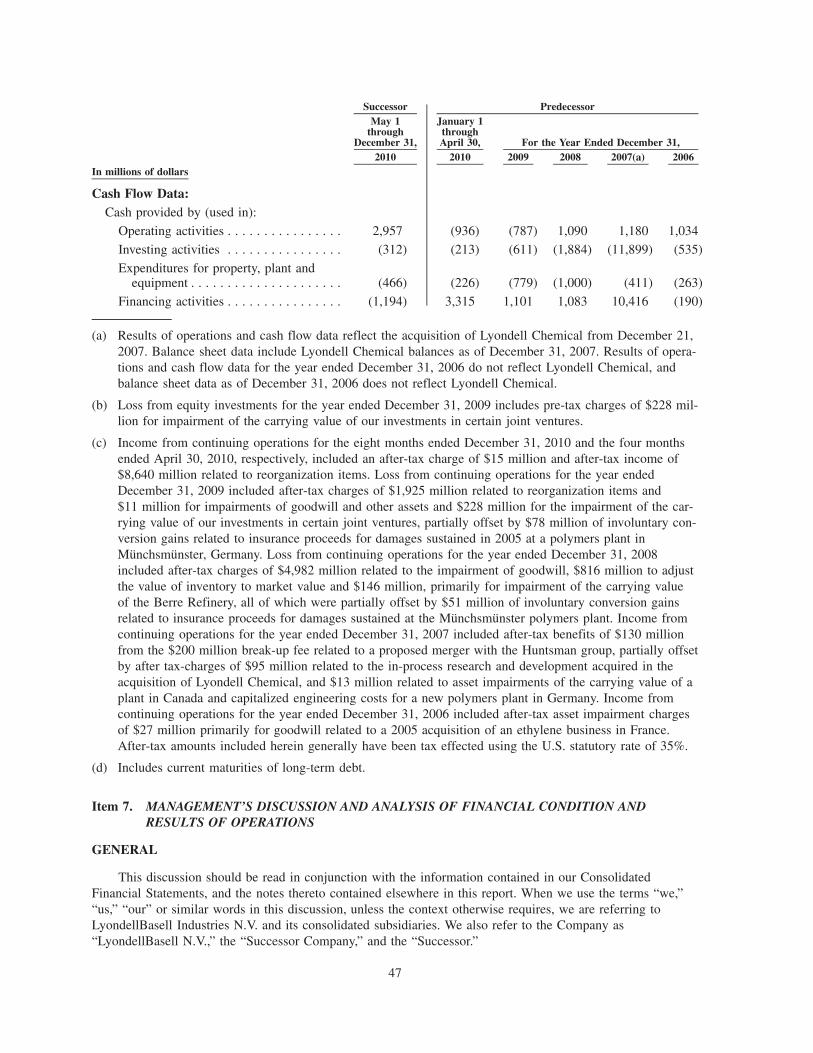
2010 2010 2009 2008 2007(a) 2006
May 1through
December 31,
January 1throughApril 30, For the Year Ended December 31,
Successor Predecessor
In millions of dollars
Cash Flow Data:Cash provided by (used in):
Operating activities . . . . . . . . . . . . . . . . 2,957 (936) (787) 1,090 1,180 1,034
Investing activities . . . . . . . . . . . . . . . . (312) (213) (611) (1,884) (11,899) (535)
Expenditures for property, plant andequipment . . . . . . . . . . . . . . . . . . . . . (466) (226) (779) (1,000) (411) (263)
Financing activities . . . . . . . . . . . . . . . . (1,194) 3,315 1,101 1,083 10,416 (190)
(a) Results of operations and cash flow data reflect the acquisition of Lyondell Chemical from December 21,2007. Balance sheet data include Lyondell Chemical balances as of December 31, 2007. Results of opera-tions and cash flow data for the year ended December 31, 2006 do not reflect Lyondell Chemical, andbalance sheet data as of December 31, 2006 does not reflect Lyondell Chemical.
(b) Loss from equity investments for the year ended December 31, 2009 includes pre-tax charges of $228 mil-lion for impairment of the carrying value of our investments in certain joint ventures.
(c) Income from continuing operations for the eight months ended December 31, 2010 and the four monthsended April 30, 2010, respectively, included an after-tax charge of $15 million and after-tax income of$8,640 million related to reorganization items. Loss from continuing operations for the year endedDecember 31, 2009 included after-tax charges of $1,925 million related to reorganization items and$11 million for impairments of goodwill and other assets and $228 million for the impairment of the car-rying value of our investments in certain joint ventures, partially offset by $78 million of involuntary con-version gains related to insurance proceeds for damages sustained in 2005 at a polymers plant inMunchsmunster, Germany. Loss from continuing operations for the year ended December 31, 2008included after-tax charges of $4,982 million related to the impairment of goodwill, $816 million to adjustthe value of inventory to market value and $146 million, primarily for impairment of the carrying valueof the Berre Refinery, all of which were partially offset by $51 million of involuntary conversion gainsrelated to insurance proceeds for damages sustained at the Munchsmunster polymers plant. Income fromcontinuing operations for the year ended December 31, 2007 included after-tax benefits of $130 millionfrom the $200 million break-up fee related to a proposed merger with the Huntsman group, partially offsetby after tax-charges of $95 million related to the in-process research and development acquired in theacquisition of Lyondell Chemical, and $13 million related to asset impairments of the carrying value of aplant in Canada and capitalized engineering costs for a new polymers plant in Germany. Income fromcontinuing operations for the year ended December 31, 2006 included after-tax asset impairment chargesof $27 million primarily for goodwill related to a 2005 acquisition of an ethylene business in France.After-tax amounts included herein generally have been tax effected using the U.S. statutory rate of 35%.
(d) Includes current maturities of long-term debt.
Item 7. MANAGEMENT’S DISCUSSION AND ANALYSIS OF FINANCIAL CONDITION ANDRESULTS OF OPERATIONS
GENERAL
This discussion should be read in conjunction with the information contained in our ConsolidatedFinancial Statements, and the notes thereto contained elsewhere in this report. When we use the terms “we,”“us,” “our” or similar words in this discussion, unless the context otherwise requires, we are referring toLyondellBasell Industries N.V. and its consolidated subsidiaries. We also refer to the Company as“LyondellBasell N.V.,” the “Successor Company,” and the “Successor.”
47
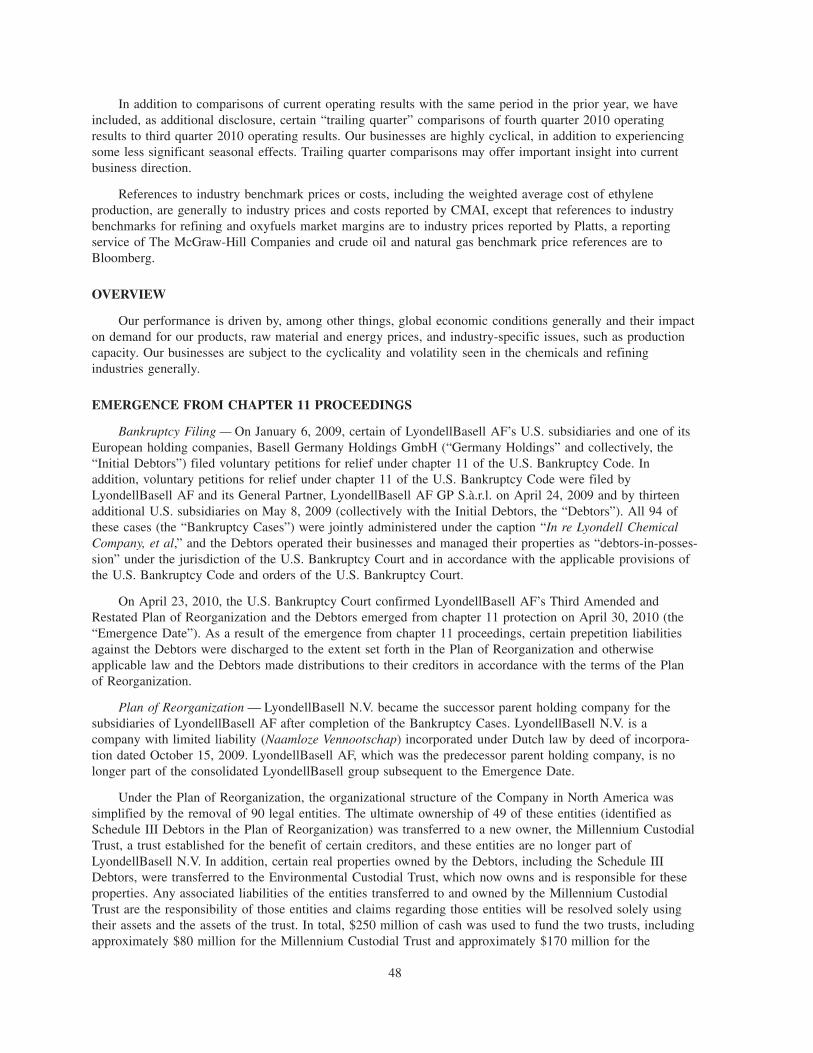
In addition to comparisons of current operating results with the same period in the prior year, we haveincluded, as additional disclosure, certain “trailing quarter” comparisons of fourth quarter 2010 operatingresults to third quarter 2010 operating results. Our businesses are highly cyclical, in addition to experiencingsome less significant seasonal effects. Trailing quarter comparisons may offer important insight into currentbusiness direction.
References to industry benchmark prices or costs, including the weighted average cost of ethyleneproduction, are generally to industry prices and costs reported by CMAI, except that references to industrybenchmarks for refining and oxyfuels market margins are to industry prices reported by Platts, a reportingservice of The McGraw-Hill Companies and crude oil and natural gas benchmark price references are toBloomberg.
OVERVIEW
Our performance is driven by, among other things, global economic conditions generally and their impacton demand for our products, raw material and energy prices, and industry-specific issues, such as productioncapacity. Our businesses are subject to the cyclicality and volatility seen in the chemicals and refiningindustries generally.
EMERGENCE FROM CHAPTER 11 PROCEEDINGS
Bankruptcy Filing — On January 6, 2009, certain of LyondellBasell AF’s U.S. subsidiaries and one of itsEuropean holding companies, Basell Germany Holdings GmbH (“Germany Holdings” and collectively, the“Initial Debtors”) filed voluntary petitions for relief under chapter 11 of the U.S. Bankruptcy Code. Inaddition, voluntary petitions for relief under chapter 11 of the U.S. Bankruptcy Code were filed byLyondellBasell AF and its General Partner, LyondellBasell AF GP S.à.r.l. on April 24, 2009 and by thirteenadditional U.S. subsidiaries on May 8, 2009 (collectively with the Initial Debtors, the “Debtors”). All 94 ofthese cases (the “Bankruptcy Cases”) were jointly administered under the caption “In re Lyondell ChemicalCompany, et al,” and the Debtors operated their businesses and managed their properties as “debtors-in-posses-sion” under the jurisdiction of the U.S. Bankruptcy Court and in accordance with the applicable provisions ofthe U.S. Bankruptcy Code and orders of the U.S. Bankruptcy Court.
On April 23, 2010, the U.S. Bankruptcy Court confirmed LyondellBasell AF’s Third Amended andRestated Plan of Reorganization and the Debtors emerged from chapter 11 protection on April 30, 2010 (the“Emergence Date”). As a result of the emergence from chapter 11 proceedings, certain prepetition liabilitiesagainst the Debtors were discharged to the extent set forth in the Plan of Reorganization and otherwiseapplicable law and the Debtors made distributions to their creditors in accordance with the terms of the Planof Reorganization.
Plan of Reorganization — LyondellBasell N.V. became the successor parent holding company for thesubsidiaries of LyondellBasell AF after completion of the Bankruptcy Cases. LyondellBasell N.V. is acompany with limited liability (Naamloze Vennootschap) incorporated under Dutch law by deed of incorpora-tion dated October 15, 2009. LyondellBasell AF, which was the predecessor parent holding company, is nolonger part of the consolidated LyondellBasell group subsequent to the Emergence Date.
Under the Plan of Reorganization, the organizational structure of the Company in North America wassimplified by the removal of 90 legal entities. The ultimate ownership of 49 of these entities (identified asSchedule III Debtors in the Plan of Reorganization) was transferred to a new owner, the Millennium CustodialTrust, a trust established for the benefit of certain creditors, and these entities are no longer part ofLyondellBasell N.V. In addition, certain real properties owned by the Debtors, including the Schedule IIIDebtors, were transferred to the Environmental Custodial Trust, which now owns and is responsible for theseproperties. Any associated liabilities of the entities transferred to and owned by the Millennium CustodialTrust are the responsibility of those entities and claims regarding those entities will be resolved solely usingtheir assets and the assets of the trust. In total, $250 million of cash was used to fund the two trusts, includingapproximately $80 million for the Millennium Custodial Trust and approximately $170 million for the
48

Environmental Custodial Trust and to make certain direct payments to the Environmental Protection Agencyand certain state environmental agencies.
Pursuant to the Plan of Reorganization, administrative and priority claims, as well as the new moneydebtor-in-possession (“DIP”) financing that had been incurred during the bankruptcy proceedings were repaidin full. The lenders of certain DIP loans representing a dollar-for-dollar roll-up or conversion of previouslyoutstanding senior secured loans (“DIP Roll-up Notes”) received Senior Secured 11% Notes in the sameprincipal amount as the DIP Roll-up Notes. Holders of senior secured claims received a combination ofLyondellBasell N.V. class A ordinary shares; rights to purchase class B ordinary shares of LyondellBasellN.V.; LyondellBasell N.V. warrants to purchase class A ordinary shares; and cash in exchange for their claims.Pursuant to the Amended Lender Litigation Settlement approved by the U.S. Bankruptcy Court on March 11,2010, allowed general unsecured claims received a combination of cash and class A ordinary shares ofLyondellBasell N.V.
See “Liquidity and Capital Resources” below for a discussion of the emergence financing.
Tax Impact of Reorganization — Under the Plan of Reorganization, LyondellBasell AF’s pre-petition debtsecurities, revolving credit facility and other obligations were extinguished. Absent an exception, a debtorrecognizes cancellation of indebtedness income (“CODI”) upon discharge of its outstanding indebtedness foran amount of consideration that is less than its adjusted issue price. The Internal Revenue Code of 1986, asamended (“IRC”), provides that a debtor in a bankruptcy case may exclude CODI from income, but mustreduce certain of its tax attributes by the amount of any CODI realized as a result of the consummation of aplan of reorganization. The amount of CODI realized by a taxpayer is the adjusted issue price of anyindebtedness discharged less the sum of (i) the amount of cash paid, (ii) the issue price of any newindebtedness issued and (iii) the fair market value of any other consideration, including equity, issued. As aresult of the market value of our equity on the Emergence Date, the estimated amount of CODI exceeded theestimated amount of its tax attributes by approximately $7,433 million. The actual reduction in tax attributesdoes not occur until the first day of the subsequent tax year, or January 1, 2011.
As a result of tax attribute reduction, we do not expect to retain any U.S. net operating loss carryforwards,alternative minimum tax credits or capital loss carryforwards. In addition, we expect that most, if not all, ofour tax basis in depreciable assets will be eliminated. Accordingly, it is expected that our liability forU.S. income taxes in future periods will reflect these adjustments and our estimated cash tax liabilities for theyears following 2010 will be significantly higher than in 2009 or 2010. This situation may be somewhatpostponed by the temporary bonus depreciation provisions contained in the Job Creation Act of 2010, whichallows current year expensing for certain qualified acquisitions.
The Company recorded its adjusted taxes in fresh-start accounting without adjustment for estimatedchanges of tax attributes that could occur from May 1, 2010 to January 1, 2011, the date of actual reduction oftax attributes. Any adjustment to our tax attributes as a result of events or transactions that occurred during theperiod from May 1, 2010 to December 31, 2010 was reflected in the earnings of the Successor Company.
IRC Sections 382 and 383 provide an annual limitation with respect to the ability of a corporation toutilize its tax attributes, as well as certain built-in-losses, against future U.S. taxable income in the event of achange in ownership. The emergence from chapter 11 proceedings is considered a change in ownership forpurposes of IRC Section 382. The limitation under the IRC is based on the value of the corporation as of theEmergence Date. We do not expect that the application of these limitations will have a material affect uponour U.S. federal income tax liabilities. Germany has similar provisions that preclude the use of certain taxattributes generated prior to a change of control. As of the Emergence Date, the Company had tax benefitsassociated with excess interest expense carryforwards of $16 million in Germany that were eliminated as aresult of the emergence. The reversal of tax benefits associated with the loss of these carryforwards is reflectedin the Predecessor period.
Our current and future provisions for income taxes are significantly impacted by the initial recognition of,and changes in, valuation allowances in certain countries and are dependent upon future earnings and earnings
49

sustainability in those jurisdictions. Consequently, our effective tax rate of 10.1% in the Successor period isnot indicative of future effective tax rates.
Financial Information — Following the completion of the Bankruptcy Cases, LyondellBasell AF’s equityinterests in its indirect subsidiaries terminated and LyondellBasell N.V., the successor holding company, nowowns and operates, directly and indirectly, substantially the same business owned and operated byLyondellBasell AF prior to emergence from bankruptcy. For accounting purposes, the operations ofLyondellBasell AF are deemed to have ceased on April 30, 2010 and LyondellBasell N.V. is deemed to havebegun operations on that date. Effective May 1, 2010, we adopted fresh-start accounting. References in thefollowing discussions to the “Company” for periods prior to April 30, 2010, the Emergence Date, are to thePredecessor Company and, for periods after the Emergence Date, to the Successor Company.
The accompanying consolidated financial statements present separately the period prior to April 30, 2010and the period after emergence from bankruptcy to recognize the application of fresh-start accounting.Management believes that combining the Successor and Predecessor periods for the year ended December 31,2010, which is a non-GAAP presentation, provides a more meaningful comparison of the 2010, 2009 and 2008results of operations and cash flows when considered with the effects of fresh-start accounting describedbelow. As a result, we have combined the periods in our discussion to enable a more meaningful analysis ofyear over year results. The effects of fresh-start accounting are specifically addressed throughout the discussionto ensure a proper analysis. References in the following discussion to results for the year ended December 31,2010 are to the combined Successor and Predecessor periods unless otherwise specifically described asSuccessor or Predecessor.
The primary impacts of our reorganization pursuant to the Plan of Reorganization and the adoption offresh-start accounting on our results of operations are as follows:
Inventory — We adopted the last in, first out (“LIFO”) method of accounting for inventory uponimplementation of fresh-start accounting. Prior to the emergence from bankruptcy, LyondellBasell AF usedboth the first in, first out (“FIFO”) and LIFO methods of accounting to determine inventory cost. For purposesof evaluating segment results, management reviewed operating results for LyondellBasell AF determined usingcurrent cost, which approximates results using the LIFO method of accounting for inventory. Subsequent tothe Emergence Date, our operating results are reviewed using the LIFO method of accounting for inventory.While determining the impact of the adoption of LIFO on predecessor periods is not practicable, we believethat the current cost method used by the Predecessor for segment reporting is similar to LIFO and the currentcost method would have resulted in a decrease of cost of sales of $29 million for the twelve months endedDecember 31, 2009.
In addition, on April 30, 2010, pursuant to ASC Topic 852, Reorganizations, we recorded inventory atfair value. The increase in inventory of $1,297 million was primarily in the U.S. and was largely driven by theprice of crude oil. The decline of the per barrel benchmark price of crude oil from $86.15 at April 30, 2010 to$75.63 at June 30, 2010 contributed to a $333 million lower of cost or market charge in the second quarter2010, primarily to our raw materials and finished goods inventory. In the third quarter 2010, lower marketprices, primarily for polypropylene, resulted in an additional $32 million lower of cost or market charge toadjust the value of our finished goods inventory to market. During the fourth quarter 2010, we recorded a$323 million non-cash credit to reflect the market price recovery of WTI crude oil, substantially offsetting thesecond quarter 2010 lower of cost or market adjustment to our raw materials inventory. The effect of theseadjustments to the value of our inventory is reflected in cost of sales for the Successor period.
Depreciation and amortization expense — Depreciation and amortization expense is lower in the Succes-sor period as a result of our revaluation of assets for fresh-start accounting. For additional information on the
50

revaluation of assets, see Note 4 to the Consolidated Financial Statements. Depreciation and amortization asreported for all periods presented is as follows:
2010 2010 2009 2008
May 1through
December 31,
January 1throughApril 30,
For the TwelveMonths EndedDecember 31,
Successor Predecessor
Millions of dollars
Cost of sales:Depreciation . . . . . . . . . . . . . . . . . . . . . . . . . . . . . . . . . . . . . $394 $464 $1,412 $1,493
Amortization . . . . . . . . . . . . . . . . . . . . . . . . . . . . . . . . . . . . 142 75 293 356Research and development expenses:
Depreciation . . . . . . . . . . . . . . . . . . . . . . . . . . . . . . . . . . . . . 11 8 24 23
Selling, general and administrative expenses:Depreciation . . . . . . . . . . . . . . . . . . . . . . . . . . . . . . . . . . . . . 11 18 45 39
$558 $565 $1,774 $1,911
Interest expense — Lower interest expense in the Successor period was largely driven by the discharge orrepayment of debt, upon which interest was accruing during the bankruptcy, through the Company’sreorganization on April 30, 2010 pursuant to the Plan of Reorganization, partially offset by interest expense onthe new debt incurred as part of the emergence from bankruptcy.
2010 2010 2009 2008
May 1through
December 31,
January 1throughApril 30,
SuccessorFor the Twelve
MonthsEnded December 31,
Predecessor
Millions of dollars
Interest expense . . . . . . . . . . . . . . . . . . . . . . . . . . . . . . . . . . . . $545 $713 $1,795 $2,476
Overview of Results of Operations
2010 Versus 2009 — Global market conditions in 2010 improved from the weak conditions experiencedthroughout most of 2009 as demand in the durable goods sector, particularly the automotive markets, washigher than in 2009. As a result, demand and operating rates were higher in 2010 than in 2009. In addition,certain of our business segments benefited from planned and unplanned competitor operating disruptions,particularly during the second quarter 2010.
Excluding the impacts of fresh-start accounting discussed above in “— Emergence from Chapter 11Proceedings,” operating results in 2010 generally reflected higher product margins and higher sales volumescompared to 2009. Reliable operations and the effect of industry supply disruptions resulted in higher productmargins and higher sales volumes in the O&P-Americas business segment. Higher operating results in theO&P-EAI and the I&D businesses were primarily a reflection of higher sales volumes and higher productmargins due to improvement in the durable goods markets, especially the automotive market. The Refiningand Oxyfuels business segment results were higher in 2010 primarily due to higher refining margins at theHouston refinery. Lower licensing revenue contributed to lower results in the Technology segment.
2009 Versus 2008 — Although global market conditions in 2009 improved compared to late 2008,compared to the full year 2008, market conditions in 2009 were significantly weaker. Demand was particularlyweak in durable goods market sectors, including housing and automotive markets. Similarly, while industryoperating rates and sales volumes improved during the course of 2009 compared to late 2008, for the full year2009, they were below the levels experienced for the full year 2008, despite the significant decline in businessactivity late in 2008.
51
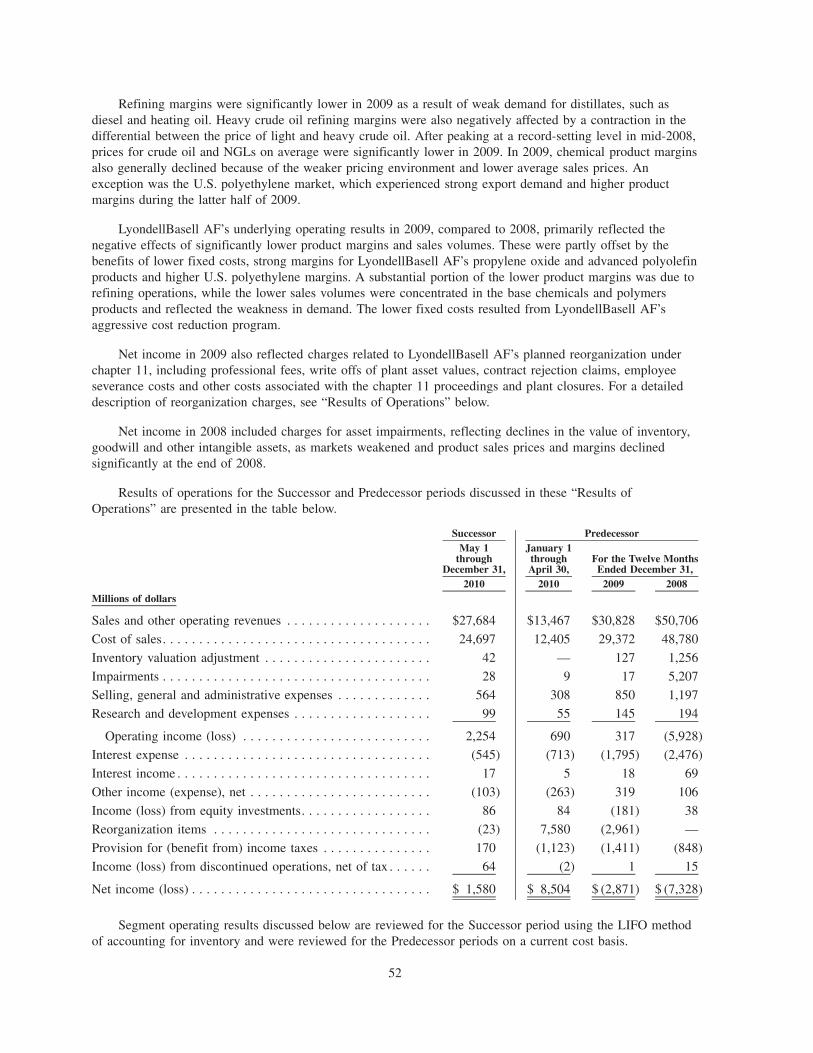
Refining margins were significantly lower in 2009 as a result of weak demand for distillates, such asdiesel and heating oil. Heavy crude oil refining margins were also negatively affected by a contraction in thedifferential between the price of light and heavy crude oil. After peaking at a record-setting level in mid-2008,prices for crude oil and NGLs on average were significantly lower in 2009. In 2009, chemical product marginsalso generally declined because of the weaker pricing environment and lower average sales prices. Anexception was the U.S. polyethylene market, which experienced strong export demand and higher productmargins during the latter half of 2009.
LyondellBasell AF’s underlying operating results in 2009, compared to 2008, primarily reflected thenegative effects of significantly lower product margins and sales volumes. These were partly offset by thebenefits of lower fixed costs, strong margins for LyondellBasell AF’s propylene oxide and advanced polyolefinproducts and higher U.S. polyethylene margins. A substantial portion of the lower product margins was due torefining operations, while the lower sales volumes were concentrated in the base chemicals and polymersproducts and reflected the weakness in demand. The lower fixed costs resulted from LyondellBasell AF’saggressive cost reduction program.
Net income in 2009 also reflected charges related to LyondellBasell AF’s planned reorganization underchapter 11, including professional fees, write offs of plant asset values, contract rejection claims, employeeseverance costs and other costs associated with the chapter 11 proceedings and plant closures. For a detaileddescription of reorganization charges, see “Results of Operations” below.
Net income in 2008 included charges for asset impairments, reflecting declines in the value of inventory,goodwill and other intangible assets, as markets weakened and product sales prices and margins declinedsignificantly at the end of 2008.
Results of operations for the Successor and Predecessor periods discussed in these “Results ofOperations” are presented in the table below.
2010 2010 2009 2008
May 1through
December 31,
January 1throughApril 30,
For the Twelve MonthsEnded December 31,
Successor Predecessor
Millions of dollars
Sales and other operating revenues . . . . . . . . . . . . . . . . . . . . $27,684 $13,467 $30,828 $50,706
Cost of sales. . . . . . . . . . . . . . . . . . . . . . . . . . . . . . . . . . . . . 24,697 12,405 29,372 48,780
Inventory valuation adjustment . . . . . . . . . . . . . . . . . . . . . . . 42 — 127 1,256
Impairments . . . . . . . . . . . . . . . . . . . . . . . . . . . . . . . . . . . . . 28 9 17 5,207
Selling, general and administrative expenses . . . . . . . . . . . . . 564 308 850 1,197
Research and development expenses . . . . . . . . . . . . . . . . . . . 99 55 145 194
Operating income (loss) . . . . . . . . . . . . . . . . . . . . . . . . . . 2,254 690 317 (5,928)
Interest expense . . . . . . . . . . . . . . . . . . . . . . . . . . . . . . . . . . (545) (713) (1,795) (2,476)
Interest income . . . . . . . . . . . . . . . . . . . . . . . . . . . . . . . . . . . 17 5 18 69
Other income (expense), net . . . . . . . . . . . . . . . . . . . . . . . . . (103) (263) 319 106
Income (loss) from equity investments. . . . . . . . . . . . . . . . . . 86 84 (181) 38
Reorganization items . . . . . . . . . . . . . . . . . . . . . . . . . . . . . . (23) 7,580 (2,961) —
Provision for (benefit from) income taxes . . . . . . . . . . . . . . . 170 (1,123) (1,411) (848)
Income (loss) from discontinued operations, net of tax . . . . . . 64 (2) 1 15
Net income (loss) . . . . . . . . . . . . . . . . . . . . . . . . . . . . . . . . . $ 1,580 $ 8,504 $ (2,871) $ (7,328)
Segment operating results discussed below are reviewed for the Successor period using the LIFO methodof accounting for inventory and were reviewed for the Predecessor periods on a current cost basis.
52

RESULTS OF OPERATIONS
Revenues — We had revenues of $41,151 million in 2010, $30,828 million in 2009 and $50,706 millionin 2008. The $10,323 million increase in 2010 compared to 2009 reflected higher demand, resulting in higheraverage sales prices and higher sales volumes across most business segments, partially offset by lowerlicensing revenue in the Technology business segment. Higher crude-oil and natural gas prices also contributedto the increase in average sales prices in 2010. The $19,878 million decrease in 2009 compared to 2008reflected the effect of significantly lower sales prices and sales volumes due to lower crude oil and natural gasprices and weaker demand.
Cost of Sales — Cost of sales were $37,102 million in 2010, $29,372 million in 2009 and $48,780 millionin 2008.
The $7,730 million increase in cost of sales in 2010 was primarily due to higher raw material costs,which reflect the effects of higher crude oil and natural gas liquids-based raw material prices, as well as theeffect of higher sales volumes. Cost of sales in the Successor period included a $64 million charge related to achange in estimate related to a dispute over environmental liability. Lower depreciation and amortizationexpense of $630 million due to the $7,474 million write-down of Property, plant, and equipment associatedwith the revaluation of our assets in fresh-start accounting partially offset the higher costs in the SuccessorPeriod. The Predecessor period in 2010 included a charge of $23 million for plant closure and other costsrelated to a polypropylene plant in Terni, Italy.
The $19,408 million decrease in 2009 compared to 2008 was primarily due to lower market prices forcrude oil, crude oil-based and natural gas liquids raw materials, lower fixed and variable costs, and lower salesvolumes and operating rates, reflecting the weak demand.
Inventory Valuation Adjustment — The Company had non-cash inventory valuation adjustments of$42 million, $127 million and $1,256 million in the 2010 Successor period, 2009 and 2008, respectively. Werecorded non-cash charges in the 2010 Successor period totaling $365 million to adjust the value of our rawmaterials and finished goods inventory to market as of June 30, 2010 and September 30, 2010. As discussedabove, these lower of cost or market charges were the result of the decline in the per barrel benchmark priceof crude oil from the Emergence Date to June 30, 2010 and lower market prices for certain products, primarilypolypropylene. A non-cash credit of $323 million recorded in the fourth quarter 2010 to reflect the recovery ofmarket price substantially offset the lower of cost or market adjustment related to our raw materials inventory.In 2009 and 2008, the Company recorded charges of $127 million and $1,256 million, respectively, to adjustthe value of its inventory to market, which was lower than the carrying value on December 31, 2009 and2008.
Impairments — Impairments of $37 million, $17 million and $5,207 million were recognized by theCompany in 2010, 2009 and 2008, respectively. In the 2010 Successor period, we recognized $28 million ofimpairment charges, including a charge of $25 million related to impairment of the carrying value of assets atthe Berre refinery. Capital spending required for the operation of the Berre refinery will continue to beimpaired until such time as the discounted cash flow projections for the Berre refinery are sufficient to recoverthe asset’s carrying amount. In 2008, the Company recognized charges of $4,982 million and $225 million,respectively, for impairment of goodwill related to the December 20, 2007 acquisition of Lyondell Chemicaland the carrying value of its Berre refinery.
SG&A Expenses — Selling, general and administrative (“SG&A”) expenses were $872 million in 2010,$850 million in 2009 and $1,197 million in 2008. The $347 million decrease in 2009 compared to 2008 wasprimarily the result of LyondellBasell AF’s 2009 cost reduction program, and a favorable effect from changesin currency exchange rates. Currency exchange rates had a favorable effect on costs of non-U.S. operations asthe U.S. dollar strengthened versus the Euro in 2009 compared to 2008. SG&A expenses in 2008 included$564 million of Lyondell Chemical and Berre refinery SG&A expense following their acquisitions byLyondellBasell AF on December 20, 2007 and April 1, 2008, respectively.
Operating Income (Loss) — The Company had operating income of $2,944 million and $317 million in2010 and 2009, respectively, and an operating loss of $5,928 million in 2008. The results of our underlying
53
operations improved in 2010, compared to 2009, reflecting higher product margins and the effect of highersales volumes as demand increased due to improved global market conditions, particularly in the first half ofthe year compared to the same periods in 2009 when demand was very weak. Operating results in the 2010Successor period benefited from lower depreciation and amortization expense of $651 million primarily due tothe $7,474 million write-down of Property, plant, and equipment associated with the revaluation of our assetsin fresh-start accounting. Operating results in the 2010 Successor period also included the negative impact ofthe $64 million non-cash charge related to a dispute over environmental liability.
Results in 2009 compared to 2008 reflected the benefits of the Company’s cost reduction program, offsetby the unfavorable effects of lower product margins, sales volumes, and currency exchange rates onnon-U.S. operating income. Results in 2008 were impacted by charges of $4,982 million and $225 million,respectively, for impairment of goodwill related to the December 20, 2007 acquisition of Lyondell Chemicaland the carrying value of the Berre refinery; and a charge of $1,256 million to adjust inventory to marketvalue.
Operating results for each of our business segments are reviewed further in the “Segment Analysis”section below.
Interest Expense — Interest expense was $1,258 million in 2010, $1,795 million in 2009 and $2,476 mil-lion in 2008. Interest expense was $537 million lower in 2010 compared to 2009, primarily due to therepayment or discharge of debt on the Emergence Date in accordance with the Plan of Reorganization, uponwhich interest was accruing during the bankruptcy, and the repayment of $1,233 million of debt in the fourthquarter 2010. This decrease in interest expense was partially offset by interest expense on the debt incurred aspart of the emergence financing (see Note 15 to the Consolidated Financial Statements) and $26 million ofcharges related to the prepayment of $769 million of debt in December 2010. The prepayment of debtincluded $275 million of our 8% senior secured notes and $494 million of the senior secured term loan facilityin December 2010 and $464 million under the accounts receivable securitization facility and accountsreceivable factoring agreement during October and November of 2010. Interest expense in 2009 was lower,compared to 2008, primarily due to various debt instruments becoming subject to compromise as a result ofthe chapter 11 filing. Contractual interest expense for the Predecessor periods was $2,720 million for 2009 and$2,476 million for 2008.
Other Income (Expense), net — The Company had other expense, net, of $366 million in 2010 and otherincome, net, of $319 million and $106 million in 2009 and 2008, respectively. Other expense, net, in 2010included the negative effect of the fair value adjustment of the warrants to purchase our shares of $114 millionand foreign exchange losses of $240 million. In 2009 and 2008, the Company recognized involuntaryconversion gains of $120 million and $79 million, respectively, representing partial insurance settlements ofoutstanding insurance claims related to damages sustained in 2005 at the polymers plant in Munchsmunster,Germany, and foreign exchange gains of $123 million and $20 million, respectively, as a result of changes incurrency exchange rates. Other income, net, in 2009 also included benefits totaling $72 million resulting fromindemnification payments received from previous plant owners for employee benefit and environmentalremediation costs related to plant closures and a $15 million gain related to settlement of a U.K. pensionclaim.
Income (Loss) from Equity Investments — The Company had income from equity investments totaling$170 million in 2010, a loss from equity investments of $181 million in 2009 and income from equityinvestments of $38 million in 2008. The loss from equity investments in 2009 included a $228 million chargefor impairment of the carrying value of the Company’s investments in certain joint ventures. Income fromequity investments in 2010 benefited from the operations of our Saudi Ethylene & Polyethylene Company Ltd.joint venture, which commenced operations in June 2009, and from a new polypropylene plant operated byour HMC Polymers Company Ltd. joint venture that commenced operations in October 2010.
Reorganization Items — The Company had income from reorganization items totaling $7,557 million in2010 compared to reorganization expense of $2,961 million in 2009. Gains from reorganization items in 2010included gains totaling $13,617 million related to settlement of liabilities subject to compromise, deconsolida-tion of entities upon emergence, adjustments related to rejected contracts, and a reduction of environmental
54
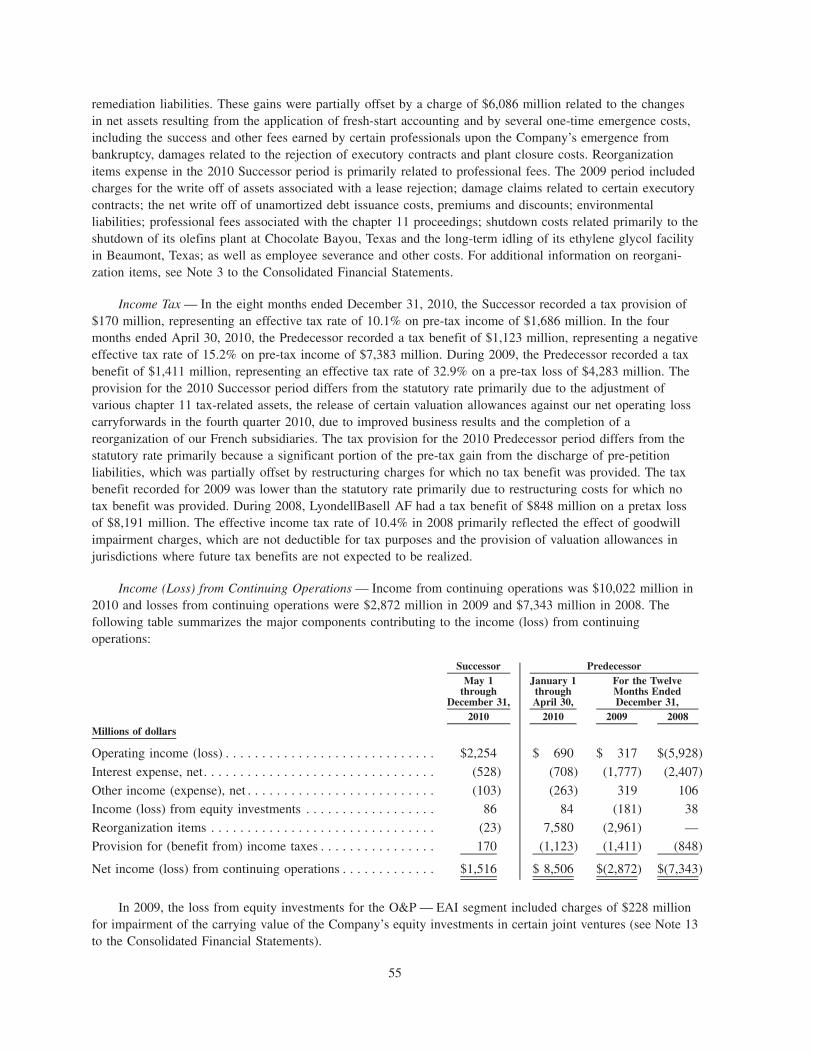
remediation liabilities. These gains were partially offset by a charge of $6,086 million related to the changesin net assets resulting from the application of fresh-start accounting and by several one-time emergence costs,including the success and other fees earned by certain professionals upon the Company’s emergence frombankruptcy, damages related to the rejection of executory contracts and plant closure costs. Reorganizationitems expense in the 2010 Successor period is primarily related to professional fees. The 2009 period includedcharges for the write off of assets associated with a lease rejection; damage claims related to certain executorycontracts; the net write off of unamortized debt issuance costs, premiums and discounts; environmentalliabilities; professional fees associated with the chapter 11 proceedings; shutdown costs related primarily to theshutdown of its olefins plant at Chocolate Bayou, Texas and the long-term idling of its ethylene glycol facilityin Beaumont, Texas; as well as employee severance and other costs. For additional information on reorgani-zation items, see Note 3 to the Consolidated Financial Statements.
Income Tax — In the eight months ended December 31, 2010, the Successor recorded a tax provision of$170 million, representing an effective tax rate of 10.1% on pre-tax income of $1,686 million. In the fourmonths ended April 30, 2010, the Predecessor recorded a tax benefit of $1,123 million, representing a negativeeffective tax rate of 15.2% on pre-tax income of $7,383 million. During 2009, the Predecessor recorded a taxbenefit of $1,411 million, representing an effective tax rate of 32.9% on a pre-tax loss of $4,283 million. Theprovision for the 2010 Successor period differs from the statutory rate primarily due to the adjustment ofvarious chapter 11 tax-related assets, the release of certain valuation allowances against our net operating losscarryforwards in the fourth quarter 2010, due to improved business results and the completion of areorganization of our French subsidiaries. The tax provision for the 2010 Predecessor period differs from thestatutory rate primarily because a significant portion of the pre-tax gain from the discharge of pre-petitionliabilities, which was partially offset by restructuring charges for which no tax benefit was provided. The taxbenefit recorded for 2009 was lower than the statutory rate primarily due to restructuring costs for which notax benefit was provided. During 2008, LyondellBasell AF had a tax benefit of $848 million on a pretax lossof $8,191 million. The effective income tax rate of 10.4% in 2008 primarily reflected the effect of goodwillimpairment charges, which are not deductible for tax purposes and the provision of valuation allowances injurisdictions where future tax benefits are not expected to be realized.
Income (Loss) from Continuing Operations — Income from continuing operations was $10,022 million in2010 and losses from continuing operations were $2,872 million in 2009 and $7,343 million in 2008. Thefollowing table summarizes the major components contributing to the income (loss) from continuingoperations:
2010 2010 2009 2008
For the TwelveMonths EndedDecember 31,
May 1through
December 31,
January 1throughApril 30,
Successor Predecessor
Millions of dollars
Operating income (loss) . . . . . . . . . . . . . . . . . . . . . . . . . . . . . $2,254 $ 690 $ 317 $(5,928)
Interest expense, net. . . . . . . . . . . . . . . . . . . . . . . . . . . . . . . . (528) (708) (1,777) (2,407)
Other income (expense), net . . . . . . . . . . . . . . . . . . . . . . . . . . (103) (263) 319 106Income (loss) from equity investments . . . . . . . . . . . . . . . . . . 86 84 (181) 38
Reorganization items . . . . . . . . . . . . . . . . . . . . . . . . . . . . . . . (23) 7,580 (2,961) —
Provision for (benefit from) income taxes . . . . . . . . . . . . . . . . 170 (1,123) (1,411) (848)
Net income (loss) from continuing operations . . . . . . . . . . . . . $1,516 $ 8,506 $(2,872) $(7,343)
In 2009, the loss from equity investments for the O&P — EAI segment included charges of $228 millionfor impairment of the carrying value of the Company’s equity investments in certain joint ventures (see Note 13to the Consolidated Financial Statements).
55

The table below summarizes some of the items of special note with regards to our income (loss) fromcontinuing operations for the periods shown:
May 1through
December 31,2010
January 1throughApril 30,
2010 2009 2008
For the TwelveMonths
Ended December 31,
Successor Predecessor
Millions of dollars
Pretax charges (benefits):
Impairments . . . . . . . . . . . . . . . . . . . . . . . . . . . . . . . . . . . . $ 28 $ 9 $ 245 $5,207
Reorganization items . . . . . . . . . . . . . . . . . . . . . . . . . . . . . . 23 (7,580) 2,961 —
Warrants — fair value adjustment . . . . . . . . . . . . . . . . . . . . . 114 — — —
Charge related to dispute over environmental liability . . . . . . 64 — — —
Charges and premiums related to repayment of debt . . . . . . . 26 — — —
Inventory valuation adjustments . . . . . . . . . . . . . . . . . . . . . . 42 — 127 1,256
Interest rate swap termination — Structured FinancingTransaction . . . . . . . . . . . . . . . . . . . . . . . . . . . . . . . . . . . — — — 55
Hurricane costs . . . . . . . . . . . . . . . . . . . . . . . . . . . . . . . . . . — — 5 55
Gain related to insurance settlements . . . . . . . . . . . . . . . . . . — — (120) (79)
Provisions for uncollectible accounts receivable . . . . . . . . . . 12 7 18 47
Total pretax income effect . . . . . . . . . . . . . . . . . . . . . . . . . . . . 309 (7,564) 3,236 6,541
Tax effect of above items. . . . . . . . . . . . . . . . . . . . . . . . . . . (48) (1,068) (1,133) (546)
Total . . . . . . . . . . . . . . . . . . . . . . . . . . . . . . . . . . . . . . . . . . . . $261 $(8,632) $ 2,103 $5,995
Impairments in 2009 include an adjustment related to prior periods which increased income fromoperations and net income for the three-month period ended December 31, 2009, by $65 million. Theadjustment related to an overstatement of goodwill impairment in 2008.
Income (Loss) from Discontinued Operations, Net of Tax — The Company had income from discontinuedoperations of $64 million in the 2010 Successor period related to the sale of its Flavor and Fragrancechemicals business. The Company had a loss from discontinued operations in the 2010 Predecessor period of$2 million and income from discontinued operations of $1 million and $15 million, respectively, in 2009 and2008 related to the sale of a toluene di-isocyanate business in September 2008.
Fourth Quarter 2010 versus Third Quarter 2010 — Net income was $766 million in the fourth quarter2010 compared to $467 million in the third quarter 2010. The $299 million increase in net income wasprimarily attributable to the release of non-U.S. valuation allowances against net deferred tax assets in thefourth quarter 2010, a net benefit related to reorganization items attributable to events that occurred during thefourth quarter 2010 and the gain related to the sale of our Flavor and Fragrance chemicals business inDecember 2010, partially offset by lower operating results attributable to our O&P-EAI and Technologysegments discussed below. The release of the non-U.S. valuation allowances was due to improved businessresults and the completion of a reorganization of our French subsidiaries.
Segment Analysis
Our operations are primarily in five reportable segments: O&P — Americas; O&P — EAI; I&D; Refiningand Oxyfuels; and Technology. These operations comprise substantially the same businesses owned andoperated by LyondellBasell AF prior to the Company’s emergence from bankruptcy. However, for accountingpurposes, the operations of LyondellBasell AF are deemed to have ceased on April 30, 2010 andLyondellBasell N.V. is deemed to have begun operations on that date. The results of operations for theSuccessor are not comparable to the Predecessor due to adjustments made under fresh-start accounting as
56

described in “Emergence from Chapter 11 Proceedings.” The impact of these items is addressed in thediscussion of each segment’s results below.
The following tables reflect selected financial information for our reportable segments. Operating income(loss) for segment reporting is on a LIFO basis for the Successor and on a current cost basis for thePredecessor.
May 1through
December 31,2010
January 1throughApril 30,
2010 2009 2008
For the Twelve MonthsEnded December 31,
Successor Predecessor
Millions of dollars
Sales and other operating revenues:O&P — Americas segment . . . . . . . . . . . . . . . . . . . $ 8,406 $ 4,183 $ 8,614 $16,412O&P — EAI segment . . . . . . . . . . . . . . . . . . . . . . . 8,729 4,105 9,401 13,489I&D segment . . . . . . . . . . . . . . . . . . . . . . . . . . . . . 3,754 1,820 3,778 6,218Refining and Oxyfuels segment . . . . . . . . . . . . . . . 10,321 4,748 12,078 18,362Technology segment . . . . . . . . . . . . . . . . . . . . . . . . 365 145 543 583Other, including intersegment eliminations . . . . . . . (3,891) (1,534) (3,586) (4,358)
Total . . . . . . . . . . . . . . . . . . . . . . . . . . . . . . . . . . . $27,684 $13,467 $30,828 $50,706
Operating income (loss):O&P — Americas segment . . . . . . . . . . . . . . . . . . . $ 1,043 $ 320 $ 169 $ (1,355)O&P — EAI segment . . . . . . . . . . . . . . . . . . . . . . . 411 115 (2) 220I&D segment . . . . . . . . . . . . . . . . . . . . . . . . . . . . . 512 157 250 (1,915)Refining and Oxyfuels segment . . . . . . . . . . . . . . . 241 (99) (357) (2,378)Technology segment . . . . . . . . . . . . . . . . . . . . . . . . 69 39 210 202Other, including intersegment eliminations . . . . . . . (22) (41) 18 (134)Current cost adjustment . . . . . . . . . . . . . . . . . . . . . — 199 29 (568)
Total . . . . . . . . . . . . . . . . . . . . . . . . . . . . . . . . . . . $ 2,254 $ 690 $ 317 $ (5,928)
Income (loss) from equity investments:O&P — Americas segment . . . . . . . . . . . . . . . . . . . $ 16 $ 5 $ 7 $ 6O&P — EAI segment . . . . . . . . . . . . . . . . . . . . . . . 68 80 (172) 34I&D segment . . . . . . . . . . . . . . . . . . . . . . . . . . . . . 2 (1) (16) (2)
Total . . . . . . . . . . . . . . . . . . . . . . . . . . . . . . . . . . . $ 86 $ 84 $ (181) $ 38
Olefins and Polyolefins — Americas Segment
2010 Versus 2009 — Market demand in the U.S. for ethylene was higher in 2010 compared to 2009. As aresult of higher industry operating rates compared to rates experienced during 2009, ethylene margins werehigher as benchmark sales prices increased significantly more than the benchmark weighted average costs ofethylene production. Sales of polyolefins in 2010 were comparable to 2009 although producers favoreddomestic market sales over exports due to improved domestic demand.
The O&P — Americas segment operating results for 2010 primarily reflected strong demand and highermargins for ethylene due to improved economic conditions in 2010 and unplanned operating issues andturnarounds at competitor facilities in the first half of the year. Polypropylene results were also higher in 2010compared to 2009 as domestic economic conditions improved. Demand for polyethylene in 2010 wascomparable to 2009. Operating results for the Successor period reflected the impacts of the Company’sreorganization and fresh-start accounting, including a non-cash charge to adjust inventory to market value andthe benefit of lower depreciation and amortization expense related to the write-down of segment assets (see
57

“Results of Operations — Cost of Sales”). The net effect of these items contributed to the significantlyimproved results of operations in the 2010 Successor periods compared to the twelve months of 2009.
2009 Versus 2008 — While improving during the course of 2009, ethylene market demand in theU.S. remained weak, resulting in lower industry operating rates compared to rates in the 90% to 95% rangeduring the first eight months of 2008. Ethylene margins contracted as benchmark sales prices decreased morethan the benchmark weighted average cost of ethylene production. Polyolefins markets were weaker in 2009compared to 2008 with the notable exception of U.S. polyethylene markets, which benefited from strongexport demand during 2009.
The O&P — Americas segment operating results for 2009 primarily reflected the strong polyethylene(“PE”) export markets in 2009, lower olefins product margins and lower fixed costs. As a result of weakethylene demand during late 2008 and the first half of 2009, LyondellBasell AF idled and subsequently shutdown the Chocolate Bayou olefins plant, near Alvin, Texas. LyondellBasell AF also idled and subsequentlyrestarted the La Porte, Texas olefins plant in January 2009. Strong PE export markets in 2009, benefited PEproduct margins and sales volumes. However, other polyolefins product markets were weaker and resulted innet lower sales volumes compared to 2008. As a result of LyondellBasell AF’s cost reduction program, fixedcosts were significantly lower in 2009 compared to 2008.
In the third quarter 2008, operating results were negatively impacted by lost production at certainU.S. Gulf Coast plants due to the effects of a hurricane.
Ethylene Raw Materials — Benchmark crude oil and natural gas prices generally have been indicators ofthe level and direction of the movement of raw material and energy costs for ethylene and its co-products inthe O&P — Americas segment. Ethylene and its co-products are produced from two major raw materialgroups:
• crude oil-based liquids (“liquids” or “heavy liquids”), including naphtha, condensates, and gas oils, theprices of which are generally related to crude oil prices; and
• NGLs, principally ethane and propane, the prices of which are generally affected by natural gas prices.
Although the prices of these raw materials are generally related to crude oil and natural gas prices, duringspecific periods the relationships among these materials and benchmarks may vary significantly.
In the U.S., we have a significant capability to shift the ratio of raw materials used in the production ofethylene and its co-products to take advantage of the relative costs of heavy liquids and NGLs.
In 2010, especially in the latter part of the year, production economics for the industry favored NGLs. Asa result, we increased our use of NGLs and reduced liquids consumption at our U.S. plants. During 2010,approximately 70% of our U.S. ethylene production was produced from NGLs.
The following table shows the average U.S. benchmark prices for crude oil and natural gas for theapplicable periods, as well as benchmark U.S. sales prices for ethylene and propylene, which we produce andsell or consume internally, and certain polyethylene and polypropylene products. The benchmark weighted
58

average cost of ethylene production, which is reduced by co-product revenues, is based on CMAI’s estimatedratio of heavy liquid raw materials and NGLs used in U.S. ethylene production.
2010 2009 Change 2009 2008 Change
For the TwelveMonths EndedDecember 31,
For the TwelveMonths EndedDecember 31,
Average Benchmark Price and Percent ChangeVersus Prior Year Period Average
Crude oil — dollars per Barrel . . . . . . . . . . . . . . . . . . . 79.58 62.09 28% 62.09 99.75 (38)%
Natural gas — dollars per million BTUs . . . . . . . . . . . . 4.48 3.78 19% 3.78 8.86 (57)%
United States — cents per pound
Weighted average cost of ethylene production . . . . . . . 30.0 26.2 14% 26.2 45.4 (42)%
United States — cents per pound
Ethylene . . . . . . . . . . . . . . . . . . . . . . . . . . . . . . . . . 45.9 33.9 35% 33.9 58.5 (42)%
Polyethylene (high density) . . . . . . . . . . . . . . . . . . . 82.2 66.5 24% 66.5 86.4 (23)%
Propylene — polymer grade . . . . . . . . . . . . . . . . . . . 59.6 37.9 57% 37.9 60.0 (37)%
Polypropylene . . . . . . . . . . . . . . . . . . . . . . . . . . . . . 86.0 64.4 34% 64.4 87.6 (26)%
The following table sets forth the O&P — Americas segment’s sales and other operating revenues,operating income, income from equity investments and selected product sales volumes.
May 1through
December 31,2010
January 1throughApril 30,
2010 2009 2008
For the TwelveMonths EndedDecember 31,
Successor Predecessor
Millions of dollars
Sales and other operating revenues . . . . . . . . . . . . . . . . . . . . . $8,406 $4,183 $8,614 $16,412
Operating income (loss) . . . . . . . . . . . . . . . . . . . . . . . . . . . . . 1,043 320 169 (1,355)
Income from equity investments . . . . . . . . . . . . . . . . . . . . . . . 16 5 7 6
Production Volumes, in millions of poundsEthylene. . . . . . . . . . . . . . . . . . . . . . . . . . . . . . . . . . . . . . . . . 5,585 2,768 8,129 7,990
Propylene . . . . . . . . . . . . . . . . . . . . . . . . . . . . . . . . . . . . . . . . 1,998 1,019 2,913 3,975
Sales Volumes, in millions of poundsPolypropylene . . . . . . . . . . . . . . . . . . . . . . . . . . . . . . . . . . . . 1,735 836 2,416 2,928
Polyethylene . . . . . . . . . . . . . . . . . . . . . . . . . . . . . . . . . . . . . 3,704 1,765 5,472 5,256
Revenues — Revenues in 2010 increased by $3,975 million, or 46%, compared to 2009 primarily due tosignificantly higher overall average sales prices and higher ethylene and polypropylene sales volumes. Theincreases in average sales prices and sales volumes in 2010 periods reflected an increase in demand resultingfrom improved economic conditions and the effect of constrained supply due to operating issues andturnarounds at competitor plants. The decrease in 2009 revenue of $7,798 million, or 48%, compared to 2008,reflected the effect of lower average product sales prices and net lower sale volumes. Net lower 2009 salesvolumes reflected the effect of lower sales volumes for polypropylene and ethylene and co-products, partlyoffset by higher sales volumes for polyethylene, which benefited from the strong U.S. export markets.
Operating Income (Loss) — Operating results for the O&P — Americas segment reflected an increase of$1,194 million in 2010 compared to 2009 and an increase of $1,524 million in 2009 compared to 2008. Theunderlying operations of the O&P — Americas segment in 2010 increased compared to 2009, primarily due tohigher product margins for ethylene as higher average sales prices for ethylene and its co-products more thanoffset higher raw material costs. In addition, the effect of higher polypropylene sales volumes during 2010partially offset the effect of higher utility, planned maintenance and other costs. Operating results for 2010were impacted by a non-cash charge of $34 million to adjust inventory to market values. Lower depreciation
59

and amortization expense of $204 million in 2010 compared to 2009 was primarily the result of our write-down of Property, plant, and equipment associated with the revaluation of our assets in fresh-start accounting.
Compared with 2008, the increase in the 2009 O&P — Americas operating results reflected the benefit oflower fixed costs, resulting from LyondellBasell AF’s cost reduction program, partially offset by net lowerproduct margins and the effect of net lower sales volumes. Operating results for 2008 were negatively affectedby the $120 million estimated impact of lost production due to Hurricane Ike, and related costs of $39 million,including a $7 million pretax charge for impairment of the carrying value of assets. Operating results for 2008also included inventory valuation adjustments of $619 million and goodwill impairment charges of$624 million.
Fourth Quarter 2010 versus Third Quarter 2010 — The O&P — Americas segment had operating incomeof $446 million in the fourth quarter 2010 compared to $448 million in the third quarter 2010. Operatingresults in the fourth quarter 2010 included a non-cash benefit of $163 million related to inventory market pricerecovery in the fourth quarter 2010, which partially offsets the charges recorded in the second and thirdquarters of 2010 of $171 million and $26 million, respectively, to adjust inventory to market value after theEmergence Date. Excluding the non-cash inventory adjustment, the decline in fourth quarter 2010 operatingresults was primarily due to a combination of lower product margins for polyethylene and polypropylene,lower sales volumes, and higher fixed costs. Polyethylene and polypropylene product margins declined as theincreases in feedstock prices outpaced the increases in average sales price. Product margins for ethylene werecomparable in the third and fourth quarters of 2010. The decrease in sales volumes was primarily related tothe effects of seasonality as well as planned and unplanned outages during the fourth quarter 2010. Fixed costswere higher in the fourth quarter 2010, compared to the third quarter 2010, primarily due to highermaintenance costs associated with the planned and unplanned outages and bonus expense.
Olefins and Polyolefins — Europe, Asia and International Segment
2010 Versus 2009 — Ethylene market demand in Europe was generally higher in 2010 compared to 2009as planned and unplanned outages resulted in reduced supply and higher operating results in the second andthird quarters of 2010. Ethylene margins expanded as benchmark average sales prices increased more than thebenchmark weighted average cost of ethylene production. Global polyolefin markets also improved in 2010compared to 2009. The improvement in polypropylene and LDPE reflected tight supply conditions amidplanned and unplanned industry outages throughout 2010.
The O&P — EAI segment operating results for the 2010 periods reflected higher product margins forboth olefins and polyolefins. Higher sales volumes for PP Compounds and polypropylene in 2010 compared to2009, reflect higher demand, primarily from the automotive industry. Operating results for the Successorperiod also reflected the impacts of fresh-start accounting, including the benefit of lower depreciation andamortization expense related to the write-down of segment assets (see “Results of Operations-Cost of Sales”).
2009 Versus 2008 — While improving during the course of 2009, ethylene market demand in Europeremained weak, resulting in lower industry operating rates in the range of 75% to 80% compared to rates inthe 85% to 90% range prior to the fourth quarter downturn in 2008. Ethylene margins contracted as benchmarksales prices decreased more than the benchmark weighted average cost of ethylene production. Globalpolyolefin markets were considerably weaker in 2009 compared to 2008. The general weakness in globalpolyolefin markets resulted in lower sales volumes, due to weaker demand, particularly in polypropylene, andlower product margins, as selling prices decreased significantly.
The O&P — EAI segment operating results for 2009 reflected the negative effects of significantly lowerproduct margins compared to 2008 for olefins products, while polyolefin product results for 2009 reflectedgenerally weaker global polyolefin markets, which resulted in lower sales volumes across all polyolefinsproduct lines and net lower product margins compared to 2008. As a result of LyondellBasell AF’s costreduction program, fixed costs were significantly lower in 2009, partly offsetting the negative effects of theweak markets.
60

Ethylene Raw Materials — In Europe, heavy liquids are the primary raw materials for our ethyleneproduction.
The following table shows the average West Europe benchmark prices for Brent crude oil, a heavy liquidraw material, for the applicable periods, as well as benchmark West Europe prices for ethylene and propylene,which we produce and consume internally or purchase from unrelated suppliers, and certain polyethylene andpolypropylene products.
2010 2009 Change 2009 2008 Change
For the Year EndedDecember 31,
For the Year EndedDecember 31,
Average Benchmark Price and Percent ChangeVersus Prior Year Period Average
Brent crude oil — dollars per barrel . . . . . . . . . . . 80.80 68.30 18% 68.30 101.83 (33)%Western Europe — A0.01 per pound
Weighted average cost of ethylene production . . . . 29.5 23.8 24% 23.8 28.2 (16)%
Ethylene . . . . . . . . . . . . . . . . . . . . . . . . . . . . . . 43.2 33.4 29% 33.4 50.0 (33)%
Polyethylene (high density) . . . . . . . . . . . . . . . . 52.5 42.9 22% 42.9 58.5 (27)%
Propylene . . . . . . . . . . . . . . . . . . . . . . . . . . . . . 42.4 27.7 53% 27.7 43.6 (36)%
Polypropylene (homopolymer) . . . . . . . . . . . . . 57.7 39.9 45% 39.9 54.2 (26)%
Average Exchange Rate — $US per A . . . . . . . . . . 1.3205 1.3972 (5)% 1.3972 1.4739 (5)%
The following table sets forth the O&P — EAI segment’s sales and other operating revenues, operatingincome, income from equity investments and selected product sales volumes.
May 1through
December 31,2010
January 1throughApril 30,
2010 2009 2008
For the TwelveMonths EndedDecember 31,
Successor Predecessor
Millions of dollars
Sales and other operating revenues . . . . . . . . . . . . . . $8,729 $4,105 $9,401 $13,489
Operating income (loss) . . . . . . . . . . . . . . . . . . . . . . 411 115 (2) 220
Income (loss) from equity investments . . . . . . . . . . . 68 80 (172) 34
Production Volumes, in millions of poundsEthylene . . . . . . . . . . . . . . . . . . . . . . . . . . . . . . . . . 2,502 1,108 3,503 3,615
Propylene . . . . . . . . . . . . . . . . . . . . . . . . . . . . . . . . 1,572 661 2,149 2,135
Sales Volumes, in millions of poundsPolypropylene . . . . . . . . . . . . . . . . . . . . . . . . . . . . . 4,906 2,117 6,156 7,023
Polyethylene . . . . . . . . . . . . . . . . . . . . . . . . . . . . . . 3,402 1,658 4,815 4,821
Revenues — Revenues for 2010 increased $3,433 million, or 37%, compared to revenues for 2009, andrevenues for 2009 decreased $4,088 million, or 30%, compared to revenues for 2008. The increase in 2010revenues, compared to 2009, was primarily due to the effect of higher average product sales prices across mostproducts, particularly ethylene, butadiene, polyethylene and polypropylene, as well as the effect of higher salesvolumes, particularly polypropylene, including Catalloy and PP Compounds.
The decrease in 2009 revenues compared to 2008 reflected the effect of lower product sales prices and netlower sale volumes as well as the unfavorable effects of changes in currency exchange rates as the U.S. dollarwas stronger in relation to the Euro in 2009 compared to 2008. Lower 2009 polypropylene and ethylene co-product sales volumes were partly offset by higher sales volumes for polyethylene and ethylene products.
Operating Income (Loss) — Operating results for 2010 increased $528 million compared to 2009 anddecreased $222 million for 2009 compared to 2008. The underlying operating results of our O&P — EAIbusiness segment were higher in 2010 compared to 2009, primarily as a result of higher product margins forethylene, butadiene, polypropylene and polyethylene, mainly LDPE. Fixed costs were also higher in 2010
61

compared to 2009, reflecting costs related to our maintenance program and the start up of the polymers plantin Munchsmunster, Germany. Operating results for 2010 were negatively impacted by a $35 million chargeassociated with a change in estimate related to a dispute that arose during the third quarter 2010 over anenvironmental indemnity. Lower depreciation and amortization expense of $62 million in 2010 compared to2009 was primarily a result of our write-down of Property, plant and equipment associated with the revaluationof our assets in fresh-start accounting.
In 2009, the underlying operations of the O&P — EAI segment reflected significantly lower net productmargins and lower sales volumes, primarily in Europe, offset by the benefit of lower fixed costs compared to2008. The lower fixed costs were primarily a result of LyondellBasell AF’s cost reduction program.
Income (loss) from equity investments — Income from equity investments for the O&P — EAI segmentincreased $320 million in 2010 compared to 2009 and decreased $206 million from 2008 to 2009. We receiveddividends of $40 million from our equity investments during 2010. The decrease from 2008 to 2009 wasprimarily due to recognition of a $228 million after-tax impairment of the carrying value of LyondellBasellAF’s investment in certain joint ventures during 2009 as a result of weak current and projected marketconditions. This loss was based on estimates of fair values developed in connection with LyondellBasell AF’sestimation of its reorganization enterprise value.
Fourth Quarter 2010 versus Third Quarter 2010 — The O&P — EAI segment had operating income of$66 million in the fourth quarter 2010 compared to $231 million in the third quarter 2010. Underlyingoperating results reflected a decrease in the fourth quarter 2010, compared to the third quarter 2010, primarilydue to lower product margins, particularly ethylene, and to a lesser extent, higher fixed costs and the effect oflower sales volumes. The lower product margins reflected higher raw material costs while the higher fixedcosts resulted from higher costs related to our maintenance program. The decrease in product margins wasamplified by the unfavorable effects of changes in currency exchange rates as the Euro weakened against theU.S. dollar in the fourth quarter compared to the third quarter 2010. Operating results in the fourth quarter2010 included an $10 million non-cash credit related to inventory market price recovery in the fourth quarter2010, which offsets the $5 million inventory adjustments recorded in each of the second and third quarters of2010 to adjust inventory to market value after the Emergence Date. Operating results for the third quarter2010 also included a $35 million charge associated with a change in estimate related to a dispute that aroseduring that period over an environmental liability.
Intermediates and Derivatives Segment
2010 Versus 2009 — Market demand for PO and PO derivatives improved in 2010 as the recovery of theautomotive industry from a particularly weak 2009 and planned and unplanned industry outages during 2010resulted in tightened supply. Demand in the Intermediates market also returned to at or above pre-recession levels.
The I&D segment’s operating results for 2010 primarily reflected higher sales volumes across most productscompared to 2009. The propylene oxide business benefited from planned and unplanned competitor downtime inthe first half of 2010 as the market for durable goods end-uses strengthened. Operating results for the Successorperiods reflected the impacts of fresh-start accounting, including a non-cash charge, in the second quarter 2010,to adjust inventory to market value that was offset by the benefit of lower depreciation and amortization expenserelated to the write-down of segment assets (see “Results of Operations — Cost of Sales”).
2009 Versus 2008 — While improving during the course of 2009, markets for PO and PO derivatives,ethylene derivatives and other intermediate chemical products generally experienced weaker demand in 2009compared to 2008 particularly in durable goods markets.
The I&D segment operating results in 2009 primarily reflected the negative effects of lower sales volumescompared to 2008. As a result of LyondellBasell AF’s cost reduction program, fixed costs were significantlylower in 2009, partly offsetting the negative effects of the weak markets. Product margins were relativelystable. In response to lower PO demand, LyondellBasell AF temporarily idled two PO facilities in late 2008.In mid-May 2009, LyondellBasell AF restarted one of the idled PO facilities, which is located in Europe and
62
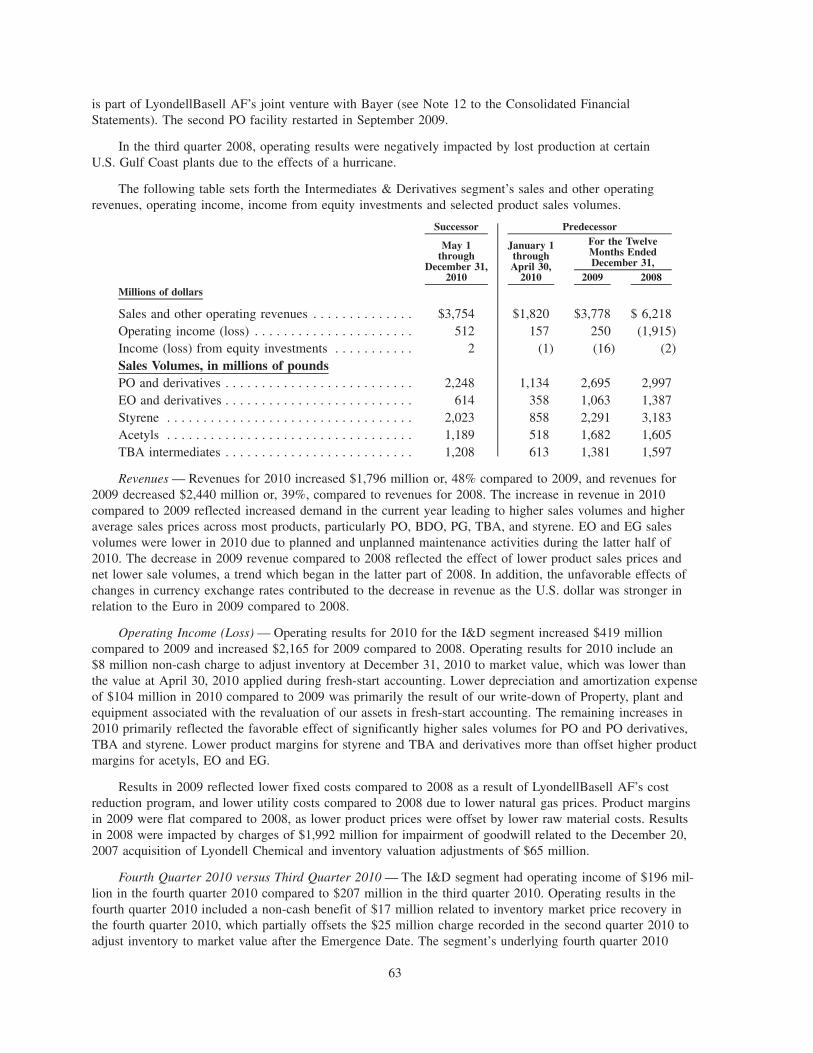
is part of LyondellBasell AF’s joint venture with Bayer (see Note 12 to the Consolidated FinancialStatements). The second PO facility restarted in September 2009.
In the third quarter 2008, operating results were negatively impacted by lost production at certainU.S. Gulf Coast plants due to the effects of a hurricane.
The following table sets forth the Intermediates & Derivatives segment’s sales and other operatingrevenues, operating income, income from equity investments and selected product sales volumes.
May 1through
December 31,2010
January 1throughApril 30,
2010 2009 2008
For the TwelveMonths EndedDecember 31,
Successor Predecessor
Millions of dollars
Sales and other operating revenues . . . . . . . . . . . . . . $3,754 $1,820 $3,778 $ 6,218Operating income (loss) . . . . . . . . . . . . . . . . . . . . . . 512 157 250 (1,915)Income (loss) from equity investments . . . . . . . . . . . 2 (1) (16) (2)Sales Volumes, in millions of poundsPO and derivatives . . . . . . . . . . . . . . . . . . . . . . . . . . 2,248 1,134 2,695 2,997EO and derivatives . . . . . . . . . . . . . . . . . . . . . . . . . . 614 358 1,063 1,387Styrene . . . . . . . . . . . . . . . . . . . . . . . . . . . . . . . . . . 2,023 858 2,291 3,183Acetyls . . . . . . . . . . . . . . . . . . . . . . . . . . . . . . . . . . 1,189 518 1,682 1,605TBA intermediates . . . . . . . . . . . . . . . . . . . . . . . . . . 1,208 613 1,381 1,597
Revenues — Revenues for 2010 increased $1,796 million or, 48% compared to 2009, and revenues for2009 decreased $2,440 million or, 39%, compared to revenues for 2008. The increase in revenue in 2010compared to 2009 reflected increased demand in the current year leading to higher sales volumes and higheraverage sales prices across most products, particularly PO, BDO, PG, TBA, and styrene. EO and EG salesvolumes were lower in 2010 due to planned and unplanned maintenance activities during the latter half of2010. The decrease in 2009 revenue compared to 2008 reflected the effect of lower product sales prices andnet lower sale volumes, a trend which began in the latter part of 2008. In addition, the unfavorable effects ofchanges in currency exchange rates contributed to the decrease in revenue as the U.S. dollar was stronger inrelation to the Euro in 2009 compared to 2008.
Operating Income (Loss) — Operating results for 2010 for the I&D segment increased $419 millioncompared to 2009 and increased $2,165 for 2009 compared to 2008. Operating results for 2010 include an$8 million non-cash charge to adjust inventory at December 31, 2010 to market value, which was lower thanthe value at April 30, 2010 applied during fresh-start accounting. Lower depreciation and amortization expenseof $104 million in 2010 compared to 2009 was primarily the result of our write-down of Property, plant andequipment associated with the revaluation of our assets in fresh-start accounting. The remaining increases in2010 primarily reflected the favorable effect of significantly higher sales volumes for PO and PO derivatives,TBA and styrene. Lower product margins for styrene and TBA and derivatives more than offset higher productmargins for acetyls, EO and EG.
Results in 2009 reflected lower fixed costs compared to 2008 as a result of LyondellBasell AF’s costreduction program, and lower utility costs compared to 2008 due to lower natural gas prices. Product marginsin 2009 were flat compared to 2008, as lower product prices were offset by lower raw material costs. Resultsin 2008 were impacted by charges of $1,992 million for impairment of goodwill related to the December 20,2007 acquisition of Lyondell Chemical and inventory valuation adjustments of $65 million.
Fourth Quarter 2010 versus Third Quarter 2010 — The I&D segment had operating income of $196 mil-lion in the fourth quarter 2010 compared to $207 million in the third quarter 2010. Operating results in thefourth quarter 2010 included a non-cash benefit of $17 million related to inventory market price recovery inthe fourth quarter 2010, which partially offsets the $25 million charge recorded in the second quarter 2010 toadjust inventory to market value after the Emergence Date. The segment’s underlying fourth quarter 2010
63

operating results reflect slightly lower product margins higher fixed costs. The lower product margins primarilyreflected higher raw material and utility costs.
Refining and Oxyfuels Segment
2010 Versus 2009 — In 2010 compared to 2009, benchmark heavy crude refining margins averagedhigher, primarily due to an increase in the differential between the cost of heavy and light crude oil.
Segment operating results in 2010 compared to 2009 primarily reflected higher benchmark refiningmargins and lower crude processing rates at the Houston refinery. Crude processing rates for the Houstonrefinery reflected the effects of a crude unit fire, sulfur recovery constraints and unplanned outages, while theBerre refinery crude processing rates were negatively affected by national strikes in France during the fourthquarter 2010. Oxyfuels results were lower in 2010. Operating results for the Successor period reflected theimpacts of fresh-start accounting, including non-cash charges in the second and third quarters of 2010 to adjustinventory to market value, all of which was recovered in the fourth quarter 2010, and the benefit of lowerdepreciation and amortization expense related to the write-down of segment assets (see “Results ofOperations — Cost of Sales”).
2009 Versus 2008 — Benchmark refining margins for 2009 were lower compared to the same period in2008, generally reflecting the weaker global economy and consequent weaker demand for gasoline anddistillate products, such as diesel and heating oil. The weaker demand resulted in lower prices for light crudeoil, while OPEC-mandated production cuts resulted in lower supplies of heavy crude oil and lower pricediscounts relative to light crude oil. Both factors compressed the price differential between light and heavycrude oil. Benchmark margins for oxyfuels in 2009 were comparable to 2008.
Refining and Oxyfuels segment operating results in 2009 primarily reflected the effects of significantlylower U.S. refining margins compared to the same period in 2008. The operating results of the Berre refinery,which was acquired on April 1, 2008, reflected the weak distillate markets in 2009. Operating results in 2009benefited from higher margins for oxygenated gasoline blending components and lower utility and fixed costs,but were negatively affected by outages of some of the Houston refinery’s sulfur recovery units during thesecond quarter 2009 and of a crude unit during the fourth quarter 2009. As a result of LyondellBasell AF’scost reduction program, fixed costs were significantly lower in 2009 compared to 2008.
In 2008, operating results were negatively impacted by lost production at the Houston refinery due to theeffects of a hurricane and a scheduled maintenance turnaround of one of the refinery’s crude trains and cokerunits during the third quarter 2008 that was delayed by an incident involving a contractor’s crane and anunplanned second quarter 2008 outage of a FCC unit.
The following table sets forth the Refining and Oxyfuels segment’s sales and other operating revenues,operating income and sales volumes for certain gasoline blending components for the applicable periods. Inaddition, the table shows market refining margins for the U.S. and Europe and MTBE margins in Northwest
64
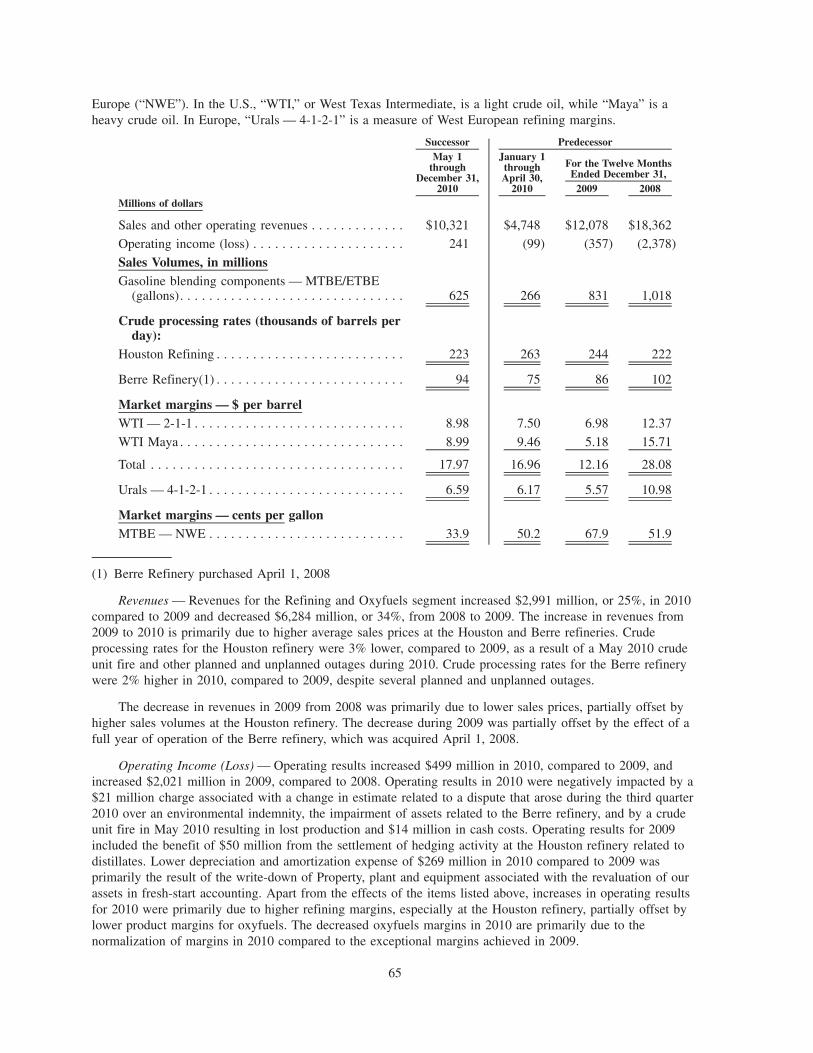
Europe (“NWE”). In the U.S., “WTI,” or West Texas Intermediate, is a light crude oil, while “Maya” is aheavy crude oil. In Europe, “Urals — 4-1-2-1” is a measure of West European refining margins.
May 1through
December 31,2010
January 1throughApril 30,
2010 2009 2008
For the Twelve MonthsEnded December 31,
Successor Predecessor
Millions of dollars
Sales and other operating revenues . . . . . . . . . . . . . $10,321 $4,748 $12,078 $18,362
Operating income (loss) . . . . . . . . . . . . . . . . . . . . . 241 (99) (357) (2,378)
Sales Volumes, in millionsGasoline blending components — MTBE/ETBE
(gallons). . . . . . . . . . . . . . . . . . . . . . . . . . . . . . . 625 266 831 1,018
Crude processing rates (thousands of barrels perday):
Houston Refining . . . . . . . . . . . . . . . . . . . . . . . . . . 223 263 244 222
Berre Refinery(1) . . . . . . . . . . . . . . . . . . . . . . . . . . 94 75 86 102
Market margins — $ per barrelWTI — 2-1-1 . . . . . . . . . . . . . . . . . . . . . . . . . . . . . 8.98 7.50 6.98 12.37
WTI Maya . . . . . . . . . . . . . . . . . . . . . . . . . . . . . . . 8.99 9.46 5.18 15.71
Total . . . . . . . . . . . . . . . . . . . . . . . . . . . . . . . . . . . 17.97 16.96 12.16 28.08
Urals — 4-1-2-1 . . . . . . . . . . . . . . . . . . . . . . . . . . . 6.59 6.17 5.57 10.98
Market margins — cents per gallonMTBE — NWE . . . . . . . . . . . . . . . . . . . . . . . . . . . 33.9 50.2 67.9 51.9
(1) Berre Refinery purchased April 1, 2008
Revenues — Revenues for the Refining and Oxyfuels segment increased $2,991 million, or 25%, in 2010compared to 2009 and decreased $6,284 million, or 34%, from 2008 to 2009. The increase in revenues from2009 to 2010 is primarily due to higher average sales prices at the Houston and Berre refineries. Crudeprocessing rates for the Houston refinery were 3% lower, compared to 2009, as a result of a May 2010 crudeunit fire and other planned and unplanned outages during 2010. Crude processing rates for the Berre refinerywere 2% higher in 2010, compared to 2009, despite several planned and unplanned outages.
The decrease in revenues in 2009 from 2008 was primarily due to lower sales prices, partially offset byhigher sales volumes at the Houston refinery. The decrease during 2009 was partially offset by the effect of afull year of operation of the Berre refinery, which was acquired April 1, 2008.
Operating Income (Loss) — Operating results increased $499 million in 2010, compared to 2009, andincreased $2,021 million in 2009, compared to 2008. Operating results in 2010 were negatively impacted by a$21 million charge associated with a change in estimate related to a dispute that arose during the third quarter2010 over an environmental indemnity, the impairment of assets related to the Berre refinery, and by a crudeunit fire in May 2010 resulting in lost production and $14 million in cash costs. Operating results for 2009included the benefit of $50 million from the settlement of hedging activity at the Houston refinery related todistillates. Lower depreciation and amortization expense of $269 million in 2010 compared to 2009 wasprimarily the result of the write-down of Property, plant and equipment associated with the revaluation of ourassets in fresh-start accounting. Apart from the effects of the items listed above, increases in operating resultsfor 2010 were primarily due to higher refining margins, especially at the Houston refinery, partially offset bylower product margins for oxyfuels. The decreased oxyfuels margins in 2010 are primarily due to thenormalization of margins in 2010 compared to the exceptional margins achieved in 2009.
65
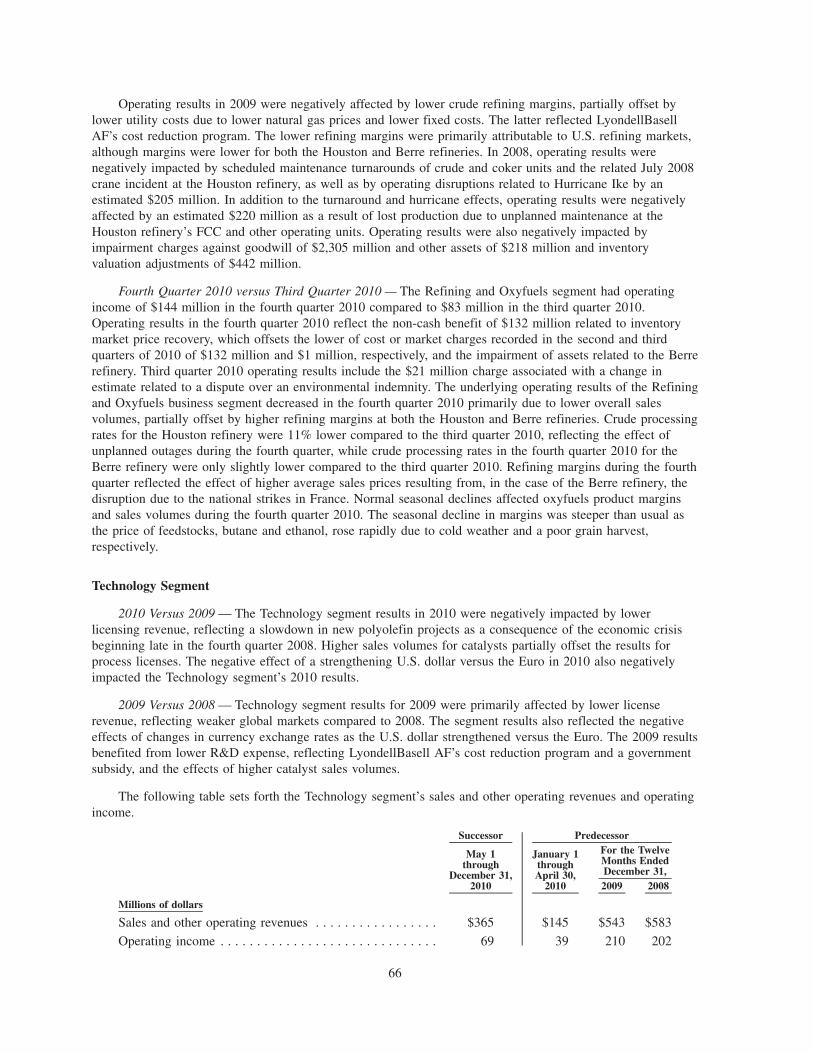
Operating results in 2009 were negatively affected by lower crude refining margins, partially offset bylower utility costs due to lower natural gas prices and lower fixed costs. The latter reflected LyondellBasellAF’s cost reduction program. The lower refining margins were primarily attributable to U.S. refining markets,although margins were lower for both the Houston and Berre refineries. In 2008, operating results werenegatively impacted by scheduled maintenance turnarounds of crude and coker units and the related July 2008crane incident at the Houston refinery, as well as by operating disruptions related to Hurricane Ike by anestimated $205 million. In addition to the turnaround and hurricane effects, operating results were negativelyaffected by an estimated $220 million as a result of lost production due to unplanned maintenance at theHouston refinery’s FCC and other operating units. Operating results were also negatively impacted byimpairment charges against goodwill of $2,305 million and other assets of $218 million and inventoryvaluation adjustments of $442 million.
Fourth Quarter 2010 versus Third Quarter 2010 — The Refining and Oxyfuels segment had operatingincome of $144 million in the fourth quarter 2010 compared to $83 million in the third quarter 2010.Operating results in the fourth quarter 2010 reflect the non-cash benefit of $132 million related to inventorymarket price recovery, which offsets the lower of cost or market charges recorded in the second and thirdquarters of 2010 of $132 million and $1 million, respectively, and the impairment of assets related to the Berrerefinery. Third quarter 2010 operating results include the $21 million charge associated with a change inestimate related to a dispute over an environmental indemnity. The underlying operating results of the Refiningand Oxyfuels business segment decreased in the fourth quarter 2010 primarily due to lower overall salesvolumes, partially offset by higher refining margins at both the Houston and Berre refineries. Crude processingrates for the Houston refinery were 11% lower compared to the third quarter 2010, reflecting the effect ofunplanned outages during the fourth quarter, while crude processing rates in the fourth quarter 2010 for theBerre refinery were only slightly lower compared to the third quarter 2010. Refining margins during the fourthquarter reflected the effect of higher average sales prices resulting from, in the case of the Berre refinery, thedisruption due to the national strikes in France. Normal seasonal declines affected oxyfuels product marginsand sales volumes during the fourth quarter 2010. The seasonal decline in margins was steeper than usual asthe price of feedstocks, butane and ethanol, rose rapidly due to cold weather and a poor grain harvest,respectively.
Technology Segment
2010 Versus 2009 — The Technology segment results in 2010 were negatively impacted by lowerlicensing revenue, reflecting a slowdown in new polyolefin projects as a consequence of the economic crisisbeginning late in the fourth quarter 2008. Higher sales volumes for catalysts partially offset the results forprocess licenses. The negative effect of a strengthening U.S. dollar versus the Euro in 2010 also negativelyimpacted the Technology segment’s 2010 results.
2009 Versus 2008 — Technology segment results for 2009 were primarily affected by lower licenserevenue, reflecting weaker global markets compared to 2008. The segment results also reflected the negativeeffects of changes in currency exchange rates as the U.S. dollar strengthened versus the Euro. The 2009 resultsbenefited from lower R&D expense, reflecting LyondellBasell AF’s cost reduction program and a governmentsubsidy, and the effects of higher catalyst sales volumes.
The following table sets forth the Technology segment’s sales and other operating revenues and operatingincome.
May 1through
December 31,2010
January 1throughApril 30,
2010 2009 2008
For the TwelveMonths EndedDecember 31,
Successor Predecessor
Millions of dollars
Sales and other operating revenues . . . . . . . . . . . . . . . . . $365 $145 $543 $583
Operating income . . . . . . . . . . . . . . . . . . . . . . . . . . . . . . 69 39 210 202
66

Revenues — Revenues for 2010 decreased $33 million, or 6% compared to 2009 and decreased $40 mil-lion, or 7% from 2008 to 2009. The decreases in 2010 and 2009 revenues were attributable to lower processlicense revenue, partially offset by higher catalyst sales volumes. In addition, currency exchange rates had anunfavorable effect on operating income of non-U.S. operations as the U.S. dollar strengthened versus the Euroin both periods.
Operating Income — Operating income for 2010 for the Technology segment decreased $102 millioncompared to 2009 and increased $8 million from 2008 to 2009. Operating income for 2010 was negativelyaffected by an $8 million charge associated with a change in estimate related to a dispute that arose during thethird quarter 2010 over an environmental indemnity and by a $17 million charge related to the sale, in 2010,of higher cost inventory. The remaining decrease in operating income in 2010 compared to 2009 was the resultof lower licensing revenue, and to a lesser extent, the negative effects of a strengthening U.S. dollar versus theEuro in 2010 compared to 2009. These decreases in 2010 operating results were only partly offset by theeffect of increased catalyst sales volumes in 2010. Operating income in 2009 also included the benefit of agovernment subsidy recognized as a reduction of R&D expense.
The $8 million increase in operating income in 2009, compared to 2008, was primarily the result ofhigher catalysts sales volumes, partly offset by an unfavorable effect from changes in currency exchange rates.Currency exchange rates had an unfavorable effect on operating income as the U.S. dollar strengthened versusthe Euro in 2009 compared to 2008.
Fourth Quarter 2010 versus Third Quarter 2010 — The Technology segment had operating income of$8 million in the fourth quarter 2010 compared to $38 million in the third quarter 2010. Apart from a fourthquarter 2010 charge of $17 million related to the sale of higher cost inventory during the year and an$8 million charge related to a dispute over environmental liability, operating results in the fourth quarter 2010reflected lower licensing income and the effect of lower sales volumes for catalysts, compared to the thirdquarter 2010.
FINANCIAL CONDITION
Operating, investing and financing activities of continuing operations, which are discussed below, arepresented in the following table:
May 1through
December 31,2010
January 1throughApril 30,
2010 2009 2008
For the Twelve MonthsEnded
December 31,
Successor Predecessor
Millions of dollars
Source (use) of cash:
Operating activities . . . . . . . . . . . . . . . . . . . . . . . . . $ 2,957 $ (936) $ (787) $ 1,090
Investing activities . . . . . . . . . . . . . . . . . . . . . . . . . (312) (213) (611) (1,884)
Financing activities . . . . . . . . . . . . . . . . . . . . . . . . . (1,194) 3,315 1,101 1,083
Operating Activities — Cash provided in the combined Successor and Predecessor periods of 2010primarily reflected an increase in earnings offset by payments for reorganization items, claims under the Planof Reorganization, and certain annual payments relating to sales rebates, employee bonuses, property taxes andinsurance premiums. The use of cash in 2009 primarily reflected a $573 million increase in cash used by themain components of working capital — accounts receivable and inventory, net of accounts payable — and$329 million of vendor prepayments that were required by certain third parties as a result of LyondellBasellAF’s chapter 11 filing.
In 2010, the main components of working capital — accounts receivable and inventory, net of accountspayable used cash of $456 million compared to $573 million in 2009. The increase in these components ofworking capital during 2010 reflected a $702 million increase in accounts receivable due to higher averagesales prices and higher sales volumes and a $395 million increase in inventory, partially offset by a
67

$641 million increase in accounts payable due to the higher costs and volumes of feedstocks, and morefavorable payment terms.
Changes in the main components of working capital used cash of $573 million in 2009 and provided cashof $747 million in 2008. The increase in cash used by the main components of working capital in 2009primarily reflected a $503 million repayment that was required in connection with the termination of anaccounts receivable securitization program in early 2009. Operationally, cash used by the main components ofworking capital increased by only $70 million, despite the effect of rising prices during 2009, as the Companyfocused on reducing working capital levels.
In 2008, the $747 million of cash provided by the main components of working capital primarily reflectedthe effects of declining crude oil prices on sales prices and the value of inventory; the disruptive effects ofHurricane Ike on the Company’s Gulf Coast operations; and the planned and unplanned outages related to aturnaround at the Houston Refinery. Other factors impacting the main components of working capital includeda general tightening of credit in the industry and the delay, in December 2008 of certain payments.
Investing Activities — Cash used in investing activities in 2010 included $692 million of capitalexpenditures, partially offset by proceeds of $154 million from the sale of our F&F business in December2010 and $12 million in proceeds from a money market fund that had suspended rights to redemption in 2008,as described below.
The cash used in 2009 primarily included $779 million of capital expenditures, partially offset byproceeds of $120 million from insurance claims, $20 million from sales of assets, and $23 million from a netreduction of short-term investments. The cash provided by insurance claims related to damages sustained in2005 at the polymers plant in Munchsmunster, Germany.
The cash used in 2008 was primarily related to business acquisitions and capital expenditures, partiallyoffset by proceeds from the sales of assets and insurance claims related to the polymers plant inMunchsmunster, Germany. Acquisitions in 2008 included the April 2008 acquisition of the Shell oil refinery,inventory and associated infrastructure and businesses at our Berre Refinery for a purchase price of$927 million, including final adjustment for working capital and the February 2008 acquisition of SolvayEngineered Polymers, Inc., a leading supplier of polypropylene compounds in North America, for $134 million(see Note 5 to the Consolidated Financial Statements). Asset sales included the September 2008 sale of theTDI business for proceeds of A77 million ($113 million) and the July 2008 sale of a Canadian plant forproceeds of $18 million. As a result of financial difficulties experienced by major financial institutionsbeginning in the latter part of 2008, LyondellBasell AF received notice that rights of redemption had beensuspended with respect to a money market fund in which LyondellBasell AF had invested approximately$174 million. LyondellBasell AF subsequently redeemed a total of $172 million, including $137 million in2008, $23 million in 2009 and $12 million in January 2010.
68

The following table summarizes capital expenditures for the periods presented:
Plan2011
May 1through
December 31,2010
January 1throughApril 30,
2010 2009 2008
For the TwelveMonths EndedDecember 31,
Successor Predecessor
Millions of dollars
Capital expenditures by segment:O&P — Americas . . . . . . . . . . . . . . . . . . . . . . . . . . . . $ 361 $146 $ 52 $142 $ 201
O&P — EAI . . . . . . . . . . . . . . . . . . . . . . . . . . . . . . . . 286 105 102 411 509
I&D . . . . . . . . . . . . . . . . . . . . . . . . . . . . . . . . . . . . . . 122 77 8 23 66
Refining and Oxyfuels . . . . . . . . . . . . . . . . . . . . . . . . . 345 108 49 167 196
Technology . . . . . . . . . . . . . . . . . . . . . . . . . . . . . . . . . 38 19 12 32 33
Other . . . . . . . . . . . . . . . . . . . . . . . . . . . . . . . . . . . . . 15 12 3 6 24
Total capital expenditures by segment . . . . . . . . . . . . . 1,167 467 226 781 1,029
Less:Contributions to PO Joint Ventures. . . . . . . . . . . . . . . . 3 1 — 2 29
Consolidated capital expenditures of continuingoperations . . . . . . . . . . . . . . . . . . . . . . . . . . . . . . . . $1,164 $466 $226 $779 $1,000
The capital expenditures presented in the table above exclude costs of major periodic maintenance andrepair activities, including turnarounds and catalyst recharges of $71 million, $39 million and $164 million inthe Predecessor periods of 2010, 2009 and 2008, respectively.
Financing Activities — The cash used in the Successor period primarily reflects the repayment of debt inthe fourth quarter of 2010. In December 2010, we redeemed $225 million and A37.5 million ($50 million) ofour 8% Senior Secured Notes due 2017, comprising 10% of the outstanding senior secured dollar notes andsenior secured Euro notes, respectively. In conjunction with the redemption of the notes, we paid premiumstotaling $8 million. Also in 2010, we repaid $495 million of the Senior Term Loan Facility, including amandatory quarterly amortization payment of $1 million and a prepayment, at par, of $494 million inDecember 2010.
Since the Emergence Date, we made net payments totaling $398 million under the European Securitiza-tion Facility, which includes the entire outstanding balance in October 2010. We also made net payments of$14 million under our accounts receivable factoring facility during the Successor period.
As part of our emergence from bankruptcy, we received gross proceeds of $2,800 million on April 30,2010 in connection with the issuance of shares in a rights offering and paid $86 million of fees, including$70 million of fees to equity backstop providers. On April 30, 2010 we also received net proceeds of$3,242 million from the issuance of new debt by our subsidiary, Lyondell Chemical, including Senior SecuredNotes in the amounts of $2,250 million and A375 million ($497 million) and from proceeds of the SeniorTerm Loan facility of $495 million. Proceeds from the rights offering and the Senior Notes, along withborrowings under the Senior Term Loan Facility and the amended and restated European Securitization, wereused to repay outstanding amounts of $2,167 million under the DIP New Money Term Loan, $985 millionunder the DIP ABL Facility and to pay a $195 million exit fee required under the DIP financing. We also paidfees totaling $92 million in connection with our new U.S. ABL Facility and amended and restated EuropeanSecuritization facility. Predecessor debt classified as Liabilities subject to compromise immediately prior toemergence from bankruptcy was discharged pursuant to the Plan of Reorganization (see Note 4 toConsolidated Financial Statements).
Apart from the payments reflected above, during the 2010 Predecessor period, we repaid a $5 millionArgentinean loan; made a $12 million mandatory quarterly amortization payment of the Dutch Tranche ADollar Term Loan, $3 million of which was related to the DIP Roll-Up Loans; and made payments of
69
$8 million on the French Factoring Facility. In addition, we made payments totaling $13 million related to theextension of the DIP financing. We also had a net increase in borrowings of $47 million under the EuropeanSecuritization facility in the 2010 Predecessor period.
In 2009, LyondellBasell AF borrowed $2,167 million under a DIP financing arrangement, receiving netproceeds of $2,089 million and subsequently paid additional bank fees of $97 million. In addition,LyondellBasell AF paid fees of $93 million related to the issuance of the DIP ABL facility, and atDecember 31, 2009 had $325 million of net borrowings outstanding under this facility.
The chapter 11 filing in 2009 constituted a termination event under the asset-based credit facilities in theU.S., and LyondellBasell AF used $880 million of the net proceeds under the DIP financing arrangement torepay $766 million and $114 million outstanding under the previous inventory-based credit facility and theNorth American accounts receivable securitization program, respectively. As noted under Operating Activities,LyondellBasell AF also used $503 million to repurchase outstanding accounts receivable sold under itsprevious $1,150 million receivables securitization facility. In addition, LyondellBasell AF repaid a $100 milliondemand note related to emergency postpetition funding. In 2009, LyondellBasell AF made net repaymentstotaling $201 million under its European receivables securitization program, which was amended and restatedin March 2009. LyondellBasell AF repaid $45 million (70 million Australian dollars) outstanding under anAustralian term loan and $11 million of other loans, including $6 million outstanding under an Argentineanbank loan, and made mandatory quarterly amortization payments of the Dutch Tranche A Dollar Term Loantotaling $24 million, $6 million of which was related to the DIP financing.
A non-debtor subsidiary of LyondellBasell AF entered into an accounts receivable factoring agreement in2009 under which it received $24 million of proceeds. See the “Accounts Receivable Factoring Agreement”section in “Liquidity and Capital Resources.” Also in 2009, LyondellBasell AF received $18 million ofproceeds from an Argentinean bank loan and borrowed $17 million related to a letter of credit presented forpayment under the prepetition senior secured revolving credit facility.
LyondellBasell AF had an additional $21 million of cash used by financing activities, primarily related tothe effects of bank overdrafts.
The cash provided in 2008 primarily reflected net $1,510 million borrowed under LyondellBasell AF’scredit facilities offset by $384 million of long-term debt repayments. The borrowings were used to fund thebusiness acquisitions described in the “Investing Activities” section above.
Liquidity and Capital Resources — As of December 31, 2010, we had cash on hand of $4,222 million. Inaddition, we had total unused availability under our credit facilities of $1,883 million at December 31, 2010,which included the following:
• $1,380 million under our $1,750 million U.S. ABL facility, which matures in 2014. Availability underthe U.S. ABL facility is subject to a borrowing base of $1,750 million at December 31, 2010, and isreduced to the extent of outstanding borrowings and outstanding letters of credit provided under thefacility. At December 31, 2010, we had $370 million of outstanding letters of credit and no outstandingborrowings under the facility.
• A368 million and $16 million (totaling approximately $503 million) under our A450 million Europeanreceivables securitization facility. Availability under the European receivables securitization facility issubject to a borrowing base comprising A368 million and $16 million in effect as of December 31,2010. There were no outstanding borrowings under this facility at December 31, 2010.
In October 2010, we provided the lenders under our accounts receivable factoring facility with notice ofour intent to terminate the agreement. The facility was repaid in full in November 2010 and terminated.
We may use cash on hand, cash from operating activities and proceeds from asset divestitures to repaydebt, which may include additional purchases of our outstanding bonds in the open market or otherwise. Wealso plan to finance our ongoing working capital, capital expenditures, debt service and other fundingrequirements through our future financial and operating performance, which could be affected by generaleconomic, financial, competitive, legislative, regulatory, business and other factors, many of which are beyond
70

our control. We believe that our cash, cash from operating activities and proceeds from our revolving creditfacilities provide us with sufficient financial resources to meet our anticipated capital requirements andobligations as they come due.
At December 31, 2010, we had total short-term and long-term debt, including current maturities, of$6,082 million. At December 31, 2010, our $4 million of current maturities of long-term debt comprisesvarious non-U.S. loans.
We are seeking to amend and restate our Senior Secured Term Loan Agreement to, among other things,modify certain restrictive covenants.
Receivables securitization — On May 4, 2010, we amended and restated an existing securitizationagreement under which two of our non-U.S. subsidiaries may sell, subject to a borrowing base, up toA450 million in trade receivables. Transfers of accounts receivable under this three-year program do notqualify as sales; therefore, the transferred accounts receivable and the proceeds received through such transfersare included in trade receivables, net, and short-term debt in the consolidated balance sheets. There were noborrowings under this facility as of December 31, 2010.
Contractual and Other Obligations — The following table summarizes, as of December 31, 2010, ourminimum payments for long-term debt, including current maturities, short-term debt, and contractual and otherobligations for the next five years and thereafter.
Total 2011 2012 2013 2014 2015 ThereafterPayments Due By Period
Millions of dollars
Total debt . . . . . . . . . . . . . . . . . . . $ 6,082 $ 46 $ 10 $ 1 $ — $ 1 $ 6,024
Interest on total debt . . . . . . . . . . . 4,460 609 608 608 589 579 1,467
Pension benefits:
PBO . . . . . . . . . . . . . . . . . . . . . 2,933 161 166 236 186 205 1,979
Assets. . . . . . . . . . . . . . . . . . . . (1,760) — — — — — (1,760)
Funded status . . . . . . . . . . . . 1,173
Other postretirement benefits. . . . . 332 22 22 23 23 24 218
Advances from customers . . . . . . . 101 12 17 16 12 12 32
Other . . . . . . . . . . . . . . . . . . . . . . 605 112 93 71 35 33 261
Deferred income taxes . . . . . . . . . 923 168 165 153 143 134 160
Other obligations:
Purchase obligations:
Take-or-pay contracts . . . . . . . . 15,223 2,400 2,352 2,328 2,357 1,910 3,876
Other contracts . . . . . . . . . . . . . 41,593 13,484 6,325 5,612 5,405 4,767 6,000
Operating leases . . . . . . . . . . . . . . 1,687 278 232 211 185 152 629
Total . . . . . . . . . . . . . . . . . . . . . $72,179 $17,292 $9,990 $9,259 $8,935 $7,817 $18,886
Total Debt — Total debt includes our 8% U.S. dollar and Euro Senior Secured Notes due 2017, SeniorSecured Term Loan Facility due 2016, 11% Senior Secured Notes due 2018, 8.1% guaranteed notes due 2027(the “2027 Notes”) and various non-U.S. loans. See Note 15 for a discussion of covenant requirements underthe credit facilities and indentures and additional information regarding our debt facilities.
Interest — Our debt and related party debt agreements contain provisions for the payment of monthly,quarterly or semi-annual interest at a stated rate of interest over the term of the debt.
Pension Benefits — We maintain several defined benefit pension plans, as described in Note 18 to theConsolidated Financial Statements. At December 31, 2010, the projected benefit obligation for our pensionplans exceeded the fair value of plan assets by $1,173 million. Subject to future actuarial gains and losses, aswell as actual asset earnings, we, together with our consolidated subsidiaries, will be required to fund the
71

$1,173 million, with interest, in future years. We contributed $99 million to our pension plans in 2010 andLyondellBasell AF made contributions to the plans of $52 million in 2009 and $80 million in 2008. In January2011, we contributed $155 million of the approximately $287 million of required contributions that we expectto make to our pension plans in 2011. Estimates of pension benefit payments through 2015 are included in thetable above.
Other Postretirement Benefits — We provide other postretirement benefits, primarily medical benefits toeligible participants, as described in Note 18 to the Consolidated Financial Statements. We pay other unfundedpostretirement benefits as incurred. Estimates of other postretirement benefit payments through 2015 areincluded in the table above.
Advances from Customers — We are obligated to deliver product, primarily at cost-based prices, inconnection with long-term sales agreements under which our Predecessor received advances from customers inprior years. These advances are treated as deferred revenue and will be amortized to earnings as product isdelivered over the remaining terms of the respective contracts, which primarily range from 4 to 8 years. Theunamortized long-term portion of such advances totaled $101 million as of December 31, 2010.
Other — Other primarily consists of accruals for environmental remediation costs, obligations underdeferred compensation arrangements, and anticipated asset retirement obligations. See “Critical AccountingPolicies” below for a discussion of obligations for environmental remediation costs.
Deferred Income Taxes — The scheduled settlement of the deferred tax liabilities shown in the table isbased on the scheduled reversal of the underlying temporary differences. Actual cash tax payments will varydepending upon future taxable income.
Purchase Obligations — We are party to various obligations to purchase products and services, principallyfor raw materials, utilities and industrial gases. These commitments are designed to assure sources of supplyand are not expected to be in excess of normal requirements. The commitments are segregated into take-or-paycontracts and other contracts. Under the take-or-pay contracts, we are obligated to make minimum paymentswhether or not we take the product or service. Other contracts include contracts that specify minimumquantities; however, in the event that we do not take the contractual minimum, we are only obligated for anyresulting economic loss suffered by the vendor. The payments shown for the other contracts assume thatminimum quantities are purchased. For contracts with variable pricing terms, the minimum payments reflectthe contract price at December 31, 2010.
Operating Leases — We lease various facilities and equipment under noncancelable lease arrangementsfor various periods. See Note 16 to the Consolidated Financial Statements for related lease disclosures.
RELATED PARTY TRANSACTIONS
We have related party transactions with certain of our major shareholders and their affiliates and our jointventure partners. We believe that such transactions are effected on terms substantially no more or lessfavorable than those that would have been agreed upon by unrelated parties on an arm’s length basis.
LyondellBasell AF had related party transactions with its equity investees and its affiliates as well as amember of its Board of Directors (see Note 7 to the Consolidated Financial Statements). In addition, prior tothe Emergence Date, LyondellBasell AF had related party transactions with Access Industries.
CRITICAL ACCOUNTING POLICIES
Management applies those accounting policies that it believes best reflect the underlying business andeconomic events, consistent with accounting principles generally accepted in the U.S. (see Note 2 to theConsolidated Financial Statements). Our more critical accounting policies include those related to the valuationof inventory, long-lived assets, the valuation of goodwill, accruals for long-term employee benefit costs suchas pension and other postretirement costs, liabilities for anticipated expenditures to comply with environmentalregulations, and accruals for taxes based on income. Inherent in such policies are certain key assumptions andestimates made by management. Management periodically updates its estimates used in the preparation of the
72

financial statements based on its latest assessment of the current and projected business and general economicenvironment. Changes to these critical accounting policies have been reviewed with LyondellBasell N.V.’sSupervisory Board.
Inventory — LyondellBasell N.V. adopted the LIFO method of accounting for inventory upon implemen-tation of fresh-start accounting. In conjunction with the implementation of fresh-start accounting on April 30,2010, the Company recorded its inventory, which is primarily crude-oil derived, at fair value. The resultingincrease in inventory was primarily in the U.S. and was largely driven by the price of crude oil. The per barrelbenchmark price of WTI crude oil at April 30, 2010 had increased to $86.15. The price of crude oil is subjectto many factors, including changes in economic conditions. The fluctuation in the price of crude oil fromperiod to period may result in the recognition of charges to adjust the value of inventory to the lower of costor market in periods of falling prices and the reversal of those charges in subsequent periods as market pricesrecover. Accordingly, our cost of sales and results of operations may be affected by such fluctuations.
Following the revaluation of our inventory on April 30, 2010, the per barrel benchmark price of WTIcrude oil declined to $75.63 on June 30, 2010, resulting in a $333 million lower of cost or market adjustmentprimarily to the Company’s raw materials and finished goods inventory and associated increase in cost of salesfor the period from May 1 through June 30, 2010. In the third quarter 2010, as a result of lower market pricesfor certain of the Company’s finished goods inventory, the Company recorded a non-cash charge of $32 millionto adjust the value to the lower of cost or market. The recovery of the market price of crude oil in the fourthquarter of 2010, resulted in a non-cash credit of $323 million to earnings.
Long-Lived Assets — With respect to long-lived assets, key assumptions included the estimates of theasset fair values and useful lives at the Emergence Date and the recoverability of carrying values of fixedassets and other intangible assets, as well as the existence of any obligations associated with the retirement offixed assets. Such estimates could be significantly modified and/or the carrying values of the assets could beimpaired by such factors as new technological developments, new chemical industry entrants with significantraw material or other cost advantages, uncertainties associated with the European, U.S. and world economies,the cyclical nature of the chemical and refining industries, and uncertainties associated with governmentalactions, whether regulatory or, in the case of Houston refinery, with respect to its crude oil contract.
Earnings in the 2010 Successor period included a pretax charge of $28 million primarily related toimpairment of the carrying value of capital additions at our Berre refinery following an analysis of itsdiscounted cash flow projections.
Predecessor earnings for 2009 included pretax impairment charges of $17 million, primarily related to theimpairment of LyondellBasell AF’s emissions allowances that are subject to reallocation to other industryparticipants under a proposed regulation by the Texas Commission on Environmental Quality. As part of itsreorganization, LyondellBasell AF also recognized charges totaling $679 million, including $624 million forthe write off of the carrying value and related assets of its Chocolate Bayou olefins facility near Alvin, Texasand $55 million for the write off of its ethylene glycol facility in Beaumont, Texas.
Predecessor earnings for 2008 included a $218 million pretax charge for impairment of the carrying valueof the assets related to LyondellBasell AF’s Berre Refinery. Also in 2008, LyondellBasell AF recognized a$7 million charge for impairment of its ethylene glycol facility in Beaumont, Texas.
For purposes of recognition and measurement of the above-noted impairments, long-lived assets weregrouped with other assets and liabilities at the lowest level for which identifiable cash flows were largelyindependent of the cash flows of other assets and liabilities.
The estimated useful lives of long-lived assets range from 3 to 30 years. Depreciation and amortization ofthese assets, including amortization of deferred turnaround costs, under the straight-line method over theirestimated useful lives totaled $1,123 million in 2010, including $558 million in the Successor period. Basedupon the estimated fair values and re-assessed useful lives at the Emergence Date, depreciation andamortization would be approximately $850 million per year. If the useful lives of the assets were found to beshorter than originally estimated, depreciation and amortization charges would be accelerated over the reviseduseful life.
73
Goodwill — Goodwill of $787 million at December 31, 2010 represents the tax effect of the differencesbetween the tax and book bases of the Company’s assets and liabilities resulting from the Company’srevaluation of those assets and liabilities to fair value in connection with the Company’s emergence frombankruptcy and adoption of fresh-start accounting. LyondellBasell N.V. evaluates the carrying value ofgoodwill annually or more frequently if events or changes in circumstances indicate that the carrying amountmay exceed fair value. Recoverability is determined by comparing the estimated fair value of the reportingunit to which the goodwill applies to the carrying value, including goodwill, of that reporting unit.
The recoverability of LyondellBasell N.V.’s goodwill is dependent upon the future operating resultsassociated with its reporting units, which could change significantly based upon business performance or otherfactors.
Long-Term Employee Benefit Costs — The costs to LyondellBasell N.V. of long-term employee benefits,particularly pension and other postretirement medical and life insurance benefits, are incurred over longperiods of time, and involve many uncertainties over those periods. The net periodic benefit cost attributableto current periods is based on several assumptions about such future uncertainties, and is sensitive to changesin those assumptions. It is management’s responsibility, often with the assistance of independent experts, toselect assumptions that in its judgment represent its best estimates of the future effects of those uncertainties.It also is management’s responsibility to review those assumptions periodically to reflect changes in economicor other factors that affect those assumptions.
The current benefit service costs, as well as the existing liabilities, for pensions and other postretirementbenefits are measured on a discounted present value basis. The discount rate is a current rate, related to therate at which the liabilities could be settled. LyondellBasell N.V.’s assumed discount rate is based on publishedaverage rates for high-quality (Aa rating) ten-year fixed income securities. For the purpose of measuring thebenefit obligations at December 31, 2010, LyondellBasell N.V. used a discount rate of 5.25% for mostU.S. plans while a rate of 5.0% was used for certain U.S. plans to reflect the different terms of the relatedbenefit obligations. The discount rate used to measure obligations for non-U.S. plans at December 31, 2010was 4.97%, reflecting market interest rates. The discount rates in effect at December 31, 2010 will be used tomeasure net periodic benefit cost during 2011.
The benefit obligation and the periodic cost of other postretirement medical benefits also are measuredbased on assumed rates of future increase in the per capita cost of covered health care benefits. As ofDecember 31, 2010, the assumed rate of increase for our U.S. plans was 9.1%, decreasing to 5% in 2026 andthereafter. The assumed rate of increase for our Canadian plans, as of December 31, 2010, was 8.5%,decreasing to 5% in 2018 and thereafter. A one percentage point change in the health care cost trend rateassumption would have no significant effect on either the benefit liability or the net periodic cost, due to limitson LyondellBasell N.V.’s maximum contribution level under the medical plan.
The net periodic cost of pension benefits included in expense also is affected by the expected long-termrate of return on plan assets assumption. Investment returns that are recognized currently in net incomerepresent the expected long-term rate of return on plan assets applied to a market-related value of plan assetswhich, for LyondellBasell N.V., is defined as the market value of assets. The expected rate of return on planassets is a longer term rate, and is expected to change less frequently than the current assumed discount rate,reflecting long-term market expectations, rather than current fluctuations in market conditions.
The weighted average expected long-term rate of return on U.S. and non-U.S. plan assets of 8% and6.24%, respectively, is based on the average level of earnings that its independent pension investment advisorhad advised could be expected to be earned over time. The expectation is based on an asset allocation thatvaries by region. The asset allocations are summarized in Note 18 to the Consolidated Financial Statements.The actual returns in 2010 for U.S. and non- U.S. plan assets were 15.6% and 8.4%, respectively.
The actual rate of return on plan assets may differ from the expected rate due to the volatility normallyexperienced in capital markets. Management’s goal is to manage the investments over the long term to achieveoptimal returns with an acceptable level of risk and volatility.
74

Net periodic pension cost recognized each year includes the expected asset earnings, rather than theactual earnings or loss. This unrecognized amount, to the extent it exceeds 10% of the projected benefitobligation for the respective plan, is recognized as additional net periodic benefit cost over the averageremaining service period of the participants in each plan.
In May 2010, LyondellBasell N.V. resumed matching contributions under its defined contribution plans(the 401(k) Employee Savings Plans). LyondellBasell AF had temporarily suspended its matching contributionsunder the Company’s defined contribution plans beginning in March 2009 as a result of the bankruptcy.
Additional information on the key assumptions underlying these benefit costs appears in Note 18 to theConsolidated Financial Statements.
Liabilities for Environmental Remediation Costs — Anticipated expenditures related to investigation andremediation of contaminated sites, which include current and former plant sites and other remediation sites,are accrued when it is probable a liability has been incurred and the amount of the liability can be reasonablyestimated. Only ongoing operating and monitoring costs, the timing of which can be determined withreasonable certainty, are discounted to present value. Future legal costs associated with such matters, whichgenerally are not estimable, are not included in these liabilities.
As of December 31, 2010, LyondellBasell N.V.’s accrued liability for future environmental remediationcosts at current and former plant sites and other remediation sites totaled $107 million. The liabilities forindividual sites range from less than $1 million to $37 million, and remediation expenditures are expected tooccur over a number of years, and not to be concentrated in any single year. In the opinion of management, itis reasonably possible that losses in excess of the liabilities recorded for environmental remediation may havebeen incurred. However, we cannot estimate any amount or range of such possible additional losses. Newinformation about sites, new technology or future developments such as involvement in investigations byregulatory agencies, could require LyondellBasell N.V. to reassess potential exposure related to environmentalmatters. See Note 21 to the Consolidated Financial Statements for further discussion of environmentalremediation matters.
Accruals for Taxes Based on Income — The determination of our provision for income taxes and thecalculation of our tax benefits and liabilities is subject to management’s estimates and judgments due to thecomplexity of the tax laws and regulations in the tax jurisdictions in which we operate. Uncertainties existwith respect to interpretation of these complex laws and regulations.
Deferred tax assets and liabilities are determined based on temporary differences between the financialstatement carrying amounts of existing assets and liabilities and their respective tax bases, and are measuredusing enacted tax rates expected to apply to taxable income in the years in which those temporary differencesare expected to reverse.
We recognize future tax benefits to the extent that the realization of these benefits is more likely than not.Our current provision for income taxes was impacted significantly by the initial recognition of valuationallowances related to net deferred assets in certain non-U.S. jurisdictions. Further changes to these valuationallowances may impact our future provision for income taxes, which will include no tax benefit with respectto losses incurred and no tax expense with respect to income generated in these countries until the respectivevaluation allowance is eliminated.
For further information related to our income taxes, see Note 20 to the Consolidated Financial Statementsof LyondellBasell N.V. for the year ended December 31, 2010. See Note 24 to LyondellBasell AF’sConsolidated Financial Statements for the year ended December 31, 2009 for further information related toincome taxes in the predecessor periods.
75

Accounting and Reporting Changes
For a discussion of the potential impact of new accounting pronouncements on our consolidated financialstatements, see Note 2 to the Consolidated Financial Statements.
Item 7A. QUANTITATIVE AND QUALITATIVE DISCLOSURES ABOUT MARKET RISK
See Note 17 to the Consolidated Financial Statements for discussion of LyondellBasell N.V.’s manage-ment of commodity price risk, foreign currency exposure and interest rate risk through its use of derivativeinstruments and hedging activities.
Commodity Price Risk
A substantial portion of our products and raw materials are commodities whose prices fluctuate as marketsupply and demand fundamentals change. Accordingly, product margins and the level of our profitability tendto fluctuate with changes in the business cycle. We try to protect against such instability through variousbusiness strategies. These include provisions in sales contracts allowing us to pass on higher raw material coststhrough timely price increases, formula price contracts to transfer or share commodity price risk, andincreasing the depth and breadth of our product portfolio.
In addition, we selectively use commodity swap, option, and futures contracts with various terms tomanage the volatility related to purchases of natural gas and raw materials, as well as product sales. Suchcontracts are generally limited to durations of one year or less. Cash-flow hedge accounting may be electedfor these derivative transactions; however, in some cases, when the duration of a derivative is short, hedgeaccounting is not elected. When hedge accounting is not elected, the changes in fair value of these instrumentswill be recorded in earnings. When hedge accounting is elected, gains and losses on these instruments will bedeferred in accumulated other comprehensive income (“AOCI”), to the extent that the hedge remains effective,until the underlying transaction is recognized in earnings. Market risks created by these derivative instrumentsand the mark-to-market valuations of open positions are monitored by management.
During 2010, we entered into futures contracts with respect to sales of gasoline and heating oil, andpurchases of crude oil and sales of gasoline. At December 31, 2010, futures contracts for 28 million gallons ofgasoline and heating oil in the notional amount of $70 million, maturing in February 2011, were outstanding.
We use value at risk (“VAR”), stress testing and scenario analysis for risk measurement and controlpurposes. VAR estimates the maximum potential loss in fair market values, given a certain move in pricesover a certain period of time, using specified confidence levels. Using sensitivity analysis and hypotheticalunfavorable changes in market prices ranging from 27% to 28% from those in effect at December 31, 2010,the effect would be to reduce net income by less than $1 million. The quantitative information about marketrisk is necessarily limited because it does not take into account the effects of the underlying operatingtransactions.
Foreign Exchange Risk
We manufacture and market our products in a number of countries throughout the world and, as a result,are exposed to changes in foreign currency exchange rates. Costs in some countries are incurred, in part, incurrencies other than the applicable functional currency.
We enter into transactions denominated in other than the functional currency and are, therefore, exposedto foreign currency risk on receivables and payables. We maintain risk management control systems intendedto monitor foreign currency risk attributable to both the outstanding foreign currency balances and futurecommitments. The risk management control systems involve the centralization of foreign currency exposuremanagement, offsetting exposures and estimating the expected impacts of changes in foreign currency rates onour earnings. We enter into foreign currency forward contracts to reduce the effects of our net currencyexchange exposures. For the 2010 Successor and Predecessor periods and the years ended December 31, 2009and 2008, other income (loss), net, in the Consolidated Statements of Income reflected a gain of $18 million,losses of $258 million and gains of $123 million and $20 million, respectively, in net exchange rate gains and
76

losses. For forward contracts that economically hedge recognized monetary assets and liabilities in foreigncurrencies, no hedge accounting is applied. Changes in the fair value of foreign currency forward contracts arereported in the Consolidated Statements of Income and offset the currency exchange results recognized on theassets and liabilities.
Interest Rate Risk
We are exposed to interest rate risk with respect to variable rate debt. Our variable rate debt consists ofour $1,750 million U.S. asset-based facility and our receivable securitization facility. At December 31, 2010,there were no outstanding borrowings under these facilities.
77

Item 8. FINANCIAL STATEMENTS AND SUPPLEMENTARY DATA
Index to the Consolidated Financial Statements
Page
LYONDELLBASELL INDUSTRIES N.V.Reports of Independent Registered Public Accounting Firm . . . . . . . . . . . . . . . . . . . . . . . . . . . . . . . . . . 79
Consolidated Financial Statements:
Consolidated Statements of Income . . . . . . . . . . . . . . . . . . . . . . . . . . . . . . . . . . . . . . . . . . . . . . . . . . 81
Consolidated Balance Sheets . . . . . . . . . . . . . . . . . . . . . . . . . . . . . . . . . . . . . . . . . . . . . . . . . . . . . . . 82
Consolidated Statements of Cash Flows . . . . . . . . . . . . . . . . . . . . . . . . . . . . . . . . . . . . . . . . . . . . . . . 83
Consolidated Statements of Stockholders’ Equity (Deficit) . . . . . . . . . . . . . . . . . . . . . . . . . . . . . . . . . 84
Notes to the Consolidated Financial Statements . . . . . . . . . . . . . . . . . . . . . . . . . . . . . . . . . . . . . . . . . 86
78
REPORT OF INDEPENDENT REGISTERED PUBLIC ACCOUNTING FIRM
To the Board of Directors and stockholders of LyondellBasell Industries N.V.,
In our opinion, the accompanying consolidated balance sheet as of December 31, 2010 and the relatedconsolidated statement of income, of stockholders’ equity (deficit) and of cash flows for the period fromMay 1, 2010 through December 31, 2010 present fairly, in all material respects, the financial position ofLyondellBasell Industries N.V. and its subsidiaries (the “Successor Company”) at December 31, 2010 and theresults of their operations and their cash flows for the period from May 1, 2010 through December 31, 2010 inconformity with accounting principles generally accepted in the United States of America. These financialstatements are the responsibility of the Successor Company’s management. Our responsibility is to express anopinion on these financial statements based on our audits. We conducted our audit of these statements inaccordance with the standards of the Public Company Accounting Oversight Board (United States). Thosestandards require that we plan and perform the audit to obtain reasonable assurance about whether thefinancial statements are free of material misstatement. An audit includes examining, on a test basis, evidencesupporting the amounts and disclosures in the financial statements, assessing the accounting principles usedand significant estimates made by management, and evaluating the overall financial statement presentation. Webelieve that our audit provides a reasonable basis for our opinion.
As discussed in Note 3 to the consolidated financial statements, in 2009 LyondellBasell Industries AFS.C.A. (“the Predecessor Company”), its U.S. subsidiaries and a German subsidiary, each filed a voluntarypetition with the United States Bankruptcy Court for reorganization under the provisions of Chapter 11 of theUnited States Bankruptcy Code. The Predecessor Company’s Third Amended and Restated Plan of Reorgani-zation was confirmed on April 23, 2010 and the Debtors emerged from Chapter 11 protection on April 30,2010. As of the Emergence Date, the Predecessor Company’s equity interests in its indirect subsidiariesterminated and the Successor Company now owns and operates, directly and indirectly, substantially the samebusiness as the Predecessor Company owned and operated prior to emergence from the Bankruptcy Cases. Inconnection with its emergence from bankruptcy, the Successor Company adopted fresh start accounting onMay 1, 2010.
PricewaterhouseCoopers LLPHouston, TexasMarch 17, 2011
79

REPORT OF INDEPENDENT REGISTERED PUBLIC ACCOUNTING FIRM
To the Board of Directors and stockholders of LyondellBasell Industries N.V.
In our opinion, the accompanying consolidated balance sheet as of December 31, 2009 and the relatedconsolidated statements of income, of stockholders’ equity (deficit) and of cash flows for the period fromJanuary 1, 2010 through April 30, 2010 and for each of the years ended December 31, 2009 and 2008 presentfairly, in all material respects, the financial position of the Predecessor of LyondellBasell Industries N.V. andits subsidiaries (the “Predecessor Company”) at December 31, 2009 and the results of their operations andtheir cash flows for the period from January 1, 2010 through April 30, 2010 and for each of the years endedDecember 31, 2009 and 2008 in conformity with accounting principles generally accepted in the United Statesof America. These financial statements are the responsibility of the Predecessor Company’s management. Ourresponsibility is to express an opinion on these financial statements based on our audits. We conducted ouraudits of these statements in accordance with the standards of the Public Company Accounting OversightBoard (United States). Those standards require that we plan and perform the audit to obtain reasonableassurance about whether the financial statements are free of material misstatement. An audit includesexamining, on a test basis, evidence supporting the amounts and disclosures in the financial statements,assessing the accounting principles used and significant estimates made by management, and evaluating theoverall financial statement presentation. We believe that our audits provide a reasonable basis for our opinion.
As discussed in Note 3 to the consolidated financial statements, in 2009 the Predecessor Company, itsU.S. subsidiaries and a German subsidiary, each filed a voluntary petition with the United States BankruptcyCourt for reorganization under the provisions of Chapter 11 of the United States Bankruptcy Code. ThePredecessor Company’s Third Amended and Restated Plan of Reorganization was confirmed on April 23,2010 and the Debtors emerged from Chapter 11 protection on April 30, 2010. As of the Emergence Date, thePredecessor Company’s equity interests in its indirect subsidiaries terminated and LyondellBasell IndustriesN.V. (the “Successor Company”) now owns and operates, directly and indirectly, substantially the samebusiness as the Predecessor Company owned and operated prior to emergence from the Bankruptcy Cases. Inconnection with its emergence from bankruptcy, the Successor Company adopted fresh start accounting onMay 1, 2010.
PricewaterhouseCoopers LLPHouston, TexasMarch 17, 2011
80

LYONDELLBASELL INDUSTRIES N.V.
CONSOLIDATED STATEMENTS OF INCOME
May 1through
December 31,2010
January 1throughApril 30,
2010 2009 2008
For the Year EndedDecember 31,
Successor Predecessor
Millions of dollars, except earnings per share
Sales and other operating revenues:Trade . . . . . . . . . . . . . . . . . . . . . . . . . . . . . . . . . . . . . . . . $26,961 $13,260 $30,207 $49,903Related parties . . . . . . . . . . . . . . . . . . . . . . . . . . . . . . . . . 723 207 621 803
27,684 13,467 30,828 50,706Operating costs and expenses:
Cost of sales . . . . . . . . . . . . . . . . . . . . . . . . . . . . . . . . . . . 24,697 12,405 29,372 48,780Inventory valuation adjustment . . . . . . . . . . . . . . . . . . . . . 42 — 127 1,256Impairments . . . . . . . . . . . . . . . . . . . . . . . . . . . . . . . . . . . 28 9 17 5,207Selling, general and administrative expenses . . . . . . . . . . . 564 308 850 1,197Research and development expenses . . . . . . . . . . . . . . . . . 99 55 145 194
25,430 12,777 30,511 56,634
Operating income (loss) . . . . . . . . . . . . . . . . . . . . . . . . . . . . 2,254 690 317 (5,928)Interest expense . . . . . . . . . . . . . . . . . . . . . . . . . . . . . . . . . . (545) (713) (1,795) (2,476)Interest income . . . . . . . . . . . . . . . . . . . . . . . . . . . . . . . . . . . 17 5 18 69Other income (expense), net . . . . . . . . . . . . . . . . . . . . . . . . . (103) (263) 319 106
Income (loss) from continuing operations before equityinvestments, reorganization items and income taxes . . . . 1,623 (281) (1,141) (8,229)
Income (loss) from equity investments. . . . . . . . . . . . . . . . . . 86 84 (181) 38Reorganization items . . . . . . . . . . . . . . . . . . . . . . . . . . . . . . (23) 7,580 (2,961) —
Income (loss) from continuing operations before incometaxes . . . . . . . . . . . . . . . . . . . . . . . . . . . . . . . . . . . . . . . 1,686 7,383 (4,283) (8,191)
Provision for (benefit from) income taxes . . . . . . . . . . . . . . . 170 (1,123) (1,411) (848)
Income (loss) from continuing operations . . . . . . . . . . . . . . . 1,516 8,506 (2,872) (7,343)Income (loss) from discontinued operations, net of tax . . . . . . 64 (2) 1 15
Net income (loss) . . . . . . . . . . . . . . . . . . . . . . . . . . . . . . . . . 1,580 8,504 (2,871) (7,328)Less: net loss attributable to non-controlling interests. . . . . . . 7 60 6 7
Net income (loss) attributable to the Company. . . . . . . . . . . . $ 1,587 $ 8,564 $ (2,865) $ (7,321)
Earnings per share:Net income:
BasicContinuing operations . . . . . . . . . . . . . . . . . . . . . . . . $ 2.68Discontinued operations . . . . . . . . . . . . . . . . . . . . . . . 0.11
$ 2.79
DilutedContinuing operations . . . . . . . . . . . . . . . . . . . . . . . . $ 2.67Discontinued operations . . . . . . . . . . . . . . . . . . . . . . . 0.11
$ 2.78
See Notes to the Consolidated Financial Statements.
81

LYONDELLBASELL INDUSTRIES N.V.
CONSOLIDATED BALANCE SHEETS
December 31,2010
December 31,2009
Successor Predecessor
Millions, except shares and par value data
ASSETSCurrent assets:
Cash and cash equivalents . . . . . . . . . . . . . . . . . . . . . . . . . . . . . . . . . . . . . . . . . . $ 4,222 $ 558Short-term investments . . . . . . . . . . . . . . . . . . . . . . . . . . . . . . . . . . . . . . . . . . . . — 11Accounts receivable:
Trade, net . . . . . . . . . . . . . . . . . . . . . . . . . . . . . . . . . . . . . . . . . . . . . . . . . . . . 3,482 3,092Related parties. . . . . . . . . . . . . . . . . . . . . . . . . . . . . . . . . . . . . . . . . . . . . . . . . 265 195
Inventories . . . . . . . . . . . . . . . . . . . . . . . . . . . . . . . . . . . . . . . . . . . . . . . . . . . . . 4,824 3,277Prepaid expenses and other current assets . . . . . . . . . . . . . . . . . . . . . . . . . . . . . . . 986 1,119
Total current assets . . . . . . . . . . . . . . . . . . . . . . . . . . . . . . . . . . . . . . . . . . . . . 13,779 8,252Property, plant and equipment, net . . . . . . . . . . . . . . . . . . . . . . . . . . . . . . . . . . . . . . 7,190 15,152Investments and long-term receivables:
Investment in PO joint ventures . . . . . . . . . . . . . . . . . . . . . . . . . . . . . . . . . . . . . . 437 922Equity investments . . . . . . . . . . . . . . . . . . . . . . . . . . . . . . . . . . . . . . . . . . . . . . . 1,587 1,085Related party receivables . . . . . . . . . . . . . . . . . . . . . . . . . . . . . . . . . . . . . . . . . . . 14 14Other investments and long-term receivables . . . . . . . . . . . . . . . . . . . . . . . . . . . . . 67 112
Goodwill . . . . . . . . . . . . . . . . . . . . . . . . . . . . . . . . . . . . . . . . . . . . . . . . . . . . . . . . 787 —Intangible assets, net . . . . . . . . . . . . . . . . . . . . . . . . . . . . . . . . . . . . . . . . . . . . . . . . 1,360 1,861Other assets . . . . . . . . . . . . . . . . . . . . . . . . . . . . . . . . . . . . . . . . . . . . . . . . . . . . . . 273 363Total assets . . . . . . . . . . . . . . . . . . . . . . . . . . . . . . . . . . . . . . . . . . . . . . . . . . . . . . $25,494 $27,761
LIABILITIES AND EQUITY (DEFICIT)Current liabilities:
Current maturities of long-term debt . . . . . . . . . . . . . . . . . . . . . . . . . . . . . . . . . . . $ 4 $ 497Short-term debt . . . . . . . . . . . . . . . . . . . . . . . . . . . . . . . . . . . . . . . . . . . . . . . . . . 42 6,182Accounts payable:
Trade . . . . . . . . . . . . . . . . . . . . . . . . . . . . . . . . . . . . . . . . . . . . . . . . . . . . . . . 1,968 1,627Related parties. . . . . . . . . . . . . . . . . . . . . . . . . . . . . . . . . . . . . . . . . . . . . . . . . 793 501
Accrued liabilities . . . . . . . . . . . . . . . . . . . . . . . . . . . . . . . . . . . . . . . . . . . . . . . . 1,705 1,390Deferred income taxes . . . . . . . . . . . . . . . . . . . . . . . . . . . . . . . . . . . . . . . . . . . . . 244 170
Total current liabilities . . . . . . . . . . . . . . . . . . . . . . . . . . . . . . . . . . . . . . . . . . . 4,756 10,367Long-term debt . . . . . . . . . . . . . . . . . . . . . . . . . . . . . . . . . . . . . . . . . . . . . . . . . . . . 6,036 305Other liabilities . . . . . . . . . . . . . . . . . . . . . . . . . . . . . . . . . . . . . . . . . . . . . . . . . . . . 2,183 1,361Deferred income taxes . . . . . . . . . . . . . . . . . . . . . . . . . . . . . . . . . . . . . . . . . . . . . . 923 2,081Commitments and contingenciesLiabilities subject to compromise . . . . . . . . . . . . . . . . . . . . . . . . . . . . . . . . . . . . . . . — 22,494Stockholders’ equity (deficit):
Ordinary shares, A0.04 par value, 1,000 million shares authorized and565,676,222 shares issued at December 31, 2010 . . . . . . . . . . . . . . . . . . . . . . . . 30 —
Predecessor common stock, A124 par value, 403,226 shares authorized and issued atDecember 31, 2009 . . . . . . . . . . . . . . . . . . . . . . . . . . . . . . . . . . . . . . . . . . . . . — 60
Additional paid-in capital. . . . . . . . . . . . . . . . . . . . . . . . . . . . . . . . . . . . . . . . . . . 9,837 563Retained earnings (deficit) . . . . . . . . . . . . . . . . . . . . . . . . . . . . . . . . . . . . . . . . . . 1,587 (9,313)Accumulated other comprehensive income (loss) . . . . . . . . . . . . . . . . . . . . . . . . . . 81 (286)Treasury stock, at cost, 1,122,651 class A ordinary shares at December 31, 2010 . . . — —
Total Company share of stockholders’ equity (deficit) . . . . . . . . . . . . . . . . . . . . 11,535 (8,976)Non-controlling interests . . . . . . . . . . . . . . . . . . . . . . . . . . . . . . . . . . . . . . . . . . . . . 61 129
Total equity (deficit) . . . . . . . . . . . . . . . . . . . . . . . . . . . . . . . . . . . . . . . . . . . . 11,596 (8,847)Total liabilities and equity (deficit) . . . . . . . . . . . . . . . . . . . . . . . . . . . . . . . . . . . . . . $25,494 $27,761
See Notes to the Consolidated Financial Statements.
82

LYONDELLBASELL INDUSTRIES N.V.
CONSOLIDATED STATEMENTS OF CASH FLOWS
May 1through
December 31,2010
January 1throughApril 30,
2010 2009 2008
For the YearEnded
December 31,
Successor Predecessor
Millions of dollars
Cash flows from operating activities:Net income (loss) . . . . . . . . . . . . . . . . . . . . . . . . . . . . . . . . . . . . . . . . . . . . . . . . . $ 1,580 $ 8,504 $(2,871) $(7,328)Adjustments to reconcile net income (loss) to net cash provided by (used in) operating activities:
Depreciation and amortization . . . . . . . . . . . . . . . . . . . . . . . . . . . . . . . . . . . . . . . . 558 565 1,774 1,911Asset impairments . . . . . . . . . . . . . . . . . . . . . . . . . . . . . . . . . . . . . . . . . . . . . . . 28 9 17 5,207Amortization of debt-related costs . . . . . . . . . . . . . . . . . . . . . . . . . . . . . . . . . . . . . 23 307 347 513Charge related to payment of debt . . . . . . . . . . . . . . . . . . . . . . . . . . . . . . . . . . . . . 18 — — —Accrued debtor-in-possession exit fees . . . . . . . . . . . . . . . . . . . . . . . . . . . . . . . . . . . — — 159 —Inventory valuation adjustment . . . . . . . . . . . . . . . . . . . . . . . . . . . . . . . . . . . . . . . 42 — 127 1,256Equity investments —
Equity (income) loss . . . . . . . . . . . . . . . . . . . . . . . . . . . . . . . . . . . . . . . . . . . . (86) (84) 181 (38)Distributions of earnings . . . . . . . . . . . . . . . . . . . . . . . . . . . . . . . . . . . . . . . . . . 34 18 26 98
Deferred income taxes . . . . . . . . . . . . . . . . . . . . . . . . . . . . . . . . . . . . . . . . . . . . 20 (1,129) (1,399) (831)Reorganization items and fresh-start accounting adjustments, net . . . . . . . . . . . . . . . . . . . 23 (7,580) 2,961 —Reorganization-related payments, net . . . . . . . . . . . . . . . . . . . . . . . . . . . . . . . . . . . . (349) (407) (340) —(Gain) loss on sale of assets . . . . . . . . . . . . . . . . . . . . . . . . . . . . . . . . . . . . . . . . . (64) 4 8 (9)Unrealized foreign currency exchange loss (gains) . . . . . . . . . . . . . . . . . . . . . . . . . . . . 22 264 (193) (20)
Changes in assets and liabilities that provided (used) cash:Accounts receivable . . . . . . . . . . . . . . . . . . . . . . . . . . . . . . . . . . . . . . . . . . . . . . (52) (650) (129) 1,367Inventories . . . . . . . . . . . . . . . . . . . . . . . . . . . . . . . . . . . . . . . . . . . . . . . . . . . (27) (368) (40) 943Accounts payable . . . . . . . . . . . . . . . . . . . . . . . . . . . . . . . . . . . . . . . . . . . . . . . 392 249 99 (1,563)
Repayment of accounts receivable securitization facility . . . . . . . . . . . . . . . . . . . . . . . . . . — — (503) —Prepaid expenses and other current assets . . . . . . . . . . . . . . . . . . . . . . . . . . . . . . . . . . 22 47 (329) 101Other, net . . . . . . . . . . . . . . . . . . . . . . . . . . . . . . . . . . . . . . . . . . . . . . . . . . . . . 773 (685) (682) (517)
Net cash provided by (used in) operating activities . . . . . . . . . . . . . . . . . . . . . . . . . . 2,957 (936) (787) 1,090
Cash flows from investing activities:Expenditures for property, plant and equipment . . . . . . . . . . . . . . . . . . . . . . . . . . . . . . . (466) (226) (779) (1,000)Proceeds from insurance claims . . . . . . . . . . . . . . . . . . . . . . . . . . . . . . . . . . . . . . . . — — 120 89Acquisition of businesses, net of cash . . . . . . . . . . . . . . . . . . . . . . . . . . . . . . . . . . . . . — — (1,061)Advances and contributions to affiliates . . . . . . . . . . . . . . . . . . . . . . . . . . . . . . . . . . . . — — (4) (60)Proceeds from disposal of assets . . . . . . . . . . . . . . . . . . . . . . . . . . . . . . . . . . . . . . . . 154 1 20 173Short-term investments . . . . . . . . . . . . . . . . . . . . . . . . . . . . . . . . . . . . . . . . . . . . . . — 12 23 (32)Other . . . . . . . . . . . . . . . . . . . . . . . . . . . . . . . . . . . . . . . . . . . . . . . . . . . . . . . . — — 9 7
Net cash used in investing activities . . . . . . . . . . . . . . . . . . . . . . . . . . . . . . . . . . . . (312) (213) (611) (1,884)
Cash flows from financing activities:Issuance of class B ordinary shares . . . . . . . . . . . . . . . . . . . . . . . . . . . . . . . . . . . . . . — 2,800 — —Proceeds from note payable . . . . . . . . . . . . . . . . . . . . . . . . . . . . . . . . . . . . . . . . . . . — — 100 —Repayment of note payable . . . . . . . . . . . . . . . . . . . . . . . . . . . . . . . . . . . . . . . . . . . — — (100) —Net proceeds from (repayments of) debtor-in-possession term loan facility . . . . . . . . . . . . . . . — (2,170) 1,986 —Net borrowings (repayments) under debtor-in-possession revolving credit facility . . . . . . . . . . . — (325) 325 —Net borrowings (repayments) under pre-petition revolving credit facilities . . . . . . . . . . . . . . . — — (766) 1,510Net borrowings (repayments) on revolving credit facilities . . . . . . . . . . . . . . . . . . . . . . . . (412) 38 (298) —Proceeds from short-term debt . . . . . . . . . . . . . . . . . . . . . . . . . . . . . . . . . . . . . . . . . 6 8 42 5Repayments of short-term debt . . . . . . . . . . . . . . . . . . . . . . . . . . . . . . . . . . . . . . . . . (8) (14) (6) (7)Issuance of long-term debt . . . . . . . . . . . . . . . . . . . . . . . . . . . . . . . . . . . . . . . . . . . — 3,242 — 1Repayments of long-term debt . . . . . . . . . . . . . . . . . . . . . . . . . . . . . . . . . . . . . . . . . (778) (9) (68) (384)Payments of equity and debt issuance costs . . . . . . . . . . . . . . . . . . . . . . . . . . . . . . . . . (2) (253) (93) (42)Other, net . . . . . . . . . . . . . . . . . . . . . . . . . . . . . . . . . . . . . . . . . . . . . . . . . . . . . — (2) (21) —
Net cash provided by (used in) financing activities . . . . . . . . . . . . . . . . . . . . . . . . . . . (1,194) 3,315 1,101 1,083
Effect of exchange rate changes on cash and cash equivalents . . . . . . . . . . . . . . . . . . . . . . . . 60 (13) (3) 9
Increase (decrease) in cash and cash equivalents . . . . . . . . . . . . . . . . . . . . . . . . . . . . . . 1,511 2,153 (300) 298Cash and cash equivalents at beginning of period . . . . . . . . . . . . . . . . . . . . . . . . . . . . . . . 2,711 558 858 560
Cash and cash equivalents at end of period . . . . . . . . . . . . . . . . . . . . . . . . . . . . . . . . . . . $ 4,222 $ 2,711 $ 558 $ 858
Supplemental Cash Flow Information:Interest paid . . . . . . . . . . . . . . . . . . . . . . . . . . . . . . . . . . . . . . . . . . . . . . . . . . . . $ 281 $ 360 $ 1,221 $ 1,457
Net income taxes paid . . . . . . . . . . . . . . . . . . . . . . . . . . . . . . . . . . . . . . . . . . . . . . $ 75 $ 12 $ 57 $ 145
See Notes to the Consolidated Financial Statements.
83
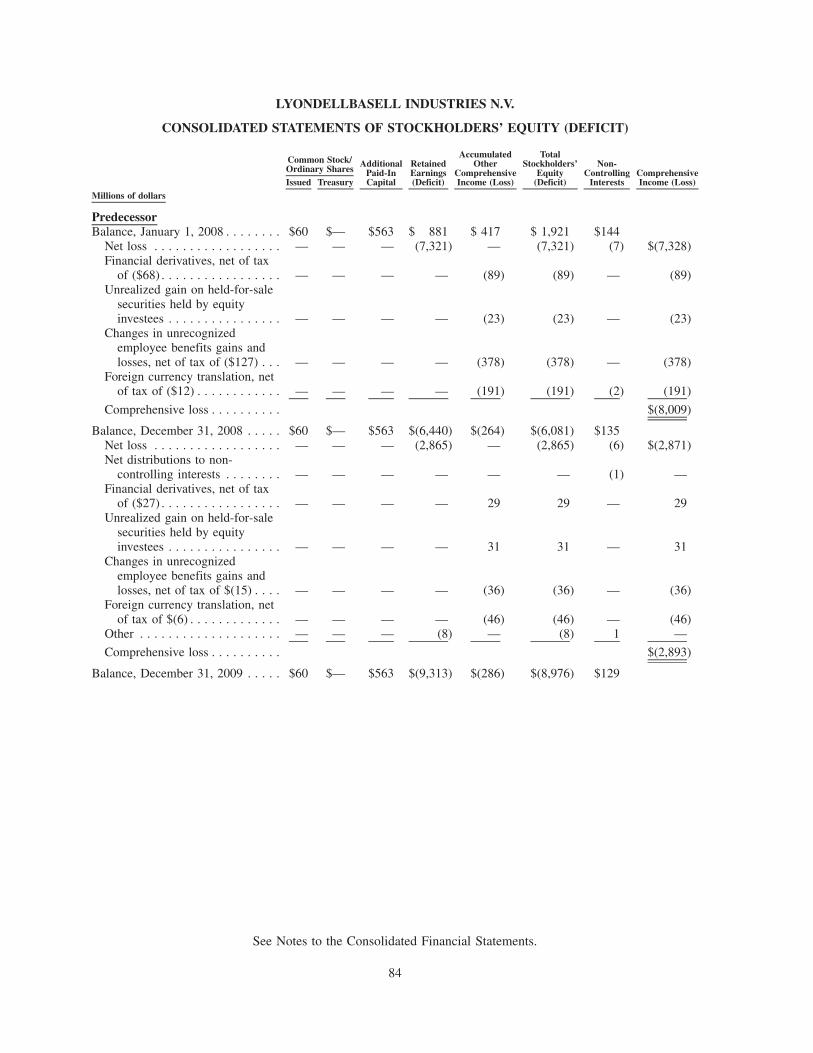
LYONDELLBASELL INDUSTRIES N.V.
CONSOLIDATED STATEMENTS OF STOCKHOLDERS’ EQUITY (DEFICIT)
Issued Treasury
AdditionalPaid-InCapital
RetainedEarnings(Deficit)
AccumulatedOther
ComprehensiveIncome (Loss)
TotalStockholders’
Equity(Deficit)
Non-Controlling
InterestsComprehensiveIncome (Loss)
Common Stock/Ordinary Shares
Millions of dollars
PredecessorBalance, January 1, 2008 . . . . . . . . $60 $— $563 $ 881 $ 417 $ 1,921 $144
Net loss . . . . . . . . . . . . . . . . . . — — — (7,321) — (7,321) (7) $(7,328)Financial derivatives, net of tax
of ($68) . . . . . . . . . . . . . . . . . — — — — (89) (89) — (89)Unrealized gain on held-for-sale
securities held by equityinvestees . . . . . . . . . . . . . . . . — — — — (23) (23) — (23)
Changes in unrecognizedemployee benefits gains andlosses, net of tax of ($127) . . . — — — — (378) (378) — (378)
Foreign currency translation, netof tax of ($12) . . . . . . . . . . . . — — — — (191) (191) (2) (191)
Comprehensive loss . . . . . . . . . . $(8,009)
Balance, December 31, 2008 . . . . . $60 $— $563 $(6,440) $(264) $(6,081) $135Net loss . . . . . . . . . . . . . . . . . . — — — (2,865) — (2,865) (6) $(2,871)Net distributions to non-
controlling interests . . . . . . . . — — — — — — (1) —Financial derivatives, net of tax
of ($27) . . . . . . . . . . . . . . . . . — — — — 29 29 — 29Unrealized gain on held-for-sale
securities held by equityinvestees . . . . . . . . . . . . . . . . — — — — 31 31 — 31
Changes in unrecognizedemployee benefits gains andlosses, net of tax of $(15) . . . . — — — — (36) (36) — (36)
Foreign currency translation, netof tax of $(6) . . . . . . . . . . . . . — — — — (46) (46) — (46)
Other . . . . . . . . . . . . . . . . . . . . — — — (8) — (8) 1 —
Comprehensive loss . . . . . . . . . . $(2,893)
Balance, December 31, 2009 . . . . . $60 $— $563 $(9,313) $(286) $(8,976) $129
See Notes to the Consolidated Financial Statements.
84

Issued Treasury
AdditionalPaid-InCapital
RetainedEarnings(Deficit)
AccumulatedOther
ComprehensiveIncome (Loss)
TotalStockholders’
Equity(Deficit)
Non-Controlling
InterestsComprehensiveIncome (Loss)
Common Stock/Ordinary Shares
Millions of dollars
PredecessorBalance, December 31, 2009 . . . . . $ 60 $— $ 563 $(9,313) $(286) $ (8,976) $129
Net income (loss) . . . . . . . . . . . — — — 8,564 — 8,564 (60) $8,504Net distributions to non-
controlling interests . . . . . . . . — — — — — — (15) —Financial derivatives, net of tax
of $51 . . . . . . . . . . . . . . . . . . — — — — 90 90 — 90Unrealized gain on held-for-sale
securities held by equityinvestees . . . . . . . . . . . . . . . . — — — — (13) (13) — (13)
Changes in unrecognizedemployee benefits gains andlosses, net of tax of $3 . . . . . . — — — — (48) (48) — (48)
Foreign currency translation netof tax of $(9) . . . . . . . . . . . . . — — — — (25) (25) — (25)
Comprehensive loss . . . . . . . . . . $8,508
Balance, April 30, 2010 . . . . . . . . . 60 — 563 (749) (282) (408) 54Fresh-start reporting adjustments:Elimination of predecessor
common stock, capital surplusand accumulated earnings . . . . (60) — (563) 749 — 126 —
Elimination of predecessoraccumulated othercomprehensive loss . . . . . . . . — — — — 282 282 —
Balance, May 1, 2010, Successor . . $ — $— $ — $ — $ — $ — $ 54
SuccessorBalance May 1, 2010 . . . . . . . . . . $ — $— $ — $ — $ — $ — $ 54
Issuance of class A and class Bordinary shares . . . . . . . . . . . 30 — 9,815 — — 9,845 —Share-based compensation
expense . . . . . . . . . . . . . . . — — 22 — — 22 —Net income . . . . . . . . . . . . . . . . — — — 1,587 — 1,587 (7) $1,580Contributions from non-
controlling interests . . . . . . . . — — — — — — 14 —Unrealized gain on held-for-sale
securities held by equityinvestees . . . . . . . . . . . . . . . . — — — — 1 1 — 1
Changes in unrecognizedemployee benefits gains andlosses, net of tax of ($30) . . . . — — — — (33) (33) — (33)
Foreign currency translation, netof tax of $4 . . . . . . . . . . . . . . — — — — 113 113 — 113
Comprehensive income (loss) . . . $1,661
Balance, December 31, 2010 . . . . . $ 30 $— $9,837 $ 1,587 $ 81 $11,535 $ 61
See Notes to the Consolidated Financial Statements.
85
LYONDELLBASELL INDUSTRIES N.V.
CONSOLIDATED STATEMENTS OF STOCKHOLDERS’ EQUITY (DEFICIT) — (Continued)

LYONDELLBASELL INDUSTRIES N.V.
NOTES TO THE CONSOLIDATED FINANCIAL STATEMENTS
TABLE OF CONTENTS
Page
1. Description of Company and Operations . . . . . . . . . . . . . . . . . . . . . . . . . . . . . . . . . . . . . . . . . . . . 87
2. Summary of Significant Accounting Policies . . . . . . . . . . . . . . . . . . . . . . . . . . . . . . . . . . . . . . . . . 87
3. Emergence from Chapter 11 Proceedings . . . . . . . . . . . . . . . . . . . . . . . . . . . . . . . . . . . . . . . . . . . 93
4. Fresh-Start Accounting . . . . . . . . . . . . . . . . . . . . . . . . . . . . . . . . . . . . . . . . . . . . . . . . . . . . . . . . . 96
5. Business Acquisitions and Dispositions . . . . . . . . . . . . . . . . . . . . . . . . . . . . . . . . . . . . . . . . . . . . . 105
6. Insurance Claims . . . . . . . . . . . . . . . . . . . . . . . . . . . . . . . . . . . . . . . . . . . . . . . . . . . . . . . . . . . . . 106
7. Related Party Transactions . . . . . . . . . . . . . . . . . . . . . . . . . . . . . . . . . . . . . . . . . . . . . . . . . . . . . . 106
8. Short-Term Investments . . . . . . . . . . . . . . . . . . . . . . . . . . . . . . . . . . . . . . . . . . . . . . . . . . . . . . . . 108
9. Accounts Receivable . . . . . . . . . . . . . . . . . . . . . . . . . . . . . . . . . . . . . . . . . . . . . . . . . . . . . . . . . . 108
10. Inventories . . . . . . . . . . . . . . . . . . . . . . . . . . . . . . . . . . . . . . . . . . . . . . . . . . . . . . . . . . . . . . . . . . 109
11. Property, Plant and Equipment, Goodwill, Intangible and Other Assets . . . . . . . . . . . . . . . . . . . . . . 110
12. Investment in PO Joint Ventures . . . . . . . . . . . . . . . . . . . . . . . . . . . . . . . . . . . . . . . . . . . . . . . . . . 113
13. Equity Investments . . . . . . . . . . . . . . . . . . . . . . . . . . . . . . . . . . . . . . . . . . . . . . . . . . . . . . . . . . . . 115
14. Accrued Liabilities . . . . . . . . . . . . . . . . . . . . . . . . . . . . . . . . . . . . . . . . . . . . . . . . . . . . . . . . . . . . 118
15. Debt . . . . . . . . . . . . . . . . . . . . . . . . . . . . . . . . . . . . . . . . . . . . . . . . . . . . . . . . . . . . . . . . . . . . . . 11816. Lease Commitments . . . . . . . . . . . . . . . . . . . . . . . . . . . . . . . . . . . . . . . . . . . . . . . . . . . . . . . . . . . 123
17. Financial Instruments and Derivatives . . . . . . . . . . . . . . . . . . . . . . . . . . . . . . . . . . . . . . . . . . . . . . 124
18. Pension and Other Postretirement Benefits . . . . . . . . . . . . . . . . . . . . . . . . . . . . . . . . . . . . . . . . . . 131
19. Incentive and Share-Based Compensation . . . . . . . . . . . . . . . . . . . . . . . . . . . . . . . . . . . . . . . . . . . 147
20. Income Taxes . . . . . . . . . . . . . . . . . . . . . . . . . . . . . . . . . . . . . . . . . . . . . . . . . . . . . . . . . . . . . . . . 151
21. Commitments and Contingencies . . . . . . . . . . . . . . . . . . . . . . . . . . . . . . . . . . . . . . . . . . . . . . . . . 157
22. Stockholders’ Equity (Deficit) and Non-Controlling Interests . . . . . . . . . . . . . . . . . . . . . . . . . . . . . 160
23. Per Share Data . . . . . . . . . . . . . . . . . . . . . . . . . . . . . . . . . . . . . . . . . . . . . . . . . . . . . . . . . . . . . . . 162
24. Segment and Related Information . . . . . . . . . . . . . . . . . . . . . . . . . . . . . . . . . . . . . . . . . . . . . . . . . 163
25. Unaudited Quarterly Results . . . . . . . . . . . . . . . . . . . . . . . . . . . . . . . . . . . . . . . . . . . . . . . . . . . . . 168
26. Subsequent Events . . . . . . . . . . . . . . . . . . . . . . . . . . . . . . . . . . . . . . . . . . . . . . . . . . . . . . . . . . . . 169
86

1. Description of Company and Operations
LyondellBasell Industries N.V. is a limited liability company (Naamloze Vennootschap) incorporatedunder Dutch law by deed of incorporation dated October 15, 2009. LyondellBasell Industries N.V. was formedto serve as the parent holding company for certain subsidiaries of LyondellBasell Industries AF S.C.A.(together with its subsidiaries, “LyondellBasell AF,” the “Predecessor Company” or the “Predecessor”) aftercompletion of proceedings under chapter 11 (“chapter 11”) of title 11 of the United States Bankruptcy Code(the “U.S. Bankruptcy Code”). LyondellBasell Industries AF S.C.A. and 93 of its subsidiaries were debtors(“the Debtors”) in jointly administered bankruptcy cases (the “Bankruptcy Cases”) in the United StatesBankruptcy Court in the Southern District of New York (the “Bankruptcy Court”). As of April 30, 2010 (the“Emergence Date”), LyondellBasell Industries AF S.C.A.’s equity interests in its indirect subsidiariesterminated and LyondellBasell Industries N.V. now owns and operates, directly and indirectly, substantially thesame business as LyondellBasell Industries AF S.C.A. owned and operated prior to emergence from theBankruptcy Cases, which business includes subsidiaries of LyondellBasell Industries AF S.C.A. that were notinvolved in the Bankruptcy Cases. LyondellBasell Industries N.V. is the successor to the combination inDecember 2007 of Lyondell Chemical Company (“Lyondell Chemical”) and Basell AF S.C.A. (“Basell”),which created one of the world’s largest private petrochemical companies with significant worldwide scale andleading product positions. LyondellBasell Industries AF S.C.A. is no longer part of the LyondellBasell group.
LyondellBasell Industries N.V., together with its consolidated subsidiaries (collectively “LyondellBasellN.V.,” the “Successor Company” or the “Successor”), is a worldwide manufacturer of chemicals and polymers,a refiner of crude oil, a significant producer of gasoline blending components and a developer and licensor oftechnologies for production of polymers. When we use the terms “LyondellBasell N.V.,” the “SuccessorCompany,” the “Successor,” “we,” “us,” “our” or similar words, unless the context otherwise requires, we arereferring to LyondellBasell N.V. after April 30, 2010. References herein to the “Company” for periods throughApril 30, 2010 are to the Predecessor Company, LyondellBasell AF, and for periods after the Emergence Date,to the Successor Company, LyondellBasell N.V.
LyondellBasell Industries AF S.C.A. was formed in the Grand Duchy of Luxembourg as a corporatepartnership limited by shares in April 2005 by BI S.à.r.l., a Luxembourg private limited liability company,affiliated with Access Industries (“Access Industries”), which is a privately held industrial group based in theUnited States (“U.S.”). On July 2, 2009, Nell Limited (“Nell”), an affiliate of Access Industries and theindirect owner of 100% of the share capital of LyondellBasell AF, transferred its indirect ownership interest inLyondellBasell AF to Prochemie GmbH (“Prochemie”), a wholly owned subsidiary of ProChemie HoldingLtd. (“ProChemie Holding”). As of July 2, 2009, Nell and ProChemie Holding each owned 50% of Prochemie,which owned 100% of the share capital of LyondellBasell AF.
2. Summary of Significant Accounting Policies
Basis of Presentation — The accompanying consolidated financial statements have been prepared fromthe books and records of LyondellBasell N.V. and its majority-owned subsidiaries after April 30, 2010 andLyondellBasell AF and its majority-owned subsidiaries for periods up to and including that date underaccounting principles generally accepted in the U.S. (“U.S. GAAP”). All inter company transactions andbalances have been eliminated in consolidation.
87
LYONDELLBASELL INDUSTRIES N.V.
NOTES TO THE CONSOLIDATED FINANCIAL STATEMENTS — (Continued)

2. Summary of Significant Accounting Policies — (Continued)
The Company identified adjustments in its opening fresh start balance sheet as a result of deferred taxliabilities either omitted or included in error. These amounts in the aggregate were not material to thePredecessor period or the fresh start opening balance sheet. However, the Company has revised its consolidatedfinancial statements for the four months ending April 30, 2010 to correct for an overstatement of goodwill anddeferred income taxes with corresponding adjustments to Reorganization items and Benefit from income taxesresulting from these errors as follows:
As PreviouslyReported Adjustment Revised
Predecessor
Millions of dollars
Statement of IncomeReorganization items . . . . . . . . . . . . . . . . . . . . . . . . . . . . . . . $ 8,010 $(430) $ 7,580
Income from continuing operations before income taxes . . . . . 7,813 (430) 7,383
Benefit from income taxes . . . . . . . . . . . . . . . . . . . . . . . . . . . (693) (430) (1,123)Net income . . . . . . . . . . . . . . . . . . . . . . . . . . . . . . . . . . . . . . 8,504 — 8,504
Statement of Cash FlowsReorganization items . . . . . . . . . . . . . . . . . . . . . . . . . . . . . . . (8,010) 430 (7,580)
Deferred income taxes . . . . . . . . . . . . . . . . . . . . . . . . . . . . . . (610) (519) (1,129)
Other* . . . . . . . . . . . . . . . . . . . . . . . . . . . . . . . . . . . . . . . . . . (761) 76 (685)
Net cash used in operating activities . . . . . . . . . . . . . . . . . . . . (936) — (936)
* The adjustment for Other includes the reclassification of $9 million to Asset impairments and $4 million toGain (loss) on sale of assets to conform to classifications at December 31, 2010.
Amounts presented in Note 4 changed as follows:
Balance SheetGoodwill . . . . . . . . . . . . . . . . . . . . . . . . . . . . . . . . . . . . . . . . . . . . . . . . 1,098 (314) 784
Total assets . . . . . . . . . . . . . . . . . . . . . . . . . . . . . . . . . . . . . . . . . . . . . . 24,312 (314) 23,998
Deferred income taxes . . . . . . . . . . . . . . . . . . . . . . . . . . . . . . . . . . . . . . 920 (314) 606
Total liabilities and equity . . . . . . . . . . . . . . . . . . . . . . . . . . . . . . . . . . . 24,312 (314) 23,998
Investments in joint ventures where we exert a certain level of management control, but lack full decisionmaking ability over all major issues, are accounted for using the equity method. Under those circumstances,the equity method is used even though our ownership percentage may exceed 50%.
The Accounting Policies of LyondellBasell N.V. in the Successor period are as follows:
Fresh Start Accounting — In accordance with Financial Accounting Standards Board (“FASB”) Account-ing Standards Codification (“ASC”) Topic 852, Reorganizations, (“ASC 852”), we applied “fresh-start”accounting as of May 1, 2010. Fresh-start accounting requires us to initially record the assets and liabilities attheir fair value based on the Company’s reorganization value. Reorganization value is the fair value of theemerged entity before considering liabilities. The Debtors’ reorganization proceedings associated with theiremergence from bankruptcy resulted in a new reporting entity. Financial information presented for theSuccessor is on a basis different from, and is therefore not comparable to, financial information for thePredecessor. The Predecessor information in the financial statements is for periods through April 30, 2010,including the impact of plan of reorganization provisions and the adoption of fresh-start accounting. Foradditional information on fresh-start accounting, see Note 4.
88
LYONDELLBASELL INDUSTRIES N.V.
NOTES TO THE CONSOLIDATED FINANCIAL STATEMENTS — (Continued)

2. Summary of Significant Accounting Policies — (Continued)
Revenue Recognition — Revenue from product sales is recognized at the time of transfer of title and riskof loss to the customer, which usually occurs at the time of shipment. Revenue is recognized at the time ofdelivery if we retain the risk of loss during shipment. For products that are shipped on a consignment basis,revenue is recognized when the customer uses the product. Costs incurred in shipping products sold areincluded in cost of sales. Billings to customers for shipping costs are included in sales revenue.
With respect to licensing contracts we recognize revenue on a contract-by-contract basis when wedetermine that we have sold our product or rendered service. For proven technologies for which we arecontractually entitled to receive the vast majority of the contract value in cash at or before the date ofcustomer acceptance, we will generally recognize revenue at the date of delivery of the process design packageand the related license, provided that the undelivered items are considered inconsequential or perfunctory.Revenue for remaining perfunctory items for these contracts is recognized when the uncertainties are resolved.For contracts involving unproven process technology or post-delivery technical assistance that is not consideredinconsequential or perfunctory, we recognize revenue at the date of customer acceptance up to the amount offixed fees due at customer acceptance date. Future fixed fees for these contracts are recognized when theuncertainties are resolved. Royalties under these contracts are recognized when earned, typically based onproduction volumes.
Research and Development — Research and Development (“R&D”) costs are expensed when incurred.Subsidies for research and development are included in Other income. Depreciation expense related to R&Dassets is included as a cost of R&D. To the extent the purchase price in a business combination is allocated toin-process research and development assets, those assets are capitalized at fair value as an intangible assetwith an indefinite life. When the related R&D project is abandoned, the assets are impaired and when therelated R&D project activities are completed, we make a determination of the useful lives and amortize thoseassets over their useful lives.
Cash and Cash Equivalents — Cash equivalents consist of highly liquid debt instruments such ascertificates of deposit, commercial paper and money market accounts. Cash equivalents include instrumentswith maturities of three months or less when acquired. Cash equivalents are stated at cost, which approximatesfair value. Cash and cash equivalents exclude restricted cash. Our cash equivalents are placed in high-qualitycommercial paper, money market funds and time deposits with major international banks and financialinstitutions.
We have no requirements for compensating balances in a specific amount at a specific point in time. Wemaintain compensating balances for some of our banking services and products. Such balances are maintainedon an average basis and are solely at our discretion.
Allowance for Doubtful Accounts — We establish provisions for doubtful accounts receivable based onour estimates of amounts that we believe are unlikely to be collected. Collectability of receivables is reviewedand the allowance for doubtful accounts is adjusted at least quarterly, based on aging of specific accounts andother available information about the associated customers. Provisions for an allowance for doubtful accountsare included in selling, general and administrative expenses.
Inventories — Inventories are carried at the lower of current market value or cost. Cost is determinedusing the last-in, first-out (“LIFO”) method for raw materials, work in progress (“WIP”) and finished goods,and the moving average cost method for materials and supplies.
Inventory exchange transactions, which involve fungible commodities and do not involve the payment orreceipt of cash, are not accounted for as purchases and sales. Any resulting volumetric exchange balances areaccounted for as inventory, with cost determined using the LIFO method.
89
LYONDELLBASELL INDUSTRIES N.V.
NOTES TO THE CONSOLIDATED FINANCIAL STATEMENTS — (Continued)

2. Summary of Significant Accounting Policies — (Continued)
Property, Plant and Equipment — Property, plant and equipment was recorded at fair value at emergenceand then at cost subsequently. Depreciation is computed using the straight-line method over the estimateduseful asset lives, generally up to 25 years for major manufacturing equipment, 30 years for buildings, 5 to15 years for light equipment and instrumentation, 15 years for office furniture and 3 to 5 years for informationsystem equipment. Upon retirement or sale, we remove the cost of the asset and the related accumulateddepreciation from the accounts and reflect any resulting gain or loss in the Consolidated Statements of Income.Our policy is to capitalize interest cost incurred on debt during the construction of major projects exceedingone year.
Costs of major maintenance and repairs incurred as part of turnarounds of major units at our manufactur-ing facilities are deferred and amortized using the straight-line method over the period until the next plannedturnaround, predominantly 4 to 7 years. These costs are necessary to maintain, extend and improve theoperating capacity and efficiency rates of the production units.
Long-Lived Asset Impairment — We evaluate long-lived assets, including identifiable intangible assets, forimpairment whenever events or changes in circumstances indicate that the carrying amount of an asset maynot be recoverable. When it is probable that undiscounted future cash flows will not be sufficient to recover anasset’s carrying amount, the asset is written down to its estimated fair value.
Goodwill — We recorded goodwill upon application of fresh-start accounting (see Note 4). Goodwill isnot amortized, but is tested for impairment annually during the fourth quarter, or sooner if events or changesin circumstances indicate the carrying amount may exceed fair value. Recoverability is determined bycomparing the estimated fair value of a reporting unit to the carrying value, including the related goodwill, ofthat reporting unit. We use the present value of expected net cash flows to determine the estimated fair valueof the reporting units. The impairment test requires us to make cash flow assumptions including, among otherthings, future margins, volumes, operating costs, capital expenditures, growth rates and discount rates. Ourassumptions regarding future margins and volumes require significant judgment as actual margins and volumeshave fluctuated in the past and will likely continue to do so.
Identifiable Intangible Assets — Costs to purchase and to develop software for internal use are deferredand amortized over periods of 3 to 10 years. Other intangible assets were stated at fair value at emergence andcarried at cost or amortized cost subsequently. Such assets primarily consist of emission allowances, variouscontracts, and in-process research and development. These assets are amortized using the straight-line methodover their estimated useful lives or over the term of the related agreement, if shorter.
Environmental Remediation Costs — Anticipated expenditures related to investigation and remediation ofcontaminated sites, which include current and former plant sites and other remediation sites, are accrued whenit is probable a liability has been incurred and the amount of the liability can reasonably be estimated. Onlyongoing operating and monitoring costs, the timing of which can be determined with reasonable certainty, arediscounted to present value. Future legal costs associated with such matters, which generally are not estimable,are not included in these liabilities.
Legal Costs — We expense legal costs, including those incurred in connection with loss contingencies, asincurred.
Income Taxes — Deferred income taxes reflect the net tax effects of temporary differences between thecarrying amounts of assets and liabilities for financial reporting purposes and the amounts used for income taxpurposes, as well as the net tax effects of net operating loss carryforwards. Valuation allowances are providedagainst deferred tax assets when it is more likely than not that some portion or all of the deferred tax assetwill not be realized.
90
LYONDELLBASELL INDUSTRIES N.V.
NOTES TO THE CONSOLIDATED FINANCIAL STATEMENTS — (Continued)

2. Summary of Significant Accounting Policies — (Continued)
We recognize the financial statement effects of an uncertain income tax position when it is more likelythan not, based on the technical merits, that the position will be sustained upon examination. We accrue forother tax contingencies when it is probable that a liability to a taxing authority has been incurred and theamount of the contingency can be reasonably estimated.
Liabilities Subject to Compromise — Pursuant to U.S. GAAP, certain pre-petition liabilities of the Debtorshave been reclassified as of December 31, 2009, to long-term liabilities on the accompanying consolidatedbalance sheets as liabilities subject to compromise (see Note 3). Liabilities subject to compromise included theDebtors’ long-term debt that was considered undersecured and amounts that were due from the Debtors tovendors and employees for goods and services received prior to the January 6, 2009, April 24, 2009 andMay 8, 2009 petition dates and include damage claims created by the Debtors’ rejection of executorycontracts. The Debtors recognized claims at the probable allowed amounts. Claims for rejected contracts wererecorded at the earlier of default by the Debtors under the contract or notification to the U.S. BankruptcyCourt of rejection. Liabilities subject to compromise were distinguished from pre-petition liabilities of theDebtors estimated to be fully secured, post-petition liabilities of the Debtors and liabilities of the non-Debtorsfor all of which the balance sheet classification was unchanged.
Stock-Based Compensation — The Company grants stock-based compensation awards that vest over aspecified period or upon employees meeting certain service criteria. The fair value of equity instruments issuedto employees is measured on the grant date and is recognized over the vesting period.
Non controlling interests — Non-controlling interests primarily represent the interests of unaffiliatedinvestors in a partnership that owns our PO/SM II plant at the Channelview, Texas complex and a subsidiaryowning an equity investment in the Al-Waha Petrochemicals Ltd. joint venture.
Foreign Currency Translation — Our reporting currency for the accompanying financial statements is theU.S. dollar. We have significant operations in several countries of which functional currencies are primarilythe U.S. dollar for U.S. operations and the Euro for operations in Europe.
Adjustments resulting from the process of translating foreign functional currency financial statements areincluded in Accumulated other comprehensive income (loss) in Stockholders’ equity. Foreign currencytransaction gains and losses are included in current earnings.
Financial Instruments and Derivatives — We selectively enter into derivative transactions to managevolatility related to market risks associated with changes in commodity pricing, currency exchange rates andinterest rates. We categorize assets and liabilities, measured at fair value, into one of three different levelsdepending on the observability of the inputs employed in the measurement. Level 1 inputs are quoted prices inactive markets for identical assets or liabilities. Level 2 inputs are observable inputs other than quoted pricesincluded within Level 1 for the asset or liability, either directly or indirectly through market corroboratedinputs. Level 3 inputs are unobservable inputs for the asset or liability reflecting significant modifications toobservable related market data or our assumptions about pricing by market participants. For a discussionrelated to financial instruments and derivatives policies, see Note 17.
Use of Estimates — The preparation of financial statements in conformity with generally acceptedaccounting principles requires management to make estimates and assumptions that affect the reportedamounts of assets and liabilities, the disclosure of contingent assets and liabilities at the date of the financialstatements, and the reported amounts of revenues and expenses during the reporting periods. Actual resultscould differ from those estimates.
Classification — Our consolidated financial statements classify precious metals and catalysts as compo-nents of Property, plant and equipment. Catalysts and precious metals were previously reported by the
91
LYONDELLBASELL INDUSTRIES N.V.
NOTES TO THE CONSOLIDATED FINANCIAL STATEMENTS — (Continued)

2. Summary of Significant Accounting Policies — (Continued)
Predecessor as Intangible assets and Other assets, respectively. Debt issuance costs, which were previouslyreported as Intangible assets, net, by the Predecessor, are classified as Other assets by the Successor.
The accounting policies of LyondellBasell A.F. in the Predecessor period were the same as for theSuccessor period except as follows:
Inventories — Inventories are carried at the lower of current market value or cost. Cost is determinedusing the FIFO method, except for certain U.S. inventories for which cost is required to be determined usingthe LIFO method, and the average cost method for materials and supplies.
New Accounting Standards
Business Combinations — In December 2010, the FASB issued guidance related to ASC Topic 805,Business Combinations, to clarify that if a public entity presents comparative financial statements, the entityshould disclose pro-forma revenue and earnings of the combined entity as though the business combination(s)that occurred during the current year had occurred as of the beginning of the comparable prior annualreporting period only. This guidance also expands the supplemental pro forma disclosures to include adescription of the nature and amount of material, nonrecurring pro forma adjustments directly attributable tothe business combination included in the reported pro forma revenue and earnings. This guidance is effectiveprospectively for business combinations for which the acquisition date is on or after the beginning of the firstannual reporting period beginning on or after December 15, 2010. Early adoption is permitted. Adoption ofthis amendment is not expected to have a material effect on our consolidated financial statements.
Goodwill — In December 2010, the FASB issued guidance related to ASC Topic 350, Intangibles —Goodwill and Other, to require a company with reporting units having a carrying amount of zero or less toperform Step 2 of the goodwill impairment test if it is more likely than not that a goodwill impairment exists.This guidance is effective for fiscal years, and interim periods within those years, beginning December 15,2010. Early adoption is not permitted. Adoption of this amendment is not expected to have a material effecton our consolidated financial statements.
Pension and Other Post Retirement Benefits — In September 2010, the FASB issued guidance related toASC Topic 962, Plan Accounting — Defined Contribution Pension Plans, to clarify how loans to participantsshould be classified and measured by defined contribution pension benefit plans. The guidance requires thatparticipant loans be classified as notes receivable from participants, which are segregated from planinvestments and measured at their unpaid principal balance, plus any accrued but unpaid interest. Thisguidance is effective for fiscal years ending after December 15, 2010, and should be applied retrospectively toall prior periods presented. Early adoption is permitted. Adoption of this amendment is not expected to have amaterial effect on our consolidated financial statements.
Revenue Recognition — In April 2010, the FASB issued additional guidance on the criteria that should bemet for determining whether the milestone method of revenue recognition is appropriate. Under this guidance,a vendor can recognize consideration that is contingent upon achievement of a milestone in its entirety asrevenue in the period in which the milestone is achieved only if the milestone meets all criteria to beconsidered substantive. Our adoption of this amendment effective July 1, 2010 did not have a material effecton our consolidated financial statements.
In October 2009, the FASB ratified the consensus reached by its emerging issues task force to requirecompanies to allocate revenue in multiple-element arrangements based on the estimated selling price of anelement if vendor-specific or other third-party evidence of value is not available. The adoption of thesechanges, in January 2011, will not have a material effect on our consolidated financial statements.
92
LYONDELLBASELL INDUSTRIES N.V.
NOTES TO THE CONSOLIDATED FINANCIAL STATEMENTS — (Continued)

2. Summary of Significant Accounting Policies — (Continued)
Income Taxes — In April 2010, the FASB issued additional guidance on accounting for certain tax effectsof the 2010 Health Care Reforms Act. The guidance requires entities to recognize the impact of changes in taxlaw in continuing operations in the Consolidated Statements of Income for the period that includes theenactment date. The adoption of these changes in March 2010 did not have a material effect on the Company’sconsolidated financial statements.
Fair Value Measurement — In January 2010, the FASB issued additional guidance on improvingdisclosures regarding fair value measurements. The guidance requires the disclosure of the amounts of, and therationale for, significant transfers between Level 1 and Level 2 of the fair value hierarchy, as well as therationale for transfers in or out of Level 3. We have adopted all of the amendments regarding fair valuemeasurements except for a requirement to disclose information about purchases, sales, issuances, andsettlements in the reconciliation of recurring Level 3 measurements on a gross basis. The requirement toseparately disclose purchases, sales, issuances, and settlements of recurring Level 3 measurements beginningin 2011 will not have a material impact on our consolidated financial statements.
Transfer and Servicing — In June 2009, the FASB revised the requirements for accounting for transfers offinancial assets. These revisions eliminate the concept of a “qualifying special-purpose entity,” change therequirements for de-recognizing financial assets, and require additional disclosures regarding transfers offinancial assets, securitization transactions, and exposures to risks related to transferred financial assets. Thesechanges were effective for the Company beginning in 2010. The adoption of these changes did not have amaterial effect on the Company’s consolidated financial statements.
3. Emergence from Chapter 11 Proceedings
On April 23, 2010, the U.S. Bankruptcy Court confirmed LyondellBasell AF’s Third Amended andRestated Plan of Reorganization and the Debtors emerged from chapter 11 protection on April 30, 2010.
As a result of the emergence from chapter 11 proceedings, certain prepetition liabilities against theDebtors were discharged to the extent set forth in the Plan of Reorganization and otherwise applicable law andthe Debtors were permitted to make distributions to their creditors in accordance with the terms of the Plan ofReorganization.
General unsecured non-priority claims against the Debtors were addressed through the bankruptcy processand were reported as liabilities subject to compromise and adjusted to the estimated allowed claim amount asdetermined through the bankruptcy process if determined to be probable and estimable. Certain of these claimswere resolved and satisfied on or before the Debtors’ emergence on April 30, 2010. Except for certain specificnon-priority claims, the unsecured non-priority claims were resolved as part of the Plan of Reorganization.
Under the Plan of Reorganization, the organizational structure of the Company in North America wassimplified by the removal of 90 legal entities. The ultimate ownership of 49 of these entities (identified asSchedule III Debtors in the Plan) was transferred to a new owner, the Millennium Custodial Trust, a trustestablished for the benefit of certain creditors, and these entities are no longer part of LyondellBasell N.V. Inaddition, certain real properties owned by the Debtors, including the Schedule III Debtors (as defined in thePlan), were transferred to the Environmental Custodial Trust, which now owns and is responsible for theseproperties. Any associated liabilities of the entities transferred to and owned by the Millennium CustodialTrust are the responsibility of those entities and claims regarding those entities will be resolved solely usingtheir assets and the assets of the trust. In total, $250 million of cash was used to fund the two trusts, includingapproximately $80 million to the Millennium Custodial Trust and approximately $170 million to fund theEnvironmental Custodial Trust and to make certain direct payments to the U.S. EPA and certain stateenvironmental agencies.
93
LYONDELLBASELL INDUSTRIES N.V.
NOTES TO THE CONSOLIDATED FINANCIAL STATEMENTS — (Continued)

3. Emergence from Chapter 11 Proceedings — (Continued)
As part of the Debtors’ emergence from chapter 11 proceedings, approximately 563.9 million shares ofcommon stock of LyondellBasell N.V. were issued under the Plan, including 300 million shares of class Aordinary shares issued in exchange for allowed claims under the Plan of Reorganization. Approximately263.9 million shares of LyondellBasell N.V. class B ordinary shares were issued in connection with a rightsoffering for gross proceeds of $2.8 billion.
Pursuant to the Plan of Reorganization, administrative and priority claims, as well as the new moneydebtor-in-possession (“DIP”) financing, were repaid in full. The lenders of certain DIP loans, whichrepresented a dollar-for-dollar roll-up or conversion of previously outstanding senior secured loans (“DIPRoll-up Notes”), received new senior secured third lien notes in the same principal amount as the DIP Roll-upNotes. In accordance with the Plan of Reorganization, holders of senior secured claims received a combinationof LyondellBasell N.V. class A ordinary shares; rights to purchase class B ordinary shares of LyondellBasellN.V.; LyondellBasell N.V. stock warrants; and cash. Allowed general unsecured claims received a combinationof cash and class A ordinary shares of LyondellBasell N.V. pursuant to the Amended Lender LitigationSettlement approved by the U.S. Bankruptcy Court on March 11, 2010.
In conjunction with the Debtors’ emergence from chapter 11, LyondellBasell N.V., through its whollyowned subsidiary, LBI Escrow Corporation, (“LBI Escrow”) issued $3.25 billion of first priority debt,including $2.25 billion and A375 million offerings of senior secured notes in a private placement andborrowings of $500 million under a senior term loan facility. Upon emergence, LBI Escrow merged with andinto Lyondell Chemical Company (“Lyondell Chemical”), which replaced LBI Escrow as the issuer of thesenior secured notes and as borrower under the term loan. On April 30, 2010, Lyondell Chemical issued$3,240 million of Senior Secured 11% Notes due 2018 (the “Senior Secured 11% Notes”) in exchange for DIPRoll-up Notes incurred as part of the debtor-in-possession financing. The net proceeds from the sale of thesenior secured notes, together with borrowings under the term loan, a new European securitization facility, andproceeds from the $2.8 billion rights offering, were used to repay and replace certain existing debt, includingthe debtor-in-possession credit facilities and an existing European securitization facility, and to make certainrelated payments. In addition, we entered into a new $1,750 million U.S. asset-based revolving credit facility,which can be used for advances or to issue up to $700 million of letters of credit. For additional informationon the Company’s debt, see Note 15.
Liabilities Subject to Compromise — Certain prepetition liabilities subject to compromise were reported atthe expected allowed amount, even if they could potentially be settled for lesser amounts in accordance withthe terms of the Plan of Reorganization. The total amount to be paid by the Debtors to settle claims is fixedunder the Plan of Reorganization. As a result, all of the Debtors’ liabilities subject to compromise at April 30,2010 have been effectively resolved at the Emergence Date. As of December 31, 2010, approximately$98 million of priority and administrative claims have yet to be paid.
94
LYONDELLBASELL INDUSTRIES N.V.
NOTES TO THE CONSOLIDATED FINANCIAL STATEMENTS — (Continued)

3. Emergence from Chapter 11 Proceedings — (Continued)
Liabilities subject to compromise included in the Predecessor’s balance sheet consist of the following:
April 30,2010
December 31,2009
Predecessor
Millions of dollars
Accounts payable . . . . . . . . . . . . . . . . . . . . . . . . . . . . . . . . . . . . . . . . . . . $ 473 $ 602
Employee benefits . . . . . . . . . . . . . . . . . . . . . . . . . . . . . . . . . . . . . . . . . . . 994 997
Accrued interest . . . . . . . . . . . . . . . . . . . . . . . . . . . . . . . . . . . . . . . . . . . . 295 277
Conversion fee — Interim Loan . . . . . . . . . . . . . . . . . . . . . . . . . . . . . . . . . 161 161
Estimated claims . . . . . . . . . . . . . . . . . . . . . . . . . . . . . . . . . . . . . . . . . . . . 1,392 1,726
Interest rate swap obligations . . . . . . . . . . . . . . . . . . . . . . . . . . . . . . . . . . . 218 201
Related party payable . . . . . . . . . . . . . . . . . . . . . . . . . . . . . . . . . . . . . . . . — 82
Other accrued liabilities . . . . . . . . . . . . . . . . . . . . . . . . . . . . . . . . . . . . . . . 102 78
Long-term debt . . . . . . . . . . . . . . . . . . . . . . . . . . . . . . . . . . . . . . . . . . . . . 18,310 18,370
Total liabilities subject to compromise . . . . . . . . . . . . . . . . . . . . . . . . . . $21,945 $22,494
The April 30, 2010 liabilities subject to compromise in the above table represent such liabilitiesimmediately prior to their discharge in accordance with the Plan of Reorganization.
The Plan of Reorganization required that, upon emergence, certain liabilities previously reported asliabilities subject to compromise be retained by LyondellBasell N.V. Accordingly, on the Emergence Date,approximately $854 million of pension and other post-retirement benefit liabilities, included in employeebenefits in the above table, were reclassified from liabilities subject to compromise to current or long-termliabilities, as appropriate.
Long-term debt classified as liabilities subject to compromise immediately prior to the Debtors’emergence from bankruptcy included amounts outstanding under the Interim Loan; the Senior Secured CreditFacility, including the Term Loan A U.S. Dollar tranche, the U.S. dollar and German tranches of Term Loan Band the Revolving Credit Facility; 10.25% Debentures due 2010; 9.8% Debentures due 2020; 7.55% Deben-tures due 2026; the Senior Notes due 2015; 7.625% Senior Debentures due 2026; and loans from the State ofMaryland and KIC Ltd.
All of the long-term debt classified in liabilities subject to compromise at April 30, 2010, except for a$6 million loan from KIC Ltd., was discharged pursuant to the Plan of Reorganization through distributions ofa combination of LyondellBasell N.V. class A ordinary shares, the rights to purchase class B ordinary sharesof LyondellBasell N.V. in a rights offering, warrants to purchase class A ordinary shares of LyondellBasellN.V. and cash. The loan from KIC Ltd. was transferred to the Millennium Custodial Trust under the Plan ofReorganization.
Reorganization Items — Reorganization items, including professional advisory fees and other costsdirectly associated with our reorganization, recognized by the Debtors since the January 6, 2009 bankruptcyare classified as Reorganization items on the Consolidated Statements of Income.
Post-emergence reorganization items are primarily related to professional fees associated with claimsettlements, plan implementation and other transition costs attributable to the reorganization. Pre-emergencereorganization items include provisions and adjustments to record the carrying value of certain pre-petitionliabilities at their estimated allowable claim amounts, as well as the costs incurred by non-Debtor companiesas a result of the Debtors’ chapter 11 proceedings.
95
LYONDELLBASELL INDUSTRIES N.V.
NOTES TO THE CONSOLIDATED FINANCIAL STATEMENTS — (Continued)
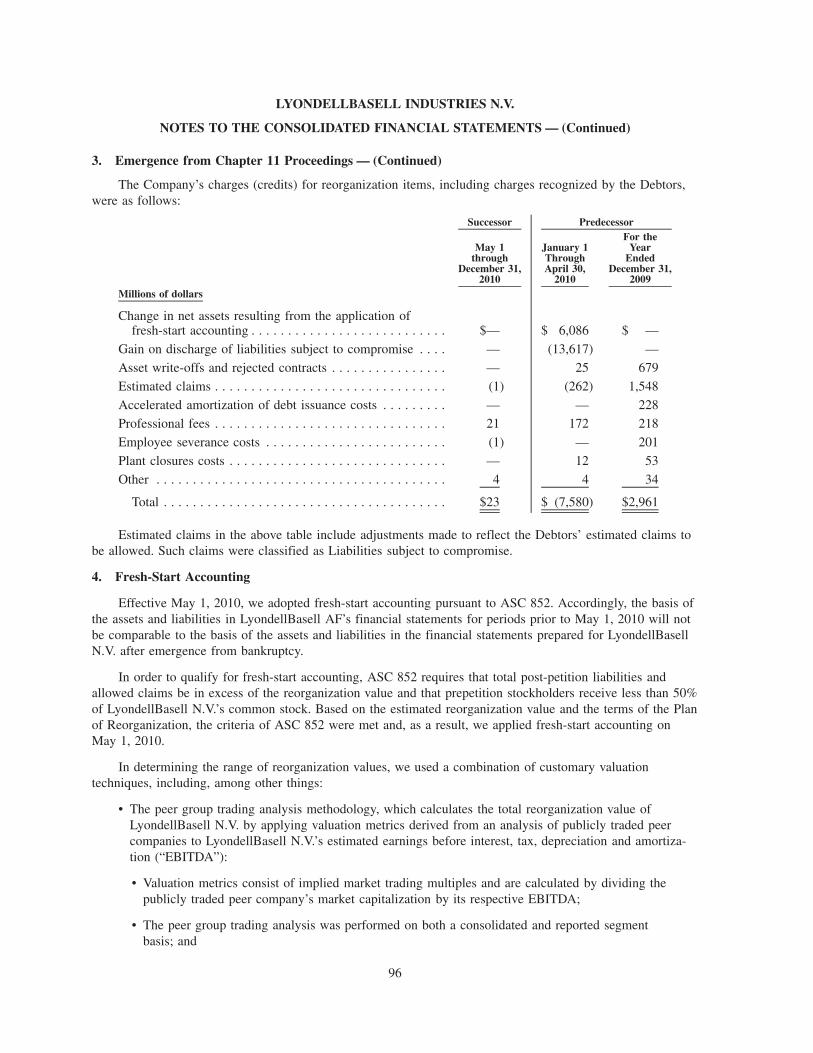
3. Emergence from Chapter 11 Proceedings — (Continued)
The Company’s charges (credits) for reorganization items, including charges recognized by the Debtors,were as follows:
May 1through
December 31,2010
January 1ThroughApril 30,
2010
For theYear
EndedDecember 31,
2009
Successor Predecessor
Millions of dollars
Change in net assets resulting from the application offresh-start accounting . . . . . . . . . . . . . . . . . . . . . . . . . . . $— $ 6,086 $ —
Gain on discharge of liabilities subject to compromise . . . . — (13,617) —
Asset write-offs and rejected contracts . . . . . . . . . . . . . . . . — 25 679
Estimated claims . . . . . . . . . . . . . . . . . . . . . . . . . . . . . . . . (1) (262) 1,548
Accelerated amortization of debt issuance costs . . . . . . . . . — — 228
Professional fees . . . . . . . . . . . . . . . . . . . . . . . . . . . . . . . . 21 172 218
Employee severance costs . . . . . . . . . . . . . . . . . . . . . . . . . (1) — 201
Plant closures costs . . . . . . . . . . . . . . . . . . . . . . . . . . . . . . — 12 53
Other . . . . . . . . . . . . . . . . . . . . . . . . . . . . . . . . . . . . . . . . 4 4 34
Total . . . . . . . . . . . . . . . . . . . . . . . . . . . . . . . . . . . . . . . $23 $ (7,580) $2,961
Estimated claims in the above table include adjustments made to reflect the Debtors’ estimated claims tobe allowed. Such claims were classified as Liabilities subject to compromise.
4. Fresh-Start Accounting
Effective May 1, 2010, we adopted fresh-start accounting pursuant to ASC 852. Accordingly, the basis ofthe assets and liabilities in LyondellBasell AF’s financial statements for periods prior to May 1, 2010 will notbe comparable to the basis of the assets and liabilities in the financial statements prepared for LyondellBasellN.V. after emergence from bankruptcy.
In order to qualify for fresh-start accounting, ASC 852 requires that total post-petition liabilities andallowed claims be in excess of the reorganization value and that prepetition stockholders receive less than 50%of LyondellBasell N.V.’s common stock. Based on the estimated reorganization value and the terms of the Planof Reorganization, the criteria of ASC 852 were met and, as a result, we applied fresh-start accounting onMay 1, 2010.
In determining the range of reorganization values, we used a combination of customary valuationtechniques, including, among other things:
• The peer group trading analysis methodology, which calculates the total reorganization value ofLyondellBasell N.V. by applying valuation metrics derived from an analysis of publicly traded peercompanies to LyondellBasell N.V.’s estimated earnings before interest, tax, depreciation and amortiza-tion (“EBITDA”):
• Valuation metrics consist of implied market trading multiples and are calculated by dividing thepublicly traded peer company’s market capitalization by its respective EBITDA;
• The peer group trading analysis was performed on both a consolidated and reported segmentbasis; and
96
LYONDELLBASELL INDUSTRIES N.V.
NOTES TO THE CONSOLIDATED FINANCIAL STATEMENTS — (Continued)

4. Fresh-Start Accounting — (Continued)
• Public peer companies were selected based on their comparability to LyondellBasell N.V.’s reportableoperating segments, with those comparable companies primarily operating in the diversified commod-ity chemicals, refining and technology businesses.
• Discounted cash flow valuation methodology, which calculates the reorganization value of LyondellBa-sell N.V. as the sum of the present value of its projected unlevered, after-tax free cash flows. Theresulting reorganization valuation is representative of LyondellBasell N.V. on a cash-free, debt-freebasis:
• Financial projections beginning May 1, 2010 were estimated based on a 4-year and 8-month detailedforecast followed with a higher level 10-year forecast. These projections reflected certain economicand industry information relevant to the operating businesses of LyondellBasell N.V. and estimatedcyclical trends where appropriate. Various time periods within the approximately 15-year forecastperiod were evaluated including the entire period itself. To the extent that such cycles are, orcommodity price volatility within any cycle is, greater or smaller than estimated, the estimate of thereorganization value could vary significantly;
• The projected cash flows associated with the projections were discounted at a range of rates thatreflected the estimated range of weighted average cost of capital (“WACC”);
• The imputed discounted cash flow value comprises the sum of (i) the present value of the projectedunlevered free cash flows over the projection period; and (ii) the present value of a terminal value,which represents the estimate of value attributable to performance beyond the projection period. Cashflows and associated imputed values were calculated on both a consolidated and reportable segmentbasis;
• WACCs utilized in the consolidated discounted cash flow analysis ranged from 11% to 12%. Therange of WACCs utilized were developed from an analysis of the yields associated withLyondellBasell N.V.’s own debt financings and the equity costs of peer companies as well as theanticipated mix of LyondellBasell N.V.’s debt and equity;
• A range of terminal value EBITDA multiples were selected which, where appropriate, representedestimated industry cycle average market capitalization/EBITDA multiples; and
• Additional discounted cash flow analysis was performed for LyondellBasell N.V.’s unconsolidatedjoint ventures.
In April 2010 the U.S. Bankruptcy Court approved the total reorganization enterprise value on a cash-freeand debt-free basis for consolidated LyondellBasell AF at approximately $14.2 billion to $16.2 billion, with amidpoint of $15.2 billion. This estimate incorporated adjustments to include the estimated reorganization valueof LyondellBasell AF’s interests in unconsolidated joint ventures, and deducted the estimated book value ofthird party non-controlling interests in consolidated joint ventures. The Plan of Reorganization, which wasconfirmed and approved by the U.S. Bankruptcy Court on April 23, 2010, without objection by any third party,adopted the midpoint of $15.2 billion as the reorganization value used to calculate and settle claims.
Fresh-start accounting requires us to allocate the reorganization value approved by the U.S. BankruptcyCourt to the individual assets and liabilities based upon their estimated fair values. The determination of fairvalues of assets and liabilities is subject to significant estimation and assumptions. The following balance sheetinformation illustrates the financial effects as of May 1, 2010 of implementing the Plan of Reorganization andthe adoption of fresh-start accounting. Adjustments recorded to the Predecessor balance sheet, resulting fromthe consummation of the Plan of Reorganization and the adoption of fresh-start accounting, are summarizedbelow.
97
LYONDELLBASELL INDUSTRIES N.V.
NOTES TO THE CONSOLIDATED FINANCIAL STATEMENTS — (Continued)

4. Fresh-Start Accounting — (Continued)
CONSOLIDATED BALANCE SHEET
LyondellBasell AFReorganization
AdjustmentsFresh Start
Adjustments LyondellBasell N.V.Predecessor Successor
Millions of dollars
ASSETSCurrent assets:
Cash and cash equivalents . . . . . . . . . . $ 817 $1,894 a $ — $ 2,711
Accounts receivable . . . . . . . . . . . . . . 3,771 1 — 3,772
Inventories . . . . . . . . . . . . . . . . . . . . . 3,552 — 1,297 h 4,849
Prepaid expenses and other currentassets . . . . . . . . . . . . . . . . . . . . . . . 1,098 (20) (30) 1,048
Total current assets . . . . . . . . . . . . . 9,238 1,875 1,267 12,380
Property, plant and equipment, net. . . . . . 14,554 — (7,474) i 7,080
Investments and long-term receivables:
Investments in PO joint ventures . . . . . 867 — (415) j 452
Equity investments . . . . . . . . . . . . . . . 1,173 — 351 k 1,524
Other investments and long-termreceivables . . . . . . . . . . . . . . . . . . . 97 — (46) k 51
Goodwill . . . . . . . . . . . . . . . . . . . . . . . . — — 784 l 784
Intangible assets, net . . . . . . . . . . . . . . . . 1,689 — (215) m 1,474
Other assets . . . . . . . . . . . . . . . . . . . . . . 340 154 b (241) n 253
Total assets . . . . . . . . . . . . . . . . . . . . . . . $27,958 $2,029 $(5,989) $23,998
98
LYONDELLBASELL INDUSTRIES N.V.
NOTES TO THE CONSOLIDATED FINANCIAL STATEMENTS — (Continued)
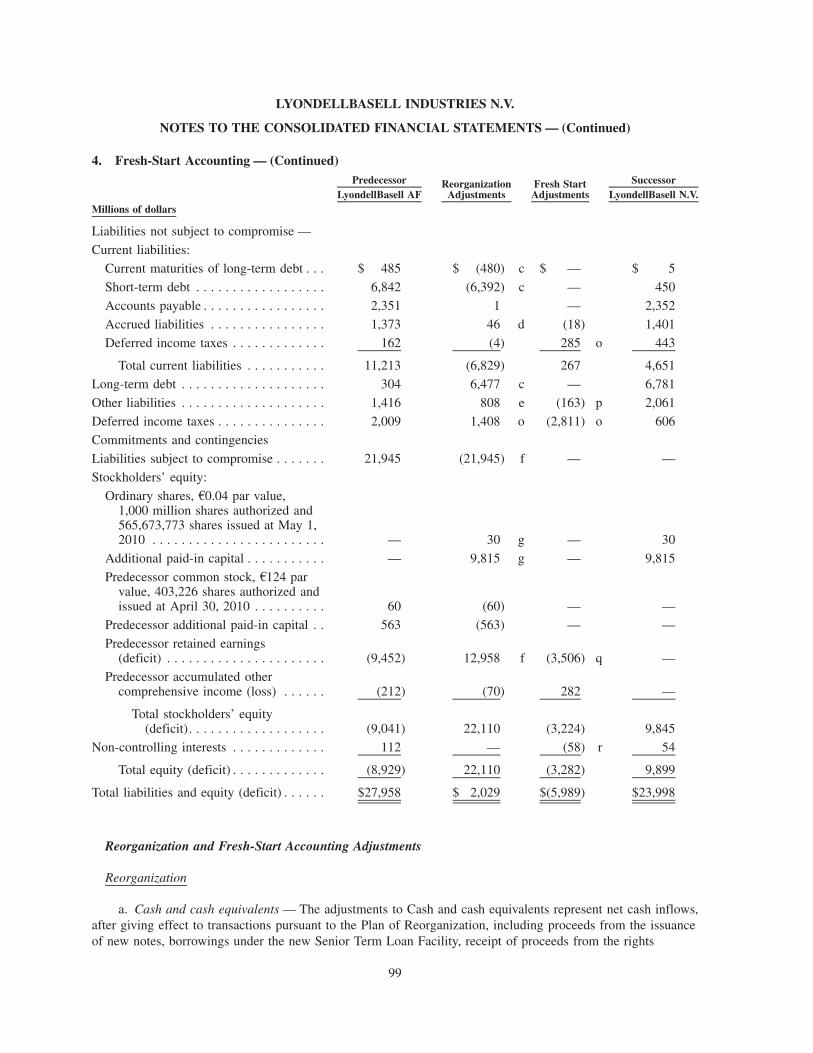
4. Fresh-Start Accounting — (Continued)
LyondellBasell AFReorganization
AdjustmentsFresh StartAdjustments LyondellBasell N.V.
Predecessor Successor
Millions of dollars
Liabilities not subject to compromise —
Current liabilities:
Current maturities of long-term debt . . . $ 485 $ (480) c $ — $ 5
Short-term debt . . . . . . . . . . . . . . . . . . 6,842 (6,392) c — 450
Accounts payable . . . . . . . . . . . . . . . . . 2,351 1 — 2,352
Accrued liabilities . . . . . . . . . . . . . . . . 1,373 46 d (18) 1,401
Deferred income taxes . . . . . . . . . . . . . 162 (4) 285 o 443
Total current liabilities . . . . . . . . . . . 11,213 (6,829) 267 4,651
Long-term debt . . . . . . . . . . . . . . . . . . . . 304 6,477 c — 6,781
Other liabilities . . . . . . . . . . . . . . . . . . . . 1,416 808 e (163) p 2,061
Deferred income taxes . . . . . . . . . . . . . . . 2,009 1,408 o (2,811) o 606
Commitments and contingencies
Liabilities subject to compromise . . . . . . . 21,945 (21,945) f — —
Stockholders’ equity:
Ordinary shares, A0.04 par value,1,000 million shares authorized and565,673,773 shares issued at May 1,2010 . . . . . . . . . . . . . . . . . . . . . . . . — 30 g — 30
Additional paid-in capital . . . . . . . . . . . — 9,815 g — 9,815
Predecessor common stock, A124 parvalue, 403,226 shares authorized andissued at April 30, 2010 . . . . . . . . . . 60 (60) — —
Predecessor additional paid-in capital . . 563 (563) — —
Predecessor retained earnings(deficit) . . . . . . . . . . . . . . . . . . . . . . (9,452) 12,958 f (3,506) q —
Predecessor accumulated othercomprehensive income (loss) . . . . . . (212) (70) 282 —
Total stockholders’ equity(deficit). . . . . . . . . . . . . . . . . . . (9,041) 22,110 (3,224) 9,845
Non-controlling interests . . . . . . . . . . . . . 112 — (58) r 54
Total equity (deficit) . . . . . . . . . . . . . (8,929) 22,110 (3,282) 9,899
Total liabilities and equity (deficit) . . . . . . $27,958 $ 2,029 $(5,989) $23,998
Reorganization and Fresh-Start Accounting Adjustments
Reorganization
a. Cash and cash equivalents — The adjustments to Cash and cash equivalents represent net cash inflows,after giving effect to transactions pursuant to the Plan of Reorganization, including proceeds from the issuanceof new notes, borrowings under the new Senior Term Loan Facility, receipt of proceeds from the rights
99
LYONDELLBASELL INDUSTRIES N.V.
NOTES TO THE CONSOLIDATED FINANCIAL STATEMENTS — (Continued)

4. Fresh-Start Accounting — (Continued)
offering; payments relating to the discharge of debts and other liabilities subject to compromise; and thefunding of the custodial and litigation trusts.
Millions of dollars
Sources of funds:Senior Secured Notes due 2017, $2,250 million, 8.0% . . . . . . . . . . . . . . . . . . . . . . . . . . $ 2,250
Senior Secured Notes due 2017, A375 million, 8.0%. . . . . . . . . . . . . . . . . . . . . . . . . . . . 497
Senior Term Loan Facility due 2016 ($5 million of discount) . . . . . . . . . . . . . . . . . . . . . 495
Issuance of class B ordinary shares . . . . . . . . . . . . . . . . . . . . . . . . . . . . . . . . . . . . . . . . 2,714
5,956
Use of funds:Debtor-in-Possession Credit Agreements —
Term Loan facility due 2010:
New Money Loans. . . . . . . . . . . . . . . . . . . . . . . . . . . . . . . . . . . . . . . . . . . . . . . . . (2,167)
ABL Facility . . . . . . . . . . . . . . . . . . . . . . . . . . . . . . . . . . . . . . . . . . . . . . . . . . . . . (985)
Settlement with unsecured creditors . . . . . . . . . . . . . . . . . . . . . . . . . . . . . . . . . . . . . . . . (260)
DIP exit fees . . . . . . . . . . . . . . . . . . . . . . . . . . . . . . . . . . . . . . . . . . . . . . . . . . . . . . . . . (195)
Funding of Millennium and environmental custodial trusts . . . . . . . . . . . . . . . . . . . . . . . (270)
Deferred financing costs . . . . . . . . . . . . . . . . . . . . . . . . . . . . . . . . . . . . . . . . . . . . . . . . (156)
Other . . . . . . . . . . . . . . . . . . . . . . . . . . . . . . . . . . . . . . . . . . . . . . . . . . . . . . . . . . . . . . (29)
(4,062)
Net cash proceeds from reorganization . . . . . . . . . . . . . . . . . . . . . . . . . . . . . . . . . . . . . . . $ 1,894
b. Other assets — Changes to Other assets primarily comprise capitalized debt issuance costs resultingfrom the incurrence of new debt.
100
LYONDELLBASELL INDUSTRIES N.V.
NOTES TO THE CONSOLIDATED FINANCIAL STATEMENTS — (Continued)

4. Fresh-Start Accounting — (Continued)
c. Debt — The changes in debt are summarized below:
Millions of dollars
Current maturities of senior secured credit facility settled with class A ordinaryshares —
Senior secured credit facility:
Term Loan A due 2013, Dutch tranche . . . . . . . . . . . . . . . . . . . . . . . . . . . . . . . . . . . . . $ (322)
$1,000 million revolving credit facility . . . . . . . . . . . . . . . . . . . . . . . . . . . . . . . . . . . . . (163)
(485)
Current maturities — New Senior Term Loan Facility due 2016 . . . . . . . . . . . . . . . . . . . . . 5
$ (480)
Debtor-in-Possession Credit Agreements —
Term Loan facility due 2010:
New Money Loans . . . . . . . . . . . . . . . . . . . . . . . . . . . . . . . . . . . . . . . . . . . . . . . . . . $(2,167)
Roll-up Loans — Senior Secured Credit Facility . . . . . . . . . . . . . . . . . . . . . . . . . . . . . (3,240)
ABL Facility . . . . . . . . . . . . . . . . . . . . . . . . . . . . . . . . . . . . . . . . . . . . . . . . . . . . . . . (985)
$(6,392)
New long-term debt:
Senior Secured Notes due 2017, $2,250 million, 8.0% . . . . . . . . . . . . . . . . . . . . . . . . . . $ 2,250
Senior Secured Notes due 2017, A375 million, 8.0%. . . . . . . . . . . . . . . . . . . . . . . . . . . . 497
Senior Term Loan Facility due 2016 ($5 million of discount) . . . . . . . . . . . . . . . . . . . . . 495
Senior Secured Notes due 2018, $3,240 million, 11.0% . . . . . . . . . . . . . . . . . . . . . . . . . 3,240
6,482
Less: Current maturities . . . . . . . . . . . . . . . . . . . . . . . . . . . . . . . . . . . . . . . . . . . . . . . . (5)
Additional long-term debt . . . . . . . . . . . . . . . . . . . . . . . . . . . . . . . . . . . . . . . . . . . . . . . . . $ 6,477
d. Accrued liabilities — The net of payments and accruals related to the Plan of Reorganization,including the issuance of warrants to purchase class A ordinary shares with a fair value of $101 million.
e. Other liabilities — The adjustments to Other liabilities primarily reflect the Company’s agreement tocontinue sponsoring the pension plans previously reported as Liabilities subject to compromise.
101
LYONDELLBASELL INDUSTRIES N.V.
NOTES TO THE CONSOLIDATED FINANCIAL STATEMENTS — (Continued)

4. Fresh-Start Accounting — (Continued)
f. Liabilities subject to compromise — The adjustment to Liabilities subject to compromise reflects thedischarge of Liabilities subject to compromise through a series of transactions involving liabilities, equity andcash. The table below summarizes the discharge of debt:
Millions of dollars
Liabilities subject to compromise . . . . . . . . . . . . . . . . . . . . . . . . . . . . . . . . . . . . . . . . . . . $21,945Current maturities of senior secured credit facility settled with class A ordinary shares. . . . 485
22,430Issuance of class A ordinary shares . . . . . . . . . . . . . . . . . . . . . . . . . . . . . . . . . . . . . . . . (7,131)Warrants . . . . . . . . . . . . . . . . . . . . . . . . . . . . . . . . . . . . . . . . . . . . . . . . . . . . . . . . . . . (101)Assumption of pension plan liabilities . . . . . . . . . . . . . . . . . . . . . . . . . . . . . . . . . . . . . . (854)Settlement unsecured creditors . . . . . . . . . . . . . . . . . . . . . . . . . . . . . . . . . . . . . . . . . . . (300)Loss of receivables from deconsolidated companies . . . . . . . . . . . . . . . . . . . . . . . . . . . . (75)Other . . . . . . . . . . . . . . . . . . . . . . . . . . . . . . . . . . . . . . . . . . . . . . . . . . . . . . . . . . . . . . (352)
Gain on discharge of liabilities subject to compromise before tax . . . . . . . . . . . . . . . . . . . $13,617
Millions of dollars
Gain on discharge of liabilities subject to compromise before tax . . . . . . . . . . . . . . . . . . . $13,617
Provision for income taxes . . . . . . . . . . . . . . . . . . . . . . . . . . . . . . . . . . . . . . . . . . . . . . . . (1,413)
Gain on discharge of liabilities subject to compromise after tax . . . . . . . . . . . . . . . . . . . . . 12,204
Elimination of Predecessor’s retained earnings . . . . . . . . . . . . . . . . . . . . . . . . . . . . . . . . . 754
Retained earnings adjustment . . . . . . . . . . . . . . . . . . . . . . . . . . . . . . . . . . . . . . . . . . . . . . $12,958
g. Equity — The changes to Equity reflect LyondellBasell N.V.’s issuance of common stock.
Fresh-Start Accounting
In applying fresh-start accounting at May 1, 2010, we recorded the assets acquired and the liabilitiesassumed from LyondellBasell AF at fair value, except for deferred income taxes and certain liabilitiesassociated with employee benefits, which were recorded in accordance with ASC 852 and ASC 740,respectively. The significant assumptions related to the valuations of our assets and liabilities recorded inconnection with fresh-start accounting are discussed herein. All valuation inputs, with the exception of thecalculation of crude oil related raw material inventories, are considered to be Level 3 inputs, as they are basedon significant inputs that are not observable in the market. Crude oil related raw material inventories werevalued using a combination of Level 1 and Level 2 inputs depending on the availability of publicly availablequoted market prices. For additional information on Level 1, Level 2 and Level 3 inputs, see Note 2.
h. Inventory — We recorded Inventory at its fair value of $4,849 million, which was determined asfollows:
• Finished goods were valued based on the estimated selling price of finished goods on hand less costs tosell, including disposal and holding period costs, and a reasonable profit margin on the selling anddisposal effort for each specific category of finished goods being evaluated;
• Work in process was valued based on the estimated selling price once completed less total costs tocomplete the manufacturing process, costs to sell including disposal and holding period costs, areasonable profit margin on the remaining manufacturing, selling, and disposal effort; and
102
LYONDELLBASELL INDUSTRIES N.V.
NOTES TO THE CONSOLIDATED FINANCIAL STATEMENTS — (Continued)
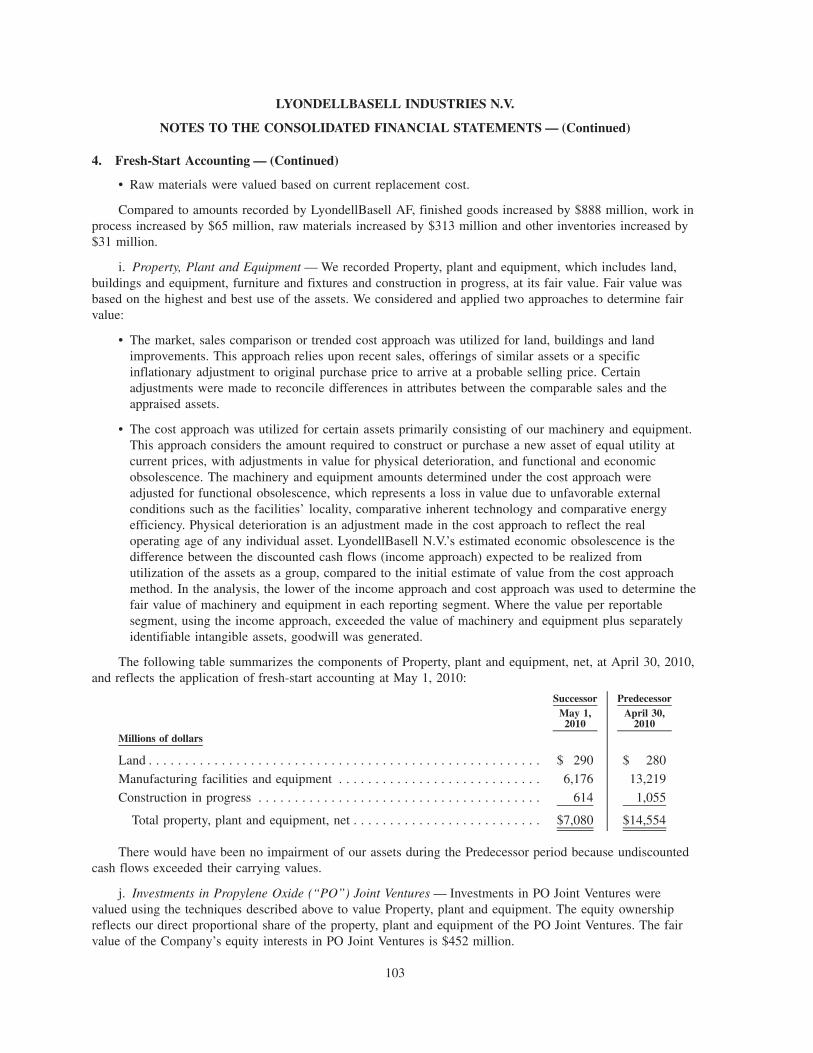
4. Fresh-Start Accounting — (Continued)
• Raw materials were valued based on current replacement cost.
Compared to amounts recorded by LyondellBasell AF, finished goods increased by $888 million, work inprocess increased by $65 million, raw materials increased by $313 million and other inventories increased by$31 million.
i. Property, Plant and Equipment — We recorded Property, plant and equipment, which includes land,buildings and equipment, furniture and fixtures and construction in progress, at its fair value. Fair value wasbased on the highest and best use of the assets. We considered and applied two approaches to determine fairvalue:
• The market, sales comparison or trended cost approach was utilized for land, buildings and landimprovements. This approach relies upon recent sales, offerings of similar assets or a specificinflationary adjustment to original purchase price to arrive at a probable selling price. Certainadjustments were made to reconcile differences in attributes between the comparable sales and theappraised assets.
• The cost approach was utilized for certain assets primarily consisting of our machinery and equipment.This approach considers the amount required to construct or purchase a new asset of equal utility atcurrent prices, with adjustments in value for physical deterioration, and functional and economicobsolescence. The machinery and equipment amounts determined under the cost approach wereadjusted for functional obsolescence, which represents a loss in value due to unfavorable externalconditions such as the facilities’ locality, comparative inherent technology and comparative energyefficiency. Physical deterioration is an adjustment made in the cost approach to reflect the realoperating age of any individual asset. LyondellBasell N.V.’s estimated economic obsolescence is thedifference between the discounted cash flows (income approach) expected to be realized fromutilization of the assets as a group, compared to the initial estimate of value from the cost approachmethod. In the analysis, the lower of the income approach and cost approach was used to determine thefair value of machinery and equipment in each reporting segment. Where the value per reportablesegment, using the income approach, exceeded the value of machinery and equipment plus separatelyidentifiable intangible assets, goodwill was generated.
The following table summarizes the components of Property, plant and equipment, net, at April 30, 2010,and reflects the application of fresh-start accounting at May 1, 2010:
May 1,2010
April 30,2010
Successor Predecessor
Millions of dollars
Land . . . . . . . . . . . . . . . . . . . . . . . . . . . . . . . . . . . . . . . . . . . . . . . . . . . . . . $ 290 $ 280
Manufacturing facilities and equipment . . . . . . . . . . . . . . . . . . . . . . . . . . . . 6,176 13,219
Construction in progress . . . . . . . . . . . . . . . . . . . . . . . . . . . . . . . . . . . . . . . 614 1,055
Total property, plant and equipment, net . . . . . . . . . . . . . . . . . . . . . . . . . . $7,080 $14,554
There would have been no impairment of our assets during the Predecessor period because undiscountedcash flows exceeded their carrying values.
j. Investments in Propylene Oxide (“PO”) Joint Ventures — Investments in PO Joint Ventures werevalued using the techniques described above to value Property, plant and equipment. The equity ownershipreflects our direct proportional share of the property, plant and equipment of the PO Joint Ventures. The fairvalue of the Company’s equity interests in PO Joint Ventures is $452 million.
103
LYONDELLBASELL INDUSTRIES N.V.
NOTES TO THE CONSOLIDATED FINANCIAL STATEMENTS — (Continued)

4. Fresh-Start Accounting — (Continued)
k. Equity Investments and Other Investments and Long-term Receivables — Our equity in the net assetsof our nonconsolidated affiliates was recorded at fair value of $1,575 million determined using discountedcash flow analyses, and included the following assumptions and estimates:
• Forecasted cash flows, which incorporate projections of sales volumes, revenues, variable costs, fixedcosts, other income and costs, and capital expenditures, after considering potential changes inunconsolidated affiliates portfolio and local market conditions;
• A terminal value calculated for investments and long-term receivables with forecasted cash flows, notlimited by contractual terms or the estimated life of the main investment asset, by assuming amaintainable level of after-tax debt-free cash flow multiplied by a capitalization factor reflecting theinvestor’s WACC adjusted for the estimated long-term perpetual growth rate; and
• A discount rate ranging from 11% to 15% that considered various factors, including market and countryrisk premiums and tax rates to determine the investor’s WACC given the assumed capital structure ofcomparable companies.
The aggregate fair value of equity in net assets of nonconsolidated affiliates accounted for using theequity method was $1,524 million.
l. Goodwill — We recorded Goodwill of $784 million, primarily resulting from the requirement to recordthe tax effect of the differences for the tax and book basis of the Company’s assets and liabilities. The reportedgoodwill and deferred tax liabilities reflect an adjustment of $314 million related to the overstatement ofgoodwill and deferred income taxes reported in previous quarterly financial statements (see Note 2). Thiscorrection has no cumulative impact on retained earnings.
m. Intangible Assets — We recorded Intangible assets at their fair values of $1,474 million. Thefollowing is a summary of the approaches used to determine the fair value of significant intangible assets:
• We recorded the fair value of developed proprietary technology licensing and catalyst contracts of$210 million using an excess earnings methodology. Significant assumptions used in the calculationincluded:
• Forecasted contractual income (fees generated) for each license technology category less directlyattributable marketing as well as research and development costs;
• Discount rates of 17% based on LyondellBasell N.V.’s WACC adjusted for perceived business risksrelated to the developed technologies; and
• Economic lives estimated from 4 to 9 years.
• We recorded the fair value of favorable utility contracts of $355 million using discounted cash flows.Significant assumptions used in this calculation included:
• The forward price of natural gas;
• The projected market settlement price of electricity;
• Discount rates of 17% based on LyondellBasell N.V’s WACC adjusted for perceived businessrisks; and
• Economic lives estimated from 11 to 16 years.
• We recorded the fair value of $132 million for in-process research and development at the cost incurredto date adjusted for the probability of future marketability.
104
LYONDELLBASELL INDUSTRIES N.V.
NOTES TO THE CONSOLIDATED FINANCIAL STATEMENTS — (Continued)
4. Fresh-Start Accounting — (Continued)
• We recorded the fair value of emission allowances of $731 million. Observed market activity foremission allowance trades is primarily generated only by legislation changes. As participants react tolegislation, market trades occur as companies pursue their individual lowest cost compliance strategies.Trading, in the absence of an additional significant market participant, generally ceases once compli-ance is attained. As such, we could not identify any objective inputs based on market activity and anavoided cost of replacement methodology was used to determine estimated fair value. The significantassumptions used in valuing emission allowances include:
• Business demand for utilization of the allowances held;
• Engineering and construction costs required to reduce each marginal emission denomination; and
• Development of new technologies to aid in the cost and effectiveness of compliance.
• In addition we recorded other intangible assets, including capitalized software and software licenses, atits fair value of $46 million.
n. Other Assets — The adjustment primarily relates to the current deferred taxes and the change in theclassification of precious metals from Other assets to Property, plant and equipment.
o. Deferred Income Taxes, Current and Non-current — The application of fresh-start accounting onMay 1, 2010 resulted in the remeasurement of deferred income tax liabilities associated with the revaluation ofthe company’s assets and liabilities pursuant to ASC 852. Deferred income taxes were recorded at amountsdetermined in accordance with ASC 740.
p. Other Liabilities — The adjustment in accrued liabilities is primarily a result of the revaluation ofdeferred revenues based on discounted net cash outflows.
q. Retained Deficit — The changes to retained deficit reflect our revaluation of the assets and liabilitiesof $5,598 million recorded in Reorganization items in the Consolidated Statements of Income, net of$2,092 million related tax adjustments.
r. Non-controlling Interests — We recorded the fair value of non-controlling interests which resulted in adecrease of $58 million.
5. Business Acquisitions and Dispositions
In December 2010 LyondellBasell N.V. completed the sale of LyondellBasell Flavors & Fragrances, LLC(the “Flavor & Fragrance chemicals business”), receiving proceeds of $154 million and recognized an after-taxgain of $64 million. The Flavor & Fragrance chemicals business has manufacturing facilities at Jacksonville,Florida, and Brunswick, Georgia, and approximately 200 employees. It produces terpene-based fragranceingredients and flavor ingredients for the oral-care, confectionery and beverage market.
The capital gain generated by the sale of the Flavor & Fragrance chemicals business was offset by capitalloss and carryforwards, for which a full valuation allowance had been recorded and, as such, no tax wasprovided.
In September 2008, the Predecessor completed the sale of its toluene diisocyanate (“TDI”) business fornet proceeds of A77 million ($113 million). The income related to the sale of the Flavor & Fragrancechemicals business and the TDI business has been classified as discontinued operations in the consolidatedstatements of income. The combined revenues and operating expenses of these businesses are not material.
Acquisition of Shell Oil Refinery in Berre l’Etang, France — In April 2008, LyondellBasell AF acquiredthe Shell oil refinery, inventory and associated infrastructure and businesses at the Berre l’Etang petrochemicalcomplex in France (the “Berre Refinery”) for a purchase price of $927 million including a final adjustment for
105
LYONDELLBASELL INDUSTRIES N.V.
NOTES TO THE CONSOLIDATED FINANCIAL STATEMENTS — (Continued)

5. Business Acquisitions and Dispositions — (Continued)
working capital and $112 million for settlement of an accrued contingent consideration. The contingentconsideration resulted from the 2005 acquisition of the remaining 50% of Société du Craqueur de l’AubetteS.A.S. (“SCA”) from its previous joint venture partner Shell Pétrochimie Méditerranée.
The refinery is a source of raw materials for, and allowed for vertical integration at, one of our coreintegrated European sites, which operates world-scale polypropylene and polyethylene plants, a steam crackerand a butadiene extraction unit at Berre l’Etang and a polyethylene plant at nearby Fos sur Mer. Theacquisition also allows optimization opportunities with our global fuels and chemicals businesses and providesus with access to significant local logistics assets, including pipeline access, storage terminals and harboraccess to the Mediterranean Sea. The refinery’s products include naphtha, VGO, liquefied petroleum gas, fuelsfor a variety of applications, heating oil and bitumen.
Consolidation of the refinery’s operations prospectively from April 1, 2008 added revenues of $2,750 mil-lion and a $147 million operating loss, excluding the impairment discussed below, to the 2008 results ofoperations.
In the fourth quarter 2008, LyondellBasell AF evaluated the long-lived assets of the Berre Refinery forimpairment and recorded a $218 million charge representing the net book value of the assets acquired in April2008.
Acquisition of Solvay Engineered Polymers — In February 2008, LyondellBasell AF acquired SolvayEngineered Polymers, Inc. (“Solvay”), a leading supplier of polypropylene compounds in North America for$134 million. The acquisition of Solvay complements our existing polymer-based composite materials andalloys business in North America.
6. Insurance Claims
LyondellBasell AF received insurance proceeds during 2009 and 2008 of $120 million and $89 million,respectively, representing partial settlements of outstanding insurance claims related to damages sustained in2005 at the polymers plant in Munchsmunster, Germany. These proceeds were used to finance the constructionof the polyethylene plant in Munchsmunster, Germany (see Note 21). LyondellBasell AF recognized gains oninvoluntary conversion in 2009 and 2008 of $120 million and $79 million, respectively, all of which wereincluded in “Other income, net,” in the Consolidated Statements of Income.
7. Related Party Transactions
The Company has related party transactions with affiliates of our major shareholders, Access Industries(“Access”) and Apollo Management (“Apollo”), and with the Company’s joint venture partners (see Note 13).
Access — Past Access related party transactions included a management and a tax-sharing agreement.
Upon emergence, in May 2010, we entered into a tax cooperation agreement with Access. The taxcooperation agreement allows either party to provide the other with information and support in connectionwith tax return preparation and audits for a fee. There were no payments made or received under thisagreement during 2010.
In December 2007, LyondellBasell AF also entered into a tax-sharing agreement with a subsidiary ofAccess entitling Access to consideration equal to 17.5% of the net operating loss carryforwards used byLyondellBasell AF entities to reduce their Dutch or French income tax liability. Payments under this agreementare limited to a maximum of $175 million. There were no payments under this agreement during 2010, 2009and 2008. This agreement was not assumed upon the Company’s emergence from chapter 11.
In December 2007, in connection with the Lyondell Chemical acquisition, LyondellBasell AF entered intoa management agreement with Access. The agreement included a periodic annual fee of $25 million.
106
LYONDELLBASELL INDUSTRIES N.V.
NOTES TO THE CONSOLIDATED FINANCIAL STATEMENTS — (Continued)

7. Related Party Transactions — (Continued)
Management fees of $25 million in 2009 and 2008 are reflected as expense in Selling, general andadministrative expenses. The 2009 management fee, which was not paid, was discharged pursuant to the Planof Reorganization. This agreement was not assumed upon the Company’s emergence from chapter 11.
On December 20, 2010, one of our subsidiaries received demand letters from affiliates of Access. TheAccess affiliates have demanded that our subsidiary, LyondellBasell Industries Holdings B.V. (“LBIH”),indemnify them and their shareholders, members, affiliates, officers, directors, employees and other relatedparties for all losses, including attorney’s fees and expenses, arising out of a pending lawsuit and pay$50 million in management fees for 2009 and 2010 in addition to other unspecified amounts related to advicepurportedly given in connection with financing and other strategic transactions. For additional informationrelated to this matter, see Note 21.
Apollo — As a result of the distribution of ordinary shares of LyondellBasell N.V. common stock pursuantto the Plan of Reorganization and the issuance of ordinary shares of LyondellBasell N.V. common stock undera rights offering on the Emergence Date, we began reporting transactions between the Company and entities inwhich Apollo and its affiliates own interests as related party transactions. These transactions include the salesof product under a long-term contract that renews automatically each year on July 31, unless a 90 day noticeof termination has been received. Other product sales are made on the spot market.
Consultant Fee — In connection with the Bankruptcy cases, LyondellBasell AF retained the services ofand entered into a Bankruptcy Court-approved contractual agreement with one of its directors. The directorreceived a $10 million success fee from the Company upon emergence from chapter 11.
Joint Venture Partners — The Company has related party transactions with its equity investees. Theserelated party transactions include the sales and purchases of goods in the normal course of business as well ascertain financing arrangements. In addition, under contractual arrangements with certain of the Company’sequity investees, we receive certain services, utilities, materials and facilities at some of our manufacturingsites and we provide certain services to our equity investees.
In December 2009, LyondellBasell N.V. advanced A10 million ($14 million) to its joint venture partner,Basell Orlen Polyolefins SP.Z.O.O. under a loan agreement that matures on December 31, 2013. The notebears interest, which is due semi-annually, at EURIBOR plus 4% through June 30, 2012 and EURIBOR plus4.5% thereafter.
107
LYONDELLBASELL INDUSTRIES N.V.
NOTES TO THE CONSOLIDATED FINANCIAL STATEMENTS — (Continued)
7. Related Party Transactions — (Continued)
Related party transactions are summarized as follows:
May 1through
December 31,2010
January 1throughApril 30,
2010 2009 2008
For the Year EndedDecember 31,
Successor Predecessor
Millions of dollars
The Company billed related parties for:Sales of products —
Apollo affiliates . . . . . . . . . . . . . . . . . . . . . . . . . $235 $ — $ — $ —
Joint venture partners . . . . . . . . . . . . . . . . . . . . . 488 207 621 803
Shared services agreements —Apollo affiliates . . . . . . . . . . . . . . . . . . . . . . . . . — — — —
Joint venture partners . . . . . . . . . . . . . . . . . . . . . 22 3 21 14
Interest —
Joint venture partners . . . . . . . . . . . . . . . . . . . . . — — 4 18
Related parties billed the Company for:Sales of products —
Joint venture partners . . . . . . . . . . . . . . . . . . . . . 803 432 1,856 2,418
Shared services agreements —
Joint venture partners . . . . . . . . . . . . . . . . . . . . . 56 28 100 111
8. Short-term Investments
As a result of financial difficulties experienced by major financial institutions beginning in the latter partof the third quarter of 2008, LyondellBasell AF received notice that rights of redemption had been suspendedwith respect to a money market fund in which LyondellBasell AF invested approximately $174 million.LyondellBasell AF had been advised that additional redemptions were forthcoming, subject to LyondellBasellAF’s pro rata share of a $3.5 billion loss reserve established by the fund in February 2009. Accordingly,LyondellBasell AF recorded a provision in 2008 for an estimated loss of $5 million related to the moneymarket fund. However, on May 5, 2009, the SEC filed an application for injunctive and other relief with TheUnited States District Court for the Southern District of New York (“U.S. District Court”) that objected to thecreation of the $3.5 billion loss reserve and instead proposed a plan to distribute the remaining assets of themoney market fund on a pro rata basis to shareholders that have not been fully redeemed since September 15,2008. A majority of the claimants agreed with the SEC’s plan and on November 25, 2009, the U.S. DistrictCourt issued an order which provided for a pro rata distribution of the remaining assets. The Companyreceived redemptions totaling $172 million through December 31, 2010, including $12 million in 2010,$23 million in 2009 and $137 million in 2008. The 2010 redemption exceeded the $9 million carrying value.Accordingly, the Predecessor recognized a $3 million gain on redemption in January 2010.
9. Accounts Receivable
We sell our products primarily to other industrial concerns in the petrochemicals and refining industries.We perform ongoing credit evaluations of our customers’ financial condition and, in certain circumstances,require letters of credit or corporate guarantees from them. As part of fresh-start accounting our Accountsreceivable were valued at market. Our allowance for doubtful accounts at December 31, 2010, which isreflected in the Consolidated Balance Sheets as a reduction of accounts receivable, was $12 million.LyondellBasell AF’s allowance for doubtful accounts receivable totaled $109 million at December 31, 2009.
108
LYONDELLBASELL INDUSTRIES N.V.
NOTES TO THE CONSOLIDATED FINANCIAL STATEMENTS — (Continued)

9. Accounts Receivable — (Continued)
Our provisions for doubtful accounts receivable, which are recorded in the Consolidated Statements of Income,were $12 million for the eight months ended December 31, 2010. LyondellBasell AF recorded provisions fordoubtful accounts receivable of $7 million, $18 million, and $47 million in the four months ended April 30,2010 and for the full years 2009 and 2008, respectively.
10. Inventories
Inventories consisted of the following components at December 31:
2010 2009Successor Predecessor
Millions of dollars
Finished goods . . . . . . . . . . . . . . . . . . . . . . . . . . . . . . . . . . . . . . . . . . . . . . $3,127 $2,073
Work-in-process . . . . . . . . . . . . . . . . . . . . . . . . . . . . . . . . . . . . . . . . . . . . . 230 164
Raw materials and supplies . . . . . . . . . . . . . . . . . . . . . . . . . . . . . . . . . . . . . 1,467 1,040
Total inventories . . . . . . . . . . . . . . . . . . . . . . . . . . . . . . . . . . . . . . . . . . . $4,824 $3,277
In connection with application of fresh-start accounting on May 1, 2010, we recorded inventory at its fairvalue of $4,849 million (see Note 4). The increase in inventory of $1,297 million was primarily in the U.S. andlargely due to the price of crude oil.
We recorded non-cash charges in the Successor period totaling $365 million to adjust the value of ourraw materials and finished goods inventory to market as of June 30, 2010 and September 30, 2010. These non-cash charges were the result of the decline in the per barrel benchmark price of crude oil from the EmergenceDate to June 30, 2010 and lower market prices for certain products, primarily polypropylene. A non-cashcredit of $323 million recorded in the fourth quarter 2010 to reflect the recovery of market price substantiallyoffset the lower of cost or market adjustment related to our raw materials inventory.
LyondellBasell AF recorded charges of $127 million and $1,256 million in 2009 and 2008, respectively,to adjust the value of its inventory to market value, which was lower than the carrying cost at December 31,2009 and 2008.
At December 31, 2010, approximately 87% of our inventories were valued using the LIFO method.Approximately 42% of the Predecessor inventory was valued using the LIFO method at December 31, 2009,and the remainder, excluding materials and supplies, was valued using the FIFO method. The excess of currentreplacement cost over LIFO cost of inventories amounted to $257 million and $801 million at December 31,2010 and 2009, respectively. During 2010 and 2009, liquidations of LIFO inventory layers resulted in chargesof $9 million and $5 million, respectively.
109
LYONDELLBASELL INDUSTRIES N.V.
NOTES TO THE CONSOLIDATED FINANCIAL STATEMENTS — (Continued)
11. Property, Plant and Equipment, Goodwill, Intangible and Other Assets
Plant, Property and Equipment — The components of Property, plant and equipment, at cost, and therelated accumulated depreciation were as follows at December 31:
2010 2009Successor Predecessor
Millions of dollars
Land . . . . . . . . . . . . . . . . . . . . . . . . . . . . . . . . . . . . . . . . . . . . . . . . . . . . . . $ 286 $ 297
Manufacturing facilities and equipment . . . . . . . . . . . . . . . . . . . . . . . . . . . . 6,752 17,665
Construction in progress . . . . . . . . . . . . . . . . . . . . . . . . . . . . . . . . . . . . . . . 569 1,029
Total property, plant and equipment . . . . . . . . . . . . . . . . . . . . . . . . . . . . . 7,607 18,991
Less accumulated depreciation . . . . . . . . . . . . . . . . . . . . . . . . . . . . . . . . . . . (417) (3,839)
Property, plant and equipment, net . . . . . . . . . . . . . . . . . . . . . . . . . . . . . . $7,190 $15,152
In connection with application of fresh-start accounting on May 1, 2010, we recorded Property, plant andequipment, which includes land, buildings and equipment, furniture and fixtures and construction in progress,at its fair value of $7,080 million (see Note 4).
On February 25, 2010, based on the continued impact of global economic conditions on polypropylenedemand, LyondellBasell AF announced a project to cease production at, and permanently shut down, itspolypropylene plant at Terni, Italy. LyondellBasell AF recognized charges of $23 million in cost of salesrelated to plant and other closure costs in the first quarter of 2010. In July 2010 the plant ceased production.
Following an analysis of the cash flow projections for the Berre refinery, we concluded that the capitaladditions in 2010 are impaired. Accordingly, we recognized a $25 million charge for impairment of thecarrying value of those assets.
The full carrying value of the Berre Refinery assets was impaired in 2008 resulting in a charge of$218 million. The analysis that was conducted resulting in the impairment was triggered by a downwardrevision of the Company’s long range cash flow projections due to the significantly deteriorating businessconditions experienced in the fourth quarter of 2008.
Capitalized interest expense related to Property, plant and equipment for the eight months endedDecember 31, 2010, the four months ended April 30, 2010 and for the years ended December 31, 2009 and2008 was $2 million, $4 million, $35 million and $13 million, respectively.
Goodwill — We recorded goodwill of $784 million upon application of fresh-start accounting (see Note 4).Goodwill at December 31, 2010 reflects a $3 million effect of changes in currency exchange rates sinceApril 30, 2010. This was the only movement in goodwill during the Successor period.
During the fourth quarter of 2008, LyondellBasell AF determined that the goodwill associated with itsRefining and Oxyfuels, O&P — Americas and Intermediates and Derivatives business segments was impaired.The impairment was based on a review of the business segments performed by Management in whichdiscounted cash flows did not support the carrying value of the goodwill due to the rapid deterioration in theglobal economy and the effects on LyondellBasell AF’s operations in the latter part of the fourth quarter of2008. Accordingly, in the fourth quarter of 2008, LyondellBasell AF recorded a charge to earnings of$4,982 million, for impairment of goodwill, including $4,921 million related to the December 20, 2007acquisition of Lyondell Chemical. In the fourth quarter of 2009, LyondellBasell AF recorded an adjustmentrelated to prior periods which increased income from operations and net income for the three-month period
110
LYONDELLBASELL INDUSTRIES N.V.
NOTES TO THE CONSOLIDATED FINANCIAL STATEMENTS — (Continued)

11. Property, Plant and Equipment, Goodwill, Intangible and Other Assets — (Continued)
ended December 31, 2009 by $65 million. The adjustment related to an overstatement of goodwill impairmentin 2008.
Intangible Assets — In connection with application of fresh-start accounting on May 1, 2010, we recordedIntangible assets at their fair values of $1,474 million (see Note 4).
The components of identifiable intangible assets, at cost, and the related accumulated amortization wereas follows at December 31:
CostAccumulatedAmortization Net Cost
AccumulatedAmortization Net
2010 2009Successor Predecessor
Millions of dollars
In-process research and developmentcosts. . . . . . . . . . . . . . . . . . . . . . . $ 132 $ (3)* $ 129 $ — $ — $ —
Technology, patent and licensecosts. . . . . . . . . . . . . . . . . . . . . . . 2 — 2 1,021 (338) 683
Emission allowances . . . . . . . . . . . . . 731 (46) 685 733 (62)* 671
Various contracts . . . . . . . . . . . . . . . 567 (74) 493 350 (118) 232Debt issuance costs . . . . . . . . . . . . . — — — 598 (477) 121
Software costs . . . . . . . . . . . . . . . . . 53 (2) 51 71 (6) 65
Catalyst costs . . . . . . . . . . . . . . . . . . — — — 127 (89) 38
Other . . . . . . . . . . . . . . . . . . . . . . . . — — — 111 (60) 51
Total intangible assets. . . . . . . . . . . . $1,485 $(125) $1,360 $3,011 $(1,150) $1,861
* Includes impairments discussed in the paragraphs below.
Amortization of these identifiable intangible assets for the next five years is expected to be $133 millionin each of 2011, 2012, 2013 and 2014 and $126 million in 2015.
During the Successor period we recognized an impairment of $3 million related to certain in-processresearch and development projects which were abandoned.
During the fourth quarter 2009 LyondellBasell AF recognized a $44 million charge related to surplushighly-reactive volatile organic compound (“HRVOC”) emissions allowances. For purposes of the annualimpairment test, fair value was measured based on estimates of cost to implement alternative emissionreduction technology. Also in December 2009, LyondellBasell AF recognized a $9 million impairment fornon-U.S. emission rights. These charges are reflected in Impairments on the Consolidated Statements ofIncome.
111
LYONDELLBASELL INDUSTRIES N.V.
NOTES TO THE CONSOLIDATED FINANCIAL STATEMENTS — (Continued)
11. Property, Plant and Equipment, Goodwill, Intangible and Other Assets — (Continued)
The components of Other assets were as follows at December 31:
2010 2009Successor Predecessor
Millions of dollars
Precious metals . . . . . . . . . . . . . . . . . . . . . . . . . . . . . . . . . . . . . . . . . . . . . . $ — $ 90
Debt issuance costs . . . . . . . . . . . . . . . . . . . . . . . . . . . . . . . . . . . . . . . . . . . 126 —
Company-owned life insurance . . . . . . . . . . . . . . . . . . . . . . . . . . . . . . . . . . 58 52
Pension assets . . . . . . . . . . . . . . . . . . . . . . . . . . . . . . . . . . . . . . . . . . . . . . . 21 19
Deferred tax assets . . . . . . . . . . . . . . . . . . . . . . . . . . . . . . . . . . . . . . . . . . . 41 115
Other . . . . . . . . . . . . . . . . . . . . . . . . . . . . . . . . . . . . . . . . . . . . . . . . . . . . . 27 87
Total other assets . . . . . . . . . . . . . . . . . . . . . . . . . . . . . . . . . . . . . . . . . . . $273 $363
Depreciation and Amortization Expense — Depreciation and amortization expense is summarized asfollows:
May 1through
December 31,2010
January 1throughApril 30,
2010 2009 2008
For the Year EndedDecember 31,
Successor Predecessor
Millions of dollars
Property, plant and equipment . . . . . . . . . . . . . . . . . . $413 $499 $1,515 $1,628
Investment in PO joint ventures . . . . . . . . . . . . . . . . . 16 19 57 59
Emission allowances . . . . . . . . . . . . . . . . . . . . . . . . . 46 — — —
Various contracts . . . . . . . . . . . . . . . . . . . . . . . . . . . . 81 — — —
Technology, patent and license costs. . . . . . . . . . . . . . — 25 123 93
Software costs . . . . . . . . . . . . . . . . . . . . . . . . . . . . . . 2 12 21 15
Other . . . . . . . . . . . . . . . . . . . . . . . . . . . . . . . . . . . . — 10 58 116
Total depreciation and amortization . . . . . . . . . . . . $558 $565 $1,774 $1,911
Asset Retirement Obligations — At some sites we are contractually obligated to decommission our plantsupon site exit. The Company has provided for the net present value of the estimated costs. Typically such
112
LYONDELLBASELL INDUSTRIES N.V.
NOTES TO THE CONSOLIDATED FINANCIAL STATEMENTS — (Continued)
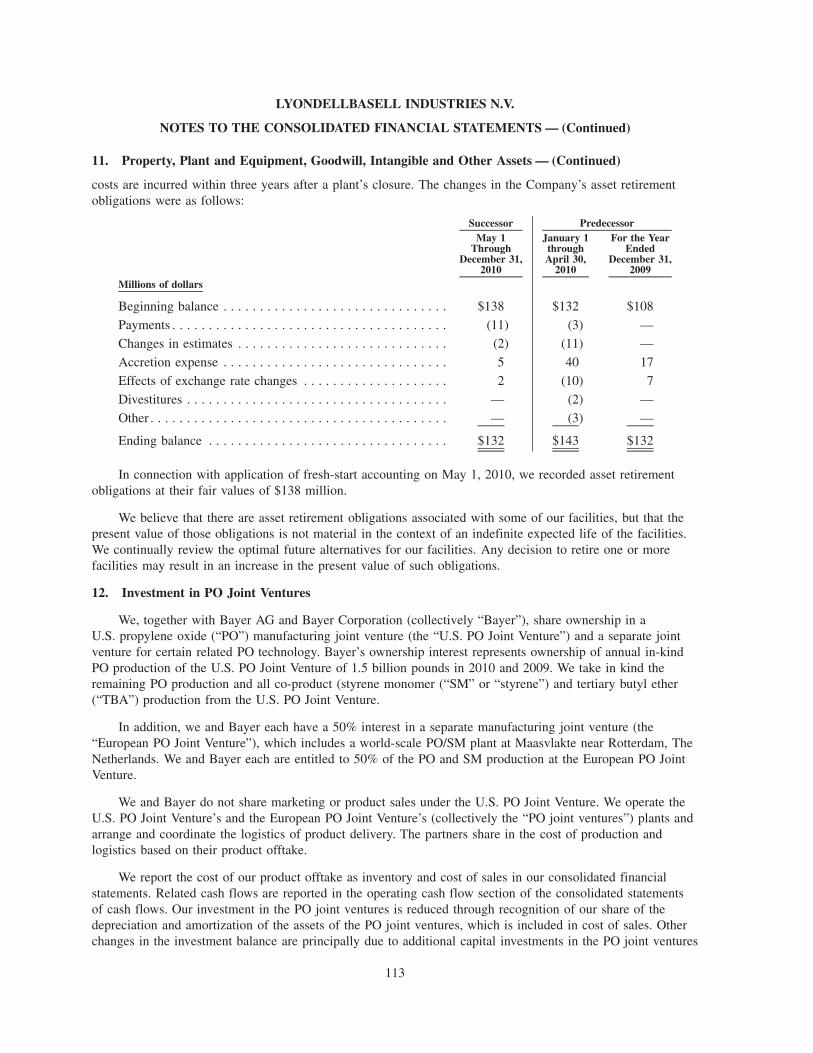
11. Property, Plant and Equipment, Goodwill, Intangible and Other Assets — (Continued)
costs are incurred within three years after a plant’s closure. The changes in the Company’s asset retirementobligations were as follows:
May 1Through
December 31,2010
January 1throughApril 30,
2010
For the YearEnded
December 31,2009
Successor Predecessor
Millions of dollars
Beginning balance . . . . . . . . . . . . . . . . . . . . . . . . . . . . . . . $138 $132 $108
Payments . . . . . . . . . . . . . . . . . . . . . . . . . . . . . . . . . . . . . . (11) (3) —
Changes in estimates . . . . . . . . . . . . . . . . . . . . . . . . . . . . . (2) (11) —
Accretion expense . . . . . . . . . . . . . . . . . . . . . . . . . . . . . . . 5 40 17
Effects of exchange rate changes . . . . . . . . . . . . . . . . . . . . 2 (10) 7
Divestitures . . . . . . . . . . . . . . . . . . . . . . . . . . . . . . . . . . . . — (2) —
Other . . . . . . . . . . . . . . . . . . . . . . . . . . . . . . . . . . . . . . . . . — (3) —
Ending balance . . . . . . . . . . . . . . . . . . . . . . . . . . . . . . . . . $132 $143 $132
In connection with application of fresh-start accounting on May 1, 2010, we recorded asset retirementobligations at their fair values of $138 million.
We believe that there are asset retirement obligations associated with some of our facilities, but that thepresent value of those obligations is not material in the context of an indefinite expected life of the facilities.We continually review the optimal future alternatives for our facilities. Any decision to retire one or morefacilities may result in an increase in the present value of such obligations.
12. Investment in PO Joint Ventures
We, together with Bayer AG and Bayer Corporation (collectively “Bayer”), share ownership in aU.S. propylene oxide (“PO”) manufacturing joint venture (the “U.S. PO Joint Venture”) and a separate jointventure for certain related PO technology. Bayer’s ownership interest represents ownership of annual in-kindPO production of the U.S. PO Joint Venture of 1.5 billion pounds in 2010 and 2009. We take in kind theremaining PO production and all co-product (styrene monomer (“SM” or “styrene”) and tertiary butyl ether(“TBA”) production from the U.S. PO Joint Venture.
In addition, we and Bayer each have a 50% interest in a separate manufacturing joint venture (the“European PO Joint Venture”), which includes a world-scale PO/SM plant at Maasvlakte near Rotterdam, TheNetherlands. We and Bayer each are entitled to 50% of the PO and SM production at the European PO JointVenture.
We and Bayer do not share marketing or product sales under the U.S. PO Joint Venture. We operate theU.S. PO Joint Venture’s and the European PO Joint Venture’s (collectively the “PO joint ventures”) plants andarrange and coordinate the logistics of product delivery. The partners share in the cost of production andlogistics based on their product offtake.
We report the cost of our product offtake as inventory and cost of sales in our consolidated financialstatements. Related cash flows are reported in the operating cash flow section of the consolidated statementsof cash flows. Our investment in the PO joint ventures is reduced through recognition of our share of thedepreciation and amortization of the assets of the PO joint ventures, which is included in cost of sales. Otherchanges in the investment balance are principally due to additional capital investments in the PO joint ventures
113
LYONDELLBASELL INDUSTRIES N.V.
NOTES TO THE CONSOLIDATED FINANCIAL STATEMENTS — (Continued)
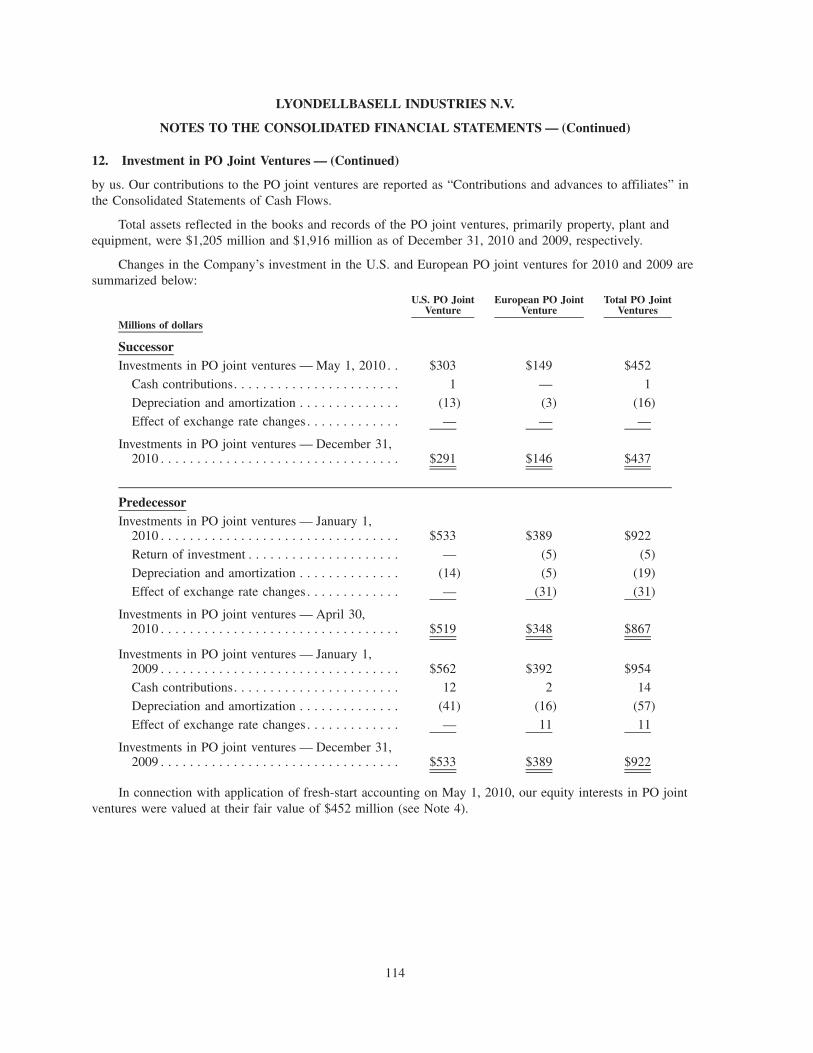
12. Investment in PO Joint Ventures — (Continued)
by us. Our contributions to the PO joint ventures are reported as “Contributions and advances to affiliates” inthe Consolidated Statements of Cash Flows.
Total assets reflected in the books and records of the PO joint ventures, primarily property, plant andequipment, were $1,205 million and $1,916 million as of December 31, 2010 and 2009, respectively.
Changes in the Company’s investment in the U.S. and European PO joint ventures for 2010 and 2009 aresummarized below:
U.S. PO JointVenture
European PO JointVenture
Total PO JointVentures
Millions of dollars
SuccessorInvestments in PO joint ventures — May 1, 2010 . . $303 $149 $452
Cash contributions. . . . . . . . . . . . . . . . . . . . . . . 1 — 1
Depreciation and amortization . . . . . . . . . . . . . . (13) (3) (16)
Effect of exchange rate changes . . . . . . . . . . . . . — — —
Investments in PO joint ventures — December 31,2010 . . . . . . . . . . . . . . . . . . . . . . . . . . . . . . . . . $291 $146 $437
PredecessorInvestments in PO joint ventures — January 1,
2010 . . . . . . . . . . . . . . . . . . . . . . . . . . . . . . . . . $533 $389 $922
Return of investment . . . . . . . . . . . . . . . . . . . . . — (5) (5)
Depreciation and amortization . . . . . . . . . . . . . . (14) (5) (19)
Effect of exchange rate changes . . . . . . . . . . . . . — (31) (31)
Investments in PO joint ventures — April 30,2010 . . . . . . . . . . . . . . . . . . . . . . . . . . . . . . . . . $519 $348 $867
Investments in PO joint ventures — January 1,2009 . . . . . . . . . . . . . . . . . . . . . . . . . . . . . . . . . $562 $392 $954Cash contributions. . . . . . . . . . . . . . . . . . . . . . . 12 2 14
Depreciation and amortization . . . . . . . . . . . . . . (41) (16) (57)
Effect of exchange rate changes . . . . . . . . . . . . . — 11 11
Investments in PO joint ventures — December 31,2009 . . . . . . . . . . . . . . . . . . . . . . . . . . . . . . . . . $533 $389 $922
In connection with application of fresh-start accounting on May 1, 2010, our equity interests in PO jointventures were valued at their fair value of $452 million (see Note 4).
114
LYONDELLBASELL INDUSTRIES N.V.
NOTES TO THE CONSOLIDATED FINANCIAL STATEMENTS — (Continued)

13. Equity Investments
Direct and indirect Equity investments held by the Company are as follows:
Percent of OwnershipDecember 31,
2010December 31,
2009
Basell Orlen Polyolefins Sp. Z.o.o. . . . . . . . . . . . . . . . . . . . . . . . . . . . . 50.00% 50.00%
PolyPacific Pty. Ltd. . . . . . . . . . . . . . . . . . . . . . . . . . . . . . . . . . . . . . . 50.00% 50.00%
SunAllomer Ltd. . . . . . . . . . . . . . . . . . . . . . . . . . . . . . . . . . . . . . . . . . 50.00% 50.00%
Saudi Polyolefins Company . . . . . . . . . . . . . . . . . . . . . . . . . . . . . . . . . 25.00% 25.00%
Saudi Ethylene & Polyethylene Company Ltd. . . . . . . . . . . . . . . . . . . . 25.00% 25.00%
Al-Waha Petrochemicals Ltd. . . . . . . . . . . . . . . . . . . . . . . . . . . . . . . . . 20.95% 20.95%
PolyMirae Co. Ltd. . . . . . . . . . . . . . . . . . . . . . . . . . . . . . . . . . . . . . . . 42.59% 42.59%
HMC Polymers Company Ltd. . . . . . . . . . . . . . . . . . . . . . . . . . . . . . . . 28.56% 28.56%
Indelpro S.A. de C.V. . . . . . . . . . . . . . . . . . . . . . . . . . . . . . . . . . . . . . 49.00% 49.00%
Kazakhstan Petro-Chemicals Industries, Inc. . . . . . . . . . . . . . . . . . . . . . — 24.00%
Ningbo ZRCC Lyondell Chemical Co. Ltd. . . . . . . . . . . . . . . . . . . . . . 26.65% 26.65%
Ningbo ZRCC Lyondell Chemical Marketing Co. . . . . . . . . . . . . . . . . . 50.00% 50.00%
Nihon Oxirane Company . . . . . . . . . . . . . . . . . . . . . . . . . . . . . . . . . . . 40.00% 40.00%
NOC Asia Ltd. . . . . . . . . . . . . . . . . . . . . . . . . . . . . . . . . . . . . . . . . . . 40.00% 40.00%
Geosel . . . . . . . . . . . . . . . . . . . . . . . . . . . . . . . . . . . . . . . . . . . . . . . . . 27.00% 27.00%
The changes in Equity investments are as follows for the years 2010 and 2009:
May 1through
December 31,2010
January 1throughApril 30,
2010
For the YearEnded
December 31,2009
Successor Predecessor
Millions of dollars
Beginning balance . . . . . . . . . . . . . . . . . . . . . . . . . . . . . . . $1,524 $1,085 $1,215
Investee net income . . . . . . . . . . . . . . . . . . . . . . . . . . . . . . 86 84 47
Impairment recognized by investor . . . . . . . . . . . . . . . . . . . — — (228)
Income (loss) from equity investments . . . . . . . . . . . . . . 86 84 (181)
Dividends received . . . . . . . . . . . . . . . . . . . . . . . . . . . . . . . (34) (18) (19)
Contributions to joint venture . . . . . . . . . . . . . . . . . . . . . . . — 20 8
Currency exchange effects . . . . . . . . . . . . . . . . . . . . . . . . . (7) (8) 48
Other . . . . . . . . . . . . . . . . . . . . . . . . . . . . . . . . . . . . . . . . . 18 10 14
Ending balance . . . . . . . . . . . . . . . . . . . . . . . . . . . . . . . . . $1,587 $1,173 $1,085
We capitalize interest on the projects of our equity investees that are necessary for the commencement oftheir principal operations. During 2010 and 2009, the Company capitalized interest of $2 million and$17 million, respectively, for qualified projects of Saudi Ethylene & Polyethylene Company Ltd. and Al-WahaPetrochemicals Ltd.
The subsidiary that holds the Company’s equity interest in Saudi Al-Waha Petrochemicals Ltd has aminority shareholder, which holds 16.21% of its equity. The equity interest held by the minority shareholder
115
LYONDELLBASELL INDUSTRIES N.V.
NOTES TO THE CONSOLIDATED FINANCIAL STATEMENTS — (Continued)

13. Equity Investments — (Continued)
can be called by the Company or can be put to the Company by the minority interest shareholder at any timeafter May 23, 2009. The price of the call option is the nominal value of the shares (initial $18 millioninvestment) plus accrued interest based on LIBOR plus 40 basis points, less paid dividends. The price of theput option is A1 plus the minority shareholder’s undistributed pro-rata earnings. As of December 31, 2010 and2009, the put would have a minimal redemption amount and the call could be redeemed for $21 million and$20 million, respectively, the value of the initial investment plus accrued interest.
Summarized balance sheet information and the Company’s share of Equity investments was as follows:
100%Company
Share 100%Company
Share
December 31, 2010 December 31, 2009Successor Predecessor
Millions of dollars
Current assets . . . . . . . . . . . . . . . . . . . . . . . . . . . . . . . . $ 3,793 $1,343 $2,760 $1,016
Noncurrent assets . . . . . . . . . . . . . . . . . . . . . . . . . . . . . 6,849 1,998 6,887 2,172
Total assets . . . . . . . . . . . . . . . . . . . . . . . . . . . . . . . . 10,642 3,341 9,647 3,188
Current liabilities . . . . . . . . . . . . . . . . . . . . . . . . . . . . . . 2,923 1,016 1,881 695
Noncurrent liabilities . . . . . . . . . . . . . . . . . . . . . . . . . . . 3,926 1,100 4,207 1,180
Net assets . . . . . . . . . . . . . . . . . . . . . . . . . . . . . . . . . $ 3,793 $1,225 $3,559 $1,313
Summarized income statement information and the Company’s share for the periods for which therespective equity investments were accounted for under the equity method is set forth below:
100%Company
Share 100%Company
Share
May 1through
December 31, 2010
January 1through
April 30, 2010
Successor Predecessor
Millions of dollars
Revenues . . . . . . . . . . . . . . . . . . . . . . . . . . . . . . . . . . . $ 6,249 $ 2,248 $ 3,127 $ 989
Cost of sales . . . . . . . . . . . . . . . . . . . . . . . . . . . . . . . . . (5,622) (2,042) (2,699) (869)
Gross profit . . . . . . . . . . . . . . . . . . . . . . . . . . . . . . . . 627 206 428 120
Net operating expenses . . . . . . . . . . . . . . . . . . . . . . . . . (169) (55) (82) (29)
Operating income . . . . . . . . . . . . . . . . . . . . . . . . . . . 458 151 346 91
Interest income . . . . . . . . . . . . . . . . . . . . . . . . . . . . . . . 4 2 2 1
Interest expense . . . . . . . . . . . . . . . . . . . . . . . . . . . . . . (151) (43) (43) (13)
Foreign currency translation . . . . . . . . . . . . . . . . . . . . . 5 (1) 83 24
Income (loss) from equity investments . . . . . . . . . . . . . . (2) (3) 3 2
Income before income taxes . . . . . . . . . . . . . . . . . . . 314 106 391 105
Provision for income taxes . . . . . . . . . . . . . . . . . . . . . . 43 20 67 21
Net income . . . . . . . . . . . . . . . . . . . . . . . . . . . . . . . . $ 271 $ 86 $ 324 $ 84
116
LYONDELLBASELL INDUSTRIES N.V.
NOTES TO THE CONSOLIDATED FINANCIAL STATEMENTS — (Continued)

13. Equity Investments — (Continued)
100%Company
Share 100%Company
Share
2009 2008Predecessor
Millions of dollars
Revenues . . . . . . . . . . . . . . . . . . . . . . . . . . . . . . . . . . . $ 6,640 $ 2,099 $ 7,252 $ 2,609
Cost of sales . . . . . . . . . . . . . . . . . . . . . . . . . . . . . . . . . (5,973) (1,891) (6,532) (2,418)
Gross profit . . . . . . . . . . . . . . . . . . . . . . . . . . . . . . . . 667 208 720 191
Net operating expenses . . . . . . . . . . . . . . . . . . . . . . . . . (169) (71) (423) (106)
Operating income . . . . . . . . . . . . . . . . . . . . . . . . . . . 498 137 297 85
Interest income . . . . . . . . . . . . . . . . . . . . . . . . . . . . . . . 18 3 24 8
Interest expense . . . . . . . . . . . . . . . . . . . . . . . . . . . . . . (202) (61) (62) (26)
Foreign currency translation . . . . . . . . . . . . . . . . . . . . . (10) (5) (57) (16)
Income from equity investments . . . . . . . . . . . . . . . . . . 4 2 23 4
Income before income taxes . . . . . . . . . . . . . . . . . . . 308 76 225 55
Provision for income taxes . . . . . . . . . . . . . . . . . . . . . . 92 29 58 17
Net income . . . . . . . . . . . . . . . . . . . . . . . . . . . . . . . . $ 216 $ 47 $ 167 $ 38
In connection with application of fresh-start accounting on May 1, 2010, we recorded equity investmentsat their fair value of $1,524 million (see Note 4). The carrying value of our equity investments at December 31,2010 of $1,587 million reflects the 2010 aggregate fair value adjustment, which is different than our share ofits equity investment in the underlying assets of $1,225 million. In 2009, the Company recognized pretaximpairment charges totaling $228 million for impairment of the carrying value of its investments in certainjoint ventures.
A joint venture of ours is in default under its financing arrangement due to a delay in the start-up of itsassets and as a result of LyondellBasell AF’s voluntary filing for relief under chapter 11 of the U.S. BankruptcyCode on April 24, 2009. The parties are currently negotiating in good faith to resolve the default and atpresent there is no evidence that such negotiations will not be concluded successfully or that the resolution ofthis matter will have a material adverse impact on our operations or liquidity.
117
LYONDELLBASELL INDUSTRIES N.V.
NOTES TO THE CONSOLIDATED FINANCIAL STATEMENTS — (Continued)
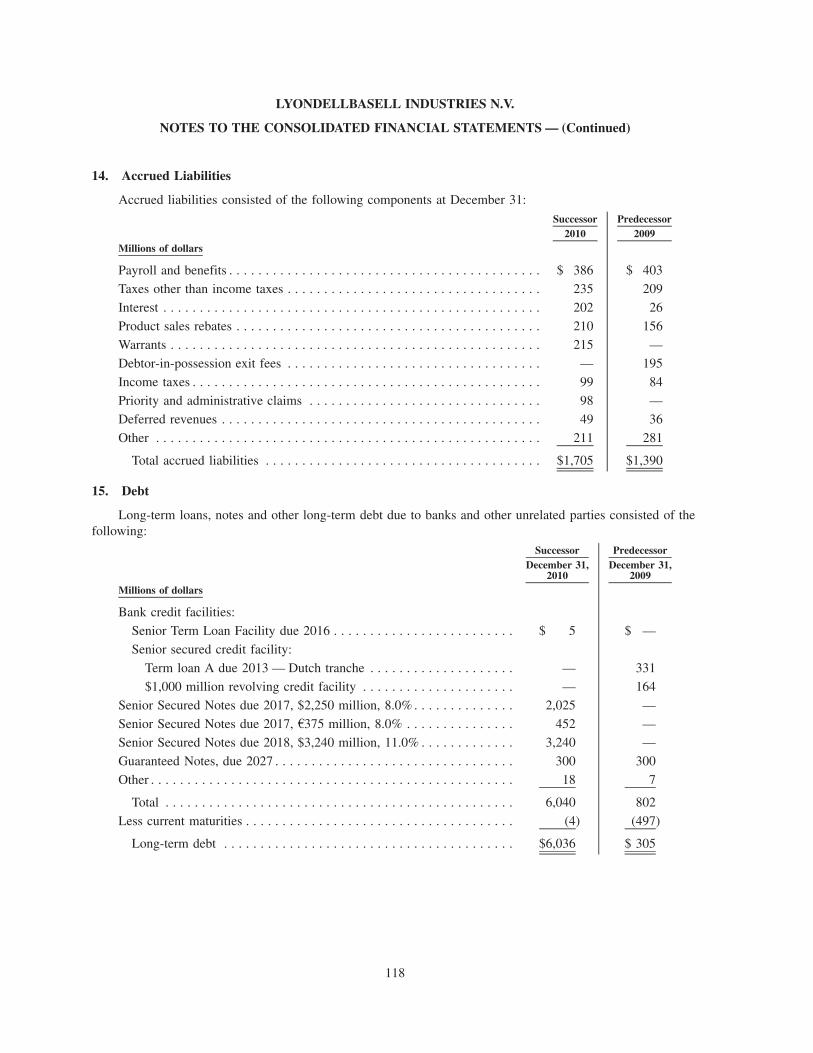
14. Accrued Liabilities
Accrued liabilities consisted of the following components at December 31:
2010 2009Successor Predecessor
Millions of dollars
Payroll and benefits . . . . . . . . . . . . . . . . . . . . . . . . . . . . . . . . . . . . . . . . . . . $ 386 $ 403
Taxes other than income taxes . . . . . . . . . . . . . . . . . . . . . . . . . . . . . . . . . . . 235 209
Interest . . . . . . . . . . . . . . . . . . . . . . . . . . . . . . . . . . . . . . . . . . . . . . . . . . . . 202 26
Product sales rebates . . . . . . . . . . . . . . . . . . . . . . . . . . . . . . . . . . . . . . . . . . 210 156
Warrants . . . . . . . . . . . . . . . . . . . . . . . . . . . . . . . . . . . . . . . . . . . . . . . . . . . 215 —
Debtor-in-possession exit fees . . . . . . . . . . . . . . . . . . . . . . . . . . . . . . . . . . . — 195
Income taxes . . . . . . . . . . . . . . . . . . . . . . . . . . . . . . . . . . . . . . . . . . . . . . . . 99 84
Priority and administrative claims . . . . . . . . . . . . . . . . . . . . . . . . . . . . . . . . 98 —
Deferred revenues . . . . . . . . . . . . . . . . . . . . . . . . . . . . . . . . . . . . . . . . . . . . 49 36
Other . . . . . . . . . . . . . . . . . . . . . . . . . . . . . . . . . . . . . . . . . . . . . . . . . . . . . 211 281
Total accrued liabilities . . . . . . . . . . . . . . . . . . . . . . . . . . . . . . . . . . . . . . $1,705 $1,390
15. Debt
Long-term loans, notes and other long-term debt due to banks and other unrelated parties consisted of thefollowing:
December 31,2010
December 31,2009
Successor Predecessor
Millions of dollars
Bank credit facilities:
Senior Term Loan Facility due 2016 . . . . . . . . . . . . . . . . . . . . . . . . . $ 5 $ —
Senior secured credit facility:
Term loan A due 2013 — Dutch tranche . . . . . . . . . . . . . . . . . . . . — 331
$1,000 million revolving credit facility . . . . . . . . . . . . . . . . . . . . . — 164
Senior Secured Notes due 2017, $2,250 million, 8.0% . . . . . . . . . . . . . . 2,025 —
Senior Secured Notes due 2017, A375 million, 8.0% . . . . . . . . . . . . . . . 452 —
Senior Secured Notes due 2018, $3,240 million, 11.0% . . . . . . . . . . . . . 3,240 —
Guaranteed Notes, due 2027 . . . . . . . . . . . . . . . . . . . . . . . . . . . . . . . . . 300 300
Other . . . . . . . . . . . . . . . . . . . . . . . . . . . . . . . . . . . . . . . . . . . . . . . . . . 18 7
Total . . . . . . . . . . . . . . . . . . . . . . . . . . . . . . . . . . . . . . . . . . . . . . . . 6,040 802
Less current maturities . . . . . . . . . . . . . . . . . . . . . . . . . . . . . . . . . . . . . (4) (497)
Long-term debt . . . . . . . . . . . . . . . . . . . . . . . . . . . . . . . . . . . . . . . . $6,036 $ 305
118
LYONDELLBASELL INDUSTRIES N.V.
NOTES TO THE CONSOLIDATED FINANCIAL STATEMENTS — (Continued)
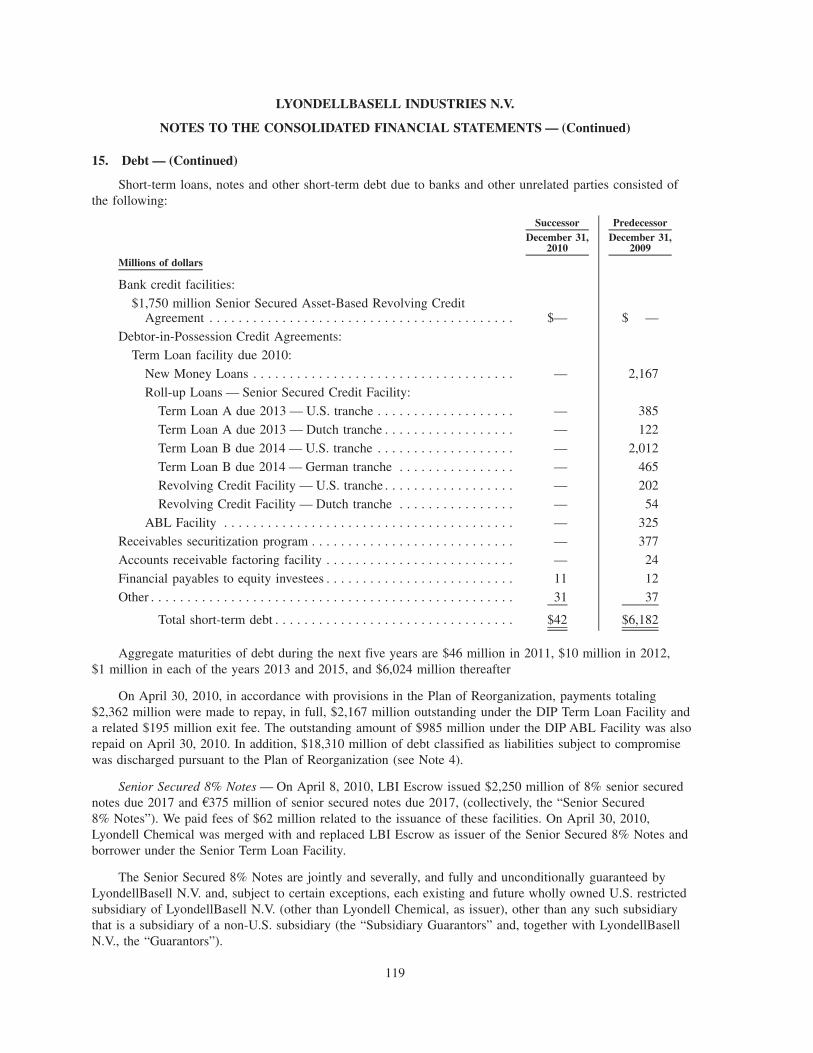
15. Debt — (Continued)
Short-term loans, notes and other short-term debt due to banks and other unrelated parties consisted ofthe following:
December 31,2010
December 31,2009
Successor Predecessor
Millions of dollars
Bank credit facilities:
$1,750 million Senior Secured Asset-Based Revolving CreditAgreement . . . . . . . . . . . . . . . . . . . . . . . . . . . . . . . . . . . . . . . . . . $— $ —
Debtor-in-Possession Credit Agreements:
Term Loan facility due 2010:
New Money Loans . . . . . . . . . . . . . . . . . . . . . . . . . . . . . . . . . . . . — 2,167
Roll-up Loans — Senior Secured Credit Facility:
Term Loan A due 2013 — U.S. tranche . . . . . . . . . . . . . . . . . . . — 385
Term Loan A due 2013 — Dutch tranche . . . . . . . . . . . . . . . . . . — 122
Term Loan B due 2014 — U.S. tranche . . . . . . . . . . . . . . . . . . . — 2,012
Term Loan B due 2014 — German tranche . . . . . . . . . . . . . . . . — 465
Revolving Credit Facility — U.S. tranche . . . . . . . . . . . . . . . . . . — 202
Revolving Credit Facility — Dutch tranche . . . . . . . . . . . . . . . . — 54
ABL Facility . . . . . . . . . . . . . . . . . . . . . . . . . . . . . . . . . . . . . . . . — 325
Receivables securitization program . . . . . . . . . . . . . . . . . . . . . . . . . . . . — 377Accounts receivable factoring facility . . . . . . . . . . . . . . . . . . . . . . . . . . — 24
Financial payables to equity investees . . . . . . . . . . . . . . . . . . . . . . . . . . 11 12
Other . . . . . . . . . . . . . . . . . . . . . . . . . . . . . . . . . . . . . . . . . . . . . . . . . . 31 37
Total short-term debt . . . . . . . . . . . . . . . . . . . . . . . . . . . . . . . . . $42 $6,182
Aggregate maturities of debt during the next five years are $46 million in 2011, $10 million in 2012,$1 million in each of the years 2013 and 2015, and $6,024 million thereafter
On April 30, 2010, in accordance with provisions in the Plan of Reorganization, payments totaling$2,362 million were made to repay, in full, $2,167 million outstanding under the DIP Term Loan Facility anda related $195 million exit fee. The outstanding amount of $985 million under the DIP ABL Facility was alsorepaid on April 30, 2010. In addition, $18,310 million of debt classified as liabilities subject to compromisewas discharged pursuant to the Plan of Reorganization (see Note 4).
Senior Secured 8% Notes — On April 8, 2010, LBI Escrow issued $2,250 million of 8% senior securednotes due 2017 and A375 million of senior secured notes due 2017, (collectively, the “Senior Secured8% Notes”). We paid fees of $62 million related to the issuance of these facilities. On April 30, 2010,Lyondell Chemical was merged with and replaced LBI Escrow as issuer of the Senior Secured 8% Notes andborrower under the Senior Term Loan Facility.
The Senior Secured 8% Notes are jointly and severally, and fully and unconditionally guaranteed byLyondellBasell N.V. and, subject to certain exceptions, each existing and future wholly owned U.S. restrictedsubsidiary of LyondellBasell N.V. (other than Lyondell Chemical, as issuer), other than any such subsidiarythat is a subsidiary of a non-U.S. subsidiary (the “Subsidiary Guarantors” and, together with LyondellBasellN.V., the “Guarantors”).
119
LYONDELLBASELL INDUSTRIES N.V.
NOTES TO THE CONSOLIDATED FINANCIAL STATEMENTS — (Continued)
15. Debt — (Continued)
The Senior Secured 8% Notes rank equally in right of payment with all existing and future senior debt ofLyondell Chemical and the Guarantors; the notes and guarantees rank junior to obligations of our subsidiariesthat do not guarantee the Senior Secured 8% Notes.
The Senior Secured 8% Notes and guarantees are secured by:
• a first priority lien on substantially all of Lyondell Chemical’s and the Subsidiary Guarantors’ existingand future property and assets other than the assets securing the U.S. ABL Facility;
• a first priority lien on the capital stock of Lyondell Chemical and all Subsidiary Guarantors (other thanany such subsidiary that is a subsidiary of a non-U.S. subsidiary);
• a first priority lien on 65% of the capital stock and 100% of the non-voting capital stock of the first-tiernon-U.S. subsidiaries of Lyondell Chemical or of LyondellBasell N.V.;
• a second priority lien on the accounts receivables, inventory, related contracts and other rights andassets related to the foregoing and proceeds thereof that secure the U.S. ABL Facility on a first prioritybasis;
• subject, in each case, to certain exceptions permitted liens and releases under certain circumstances.
The Senior Secured 8% Notes are redeemable by Lyondell Chemical (i) prior to maturity at specifiedredemption premium percentages according to the date the notes are redeemed or (ii) from time to time at aredemption price of 100% of such principal amount plus generally applicable premium as calculated pursuantto a formula.
In addition, Lyondell Chemical has the option to redeem up to 10% of the outstanding Senior Secured8% Notes annually prior to May 1, 2013 at a redemption price equal to 103% of such notes’ principal amount.Also prior to May 1, 2013, Lyondell Chemical has the option to redeem up to 35% of the original aggregateprincipal amount of the Senior Secured 8% Notes (plus any additional notes), generally at a redemption priceof 108% of such principal amount, with the net proceeds of one or more equity offerings, provided that (i) atleast 50% of the original aggregate principal amount remains outstanding immediately after such redemptionand (ii) the redemption occurs within 90 days of the closing of the equity offering. The value of this embeddedderivative is nominal.
The Senior Secured 8% Notes are redeemable at par after May 1, 2016 and contain covenants, subject tocertain exceptions, that restrict, among other things, debt and lien incurrence; investments; certain restrictedpayments; sales of assets and mergers; and affiliate transactions.
Several of the restrictive covenants would be suspended if we receive an investment grade rating fromtwo rating agencies. The Senior Secured 8% Notes are not subject to the maintenance of any specific financialcovenant.
In December 2010 we redeemed $225 million of 8.0% Senior Secured dollar notes and A37.5 million($50 million) of 8.0% Senior Secured Euro notes maturing in 2017, pursuant to the terms of the indenturerepresenting repayment of 10% of the outstanding bonds. Interest expense in the 2010 Successor periodreflects the effect of prepayment premiums of $7 million and $1 million, respectively, paid in connection withthe repayment of the 8% Senior Secured dollar notes and 8% Senior Secured Euro notes.
Senior Secured 11% Notes — Consistent with the terms of the Plan of Reorganization, on the EmergenceDate, Lyondell Chemical issued Senior Secured 11% Notes under an indenture of approximately $3,240 mil-lion, replacing the DIP Roll-up Notes issued as part of the DIP Term Loan Facility in January 2009.
120
LYONDELLBASELL INDUSTRIES N.V.
NOTES TO THE CONSOLIDATED FINANCIAL STATEMENTS — (Continued)
15. Debt — (Continued)
The Senior Secured 11% Notes are guaranteed by the same Guarantors that support the Senior Secured8% Notes, the Senior Term Loan Facility and the U.S. ABL Facility. The Senior Secured 11% Notes aresecured by the same security package as the Senior Secured 8% Notes, the Senior Term Loan Facility and theU.S. ABL Facility on a third priority basis and bear interest at a rate equal to 11%.
The Senior Secured 11% Notes are redeemable by Lyondell Chemical (i) at par on or after May 1, 2013and (ii) from time to time at a redemption price of 100% of such principal amount plus generally applicablepremium as calculated pursuant to a formula.
In addition, Lyondell Chemical has the option to redeem up to 35% of the original aggregate principalamount of the Senior Secured 11% Notes (plus any additional notes), generally at a redemption price of 111%of such principal amount, with the net proceeds of one or more equity offerings, provided that (i) at least 50%of the original aggregate principal amount remains outstanding immediately after such redemption and (ii) theredemption occurs within 90 days of the closing of the equity offering. The value of this embedded derivativeis nominal. The exercise of this option is subject to certain limitations under the Senior Term Loan Facility.
Registration Rights Agreement — In connection with the issuance of the Senior Secured 8% Notes and theSenior Secured 11% Notes (collectively, the “Senior Secured Notes”), we entered into registration rightsagreements that require us to exchange the Senior Secured Notes for notes with substantially identical terms asthe Senior Secured Notes except the new notes will be registered with the SEC under the Securities Act of1933, as amended, and will therefore be free of any transfer restrictions. The registration rights agreementrequires a registration statement for the exchange to be effective with the SEC by April 30, 2011 and theexchange to be consummated within 45 days thereafter. If we do not meet these deadlines, the interest rate onthe Senior Secured Notes will be increased by 0.25% per annum for the 90-day period following April 30,2011 and will increase by an additional 0.25% for each subsequent 90-day period that the registration andexchange are not completed, up to a maximum of 1.00% per annum.
Senior Term Loan Facility — On April 8, 2010, LBI Escrow borrowed $500 million under a new six-year,$500 million senior term loan facility (the “Senior Term Loan Facility”) and received proceeds, net ofdiscount, of $495 million. We paid fees of $10 million related to the issuance of this facility.
Borrowings under the Senior Term Loan Facility will bear interest at either (a) a LIBOR rate adjusted forcertain additional costs or (b) a base rate determined by reference to the highest of the administrative agent’sprime rate, the federal funds effective rate plus 0.5%, or one-month LIBOR plus 1.0% (the “Base Rate”), ineach case plus an applicable margin.
The Senior Term Loan Facility is guaranteed, jointly and severally, and fully and unconditionally, on asenior secured basis, initially by the Guarantors. Subject to permitted liens and other exceptions, LyondellChemical’s obligations and guarantees will be secured on a pari passu basis with the Senior Secured Notes byfirst priority security interests in the collateral securing the Senior Secured Notes and by a second prioritysecurity interest in the collateral securing the U.S. ABL Facility described below.
The Senior Term Loan Facility contains covenants that are substantially similar to the Senior SecuredNotes. The Senior Term Loan Facility is not subject to the maintenance of any specific financial covenant.
During the Successor period, we made payments under the Senior Term Loan Facility totaling $495 mil-lion, including a $1 million mandatory quarterly amortization payment in September 2010 and $494 million inDecember 2010. The payment in December 2010 satisfied all future amortization payments under the loan.
U.S. ABL Facility — On April 8, 2010, Lyondell Chemical completed the financing of a new four-year,$1,750 million U.S. asset-based facility (“U.S. ABL Facility”), which may be used for advances or to issue upto $700 million of letters of credit. Lyondell Chemical paid fees of $70 million related to the completion of
121
LYONDELLBASELL INDUSTRIES N.V.
NOTES TO THE CONSOLIDATED FINANCIAL STATEMENTS — (Continued)
15. Debt — (Continued)
this financing. Borrowings under the U.S. ABL Facility bear interest at the Base Rate or LIBOR, plus anapplicable margin, and the lenders are paid a commitment fee on the average daily unused commitments.
At December 31, 2010, there were no borrowings outstanding under the U.S. ABL facility andoutstanding letters of credit totaled $370 million. Pursuant to the U.S. ABL facility, Lyondell Chemical could,subject to a borrowing base, borrow up to $1,380 million. The borrowing base is determined using formulaeapplied to accounts receivable and inventory balances, and is reduced to the extent of outstanding letters ofcredit under the facility. Advances under this new facility are available to our subsidiaries, Lyondell Chemical,Equistar Chemicals LP (“Equistar”), Houston Refining LP, or LyondellBasell Acetyls LLC.
Obligations under the U.S. ABL Facility are guaranteed jointly and severally, and fully and uncondition-ally, on a senior secured basis, by the Guarantors (except, in the case of any Guarantor that is a borrowerunder the facility, to the extent of its own obligations in its capacity as a borrower). The borrowers’ obligationsunder the U.S. ABL Facility and the related guarantees are secured by (i) a first priority lien on all presentand after-acquired inventory, accounts receivable, related contracts and other rights, deposit accounts intowhich proceeds of the foregoing are credited, and books and records related thereto, together with all proceedsof the foregoing, in each case to the extent of the rights, title and interest therein of any ABL borrowers and(ii) a second priority lien on the Senior Secured Notes and Senior Term Loan Facility collateral.
Mandatory prepayments of the loans under the U.S. ABL Facility will be made from net cash proceedsfrom certain sales of collateral securing the facility and insurance and condemnation awards involving thefacility.
The U.S. ABL Facility contains covenants that are substantially similar to the Senior Secured Notes.
In addition, during the first two years, in the event (i) excess availability under the U.S. ABL Facilityfalls below $300 million for five consecutive business days or below $250 million on any business day, or(ii) total liquidity falls below $550 million for five consecutive business days or below $500 million on anybusiness day, we are required to comply with a minimum fixed charge coverage ratio of not less than 1.00 to1.00, measured quarterly. Following the second anniversary of the effective date, in the event (i) excessavailability under the U.S. ABL Facility falls below $400 million for five consecutive business days or below$325 million on any business day, or (ii) total liquidity falls below $650 million for five consecutive businessdays or below $575 million on any business day, we are also required to meet the minimum fixed chargecoverage ratio. The fixed charge coverage ratio is defined in the facility, generally, as the ratio of earningsbefore interest, taxes, depreciation and amortization less capital expenditures to consolidated interest expense,plus dividends on preferred or other preferential stock, adjusted for relevant taxes, and scheduled repaymentsof debt. The availability under the U.S. ABL Facility was $1,380 million as of December 31, 2010.
Guaranteed Notes due 2027 — We have outstanding fixed interest rate Guaranteed Notes of $300 millionwith a maturity date of March 15, 2027. The interest rate is 8.1% and the interest payment dates areSeptember 15 and March 15.
The Guaranteed Notes are guaranteed by LyondellBasell Industries Holdings B.V., a subsidiary ofLyondellBasell N.V. The 2027 Guaranteed Notes provide certain restrictions with respect to the level ofmaximum debt that can be incurred and security that can be granted by the operating companies in Italy andThe Netherlands that are direct or indirect wholly owned subsidiaries of LyondellBasell Industries HoldingsB.V.
The 2027 Notes contain customary provisions for default, including, among others, the non-payment ofprincipal and interest on the 2027 Notes, certain failures to perform or observe any other obligation under the2027 Agreement on the 2027 Notes, the occurrence of certain defaults under other indebtedness, failure to paycertain indebtedness and the insolvency or bankruptcy of certain LyondellBasell N.V. subsidiaries.
122
LYONDELLBASELL INDUSTRIES N.V.
NOTES TO THE CONSOLIDATED FINANCIAL STATEMENTS — (Continued)
15. Debt — (Continued)
Receivables securitization programs — On December 20, 2007, in connection with the acquisition ofLyondell Chemical, certain U.S. subsidiaries entered into a $1,150 million accounts receivable securitizationfacility to sell, through a wholly owned, bankruptcy-remote subsidiary, on an ongoing basis and withoutrecourse, interests in a pool of U.S. accounts receivable to financial institutions participating in the facility.
The amount of outstanding receivables sold under the new facility was $503 million as of December 31,2008. On January 9, 2009, as a result of the filing for relief under chapter 11 of the U.S. Bankruptcy Code,the $1,150 million accounts receivable sales facility was terminated and repaid in full, using $503 million ofthe initial proceeds of the DIP Financing.
The Company had an accounts receivable securitization program under which it could receive funding ofup to A450 million against eligible receivables of certain European subsidiaries. This facility was refinanced,in full, on May 4, 2010 and replaced with a new three-year European securitization facility. Transfers ofaccounts receivable under this program do not qualify as sales; therefore, the transferred accounts receivableand the proceeds received through such transfers are included in Trade receivables, net, and Short-term debt inthe Consolidated Balance Sheets. In October 2010, the amounts outstanding under the receivable securitizationprogram were repaid. The lenders will receive a commitment fee on the unused commitments.
Accounts Receivable Factoring Facility — On October 8, 2009, the Company entered into an accountsreceivable factoring facility for up to A100 million. The factoring facility was for an indefinite period, non-recourse, unsecured and terminable by either party subject to notice. In November 2010, the facility was paidin full and terminated.
Other — In the eight months ended December 31, 2010, and in the four months ended April 30, 2010,amortization of debt premiums and debt issuance costs resulted in amortization expense of $23 million and$307 million, respectively, that was included in interest expense in the Consolidated Statements of Income.For the years ended December 31, 2009 and 2008, such amortization was $499 million and $513 million,respectively, including adjustments to fair values included in accounting for the acquisition of LyondellChemical, and debt issuance costs.
In 2009, in conjunction with the reclassification of debt to “Liabilities Subject to Compromise,”LyondellBasell AF wrote off the associated unamortized debt issuance costs of $228 million, which arereflected in “Reorganization items” in the Consolidated Statements of Income.
Contractual interest for the Debtors was $914 million for the four-months ended April 30, 2010; and$2,720 million for the year ended December 31, 2009.
Our 2010 weighted average interest rate on outstanding short-term debt was 5% and 9.2% in the 2010Successor and Predecessor periods, respectively, and 8.8% in 2009.
16. Lease Commitments
We lease office facilities, railcars, vehicles, and other equipment under long-term operating leases. Someleases contain renewal provisions, purchase options and escalation clauses. Additionally, we have entered intoa long-term agreement with an information technology service provider that is cancellable by us with a six-month notice period and payment of a cancellation fee. This agreement is classified as an operating lease.
123
LYONDELLBASELL INDUSTRIES N.V.
NOTES TO THE CONSOLIDATED FINANCIAL STATEMENTS — (Continued)
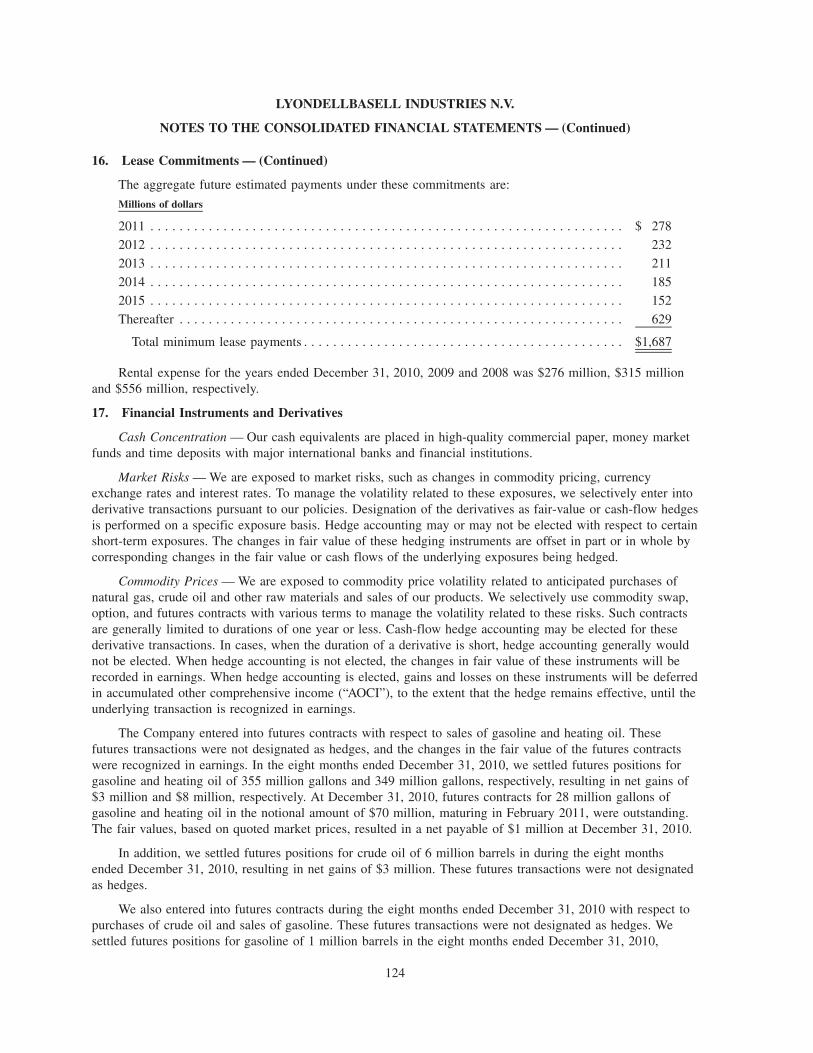
16. Lease Commitments — (Continued)
The aggregate future estimated payments under these commitments are:
Millions of dollars
2011 . . . . . . . . . . . . . . . . . . . . . . . . . . . . . . . . . . . . . . . . . . . . . . . . . . . . . . . . . . . . . . . . . $ 278
2012 . . . . . . . . . . . . . . . . . . . . . . . . . . . . . . . . . . . . . . . . . . . . . . . . . . . . . . . . . . . . . . . . . 232
2013 . . . . . . . . . . . . . . . . . . . . . . . . . . . . . . . . . . . . . . . . . . . . . . . . . . . . . . . . . . . . . . . . . 2112014 . . . . . . . . . . . . . . . . . . . . . . . . . . . . . . . . . . . . . . . . . . . . . . . . . . . . . . . . . . . . . . . . . 185
2015 . . . . . . . . . . . . . . . . . . . . . . . . . . . . . . . . . . . . . . . . . . . . . . . . . . . . . . . . . . . . . . . . . 152
Thereafter . . . . . . . . . . . . . . . . . . . . . . . . . . . . . . . . . . . . . . . . . . . . . . . . . . . . . . . . . . . . . 629
Total minimum lease payments . . . . . . . . . . . . . . . . . . . . . . . . . . . . . . . . . . . . . . . . . . . . $1,687
Rental expense for the years ended December 31, 2010, 2009 and 2008 was $276 million, $315 millionand $556 million, respectively.
17. Financial Instruments and Derivatives
Cash Concentration — Our cash equivalents are placed in high-quality commercial paper, money marketfunds and time deposits with major international banks and financial institutions.
Market Risks — We are exposed to market risks, such as changes in commodity pricing, currencyexchange rates and interest rates. To manage the volatility related to these exposures, we selectively enter intoderivative transactions pursuant to our policies. Designation of the derivatives as fair-value or cash-flow hedgesis performed on a specific exposure basis. Hedge accounting may or may not be elected with respect to certainshort-term exposures. The changes in fair value of these hedging instruments are offset in part or in whole bycorresponding changes in the fair value or cash flows of the underlying exposures being hedged.
Commodity Prices — We are exposed to commodity price volatility related to anticipated purchases ofnatural gas, crude oil and other raw materials and sales of our products. We selectively use commodity swap,option, and futures contracts with various terms to manage the volatility related to these risks. Such contractsare generally limited to durations of one year or less. Cash-flow hedge accounting may be elected for thesederivative transactions. In cases, when the duration of a derivative is short, hedge accounting generally wouldnot be elected. When hedge accounting is not elected, the changes in fair value of these instruments will berecorded in earnings. When hedge accounting is elected, gains and losses on these instruments will be deferredin accumulated other comprehensive income (“AOCI”), to the extent that the hedge remains effective, until theunderlying transaction is recognized in earnings.
The Company entered into futures contracts with respect to sales of gasoline and heating oil. Thesefutures transactions were not designated as hedges, and the changes in the fair value of the futures contractswere recognized in earnings. In the eight months ended December 31, 2010, we settled futures positions forgasoline and heating oil of 355 million gallons and 349 million gallons, respectively, resulting in net gains of$3 million and $8 million, respectively. At December 31, 2010, futures contracts for 28 million gallons ofgasoline and heating oil in the notional amount of $70 million, maturing in February 2011, were outstanding.The fair values, based on quoted market prices, resulted in a net payable of $1 million at December 31, 2010.
In addition, we settled futures positions for crude oil of 6 million barrels in during the eight monthsended December 31, 2010, resulting in net gains of $3 million. These futures transactions were not designatedas hedges.
We also entered into futures contracts during the eight months ended December 31, 2010 with respect topurchases of crude oil and sales of gasoline. These futures transactions were not designated as hedges. Wesettled futures positions for gasoline of 1 million barrels in the eight months ended December 31, 2010,
124
LYONDELLBASELL INDUSTRIES N.V.
NOTES TO THE CONSOLIDATED FINANCIAL STATEMENTS — (Continued)
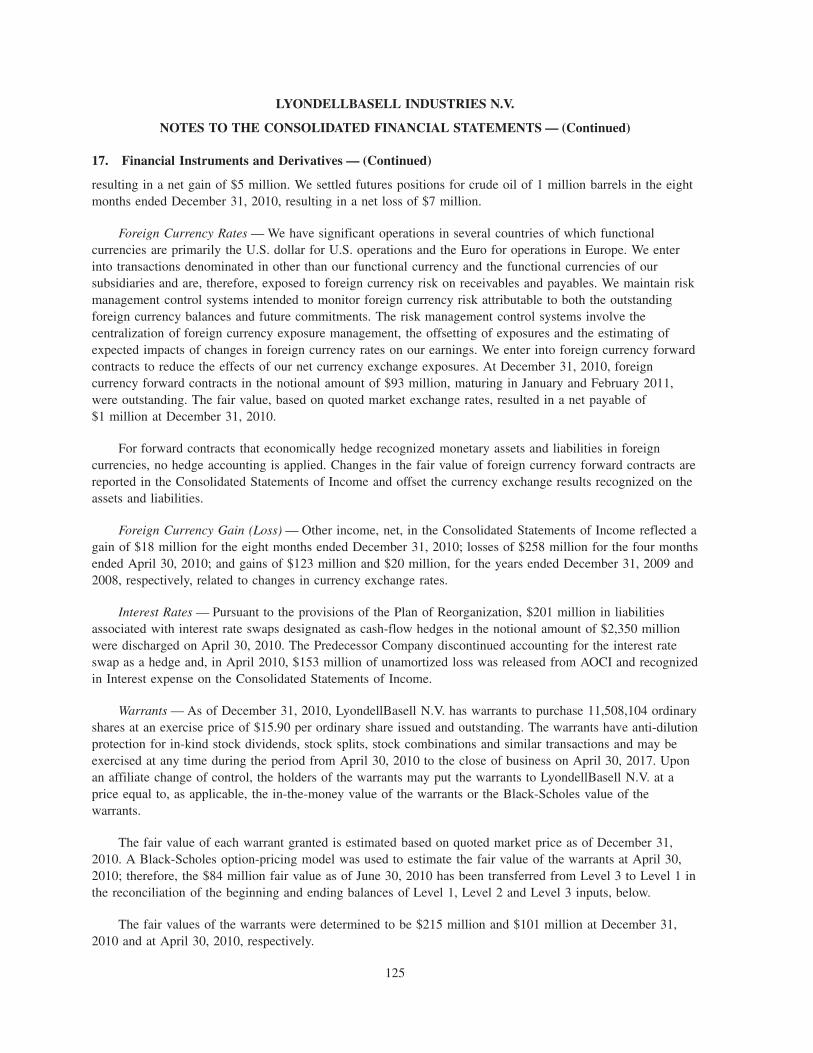
17. Financial Instruments and Derivatives — (Continued)
resulting in a net gain of $5 million. We settled futures positions for crude oil of 1 million barrels in the eightmonths ended December 31, 2010, resulting in a net loss of $7 million.
Foreign Currency Rates — We have significant operations in several countries of which functionalcurrencies are primarily the U.S. dollar for U.S. operations and the Euro for operations in Europe. We enterinto transactions denominated in other than our functional currency and the functional currencies of oursubsidiaries and are, therefore, exposed to foreign currency risk on receivables and payables. We maintain riskmanagement control systems intended to monitor foreign currency risk attributable to both the outstandingforeign currency balances and future commitments. The risk management control systems involve thecentralization of foreign currency exposure management, the offsetting of exposures and the estimating ofexpected impacts of changes in foreign currency rates on our earnings. We enter into foreign currency forwardcontracts to reduce the effects of our net currency exchange exposures. At December 31, 2010, foreigncurrency forward contracts in the notional amount of $93 million, maturing in January and February 2011,were outstanding. The fair value, based on quoted market exchange rates, resulted in a net payable of$1 million at December 31, 2010.
For forward contracts that economically hedge recognized monetary assets and liabilities in foreigncurrencies, no hedge accounting is applied. Changes in the fair value of foreign currency forward contracts arereported in the Consolidated Statements of Income and offset the currency exchange results recognized on theassets and liabilities.
Foreign Currency Gain (Loss) — Other income, net, in the Consolidated Statements of Income reflected again of $18 million for the eight months ended December 31, 2010; losses of $258 million for the four monthsended April 30, 2010; and gains of $123 million and $20 million, for the years ended December 31, 2009 and2008, respectively, related to changes in currency exchange rates.
Interest Rates — Pursuant to the provisions of the Plan of Reorganization, $201 million in liabilitiesassociated with interest rate swaps designated as cash-flow hedges in the notional amount of $2,350 millionwere discharged on April 30, 2010. The Predecessor Company discontinued accounting for the interest rateswap as a hedge and, in April 2010, $153 million of unamortized loss was released from AOCI and recognizedin Interest expense on the Consolidated Statements of Income.
Warrants — As of December 31, 2010, LyondellBasell N.V. has warrants to purchase 11,508,104 ordinaryshares at an exercise price of $15.90 per ordinary share issued and outstanding. The warrants have anti-dilutionprotection for in-kind stock dividends, stock splits, stock combinations and similar transactions and may beexercised at any time during the period from April 30, 2010 to the close of business on April 30, 2017. Uponan affiliate change of control, the holders of the warrants may put the warrants to LyondellBasell N.V. at aprice equal to, as applicable, the in-the-money value of the warrants or the Black-Scholes value of thewarrants.
The fair value of each warrant granted is estimated based on quoted market price as of December 31,2010. A Black-Scholes option-pricing model was used to estimate the fair value of the warrants at April 30,2010; therefore, the $84 million fair value as of June 30, 2010 has been transferred from Level 3 to Level 1 inthe reconciliation of the beginning and ending balances of Level 1, Level 2 and Level 3 inputs, below.
The fair values of the warrants were determined to be $215 million and $101 million at December 31,2010 and at April 30, 2010, respectively.
125
LYONDELLBASELL INDUSTRIES N.V.
NOTES TO THE CONSOLIDATED FINANCIAL STATEMENTS — (Continued)
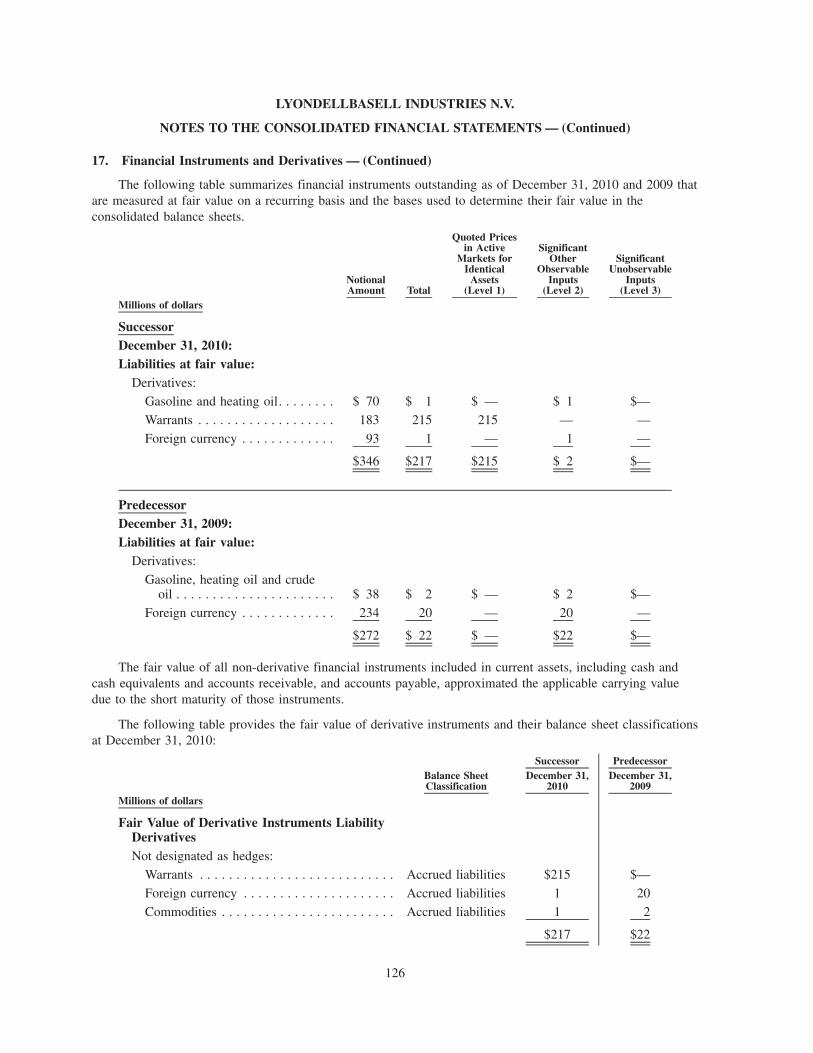
17. Financial Instruments and Derivatives — (Continued)
The following table summarizes financial instruments outstanding as of December 31, 2010 and 2009 thatare measured at fair value on a recurring basis and the bases used to determine their fair value in theconsolidated balance sheets.
NotionalAmount Total
Quoted Pricesin Active
Markets forIdentical
Assets(Level 1)
SignificantOther
ObservableInputs
(Level 2)
SignificantUnobservable
Inputs(Level 3)
Millions of dollars
SuccessorDecember 31, 2010:Liabilities at fair value:
Derivatives:Gasoline and heating oil. . . . . . . . $ 70 $ 1 $ — $ 1 $—
Warrants . . . . . . . . . . . . . . . . . . . 183 215 215 — —
Foreign currency . . . . . . . . . . . . . 93 1 — 1 —
$346 $217 $215 $ 2 $—
PredecessorDecember 31, 2009:Liabilities at fair value:
Derivatives:
Gasoline, heating oil and crudeoil . . . . . . . . . . . . . . . . . . . . . . $ 38 $ 2 $ — $ 2 $—
Foreign currency . . . . . . . . . . . . . 234 20 — 20 —
$272 $ 22 $ — $22 $—
The fair value of all non-derivative financial instruments included in current assets, including cash andcash equivalents and accounts receivable, and accounts payable, approximated the applicable carrying valuedue to the short maturity of those instruments.
The following table provides the fair value of derivative instruments and their balance sheet classificationsat December 31, 2010:
Balance SheetClassification
December 31,2010
December 31,2009
Successor Predecessor
Millions of dollars
Fair Value of Derivative Instruments LiabilityDerivativesNot designated as hedges:
Warrants . . . . . . . . . . . . . . . . . . . . . . . . . . . Accrued liabilities $215 $—
Foreign currency . . . . . . . . . . . . . . . . . . . . . Accrued liabilities 1 20
Commodities . . . . . . . . . . . . . . . . . . . . . . . . Accrued liabilities 1 2
$217 $22
126
LYONDELLBASELL INDUSTRIES N.V.
NOTES TO THE CONSOLIDATED FINANCIAL STATEMENTS — (Continued)

17. Financial Instruments and Derivatives — (Continued)
The following table summarizes the pretax effect of derivative instruments charged directly to income:
Gain (Loss)Recognized
in AOCI
Gain (Loss)Reclassifiedfrom AOCIto Income
AdditionalGain (Loss)Recognizedin Income
Income StatementClassification
Effect of Financial Instruments
Millions of dollars
SuccessorFor the period May 1 through
December 31, 2010:Derivatives not designated as hedges:
Warrants . . . . . . . . . . . . . . . . . . . . . . . $ — $ — $(114)Other income(expense), net
Commodities . . . . . . . . . . . . . . . . . . . . — — 11 Cost of sales
Foreign currency . . . . . . . . . . . . . . . . . — — (2)Other income(expense), net
$ — $ — $(105)
PredecessorFor the period January 1 through
April 30, 2010:Derivatives designated as cash-flow
hedges:
Interest rate . . . . . . . . . . . . . . . . . . . . . $ — $(17) $ — Interest Expense
Derivatives not designated as hedges:
Commodities . . . . . . . . . . . . . . . . . . . . — — 6 Cost of sales
Foreign currency . . . . . . . . . . . . . . . . . — — 8Other income(expense), net
— — 14
$ — $(17) $ 14
Non-derivatives designated as hedges offoreign currency:
Net foreign investment —
8.1% Guaranteed Notes due 2027 . . . $(24) $ — $ —8.375% Senior Notes due 2015. . . . . (20) — —
$(44) $ — $ —
127
LYONDELLBASELL INDUSTRIES N.V.
NOTES TO THE CONSOLIDATED FINANCIAL STATEMENTS — (Continued)

17. Financial Instruments and Derivatives — (Continued)
Gain (Loss)Recognized
in AOCI
Gain (Loss)Reclassifiedfrom AOCIto Income
AdditionalGain (Loss)Recognizedin Income
Income StatementClassification
Effect of Financial Instruments
Millions of dollars
PredecessorFor the year ended December 31, 2009:Derivatives designated as cash-flow
hedges:
Commodities . . . . . . . . . . . . . . . . . . . . $— $ 50 $ — Cost of sales
Cross-currency interest rate . . . . . . . . . 23 23 —Other income(expense), net
Interest rate . . . . . . . . . . . . . . . . . . . . . (5) (31) — Interest expense
18 42 —
Derivatives not designated as hedges:
Commodities . . . . . . . . . . . . . . . . . . . . — — 36 Cost of sales
Foreign currency . . . . . . . . . . . . . . . . . — — (15)Other income(expense), net
Stock option plans . . . . . . . . . . . . . . . . — — (3)Other income(expense), net
— — 18
$18 $ 42 $ 18
Non-derivatives designated as hedges offoreign currency:
Net foreign investment —
8.1% Guaranteed Notes due 2027 . . . $ 9 $ — $ —
8.375% Senior Notes due 2015 . . . . . 8 — —
$17 $ — $ —
128
LYONDELLBASELL INDUSTRIES N.V.
NOTES TO THE CONSOLIDATED FINANCIAL STATEMENTS — (Continued)

17. Financial Instruments and Derivatives — (Continued)
Gain (Loss)Recognized
in AOCI
Gain (Loss)Reclassifiedfrom AOCIto Income
AdditionalGain (Loss)Recognizedin Income
Income StatementClassification
Effect of Financial Instruments
Millions of dollars
PredecessorFor the year ended December 31, 2008:Derivatives designated as cash-flow
hedges:
Commodities . . . . . . . . . . . . . . . . . . . . $ 112 $ 62 $ — Cost of sales
Cross-currency interest rate . . . . . . . . . 22 (22) —Other income(expense), net
Interest rate . . . . . . . . . . . . . . . . . . . . . (241) — 35 Interest expense
(107) 40 35
Derivatives not designated as hedges:
Commodities . . . . . . . . . . . . . . . . . . . . — — 9 Cost of sales
Foreign currency . . . . . . . . . . . . . . . . . — — 74Other income(expense), net
Stock option plans . . . . . . . . . . . . . . . . — — (5)Other income(expense), net
— — 78
$(107) $ 40 $113
Non-derivatives designated as hedges offoreign currency:
Net foreign investment —
8.1% Guaranteed Notes due 2027 . . . $ (13) $ — $ —
Dutch tranche A term loan . . . . . . . . (19) — —
8.375% Senior Notes due 2015 . . . . . (11) — —
$ (43) $ — $ —
The carrying value and the estimated fair value of the Company’s non-derivative financial instruments areshown in the table below:
CarryingValue
FairValue
CarryingValue
FairValue
December 31, 2010 December 31, 2009Successor Predecessor
Millions of dollars
Short and long-term debt, including current maturitiesand debt classified as liabilities subject tocompromise . . . . . . . . . . . . . . . . . . . . . . . . . . . . . . . . $6,079 $6,819 $25,354 $13,986
129
LYONDELLBASELL INDUSTRIES N.V.
NOTES TO THE CONSOLIDATED FINANCIAL STATEMENTS — (Continued)

17. Financial Instruments and Derivatives — (Continued)
The following table summarizes the bases used to measure certain liabilities at fair value on a recurringbasis, which are recorded at historical cost or amortized cost, in the consolidated balance sheet:
CarryingValue
December 31,2010
Fair ValueDecember 31,
2010
Quoted pricesin active
markets foridentical
assets(Level 1)
Significantother
observableinputs
(Level 2)
Significantunobservable
inputs(Level 3)
Successor Fair Value Measurement
Millions of dollars
Short and long-term debt, includingcurrent maturities . . . . . . . . . . . . . . $6,079 $6,819 $— $6,774 $45
The following table is a reconciliation of the beginning and ending balances of Level 1, Level 2 andLevel 3 inputs:
Fair ValueMeasurementUsing Quoted
prices in activemarkets for
identical assets(Level 1)
Fair ValueMeasurement
UsingSignificant
OtherObservable
Inputs (Level 2)
Fair ValueMeasurement
UsingSignificant
UnobservableInputs (Level 3)
Millions of dollars
Debt and warrantsBalance at May 1, 2010 . . . . . . . . . . . . . . . . . . . . . . . . . . . . $ — $6,766 $ 558
Purchases, sales, issuances, and settlements (net) . . . . . . . . . . — (770) (414)
Transfers in and/or out of Level 3 . . . . . . . . . . . . . . . . . . . . . 84 — (84)
Total gains or losses (realized/unrealized) . . . . . . . . . . . . . . . 131 778 (15)
Balance at December 31, 2010 . . . . . . . . . . . . . . . . . . . . . $215 $6,774 $ 45
For liabilities classified as Level 1, the fair value is measured using quoted prices in active markets. Thetotal fair value is either the price of the most recent trade at the time of the market close or the official closeprice, as defined by the exchange in which the asset is most actively traded on the last trading day of theperiod, multiplied by the number of units held without consideration of transaction costs. For liabilitiesclassified as Level 2, fair value is based on the price a market participant would pay for the security, adjustedfor the terms specific to that asset and liability. Broker quotes were obtained from well established andrecognized vendors of market data for debt valuations. The inputs for liabilities classified as Level 3 reflectour assessment of the assumptions that a market participant would use in determining the price of the asset orliability, including our liquidity risk at December 31, 2010.
The fair values of Level 3 instruments are determined using pricing data similar to that used in Level 2financial instruments described above, and reflect adjustments for less liquid markets or longer contractualterms. For these Level 3 financial instruments, pricing data obtained from third party pricing sources isadjusted for the liquidity of the underlying over the contractual terms to develop an estimated price thatmarket participants would use. Our valuation of these instruments considers specific contractual terms, presentvalue concepts and other internal assumptions related to (i) contract maturities that extend beyond the periodsin which quoted market prices are available; (ii) the uniqueness of the contract terms; and (iii) ourcreditworthiness or that of our counterparties (adjusted for collateral related to our asset positions). Based onour calculations, we expect that a significant portion of other debts will react in a generally proportionate
130
LYONDELLBASELL INDUSTRIES N.V.
NOTES TO THE CONSOLIDATED FINANCIAL STATEMENTS — (Continued)

17. Financial Instruments and Derivatives — (Continued)
manner to changes in the benchmark interest rate. Accordingly, these financial instruments are fair valued atpar and are classified as Level 3.
18. Pension and Other Postretirement Benefits
We have defined benefit pension plans which cover employees in the U.S. and various non-U.S. countries.We also sponsor postretirement benefit plans other than pensions that provide medical benefits to our U.S. andCanadian employees. In addition, we provide other post employment benefits such as early retirement anddeferred compensation severance benefits to employees of certain non-U.S. countries. We use a measurementdate of December 31 for all of our benefit plans.
Employees in the U.S. are eligible to participate in defined contribution plans (Employee Savings Plans)by contributing a portion of their compensation. We match a part of the employees’ contributions.
Pensions — Substantially all of our employees in Germany are covered under several defined benefitpension plans, which provide for benefits based on years of service and average rates of pay. Up to a certainsalary level, the benefit obligations regarding the majority of the German employees are covered bycontributions of the Company and the employees to the Pensionskasse der BASF VVaG. In 2010, ourcontributions into this plan were $7 million. In addition, we offer an unfunded supplementary plan foremployees earning in excess of the local social security limits. For certain employees we offer an unfundedpension plan.
For 2010 the actual return on plan assets for the U.S. and non-U.S. was 15.6% and 8.4%, respectively.
Under the Plan of Reorganization, except with respect to the Supplemental Executive Retirement Plan, allbenefit plans and collective bargaining agreements remained in force subsequent to the Debtors’ emergencefrom chapter 11 proceedings. Accordingly, approximately $854 million of pension and other post-retirementbenefit liabilities were reclassified from liabilities subject to compromise to current or long-term liabilities, asappropriate, upon emergence from bankruptcy (see Note 4).
The U.S. bankruptcy court approved the termination of the U.S. Supplemental Executive Retirement Plansas of January 6, 2009. The termination of these plans resulted in a gain of $4 million. Due to the bankruptcyno benefits were paid as a result of the plan termination. The beneficiaries of these plans had outstandingclaims of $48 million, $8 million of which is related to non-U.S. employees, filed with the bankruptcy court.The liability balance for these claims was discharged pursuant to the Plan of Reorganization (see Note 4).
In 2010, the settlement gain of $15 million in the U.S. plans reflected payments of lump sum benefits inthe Pension Plans for Eligible Hourly Non-Represented Employees of Equistar Chemicals, LP and HoustonRefining LP Retirement Plan for Eligible Hourly Non-Represented Employees. In 2009, the settlement gain of$11 million in the U.S. plans reflected payments of lump sum benefits in the Pension Plan for Eligible HourlyRepresented Employees of Equistar Chemicals, LP and the Houston Refining LP Retirement Plan forRepresented Employees.
The accounting for a reduction in expected years of future service due to the headcount reductionprogram resulted in a $5 million curtailment charge in 2009 related to the U.S. plans: LyondellBasellRetirement Plan, Equistar Chemicals, LP Retirement Plan, and Basell Retirement Income Plan.
Divestitures — In December 2010, we sold our Flavor and Fragrance chemicals business. The plan andrelated obligations covering the retired employees of the business were retained by LyondellBasell N.V. As aresult of this divestiture, the accumulated benefit obligation related to the plan decreased by approximately$4 million, resulting in a curtailment. The gain associated with the curtailment was not recognized in 2010since it does not exceed the unrecognized net loss existing under the plan.
131
LYONDELLBASELL INDUSTRIES N.V.
NOTES TO THE CONSOLIDATED FINANCIAL STATEMENTS — (Continued)
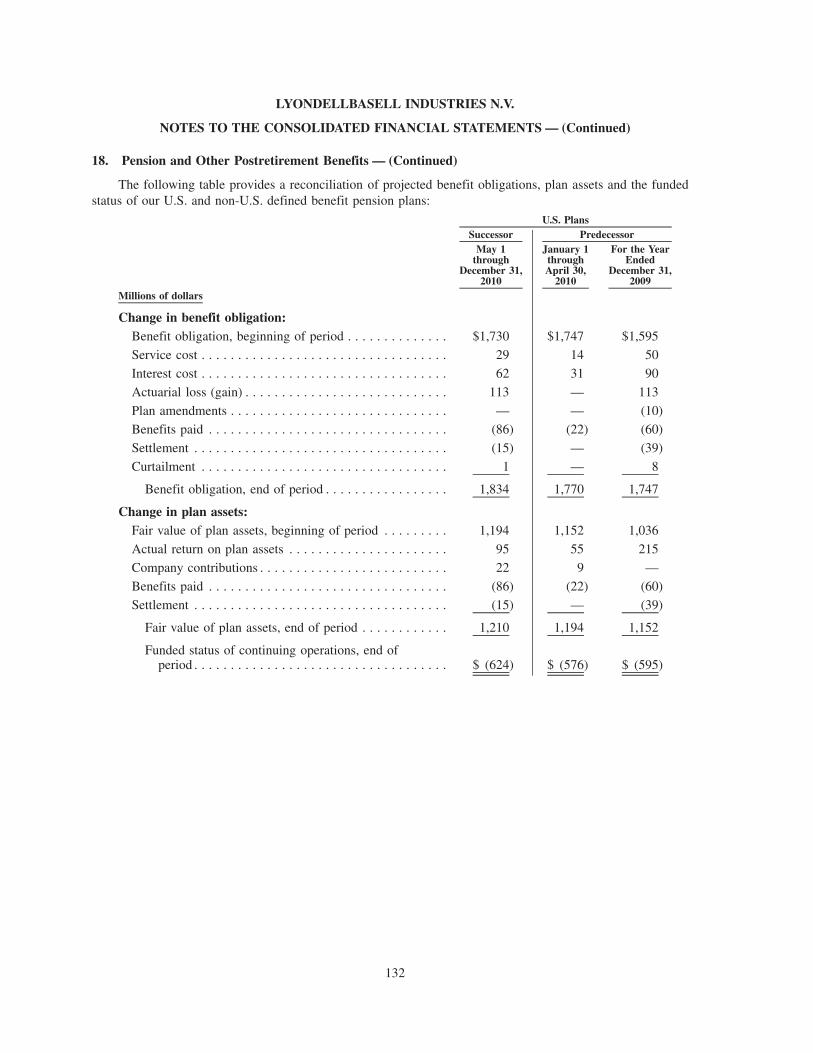
18. Pension and Other Postretirement Benefits — (Continued)
The following table provides a reconciliation of projected benefit obligations, plan assets and the fundedstatus of our U.S. and non-U.S. defined benefit pension plans:
May 1through
December 31,2010
January 1throughApril 30,
2010
For the YearEnded
December 31,2009
Successor PredecessorU.S. Plans
Millions of dollars
Change in benefit obligation:Benefit obligation, beginning of period . . . . . . . . . . . . . . $1,730 $1,747 $1,595
Service cost . . . . . . . . . . . . . . . . . . . . . . . . . . . . . . . . . . 29 14 50
Interest cost . . . . . . . . . . . . . . . . . . . . . . . . . . . . . . . . . . 62 31 90
Actuarial loss (gain) . . . . . . . . . . . . . . . . . . . . . . . . . . . . 113 — 113
Plan amendments . . . . . . . . . . . . . . . . . . . . . . . . . . . . . . — — (10)
Benefits paid . . . . . . . . . . . . . . . . . . . . . . . . . . . . . . . . . (86) (22) (60)
Settlement . . . . . . . . . . . . . . . . . . . . . . . . . . . . . . . . . . . (15) — (39)
Curtailment . . . . . . . . . . . . . . . . . . . . . . . . . . . . . . . . . . 1 — 8
Benefit obligation, end of period . . . . . . . . . . . . . . . . . 1,834 1,770 1,747
Change in plan assets:Fair value of plan assets, beginning of period . . . . . . . . . 1,194 1,152 1,036
Actual return on plan assets . . . . . . . . . . . . . . . . . . . . . . 95 55 215
Company contributions . . . . . . . . . . . . . . . . . . . . . . . . . . 22 9 —
Benefits paid . . . . . . . . . . . . . . . . . . . . . . . . . . . . . . . . . (86) (22) (60)
Settlement . . . . . . . . . . . . . . . . . . . . . . . . . . . . . . . . . . . (15) — (39)
Fair value of plan assets, end of period . . . . . . . . . . . . 1,210 1,194 1,152
Funded status of continuing operations, end ofperiod . . . . . . . . . . . . . . . . . . . . . . . . . . . . . . . . . . . $ (624) $ (576) $ (595)
132
LYONDELLBASELL INDUSTRIES N.V.
NOTES TO THE CONSOLIDATED FINANCIAL STATEMENTS — (Continued)
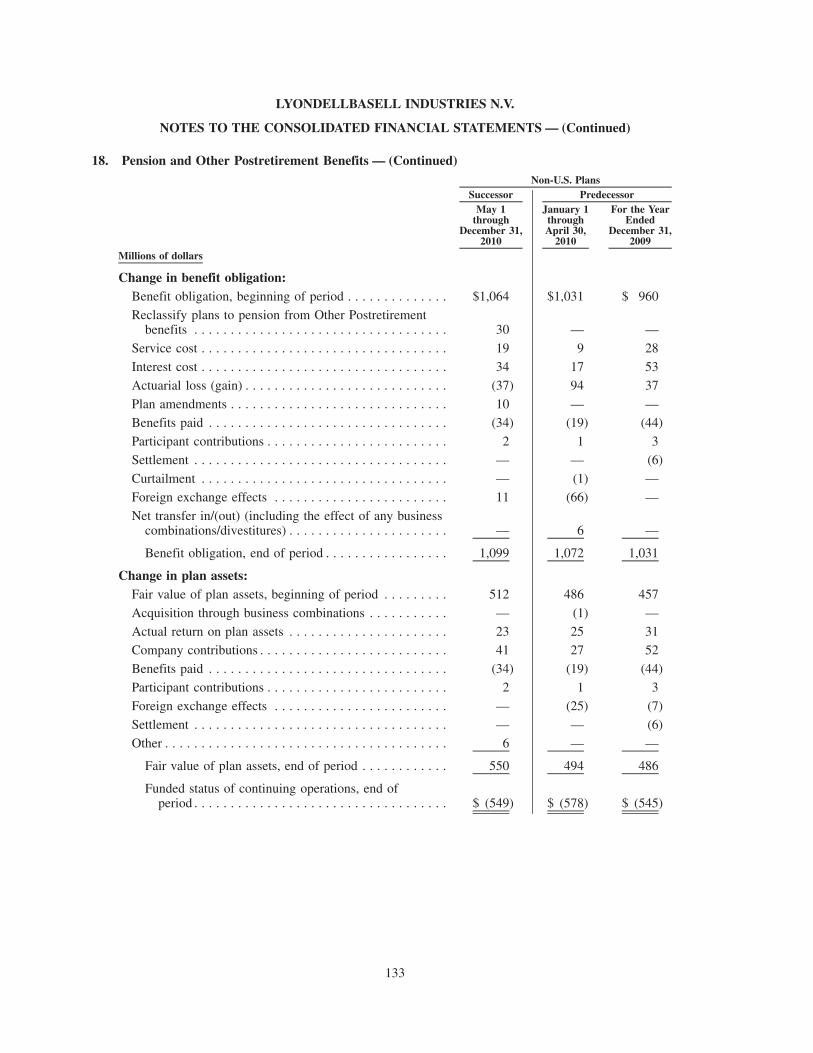
18. Pension and Other Postretirement Benefits — (Continued)
May 1through
December 31,2010
January 1throughApril 30,
2010
For the YearEnded
December 31,2009
Successor PredecessorNon-U.S. Plans
Millions of dollars
Change in benefit obligation:Benefit obligation, beginning of period . . . . . . . . . . . . . . $1,064 $1,031 $ 960
Reclassify plans to pension from Other Postretirementbenefits . . . . . . . . . . . . . . . . . . . . . . . . . . . . . . . . . . . 30 — —
Service cost . . . . . . . . . . . . . . . . . . . . . . . . . . . . . . . . . . 19 9 28
Interest cost . . . . . . . . . . . . . . . . . . . . . . . . . . . . . . . . . . 34 17 53
Actuarial loss (gain) . . . . . . . . . . . . . . . . . . . . . . . . . . . . (37) 94 37
Plan amendments . . . . . . . . . . . . . . . . . . . . . . . . . . . . . . 10 — —
Benefits paid . . . . . . . . . . . . . . . . . . . . . . . . . . . . . . . . . (34) (19) (44)
Participant contributions . . . . . . . . . . . . . . . . . . . . . . . . . 2 1 3
Settlement . . . . . . . . . . . . . . . . . . . . . . . . . . . . . . . . . . . — — (6)
Curtailment . . . . . . . . . . . . . . . . . . . . . . . . . . . . . . . . . . — (1) —
Foreign exchange effects . . . . . . . . . . . . . . . . . . . . . . . . 11 (66) —
Net transfer in/(out) (including the effect of any businesscombinations/divestitures) . . . . . . . . . . . . . . . . . . . . . . — 6 —
Benefit obligation, end of period . . . . . . . . . . . . . . . . . 1,099 1,072 1,031
Change in plan assets:Fair value of plan assets, beginning of period . . . . . . . . . 512 486 457
Acquisition through business combinations . . . . . . . . . . . — (1) —
Actual return on plan assets . . . . . . . . . . . . . . . . . . . . . . 23 25 31Company contributions . . . . . . . . . . . . . . . . . . . . . . . . . . 41 27 52
Benefits paid . . . . . . . . . . . . . . . . . . . . . . . . . . . . . . . . . (34) (19) (44)
Participant contributions . . . . . . . . . . . . . . . . . . . . . . . . . 2 1 3
Foreign exchange effects . . . . . . . . . . . . . . . . . . . . . . . . — (25) (7)
Settlement . . . . . . . . . . . . . . . . . . . . . . . . . . . . . . . . . . . — — (6)
Other . . . . . . . . . . . . . . . . . . . . . . . . . . . . . . . . . . . . . . . 6 — —
Fair value of plan assets, end of period . . . . . . . . . . . . 550 494 486
Funded status of continuing operations, end ofperiod . . . . . . . . . . . . . . . . . . . . . . . . . . . . . . . . . . . $ (549) $ (578) $ (545)
133
LYONDELLBASELL INDUSTRIES N.V.
NOTES TO THE CONSOLIDATED FINANCIAL STATEMENTS — (Continued)
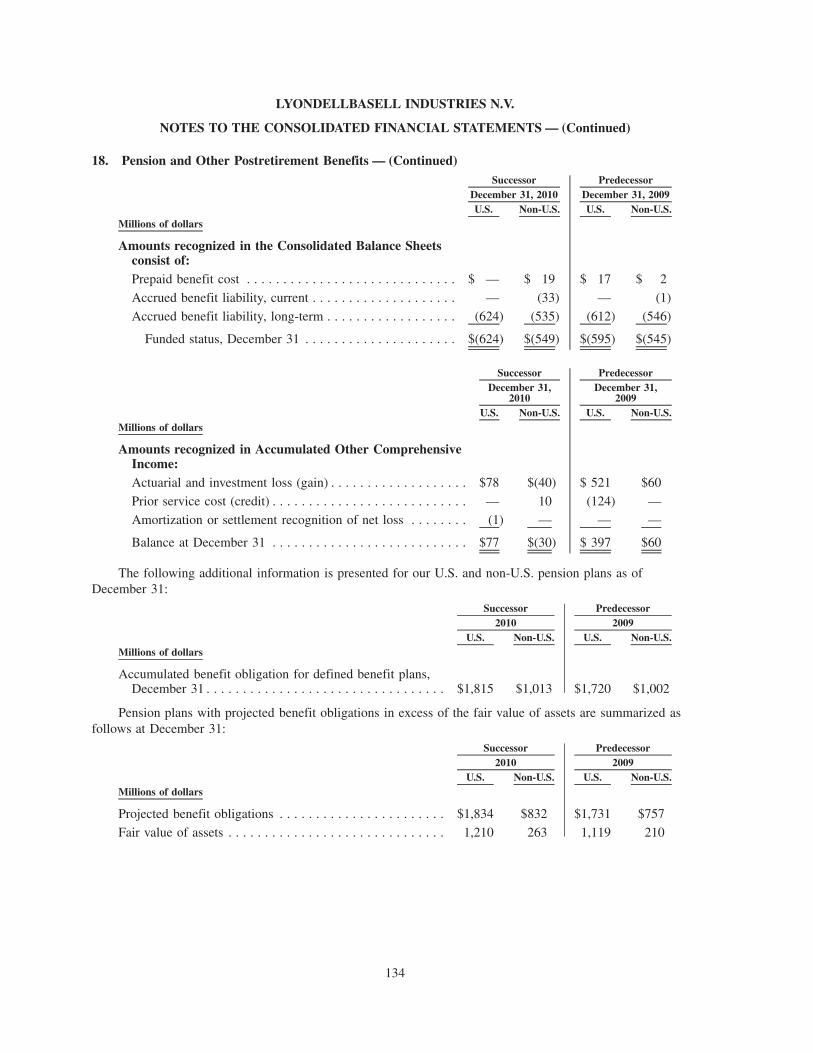
18. Pension and Other Postretirement Benefits — (Continued)
U.S. Non-U.S. U.S. Non-U.S.December 31, 2010 December 31, 2009
Successor Predecessor
Millions of dollars
Amounts recognized in the Consolidated Balance Sheetsconsist of:Prepaid benefit cost . . . . . . . . . . . . . . . . . . . . . . . . . . . . . $ — $ 19 $ 17 $ 2
Accrued benefit liability, current . . . . . . . . . . . . . . . . . . . . — (33) — (1)
Accrued benefit liability, long-term . . . . . . . . . . . . . . . . . . (624) (535) (612) (546)
Funded status, December 31 . . . . . . . . . . . . . . . . . . . . . $(624) $(549) $(595) $(545)
U.S. Non-U.S. U.S. Non-U.S.
December 31,2010
December 31,2009
Successor Predecessor
Millions of dollars
Amounts recognized in Accumulated Other ComprehensiveIncome:Actuarial and investment loss (gain) . . . . . . . . . . . . . . . . . . . $78 $(40) $ 521 $60
Prior service cost (credit) . . . . . . . . . . . . . . . . . . . . . . . . . . . — 10 (124) —
Amortization or settlement recognition of net loss . . . . . . . . (1) — — —
Balance at December 31 . . . . . . . . . . . . . . . . . . . . . . . . . . . $77 $(30) $ 397 $60
The following additional information is presented for our U.S. and non-U.S. pension plans as ofDecember 31:
U.S. Non-U.S. U.S. Non-U.S.2010 2009
Successor Predecessor
Millions of dollars
Accumulated benefit obligation for defined benefit plans,December 31 . . . . . . . . . . . . . . . . . . . . . . . . . . . . . . . . . $1,815 $1,013 $1,720 $1,002
Pension plans with projected benefit obligations in excess of the fair value of assets are summarized asfollows at December 31:
U.S. Non-U.S. U.S. Non-U.S.2010 2009
Successor Predecessor
Millions of dollars
Projected benefit obligations . . . . . . . . . . . . . . . . . . . . . . . $1,834 $832 $1,731 $757
Fair value of assets . . . . . . . . . . . . . . . . . . . . . . . . . . . . . . 1,210 263 1,119 210
134
LYONDELLBASELL INDUSTRIES N.V.
NOTES TO THE CONSOLIDATED FINANCIAL STATEMENTS — (Continued)

18. Pension and Other Postretirement Benefits — (Continued)
Pension plans with accumulated benefit obligations in excess of the fair value of assets are summarizedas follows at December 31:
U.S. Non-U.S. U.S. Non-U.S.2010 2009
Successor Predecessor
Millions of dollars
Accumulated benefit obligations . . . . . . . . . . . . . . . . . . . . $1,815 $712 $1,704 $734
Fair value of assets . . . . . . . . . . . . . . . . . . . . . . . . . . . . . . 1,210 173 1,119 210
The following table provides the components of net periodic pension costs:
May 1through
December 31,2010
January 1throughApril 30,
2010 2009 2008
For the YearEnded
December 31,
Successor PredecessorU.S. Plans
Millions of dollars
Net Periodic Pension Cost:Service cost . . . . . . . . . . . . . . . . . . . . . . . . . . . . . . . $ 29 $ 14 $ 50 $ 50
Interest cost . . . . . . . . . . . . . . . . . . . . . . . . . . . . . . . 62 31 90 105
Actual return on plan assets . . . . . . . . . . . . . . . . . . . . (95) (55) (215) 467
Less — return in excess of (less than) expectedreturn . . . . . . . . . . . . . . . . . . . . . . . . . . . . . . . . . . 35 24 125 (593)
Expected return on plan assets . . . . . . . . . . . . . . . . . . (60) (31) (90) (126)
Settlement and curtailment loss (gain) . . . . . . . . . . . . 2 — 2 1
Prior service cost (benefit) amortization . . . . . . . . . . . — (4) (14) (3)
Actuarial and investment loss amortization . . . . . . . . . — 8 27 —
Net periodic benefit cost (benefit) . . . . . . . . . . . . . $ 33 $ 18 $ 65 $ 27
135
LYONDELLBASELL INDUSTRIES N.V.
NOTES TO THE CONSOLIDATED FINANCIAL STATEMENTS — (Continued)
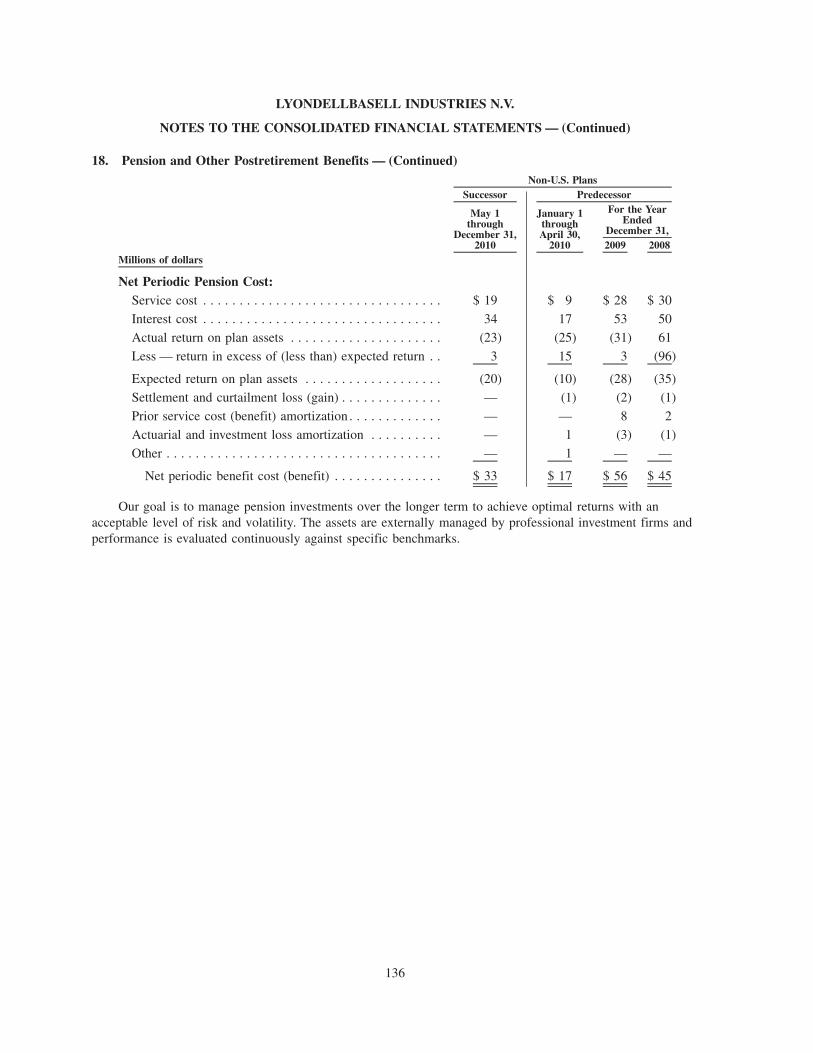
18. Pension and Other Postretirement Benefits — (Continued)
May 1through
December 31,2010
January 1throughApril 30,
2010 2009 2008
For the YearEnded
December 31,
Successor PredecessorNon-U.S. Plans
Millions of dollars
Net Periodic Pension Cost:Service cost . . . . . . . . . . . . . . . . . . . . . . . . . . . . . . . . . $ 19 $ 9 $ 28 $ 30
Interest cost . . . . . . . . . . . . . . . . . . . . . . . . . . . . . . . . . 34 17 53 50
Actual return on plan assets . . . . . . . . . . . . . . . . . . . . . (23) (25) (31) 61
Less — return in excess of (less than) expected return . . 3 15 3 (96)
Expected return on plan assets . . . . . . . . . . . . . . . . . . . (20) (10) (28) (35)
Settlement and curtailment loss (gain) . . . . . . . . . . . . . . — (1) (2) (1)
Prior service cost (benefit) amortization . . . . . . . . . . . . . — — 8 2
Actuarial and investment loss amortization . . . . . . . . . . — 1 (3) (1)
Other . . . . . . . . . . . . . . . . . . . . . . . . . . . . . . . . . . . . . . — 1 — —
Net periodic benefit cost (benefit) . . . . . . . . . . . . . . . $ 33 $ 17 $ 56 $ 45
Our goal is to manage pension investments over the longer term to achieve optimal returns with anacceptable level of risk and volatility. The assets are externally managed by professional investment firms andperformance is evaluated continuously against specific benchmarks.
136
LYONDELLBASELL INDUSTRIES N.V.
NOTES TO THE CONSOLIDATED FINANCIAL STATEMENTS — (Continued)

18. Pension and Other Postretirement Benefits — (Continued)
The actual and target allocation for our plans are as follows:
Actual Target Actual Target2010 2009
Successor Predecessor
Canada
Equity securities . . . . . . . . . . . . . . . . . . . . . . . . . . . . . . . . . . . 60% 60% 62% 60%
Fixed income . . . . . . . . . . . . . . . . . . . . . . . . . . . . . . . . . . . . . 40% 40% 38% 40%
United Kingdom — Lyondell Chemical Plans
Equity securities . . . . . . . . . . . . . . . . . . . . . . . . . . . . . . . . . . . 52% 50% 51% 50%
Fixed income . . . . . . . . . . . . . . . . . . . . . . . . . . . . . . . . . . . . . 48% 50% 49% 50%United Kingdom — Basell Plans
Equity securities . . . . . . . . . . . . . . . . . . . . . . . . . . . . . . . . . . . 59% 60% 97% 60%
Fixed income . . . . . . . . . . . . . . . . . . . . . . . . . . . . . . . . . . . . . 41% 40% 3% 40%
United States
Equity securities . . . . . . . . . . . . . . . . . . . . . . . . . . . . . . . . . . . 65% 65% 64% 65%
Fixed income . . . . . . . . . . . . . . . . . . . . . . . . . . . . . . . . . . . . . 27% 30% 29% 30%
Real Estate . . . . . . . . . . . . . . . . . . . . . . . . . . . . . . . . . . . . . . . 3% 5% 3% 5%
Other . . . . . . . . . . . . . . . . . . . . . . . . . . . . . . . . . . . . . . . . . . . 5% —% 4% —%
Netherlands — Lyondell Chemical Plans
Equity securities . . . . . . . . . . . . . . . . . . . . . . . . . . . . . . . . . . . 16% 50% 15% 50%
Fixed income . . . . . . . . . . . . . . . . . . . . . . . . . . . . . . . . . . . . . 84% 50% 85% 50%
Netherlands — Basell Plans
Equity securities . . . . . . . . . . . . . . . . . . . . . . . . . . . . . . . . . . . 19% 18% 19% 18%
Fixed income . . . . . . . . . . . . . . . . . . . . . . . . . . . . . . . . . . . . . 81% 82% 81% 82%
We estimate the following contributions to our pension plans in 2011:
U.S. Non-U.S.Millions of dollars
Defined benefit plans . . . . . . . . . . . . . . . . . . . . . . . . . . . . . . . . . . . . . . . . . . . . . . $221 $59
Multi-employer plans . . . . . . . . . . . . . . . . . . . . . . . . . . . . . . . . . . . . . . . . . . . . . . — 7
Total . . . . . . . . . . . . . . . . . . . . . . . . . . . . . . . . . . . . . . . . . . . . . . . . . . . . . . . . $221 $66
As of December 31, 2010, future expected benefit payments by our pension plans which reflect expectedfuture service, as appropriate, were as follows:
U.S. Non-U.S.Millions of dollars
2011 . . . . . . . . . . . . . . . . . . . . . . . . . . . . . . . . . . . . . . . . . . . . . . . . . . . . . . . . . . $112 $ 49
2012 . . . . . . . . . . . . . . . . . . . . . . . . . . . . . . . . . . . . . . . . . . . . . . . . . . . . . . . . . . 121 45
2013 . . . . . . . . . . . . . . . . . . . . . . . . . . . . . . . . . . . . . . . . . . . . . . . . . . . . . . . . . . 117 119
2014 . . . . . . . . . . . . . . . . . . . . . . . . . . . . . . . . . . . . . . . . . . . . . . . . . . . . . . . . . . 125 61
2015 . . . . . . . . . . . . . . . . . . . . . . . . . . . . . . . . . . . . . . . . . . . . . . . . . . . . . . . . . . 135 70
2016 through 2020 . . . . . . . . . . . . . . . . . . . . . . . . . . . . . . . . . . . . . . . . . . . . . . . . 733 322
137
LYONDELLBASELL INDUSTRIES N.V.
NOTES TO THE CONSOLIDATED FINANCIAL STATEMENTS — (Continued)

18. Pension and Other Postretirement Benefits — (Continued)
The following table sets forth the principal assumptions on discount rates, projected rates of compensationincrease and expected rates of return on plan assets, where applicable. These assumptions vary for the differentplans, as they are determined in consideration of the local conditions.
The assumptions used in determining the net benefit liabilities for our pension plans were as follows atDecember 31:
U.S. Non-U.S. U.S. Non-U.S.2010 2009
Successor Predecessor
Weighted-average assumptions:Discount rate . . . . . . . . . . . . . . . . . . . . . . . . . . . . . . . . . . . . 5.18% 4.97% 5.75% 5.51%
Rate of compensation increase. . . . . . . . . . . . . . . . . . . . . . . . 4.00% 3.27% 4.00% 3.12%
The assumptions used in determining net benefit costs for our pension plans were as follows:
U.S. Non-U.S. U.S. Non-U.S. U.S. Non-U.S. U.S. Non-U.S.
May 1through
December 31,2010
January 1throughApril 30,
2010 2009 2008For the Year Ended December 31,
Successor Predecessor
Weighted-average assumptions forthe year:Discount rate . . . . . . . . . . . . . . . . . 5.68% 4.82% 5.75% 5.50% 6.00% 5.73% 6.30% 5.30%
Expected return on plan assets . . . . 8.00% 6.24% 8.00% 6.52% 8.00% 5.78% 8.25% 6.35%
Rate of compensation increase . . . . 4.00% 3.26% 4.00% 3.08% 4.45% 3.25% 4.50% 3.11%
The discount rate assumptions reflect the rates at which the benefit obligations could be effectivelysettled, based on published long-term bond indices where the term closely matches the term of the benefitobligations. The expected rate of return on assets was estimated based on the plans’ asset allocation, a reviewof historical capital market performance, historical plan performance and a forecast of expected future assetreturns. We review these long-term assumptions on a periodic basis.
Our pension plans have not invested in securities of LyondellBasell N.V., and there have been nosignificant transactions between any of the pension plans and the Company or related parties thereof.
138
LYONDELLBASELL INDUSTRIES N.V.
NOTES TO THE CONSOLIDATED FINANCIAL STATEMENTS — (Continued)

18. Pension and Other Postretirement Benefits — (Continued)
The pension investments that are measured at fair value as of December 31, 2010 are summarized below:
Balance atDecember 31,
2010
Quoted Pricesin Active
Markets forIdentical
Assets(Level 1)
SignificantOther
ObservableInputs
(Level 2)
SignificantUnobservable
Inputs(Level 3)
U.S. PensionBasis of Fair Value Measurement
Millions of dollars
U.S.Common stocks. . . . . . . . . . . . . . . . . . . . . $ 806 $806 $ — $—
Fixed income securities . . . . . . . . . . . . . . . 234 — 234 —
Real estate . . . . . . . . . . . . . . . . . . . . . . . . 42 — — 42
Convertible investments . . . . . . . . . . . . . . . 1 — 1 —
U. S. government securities . . . . . . . . . . . . 103 41 62 —
Cash and Cash equivalents. . . . . . . . . . . . . 33 31 2 —
John Hancock GACs . . . . . . . . . . . . . . . . . 5 — — 5
Metropolitan Life Insurance GIC . . . . . . . . 18 — — 18
Total U.S. Pension Assets . . . . . . . . . . . . . $1,242 $878 $299 $65
Balance atDecember 31,
2010
Quoted Pricesin Active
Markets forIdentical
Assets(Level 1)
SignificantOther
ObservableInputs
(Level 2)
SignificantUnobservable
Inputs(Level 3)
Non-U.S. PensionBasis of Fair Value Measurement
Millions of dollars
Non-U.S.Common stocks. . . . . . . . . . . . . . . . . . . . . $187 $187 $ — $—
Fixed income securities . . . . . . . . . . . . . . . 340 — 340 —
Other . . . . . . . . . . . . . . . . . . . . . . . . . . . . — — — —
Total Non-U.S. Pension Assets . . . . . . . . . $527 $187 $340 $—
139
LYONDELLBASELL INDUSTRIES N.V.
NOTES TO THE CONSOLIDATED FINANCIAL STATEMENTS — (Continued)
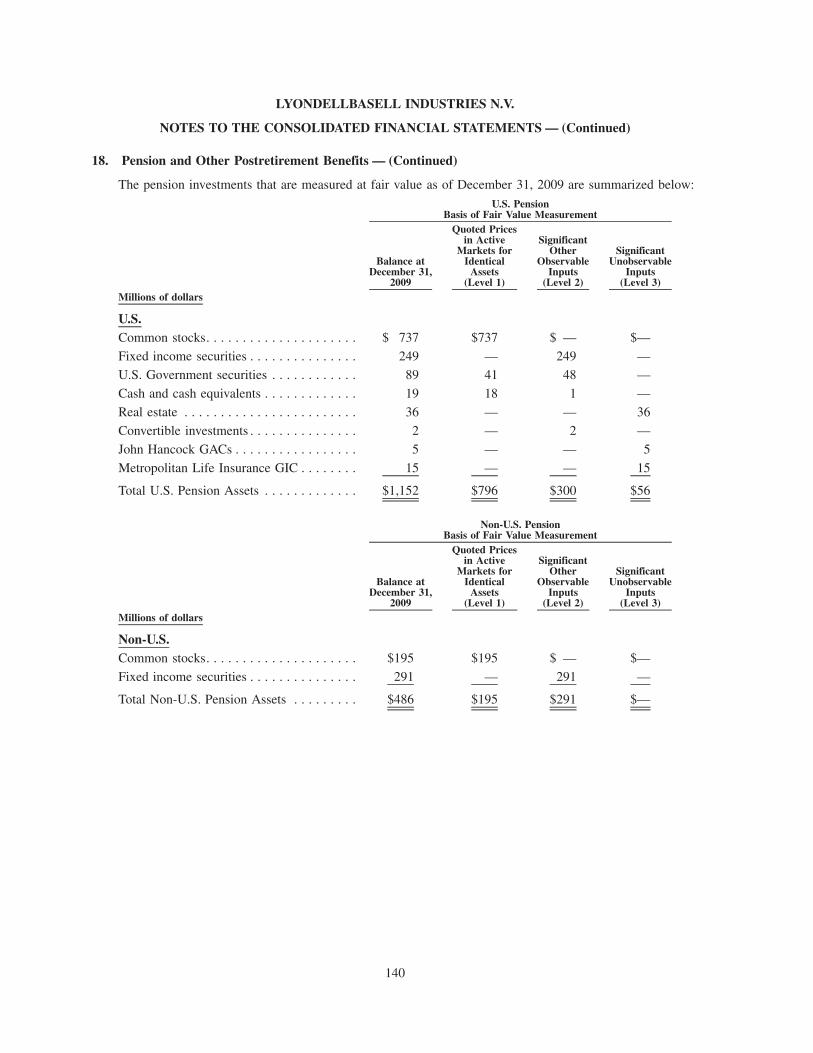
18. Pension and Other Postretirement Benefits — (Continued)
The pension investments that are measured at fair value as of December 31, 2009 are summarized below:
Balance atDecember 31,
2009
Quoted Pricesin Active
Markets forIdentical
Assets(Level 1)
SignificantOther
ObservableInputs
(Level 2)
SignificantUnobservable
Inputs(Level 3)
U.S. PensionBasis of Fair Value Measurement
Millions of dollars
U.S.Common stocks. . . . . . . . . . . . . . . . . . . . . $ 737 $737 $ — $—
Fixed income securities . . . . . . . . . . . . . . . 249 — 249 —
U.S. Government securities . . . . . . . . . . . . 89 41 48 —
Cash and cash equivalents . . . . . . . . . . . . . 19 18 1 —
Real estate . . . . . . . . . . . . . . . . . . . . . . . . 36 — — 36
Convertible investments . . . . . . . . . . . . . . . 2 — 2 —
John Hancock GACs . . . . . . . . . . . . . . . . . 5 — — 5
Metropolitan Life Insurance GIC . . . . . . . . 15 — — 15
Total U.S. Pension Assets . . . . . . . . . . . . . $1,152 $796 $300 $56
Balance atDecember 31,
2009
Quoted Pricesin Active
Markets forIdentical
Assets(Level 1)
SignificantOther
ObservableInputs
(Level 2)
SignificantUnobservable
Inputs(Level 3)
Non-U.S. PensionBasis of Fair Value Measurement
Millions of dollars
Non-U.S.Common stocks. . . . . . . . . . . . . . . . . . . . . $195 $195 $ — $—
Fixed income securities . . . . . . . . . . . . . . . 291 — 291 —
Total Non-U.S. Pension Assets . . . . . . . . . $486 $195 $291 $—
140
LYONDELLBASELL INDUSTRIES N.V.
NOTES TO THE CONSOLIDATED FINANCIAL STATEMENTS — (Continued)

18. Pension and Other Postretirement Benefits — (Continued)
The following table sets forth a summary of changes in the fair value of the level 3 plan assets for theyear ended December 31, 2009 and 2010:
Real estateMetropolitan
Life GAC
JohnHancock
GACs Total
U.S. PensionLevel 3 Assets
Millions of dollars
PredecessorBalance, January 1, 2009 . . . . . . . . . . . . . . . . . . . . . . . $ 54 $18 $ 4 $ 76
Realized gain. . . . . . . . . . . . . . . . . . . . . . . . . . . . . . . . 2 2 — 4
Unrealized gain (loss) relating to instruments still heldat the reporting date . . . . . . . . . . . . . . . . . . . . . . . . . (26) (5) 1 (30)
Purchases, sales, issuances, and settlements (net) . . . . . 6 — — 6
Balance, December 31, 2009 . . . . . . . . . . . . . . . . . . . . 36 15 5 56
Realized gain. . . . . . . . . . . . . . . . . . . . . . . . . . . . . . . . 1 1 — 2
Unrealized loss relating to instruments still held at thereporting date. . . . . . . . . . . . . . . . . . . . . . . . . . . . . . (2) — — (2)
Purchases, sales, issuances, and settlements (net) . . . . . 1 — — 1
Balance, April 30, 2010 . . . . . . . . . . . . . . . . . . . . . . . . $ 36 $16 $ 5 $ 57
SuccessorMay 1, 2010 . . . . . . . . . . . . . . . . . . . . . . . . . . . . . . . . $ 36 $16 $ 5 $ 57
Realized gain. . . . . . . . . . . . . . . . . . . . . . . . . . . . . . . . 1 1 — 2
Unrealized gain relating to instruments still held at thereporting date. . . . . . . . . . . . . . . . . . . . . . . . . . . . . . 4 1 — 5
Purchases, sales, issuances, and settlements (net) . . . . . 1 — — 1
Balance, December 31, 2010 . . . . . . . . . . . . . . . . . . . . $ 42 $18 $ 5 $ 65
Other Postretirement Benefits — We sponsor unfunded defined benefit health care and life insurance planscovering certain eligible retired employees and their spouses. Generally, the medical plans pay a statedpercentage of medical expenses reduced by deductibles and other coverage. Life insurance benefits aregenerally provided by insurance contracts. We retain the right, subject to existing agreements, to modify oreliminate these benefits.
141
LYONDELLBASELL INDUSTRIES N.V.
NOTES TO THE CONSOLIDATED FINANCIAL STATEMENTS — (Continued)
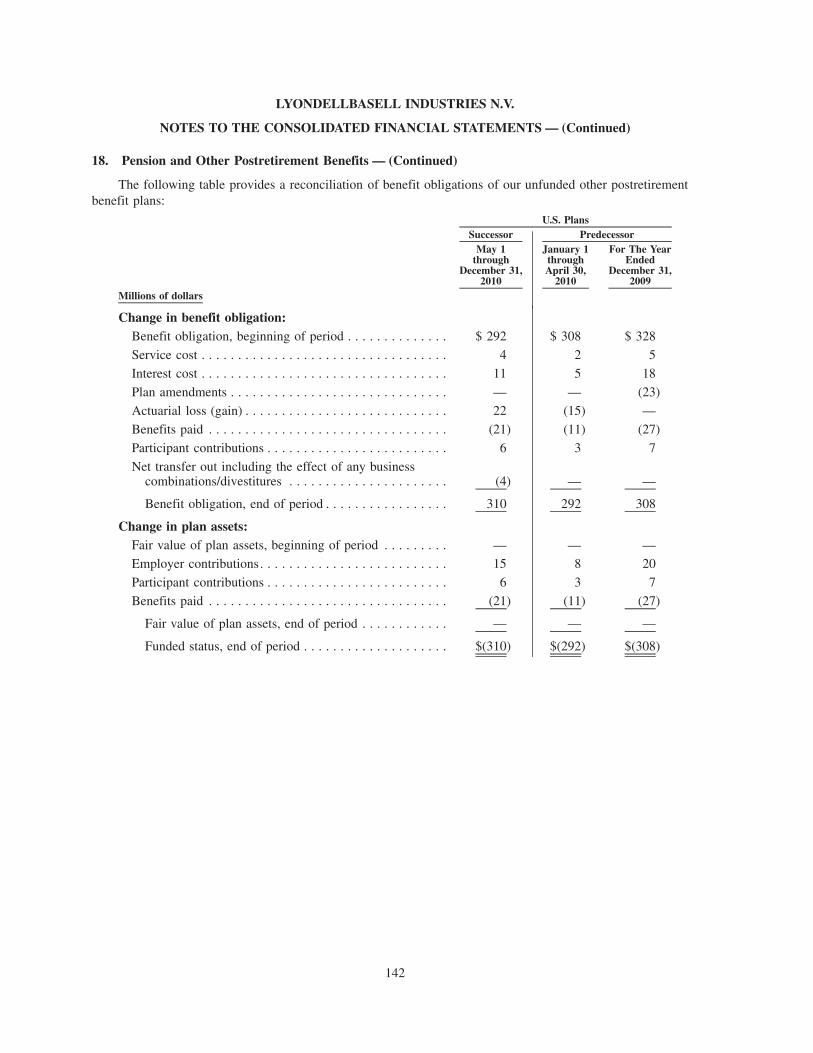
18. Pension and Other Postretirement Benefits — (Continued)
The following table provides a reconciliation of benefit obligations of our unfunded other postretirementbenefit plans:
May 1through
December 31,2010
January 1throughApril 30,
2010
For The YearEnded
December 31,2009
Successor PredecessorU.S. Plans
Millions of dollars
Change in benefit obligation:Benefit obligation, beginning of period . . . . . . . . . . . . . . $ 292 $ 308 $ 328
Service cost . . . . . . . . . . . . . . . . . . . . . . . . . . . . . . . . . . 4 2 5
Interest cost . . . . . . . . . . . . . . . . . . . . . . . . . . . . . . . . . . 11 5 18
Plan amendments . . . . . . . . . . . . . . . . . . . . . . . . . . . . . . — — (23)
Actuarial loss (gain) . . . . . . . . . . . . . . . . . . . . . . . . . . . . 22 (15) —
Benefits paid . . . . . . . . . . . . . . . . . . . . . . . . . . . . . . . . . (21) (11) (27)
Participant contributions . . . . . . . . . . . . . . . . . . . . . . . . . 6 3 7
Net transfer out including the effect of any businesscombinations/divestitures . . . . . . . . . . . . . . . . . . . . . . (4) — —
Benefit obligation, end of period . . . . . . . . . . . . . . . . . 310 292 308
Change in plan assets:Fair value of plan assets, beginning of period . . . . . . . . . — — —
Employer contributions. . . . . . . . . . . . . . . . . . . . . . . . . . 15 8 20
Participant contributions . . . . . . . . . . . . . . . . . . . . . . . . . 6 3 7
Benefits paid . . . . . . . . . . . . . . . . . . . . . . . . . . . . . . . . . (21) (11) (27)
Fair value of plan assets, end of period . . . . . . . . . . . . — — —
Funded status, end of period . . . . . . . . . . . . . . . . . . . . $(310) $(292) $(308)
142
LYONDELLBASELL INDUSTRIES N.V.
NOTES TO THE CONSOLIDATED FINANCIAL STATEMENTS — (Continued)
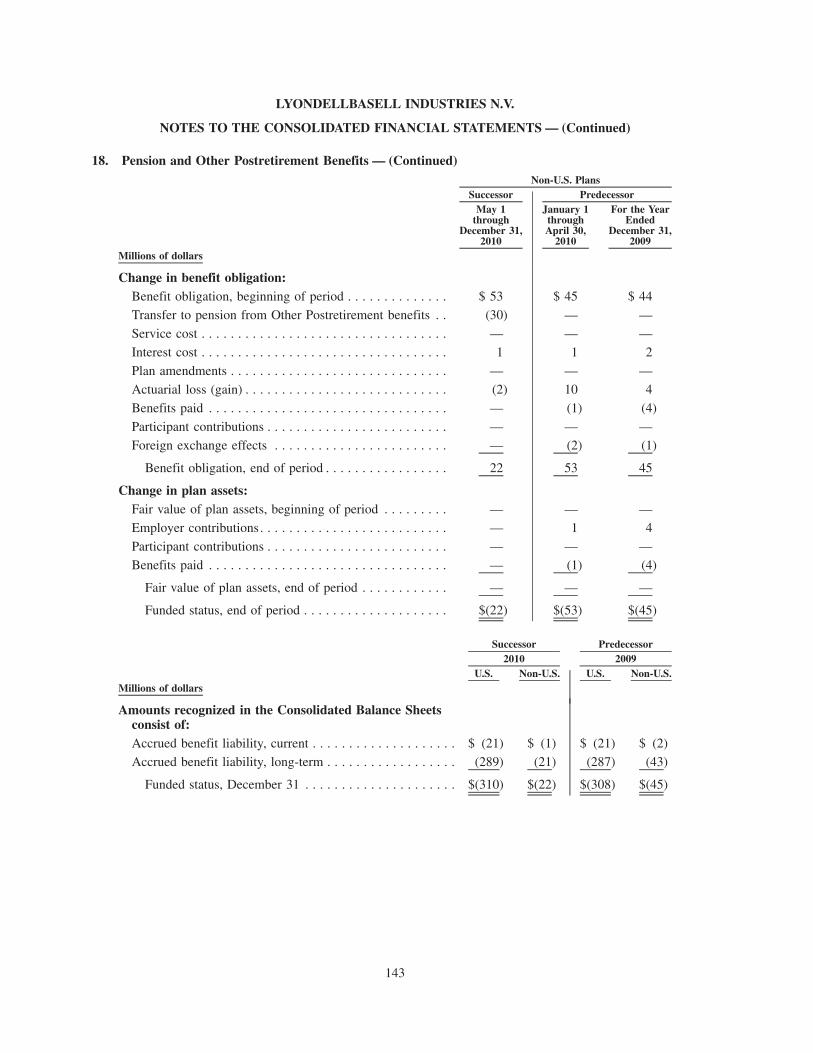
18. Pension and Other Postretirement Benefits — (Continued)
May 1through
December 31,2010
January 1throughApril 30,
2010
For the YearEnded
December 31,2009
Successor PredecessorNon-U.S. Plans
Millions of dollars
Change in benefit obligation:Benefit obligation, beginning of period . . . . . . . . . . . . . . $ 53 $ 45 $ 44
Transfer to pension from Other Postretirement benefits . . (30) — —
Service cost . . . . . . . . . . . . . . . . . . . . . . . . . . . . . . . . . . — — —
Interest cost . . . . . . . . . . . . . . . . . . . . . . . . . . . . . . . . . . 1 1 2
Plan amendments . . . . . . . . . . . . . . . . . . . . . . . . . . . . . . — — —
Actuarial loss (gain) . . . . . . . . . . . . . . . . . . . . . . . . . . . . (2) 10 4
Benefits paid . . . . . . . . . . . . . . . . . . . . . . . . . . . . . . . . . — (1) (4)
Participant contributions . . . . . . . . . . . . . . . . . . . . . . . . . — — —
Foreign exchange effects . . . . . . . . . . . . . . . . . . . . . . . . — (2) (1)
Benefit obligation, end of period . . . . . . . . . . . . . . . . . 22 53 45
Change in plan assets:Fair value of plan assets, beginning of period . . . . . . . . . — — —
Employer contributions. . . . . . . . . . . . . . . . . . . . . . . . . . — 1 4
Participant contributions . . . . . . . . . . . . . . . . . . . . . . . . . — — —
Benefits paid . . . . . . . . . . . . . . . . . . . . . . . . . . . . . . . . . — (1) (4)
Fair value of plan assets, end of period . . . . . . . . . . . . — — —
Funded status, end of period . . . . . . . . . . . . . . . . . . . . $(22) $(53) $(45)
U.S. Non-U.S. U.S. Non-U.S.2010 2009
Successor Predecessor
Millions of dollars
Amounts recognized in the Consolidated Balance Sheetsconsist of:Accrued benefit liability, current . . . . . . . . . . . . . . . . . . . . $ (21) $ (1) $ (21) $ (2)Accrued benefit liability, long-term . . . . . . . . . . . . . . . . . . (289) (21) (287) (43)
Funded status, December 31 . . . . . . . . . . . . . . . . . . . . . $(310) $(22) $(308) $(45)
143
LYONDELLBASELL INDUSTRIES N.V.
NOTES TO THE CONSOLIDATED FINANCIAL STATEMENTS — (Continued)

18. Pension and Other Postretirement Benefits — (Continued)
U.S. Non-U.S. U.S. Non-U.S.2010 2009
Successor Predecessor
Millions of dollars
Amounts recognized in Accumulated Other ComprehensiveIncome:Actuarial and investment loss (gain) . . . . . . . . . . . . . . . . . . . . $18 $ (2) $ 4 $ (1)
Prior service cost . . . . . . . . . . . . . . . . . . . . . . . . . . . . . . . . . . — — (76) —
Balance at December 31 . . . . . . . . . . . . . . . . . . . . . . . . . . $18 $ (2) $(72) $ (1)
The following table provides the components of net periodic other postretirement benefit costs:
May 1through
December 31,2010
January 1throughApril 30,
2010 2009 2008
For the YearEnded
December 31,
Successor PredecessorU.S. Plans
Millions of dollars
Net Periodic Other Postretirement Benefit Costs:Service cost . . . . . . . . . . . . . . . . . . . . . . . . . . . . . . . . . . $ 3 $ 2 $ 5 $ 6
Interest cost . . . . . . . . . . . . . . . . . . . . . . . . . . . . . . . . . . 11 5 18 19
Prior service cost (benefit) amortization . . . . . . . . . . . . . — (3) (7) (5)
Actuarial amortization gain . . . . . . . . . . . . . . . . . . . . . . . — — (1) (2)
Net periodic benefit cost . . . . . . . . . . . . . . . . . . . . . . . $14 $ 4 $15 $18
May 1through
December 31,2010
January 1throughApril 30,
2010 2009 2008
For the YearEnded
December 31,
Successor PredecessorNon-U.S. Plans
Millions of dollars
Net Periodic Other Postretirement Benefit Costs:Service cost . . . . . . . . . . . . . . . . . . . . . . . . . . . . . . . . . . $— $— $— $—
Interest cost . . . . . . . . . . . . . . . . . . . . . . . . . . . . . . . . . . 1 1 2 2
Prior service cost (benefit) amortization . . . . . . . . . . . . . — — — (1)
Actuarial amortization gain . . . . . . . . . . . . . . . . . . . . . . . — — — —
Curtailment gain. . . . . . . . . . . . . . . . . . . . . . . . . . . . . . . — — — —
Net periodic benefit cost . . . . . . . . . . . . . . . . . . . . . . . $ 1 $ 1 $ 2 $ 1
For the U.S. plans, the assumed annual rate of increase in the per capita cost of covered health carebenefits as of December 31, 2010 was 9.1% for 2011 decreasing 0.5% per year to 5.0% in 2026 and thereafter.At December 31, 2010, the assumed annual rate of increase was 9.5%. At December 31, 2009, the assumedrate of increase was 9.5% for 2010 decreasing 0.5% per year to 5% in 2026 and thereafter. At December 31,2009, the assumed annual rate of increase was 9.5%. For the Canadian plans, the assumed annual rate ofincrease in the per capita cost of covered health care benefits as of December 31, 2010 was 8.5% for 2011
144
LYONDELLBASELL INDUSTRIES N.V.
NOTES TO THE CONSOLIDATED FINANCIAL STATEMENTS — (Continued)

18. Pension and Other Postretirement Benefits — (Continued)
decreasing 0.5% per year to 5% in 2018 and thereafter. At December 31, 2010, the assumed annual rate ofincrease was 8.5%. As of December 31, 2009, the assumed annual rate of increase in the per capita cost ofcovered health care benefits for the Canadian plans was 8.5% for 2010 decreasing 0.5% per year to 5% in2017 and thereafter. At December 31, 2009, the assumed annual rate of increase was 9.0%. For the Frenchplans, the assumed annual rate of increase in the per capita cost of covered health care benefits as ofDecember 31, 2010 was 3.5% for 2011 and at December 31, 2009 was 2.0% for 2010 with no availabletrending.
The health care cost trend rate assumption does not have a significant effect on the amounts reported dueto limits on maximum contribution levels to the medical plans. To illustrate, increasing or decreasing theassumed health care cost trend rates by one percentage point in each year would change the accumulated otherpostretirement benefit liability as of December 31, 2010 by less than $1 million for U.S. and $3 million fornon-U.S. plans and would not have a material effect on the aggregate service and interest cost components ofthe net periodic other postretirement benefit cost for the year then ended.
The assumptions used in determining the net benefit liabilities for our other postretirement benefit planswere as follows at December 31:
U.S. Non-U.S. U.S. Non-U.S.2010 2009
Successor Predecessor
Weighted-average assumptions:Discount rate . . . . . . . . . . . . . . . . . . . . . . . . . . . . . . . . . . . . 5.00% 5.36% 5.75% 5.46%Rate of compensation increase. . . . . . . . . . . . . . . . . . . . . . . . 4.00% 3.52% 4.00% 3.58%
The assumptions used in determining the net benefit costs for our other postretirement benefit plans wereas follows:
U.S. Non-U.S. U.S. Non-U.S. U.S. Non-U.S. U.S. Non-U.S.
May 1through
December 31,2010
January 1throughApril 30,
2010 2009 2008For the Year Ended December 31,
Successor Predecessor
Weighted-average assumptionsfor the year:Discount rate . . . . . . . . . . . . . . 5.73% 5.22% 5.75% 5.46% 6.00% 5.73% 6.30% 5.30%
Rate of compensationincrease . . . . . . . . . . . . . . . . 4.00% 3.46% 4.00% 3.58% 4.45% 3.25% 4.50% 3.11%
As of December 31, 2010, future expected benefit payments by our other postretirement benefit plan,which reflect expected future service, as appropriate, were as follows:
U.S. Non-U.S.Millions of dollars
2011 . . . . . . . . . . . . . . . . . . . . . . . . . . . . . . . . . . . . . . . . . . . . . . . . . . . . . . . . . . $ 21 $1
2012 . . . . . . . . . . . . . . . . . . . . . . . . . . . . . . . . . . . . . . . . . . . . . . . . . . . . . . . . . . 21 1
2013 . . . . . . . . . . . . . . . . . . . . . . . . . . . . . . . . . . . . . . . . . . . . . . . . . . . . . . . . . . 22 1
2014 . . . . . . . . . . . . . . . . . . . . . . . . . . . . . . . . . . . . . . . . . . . . . . . . . . . . . . . . . . 22 1
2015 . . . . . . . . . . . . . . . . . . . . . . . . . . . . . . . . . . . . . . . . . . . . . . . . . . . . . . . . . . 23 1
2016 through 2020 . . . . . . . . . . . . . . . . . . . . . . . . . . . . . . . . . . . . . . . . . . . . . . . . 121 6
145
LYONDELLBASELL INDUSTRIES N.V.
NOTES TO THE CONSOLIDATED FINANCIAL STATEMENTS — (Continued)

18. Pension and Other Postretirement Benefits — (Continued)
Accumulated Other Comprehensive Income — The following pre-tax amounts were recognized in accu-mulated other comprehensive income as of and for the year ended December 31, 2010:
Actuarial(Gain) Loss
Prior ServiceCost (Credit)
Actuarial(Gain) Loss
Prior ServiceCost (Credit)
Pension Benefits Other Benefits
Millions of dollars
PredecessorJanuary 1, 2009 . . . . . . . . . . . . . . . . . . . . . . $612 $(140) $ (4) $(60)
Arising during the period. . . . . . . . . . . . . . 6 (3) 7 (1)
Amortization included in net periodicbenefit cost . . . . . . . . . . . . . . . . . . . . . . (7) (7) 2 8
(Gain) loss due to settlements andcurtailments . . . . . . . . . . . . . . . . . . . . . . (30) 26 (2) —
Gain due to plan amendments . . . . . . . . . . — — — (23)
December 31, 2009 . . . . . . . . . . . . . . . . . . . . 581 (124) 3 (76)
Arising during the period. . . . . . . . . . . . . . 64 — (5) —(Gain) loss due to settlements and
curtailments . . . . . . . . . . . . . . . . . . . . . . (10) 5 — 3
April 30, 2010 . . . . . . . . . . . . . . . . . . . . . . . $635 $(119) $ (2) $(73)
SuccessorMay 1, 2010 . . . . . . . . . . . . . . . . . . . . . . . . . $ — $ — $— $ —
Arising during the period. . . . . . . . . . . . . . 38 10 16 —
Amortization included in net periodicbenefit cost . . . . . . . . . . . . . . . . . . . . . . — — — —
(Gain) loss due to settlements andcurtailments . . . . . . . . . . . . . . . . . . . . . . (1) — — —
December 31, 2010 . . . . . . . . . . . . . . . . . . . . $ 37 $ 10 $16 $ —
Deferred income taxes related to amounts in Accumulated other comprehensive income include provisionsof $30 million and $118 million as of December 31, 2010 and 2009, respectively. At April 30, 2010 all gainsand losses in OCI and the related deferred income were written off.
At December 31, 2010, AOCI included $2 million of prior service credit related to non-U.S. pensionplans that is expected to be recognized as a component of net periodic benefit cost in 2011. There are no suchamounts in AOCI at December 31, 2010 for U.S. pension plans and U.S. and non-U.S. other postretirementbenefits expected to be recognized in net periodic benefit cost in 2011.
Pension Claim — Two legacy Basell subsidiaries, Basell UK Ltd and Basell Polyolefins UK Ltd weresubject to a claim totaling £40.8 million ($70.4 million) related to exit fees charged by two UK pension fundsof a former shareholder. The claims were made following the termination of the membership of these twosubsidiaries in these funds in connection with the 2005 acquisition of Basell by Access. These claims were netsettled with the two pension funds for £17 million ($32.1 million) on August 20, 2008. LyondellBasell AFsubsequently initiated arbitration proceedings against its former shareholder for indemnification of the net
146
LYONDELLBASELL INDUSTRIES N.V.
NOTES TO THE CONSOLIDATED FINANCIAL STATEMENTS — (Continued)

18. Pension and Other Postretirement Benefits — (Continued)
settlement amount. These proceedings were settled in October 2009 for £9.5 million ($15.7 million), whichamount was recognized in the 2009 Consolidated Statement of Income.
Defined Contribution Plans — Employees in the U.S. are eligible to participate in defined contributionplans (“Employee Savings Plans”) by contributing a portion of their compensation. We match a part of theemployees’ contribution. The Predecessor had temporarily suspended contributions beginning in March 2009as a result of filing voluntary petitions for reorganization under chapter 11 of the U.S. Bankruptcy Code. InMay 2010, we resumed matching contributions under the Employee Savings Plans. Contributions to theseplans were $17 million in 2010, $8 million in 2009 and $31 million in 2008.
19. Incentive and Share-Based Compensation
Medium-Term Incentive Plan — Upon the Debtors’ emergence from chapter 11 proceedings, we replacedthe Predecessor Company’s Management Incentive Plan with the 2010 Medium-Term Incentive Plan (“MTI”).The MTI is designed to link the interests of senior management with the interests of shareholders by tyingincentives to measurable corporate performance. The MTI provides for payouts based on our return on assetsand cost improvements over the calendar years 2010 through 2012. Benefits under the MTI will vest on thedate, following December 31, 2012, on which the Compensation Committee of the Supervisory Board certifiesthe performance results and will be paid on March 31 following the end of the performance cycle. The MTIprovides for an accelerated pro-rata payout in the event of a change in control of the Successor Company. TheMTI, which is accounted for as a liability award, is classified in Other liabilities on the Consolidated BalanceSheets. We recorded $4 million of compensation expense for the eight months ended December 31, 2010based on the expected achievement of performance results.
Long-Term Incentive Plan — Upon the Debtors’ emergence from chapter 11 proceedings, we created the2010 Long-Term Incentive Plan (“LTI”). Under the LTI, the Compensation Committee is authorized to grantrestricted stock, restricted stock units, stock options, stock appreciation rights and other types of equity-basedawards. The Compensation Committee determines the recipients of the equity awards, the type of award made,the required performance measures, and the timing and duration of each grant. The maximum number ofshares of LyondellBasell N.V. stock reserved for issuance under the LTI is 22,000,000. In connection with theDebtors’ emergence from bankruptcy, awards were granted to our senior management and we have sincegranted awards for new hires and promotions. As of December 31, 2010, there were 9,860,818 sharesremaining available for issuance.
The LTI awards resulted in compensation expense of $22 million for the eight months ended Decem-ber 31, 2010, and $24 million for the four months ended April 30, 2010. The tax benefits were $8 million forthe eight months ended December 31, 2010, and $8 million for the four months ended April 30, 2010.
Restricted Stock Units — Restricted stock units entitle the recipient to be paid out an equal number ofclass A ordinary shares on the fifth anniversary of the grant date, subject to forfeiture in the event of certaintermination events. Restricted stock units are accounted for as an equity award with compensation costrecognized ratably over the vesting period. The holders of the restricted stock units are entitled to dividendequivalents to be settled no later than March 15th following the year in which dividends are paid, as long asthe participant is in full employment at the time of payment.
147
LYONDELLBASELL INDUSTRIES N.V.
NOTES TO THE CONSOLIDATED FINANCIAL STATEMENTS — (Continued)
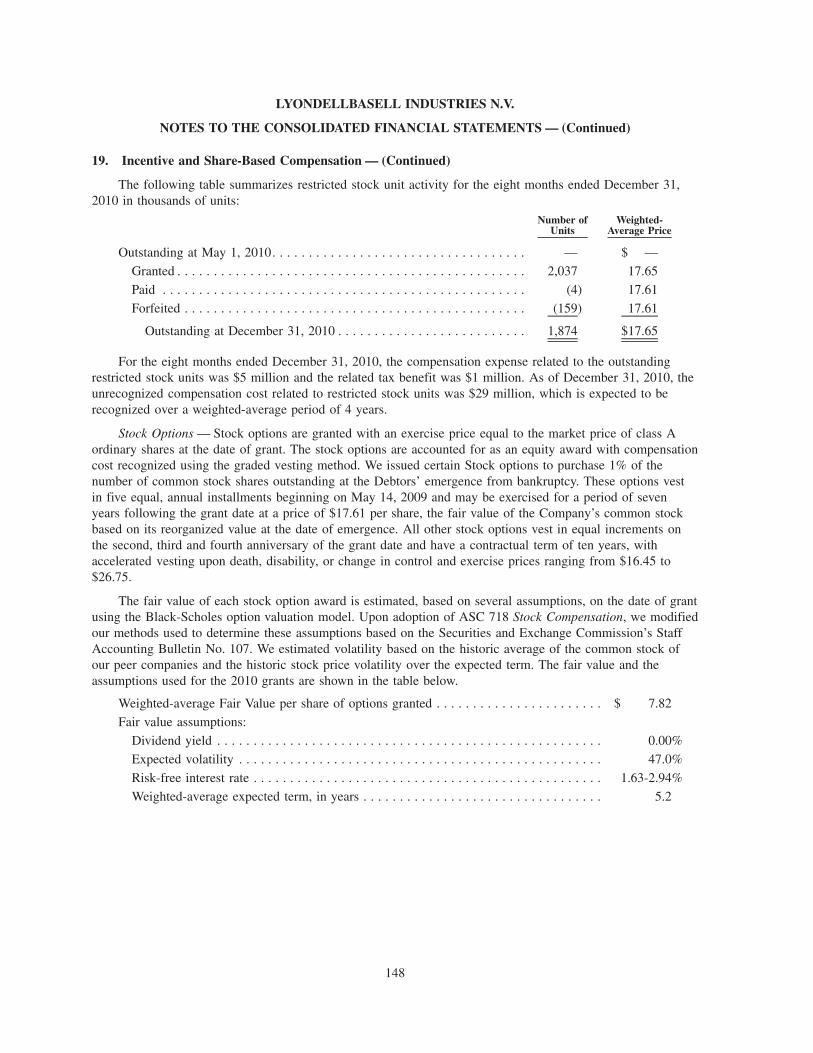
19. Incentive and Share-Based Compensation — (Continued)
The following table summarizes restricted stock unit activity for the eight months ended December 31,2010 in thousands of units:
Number ofUnits
Weighted-Average Price
Outstanding at May 1, 2010. . . . . . . . . . . . . . . . . . . . . . . . . . . . . . . . . . . — $ —
Granted . . . . . . . . . . . . . . . . . . . . . . . . . . . . . . . . . . . . . . . . . . . . . . . . 2,037 17.65
Paid . . . . . . . . . . . . . . . . . . . . . . . . . . . . . . . . . . . . . . . . . . . . . . . . . . (4) 17.61
Forfeited . . . . . . . . . . . . . . . . . . . . . . . . . . . . . . . . . . . . . . . . . . . . . . . (159) 17.61
Outstanding at December 31, 2010 . . . . . . . . . . . . . . . . . . . . . . . . . . 1,874 $17.65
For the eight months ended December 31, 2010, the compensation expense related to the outstandingrestricted stock units was $5 million and the related tax benefit was $1 million. As of December 31, 2010, theunrecognized compensation cost related to restricted stock units was $29 million, which is expected to berecognized over a weighted-average period of 4 years.
Stock Options — Stock options are granted with an exercise price equal to the market price of class Aordinary shares at the date of grant. The stock options are accounted for as an equity award with compensationcost recognized using the graded vesting method. We issued certain Stock options to purchase 1% of thenumber of common stock shares outstanding at the Debtors’ emergence from bankruptcy. These options vestin five equal, annual installments beginning on May 14, 2009 and may be exercised for a period of sevenyears following the grant date at a price of $17.61 per share, the fair value of the Company’s common stockbased on its reorganized value at the date of emergence. All other stock options vest in equal increments onthe second, third and fourth anniversary of the grant date and have a contractual term of ten years, withaccelerated vesting upon death, disability, or change in control and exercise prices ranging from $16.45 to$26.75.
The fair value of each stock option award is estimated, based on several assumptions, on the date of grantusing the Black-Scholes option valuation model. Upon adoption of ASC 718 Stock Compensation, we modifiedour methods used to determine these assumptions based on the Securities and Exchange Commission’s StaffAccounting Bulletin No. 107. We estimated volatility based on the historic average of the common stock ofour peer companies and the historic stock price volatility over the expected term. The fair value and theassumptions used for the 2010 grants are shown in the table below.
Weighted-average Fair Value per share of options granted . . . . . . . . . . . . . . . . . . . . . . . $ 7.82
Fair value assumptions:
Dividend yield . . . . . . . . . . . . . . . . . . . . . . . . . . . . . . . . . . . . . . . . . . . . . . . . . . . . . 0.00%
Expected volatility . . . . . . . . . . . . . . . . . . . . . . . . . . . . . . . . . . . . . . . . . . . . . . . . . . 47.0%
Risk-free interest rate . . . . . . . . . . . . . . . . . . . . . . . . . . . . . . . . . . . . . . . . . . . . . . . . 1.63-2.94%
Weighted-average expected term, in years . . . . . . . . . . . . . . . . . . . . . . . . . . . . . . . . . 5.2
148
LYONDELLBASELL INDUSTRIES N.V.
NOTES TO THE CONSOLIDATED FINANCIAL STATEMENTS — (Continued)
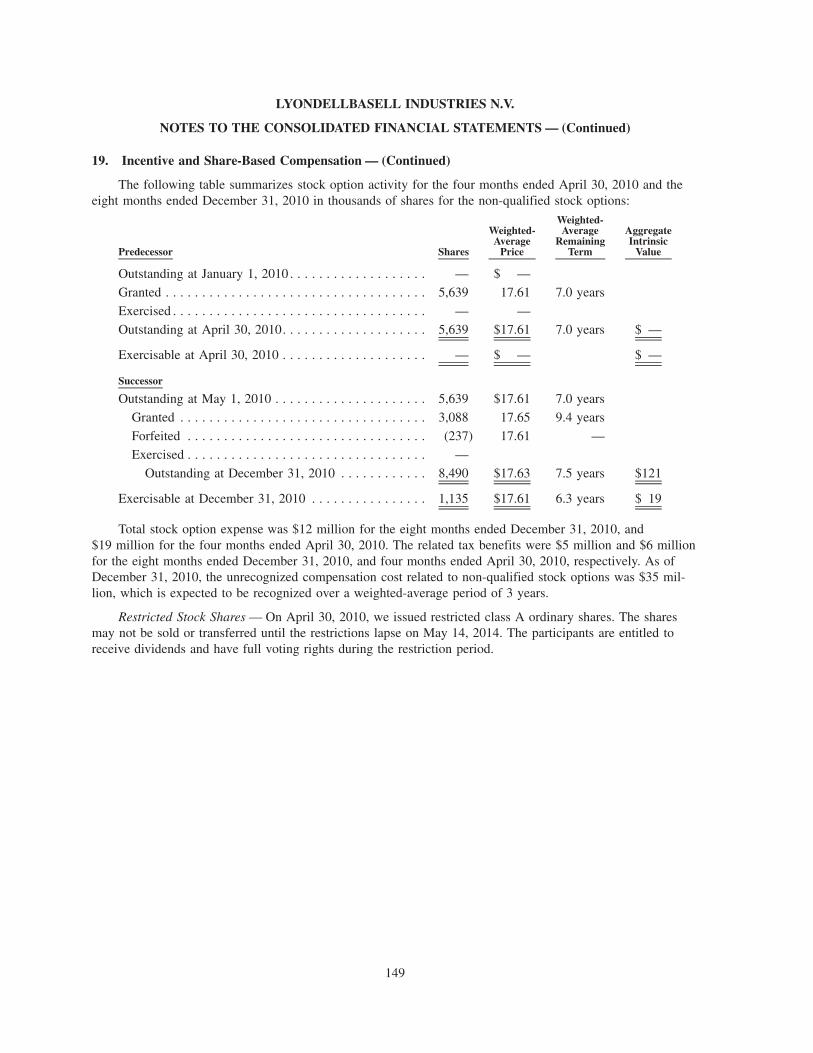
19. Incentive and Share-Based Compensation — (Continued)
The following table summarizes stock option activity for the four months ended April 30, 2010 and theeight months ended December 31, 2010 in thousands of shares for the non-qualified stock options:
Predecessor Shares
Weighted-Average
Price
Weighted-Average
RemainingTerm
AggregateIntrinsic
Value
Outstanding at January 1, 2010 . . . . . . . . . . . . . . . . . . . — $ —
Granted . . . . . . . . . . . . . . . . . . . . . . . . . . . . . . . . . . . . 5,639 17.61 7.0 years
Exercised . . . . . . . . . . . . . . . . . . . . . . . . . . . . . . . . . . . — —
Outstanding at April 30, 2010. . . . . . . . . . . . . . . . . . . . 5,639 $17.61 7.0 years $ —
Exercisable at April 30, 2010 . . . . . . . . . . . . . . . . . . . . — $ — $ —
Successor
Outstanding at May 1, 2010 . . . . . . . . . . . . . . . . . . . . . 5,639 $17.61 7.0 years
Granted . . . . . . . . . . . . . . . . . . . . . . . . . . . . . . . . . . 3,088 17.65 9.4 years
Forfeited . . . . . . . . . . . . . . . . . . . . . . . . . . . . . . . . . (237) 17.61 —
Exercised . . . . . . . . . . . . . . . . . . . . . . . . . . . . . . . . . —
Outstanding at December 31, 2010 . . . . . . . . . . . . 8,490 $17.63 7.5 years $121
Exercisable at December 31, 2010 . . . . . . . . . . . . . . . . 1,135 $17.61 6.3 years $ 19
Total stock option expense was $12 million for the eight months ended December 31, 2010, and$19 million for the four months ended April 30, 2010. The related tax benefits were $5 million and $6 millionfor the eight months ended December 31, 2010, and four months ended April 30, 2010, respectively. As ofDecember 31, 2010, the unrecognized compensation cost related to non-qualified stock options was $35 mil-lion, which is expected to be recognized over a weighted-average period of 3 years.
Restricted Stock Shares — On April 30, 2010, we issued restricted class A ordinary shares. The sharesmay not be sold or transferred until the restrictions lapse on May 14, 2014. The participants are entitled toreceive dividends and have full voting rights during the restriction period.
149
LYONDELLBASELL INDUSTRIES N.V.
NOTES TO THE CONSOLIDATED FINANCIAL STATEMENTS — (Continued)
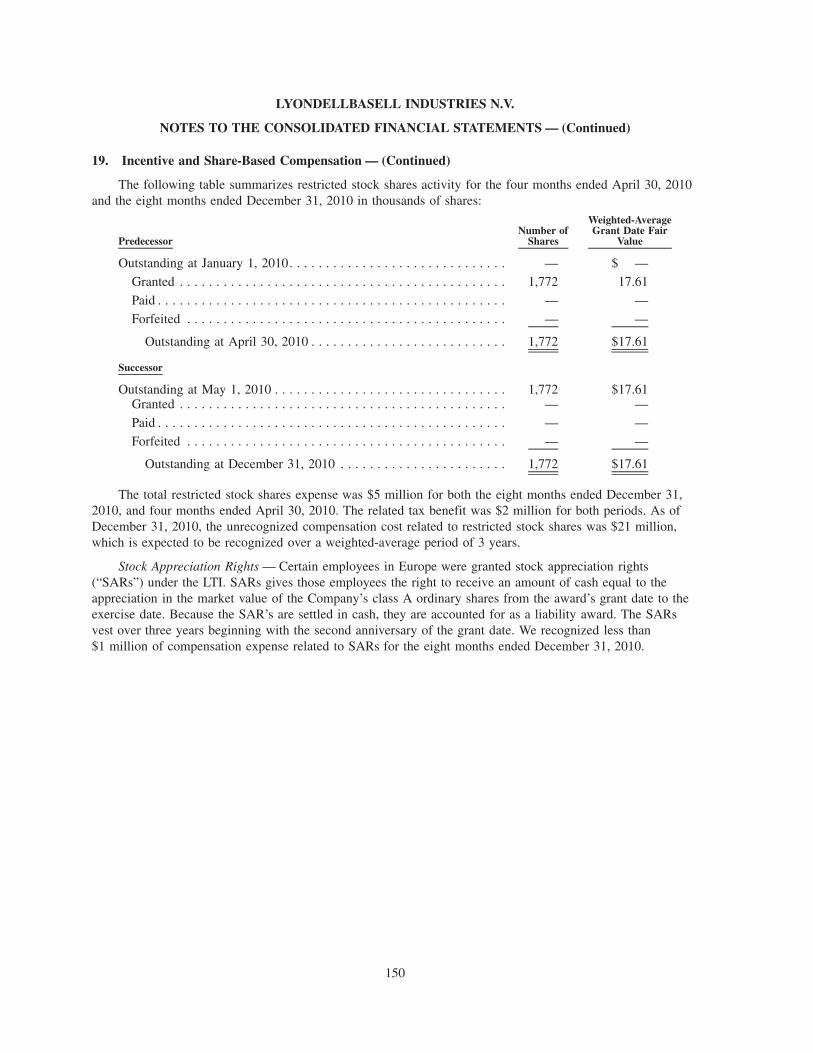
19. Incentive and Share-Based Compensation — (Continued)
The following table summarizes restricted stock shares activity for the four months ended April 30, 2010and the eight months ended December 31, 2010 in thousands of shares:
PredecessorNumber of
Shares
Weighted-AverageGrant Date Fair
Value
Outstanding at January 1, 2010. . . . . . . . . . . . . . . . . . . . . . . . . . . . . . — $ —
Granted . . . . . . . . . . . . . . . . . . . . . . . . . . . . . . . . . . . . . . . . . . . . . 1,772 17.61
Paid . . . . . . . . . . . . . . . . . . . . . . . . . . . . . . . . . . . . . . . . . . . . . . . . — —
Forfeited . . . . . . . . . . . . . . . . . . . . . . . . . . . . . . . . . . . . . . . . . . . . — —
Outstanding at April 30, 2010 . . . . . . . . . . . . . . . . . . . . . . . . . . . 1,772 $17.61
Successor
Outstanding at May 1, 2010 . . . . . . . . . . . . . . . . . . . . . . . . . . . . . . . . 1,772 $17.61Granted . . . . . . . . . . . . . . . . . . . . . . . . . . . . . . . . . . . . . . . . . . . . . — —
Paid . . . . . . . . . . . . . . . . . . . . . . . . . . . . . . . . . . . . . . . . . . . . . . . . — —
Forfeited . . . . . . . . . . . . . . . . . . . . . . . . . . . . . . . . . . . . . . . . . . . . — —
Outstanding at December 31, 2010 . . . . . . . . . . . . . . . . . . . . . . . 1,772 $17.61
The total restricted stock shares expense was $5 million for both the eight months ended December 31,2010, and four months ended April 30, 2010. The related tax benefit was $2 million for both periods. As ofDecember 31, 2010, the unrecognized compensation cost related to restricted stock shares was $21 million,which is expected to be recognized over a weighted-average period of 3 years.
Stock Appreciation Rights — Certain employees in Europe were granted stock appreciation rights(“SARs”) under the LTI. SARs gives those employees the right to receive an amount of cash equal to theappreciation in the market value of the Company’s class A ordinary shares from the award’s grant date to theexercise date. Because the SAR’s are settled in cash, they are accounted for as a liability award. The SARsvest over three years beginning with the second anniversary of the grant date. We recognized less than$1 million of compensation expense related to SARs for the eight months ended December 31, 2010.
150
LYONDELLBASELL INDUSTRIES N.V.
NOTES TO THE CONSOLIDATED FINANCIAL STATEMENTS — (Continued)
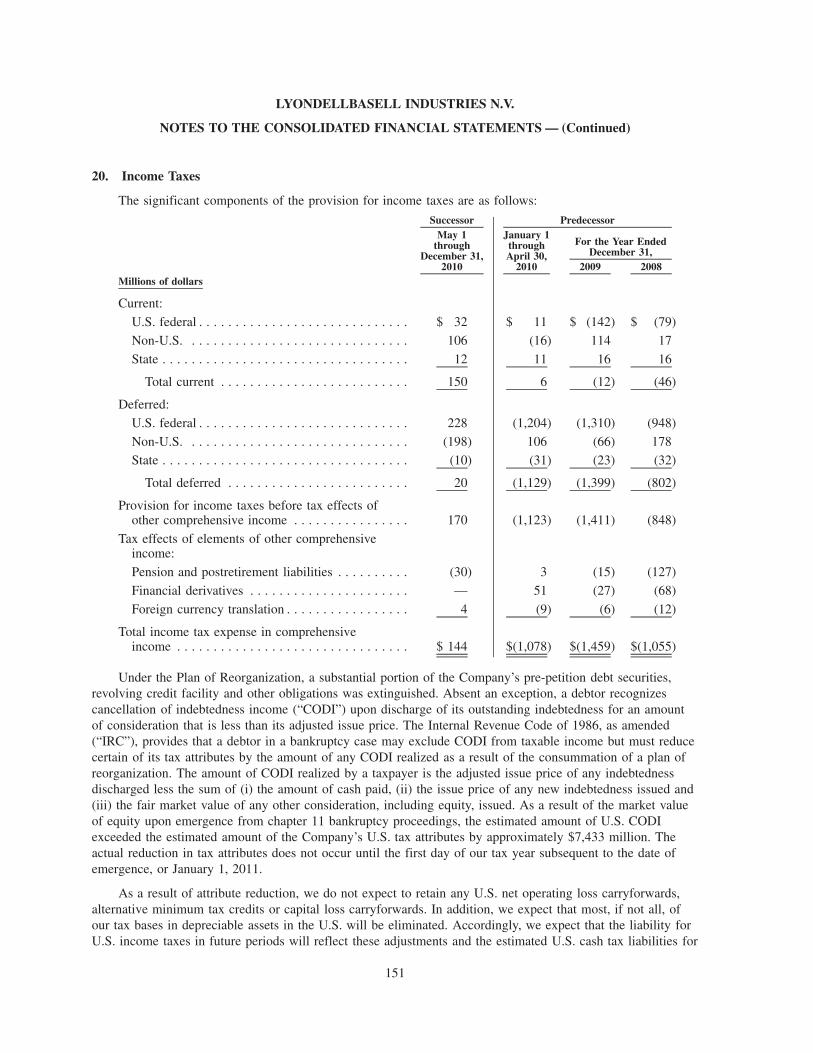
20. Income Taxes
The significant components of the provision for income taxes are as follows:
May 1through
December 31,2010
January 1throughApril 30,
2010 2009 2008
For the Year EndedDecember 31,
Successor Predecessor
Millions of dollars
Current:
U.S. federal . . . . . . . . . . . . . . . . . . . . . . . . . . . . . $ 32 $ 11 $ (142) $ (79)
Non-U.S. . . . . . . . . . . . . . . . . . . . . . . . . . . . . . . 106 (16) 114 17
State . . . . . . . . . . . . . . . . . . . . . . . . . . . . . . . . . . 12 11 16 16
Total current . . . . . . . . . . . . . . . . . . . . . . . . . . 150 6 (12) (46)
Deferred:
U.S. federal . . . . . . . . . . . . . . . . . . . . . . . . . . . . . 228 (1,204) (1,310) (948)
Non-U.S. . . . . . . . . . . . . . . . . . . . . . . . . . . . . . . (198) 106 (66) 178State . . . . . . . . . . . . . . . . . . . . . . . . . . . . . . . . . . (10) (31) (23) (32)
Total deferred . . . . . . . . . . . . . . . . . . . . . . . . . 20 (1,129) (1,399) (802)
Provision for income taxes before tax effects ofother comprehensive income . . . . . . . . . . . . . . . . 170 (1,123) (1,411) (848)
Tax effects of elements of other comprehensiveincome:
Pension and postretirement liabilities . . . . . . . . . . (30) 3 (15) (127)
Financial derivatives . . . . . . . . . . . . . . . . . . . . . . — 51 (27) (68)
Foreign currency translation . . . . . . . . . . . . . . . . . 4 (9) (6) (12)
Total income tax expense in comprehensiveincome . . . . . . . . . . . . . . . . . . . . . . . . . . . . . . . . $ 144 $(1,078) $(1,459) $(1,055)
Under the Plan of Reorganization, a substantial portion of the Company’s pre-petition debt securities,revolving credit facility and other obligations was extinguished. Absent an exception, a debtor recognizescancellation of indebtedness income (“CODI”) upon discharge of its outstanding indebtedness for an amountof consideration that is less than its adjusted issue price. The Internal Revenue Code of 1986, as amended(“IRC”), provides that a debtor in a bankruptcy case may exclude CODI from taxable income but must reducecertain of its tax attributes by the amount of any CODI realized as a result of the consummation of a plan ofreorganization. The amount of CODI realized by a taxpayer is the adjusted issue price of any indebtednessdischarged less the sum of (i) the amount of cash paid, (ii) the issue price of any new indebtedness issued and(iii) the fair market value of any other consideration, including equity, issued. As a result of the market valueof equity upon emergence from chapter 11 bankruptcy proceedings, the estimated amount of U.S. CODIexceeded the estimated amount of the Company’s U.S. tax attributes by approximately $7,433 million. Theactual reduction in tax attributes does not occur until the first day of our tax year subsequent to the date ofemergence, or January 1, 2011.
As a result of attribute reduction, we do not expect to retain any U.S. net operating loss carryforwards,alternative minimum tax credits or capital loss carryforwards. In addition, we expect that most, if not all, ofour tax bases in depreciable assets in the U.S. will be eliminated. Accordingly, we expect that the liability forU.S. income taxes in future periods will reflect these adjustments and the estimated U.S. cash tax liabilities for
151
LYONDELLBASELL INDUSTRIES N.V.
NOTES TO THE CONSOLIDATED FINANCIAL STATEMENTS — (Continued)
20. Income Taxes — (Continued)
the years following 2010 will be significantly higher than in 2009 or 2010. This situation may be somewhatpostponed by the temporary bonus depreciation provisions contained in the Job Creation Act of 2010 whichallow current year expensing for certain qualified asset acquisitions.
The Company recorded its adjusted taxes in fresh-start accounting without adjustment for estimatedchanges of tax attributes that could occur from May 1, 2010 to January 1, 2011, the date of actual reduction oftax attributes. Any adjustment to our tax attributes as a result of events or transactions that occurred during theperiod from May 1, 2010 to December 31, 2010 was reflected in the earnings of the Successor Company.
IRC Sections 382 and 383 provide an annual limitation with respect to the ability of a corporation toutilize its tax attributes, as well as certain built-in-losses, against future U.S. taxable income in the event of achange in ownership. Our emergence from Chapter 11 bankruptcy proceedings is considered a change inownership for purposes of IRC Section 382. The limitation under the IRC is based on the value of thecorporation as of the Emergence Date. We do not expect that the application of these limitations will have anymaterial affect upon our U.S. federal income tax liabilities. Germany has similar provisions that preclude theuse of certain tax attributes generated prior to a change of control. As of the Emergence Date, the Companyhad tax benefits associated with excess interest expense carryforwards in Germany in the amount of $20 millionthat were eliminated as a result of the emergence. The reversal of tax benefits associated with the loss of thesecarryforwards is reflected in the Predecessor period.
Our current and future provisions for income taxes are significantly impacted by the initial recognition of,and changes in, valuation allowances in certain countries and are dependent upon future earnings and earningssustainability in those jurisdictions. Consequently, our effective income tax rate of 10.1% in the Successorperiod will not be indicative of future effective tax rates.
152
LYONDELLBASELL INDUSTRIES N.V.
NOTES TO THE CONSOLIDATED FINANCIAL STATEMENTS — (Continued)

20. Income Taxes — (Continued)
The deferred tax effects of tax losses carried forward and the tax effects of temporary differences betweenthe tax bases of assets and liabilities and their reported amounts in the consolidated financial statements,reduced by a valuation allowance where appropriate, are presented below:
December 31,2010
December 31,2009
Successor Predecessor
Millions of dollars
Deferred tax liabilities:
Accelerated tax depreciation . . . . . . . . . . . . . . . . . . . . . . . . . . . . . . . $1,653 $3,251
Investments in joint venture partnerships . . . . . . . . . . . . . . . . . . . . . . 139 482
Accrued interest . . . . . . . . . . . . . . . . . . . . . . . . . . . . . . . . . . . . . . . . — 341
Other intangible assets . . . . . . . . . . . . . . . . . . . . . . . . . . . . . . . . . . . 357 430
Inventory . . . . . . . . . . . . . . . . . . . . . . . . . . . . . . . . . . . . . . . . . . . . . 600 238
Other . . . . . . . . . . . . . . . . . . . . . . . . . . . . . . . . . . . . . . . . . . . . . . . . — 17
Total deferred tax liabilities . . . . . . . . . . . . . . . . . . . . . . . . . . . . . . 2,749 4,759
Deferred tax assets:
Net operating loss carryforwards . . . . . . . . . . . . . . . . . . . . . . . . . . . . 645 1,031
Employee benefit plans. . . . . . . . . . . . . . . . . . . . . . . . . . . . . . . . . . . 487 543
Deferred interest carryforwards . . . . . . . . . . . . . . . . . . . . . . . . . . . . . 896 638
AMT credits. . . . . . . . . . . . . . . . . . . . . . . . . . . . . . . . . . . . . . . . . . . — 214
Goodwill . . . . . . . . . . . . . . . . . . . . . . . . . . . . . . . . . . . . . . . . . . . . . — 44
State and foreign income taxes, net of federal tax benefit . . . . . . . . . . 42 107
Environmental reserves . . . . . . . . . . . . . . . . . . . . . . . . . . . . . . . . . . . 35 549
Other . . . . . . . . . . . . . . . . . . . . . . . . . . . . . . . . . . . . . . . . . . . . . . . . 142 167
Total deferred tax assets . . . . . . . . . . . . . . . . . . . . . . . . . . . . . . . . 2,247 3,293
Deferred tax asset valuation allowances . . . . . . . . . . . . . . . . . . . . . . . (558) (666)
Net deferred tax assets . . . . . . . . . . . . . . . . . . . . . . . . . . . . . . . . . 1,689 2,627
Net deferred tax liabilities . . . . . . . . . . . . . . . . . . . . . . . . . . . . . . . . . . $1,060 $2,132
Balance sheet classifications:
Deferred tax assets — current . . . . . . . . . . . . . . . . . . . . . . . . . . . . . . $ 66 $ 4
Deferred tax assets — long-term . . . . . . . . . . . . . . . . . . . . . . . . . . . . 41 115
Deferred tax liability — current. . . . . . . . . . . . . . . . . . . . . . . . . . . . . 244 170
Deferred tax liability — long term. . . . . . . . . . . . . . . . . . . . . . . . . . . 923 2,081
Net deferred tax liabilities . . . . . . . . . . . . . . . . . . . . . . . . . . . . . . . $1,060 $2,132
The application of fresh-start accounting on May 1, 2010 resulted in the re-measurement of deferredincome tax liabilities associated with the revaluation of the Company’s assets and liabilities pursuant toASC 852 (see Note 4). As a result, deferred income taxes were recorded at amounts determined in accordancewith ASC 740 of $1,049 million. Further, we recorded valuation allowances against certain of our deferred taxassets resulting from this re-measurement.
153
LYONDELLBASELL INDUSTRIES N.V.
NOTES TO THE CONSOLIDATED FINANCIAL STATEMENTS — (Continued)
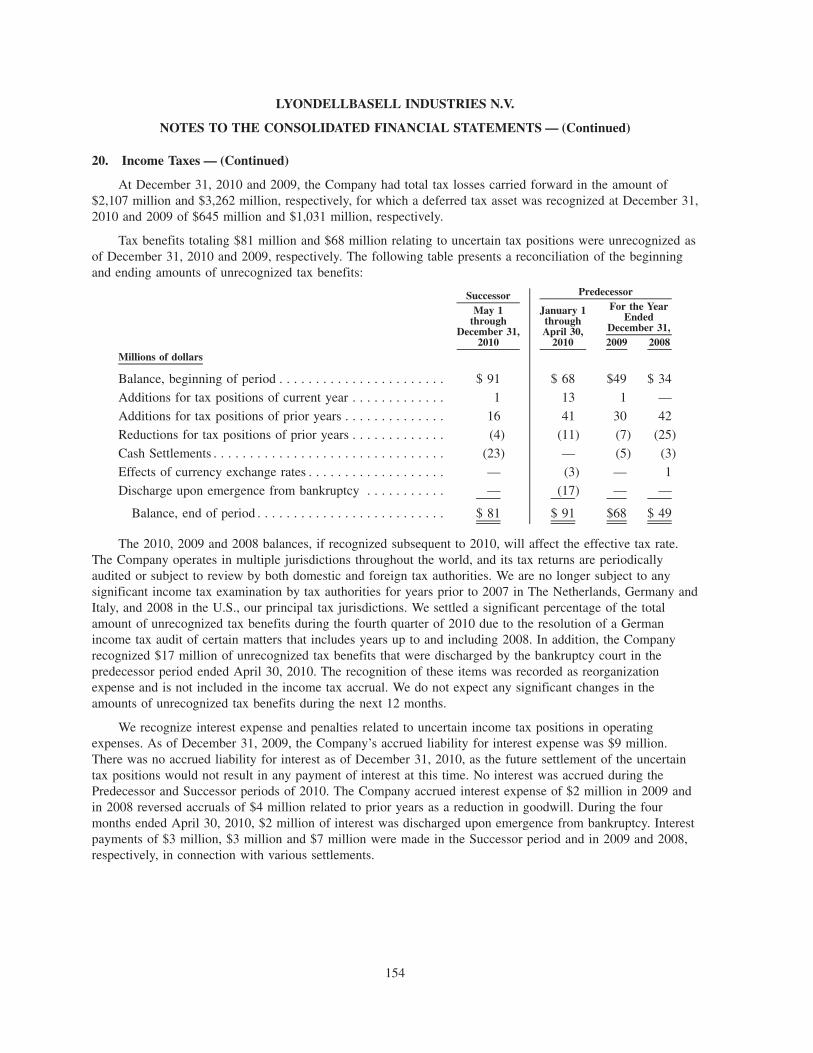
20. Income Taxes — (Continued)
At December 31, 2010 and 2009, the Company had total tax losses carried forward in the amount of$2,107 million and $3,262 million, respectively, for which a deferred tax asset was recognized at December 31,2010 and 2009 of $645 million and $1,031 million, respectively.
Tax benefits totaling $81 million and $68 million relating to uncertain tax positions were unrecognized asof December 31, 2010 and 2009, respectively. The following table presents a reconciliation of the beginningand ending amounts of unrecognized tax benefits:
May 1through
December 31,2010
January 1throughApril 30,
2010 2009 2008
For the YearEnded
December 31,
Successor Predecessor
Millions of dollars
Balance, beginning of period . . . . . . . . . . . . . . . . . . . . . . . $ 91 $ 68 $49 $ 34
Additions for tax positions of current year . . . . . . . . . . . . . 1 13 1 —
Additions for tax positions of prior years . . . . . . . . . . . . . . 16 41 30 42
Reductions for tax positions of prior years . . . . . . . . . . . . . (4) (11) (7) (25)
Cash Settlements . . . . . . . . . . . . . . . . . . . . . . . . . . . . . . . . (23) — (5) (3)
Effects of currency exchange rates . . . . . . . . . . . . . . . . . . . — (3) — 1
Discharge upon emergence from bankruptcy . . . . . . . . . . . — (17) — —
Balance, end of period . . . . . . . . . . . . . . . . . . . . . . . . . . $ 81 $ 91 $68 $ 49
The 2010, 2009 and 2008 balances, if recognized subsequent to 2010, will affect the effective tax rate.The Company operates in multiple jurisdictions throughout the world, and its tax returns are periodicallyaudited or subject to review by both domestic and foreign tax authorities. We are no longer subject to anysignificant income tax examination by tax authorities for years prior to 2007 in The Netherlands, Germany andItaly, and 2008 in the U.S., our principal tax jurisdictions. We settled a significant percentage of the totalamount of unrecognized tax benefits during the fourth quarter of 2010 due to the resolution of a Germanincome tax audit of certain matters that includes years up to and including 2008. In addition, the Companyrecognized $17 million of unrecognized tax benefits that were discharged by the bankruptcy court in thepredecessor period ended April 30, 2010. The recognition of these items was recorded as reorganizationexpense and is not included in the income tax accrual. We do not expect any significant changes in theamounts of unrecognized tax benefits during the next 12 months.
We recognize interest expense and penalties related to uncertain income tax positions in operatingexpenses. As of December 31, 2009, the Company’s accrued liability for interest expense was $9 million.There was no accrued liability for interest as of December 31, 2010, as the future settlement of the uncertaintax positions would not result in any payment of interest at this time. No interest was accrued during thePredecessor and Successor periods of 2010. The Company accrued interest expense of $2 million in 2009 andin 2008 reversed accruals of $4 million related to prior years as a reduction in goodwill. During the fourmonths ended April 30, 2010, $2 million of interest was discharged upon emergence from bankruptcy. Interestpayments of $3 million, $3 million and $7 million were made in the Successor period and in 2009 and 2008,respectively, in connection with various settlements.
154
LYONDELLBASELL INDUSTRIES N.V.
NOTES TO THE CONSOLIDATED FINANCIAL STATEMENTS — (Continued)
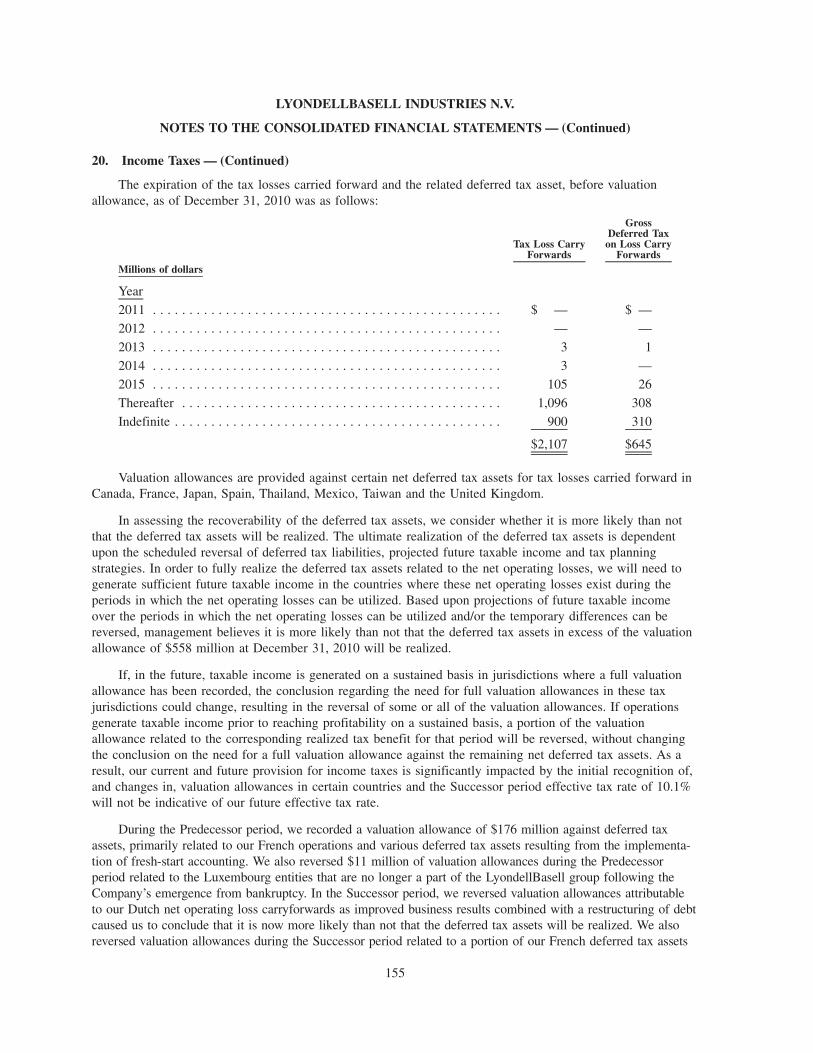
20. Income Taxes — (Continued)
The expiration of the tax losses carried forward and the related deferred tax asset, before valuationallowance, as of December 31, 2010 was as follows:
Tax Loss CarryForwards
GrossDeferred Tax
on Loss CarryForwards
Millions of dollars
Year
2011 . . . . . . . . . . . . . . . . . . . . . . . . . . . . . . . . . . . . . . . . . . . . . . . . $ — $ —
2012 . . . . . . . . . . . . . . . . . . . . . . . . . . . . . . . . . . . . . . . . . . . . . . . . — —
2013 . . . . . . . . . . . . . . . . . . . . . . . . . . . . . . . . . . . . . . . . . . . . . . . . 3 1
2014 . . . . . . . . . . . . . . . . . . . . . . . . . . . . . . . . . . . . . . . . . . . . . . . . 3 —
2015 . . . . . . . . . . . . . . . . . . . . . . . . . . . . . . . . . . . . . . . . . . . . . . . . 105 26
Thereafter . . . . . . . . . . . . . . . . . . . . . . . . . . . . . . . . . . . . . . . . . . . . 1,096 308
Indefinite . . . . . . . . . . . . . . . . . . . . . . . . . . . . . . . . . . . . . . . . . . . . . 900 310
$2,107 $645
Valuation allowances are provided against certain net deferred tax assets for tax losses carried forward inCanada, France, Japan, Spain, Thailand, Mexico, Taiwan and the United Kingdom.
In assessing the recoverability of the deferred tax assets, we consider whether it is more likely than notthat the deferred tax assets will be realized. The ultimate realization of the deferred tax assets is dependentupon the scheduled reversal of deferred tax liabilities, projected future taxable income and tax planningstrategies. In order to fully realize the deferred tax assets related to the net operating losses, we will need togenerate sufficient future taxable income in the countries where these net operating losses exist during theperiods in which the net operating losses can be utilized. Based upon projections of future taxable incomeover the periods in which the net operating losses can be utilized and/or the temporary differences can bereversed, management believes it is more likely than not that the deferred tax assets in excess of the valuationallowance of $558 million at December 31, 2010 will be realized.
If, in the future, taxable income is generated on a sustained basis in jurisdictions where a full valuationallowance has been recorded, the conclusion regarding the need for full valuation allowances in these taxjurisdictions could change, resulting in the reversal of some or all of the valuation allowances. If operationsgenerate taxable income prior to reaching profitability on a sustained basis, a portion of the valuationallowance related to the corresponding realized tax benefit for that period will be reversed, without changingthe conclusion on the need for a full valuation allowance against the remaining net deferred tax assets. As aresult, our current and future provision for income taxes is significantly impacted by the initial recognition of,and changes in, valuation allowances in certain countries and the Successor period effective tax rate of 10.1%will not be indicative of our future effective tax rate.
During the Predecessor period, we recorded a valuation allowance of $176 million against deferred taxassets, primarily related to our French operations and various deferred tax assets resulting from the implementa-tion of fresh-start accounting. We also reversed $11 million of valuation allowances during the Predecessorperiod related to the Luxembourg entities that are no longer a part of the LyondellBasell group following theCompany’s emergence from bankruptcy. In the Successor period, we reversed valuation allowances attributableto our Dutch net operating loss carryforwards as improved business results combined with a restructuring of debtcaused us to conclude that it is now more likely than not that the deferred tax assets will be realized. We alsoreversed valuation allowances during the Successor period related to a portion of our French deferred tax assets
155
LYONDELLBASELL INDUSTRIES N.V.
NOTES TO THE CONSOLIDATED FINANCIAL STATEMENTS — (Continued)

20. Income Taxes — (Continued)
due to a restructuring of our French operations. These reversals resulted in a net decrease in income tax expenseof $250 million in the Successor period. There were also changes in the valuation allowances for 2010 related totranslation adjustments. At the end of 2009, the balance of cumulative valuation allowances was $666 million.The only changes in the valuation allowance in 2009 were related to translation adjustments.
In most cases, deferred taxes have not been provided for possible future distributions of earnings ofsubsidiaries as such dividends are not expected to be subject to further taxation upon their distribution.Deferred taxes on the unremitted earnings of certain equity joint ventures of $23 million, and $20 million atDecember 31, 2010 and 2009, respectively, have been provided to the extent that such earnings are subject totaxation on their future remittance.
LyondellBasell N.V. is incorporated and is resident in The Netherlands. However, since the Company’sproportion of U.S. revenues, assets, operating income and associated tax provisions is significantly greater thanany other single taxing jurisdiction within the worldwide group, the reconciliation of the differences betweenthe provision for income taxes and the statutory rate is presented on the basis of the U.S. statutory federalincome tax rate of 35% as opposed to the Dutch statutory rate of 25.5% to provide a more meaningful insightinto those differences. This summary is shown below:
May 1through
December 31,2010
January 1throughApril 30,
2010 2009 2008
For the Year EndedDecember 31,
Successor Predecessor
Millions of dollars
Income (loss) before income taxes:
U.S. . . . . . . . . . . . . . . . . . . . . . . . . . . . . . . . . . . $1,141 $ 8,684 $(4,358) $(8,308)
Non-U.S. . . . . . . . . . . . . . . . . . . . . . . . . . . . . . . 545 (1,301) 75 117
Total . . . . . . . . . . . . . . . . . . . . . . . . . . . . . . . . $1,686 $ 7,383 $(4,283) $(8,191)
Theoretical income tax at U.S. statutory rate . . . . . . $ 590 $ 2,584 $(1,499) $(2,867)
Increase (reduction) resulting from:
Impairment of goodwill . . . . . . . . . . . . . . . . . . — — — 1,746
Discharge of debt and other reorganizationrelated items . . . . . . . . . . . . . . . . . . . . . . . . (221) (3,886) — —
Non-U.S. income taxed at lower statutoryrates. . . . . . . . . . . . . . . . . . . . . . . . . . . . . . . (14) (3) (1) (59)
State income taxes, net of federal benefit . . . . . 36 (47) — —
Changes in valuation allowances. . . . . . . . . . . . (250) 176 — 200
Non-taxable (income) and non-deductibleexpenses . . . . . . . . . . . . . . . . . . . . . . . . . . . (102) — 124 44
Notional royalties. . . . . . . . . . . . . . . . . . . . . . . (12) (11) (47) —
Other income taxes, net of federal benefit . . . . . 33 30 24 34
Uncertain tax positions . . . . . . . . . . . . . . . . . . . 13 42 24 33
Warrants & Stock Compensation . . . . . . . . . . . 24 5 — —
Transfer of subsidiary. . . . . . . . . . . . . . . . . . . . 88 — — —
Other, net . . . . . . . . . . . . . . . . . . . . . . . . . . . . (15) (13) (36) 21
Income tax provision (benefit) . . . . . . . . . . . . . $ 170 $(1,123) $(1,411) $ (848)
156
LYONDELLBASELL INDUSTRIES N.V.
NOTES TO THE CONSOLIDATED FINANCIAL STATEMENTS — (Continued)

21. Commitments and Contingencies
Commitments — We have various purchase commitments for materials, supplies and services incident tothe ordinary conduct of business, generally for quantities required for its businesses and at prevailing marketprices. These commitments are designed to assure sources of supply and are not expected to be in excess ofnormal requirements. At December 31, 2010, we had commitments of approximately $5 million related torebuilding an expanded world-scale high-density polyethylene plant at its Munchsmunster, Germany site. Ourother capital expenditure commitments at December 31, 2010 were in the normal course of business.
Financial Assurance Instruments — We have obtained letters of credit, performance and surety bonds andhave issued financial and performance guarantees to support trade payables, potential liabilities and otherobligations. Considering the frequency of claims made against the financial instruments we use to support ourobligations, and the magnitude of those financial instruments in light of our current financial position,management does not expect that any claims against or draws on these instruments would have a materialadverse effect on our consolidated financial statements. We have not experienced any unmanageable difficultyin obtaining the required financial assurance instruments for our current operations.
Environmental Remediation — Our accrued liability for future environmental remediation costs at currentand former plant sites and other remediation sites totaled $107 million as of December 31, 2010. The accruedliabilities for individual sites range from less than $1 million to $37 million. The remediation expenditures areexpected to occur over a number of years, and not to be concentrated in any single year. In our opinion, it isreasonably possible that losses in excess of the liabilities recorded may have been incurred. However, wecannot estimate any amount or range of such possible additional losses. New information about sites, newtechnology or future developments such as involvement in investigations by regulatory agencies, could requireus to reassess our potential exposure related to environmental matters.
The following table summarizes the activity in the Company’s accrued environmental liability included in“Accrued liabilities” and “Other liabilities”:
May 1through
December 31,2010
January 1throughApril 30,
2010
For the YearEnded
December 31,2009
Successor Predecessor
Millions of dollars
Balance at beginning of period . . . . . . . . . . . . . . . . . . . . . . $ 93 $89 $ 256
Additional provisions . . . . . . . . . . . . . . . . . . . . . . . . . . . . . 17 11 8
Amounts paid . . . . . . . . . . . . . . . . . . . . . . . . . . . . . . . . . . (3) (2) (7)
Reclassification to Liabilities subject to compromise . . . . . . — — (169)
Foreign exchange effects . . . . . . . . . . . . . . . . . . . . . . . . . . — (5) 1
Balance at end of period . . . . . . . . . . . . . . . . . . . . . . . . . $107 $93 $ 89
The Debtors resolved substantially all of their liability related to third-party sites (including sites wherethe Debtors were subject to a Comprehensive Environmental Response, Compensation and Liability Act orsimilar state order to fund or perform such cleanup, such as the river and the other portions of the KalamazooRiver Superfund Site that the Debtors do not own) through creation of the Environmental Custodial Trust andagreement on allowed claim values as set forth in the Debtors’ Third Amended Plan of Reorganization andSettlement Agreement Among the Debtors, the Environmental Custodial Trust Trustee, The United States, andcertain environmental Agencies filed with the U.S. Bankruptcy Court on March 30, 2010 and approved by thecourt on April 23, 2010. Upon the Debtors’ emergence from bankruptcy, certain real properties owned by theDebtors, including the Schedule III Debtors (as defined in the Plan of Reorganization), were transferred to the
157
LYONDELLBASELL INDUSTRIES N.V.
NOTES TO THE CONSOLIDATED FINANCIAL STATEMENTS — (Continued)
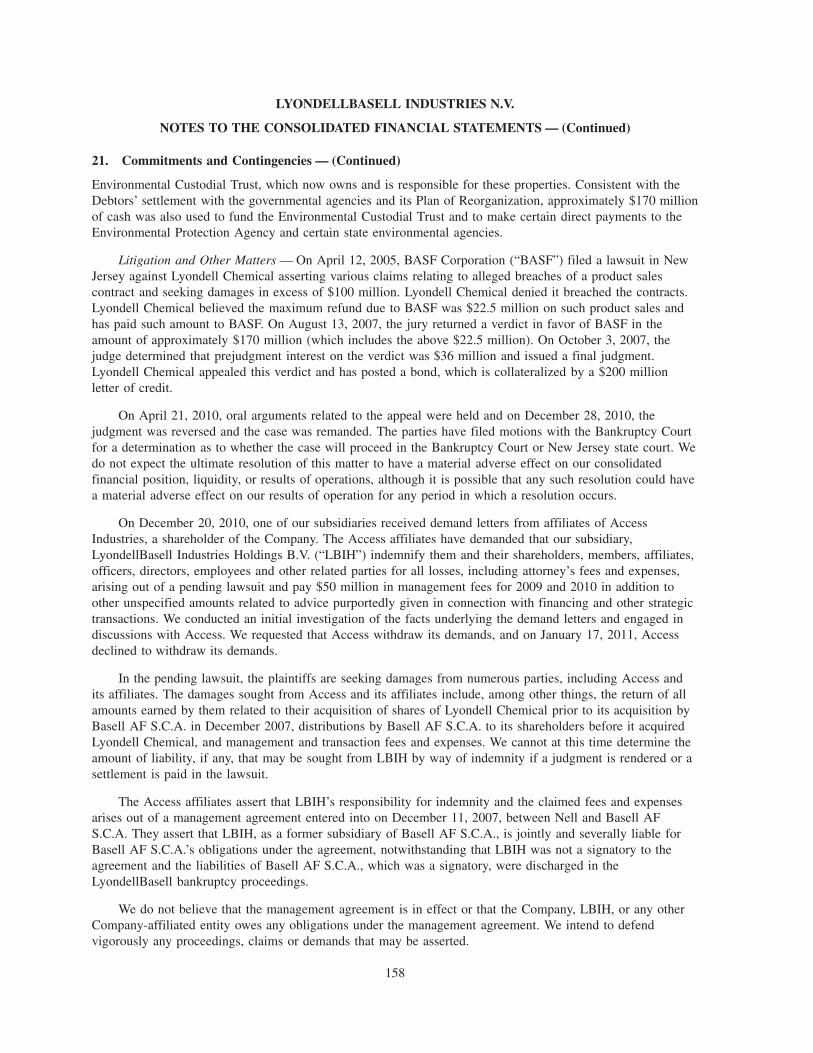
21. Commitments and Contingencies — (Continued)
Environmental Custodial Trust, which now owns and is responsible for these properties. Consistent with theDebtors’ settlement with the governmental agencies and its Plan of Reorganization, approximately $170 millionof cash was also used to fund the Environmental Custodial Trust and to make certain direct payments to theEnvironmental Protection Agency and certain state environmental agencies.
Litigation and Other Matters — On April 12, 2005, BASF Corporation (“BASF”) filed a lawsuit in NewJersey against Lyondell Chemical asserting various claims relating to alleged breaches of a product salescontract and seeking damages in excess of $100 million. Lyondell Chemical denied it breached the contracts.Lyondell Chemical believed the maximum refund due to BASF was $22.5 million on such product sales andhas paid such amount to BASF. On August 13, 2007, the jury returned a verdict in favor of BASF in theamount of approximately $170 million (which includes the above $22.5 million). On October 3, 2007, thejudge determined that prejudgment interest on the verdict was $36 million and issued a final judgment.Lyondell Chemical appealed this verdict and has posted a bond, which is collateralized by a $200 millionletter of credit.
On April 21, 2010, oral arguments related to the appeal were held and on December 28, 2010, thejudgment was reversed and the case was remanded. The parties have filed motions with the Bankruptcy Courtfor a determination as to whether the case will proceed in the Bankruptcy Court or New Jersey state court. Wedo not expect the ultimate resolution of this matter to have a material adverse effect on our consolidatedfinancial position, liquidity, or results of operations, although it is possible that any such resolution could havea material adverse effect on our results of operation for any period in which a resolution occurs.
On December 20, 2010, one of our subsidiaries received demand letters from affiliates of AccessIndustries, a shareholder of the Company. The Access affiliates have demanded that our subsidiary,LyondellBasell Industries Holdings B.V. (“LBIH”) indemnify them and their shareholders, members, affiliates,officers, directors, employees and other related parties for all losses, including attorney’s fees and expenses,arising out of a pending lawsuit and pay $50 million in management fees for 2009 and 2010 in addition toother unspecified amounts related to advice purportedly given in connection with financing and other strategictransactions. We conducted an initial investigation of the facts underlying the demand letters and engaged indiscussions with Access. We requested that Access withdraw its demands, and on January 17, 2011, Accessdeclined to withdraw its demands.
In the pending lawsuit, the plaintiffs are seeking damages from numerous parties, including Access andits affiliates. The damages sought from Access and its affiliates include, among other things, the return of allamounts earned by them related to their acquisition of shares of Lyondell Chemical prior to its acquisition byBasell AF S.C.A. in December 2007, distributions by Basell AF S.C.A. to its shareholders before it acquiredLyondell Chemical, and management and transaction fees and expenses. We cannot at this time determine theamount of liability, if any, that may be sought from LBIH by way of indemnity if a judgment is rendered or asettlement is paid in the lawsuit.
The Access affiliates assert that LBIH’s responsibility for indemnity and the claimed fees and expensesarises out of a management agreement entered into on December 11, 2007, between Nell and Basell AFS.C.A. They assert that LBIH, as a former subsidiary of Basell AF S.C.A., is jointly and severally liable forBasell AF S.C.A.’s obligations under the agreement, notwithstanding that LBIH was not a signatory to theagreement and the liabilities of Basell AF S.C.A., which was a signatory, were discharged in theLyondellBasell bankruptcy proceedings.
We do not believe that the management agreement is in effect or that the Company, LBIH, or any otherCompany-affiliated entity owes any obligations under the management agreement. We intend to defendvigorously any proceedings, claims or demands that may be asserted.
158
LYONDELLBASELL INDUSTRIES N.V.
NOTES TO THE CONSOLIDATED FINANCIAL STATEMENTS — (Continued)
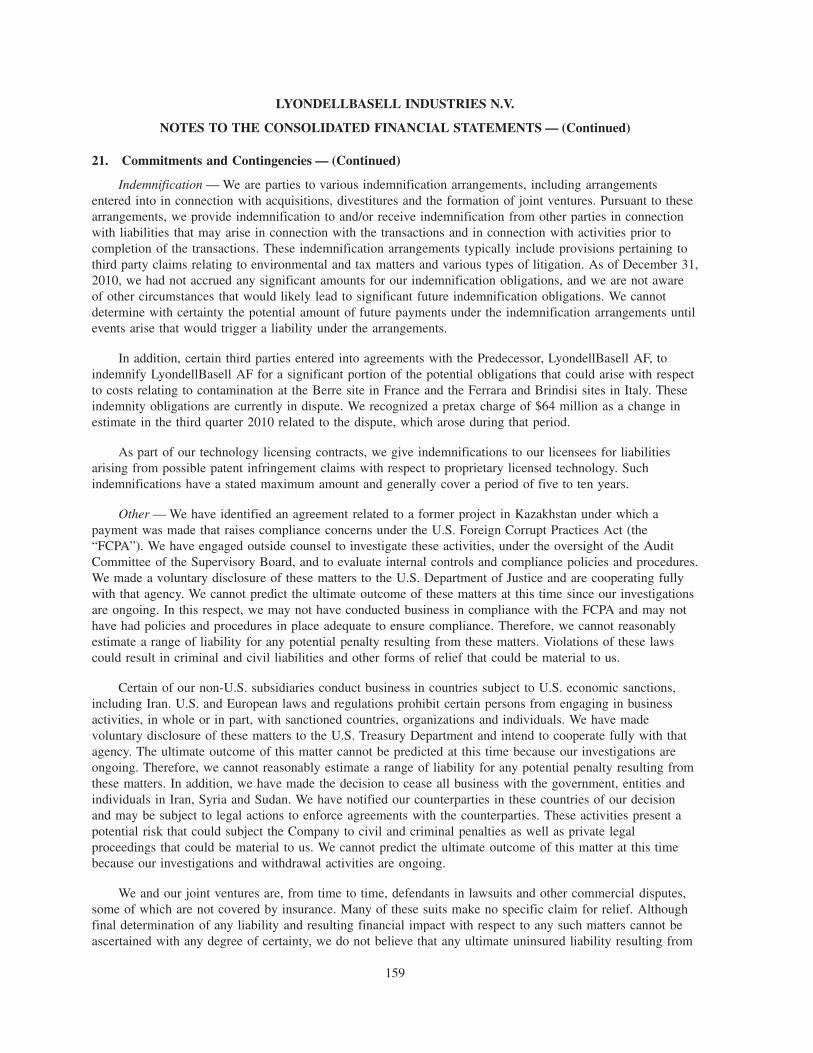
21. Commitments and Contingencies — (Continued)
Indemnification — We are parties to various indemnification arrangements, including arrangementsentered into in connection with acquisitions, divestitures and the formation of joint ventures. Pursuant to thesearrangements, we provide indemnification to and/or receive indemnification from other parties in connectionwith liabilities that may arise in connection with the transactions and in connection with activities prior tocompletion of the transactions. These indemnification arrangements typically include provisions pertaining tothird party claims relating to environmental and tax matters and various types of litigation. As of December 31,2010, we had not accrued any significant amounts for our indemnification obligations, and we are not awareof other circumstances that would likely lead to significant future indemnification obligations. We cannotdetermine with certainty the potential amount of future payments under the indemnification arrangements untilevents arise that would trigger a liability under the arrangements.
In addition, certain third parties entered into agreements with the Predecessor, LyondellBasell AF, toindemnify LyondellBasell AF for a significant portion of the potential obligations that could arise with respectto costs relating to contamination at the Berre site in France and the Ferrara and Brindisi sites in Italy. Theseindemnity obligations are currently in dispute. We recognized a pretax charge of $64 million as a change inestimate in the third quarter 2010 related to the dispute, which arose during that period.
As part of our technology licensing contracts, we give indemnifications to our licensees for liabilitiesarising from possible patent infringement claims with respect to proprietary licensed technology. Suchindemnifications have a stated maximum amount and generally cover a period of five to ten years.
Other — We have identified an agreement related to a former project in Kazakhstan under which apayment was made that raises compliance concerns under the U.S. Foreign Corrupt Practices Act (the“FCPA”). We have engaged outside counsel to investigate these activities, under the oversight of the AuditCommittee of the Supervisory Board, and to evaluate internal controls and compliance policies and procedures.We made a voluntary disclosure of these matters to the U.S. Department of Justice and are cooperating fullywith that agency. We cannot predict the ultimate outcome of these matters at this time since our investigationsare ongoing. In this respect, we may not have conducted business in compliance with the FCPA and may nothave had policies and procedures in place adequate to ensure compliance. Therefore, we cannot reasonablyestimate a range of liability for any potential penalty resulting from these matters. Violations of these lawscould result in criminal and civil liabilities and other forms of relief that could be material to us.
Certain of our non-U.S. subsidiaries conduct business in countries subject to U.S. economic sanctions,including Iran. U.S. and European laws and regulations prohibit certain persons from engaging in businessactivities, in whole or in part, with sanctioned countries, organizations and individuals. We have madevoluntary disclosure of these matters to the U.S. Treasury Department and intend to cooperate fully with thatagency. The ultimate outcome of this matter cannot be predicted at this time because our investigations areongoing. Therefore, we cannot reasonably estimate a range of liability for any potential penalty resulting fromthese matters. In addition, we have made the decision to cease all business with the government, entities andindividuals in Iran, Syria and Sudan. We have notified our counterparties in these countries of our decisionand may be subject to legal actions to enforce agreements with the counterparties. These activities present apotential risk that could subject the Company to civil and criminal penalties as well as private legalproceedings that could be material to us. We cannot predict the ultimate outcome of this matter at this timebecause our investigations and withdrawal activities are ongoing.
We and our joint ventures are, from time to time, defendants in lawsuits and other commercial disputes,some of which are not covered by insurance. Many of these suits make no specific claim for relief. Althoughfinal determination of any liability and resulting financial impact with respect to any such matters cannot beascertained with any degree of certainty, we do not believe that any ultimate uninsured liability resulting from
159
LYONDELLBASELL INDUSTRIES N.V.
NOTES TO THE CONSOLIDATED FINANCIAL STATEMENTS — (Continued)

21. Commitments and Contingencies — (Continued)
these matters will, individually or in the aggregate, have a material adverse effect on the financial position,liquidity or results of operations of LyondellBasell N.V.
General — In our opinion, the matters discussed in this note are not expected to have a material adverseeffect on the financial position or liquidity of LyondellBasell N.V. However, the adverse resolution in anyreporting period of one or more of these matters could have a material impact on our results of operations forthat period, which may be mitigated by contribution or indemnification obligations of others, or by anyinsurance coverage that may be available.
22. Stockholders’ Equity (Deficit) and Non-Controlling Interests
Common Stock — On April 30, 2010, approximately 563.9 million shares of LyondellBasell N.V. commonstock, including 300 million shares of class A new ordinary shares were issued in exchange for allowed claimsunder the Plan of Reorganization. In addition, approximately 263.9 million shares of LyondellBasell N.V.class B ordinary shares were issued in connection with a rights offering for gross proceeds of $2.8 billion. OnDecember 6, 2010, 263.9 million class B ordinary shares converted into class A ordinary shares on a one-for-one basis in accordance with their terms.
Dividend distribution — Our credit arrangements include restrictive covenants that limit our ability to paydividends up to $50 million per year through December 31, 2011 and to the greater of (i) $50 million per yearand (ii) the aggregate dividends paid since April 30, 2010 not to exceed fifty percent of net income sinceJanuary 1, 2012 and thereafter.
Conversion of Class B Ordinary Shares — Our Articles of Association provided that at the earlier of(i) the request of the relevant holder of class B ordinary shares with respect to the number of class B ordinaryshares specified by such holder; (ii) acquisition by us of one or more class B ordinary shares; or (iii) the firstdate upon which the closing price per share of the class B ordinary shares has exceeded 200% of $10.61 for atleast forty-five trading days within a period of sixty consecutive trading days (provided that the closing priceper share of the class B ordinary shares exceeded such threshold on both the first and last day of the sixty dayperiod), each such class B ordinary share would be converted into one class A ordinary share. At the close ofbusiness on December 6, 2010, the provision in (iii) was met, and the 263.9 million class B ordinary sharesoutstanding as of that date had not previously been converted in accordance with (i), above, converted into anequal number of Class A ordinary shares.
Treasury shares — In connection with our formation, we issued one million one hundred twenty-fivethousand (1,125,000), four Eurocent (A0.04) each, class A ordinary shares for A45 thousand to StichtingTopCo, a foundation formed under the laws of The Netherlands (the “Foundation”). On April 30, 2010, theFoundation transferred the shares from the Foundation for nil consideration. These shares are classified asTreasury Stock on our Consolidated Balance Sheet.
160
LYONDELLBASELL INDUSTRIES N.V.
NOTES TO THE CONSOLIDATED FINANCIAL STATEMENTS — (Continued)

22. Stockholders’ Equity (Deficit) and Non-Controlling Interests — (Continued)
The changes in the outstanding amounts of class A and class B ordinary shares and treasury shares forthe period May 1 through December 31, 2010, were as follows:
Successor
Class A ordinary shares:Issued April 30, 2010 . . . . . . . . . . . . . . . . . . . . . . . . . . . . . . . . . . . . . . . . . . . . . . 300,000,000
Share-based compensation . . . . . . . . . . . . . . . . . . . . . . . . . . . . . . . . . . . . . . . . . . . 1,774,196
Conversion of class B ordinary shares . . . . . . . . . . . . . . . . . . . . . . . . . . . . . . . . . . 263,901,979
Warrants exercised . . . . . . . . . . . . . . . . . . . . . . . . . . . . . . . . . . . . . . . . . . . . . . . . 47
Balance December 31, 2010 . . . . . . . . . . . . . . . . . . . . . . . . . . . . . . . . . . . . . . . . . 565,676,222
Class B ordinary shares:Issued April 30, 2010 . . . . . . . . . . . . . . . . . . . . . . . . . . . . . . . . . . . . . . . . . . . . . . 263,901,979
Conversion to class A ordinary shares . . . . . . . . . . . . . . . . . . . . . . . . . . . . . . . . . . (263,901,979)
Balance December 31, 2010 . . . . . . . . . . . . . . . . . . . . . . . . . . . . . . . . . . . . . . . . . —
Class A ordinary shares held as treasury shares:Shares acquired April 30, 2010 . . . . . . . . . . . . . . . . . . . . . . . . . . . . . . . . . . . . . . . 1,125,000
Shares tendered to exercise warrants . . . . . . . . . . . . . . . . . . . . . . . . . . . . . . . . . . . 53
Share-based compensation . . . . . . . . . . . . . . . . . . . . . . . . . . . . . . . . . . . . . . . . . . . (2,402)
Balance December 31, 2010 . . . . . . . . . . . . . . . . . . . . . . . . . . . . . . . . . . . . . . . . . 1,122,651
Accumulated Other Comprehensive Income (Loss) — The components of accumulated other comprehen-sive income (loss) were as follows:
Millions of dollars
SuccessorDecember 31, 2010
Pension and postretirement liabilities . . . . . . . . . . . . . . . . . . . . . . . . . . . . . . . . . . . . . . . . $ (33)
Foreign currency translation . . . . . . . . . . . . . . . . . . . . . . . . . . . . . . . . . . . . . . . . . . . . . . . 113
Unrealized gains on available-for-sale securities . . . . . . . . . . . . . . . . . . . . . . . . . . . . . . . . 1
Total . . . . . . . . . . . . . . . . . . . . . . . . . . . . . . . . . . . . . . . . . . . . . . . . . . . . . . . . . . . . . . $ 81
PredecessorDecember 31, 2009
Pension and postretirement liabilities . . . . . . . . . . . . . . . . . . . . . . . . . . . . . . . . . . . . . . . . $(273)
Financial derivatives . . . . . . . . . . . . . . . . . . . . . . . . . . . . . . . . . . . . . . . . . . . . . . . . . . . . (60)
Foreign currency translation . . . . . . . . . . . . . . . . . . . . . . . . . . . . . . . . . . . . . . . . . . . . . . . 35
Unrealized gains on available-for-sale securities . . . . . . . . . . . . . . . . . . . . . . . . . . . . . . . . 12
Total . . . . . . . . . . . . . . . . . . . . . . . . . . . . . . . . . . . . . . . . . . . . . . . . . . . . . . . . . . . . . . $(286)
Transactions recorded in “Accumulated other comprehensive income” are recognized net of tax.
The unrealized gain on available-for-sale securities represents the Company’s share of such gain recordedby equity investees.
161
LYONDELLBASELL INDUSTRIES N.V.
NOTES TO THE CONSOLIDATED FINANCIAL STATEMENTS — (Continued)

22. Stockholders’ Equity (Deficit) and Non-Controlling Interests — (Continued)
Non-controlling Interests — Losses attributable to non-controlling interests consisted of the followingcomponents:
May 1through
December 31,2010
January 1throughApril 30,
2010 2009 2008
For the YearEnded
December 31,
Successor Predecessor
Millions of dollars
Comprehensive income (loss):
Non-controlling interests share of income (loss) . . . . . . . $ 7 $(53) $ 15 $ 18
Fixed operating fees paid to Lyondell Chemical by thePO/SM II partnership . . . . . . . . . . . . . . . . . . . . . . . . (14) (7) (21) (25)
Net loss attributable to non-controlling interests . . . . . $ (7) $(60) $ (6) $ (7)
23. Per Share Data
Basic earnings per share for the periods subsequent to April 30, 2010 are based upon the weightedaverage number of shares of common stock outstanding during the periods. Diluted earnings per share includesthe effect of certain stock options. The Company has unvested restricted stock and restricted stock units thatare considered participating securities for earnings per share. Certain outstanding stock options, participatingsecurities and all of the outstanding warrants were anti-dilutive.
Earnings per share data and dividends declared per share of common stock were as follows for the periodMay 1 through December 21, 2010:
ContinuingOperations
DiscontinuedOperations
Millions of dollars
Net Income . . . . . . . . . . . . . . . . . . . . . . . . . . . . . . . . . . . . . . . . . . . . . . . $1,516 $ 64
Less: net loss attributable to non-controlling interests . . . . . . . . . . . . . . . . 7 —
Net income attributable to LyondellBasell N.V. . . . . . . . . . . . . . . . . . . . . 1,523 64
Net income attributable to participating securities . . . . . . . . . . . . . . . . . . . (3) —
Net income attributable to common stockholders . . . . . . . . . . . . . . . . . . . . $1,520 $ 64
Millions of shares
Basic weighted average common stock outstanding . . . . . . . . . . . . . . . . . . 564 564
Effect of dilutive securities:
Stock options . . . . . . . . . . . . . . . . . . . . . . . . . . . . . . . . . . . . . . . . . . 2 2
Dilutive potential shares . . . . . . . . . . . . . . . . . . . . . . . . . . . . . . . . . . . . . . 566 566
Earnings per share:
Basic . . . . . . . . . . . . . . . . . . . . . . . . . . . . . . . . . . . . . . . . . . . . . . . . . . $ 2.68 $0.11
Diluted. . . . . . . . . . . . . . . . . . . . . . . . . . . . . . . . . . . . . . . . . . . . . . . . . $ 2.67 $0.11
Anti-dilutive stock options and warrants in millions . . . . . . . . . . . . . . . . . 17.9 17.9
Dividends declared per share of common stock . . . . . . . . . . . . . . . . . . . . . $ — $ —
162
LYONDELLBASELL INDUSTRIES N.V.
NOTES TO THE CONSOLIDATED FINANCIAL STATEMENTS — (Continued)

24. Segment and Related Information
We operate in five segments:
• Olefins and Polyolefins — Americas, primarily manufacturing and marketing of olefins, includingethylene and its co-products, primarily propylene, butadiene, and aromatics, which include benzene andtoluene, as well as ethanol; and polyolefins, including polyethylene, comprising HDPE, LDPE andlinear low density polyethylene (“LLDPE”), and polypropylene; and Catalloy process resins;
• Olefins and Polyolefins — Europe, Asia, International, primarily manufacturing and marketing ofolefins, including ethylene and its co-products, primarily propylene and butadiene; polyolefins, includ-ing polyethylene, comprising HDPE, LDPE and polypropylene; polypropylene-based compounds,materials and alloys (“PP Compounds”), Catalloy process resins and polybutene-1 polymers;
• Intermediates and Derivatives (“I&D”), primarily manufacturing and marketing of PO; PO co-products,including styrene and the TBA intermediates tertiary butyl alcohol (“TBA”), isobutylene and tertiarybutyl hydroperoxide; PO derivatives, including propylene glycol, propylene glycol ethers and butane-diol; ethylene derivatives, including ethylene glycol, ethylene oxide (“EO”), and other EO derivatives;acetyls, including vinyl acetate monomer, acetic acid and methanol and fragrance and flavor chemicals;
• Refining and Oxyfuels, primarily manufacturing and marketing of refined petroleum products, includinggasoline, ultra-low sulfur diesel, jet fuel, lubricants (“lube oils”), alkylate, and oxygenated fuels, oroxyfuels, such as methyl tertiary butyl ether (“MTBE”), ethyl tertiary butyl ether (“ETBE”); and
• Technology, primarily licensing of polyolefin process technologies and supply of polyolefin catalystsand advanced catalysts.
The accounting policies of the segments are the same as those described in “Summary of SignificantAccounting Policies” (see Note 2), except that the Predecessor’s segment operating results reported tomanagement reflected costs of sales determined using current costs, which approximated results using theLIFO method of accounting for inventory. These current cost-basis operating results are reconciled toconsolidated operating income in the Predecessor tables below. Sales between segments are made primarily atprices approximating prevailing market prices.
No customer accounted for 10% or more of the Company’s consolidated sales during any year in thethree-year period ended December 31, 2010.
On December 22, 2010, we completed the sale of our Flavor and Fragrance chemicals business, includingproduction assets in Jacksonville, Florida and Colonels Island, Georgia, related inventories, receivables,contracts, customer lists, intellectual property and certain liabilities, receiving proceeds of $154 million. As aresult, the Flavor and Fragrance chemicals business, which was part of our I&D segment, is presented asdiscontinued operations and therefore excluded from the operations of the I&D segment below in theSuccessor period.
On September 1, 2008, LyondellBasell AF completed the sale of its TDI business, including productionassets in Pont-du-Claix, France, related inventories, contracts, customer lists and intellectual property, receivingnet proceeds of A77 million ($113 million). As a result, LyondellBasell AF’s TDI business, which was part ofLyondellBasell AF’s I&D segment, is presented as discontinued operations and therefore is excluded from theoperations of the I&D segment below in the Predecessor periods.
163
LYONDELLBASELL INDUSTRIES N.V.
NOTES TO THE CONSOLIDATED FINANCIAL STATEMENTS — (Continued)
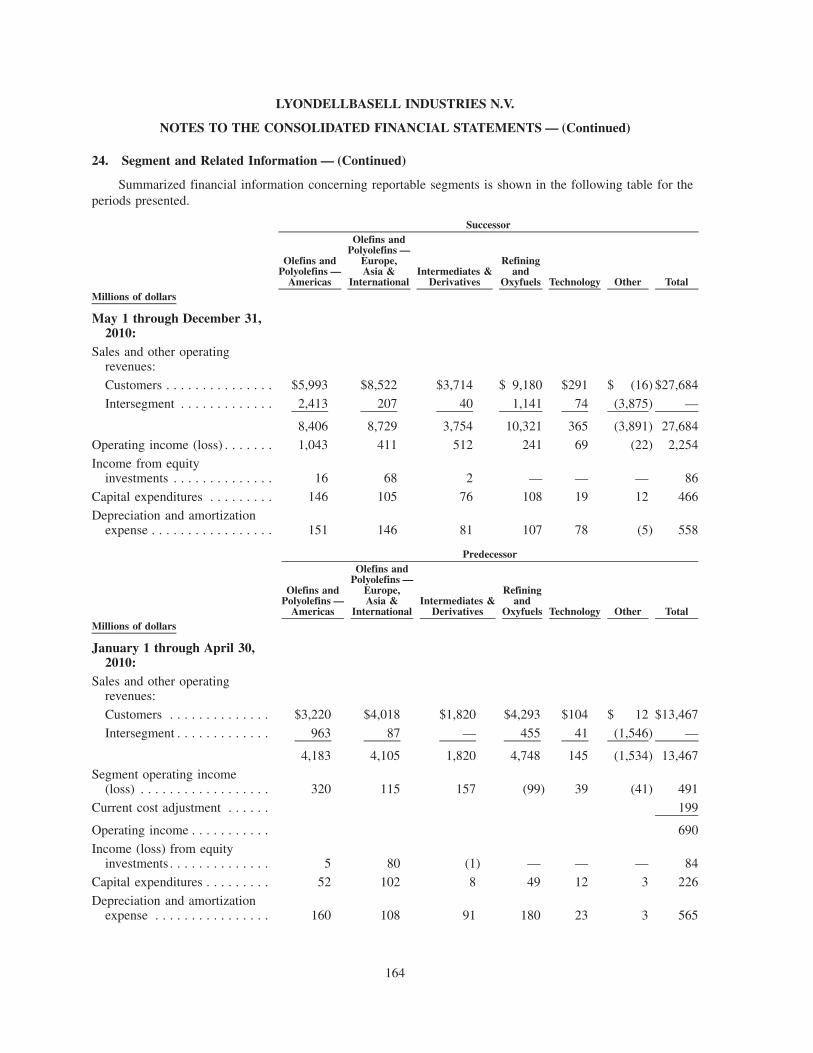
24. Segment and Related Information — (Continued)
Summarized financial information concerning reportable segments is shown in the following table for theperiods presented.
Olefins andPolyolefins —
Americas
Olefins andPolyolefins —
Europe,Asia &
InternationalIntermediates &
Derivatives
Refiningand
Oxyfuels Technology Other Total
Successor
Millions of dollars
May 1 through December 31,2010:
Sales and other operatingrevenues:
Customers . . . . . . . . . . . . . . . $5,993 $8,522 $3,714 $ 9,180 $291 $ (16) $27,684
Intersegment . . . . . . . . . . . . . 2,413 207 40 1,141 74 (3,875) —
8,406 8,729 3,754 10,321 365 (3,891) 27,684
Operating income (loss) . . . . . . . 1,043 411 512 241 69 (22) 2,254
Income from equityinvestments . . . . . . . . . . . . . . 16 68 2 — — — 86
Capital expenditures . . . . . . . . . 146 105 76 108 19 12 466
Depreciation and amortizationexpense . . . . . . . . . . . . . . . . . 151 146 81 107 78 (5) 558
Olefins andPolyolefins —
Americas
Olefins andPolyolefins —
Europe,Asia &
InternationalIntermediates &
Derivatives
Refiningand
Oxyfuels Technology Other Total
Predecessor
Millions of dollars
January 1 through April 30,2010:
Sales and other operatingrevenues:
Customers . . . . . . . . . . . . . . $3,220 $4,018 $1,820 $4,293 $104 $ 12 $13,467
Intersegment . . . . . . . . . . . . . 963 87 — 455 41 (1,546) —
4,183 4,105 1,820 4,748 145 (1,534) 13,467
Segment operating income(loss) . . . . . . . . . . . . . . . . . . 320 115 157 (99) 39 (41) 491
Current cost adjustment . . . . . . 199
Operating income . . . . . . . . . . . 690
Income (loss) from equityinvestments . . . . . . . . . . . . . . 5 80 (1) — — — 84
Capital expenditures . . . . . . . . . 52 102 8 49 12 3 226
Depreciation and amortizationexpense . . . . . . . . . . . . . . . . 160 108 91 180 23 3 565
164
LYONDELLBASELL INDUSTRIES N.V.
NOTES TO THE CONSOLIDATED FINANCIAL STATEMENTS — (Continued)
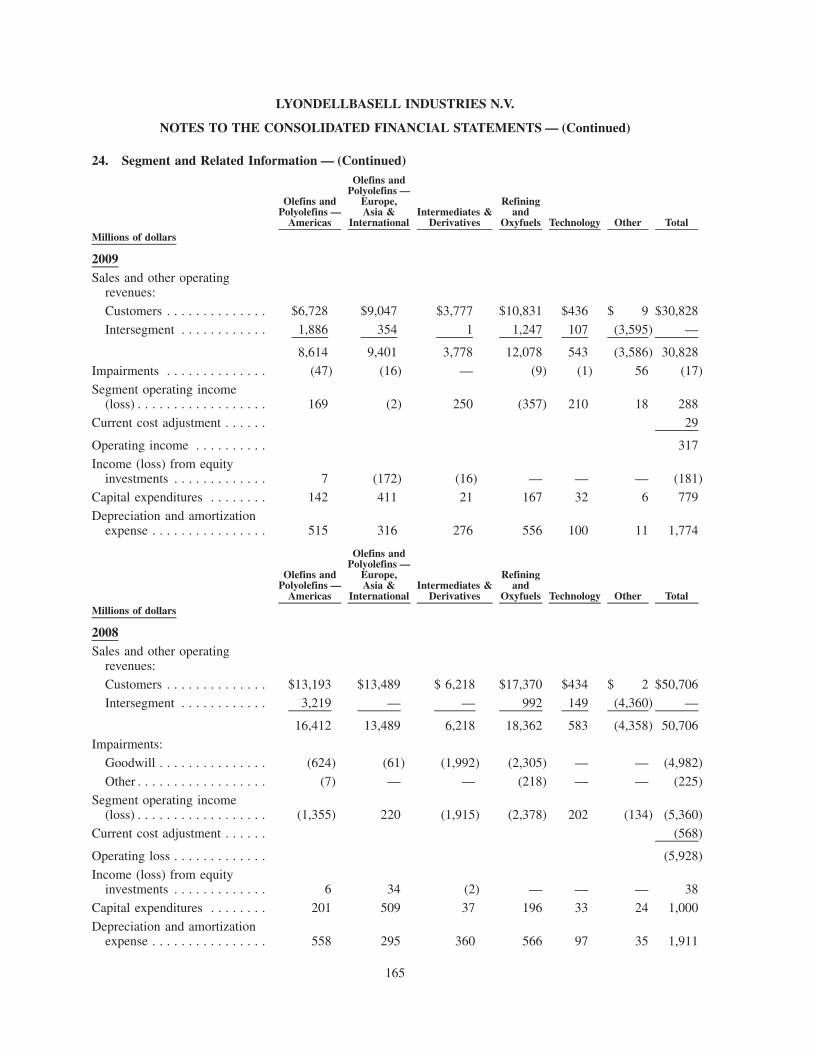
24. Segment and Related Information — (Continued)
Olefins andPolyolefins —
Americas
Olefins andPolyolefins —
Europe,Asia &
InternationalIntermediates &
Derivatives
Refiningand
Oxyfuels Technology Other TotalMillions of dollars
2009Sales and other operating
revenues:
Customers . . . . . . . . . . . . . . $6,728 $9,047 $3,777 $10,831 $436 $ 9 $30,828
Intersegment . . . . . . . . . . . . 1,886 354 1 1,247 107 (3,595) —
8,614 9,401 3,778 12,078 543 (3,586) 30,828
Impairments . . . . . . . . . . . . . . (47) (16) — (9) (1) 56 (17)
Segment operating income(loss) . . . . . . . . . . . . . . . . . . 169 (2) 250 (357) 210 18 288
Current cost adjustment . . . . . . 29
Operating income . . . . . . . . . . 317
Income (loss) from equityinvestments . . . . . . . . . . . . . 7 (172) (16) — — — (181)
Capital expenditures . . . . . . . . 142 411 21 167 32 6 779
Depreciation and amortizationexpense . . . . . . . . . . . . . . . . 515 316 276 556 100 11 1,774
Olefins andPolyolefins —
Americas
Olefins andPolyolefins —
Europe,Asia &
InternationalIntermediates &
Derivatives
Refiningand
Oxyfuels Technology Other TotalMillions of dollars
2008Sales and other operating
revenues:
Customers . . . . . . . . . . . . . . $13,193 $13,489 $ 6,218 $17,370 $434 $ 2 $50,706Intersegment . . . . . . . . . . . . 3,219 — — 992 149 (4,360) —
16,412 13,489 6,218 18,362 583 (4,358) 50,706
Impairments:
Goodwill . . . . . . . . . . . . . . . (624) (61) (1,992) (2,305) — — (4,982)
Other . . . . . . . . . . . . . . . . . . (7) — — (218) — — (225)
Segment operating income(loss) . . . . . . . . . . . . . . . . . . (1,355) 220 (1,915) (2,378) 202 (134) (5,360)
Current cost adjustment . . . . . . (568)
Operating loss . . . . . . . . . . . . . (5,928)
Income (loss) from equityinvestments . . . . . . . . . . . . . 6 34 (2) — — — 38
Capital expenditures . . . . . . . . 201 509 37 196 33 24 1,000
Depreciation and amortizationexpense . . . . . . . . . . . . . . . . 558 295 360 566 97 35 1,911
165
LYONDELLBASELL INDUSTRIES N.V.
NOTES TO THE CONSOLIDATED FINANCIAL STATEMENTS — (Continued)

24. Segment and Related Information — (Continued)
Sales and other operating revenues and operating income (loss) in the “Other” column above includeelimination of intersegment transactions and businesses that are not reportable segments in the periodspresented.
In the Successor period, we recognized a $64 million charge related to a change in estimate associatedwith a dispute over environmental liability, including $35 million, $21 million, and $8 million related to theO&P — EAI, Refining and Oxyfuels, and Technology business segments, respectively. The Successor periodalso includes a $28 million charge associated with the Refining and Oxyfuels business segment, primarilyrelated to impairment of capital additions for the Berre refinery. These charges are reflected in Cost of salesand Impairments, respectively, on the Consolidated Statements of Income.
In 2009, LyondellBasell AF recognized charges of $696 million to write off the carrying value of assets,$679 million of which are reflected in “Reorganization items,” on the Consolidated Statements of Income.These charges included $624 million related to the O&P — Americas business segment, all of which wasassociated with a lease rejection at an olefin plant at Chocolate Bayou, Texas and $55 million related to theI&D business segment associated with an interest in an ethylene glycol facility in Beaumont, Texas.
Also in 2009, operating results for the O&P — Americas and Refining and Oxyfuels business segmentsincluded charges of $47 million and $9 million, respectively, primarily for impairment of the carrying value ofsurplus emission allowances related to HRVOCs and non-U.S. emission rights (see Note 11).
The remaining $17 million, which is included in “Impairments” on the Consolidated Statements ofIncome related to the O&P — EAI business segment, including $6 million was related to an LDPE plant atFos-sur-Mer, France, $6 million related to the closure of a polypropylene line at Wesseling, Germany,$3 million related to an LDPE plant at Carrington, U.K. and $1 million related to an advanced polyolefinscompounding facility in Mansfield, Texas.
In 2009 LyondellBasell AF determined that there had been a diminution in the value of its investments incertain joint ventures and such loss was other than temporary. This determination resulted in pretax impairmentcharges of $228 million that was included in “Income (loss) from equity investments” for 2009 in the O&P —EAI business segment.
166
LYONDELLBASELL INDUSTRIES N.V.
NOTES TO THE CONSOLIDATED FINANCIAL STATEMENTS — (Continued)

24. Segment and Related Information — (Continued)
Long-lived assets of continuing operations, including goodwill, are summarized and reconciled toconsolidated totals in the following table:
Olefins andPolyolefins —
Americas
Olefins andPolyolefins —
Europe,Asia &
InternationalIntermediates &
Derivatives
Refiningand
Oxyfuels Technology Other TotalMillions of dollars
Successor2010Property, plant and equipment,
net . . . . . . . . . . . . . . . . . . . . . . $1,696 $2,458 $1,700 $ 937 $351 $48 $ 7,190
Investment in PO Joint Ventures . . — — 437 — — — 437
Equity and other investments . . . . 164 1,311 112 — — — 1,587
Goodwill . . . . . . . . . . . . . . . . . . . 354 178 246 — 9 — 787
Predecessor2009Property, plant and equipment,
net . . . . . . . . . . . . . . . . . . . . . . $4,170 $3,115 $2,583 $4,888 $323 $73 $15,152
Investment in PO Joint Ventures . . — — 922 — — — 922
Equity and other investments . . . . 117 869 99 — — — 1,085
Property, plant and equipment, net, included in the “Other” column above includes assets related tocorporate and support functions.
The following geographic data for revenues are based upon the delivery location of the product and forlong-lived assets, the location of the assets.
May 1through
December 31,2010
January 1throughApril 30,
2010 2009 2008
Successor
For the Year EndedDecember 31,
PredecessorRevenues
Millions of dollars
Europe . . . . . . . . . . . . . . . . . . . . . . . . . . . . . . . . . . . . . . . . . $10,480 $ 4,462 $10,931 $19,223
North America . . . . . . . . . . . . . . . . . . . . . . . . . . . . . . . . . . . 14,046 7,326 16,566 28,118
All other . . . . . . . . . . . . . . . . . . . . . . . . . . . . . . . . . . . . . . . 3,158 1,679 3,331 3,365
Total. . . . . . . . . . . . . . . . . . . . . . . . . . . . . . . . . . . . . . . . . $27,684 $13,467 $30,828 $50,706
167
LYONDELLBASELL INDUSTRIES N.V.
NOTES TO THE CONSOLIDATED FINANCIAL STATEMENTS — (Continued)
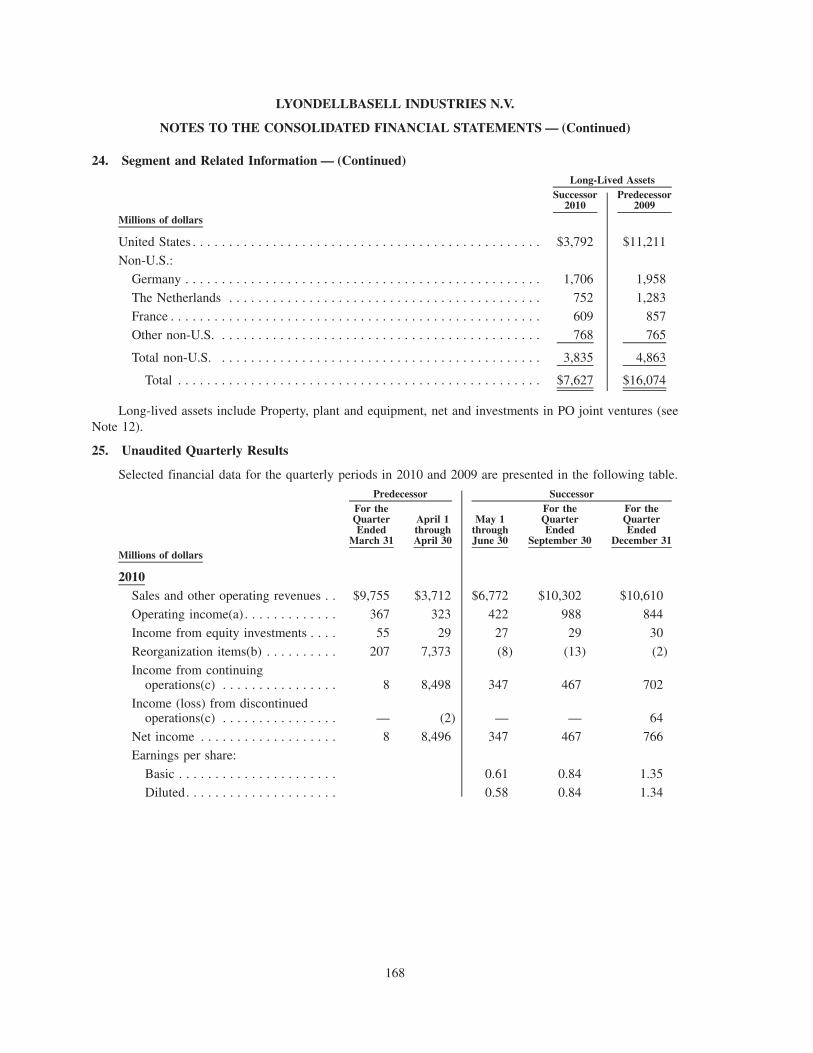
24. Segment and Related Information — (Continued)
Successor2010
Predecessor2009
Long-Lived Assets
Millions of dollars
United States . . . . . . . . . . . . . . . . . . . . . . . . . . . . . . . . . . . . . . . . . . . . . . . . $3,792 $11,211
Non-U.S.:
Germany . . . . . . . . . . . . . . . . . . . . . . . . . . . . . . . . . . . . . . . . . . . . . . . . . 1,706 1,958
The Netherlands . . . . . . . . . . . . . . . . . . . . . . . . . . . . . . . . . . . . . . . . . . . 752 1,283
France . . . . . . . . . . . . . . . . . . . . . . . . . . . . . . . . . . . . . . . . . . . . . . . . . . . 609 857
Other non-U.S. . . . . . . . . . . . . . . . . . . . . . . . . . . . . . . . . . . . . . . . . . . . . 768 765
Total non-U.S. . . . . . . . . . . . . . . . . . . . . . . . . . . . . . . . . . . . . . . . . . . . . 3,835 4,863
Total . . . . . . . . . . . . . . . . . . . . . . . . . . . . . . . . . . . . . . . . . . . . . . . . . . $7,627 $16,074
Long-lived assets include Property, plant and equipment, net and investments in PO joint ventures (seeNote 12).
25. Unaudited Quarterly Results
Selected financial data for the quarterly periods in 2010 and 2009 are presented in the following table.
For theQuarterEnded
March 31
April 1throughApril 30
May 1throughJune 30
For theQuarterEnded
September 30
For theQuarterEnded
December 31
Predecessor Successor
Millions of dollars
2010Sales and other operating revenues . . $9,755 $3,712 $6,772 $10,302 $10,610
Operating income(a) . . . . . . . . . . . . . 367 323 422 988 844
Income from equity investments . . . . 55 29 27 29 30
Reorganization items(b) . . . . . . . . . . 207 7,373 (8) (13) (2)
Income from continuingoperations(c) . . . . . . . . . . . . . . . . 8 8,498 347 467 702
Income (loss) from discontinuedoperations(c) . . . . . . . . . . . . . . . . — (2) — — 64
Net income . . . . . . . . . . . . . . . . . . . 8 8,496 347 467 766
Earnings per share:
Basic . . . . . . . . . . . . . . . . . . . . . . 0.61 0.84 1.35
Diluted. . . . . . . . . . . . . . . . . . . . . 0.58 0.84 1.34
168
LYONDELLBASELL INDUSTRIES N.V.
NOTES TO THE CONSOLIDATED FINANCIAL STATEMENTS — (Continued)

25. Unaudited Quarterly Results — (Continued)
March 31 June 30 September 30 December 31For the Quarter Ended
Predecessor
Millions of dollars
2009Sales and other operating revenues . . . . . . . . . . $ 5,900 $7,499 $8,612 $8,817
Operating income (loss)(d) . . . . . . . . . . . . . . . . (141) 89 419 (50)
Income (loss) from equity investments(e) . . . . . (20) 22 (168) (15)
Reorganization items(b) . . . . . . . . . . . . . . . . . . (948) (124) (928) (961)
Loss from continuing operations(d)(e)(f) . . . . . . (1,013) (355) (650) (854)
Income (loss) from discontinued operations . . . (4) 2 (1) 4
Net loss . . . . . . . . . . . . . . . . . . . . . . . . . . . . . . (1,017) (353) (651) (850)
(a) Operating income in 2010 includes lower of cost or market charges of $333 million and $32 million,respectively, in the quarters ended June 30, 2010 and September 30, 2010, to adjust the value of inventoryto market value. Operating income in the quarter ended December 31, 2010 includes a credit of $323 mil-lion, reflecting the recovery of market price during that period.
(b) See Note 3 for a description of reorganization items and Note 2 for the revision to Reorganization itemspreviously reported for the 2010 predecessor period.
(c) The 2010 results included after-tax gains of $8,640 million for discharge of liabilities subject to compro-mise and change in net assets from application of fresh-start accounting on April 30, 2010, $53 millionfor a change in estimate related to a dispute over environmental indemnity in the quarter ended Septem-ber 30, 2010, and $64 million for gain on sale of the Flavor and Fragrance chemicals business in the quar-ter ended December 31, 2010. See Note 2 for the revision to Income from continuing operationspreviously reported for the 2010 predecessor period.
(d) In the fourth quarter of 2009, LyondellBasell AF recorded an adjustment related to prior periods whichincreased income from operations and net income for the three-month period ended December 31, 2009,by $65 million. The adjustment related to an overstatement of goodwill impairment in 2008.
(e) Loss from equity investments in the third and fourth quarters of 2009 included pretax charge for impair-ment of the carrying value of certain equity investments of $215 million and $13 million, respectively.
(f) The 2009 results included after tax charges of $1,924 million for reorganization items, $148 million forimpairment of certain equity investments and $78 million for involuntary conversion gains on insuranceproceeds related to damages sustained at a polymers plant in Munchsmunster, Germany.
26. Subsequent Events
We have evaluated subsequent events through the date the financial statements were issued.
169
LYONDELLBASELL INDUSTRIES N.V.
NOTES TO THE CONSOLIDATED FINANCIAL STATEMENTS — (Continued)
Item 9. CHANGES IN AND DISAGREEMENTS WITH ACCOUNTANTS ON ACCOUNTING ANDFINANCIAL DISCLOSURE
None.
Item 9A. CONTROLS AND PROCEDURES
This annual report does not include a report of management’s assessment regarding our internal controlover financial reporting or an attestation report of the Company’s registered public accounting firm due to atransition period established by rules of the Securities and Exchange Commission for newly public companies.
Evaluation of Disclosure Controls and Procedures
We maintain a set of disclosure controls and procedures designed to provide reasonable assurance thatinformation we are required to disclose in reports that we file or submit with the SEC is recorded, processed,summarized and reported within the time periods specified by the SEC. An evaluation was carried out underthe supervision and with the participation of the Company’s management, including the Chief ExecutiveOfficer (“CEO”) and Chief Financial Officer (“CFO”), of the effectiveness of our disclosure controls andprocedures as of the end of the period covered by this report. Based on that evaluation, the CEO and CFOhave concluded that the Company’s disclosure controls and procedures were not effective to provide reasonableassurance that information required to be disclosed in reports we file with the SEC is processed, summarizedand reported accurately as of the end of the period covered by this annual report. This ineffectiveness wascaused by the material weakness described below.
Nevertheless, based on a number of factors, including the performance of additional procedures bymanagement designed to ensure the correctness of our tax provision and reliability of our financial reporting,we believe that the consolidated financial statements in this annual report fairly present, in all materialrespects, our financial position, results of operations, and cash flows as of the dates, and for the periods,presented, in conformity with U.S. GAAP.
Material Weakness in Internal Control over Financial Reporting
The Company has identified a material weakness in its internal controls. The Company did not maintainadequate controls over the accounting for income taxes related to consideration of the nonrecurring tax effectsof fresh start accounting under ASC Topic 852 “Reorganizations.” Specifically the preparation and presentationof the complex information supporting deferred tax accounting and related disclosures was not sufficient toallow an effective review of that information. Additionally, the analysis of the tax provision information wasnot sufficient to ensure deferred taxes were accurately accounted for in accordance with U.S. GAAP in theappropriate predecessor and successor periods. This control deficiency resulted in the misstatement of thedeferred tax provision in the successor period for the eight months ended December 31, 2010 included in theCompany’s press release dated February 18, 2011 as furnished to the SEC under Item 2.02 of Form 8-K onFebruary 18, 2011. The control deficiency also resulted in a revision of deferred tax expense and reorganiza-tion items in the predecessor period for the four months ended April 30, 2010 and of deferred tax liability andgoodwill in the opening balance sheet at May 1, 2010 (not presented) included in the February 18, 2011 pressrelease and included in our Form 10-Q for the quarter ended September 30, 2010. This control deficiency, ifnot corrected, could result in a material misstatement of the income tax account that would result in a materialmisstatement in our annual or interim consolidated financial statements that would not be prevented ordetected on a timely basis.
We conducted a detailed review of our tax basis balance sheet accounts at December 31, 2010 including adetailed analysis of the tax provision to ensure deferred taxes were accurately accounted for in the appropriatepredecessor and successor periods as reported in this annual report.
170
Plan for Remediation of Material Weakness in Internal Controls
To remediate the material weakness identified, we are implementing improvements to our internalcontrols over the calculation of our income tax provision and related balance sheet accounts. Specifically, weare implementing improved reporting processes to provide clarity of presentation and supporting documenta-tion of the tax provision information including the implementation of standardization and enhanced utilizationof tax reporting software to allow timely and effective review and analysis of the tax provision information.
We believe these actions will effectively remediate our internal control over financial reporting andenhance our disclosure controls and procedures.
Changes in Internal Control over Financial Reporting
Management, together with our CEO and CFO, evaluated the changes in our internal control overfinancial reporting during the quarter ended December 31, 2010. We determined that there were no changes inour internal control over financial reporting during the quarter ended December 31, 2010, that have materiallyaffected, or are reasonably likely to materially affect, our internal control over financial reporting.
Item 9B. OTHER INFORMATION
None.
PART III
Item 10. DIRECTORS, EXECUTIVE OFFICERS AND CORPORATE GOVERNANCE
Code of Business Ethics and Conduct for Directors and Employees
We have a Code of Conduct for all employees and directors, including our principal executive officer,principal financial officer, principal accounting officer and persons performing similar functions. We also havea Code of Financial Conduct specifically for our principal executive officer, principal financial officer,principal accounting officer and persons performing similar functions. We have posted copies of these codeson the “Corporate Governance” section of our Internet Web site at www.lyondellbasell.com (within the InvestorRelations section). Any waivers of the codes must be approved, in advance, by our Supervisory Board. Anyamendments to, or waivers from, the codes that apply to our executive officers and directors will be posted onthe “Corporate Governance” section of our Internet Web site.
All other information required by Item 10 of Part III will be included in our Proxy Statement relating toour 2010 Annual General Meeting of Shareholders, to be filed pursuant to Regulation 14A on or beforeMarch 25, 2011, and is incorporated herein by reference.*
Item 11. EXECUTIVE COMPENSATION
Information required by Item 11 of Part III will be included in our Proxy Statement relating to our 2010Annual General Meeting of Shareholders, to be filed pursuant to Regulation 14A on or before March 25,2011, and is incorporated herein by reference.*
171

Item 12. SECURITY OWNERSHIP OF CERTAIN BENEFICIAL OWNERS AND MANAGEMENT ANDRELATED STOCKHOLDER MATTERS
Equity Compensation Plan Table
The following table provides information as of December 31, 2010 about the number of shares to beissued upon vesting or exercise of equity awards and the number of shares remaining available for issuanceunder our 2010 Long Term Incentive Plan (the “2010 LTIP”).
The 2010 LTIP provides for the issuance of up to 22 million ordinary shares pursuant to stock options,stock awards and stock appreciation rights. No awards may be granted after ten years of the effective date ofthe plan. The 2010 LTIP was approved by the Bankruptcy Court and became effective upon our emergencefrom bankruptcy. The plan is categorized as “not approved by security holders,” because it has not beenapproved by our shareholders since our listing on the NYSE. As described, the 2010 LTIP was a consideredpart of our capitalization in connection with emergence and was approved by our shareholder at that time.
Plan Category
Number of Securitiesto be Issued
Upon Exercise ofOutstanding Options,Warrants and Rights
(a)
Weighted-AverageExercise Price of
Outstanding Options,Warrants and Rights(b)
Number of SecuritiesRemaining Availablefor Future Issuance
Under EquityCompensation Plans(c)
Equity compensation plans approved bysecurity holders . . . . . . . . . . . . . . . . . . . — — —
Equity compensation plans not approved bysecurity holders . . . . . . . . . . . . . . . . . . . 10,362,717 $17.63 9,865,489
Total . . . . . . . . . . . . . . . . . . . . . . . . . . . . . 10,362,717 $17.63 9,865,489
(a) Includes 8,482,498 stock options and 1,880,219 restricted stock units.
(b) Includes only the weighted-average exercise price of the outstanding stock options. Does not include therestricted stock units, as those awards have no exercise price associated with them.
(c) In addition to the stock options and restricted stock units included in the table, 1,771,794 restricted shareswere issued to Mr. Gallogly effective April 30, 2010 under the 2010 LTIP. These shares may not be soldor transferred until they vest on May 14, 2014, subject to earlier forfeiture in the case of termination ofemployment.
All other information required by Item 12 of Part III will be included in our Proxy Statement relating toour 2010 Annual General Meeting of Shareholders, to be filed pursuant to Regulation 14A on or beforeMarch 25, 2011, and is incorporated herein by reference.*
Item 13. CERTAIN RELATIONSHIPS AND RELATED TRANSACTIONS, AND DIRECTORINDEPENDENCE
Information required by Item 13 of Part III will be included in our Proxy Statement relating to our 2010Annual General Meeting of Shareholders, to be filed pursuant to Regulation 14A on or before March 25,2011, and is incorporated herein by reference.*
Item 14. PRINCIPAL ACCOUNTING FEES AND SERVICES
Information required by Item 14 of Part III will be included in our Proxy Statement relating to our 2010Annual General Meeting of Shareholders, to be filed pursuant to Regulation 14A on or before March 25,2011, and is incorporated herein by reference.*
*Except for information or data specifically incorporated herein by reference under Items 10 through 14,other information and data appearing in our 2011 Proxy Statement are not deemed to be a part of this AnnualReport on Form 10-K or deemed to be filed with the Commission as a part of this report.
172

PART IV
Item 15. EXHIBITS, FINANCIAL STATEMENT SCHEDULES
(a) (1) Consolidated Financial Statements:Reports of Independent Registered Public Accounting FirmConsolidated Balance Sheets as of December 31, 2010 and 2009Consolidated Statements of Income for the years ended December 31, 2010, 2009 and 2008Consolidated Statements of Cash Flows for the years ended December 31, 2010, 2009 and 2008Consolidated Statements of Changes in Equity for the years ended December 31, 2010, 2009 and 2008Notes to Consolidated Financial Statements
(a) (2) Consolidated Financial Statement Schedules:
Schedule II—Valuation and Qualifying Accounts
All other schedules have been omitted because the required information is not significant or is includedin the financial statements or notes thereto, or is not applicable.
(b) Exhibits:
The exhibit list required by this Item is incorporated by reference to the Exhibit Index filed as part of thisreport.
173

SIGNATURES
Pursuant to the requirements of Section 13 or 15(d) of the Securities Exchange Act of 1934, the registranthas duly caused this report to be signed on its behalf by the undersigned, thereunto duly authorized.
LYONDELLBASELL INDUSTRIES N.V.
/s/ James L. Gallogly
James L. GalloglyChairman of the Management Boardand Chief Executive Officer
March 18, 2011
Pursuant to the requirements of the Securities Exchange Act of 1934, this report has been signed, as ofMarch 18, 2011, on behalf of the registrant by the following officers in the capacity indicated and by amajority of directors.
Signature Title
/s/ James L. Gallogly
James L. Gallogly
Chairman of the Management Boardand Chief Executive Officer(Principal executive officer)
/s/ C. Kent Potter
C. Kent Potter
Executive Vice Presidentand Chief Financial Officer(Principal financial officer)
/s/ Wendy M. Johnson
Wendy M. Johnson
Vice President and Controller(Principal accounting officer)
/s/ Milton Carroll
Milton Carroll
Director
/s/ Stephen F. Cooper
Stephen F. Cooper
Director
/s/ Joshua J. Harris
Joshua J. Harris
Director
/s/ Scott Kleinman
Scott Kleinman
Director
/s/ Marvin O. Schlanger
Marvin O. Schlanger
Director
Jeffrey Serota
Director
/s/ Bruce A. Smith
Bruce A. Smith
Director
/s/ Rudy van der Meer
Rudy van der Meer
Director
174
INDEX TO EXHIBITSExhibitNumber Description
2.1 Third Amended and Restated Joint Chapter 11 Plan of Reorganization for the LyondellBasell Debtors,dated as of March 12, 2010 (incorporated by reference to Exhibit 2.1 to Form 10 dated April 28, 2010).
3.1 Amended and Restated Articles of Association of LyondellBasell Industries N.V., dated as of April 29,2010 (incorporated by reference to Exhibit 3.1 to Amendment No. 2 to Form 10 dated July 26, 2010).
3.2 Rules for the Supervisory Board of LyondellBasell Industries N.V. (incorporated by reference toExhibit 3.2 to Amendment No. 2 to Form 10 dated July 26, 2010).
3.3 Rules for the Management Board of LyondellBasell Industries N.V. (incorporated by reference toExhibit 3.3 to Amendment No. 2 to Form 10 dated July 26, 2010).
4.1 Specimen certificate for Class A ordinary shares, par value A0.04 per share, of LyondellBasell IndustriesN.V. (incorporated by reference to Exhibit 4.1 to Amendment No. 2 to Form 10 dated July 26, 2010).
4.2 Nomination Agreement between Leveragesource (Delaware), LLC and LyondellBasell Industries N.V.,dated as of April 30, 2010 (incorporated by reference to Exhibit 4.3 to Amendment No. 2 to Form 10 datedJuly 26, 2010).
4.3 Nomination Agreement between Ares Corporate Opportunities Fund III, L.P. and LyondellBasellIndustries N.V., dated as of April 30, 2010 (incorporated by reference to Exhibit 4.4 to AmendmentNo. 2 to Form 10 dated July 26, 2010).
4.4 Nomination Agreement between AI International Chemicals S.à.r.l. and LyondellBasell Industries N.V.,dated as of April 30, 2010 (incorporated by reference to Exhibit 4.5 to Amendment No. 2 to Form 10 datedJuly 26, 2010).
4.5 Registration Rights Agreement by and among LyondellBasell Industries N.V., Banc of America SecuritiesLLC and UBS Securities LLC, dated as of April 8, 2010 (incorporated by reference to Exhibit 4.4 toForm 10 dated April 28, 2010).
4.6 Registration Rights Agreement by and among LyondellBasell Industries N.V. and the Holders (as definedtherein), dated as of April 30, 2010 (incorporated by reference to Exhibit 4.7 to Amendment No. 2 toForm 10 dated July 26, 2010).
4.7 Amended and Restated Indenture relating to 8% Senior Secured Notes due 2017 between LyondellChemical Company, certain of its subsidiaries, LyondellBasell Industries N.V. and WilmingtonTrust FSB, dated as of April 30, 2010 (incorporated by reference to Exhibit 4.8 to Amendment No. 2to Form 10 dated July 26, 2010).
4.8 Security Agreement relating to 8% Senior Secured Notes due 2017 dated as of April 30, 2010 amongLyondell Chemical Company, certain of its subsidiaries, LyondellBasell Industries N.V. and DeutscheBank Trust Company Americas (incorporated by reference to Exhibit 4.9 to Amendment No. 2 to Form 10dated July 26, 2010).
4.9 Indenture relating to 11% Senior Secured Notes due 2018 by and among LyondellBasell Industries N.V.,Lyondell Chemical Company and Wells Fargo, N.A., dated as of April 30, 2010 (incorporated byreference to Exhibit 4.10 to Amendment No. 2 to Form 10 dated July 26, 2010).
4.10 Security Agreement relating to 11% Senior Secured Notes due 2018 by and among LyondellBasellIndustries N.V., Lyondell Chemical Company and Wells Fargo, N.A., dated as of April 30, 2010(incorporated by reference to Exhibit 4.11 to Amendment No. 2 to Form 10 dated July 26, 2010).
4.11 Warrant Agreement by and among LyondellBasell Industries N.V. and Computershare Inc. andComputershare Trust Company, N.A., dated as of April 30, 2010 (incorporated by reference toExhibit 4.12 to Amendment No. 2 to Form 10 dated July 26, 2010).
10.1 Employment agreement by and among James L. Gallogly, Lyondell Chemical Company andLyondellBasell AFGP, dated as of May 14, 2009 (incorporated by reference to Exhibit 10.1 toForm 10 dated April 28, 2010).
10.2 Compensation terms of C. Kent Potter (incorporated by reference to Exhibit 10.2 to Form 10 datedApril 28, 2010).
10.3 Employment agreement by and among Craig B. Glidden, Lyondell Chemical Company andLyondellBasell AFGP, dated as of August 5, 2009 (incorporated by reference to Exhibit 10.3 toForm 10 dated April 28, 2010).

ExhibitNumber Description
10.4 Employment agreement by and among Kevin Brown, Lyondell Chemical Company and LyondellBasellAFGP, dated as of March 19, 2010 (incorporated by reference to Exhibit 10.4 to Form 10 dated April 28,2010).
10.5 Employment agreement by and among Bhavesh V. Patel, Lyondell Chemical Company andLyondellBasell AFGP, dated as of August 5, 2009 (incorporated by reference to Exhibit 10.5 toForm 10 dated April 28, 2010).
10.6 LyondellBasell Industries N.V. Short-Term Incentive Plan (incorporated by reference to Exhibit 10.11 toAmendment No. 2 to Form 10 dated July 26, 2010).
10.7 LyondellBasell Industries N.V. Medium Term Incentive Plan (incorporated by reference to Exhibit 10.12to Form 10 dated April 28, 2010).
10.8 LyondellBasell Industries N.V. 2010 Long-Term Incentive Plan (incorporated by reference toExhibit 10.13 to Form 10 dated April 28, 2010).
10.9 Form of Officer and Director Indemnification Agreement (incorporated by reference to Exhibit 10.14 toAmendment No. 2 to Form 10 dated July 26, 2010).
10.10 Form of Non-Qualified Stock Option Award Agreement (incorporated by reference to Exhibit 10.16 toAmendment No. 2 to Form 10 dated July 26, 2010).
10.11 Form of Restricted Stock Unit Award Agreement (incorporated by reference to Exhibit 10.17 toAmendment No. 2 to Form 10 dated July 26, 2010).
10.12 Form of Stock Appreciation Right Award Agreement (incorporated by reference to Exhibit 10.18 toAmendment No. 2 to Form 10 dated July 26, 2010).
10.13 Senior Secured Term Loan Credit Agreement by and between Lyondell Chemical Company, LBI EscrowCorporation, LyondellBasell Industries, N.V. and UBS AG, Stamford Branch, dated as of April 8, 2010(incorporated by reference to Exhibit 10.19 to Amendment No. 2 to Form 10 dated July 26, 2010).
10.14 U.S. Security Agreement among Lyondell Chemical Company, certain of its subsidiaries, LyondellBasellIndustries N.V. and USB AG Stamford Branch, dated as of April 30, 2010 (incorporated by reference toExhibit 10.20 to Amendment No. 2 to Form 10 dated July 26, 2010).
10.15 Senior Secured Asset-Based Credit Agreement by and between Lyondell Chemical Company, certain ofits subsidiaries, LyondellBasell Industries N.V. and Citibank, N.A., dated as of April 8, 2010 (incorporatedby reference to Exhibit 10.21 to Amendment No. 2 to Form 10 dated July 26, 2010).
10.16 Security Agreement dated as of April 30, 2010 between Lyondell Chemical Company, certain of itssubsidiaries, LyondellBasell Industries N.V. and Citibank N.A. (incorporated by reference toExhibit 10.22 to Amendment No. 2 to Form 10 dated July 26, 2010).
10.17 Master Receivables Purchase Agreement dated May 4, 2010 among Basell Sales and Marketing CompanyB.V., Lyondell Chemie Nederland B.V., Basell Polyolefins Collections Limited, Citicorp TrusteeCompany Limited and Citibank, N.A., London Branch (incorporated by reference to Exhibit 10.23 toAmendment No. 2 to Form 10 dated July 26, 2010).
12.1* Computation of Ratio of Earnings to Fixed Charges.
21.1* List of subsidiaries of the registrant.
23.1* Consent of PricewaterhouseCoopers LLP, Independent Registered Public Accounting Firm.
31.1* Certification of Chief Executive Officer pursuant to Rule 13a-14(a) under the Securities Exchange Act of1934.
31.2* Certification of Chief Financial Officer pursuant to Rule 13a-14(a) under the Securities Exchange Act of1934.
32* Certifications pursuant to 18 U.S.C. Section 1350.
* Filed herewith.

Board of Directors
Leadership Team
Shareholder InformationStock Exchange
LyondellBasell’s common stock is listed on the New York Stock Exchange under the symbol “LYB”. Based on transfer records as of March 7, 2011, there were approximately 3,700 holders of record of our shares.
Website
Shareholders and other interested parties can learn more about LyondellBasell by visiting www.lyondellbasell.com.
Investor Relations Contact
Security analysts, investment professionals and shareholders should direct their inquiries to Investor Relations:
• Call LyondellBasell Investor Relations: Douglas J. Pike, 713-309-4590
• Mail your questions or requests to us at: LyondellBasell – Investor Relations Department P.O. Box 3646 Houston, Texas 77253-3646
Corporate Governance
LyondellBasell’s Corporate Governance information is available at www.lyondellbasell.com.
Online Annual Report
LyondellBasell’s Annual Report is available online at www.lyondellbasell.com.
Annual Meeting
LyondellBasell’s annual meeting of shareholders is scheduled to be held:
Thursday, May 5, 2011 Rotterdam Headquarters Groot Handelsgebouw Weena 737 3013 AM Rotterdam The Netherlands
Registrar and Transfer Agent
Computershare Shareholder Services, Inc. 250 Royall Street Canton, MA 02021
877-456-7920 (U.S. Domestic) 781-575-4337 (Outside of the U.S.) www.computershare.com
Jim GalloglyChief Executive Officer
Massimo CovezziSenior Vice President, Research and Development
Karen SwindlerSenior Vice President, Manufacturing - Americas
Kent PotterExecutive Vice President and Chief Financial Officer
Craig GliddenExecutive Vice President and Chief Legal Officer
Pat QuarlesSenior Vice President, Intermediates and Derivatives
Paul DaviesVice President and Chief Human Resources Officer
Kevin BrownSenior Vice President, Refining
Par SinghSenior Vice President, Manufacturing – Europe, Asia & International
Sam SmolikVice President, Health, Safety, Environment and Operational Excellence
Bob PatelSenior Vice President, Olefins and Polyolefins – Europe, Asia & International
Sergey VasnetsovSenior Vice President, Strategic Planning and Transactions
From left to right: Jeffrey Serota, Milton Carroll 1,2,3, Marvin O. Schlanger 4 (Chairman of the Board), Scott M. Kleinman 1,2,3, Bruce A. Smith 1,3, Stephen F. Cooper, Joshua J. Harris, Rudy van der Meer 2,4 1 Audit Committee, 2 Compensation Committee, 3 Nominating & Governance Committee, 4 Health, Safety & Environmental Committee. Symbols in blue indicate committee chair position.

lyondellbasell .com