Quinns Beach Coastal Protection Works Stage 2 Report · Quinns Beach Coastal Protection Works Stage...
97
City of Wanneroo October 1999 Quinns Beach Coastal Protection Works Stage 2 Report M P ROGERS & ASSOCIATES PTY LTD Coastal and Port Engineers Report R060 Rev 0
Transcript of Quinns Beach Coastal Protection Works Stage 2 Report · Quinns Beach Coastal Protection Works Stage...

City of Wanneroo October 1999
Quinns Beach Coastal Protection Works
Stage 2 Report
M P ROGERS & ASSOCIATES PTY LTD
Coastal and Port Engineers Report R060 Rev 0

City of Wanneroo October 1999
Quinns Beach Coastal Protection Works
Stage 2 Report
Job J248 Report R060 Rev 0
Prepared by: ___________________ Date: _________
Reviewed by: ___________________ Date: _________
Approved by: ___________________ Date: _________
M P ROGERS & ASSOCIATES PTY LTD Consulting Engineers Specialising in Coastal, Ocean & Marine Projects
3/135 Main Street Osborne Park, Western Australia, 6017 Telephone: +618 9444 4045 Facsimile: +618 9444 4341
Email: [email protected]

Limitations of Report
M P ROGERS & ASSOCIATES Quinns Beach Coastal Protection Works
Report R060 Rev 0, Page (i)
This report has been prepared for use by the Client in accordance with the
agreement between the Client and M P Rogers & Associates Pty Ltd which
includes constraints on the scope, budget and time available for the services.
The services have been completed with the degree of skill, care and
diligence normally exercised by members of the engineering profession
performing services of a similar nature, in accordance with the ethics of the
engineering profession. No other warranty, expressed or implied, is made
as to the accuracy of the data and professional advice included in this report.
This report has not been prepared for use by parties other than the Client
and its consulting advisers. It may not contain sufficient information for the
purposes of other parties or for other uses.
M P Rogers & Associates Pty Ltd (ACN 062 681 252) takes no
responsibility for the completeness or form of any subsequent copies of this
report. Copying this report without the permission of the client or
M P Rogers & Associates Pty Ltd is not permitted.

Executive Summary
M P ROGERS & ASSOCIATES Quinns Beach Coastal Protection Works
Report R060 Rev 0, Page (ii)
The Shire of Wanneroo has been involved in combating coastal erosion at
Quinns Rocks since 1970. Presently, coastal erosion is threatening to
undermine the car park located to the north of Quinns Cusp, and there are
also concerns regarding the ongoing stability of the beach to the south and
adjacent Ocean Drive. The aim of this study is to provide a comprehensive
evaluation of suitable coastal protection options for Quinns. The study is
defined by the following three stages:
Stage 1 The review of existing data and technical reports, the calculation of
appropriate design criteria for coastal protection options, and the
preliminary review of coastal protection options.
Stage 2 A comprehensive review of suitable coastal protection options.
Stage 3 The final design and cost estimate of the coastal management option
nominated by Wanneroo.
This report documents the findings of Stage 2 of the Study.
For the purposes of evaluating suitable coastal management options, the
Quinns foreshore was divided into the Southern and Northern Beaches.
Southern Beach Since the construction of the artificial headland in 1977, the Southern Beach
has remained relatively stable. Survey results indicate that the region
accreted by about 80,000 m3 during the twenty years between December
1977 and December 1997. However, a localised loss of about 12,000 m3
has occurred from the primary dune seawards of Ocean Drive. This amount
is relatively small in the overall system. However, it does suggest that
without appropriate coastal management, a succession of severe storm
events may reduce the buffer protecting Ocean Drive and threaten to
undermine it.
Suitable management options have been reviewed and the recommended
option is to increase the present buffer (ie width of dune) protecting Ocean
Drive and undertake sand renourishment following severe storm events
which cause significant erosion of the primary dune. An alternative option
is to construct a seawall; however, this option is likely to be more costly and
may increase the amount of erosion which occurs to the north of the cusp.
Allowing the dune to continue to erode is not recommended as storm
erosion may produce a recession of the primary dune which may threaten to
undermine a section of Ocean Drive. The value of the assets which may be
lost through erosion is considered to be significantly greater than the cost of

M P ROGERS & ASSOCIATES Quinns Beach Coastal Protection Works
Report R060 Rev 0, Page (iii)
protecting them.
Northern Beach Since the construction of the artificial headland in 1977, the Northern Beach
has progressively eroded, receding at a rate of about 1 m/year. The total net
loss of sediment from the Northern Beach was about 170,000 m3 during the
twenty year period between December 1977 and December 1997 (ie about
8,500 m3/year). The future rate of erosion has been estimated to be about
7,000 m3/year.
The present buffer protecting the Northern Car Park and Stubbs Park is
minimal, and without the appropriate coastal management these amenities
are likely to be undermined. If the present trend of erosion continues in the
longer term, a section of Ocean Drive may also be threatened.
Suitable management options have been reviewed and seawall construction
combined with renourishment was found to be the most appropriate
management option. This option was found to be more cost effective than
straight renourishment because the construction of the seawall was less
costly than an appropriate increase of the dune buffer using sand from an
external source. However, it should be noted that the construction of the
seawall is not expected to significantly reduce the losses of sediment from
the area, and an average annual renourishment requirement of 7,000 m3/year
is expected.
The construction of groynes or headlands is not recommended because they
are not the most cost effective option as they will be visually and physically
obstructive to the users of the beach. In addition, they are likely to have an
adverse effect on the surrounding coastline, and may be less effective in the
longer term. In essence this solution would transfer the erosion problem to
the coast to the north.
Seawall construction without renourishment is not recommended. Although
the seawall would preserve the Car Park, it is likely that the beach would be
lost through continued erosion seawards and longshore of the seawall.
Allowing the erosion to continue (ie do nothing) is also not recommended.
Although the upper foreshore would continue to supply sand to the eroding
beach, access and other amenities would be lost, and in the longer term, a
section of Ocean Drive may be threatened.

Contents
M P ROGERS & ASSOCIATES Quinns Beach Coastal Protection Works Report R060 Rev 0, Page (iv)
Executive Summary (ii)
1. Introduction 1
1.1 General 1
1.2 Study Area 2
1.3 Results of Stage 1 2
2. Management Options 5
2.1 Do Nothing 5
2.2 Sand Renourishment 5
2.3 Seawall Construction 6
2.4 Seawall Construction Combined with
Renourishment 7
2.5 Groyne / Headland Protection 7
3. Management of the Southern Beach 9
3.1 Coastal Processes 9
3.2 Do Nothing 9
3.3 Sand Renourishment 11
3.4 Seawall Construction 12
3.5 Seawall Construction Combined with
Renourishment 14
3.6 Groyne / Headland Protection 14
4. Management of the Northern Beach 16
4.1 Coastal Processes 16
4.2 Do Nothing 16
4.3 Sand Renourishment 23
4.4 Seawall Construction 25
4.5 Seawall Construction Combined with
Renourishment 30
4.6 Groyne / Headland Protection 37
5. Public Meeting 7/9/99 45

M P ROGERS & ASSOCIATES Quinns Beach Coastal Protection Works
Report R060 Rev 0, Page (v)
6. Summary and Recommendations 46
5.1 Southern Beach Summary 46
5.2 Northern Beach Summary 47
5.3 Recommendations 50
7. References 52
Figures 54
Appendix A 75
Appendix B 85

1. Introduction
M P ROGERS & ASSOCIATES Quinns Beach Coastal Protection Works Report R060 Rev 0, Page 1
1.1 General
The Shire of Wanneroo (previously the City of Wanneroo) has been
involved in combating coastal erosion at Quinns Rocks since 1970 when a
seawall was constructed to protect the parking lot and toilet block located at
the end of Quinns Road. Additional protection works were completed in
1977, with a rubble headland built to the immediate south of Quinns Cusp to
encourage accretion along the Southern Beach. Presently, coastal erosion is
threatening to undermine the car park located to the north of the cusp, and
there are also concerns regarding the ongoing stability of the Southern
Beach and adjacent Ocean Drive (refer to Figure 1.1).
In 1997, a study of the coastal processes at Quinns was prepared by
Tremarfon (1997) which recommended a combination of sand
renourishment and retreat in the short term, with the construction of
seawalls at defined locations in the longer term if renourishment proved
ineffective and the foreshore continued to recede. The option of seawalls
was reviewed by the Department of Transport (Transport) and concerns
were raised regarding the potentially adverse effects and likely costs.
The present study was commissioned by the Shire of Wanneroo (Wanneroo)
to provide a comprehensive evaluation of the coastal protection options
available. These options include renourishment, seawall construction,
groynes / headlands and breakwaters. The study is defined by the following
three stages:
Stage 1 The review of existing data and technical reports, the calculation of
appropriate design criteria for coastal protection options, and the
preliminary review of coastal protection options.
Stage 2 A comprehensive review of suitable coastal protection options.
Stage 3 The final design and cost estimate of the coastal management option
nominated by Wanneroo.
The results of the Stage 1 investigations were presented in Rogers &
Associates (1999), and the results and recommendations of Stage 2 are
presented in this report.
1.2 Study Area
Quinns Beach is located approximately 35 km north of Perth, Western
M P ROGERS & ASSOCIATES Quinns Beach Coastal Protection Works
Report R060 Rev 0, Page 2
Australia. Thousands of years ago sand accreted in the sheltered coastal
region north-east of Quinns Rocks, forming what is referred to as Quinns
Cusp (Smith, 1985). However, in more recent times, sections of this cusp
have eroded, with the recession of the foreshore threatening to undermine
public assets and reduce the recreational amenity of the beaches.
The focus of this study is the protection of amenities which are located
along the section of coastline between Caldera Close in the south and
Tapping Way in the north. For the purpose of the study Quinns Cusp will
be referred to as the Cusp, the foreshore located to the south of the Cusp
will be referred to as the Southern Beach, and the foreshore located to the
north of the Cusp will be referred to as the Northern Beach (refer to Figure
1.1).
1.3 Results of Stage 1
Coastal Processes
Existing data and technical reports were reviewed. This information was
supplemented through further investigation and analysis described in the
Stage 1 Report (Rogers & Associates, 1999). The results of the study
indicated that the artificial headland constructed to the south of the Cusp in
1977 greatly influenced the stability of the Quinns coast. Since its
construction, the Southern Beach has remained relatively stable while the
Northern Beach has progressively eroded. This finding was the principal
difference between the Stage 1 Study and Tremarfon (1997). The latter
indicated that the erosion of the Northern Beach may be the result of severe
storms experienced between 1994 and 1996 rather than a progressive trend.
Sediment budgets based on shoreline movements and a comparison of
surveys recorded between 1977 and 1997 indicated that the volume of sand
along the Quinns beaches varied significantly with both seasonal and annual
fluctuations. However, on average, about 4,000 m3/year accreted on the
Southern Beach and about 8,500 m3/year was lost from the Northern Beach.
Design Criteria
Design still water levels were determined from the results of Steedman
(1988) and analysis completed as part of the present study (refer to
Table 1.1).
The computer model 2GWave was used to analyse the wave climate at
Quinns and determine appropriate nearshore significant wave heights for a
range of storm events (refer also to Table 1.1). However, in most cases the
height of incident waves will be depth limited with energy losses occurring

M P ROGERS & ASSOCIATES Quinns Beach Coastal Protection Works
Report R060 Rev 0, Page 3
as the waves approach the foreshore entering shallower water.
Table 1.1 - Nearshore Design Criteria
ARI Event Design Still Water Level Significant Wave Height (at -4 m CD)
10 year +1.75 m CD ( 1.0 m AHD) 2.5 m
20 to 30 year +1.8 m CD ( 1.1 m AHD) 2.6 m
50 to 100 year +1.9 m CD ( 1.2 m AHD) 2.8 m
Preliminary Analysis of Management Options
Southern Beach The evaluation of coastal processes at Quinns indicated that since the
construction of the artificial headland in 1977, the Southern Beach remained
relatively stable, with survey results indicating that the beach accreted by
about 80,000 m3 between 1977 and 1997. The present beach berm provides
effective protection to the primary dune. However, during very severe
storm events the dune may erode.
To protect Ocean Drive from being undermined by the gradual erosion of
the primary dune, it was recommended that the following management
options be considered in Stage 2:
Do nothing.
Sand renourishment on an as needed basis in response to severe storm
erosion.
Seawall construction.
Northern Beach The evaluation of coastal processes at Quinns indicated that since the
construction of the artificial headland in 1977, the Northern Beach has
progressively eroded. Survey results indicated that the beach eroded by
about 170,000 m3 between 1977 and 1997. The preliminary evaluation of
management options recommended investigation of the following options in
Stage 2:
Do nothing.
Regular sand renourishment.
M P ROGERS & ASSOCIATES Quinns Beach Coastal Protection Works
Report R060 Rev 0, Page 4
Seawall construction.
Combined lower strength seawall construction and regular
renourishment.
Groyne / Headland construction.
2. Management Options
M P ROGERS & ASSOCIATES Quinns Beach Coastal Protection Works Report R060 Rev 0, Page 5
2.1 Do Nothing
The Do Nothing Option is essentially that, to implement no coastal
protection measures and allow the foreshore to be reshaped in response to
natural coastal processes. On eroding coastlines this option can be referred
to as retreat, and is often considered appropriate in cases where interference
with coastal processes is undesirable or where the cost of protection works
exceeds the value of amenities threatened by erosion.
The suitability of the Do Nothing Option is dependent on the cost and
impacts of the alternative management options in comparison to the value
(financial, recreational, environmental etc) of the amenities which are likely
to be lost if the Do Nothing Option is adopted.
2.2 Sand Renourishment
The Renourishment Option involves artificially replacing the sand which is
eroded from Quinns Beach. Sand renourishment is generally viewed
throughout the world as an environmentally friendly or soft coastal
management option. It allows the natural coastal processes to continue to
remove sand from the eroding section of coast without causing a recession
of the foreshore. The sand feeds into the system preventing deficiencies in
sediment supply to downcoast beaches, thus avoiding the relocation of the
erosion problem further along the coast. In appropriate locations, long
stretches of shore can be maintained through a relatively small input of
sand.
Provided appropriate quantities of suitable sand are used, the
Renourishment Option can maintain existing facilities, beach widths and
dune locations with limited adverse effects on the surrounding environment.
The suitability of this option is dependent of the volume of sand required,
and the availability and cost of suitable sand.
Source and Cost of Suitable Renourishment Sand
A number of sand pit operators were contacted and queried on the
availability of sand suitable for renourishment at Quinns. Rocla Quarries
identified a number of sources of sand which may be suitable, and estimated
that supply costs were likely to be between $7/t to $10/t. It is likely that if a
long term renourishment programme is established, or large volumes are
required to saturate groynes or headlands, then more competitive prices
could be obtained. Therefore, the supply cost of $7/t is considered
appropriate for the cost evaluation of options involving sand renourishment.
The Overfill Factors of the sand offered by Rocla Quarries were calculated

M P ROGERS & ASSOCIATES Quinns Beach Coastal Protection Works Report R060 Rev 0, Page 6
in accordance with the Shore Protection Manual (1984) and ranged between
1.00 and 1.11. Therefore, assuming an Overfill Factor of 1.1 and an average
compacted density of about 1.75 t/m3, the cost to replace sand lost due to
erosion sand is estimated at $13.50/m3. It is important to note that this
figure is different to the cost of supplied uncompacted or loose sand (ie in
the truck), which is estimated to cost about $10.50/m3.
Additional costs will include management, administration and the spreading
and general stabilising of the sand (assume total cost of $1.50/m3).
Therefore, for the purposes of the investigation a cost of $15/m3 in situ has
been used for the replacement of sand lost through erosion or introduced to
saturate groynes or headlands.
The Shire of Wanneroo is presently seeking tenders for renourishment
works to be conducted over the next 3 years. The tender submissions are
likely to identify a number of suitable sand supplies, and the award of this
contract will provide a more accurate estimate of the cost of future sand
renourishment.
Additional sources of sand include the sand trap at Ocean Reef and possibly
offshore dredging if it proved cost effective. A number of areas to the north
of Quinns are likely to be developed in the near future and suitable sand
from these works may also become available.
2.3 Seawall Construction
The purpose of a seawall is to create a barrier which prevents erosion
landwards of the seawall. However, it should be noted that erosion can
continue seawards and longshore of the seawall, and in many cases, erosion
in these areas can be increased by the construction of a seawall.
Coastal defence using seawalls is most appropriate in cases where the
foreshore is generally stable or accreting under normal conditions, but
suffers significant erosion during severe storm events. If the seawall is
constructed to the rear of the beach, beyond the reach of the ocean during
normal conditions, the beach is able to respond naturally during these
conditions with a general onshore movement of sand occurring. While
during periods of severe storms, when storm surges can produce increased
water levels and large waves attack the shore, the seawall is able to restrict
the limit of the erosion. This is the situation at the Southern Beach.
If a seawall is constructed on a beach which is eroding during normal
conditions, the erosion of the beaches seawards and longshore of the seawall
can be increased by wave reflection from the seawall, and a reduction in

M P ROGERS & ASSOCIATES Quinns Beach Coastal Protection Works Report R060 Rev 0, Page 7
sediment supply from the region landwards of the seawall. This is the
situation at the Northern Beach.
2.4 Seawall Construction Combined with Renourishment
As discussed in Section 2.3, if a seawall is constructed on a beach which is
eroding during normal conditions, the erosion of the beaches seawards and
longshore of the seawall can be increased by wave reflection from the
seawall, and a reduction in sediment supply from the region landwards of
the seawall. However, this process can be avoided through renourishment
which can be used to maintain the beaches during normal conditions.
The benefit of this option over straight seawall construction is that the beach
amenity is maintained for beach users, and the size and capacity of the
seawall can be reduced due to the increased protection offered by the beach.
This option may be preferable over straight renourishment if the cost of the
seawall is less than the cost of renourishment required to form an adequate
buffer to protect the amenities. Although the seawall will reduce temporary
losses during severe storm events, it is not likely that the long term net
losses from the area will be reduced. In the case of the Northern Beach, the
net losses are primarily caused by a net northwards longshore drift. These
losses will not be prevented by the construction of a seawall.
2.5 Groyne / Headland Protection
Groynes and headlands can be used to trap littoral drift, reducing net losses
in sediment and changing the angle and width of the beach. However, the
influence of these structures should be carefully evaluated as the
construction of groynes or headlands generally transfers the erosion problem
further along the beach.
Following a period of erosion which threatened to undermine the southern
flank of Ocean Drive, an artificial headland was constructed immediately
south of the Cusp in 1977. Since this time the Southern Beach has remained
relatively stable with a net accretion of 80,000 m3 recorded between
December 1977 and December 1997. However, it is likely that the headland
transferred the erosion problem to the Northern Beach which was previously
accreting and is now eroding.
If groynes or headlands are used to protect the Northern Beach, it is likely
that the beach to the north of the most northern structure will erode.

M P ROGERS & ASSOCIATES Quinns Beach Coastal Protection Works Report R060 Rev 0, Page 8

3. Management of the Southern Beach
M P ROGERS & ASSOCIATES Quinns Beach Coastal Protection Works Report R060 Rev 0, Page 9
3.1 Coastal Processes
Since the construction of the artificial headland in 1977, the Southern Beach
has remained relatively stable. Survey results indicate that the region
accreted by about 80,000 m3 between December 1977 and December 1997.
However, localised erosion produced some recession of the primary dune.
Observations by Wanneroo personnel, and SBEACH modelling undertaken
in Stage 1, indicates that severe storm events are capable of eroding the
beach berm and producing a minor recession in the primary dune.
Sediment volume change analysis of the survey results indicated that the
localised loss from the primary dune was about 6,000 m3. This, combined
with the 6,000 m3 of sand renourishment undertaken by Wanneroo in
November 1997, indicates that although the Southern Beach has accreted
over the past 20 years, localised erosion has produced a loss of about
12,000 m3 from the primary dune. This amount is relatively small in the
overall system. However, it does suggest that a succession of severe storm
events may reduce the buffer protecting Ocean Drive and threaten to
undermine it. At present, the buffer between Ocean Drive and the primary
dune is as small as 15 metres in some places.
3.2 Do Nothing
If the Do Nothing Option is adopted, a succession of severe storm events
may reduce the buffer protecting Ocean Drive and threaten to undermine it.
The threatened section of Ocean Drive is:
the sole access road to 15 private residences,
the main route of access to other private residences, and
a traffic route utilised by the wider community accessing various
amenities at Quinns.
A very conservative approach would be to suggest that Ocean Drive is
worth at least the value of the residences which rely on the road for sole
access.
The average value of properties sold along Ocean Drive was obtained from
the Department of Land Administration. These records indicated that
between 1996 and 1998 the average value of properties sold was $294,000
(18 sales). In 1998 the average value of properties sold was $348,000 (5
sales). Based on this information $300,000 per lot is considered to be a
conservative estimate. 15 private residences at $300,000 per lot equates to
$4,500,000.

M P ROGERS & ASSOCIATES Quinns Beach Coastal Protection Works Report R060 Rev 0, Page 10
Additional costs include the removal of Ocean Drive between Mary Street
and Terry Road at a cost of about $50,000, plus removal costs of structures
on the 15 private lots at about $75,000 (ie $5,000 per lot), and legal costs of
at least $150,000 ($10,000 per lot).
Cost Analysis
The cost analysis of the Do Nothing Option is detailed in Table A.1 of
Appendix A. In this analysis it has been assumed that Quinns Drive would
be undermined and access to the 15 residences lost in year 35. Table 3.1
below is a summary of Table A.1.
Table 3.1 - Summary Cost Analysis of the Do Nothing Option
Discount Rate Net Present Value of Costs
0% $4,775,000
2% $2,435,384
4% $1,258,461
6% $658,528
8% $348,791
10% $186,905
This analysis is based on the concept of discounted cash flow which
considers that money has a real time value, ie money spent or gained now
has more value than that paid or received later (refer to de Neufville et al,
1971). The rate at a which the value of money changes is referred to as the
discount rate. This rate is dependent on the economic climate, and the
objectives of the organisation intending to raise or expend revenue. For
government bodies which must plan a long way into the future, long term
bonds rates are often considered to be appropriate indicators of the discount
rate. The current long term bonds rates are about 4% pa, and this value has
been used in the final cost comparison of the management options (refer to
Sections 5.1 and 5.2).
3.3 Sand Renourishment
An important factor in the management of the Southern Beach is the
seasonal and interannual fluctuations in beach width. Stage 1 identified that
seasonal weather conditions can produce significant rotation of the shore,
M P ROGERS & ASSOCIATES Quinns Beach Coastal Protection Works Report R060 Rev 0, Page 11
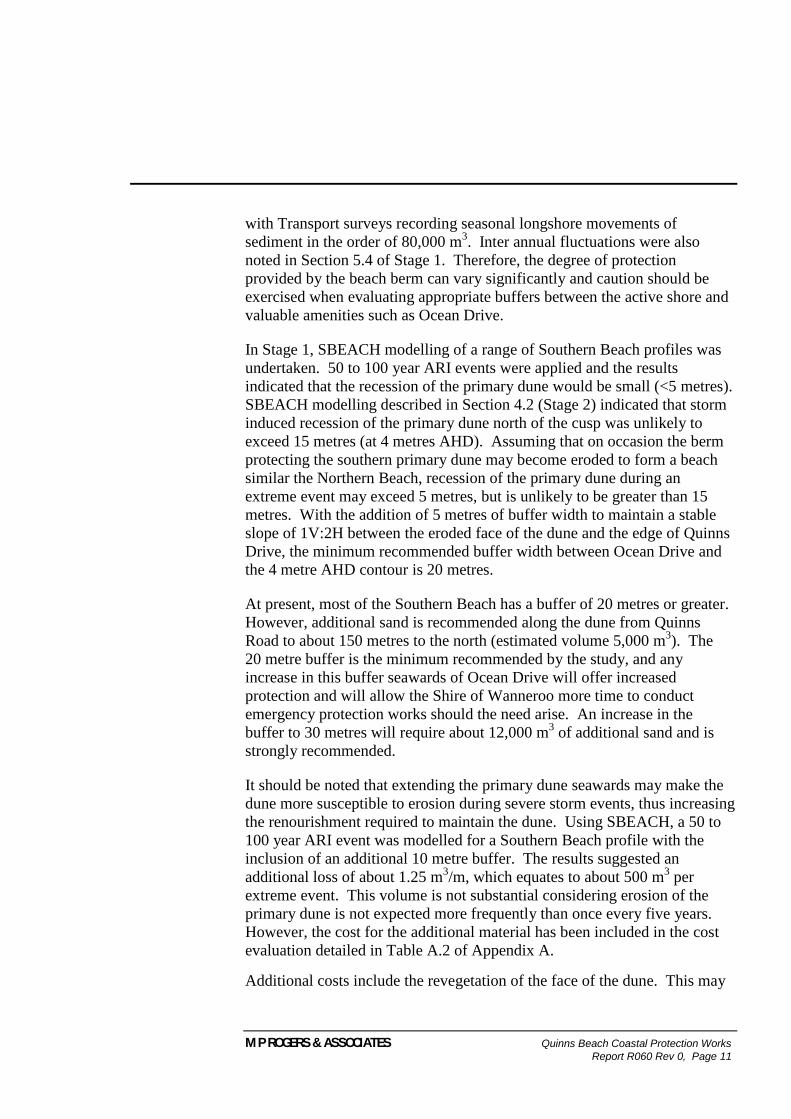
with Transport surveys recording seasonal longshore movements of
sediment in the order of 80,000 m3. Inter annual fluctuations were also
noted in Section 5.4 of Stage 1. Therefore, the degree of protection
provided by the beach berm can vary significantly and caution should be
exercised when evaluating appropriate buffers between the active shore and
valuable amenities such as Ocean Drive.
In Stage 1, SBEACH modelling of a range of Southern Beach profiles was
undertaken. 50 to 100 year ARI events were applied and the results
indicated that the recession of the primary dune would be small (<5 metres).
SBEACH modelling described in Section 4.2 (Stage 2) indicated that storm
induced recession of the primary dune north of the cusp was unlikely to
exceed 15 metres (at 4 metres AHD). Assuming that on occasion the berm
protecting the southern primary dune may become eroded to form a beach
similar the Northern Beach, recession of the primary dune during an
extreme event may exceed 5 metres, but is unlikely to be greater than 15
metres. With the addition of 5 metres of buffer width to maintain a stable
slope of 1V:2H between the eroded face of the dune and the edge of Quinns
Drive, the minimum recommended buffer width between Ocean Drive and
the 4 metre AHD contour is 20 metres.
At present, most of the Southern Beach has a buffer of 20 metres or greater.
However, additional sand is recommended along the dune from Quinns
Road to about 150 metres to the north (estimated volume 5,000 m3). The
20 metre buffer is the minimum recommended by the study, and any
increase in this buffer seawards of Ocean Drive will offer increased
protection and will allow the Shire of Wanneroo more time to conduct
emergency protection works should the need arise. An increase in the
buffer to 30 metres will require about 12,000 m3 of additional sand and is
strongly recommended.
It should be noted that extending the primary dune seawards may make the
dune more susceptible to erosion during severe storm events, thus increasing
the renourishment required to maintain the dune. Using SBEACH, a 50 to
100 year ARI event was modelled for a Southern Beach profile with the
inclusion of an additional 10 metre buffer. The results suggested an
additional loss of about 1.25 m3/m, which equates to about 500 m
3 per
extreme event. This volume is not substantial considering erosion of the
primary dune is not expected more frequently than once every five years.
However, the cost for the additional material has been included in the cost
evaluation detailed in Table A.2 of Appendix A.
Additional costs include the revegetation of the face of the dune. This may

M P ROGERS & ASSOCIATES Quinns Beach Coastal Protection Works Report R060 Rev 0, Page 12
cost in the order of $15,000 (400 m x 12.5 m x $3/m2) following the
increase in the buffer protecting Ocean Drive, and about $5,000 following
severe storm events which cause significant erosion requiring
renourishment.
Cost Analysis
The cost analysis of the Renourishment Option is detailed in Table A.2 of
Appendix A. Table 3.2 below is a summary of Table A.2.
Table 3.2 - Summary Cost Analysis of the Renourishment Option
Discount Rate Net Present Value of Costs
0% $681,000
2% $559,187
4% $482,862
6% $433,123
8% $399,440
10% $375,784
3.4 Seawall Construction
Section 4.5 contains a detailed evaluation of the management of the
Northern Beach through a combination of sand renourishment and seawall
construction. The severe wave heights at the Southern Beach are similar to
those at the Northern Beach, and provided the Southern Beach continues to
remain stable during normal conditions, it is comparable with the Northern
Beach maintained through renourishment. Therefore, the seawall
recommended for the Northern Beach in Section 4.5 (refer to Figure 4.10B)
is considered appropriate for the Southern Beach.
The seawall would be constructed along the primary dune, and should not
be exposed to wave action under normal conditions due to the protection
offered by the foredune. Under severe storm conditions when the foredune
may be eroded through the offshore movement of sand, the seawall will halt
the recession of the shore and prevent losses from the primary dune.
Following the storm event, natural coastal processes are likely to return the
sediment from the offshore and renourishment of the Southern Beach should

M P ROGERS & ASSOCIATES Quinns Beach Coastal Protection Works Report R060 Rev 0, Page 13
not be required.
The length of shore south of the Cusp requiring protection is about
400 metres long. Therefore, seawall protection is likely to cost in the order
of $400,000, with maintenance estimated at $40,000 per 10 year period.
A negative impact of the construction of a seawall is that it reduces the
amount of sand which would have previously entered the system from
erosion during severe storm events. This volume has been estimated to be
about 600 m3/year (ie about 3,000 m
3 every 5 years). If it is assumed that
this material reduced losses from the Northern Beach by moving northwards
during sea-breeze conditions, or by reducing the amount of sand moving
south past the Cusp, then an additional 3,000 m3 of sand renourishment will
be required at the Northern Beach every five years. The cost of this
renourishment has been included in the cost analysis for the Southern Beach
detailed in Table A.3 of Appendix A, because the works are required as a
direct result of constructing a seawall to protect the Southern Beach.
Cost Analysis
The cost analysis of the Seawall Option is detailed in Table A.3 of
Appendix A. Table 3.3 below is a summary of Table A.3.
Table 3.3 - Summary Cost Analysis of the Seawall Option
Discount Rate Net Present Value of Costs
0% $790,000
2% $677,117
4% $603,581
6% $554,161
8% $519,925
10% $495,511
3.5 Seawall Construction Combined with Renourishment
The Southern Beach accreted by about 80,000 m3 between December 1977
and 1997. Although some of the primary dune eroded during this period, it
is likely that this localised erosion can be managed through either

M P ROGERS & ASSOCIATES Quinns Beach Coastal Protection Works Report R060 Rev 0, Page 14
renourishment or the construction of a seawall. Unless the Southern Beach
enters an erosion trend, the combination of seawall construction and regular
renourishment is not considered warranted. One or the other should be
adequate to manage the Southern Beach.
3.6 Groyne / Headland Construction
Since the construction of the headland in 1977, the Southern Beach has
remained relatively stable. Modelling of storm erosion indicates that the
present beach width offers adequate protection to the primary dune, with
recession of the dune only expected during very severe storm events. This
is supported by survey monitoring undertaken by Transport which indicates
that losses from the primary dune have been relatively minor (ie about
12,000 m3) over the past 20 years. Therefore, increases in the beach width
through the construction of further headlands or groynes is not considered
warranted at present.
However, it should be noted that the Southern Beach is quite dynamic and
experiences significant rotation due to seasonal variations in dominant wave
climates. The present regime of stability is dependent on a fine balance of
large sediment fluxes, and minor changes in weather patterns may produce
significant changes in the coastal processes and upset this balance. If the
Southern Beach enters a trend of long term erosion, the management of the
Southern Beach should be re-evaluated. Reducing the beach rotation
through the construction of a second headland may be appropriate.

4. Management of the Northern Beach
M P ROGERS & ASSOCIATES Quinns Beach Coastal Protection Works Report R060 Rev 0, Page 15
4.1 Coastal Processes
Since the construction of the artificial headland in 1977, the Northern Beach
has progressively eroded, receding at a rate of about 1 m/year. The total net
loss of sediment from the Northern Beach was about 170,000 m3 during the
twenty year period between December 1977 and December 1997 (ie about
8,500 m3/year).
Survey analysis, and wave modelling and analysis indicates that this loss of
sediment is the result of small net differences in much larger seasonal
fluctuations of longshore sediment transport. On average, there is a net
movement of sand northwards along the coast. This sand is not replaced
with sufficient quantities of sand entering the system from the south, and
hence there is a net loss of sand from the Northern Beach.
Waves produced by summer sea-breezes are believed to be the principal
cause of the northwards longshore transport of sediment. Although severe
storms can produce offshore movements of sediment and recession of the
primary dune, they are not believed to be the cause of the progressive
erosion at the Northern Beach. In fact, storms from the north-west can
produce significant southwards transport and reduce the net losses from the
area.
Due to the complexity of the system, it is not possible to accurately
determine how far the foreshore would recede before a stable realignment
would be achieved, or even whether a stable realignment would be achieved
at all.
4.2 Do Nothing
The present buffer between the active shore and the Northern Car Park and
Stubbs Park is minimal. The Car Park itself facilitates access to the
Northern Beach and supports a toilet block and surf club. Without
appropriate coastal management these facilities will be undermined if the
present rate of erosion continues.
The present buffer protecting the northern flank of Ocean Drive is
considered barely adequate. The height of Ocean Drive varies between
10 metres and 16 metres AHD. Assuming an average height of about 11
metres AHD and a stable slope of 1V:2H, Ocean Drive may become
unstable if the 4 metres AHD contour recedes to within 14 metres of the
road.
The buffer between the road and the 4 metres AHD contour is less than 30
metres in places and the section of Ocean Drive between Mary Street and

M P ROGERS & ASSOCIATES Quinns Beach Coastal Protection Works Report R060 Rev 0, Page 16
Terry Road may be undermined within 15 to 20 years, if the buffer
continues to recede at the present rate of 1 m/year. The full length of Ocean
Drive between Robinson Road and Robert Road may be undermined within
35 years.
Figure 4.1 shows the approximate location of the present 4 metres AHD
contour location and the estimated location of this contour in 15, 25 and 35
years, assuming an average recession rate of 1 m/year. Also shown is the
14 metre buffer from Ocean Drive required to insure slope stability.
The combination of a gradual erosion trend with episodic recession of the
foreshore during severe storm events may threaten to undermine Ocean
Drive sooner than the noted 15 to 20 year period. SBEACH modelling was
used to evaluate the possible storm induced erosion which may threaten
Ocean Drive. A profile extending seawards of a location approximately
50 metres south of Mary Street was used. This profile was obtained from
Transport's October 1996 survey. A series of 50 to 100 year ARI events
were applied, with the storm induced sand bar removed between storm
events. This conservative approach was adopted to simulate the
combination of storm erosion and possible losses due to longshore
movements.
The SBEACH modelling indicated that a single 50 to 100 year ARI event
would produce a relatively minor recession in the 4 metres AHD contour of
about 3 metres. However, with the offshore bar removed and the event
repeated, the 4 metres AHD contour retreated about 10 metres landwards of
its initial location. This process was repeated a further 2 times with the final
position of the 4 metres AHD contour located about 13 metres from its
initial location. The results of the SBEACH modelling are supported by the
coastline movement analysis conducted in Stage 1, which indicated that
between 1970 to 1998 a maximum recession of 12 metres occurred between
December 1980 and October 1983. Therefore, although the average
recession rate is about 1 m/year, it is possible that a series of severe storm
events may produce a recession of the primary dune by as much as
15 metres.
Threatened Amenities
Assuming a 1 m/year rate of foreshore erosion, the following amenities are
likely to be threatened by coastal erosion within a 35 year period:
Northern Car Park,
Stubbs Park,
Surf Club,

M P ROGERS & ASSOCIATES Quinns Beach Coastal Protection Works Report R060 Rev 0, Page 17
Toilet Block,
Northern Beach, and
Quinns Drive between Robinson Road and Robert Road.
The Northern Beach is listed among the threatened amenities because the
desirability of the location to beach users will be greatly reduced by the loss
of the vehicle access provided by the Northern Car Park, the loss of
amenities provided by the public toilets, and the loss of the safety and
recreation opportunities provided by the surf club.
Threatened Amenities 1 to 5
Methods for Determining Economic Value
The present and future economic value of the amenities associated with the
Northern Beach (ie amenities 1 to 5 listed above) is difficult to determine
accurately. Evaluating the construction costs of the human made facilities is
not an appropriate method of determining the overall value, as this excludes
the value of the benefit they provide to the community. After all, the
facilities would not have been constructed if the benefits did not outweigh
the costs.
South Australian Coastal Protection Board (1993) lists the following four
methods for determining the value of beaches:
Shadow Prices - Use related market prices as an indication of the value
of the likely benefit or willingness-to-pay (eg the cost to enter a public
swimming pool).
Travel Cost Method - Estimate the travel costs to and from the beach,
and other associated costs, to estimate the minimum amount that people
are prepared to pay to use the beach.
Contingent Valuation Method - Asking people directly what they are
prepared to pay to receive the benefit of the beach, or alternatively be
compensated for the loss of the beach.
Hedonic Price Method - Infers values for particular resources based on
related markets (eg the influence of beach frontage on property prices).
Evans et al (1993) used methods 1, 2, and 4 listed above when evaluating
the economic value of Adelaide metropolitan beaches. The study included
the effect on property values, day users of the beaches, and public finance
(rates only). Evans et al estimated that the Adelaide metropolitan beaches
were worth an average of between $550,000/km/year and
$750,000/km/year.

M P ROGERS & ASSOCIATES Quinns Beach Coastal Protection Works Report R060 Rev 0, Page 18
Beach Value Specifically Related to Vehicle Access and Facilities
Various studies conducted in Western Australia and elsewhere (Elliott,
1986, Hassell et al, 1986 and Houghton, 1988) have identified that access
and facilities are key factors in beach usage. Houghton (1988) stated that,
"40% of the (Perth) metropolitan coastline attracts relatively little use. For
the most part, this situation appears to reflect difficulty of access and a
general lack of parking and other facilities."
Hassell et al (1986) estimated that about 84% of Adelaide's beach users
arrived by car, and $250,000/km/year to $450,000/km/year of the Evans et
al (1993) beach value estimation related to the day users of the beaches.
Therefore, adequate vehicle access to the Adelaide beaches can be
considered to be worth between $210,000/km/year and $380,000/km/year
(ie 84% of the above).
Houghton (1988) concluded that the travel habits of beach users at Perth and
Adelaide were broadly similar. Houghton (1988) also found that of the
Perth metropolitan beach users which travelled by car, over half travelled a
distance greater than 10 km to the beach. This suggests that as the North-
West Corridor develops there will be an increasing demand for parking and
other amenities at Quinns Beach. In the five years between 1991 and 1995,
Wanneroo North-West was the fastest growing statistical division in
Western Australia. The population increased from 5,855 to 17,880 at an
average annual rate of 25% per year. Wanneroo Central Coastal was the
third fastest growing statistical division in Western Australia, and the
second fastest within the Perth metropolitan statistical division. Its
population increased from 25,263 to 38,889 at an average annual rate of 9%
per year.
Woods (1989) described the beach north of the Northern Car Park as "a
good sandy beach", which would "obviously attract user pressure", and
estimated that the beach could attract in the order of 400 users at any one
time. The Northern Car Park has a capacity of about 140 vehicles, which
would facilitate 350 people, assuming an average of 2.5 people per vehicle.
The construction of a second car park on the northern flank of Quinns (north
of Tapping Way) was not recommended by Woods (1989). The preferred
option was to direct users further to the north through the provision of
appropriate facilities where the landforms were more stable. Clearly, the
sacrifice of the existing Northern Car Park and associated amenities would
further increase pressure on the surrounding beaches.
Assuming the Northern Car Park can facilitate about 350 people at any one

M P ROGERS & ASSOCIATES Quinns Beach Coastal Protection Works Report R060 Rev 0, Page 19
time, it is not difficult to believe that as the North-West Corridor develops
this Car Park will be regularly at, or just below, capacity during peak
periods such as summer weekends. 350 people is only a little above 84% (ie
the approximate % of dependence on vehicle access) of the 400 beach users
estimated in Woods (1989).
The number of people using Perth metropolitan beaches was evaluated by
Houghton (1988). Houghton (1988) used an aerial survey to quantify the
number of people using the beaches between 11:30 AM and 12:00 PM on
Sunday 7 February 1988. Houghton (1988) found that there was over 1
person/metre of beach at Hillarys Boat Harbour, Sorrento, Trigg,
Scarborough, North Swanbourne, North Cottesloe, Cottesloe and Port Beach
(note: the survey area did not extend to Quinns). If adequate facilities are
available, beach usage at Quinns in excess of 1 person/metre, or in excess of
500 people within a 500 metre section of beach in the vicinity of the
Northern Car Park, is considered reasonable in the longer term.
Also, it is likely that most people will not stay at the beach for the entire
day. Therefore, a majority of parking spaces will be utilised by multiple
vehicles over the course of a single day.
Peak usage of the beach is expected to be during summer weekends and
public holidays, with an expected reduction in usage during the other
seasons and on weekdays.
Shadow Prices Method Evaluation of the Northern Car Park
Based on the above information, and assuming that the recreational amenity
of a beach can be loosely compared with the recreational amenity provided
by a public pool (cost $3/person), the Shadow Prices method can be used
to determine the economical value of the beach amenity provided by the
Northern Car Park.
Summer Peak Usage = 350 people
Summer Peak Daily Usage = 2 x (Summer Peak Usage)
= 700 people/day
Summer Weekly Usage = 2 x (Summer Peak Daily Usage)
+ 5 x (Summer Peak Daily Usage) x (20%)
= 2100 people/week

M P ROGERS & ASSOCIATES Quinns Beach Coastal Protection Works Report R060 Rev 0, Page 20
Other Seasons Weekly Usage = (Summer Weekly Usage) x (15%)
= 315 people/week
Yearly Usage = 13 x (Summer Weekly Usage)
+ 39 (Other Seasons Weekly Usage)
= 39,585 people/year
Economic Value = (39,585 people/year) x ($3/person)
= $119,000/year
The above assessment used best guess approximation to determine the
beach usage. Insufficient information was available to determine more
accurate figures, and the scope of the Study did not include or warrant a
more comprehensive investigation into beach usage.
The 20% of beach users which do not depend on vehicle access to beaches
are unlikely to be deterred by the loss of the Car Park. However, the loss of
the surf club and toilet facilities would make the Northern Beach less
desirable. If it is assumed that about half of these beach users were deterred
by the loss of facilities, then the total economical value of the Northern
Beach amenities would be about $131,000/year (ie 110% of
$119,000/year).
The approach used to determine the economical value of the Northern
Beach is considered to be very conservative. This is supported by Evans et
al (1993) which estimates that a similar length of Adelaide's beaches is
worth 2 to 3 times the above value.
Additional costs of sacrificing Amenities 1-5 include the cost to remove the
Car Park pavement, the Toilet Block and Surf Club. These demolition and
removal costs are estimated at $45,000.
Threatened Amenity 6
Quinns Drive between Robinson Road and Robert Road is the sole access
road to 35 private residences. It is also the main route of access to other
private residences, and is a traffic route utilised by the wider community
accessing various amenities at Quinns. A very conservative approach would
be to suggest that Ocean Drive is worth at least the value of the residences
which rely on the road for sole access.
The average value of properties sold along Ocean Drive was obtained from

M P ROGERS & ASSOCIATES Quinns Beach Coastal Protection Works Report R060 Rev 0, Page 21
the Department of Land Administration. These records indicated that
between 1996 and 1998 the average value of properties sold was $294,000
(18 sales). In 1998 the average value of properties sold was $348,000 (5
sales). Based on this information $300,000 per lot is considered to be a
conservative estimate.
Additional costs include the removal of Ocean Drive between Mary Street
and Terry Road at a cost of about $100,000, plus removal costs of structures
on the 35 private lots at about $5,000 per lot, and legal costs of $10,000 per
lot.
Cost Analysis
The cost analysis of the Do Nothing Option is detailed in Table A.4 of
Appendix A. Table 4.1 below is a summary of Table A.4.
Table 4.1 - Summary Cost Analysis of the Do Nothing Option
Discount Rate Net Present Value of Costs
0% $14,903,500
2% $9,297,448
4% $6,046,391
6% $4,084,995
8% $2,854,998
10% $2,055,000
4.3 Sand Renourishment
Since the construction of the artificial headland in 1977, the Northern Beach
has progressively eroded, receding at a rate of about 1 m/year. The total net
loss of sediment from the Northern Beach was about 170,000 m3 during the
twenty year period between December 1977 and December 1997 (ie about
8,500 m3/year). However, it is not clear how much of this quantity is
associated with changes which occurred immediately following the
construction of the artificial headland which may have now stabilised, how
much is associated with changes resulting from the severe winter storms of
1995 and 1996, and how much is associated with other fluctuations in
weather patterns.
Figure 5.1 of the Stage 1 report shows a possible future sediment budget

M P ROGERS & ASSOCIATES Quinns Beach Coastal Protection Works Report R060 Rev 0, Page 22
based on the assumption that the beach to the south of the Cusp had become
saturated and the Southern Beach was no longer accreting at a rate of
4,000 m3/year. This suggests that 5,000 m
3/year may be sufficient to protect
the Northern Beach, with an additional 2,000 m3/year needed to protect the
beach to the north of the Study area.
For evaluation and planning purposes it is recommended that an average
annual renourishment requirement of 7,000 m3/year (in situ) is used for the
Northern Beach. This should allow for losses which may occur as a result
of seasonal sediment transport spreading the renourishment sand through the
system. However, it is noted that fluctuations in weather conditions and
longer term changes in erosion trends may influence the volume of sand
required.
As discussed in Section 4.2, SBEACH modelling indicates that the
recession of the upper foreshore (ie the 4 metres AHD contour) is unlikely
to exceed 15 metres during a series of severe storm events. Therefore, a
minimum buffer of 15 metres is recommended between the 4 metres AHD
contour and the edge of the Northern Car Park, and 30 metres is
recommended between the 4 metres AHD contour and the edge of Ocean
Drive (note: additional distance is required for a stable slope between the 4
metres AHD contour and the edge of the road located at about 11 metres
AHD).
These buffers are viewed as reasonable minimum distances which should be
maintained. If progressive erosion or a severe storm event produces a
recession in the primary dune beyond these distances, immediate action
should be undertaken to increase the degree of protection, particularly if
Ocean Drive is threatened.
The January 1999 survey completed by Transport indicates that in most
locations along the beach the buffers protecting the Car Park and Ocean
Drive are about equal to or slightly greater than minimum buffers
recommended above. However, at the northern end of the Car Park an
additional 1,000 m3 of sand may be required to supplement the present
buffer.
By increasing the present buffers, greater protection can be offered to the
Northern Car Park and Ocean Drive, and the dependence on emergency
protection works can be reduced. This would allow Wanneroo greater time
to respond to a phase of foreshore recession, possibly allowing the gradual
replacement of lost material through scheduled (budgeted) renourishment
sessions. To increase the buffer by 10 metres along 600 metres of the most
vulnerable section of foreshore, approximately 48,000 m3 of sand would be

M P ROGERS & ASSOCIATES Quinns Beach Coastal Protection Works Report R060 Rev 0, Page 23
required (assuming an active zone from
-3 metres CD to +5 metres CD). This increase in the buffer is recommended
if renourishment is adopted as the long term management option.
Cost Analysis
The cost analysis of the Renourishment Option is detailed in Table A.5 of
Appendix A. Table 4.2 below is a summary of Table A.5.
Table 4.2 - Summary Cost Analysis of the Renourishment Option
Discount Rate Net Present Value of Costs
0% $4,395,000
2% $3,376,265
4% $2,700,617
6% $2,250,953
8% $1,935,863
10% $1,706,933
4.4 Seawall Construction
The results of Tremarfon (1997) indicated that the Northern Beach had
historically been relatively stable, with trends of both accretion and erosion.
It was stated that the more recent foreshore erosion recorded by the
vegetation line plots of 1985 and 1995 were possibly the result of severe
storm events between 1993 and 1995. Based on these findings, the
construction of a seawall was recommended if the erosion trend persisted.
Stage 1 of the present study reviewed the findings of Tremarfon (1997), and
obtained additional information from subsequent surveys and evaluation of
aerial photography. The results indicated that although the severe storms
between 1993 and 1995 may have contributed to the erosion, the erosion of
the Northern Beach appeared progressive since the construction of the
artificial headland in 1977, with the principal cause of the erosion likely to
be a reduced sediment supply from the south due to the headland. This
finding greatly alters the criteria used to determine the most appropriate
coastal management options for the Northern Beach, and the criteria used in
their design.

M P ROGERS & ASSOCIATES Quinns Beach Coastal Protection Works Report R060 Rev 0, Page 24
In general, seawalls are not recommended for locations which exhibit the
trends identified at the Northern Beach by Stage 1 of the present study.
Waves produced by the summer afternoon sea-breeze, and west to south-
west winter seas will continue to produce a northwards longshore movement
of sand, and although swell and north of west winter storms may return
some of this sand to the Northern Beach, a continuation of the past net
losses is expected. These losses will denude the beaches seawards and
longshore of the seawall, increasing the water depth at the toe of the seawall
and allowing larger waves to attack the seawall.
The erosion rate over the last 20 years has averaged about 1 m/year. If this
trend continues, a foreshore recession of 25 metres is predicted over the next
25 years. This foreshore recession was applied to a beach profile obtained
from the December 1997 survey results, and the resulting profile was
modelled using SBEACH for 20-30 year ARI and 50-100 year ARI storm
events. The results are displayed in Figures 4.2 and 4.3.
The SBEACH modelling was repeated for the 20-30 year ARI event
assuming 35 years of erosion at a rate of 1 m/year (refer to Figure 4.4).
Allowing for the additional 10 years of erosion did not increase the
maximum significant wave height at the seawall or the maximum eroded
depth at the seawall. However, seabed depths further seawards of the
seawall were greater and increased protection at the toe may be required in
the longer term if the foreshore continues to erode at the present rate.
The seawall would remain accessible for maintenance should the need arise,
and the degree of protection required for public assets such as car parks is
generally viewed as less critical than the protection required for private
residences and essential roadways. Therefore, for the purposes of the
preliminary design of the seawall, the 20-30 year ARI event is considered
appropriate. The profile which assumed 25 metres of erosion produced the
greatest depth immediately seawards of the seawall and was therefore used
(refer to Table 4.3). However, as noted above, the profile which assumed
35 metres of erosion produced the larger depths further seawards.
Therefore, additional works to reinforce the toe may be required in the
longer term.

M P ROGERS & ASSOCIATES Quinns Beach Coastal Protection Works Report R060 Rev 0, Page 25
Table 4.3 - Seawall Design Criteria
Significant wave height (Hs) 2.5 metres
Eroded depth at toe -3.1 metres AHD
Estimated eroded depth at toe with adequate toe protection
-2.0 metres AHD
Seawall Construction Methods
Revetment Mattresses
Research conducted by the University of New South Wales Water Research
Laboratory (1997) on behalf of Foreshore Protection Pty Ltd indicated that
the collapsible block revetment mattress system installed at a slope of
1V:2H was not suitable in wave climates of 1.1 metres or greater (water
depth = 4 metres, wave period = 10 seconds). Given that this system was
the most robust and appropriate system recommended to Transport
(Transport, 1998) by Foreshore Protection Pty Ltd, and assuming that other
revetment mattress suppliers do not have cost effective systems which are
able to withstand significant wave heights of 2.5 metres, the use of a
revetment mattress to construct a seawall is not recommended.
Geofabric Tubes
Geofabric tubes are not recommended because the seawall is likely to be
regularly if not constantly exposed, and the tubes would be vulnerable to
damage and vandalism.
Interconnected Concrete Blocks
Transport (1998) reviewed a system of interconnected concrete blocks
referred to as "Seabees". The design capacity and cost of Seabee seawalls
constructed at Wamberal Beach (NSW) and Beacon Cove (VIC) were
detailed. The seawall at Wamberal Beach appears to be similar to the
seawall which would be required at the Northern Beach (refer to Table 4.4).
The seawall at Wamberal Beach is slightly higher (toe to crest) and can
withstand slightly larger waves. However, the expected trend of progressive
erosion at the Northern Beach will necessitate more extensive toe protection
and support. Therefore, given that the Seabee seawall at Wamberal Beach
cost about $4,800 per lineal metre, it is estimated that a seawall of similar
configuration at the Northern Beach will cost about the same.

M P ROGERS & ASSOCIATES Quinns Beach Coastal Protection Works Report R060 Rev 0, Page 26
Table 4.4 - Seabee Seawall Comparison
Location Wamberal Beach Northern Beach Quinns
Significant wave height 2.8 metres 2.5 metres
Wave period 14.4 seconds 8 seconds
Crest RL 8.0 metres 6 metres (AHD)
Toe RL -0.6 metres -2 metres (AHD)
Rubble Seawall
Throughout Western Australia rubble (ie rock) is generally the preferred
material for the construction of coastal protection structures in locations
exposed to large wave action. This is primarily due to the availability and
low cost of suitable rubble, coupled with its ability to progressively rather
than suddenly fail when overloaded.
A preliminary design was prepared (refer of Figure 4.5) using the ACES
design package (developed by the US Army Corps of Engineers) to
determine the appropriate armour size and filter layer. It is estimated that
the rubble seawall will cost in the order of $3,770 per lineal metre (refer to
Table 4.5).
Maintenance of the seawall should be minimal during the first 10 years.
However, as the beach seawards of the seawall erodes, the wave forces on
the seawall will increase. The seawall has been designed to withstand
severe storm wave attack (20 to 30 year ARI storm event) without the
protection currently provided by the beach. However, over time the rubble
at the toe of the structure may settle within the seabed, and additional
armour at the toe may be required. An allocation of $330/m for
maintenance in the 20th
year (ie 10 m3/m of armour stone at $33/m
3) is
considered appropriate.

M P ROGERS & ASSOCIATES Quinns Beach Coastal Protection Works Report R060 Rev 0, Page 27
Table 4.5 - Option 3 Rubble Seawall Cost Estimates
Item Rate Amount Cost
Armour $33/m3 72 m
3/m $2,376.00/m
Filter $33/m3 21 m
3/m $693.00/m
Excavation
Dozer
Excavator
$0.50/m3
$5.50/m3
50 m3/m
33.5 m3/m
$25.00/m
$184.25/m
Subtotal $3,278.25/m
Management 5% $163.91/m
Contingencies 10% $327.83/m
Total $3,769.99/m
Schedule of Works
Option 3 would initially involve the construction of a seawall to protect the
Northern Car Park at a cost of about $1,320,000 (ie 350 metres at
$3,770/m).
If the present trend of erosion to the immediate north of the Car Park
continued, then an extension of the seawall to protect Ocean Drive would be
required in approximately 15 years, at a cost of about $2,451,000 (ie
650 metres at $3,770/m).
After the foreshore seawards of the seawall has eroded and the wall is
exposed to larger wave action, it is likely to require maintenance works
following severe storm events. Also, as noted in the beginning of this
section, additional toe protection may be required in the longer term. An
allowance for $400,000 of maintenance and reinforcement works is
recommended, and has been applied in the 35th
year of the cost analysis.
Impacts
Wave reflection from the seawall and a reduction in the amount of sediment
entering the system from the protected area, may increase the erosion of the
beaches longshore and seawards of the wall. It is likely that the beach
seawards of the seawall would be lost within 5 years of the construction of

M P ROGERS & ASSOCIATES Quinns Beach Coastal Protection Works Report R060 Rev 0, Page 28
the seawall. If the present trend of erosion to the immediate north of the Car
Park continued, then the beach would erode back to the primary dune within
10 years, and would be completely lost within 20 years.
Cost Analysis
The cost analysis of the Seawall Option is detailed in Table A.6 of
Appendix A. Table 4.6 below is a summary of Table A.6.
Table 4.6 - Summary Cost Analysis of the Seawall Option
Discount Rate Net Present Value of Costs
0% $7,092,000
2% $5,279,487
4% $4,116,066
6% $3,344,544
8% $2,817,720
10% $2,448,595
4.5 Seawall Construction Combined with Renourishment
Renourishment Requirements
It is likely that the principal cause of the erosion of the Northern Beach is a
gradient in longshore drift, with an insufficient supply of sediment to
replace lost material. Smith Corporation (1985) indicated that there is
minimal sediment exchange between Quinns and the rocky headlands to the
south, or between Quinns and the offshore. Therefore, it is likely any net
losses from the Quinns area result from northerly sediment movements
which are produced by summer sea-breeze conditions and west to south
west winter seas.
As the construction of a seawall will not prevent the losses of beach sand
due to the above processes, it is predicted that the volume of material
needed to maintain the beach seawards of the seawall would be equivalent
to the annual renourishment requirements detailed in Section 3.3 (ie
7,000 m3/year).

M P ROGERS & ASSOCIATES Quinns Beach Coastal Protection Works Report R060 Rev 0, Page 29
Seawall Design Criteria
SBEACH was used to model the effect of 20 to 30 year ARI and 50 to 100
year ARI storm events on the Northern Beach, with the inclusion of a
seawall at Chainage 30 metres (refer to Table 4.7 and Figures 4.6 and 4.7).
Table 4.7 - Seawall Design Criteria (with renourishment)
Event 20 to 30 year ARI 50 to 100 year ARI
Significant wave height 0.8 metre 1.0 metre
Eroded depth at toe -0.3 metre AHD -0.9 metre AHD
Estimated eroded depth at toe with adequate toe protection
-0.1 metres AHD -0.3 metre AHD
Although the design of the seawall proposed in Section 4.4 used the 20 to 30
year design criteria, it was decided that the design of the seawall for the
present option would use the 50 to 100 year design criteria. This was
because the present option's seawall is dependent on the protection provided
by the beach which is to be maintained through renourishment. This
introduces a process which requires regular monitoring and management
activities which may be delayed due to unforeseen circumstances.
Therefore, a more conservative approach was adopted.
Seawall Construction Methods
Revetment Mattresses
Research conducted by the University of New South Wales Water Research
Laboratory (1997) on behalf of Foreshore Protection Pty Ltd indicated that
the collapsible block revetment mattress system installed at a slope of
1V:2H was not suitable in wave climates of 1.1 metres or greater (water
depth = 4 metres, wave period = 10 seconds). This suggests that the
revetment mattress would be at the limit of its capacity in the event of the
conditions predicted for a 50 to 100 year ARI storm, and an insufficient
safety factor would exist for possible faults in the mattress or for wave
forces in excess of those predicted. Unlike a rubble seawall which would
continue to offer substantial protection following partial failure, significant
losses could be expected if the revetment mattress system failed during a
severe storm event.
Although the use of the above revetment system is not recommended due to
its limited capacity, a preliminary design was prepared to enable a cost

M P ROGERS & ASSOCIATES Quinns Beach Coastal Protection Works Report R060 Rev 0, Page 30
estimate (refer to Figure 4.8) of the system. Based on the approximate cost
of $46.75/m2 for the revetment mattress as detailed in Transport (1998), it is
estimated that the system would cost in the order of $1,550 per lineal metre
to install (refer to Table 4.8). This cost is in excess of other seawall options
detailed below, and it is considered unlikely that other revetment mattress
manufactures would be able to supply alternative revetment mattress
systems which have greater design capacity, at a significantly reduced cost.
Therefore, the use of revetment mattress systems to protect the Northern Car
Park and Ocean Drive is not recommended.
Table 4.8 Option 4 Revetment Mattress Cost Estimates
Item Rate Amount Cost
Revetment Mattress
$46.75/m2 17.6 m
2/m $822.80/m
Filter Layer $33.00/m3 12.5 m
3/m $412.50/m
Excavation
Dozer
Excavator
$0.50/m3
$5.50/m3
135 m3/m
7.5 m3/m
$67.50/m
$41.25/m
Subtotal $1,344.05/m
Management 5% $67.20/m
Contingencies 10% $134.41/m
Total $1,550/m
Geofabric Tubes
For the purposes of evaluating sand filled geofabric tubes as seawall
protection for the Northern Beach, products supplied by Maccaferri Pty Ltd
were evaluated. A preliminary design of a geotube configuration was
prepared (refer to Figure 4.9), and approximate installation costs determined
(refer to Table 4.9). It is estimated that the use of Geotubes to protect the
Northern Car Park and Ocean Drive would cost in the order of $1,060 per
lineal metre, plus $11,500 for mobilisation and demobilisation of plant.

M P ROGERS & ASSOCIATES Quinns Beach Coastal Protection Works Report R060 Rev 0, Page 31
Table 4.9 - Option 4 Sand Filled Geotube Cost Estimates
Item Rate Amount Cost
Geotubes $240.00/m 2 $480.00/m
Scour protection $100.00/m 1 $100.00/m
Excavation
Dozer
Excavator
$0.50/m3
$5.50/m3
135 m3/m
7.5 m3/m
$67.50/m
$41.25/m
Sand Emulsifier
Mobilisation
Pumping
$10,000
$3.00/m3
1
15 m3/m
$10,000.00
$45.00/m
Extra Sand $15/m3 12.5m
3/m $187.50/m
Subtotal $921.25/m plus $10,000
Management 5% $46.06/m plus $500.00
Contingencies 10% $92.13/m plus $1000.00
Total $1,060/m plus $11,500
Interconnected Concrete Blocks
Transport (1998) reviewed a system of interconnected concrete blocks
referred to as "Seabees". The design capacity and cost of Seabee seawalls
constructed at Wamberal Beach (NSW) and Beacon Cove (VIC) were
detailed. The seawall at Beacon Cove appears to be similar to the seawall
which would be required at the Northern Beach if the present option was
adopted (refer to Table 4.10).

M P ROGERS & ASSOCIATES Quinns Beach Coastal Protection Works Report R060 Rev 0, Page 32
Table 4.10 - Seabee Seawall Comparison
Location Beacon Cove Northern Beach Quinns
Significant wave height 1.3 metres 1 metre
Wave period 4.0 seconds 8 seconds
Crest RL +2.5 metres +3.5 metres (AHD)
Toe RL -3.2 metres -1 metres (AHD)
The seawall at Beacon Cove is higher (toe to crest) and can withstand a
slightly larger wave. Therefore, given that the Seabee seawall at Beacon
Cove cost about $2,750 per lineal metre, it is estimated that a seawall of
similar configuration at the Northern Beach will cost about $2,200 per lineal
metre.
If the seawall is constructed satisfactorily, maintenance should be minimal
during the 25 year period. However, this will be dependent on the
maintenance of the beach seawards of the seawall.
Rubble Seawall
Throughout Western Australia rubble (ie rock) is generally the preferred
material for the construction of coastal protection structures in locations
exposed to large wave action. This is primarily due to the availability and
low cost of suitable rubble.
A preliminary design was prepared (refer of Figure 4.10A) using the ACES
design package to determine the appropriate armour size and filter layer. It
is estimated that the rubble seawall will cost in the order of $1,120 per lineal
metre (refer to Table 4.11).

M P ROGERS & ASSOCIATES Quinns Beach Coastal Protection Works Report R060 Rev 0, Page 33
Table 4.11 - Option 4 Rubble Seawall Cost
Item Rate Amount Cost
Armour $27/m3 20 m
3/m $540.00/m
Filter Layer $33/m3 4.9 m
3/m $161.70/m
Excavation
Dozer
Excavator
$0.50/m3
$5.50/m3
154 m3/m
27 m3/m
$77.00/m
$148.50/m
Extra Sand $15/m3 3.2 m
3/m $48.00/m
Subtotal $975.20/m
Management 5% $48.76/m
Contingencies 10% $97.52/m
Total $1,120/m
Cost savings can be achieved by reducing the depth of the seawall (refer to
Table 4.12). However, additional armour protection would be required at
the toe of the seawall, as shown in Figure 4.10B. If the beach seawards of
the seawall becomes eroded during a severe storm event, it is expected that
some of the armour stone at the toe will settle into the seabed, preventing
the seawall from being undermined. The alternative rubble seawall is likely
to cost in the order of $1,020 per lineal metre.
The maintenance requirements for the rubble seawall would be dependent
on the performance of the regular renourishment undertaken to maintain the
beach seawards of the seawall. However, it may be in the order of 10% of
the capital cost (ie $102/m), per 10 year period.

M P ROGERS & ASSOCIATES Quinns Beach Coastal Protection Works Report R060 Rev 0, Page 34
Table 4.12 - Option 4 Rubble Seawall with Armoured Toe
Item Rate Amount Cost
Armour $27/m3 22 m
3/m $594.00/m
Filter Layer $33/m3 4 m
3/m $132/m
Excavation
Dozer
Excavator
$0.50/m3
$5.50/m3
135 m3/m
12.5 m3/m
$67.50/m
$68.75/m
Subtotal $862.25/m
Management 5% $43.11/m
Contingencies 10% $86.23/m
Total $1,020/m
Recommendations
Of the seawall construction methods evaluated for the present option, the
rubble seawall with an armoured toe is recommended. This seawall would
initially be about 350 metres long and would extend around the seawards
perimeter of the Northern Car Park, at a cost of about $350,000.
Maintenance requirements include regular renourishment of about 7,000 m3
of sand per year at a cost of about $105,000 per year, and structural
maintenance of about $35,000 per 10 year period.
The principal protection will be provided by the renourishment programme.
The purpose of the seawall is to provide increased protection during severe
storm events and reduce the extent of erosion during these periods. Sections
of the seawall may fail if the beach is not adequately maintained or if the
storm event is significantly more severe than the design storm event.
However, the seawall should continue to provide a significant degree of
protection after partial failure.
A larger more durable seawall could be used to provide greater protection;
however, it would be more costly as shown in Section 4.4. Alternatively, a
smaller but less expensive seawall could be used; however, it would offer
less protection during very severe events. The recommended seawall is
considered to be an appropriate design for the conditions which are likely to
occur during the next 35 years.
M P ROGERS & ASSOCIATES Quinns Beach Coastal Protection Works Report R060 Rev 0, Page 35
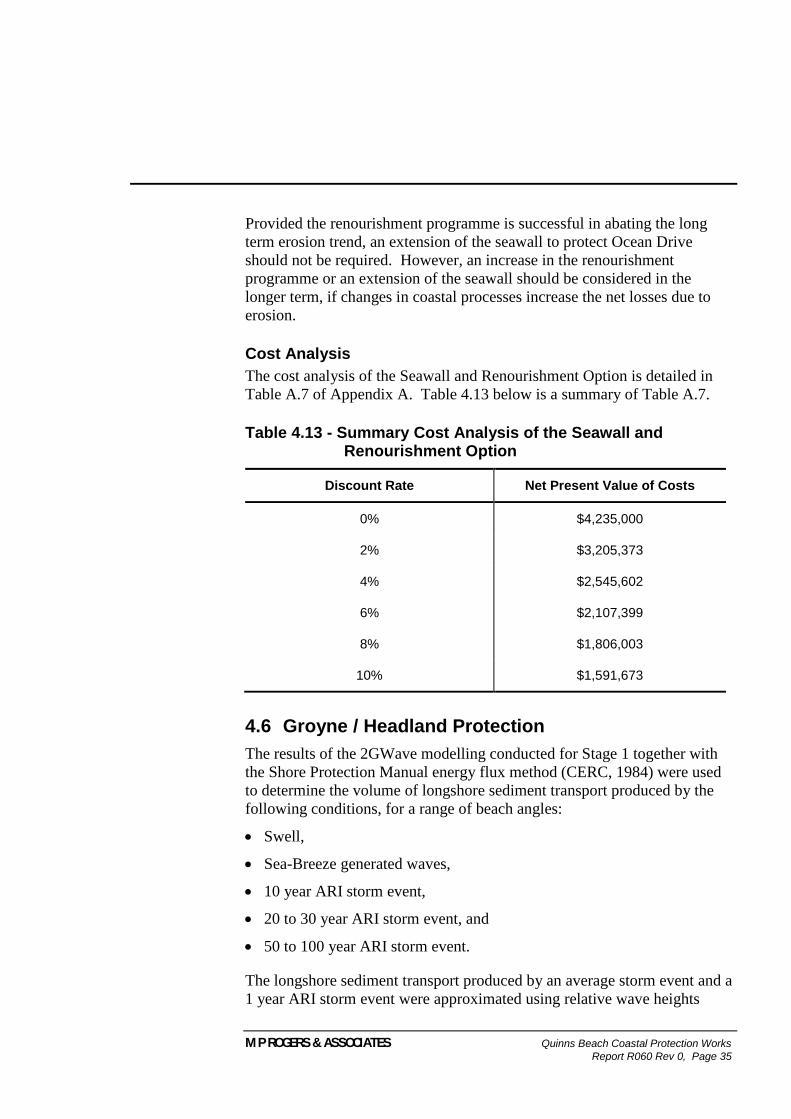
Provided the renourishment programme is successful in abating the long
term erosion trend, an extension of the seawall to protect Ocean Drive
should not be required. However, an increase in the renourishment
programme or an extension of the seawall should be considered in the
longer term, if changes in coastal processes increase the net losses due to
erosion.
Cost Analysis
The cost analysis of the Seawall and Renourishment Option is detailed in
Table A.7 of Appendix A. Table 4.13 below is a summary of Table A.7.
Table 4.13 - Summary Cost Analysis of the Seawall and Renourishment Option
Discount Rate Net Present Value of Costs
0% $4,235,000
2% $3,205,373
4% $2,545,602
6% $2,107,399
8% $1,806,003
10% $1,591,673
4.6 Groyne / Headland Protection
The results of the 2GWave modelling conducted for Stage 1 together with
the Shore Protection Manual energy flux method (CERC, 1984) were used
to determine the volume of longshore sediment transport produced by the
following conditions, for a range of beach angles:
Swell,
Sea-Breeze generated waves,
10 year ARI storm event,
20 to 30 year ARI storm event, and
50 to 100 year ARI storm event.
The longshore sediment transport produced by an average storm event and a
1 year ARI storm event were approximated using relative wave heights

M P ROGERS & ASSOCIATES Quinns Beach Coastal Protection Works Report R060 Rev 0, Page 36
obtained from Steedman (1988). The combination of an appropriate number
of each of the events was then used to obtain a net annual sediment transport
for the Northern and Southern Beaches. The results indicated that a very
small change in the angle of the beach was likely to significantly change the
net annual movements. A rotation of the mean beach angle by 1 degree
altered the net annual sediment transport at the Northern and Southern
Beaches by about 12,000 m3/year and 7,000 m
3/year respectively.
This result is supported by the response of the Southern Beach to the
installation of the headland in 1977. A comparison of the November 1974
and December 1997 surveys indicates that the mean beach angle rotated by
about 1 degree after the construction of the headland, and sediment budgets
prepared in Stage 1 indicate that this change altered the net annual sediment
transport of the Southern Beach by about 7,000 m3 (ie -3,000 m
3 to
+4,000 m3). It should be noted, however, that the predicted changes in
sediment transport are based on a number of assumptions and the results are
only considered to be representative of the order of magnitude of longshore
sediment movement which is likely to occur.
Based on the predicted changes in sediment transport for the Northern
Beach, it is likely that only a small change in the mean beach angle (ie about
1 degree) will be required to stop the present net annual sediment loss of
7,000 m3. However, if groynes or headlands are constructed to produce this
change, seasonal changes in the direction of sediment transport are likely to
produce a seasonal rotation of the beach. This rotation may be in the order
of 3 degrees which is currently observed to the south of the Cusp.
To create a mean beach angle change of 1 degree, while allowing for a
maximum seasonal rotation of 3 to 4 degrees, it is recommended that three
structures be used (refer to Figures 4.11 and 4.12). These structures would
need to be capable of extending the width of the adjacent beach by about
20 metres to allow for the combination of the mean beach angle change and
the seasonal rotation of the beach (refer to Figure 4.11). It is estimated that
about 70,000 m3 of sand would be required to initially saturate these
structures.
Using less structures to stabilise the beach was considered. However, this
would require larger structures and more sand, and the associated costs
would significantly exceed the possible savings which could be made by
reducing the number of structures.
Using more structures to stabilise the beach was also considered. However,
to make this scheme more cost effective than the recommended option
would require a reduction in the distance that the beach is extended

M P ROGERS & ASSOCIATES Quinns Beach Coastal Protection Works Report R060 Rev 0, Page 37
seawards. This was not considered feasible due to uncertainties in the
saturated beach angle which would be produced by the structures. Also, it
was believed that it would be preferable to beach users that the number of
structures be minimised.
Design Criteria
SBEACH was used to model the effect of a 20 to 30 year ARI storm event
on the Northern Beach, using the wave modelling results obtained in Stage
1. Figure 4.13 shows the predicted beach profile change and maximum
significant wave heights.
After the structures have become saturated with sand, it is unlikely that the
bed depth immediately seawards of the groyne or headland will exceed
-1.8 metres AHD (ie 1 metre below low water). Therefore, based on the
SBEACH wave height predictions, the maximum significant wave height at
the structure is unlikely to exceed 2.1 metres during a 20 to 30 year ARI
storm event. Based on breakwater modelling using ACES, two layers of 5
tonne limestone armour is appropriate for this wave climate.
Groyne Design and Cost Estimates
If a groyne is used to stabilise the Northern Beach, the structure will need to
extend back to the primary dune to prevent wave action from eroding
behind the landward end of the structure during severe storm events. The
section of the structure between the dune and the present low water line is
unlikely to be attacked by large wave action as it is in shallow water, and is
perpendicular to the shore and in the lee of the head of the groyne.
Assuming a pre-storm beach height of 1 metre AHD adjacent to this section
of the structure, the significant wave height is unlikely to exceed 0.8 metres
during a 20 to 30 year ARI storm event. Breakwater modelling using ACES
indicates that two layers of 0.4 tonne limestone armour is appropriate for
this wave climate.
Figure 4.14 illustrates the preliminary design of the a groyne suitable for the
extension of the beach width immediately to the south of the structure by
about 20 metres. It is estimated that this groyne would cost in the order of
$130,000. Table 4.14 provides a breakdown of this preliminary cost
estimate.

M P ROGERS & ASSOCIATES Quinns Beach Coastal Protection Works Report R060 Rev 0, Page 38
Table 4.14 - Groyne Cost Estimate
Item Rate Amount Cost
Armour
5 tonne
0.4 tonne
$33/m3
$30/m3
1,600 m3
580 m3
$52,800.00
$17,400.00
Core $27/m3 1230 m
3 $33,210.00
Excavation
Dry Material
Wet Material
$1.00/m3
$5.50/m3
1200 m3
290 m3
$1,200.00
$1,595.00
Plant Mobilisation
$5,000.00
Subtotal $111,205.00
Management 5% $5,560.25
Contingencies 10% $11,120.50
Total $128,000
Headland Design and Cost Estimates
Figure 4.15 illustrates the preliminary design of a headland suitable for the
extension of the beach width immediately to the south of the structure by
about 20 metres. It is estimated that this headland would cost in the order of
$140,000. Table 4.15 provides a breakdown of this preliminary cost
estimate.

M P ROGERS & ASSOCIATES Quinns Beach Coastal Protection Works Report R060 Rev 0, Page 39
Table 4.15 - Headland Cost Estimate
Item Rate Amount Cost
5 tonne Armour $33/m3 2,650 m
3 $87,450.00
Core $27/m3 1,000 m
3 $27,000.00
Plant Mobilisation
$5,000.00
Subtotal $119,450.00
Management 5% $5,972.50
Contingencies 10% $11,945.00
Total $137,367.50
Maintenance
The maintenance of the groynes and headlands is estimated at about
$42,000 per 10 year period.
Contingencies
The recommended configuration of these structures was based on the best
estimate of the likely beach change. As the estimate of the likely beach
change was obtained from computer analysis and the evaluation of the
effects of the existing headland on the Southern Beach, it is only considered
accurate to 2 degrees.
Also, the present regime is dependent on a fine balance of large sediment
fluxes. Fluctuations in seasonal and interannual weather conditions and
minor changes in longer term weather patterns may alter this balance and
change the beach angle required for stabilisation. Stage 1 indicated that the
net seasonal movement of sediment at the Southern Beach may be in the
order of 60,000 m3. If fluctuations in weather conditions produce a 50%
difference between the volume of sand moving south in one winter and the
volume of sand moving north in the following summer, then the additional
beach rotation would be in the order of 2 degrees.
If the maximum beach angle rotation is only 1 degree, then an additional
96,000 m3 of sand would be required to saturate the structures, at a cost of
about $1,440,000. Alternatively, if groynes were used then these structures
could be shortened by 12 metres at a cost of about $70,000, or if headlands

M P ROGERS & ASSOCIATES Quinns Beach Coastal Protection Works Report R060 Rev 0, Page 40
were used these structures could be moved 12 metres at a cost of about
$150,000.
If the maximum beach angle rotation is 5 degrees (ie 2 degrees greater than
the estimated 3 degrees), then each structure would need to be extended by
12 metres and resaturated with sand. Extending the groynes would cost
about $170,000, while moving the headlands would cost about $240,000.
The additional sand is likely to cost in the order of $300,000 (ie 20,000 m3
at $15/m3).
Given the significant cost implications of small differences between the
estimated mean beach angle and rotations and the possible post construction
mean beach angle and rotations, it is recommended that $300,000 is allowed
as contingencies for possible remedial works.
Impacts
As noted in Section 2.5, the protection of an eroding coast using groynes or
headlands often moves the erosion trend further along the coast. In the case
of the protection of the Northern Beach it is likely that the erosion trend will
be moved to the north of the most northern structure.
The Shire of Wanneroo has advised that to the north of the Study area the
minimum development setback from the coast is about 80 metres. This
coastline eroded by about 15 metres during the 18 year period between 1978
and 1995. The reduction in sediment supply caused by the construction of
groynes or headlands is likely to increase this rate of erosion, and the
present buffer between the shore and the intended development may be
depleted and require protection within 30 years.
Assuming coastal protection costs relative to the Northern Beach, with
about 1.5 km of shore to protect, the cost to protect the coast is estimated at
$2,235,000. This includes $40,000 for investigations, $650,000 for the
construction of Groynes or Headlands and $1,575,000 for sand
renourishment.
As well as reducing the flow of sediment northwards during summer, the
use of groynes or headlands to stabilise the Northern Beach may produce a
reduction in the southwards flow of sediment during winter. Initially this
reduction should be relatively minor. However, as the beach to the north
erodes, greater quantities of sand will be required to saturate then flow
around the most northern structure. Over time this may significantly reduce
the flow of sediment southwards during winter, which could reduce the
performance of the structures and may destabilise the Southern Beach.

M P ROGERS & ASSOCIATES Quinns Beach Coastal Protection Works Report R060 Rev 0, Page 41
Cost Analysis
The initial cost analysis of the Groyne / Headland Option is detailed in
Table A.8 of Appendix A. Table 4.16 below is a summary of Table A.8.
Table 4.16 - Summary Cost Analysis of the Groyne / Headland Option
Discount Rate Net Present Value of Costs
0% $4,459,000
2% $3,339,635
4% $2,700,948
6% $2,328,649
8% $2,106,222
10% $1,969,457
Following the public meeting held on the 7 September 1999, the City of
Wanneroo requested that consideration be given to the cost implications of
constructing the structures over a number of years.
The cost analysis of constructing 3 headlands over a period of 3 years is
detailed in Table A.9 of Appendix A. Table 4.17 below is a summary of
Table A.9, and Table 4.18 provides the estimated yearly expenditure for the
first 10 years.
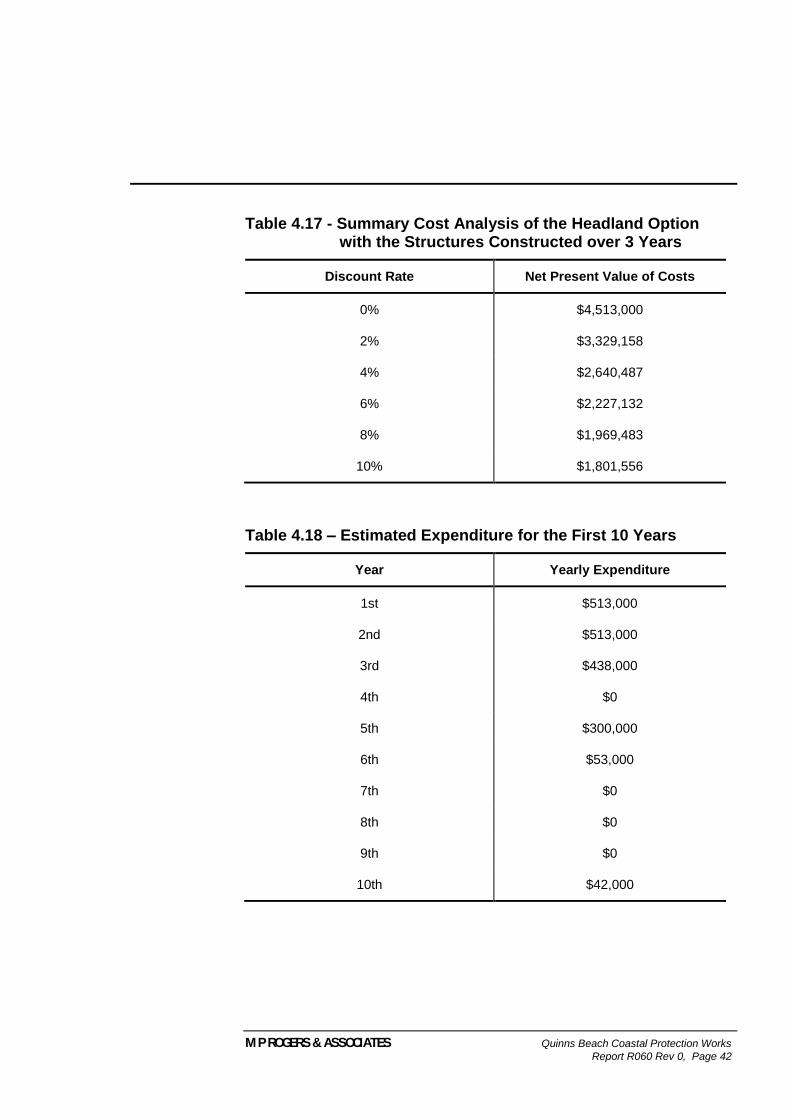
M P ROGERS & ASSOCIATES Quinns Beach Coastal Protection Works Report R060 Rev 0, Page 42
Table 4.17 - Summary Cost Analysis of the Headland Option with the Structures Constructed over 3 Years
Discount Rate Net Present Value of Costs
0% $4,513,000
2% $3,329,158
4% $2,640,487
6% $2,227,132
8% $1,969,483
10% $1,801,556
Table 4.18 – Estimated Expenditure for the First 10 Years
Year Yearly Expenditure
1st $513,000
2nd $513,000
3rd $438,000
4th $0
5th $300,000
6th $53,000
7th $0
8th $0
9th $0
10th $42,000
5. Public Meeting 7/9/99
M P ROGERS & ASSOCIATES Quinns Beach Coastal Protection Works Report R060 Rev 0, Page 43
The results of the study were presented at a public meeting held on the
7 September 1999 at the Gumblossom Community Centre, Quinns Rocks.
In total, 51 members of the local community attended the meeting. In
general the findings of the study were well received by the community. A
copy of the minutes is attached in Appendix B.
During question time, discussion on the Southern Beach was relatively
limited. Indications were that the community generally supported the
recommendation to increase the existing dune buffer, then conduct sand
renourishment on an as needed basis.
There was rigorous discussion concerning the Northern Beach. Support for
the long term management of the Northern Beach was generally divided
between seawall construction with ongoing renourishment, and the
construction of groynes or headlands. When the preference for each of
these options was put to a vote, seawall construction with ongoing
renourishment received a slightly higher number of votes (14 to 11).
The Communities concerns regarding the management of the Northern
Beach included:
Adequate beach access should continue to be provided (desire expressed
for continued slipway access).
Seawall construction with renourishment requires ongoing works (some
expressed preference for capital works).
Groynes and Headlands can provide fishing opportunities.
Groynes and Headlands along the coast will be physically and visually
obtrusive.

6. Summary and Recommendations
M P ROGERS & ASSOCIATES Quinns Beach Coastal Protection Works Report R060 Rev 0, Page 44
6.1 Southern Beach Summary
Since the construction of the artificial headland in 1977, the Southern Beach
has remained relatively stable. A seawall protects the Southern Car Park
and Toilet Block, while natural limestone appears to protect the region to
the south. Survey results indicate that the region accreted by about
80,000 m3 during the twenty years between December 1977 and December
1997. However, analysis of Transport surveys indicates a localised loss of
about 12,000 m3 occurred from the primary dune seawards of Ocean Drive.
This amount is relatively small in the overall system. However, it does
suggest that without appropriate coastal management a succession of severe
storm events may reduce the buffer protecting Ocean Drive and threaten to
undermine it.
Suitable management options were reviewed and the results have been
summarised in Table 6.1. Tables A.1 to A.3 of Appendix A provide a
breakdown of the net present value of the costs of each option. These costs
are also displayed in Figure 6.1, which shows the net present value of the
costs for a range of discount rates.
The recommended option is to increase the present buffer (ie width of dune)
protecting Ocean Drive and undertake sand renourishment following severe
storm events which cause significant erosion of the primary dune. An
alternative option is to construct a seawall; however, this option is assessed
to be more costly and may increase the amount of erosion which occurs to
the north of the cusp.
The Do Nothing Option is not recommended as storm erosion may produce
a recession of the primary dune which may threaten to undermine a section
of Ocean Drive which is the sole vehicle access route for 15 private
residential lots. The net present value of the assets which may be lost
through erosion is considered to be significantly greater than the cost of
protecting them.

M P ROGERS & ASSOCIATES Quinns Beach Coastal Protection Works Report R060 Rev 0, Page 45
Table 6.1 - Summary Evaluation of Management Options for the Southern Beach
Do Nothing Sand Renourishment
Seawall Construction
Capital Works None Increase in the existing buffer protecting
Ocean Drive
Seawall Construction
Ongoing / Maintenance Works
None (2)
Occasional Sand Renourishment
(3,500m3/5 years)
Minor maintenance after very severe
storm events
Local Impacts Possible loss of Ocean Drive and access to 15
private residences
Minimal Some degree of visual impact
Environmental Impacts
Minimal Minimal Minimal if renourishment to the
north is increased (included in cost
estimate)
Net Present Value for 35 year Period
1
$1,260,000 $480,000 $600,000
Ranking 3 1 2
Notes: 1. The discounted costs for the 35 year period are based on a discount rate of 4% pa. An analysis of long term bonds, inflation rates and Capital Index Bonds has indicated that this discount factor is appropriate for the current economic climate.
2. Renourishment of 3,500 m3 in situ equates to about 4,500 m
3 uncompacted from external
source.
6.2 Northern Beach Summary
Since the construction of the artificial headland in 1977, the Northern Beach
has progressively eroded, receding at a rate of about 1 m/year. The total net
loss of sediment from the Northern Beach was about 170,000 m3 during the
twenty year period between December 1977 and December 1997 (ie about
8,500 m3/year). Assessment of the likely future losses suggest that the area
may erode at a rate of 7,000 m3/year.
Survey analysis, and wave modelling and analysis indicates that this loss of
sediment is the result of small net differences in much larger seasonal
fluctuations of longshore sediment transport. On average, there is a net
movement of sand northwards along the coast. This sand is not replaced
with sufficient quantities of sand entering the system from the south, and
hence there is a net loss of sand from the Northern Beach.
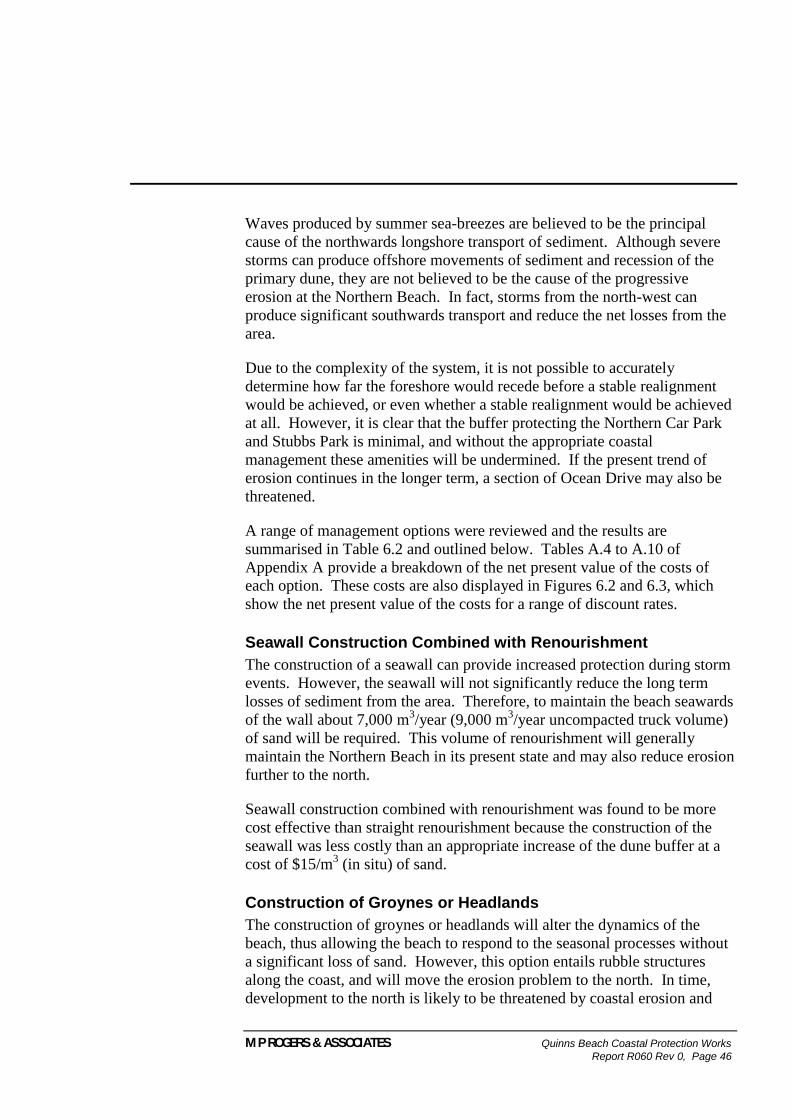
M P ROGERS & ASSOCIATES Quinns Beach Coastal Protection Works Report R060 Rev 0, Page 46
Waves produced by summer sea-breezes are believed to be the principal
cause of the northwards longshore transport of sediment. Although severe
storms can produce offshore movements of sediment and recession of the
primary dune, they are not believed to be the cause of the progressive
erosion at the Northern Beach. In fact, storms from the north-west can
produce significant southwards transport and reduce the net losses from the
area.
Due to the complexity of the system, it is not possible to accurately
determine how far the foreshore would recede before a stable realignment
would be achieved, or even whether a stable realignment would be achieved
at all. However, it is clear that the buffer protecting the Northern Car Park
and Stubbs Park is minimal, and without the appropriate coastal
management these amenities will be undermined. If the present trend of
erosion continues in the longer term, a section of Ocean Drive may also be
threatened.
A range of management options were reviewed and the results are
summarised in Table 6.2 and outlined below. Tables A.4 to A.10 of
Appendix A provide a breakdown of the net present value of the costs of
each option. These costs are also displayed in Figures 6.2 and 6.3, which
show the net present value of the costs for a range of discount rates.
Seawall Construction Combined with Renourishment
The construction of a seawall can provide increased protection during storm
events. However, the seawall will not significantly reduce the long term
losses of sediment from the area. Therefore, to maintain the beach seawards
of the wall about 7,000 m3/year (9,000 m
3/year uncompacted truck volume)
of sand will be required. This volume of renourishment will generally
maintain the Northern Beach in its present state and may also reduce erosion
further to the north.
Seawall construction combined with renourishment was found to be more
cost effective than straight renourishment because the construction of the
seawall was less costly than an appropriate increase of the dune buffer at a
cost of $15/m3 (in situ) of sand.
Construction of Groynes or Headlands
The construction of groynes or headlands will alter the dynamics of the
beach, thus allowing the beach to respond to the seasonal processes without
a significant loss of sand. However, this option entails rubble structures
along the coast, and will move the erosion problem to the north. In time,
development to the north is likely to be threatened by coastal erosion and

M P ROGERS & ASSOCIATES Quinns Beach Coastal Protection Works Report R060 Rev 0, Page 47
may also require protection. The cost of this protection has been
incorporated in the cost analysis.
Although the effect of the structures on the Northern Beach has been
calculated as accurately as possible with the resources available, small
differences from the predicted changes could be costly to manage. Some
contingencies have been allowed for within the cost analysis for minor
differences.
The gradual erosion of the beaches to the north of Quinns and the associated
protection works may reduce the flow of sediment returning from the north
during winter. In the longer term, this may reduce the performance of the
structures protecting the Northern Beach and possibly affect the Southern
Beach.
The construction of groynes or headlands is not recommended because they
are not the most cost effective option, they will be visually and physically
obstructive to the users of the beach, they are likely to have an adverse
effect on the surrounding coastline, and may be less effective in the longer
term.
Other Options
Sand renourishment will maintain the present beach and dunes with minimal
impact on beach users or the environment. However, the present buffer
between the active shore and valuable assets is not considered adequate for
long term management. If long term renourishment is adopted, the present
buffer would need to be increased through renourishment at a cost of about
$15/m3(in situ). However, the study indicated that the construction of the
seawall shown in Figure 4.10B was found to be more cost effective than an
increase in the buffer by 10 metres.
The Seawall Protection (ie without renourishment) and Do Nothing Options
are not recommended. Both of these options would involve sacrificing a
large portion of the Northern Beach amenity. Although the seawall would
preserve the Car Park, it is likely that the beach would be lost through
erosion. The Do Nothing Option may preserve some of the beach but
access and other amenities would be lost and a section of Ocean Drive may
be threatened.

M P ROGERS & ASSOCIATES Quinns Beach Coastal Protection Works Report R060 Rev 0, Page 48
Table 6.2 - Summary Evaluation of Management Options for the Northern Beach
Do Nothing Sand Renourishment
Seawall Construction
Renourishment and Seawall Construction
Groyne / Headland
Construction
Capital Works None Increase in the existing buffer
Seawall Construction
Seawall Construction
Groyne / Headland
Construction
Ongoing / Maintenance Works
None (2)
Sand Renourishment (7,000m
3/year)
Maintenance after very severe
storm events
(2)Renourishment
(7,000m3/year)
and seawall maintenance after severe
storms
Occasional Renourishment
Local Impacts Loss of beach access and
amenities, and possible loss of
Ocean Drive
Minimal Visual impact and loss of the
adjacent beaches
Minor visual impact
Significant visual and beach user
impact
Environmental Impacts
Minimal Minimal Likely increase in erosion of adjacent beaches
Minimal Erosion problem moved
to the north
Net Present Value for 35 year Period
1
>$6,050,000 (Conservative
Estimate)
$2,700,000 $4,120,000 $2,550,000 $2,640,000
Cost Based Ranking
5 3 4 1 2
Notes: 1. The discounted costs for the 35 year period are based on a discount rate of 4% pa. An analysis of long term bonds, inflation rates and Capital Index Bonds has indicated that this discount factor is appropriate for the current economic climate.
Renourishment of 7,000 m3 in situ equates to about
9,000 m3 uncompacted from external source.
6.3 Recommendations
Southern Beach
It is recommended that the present buffer (ie width of dune) protecting
Ocean Drive be increased through 17,000 m3 (in situ) of sand renourishment
and the dune be revegetated.
Following severe storm events which cause significant erosion of the
primary dune, sand renourishment should be undertaken on an as needed
basis.
Northern Beach
It is recommended that about 7,000 m3/year (in situ, ie. about 9,000 m
3/year
M P ROGERS & ASSOCIATES Quinns Beach Coastal Protection Works Report R060 Rev 0, Page 49
uncompacted truck volume) of sand renourishment is placed seawards of the
car park to maintain the beach.
It is also recommended that a seawall as shown in Figure 4.10B be
constructed to provide increased storm protection to the northern car park
and associated amenities.

7. References
M P ROGERS & ASSOCIATES Quinns Beach Coastal Protection Works Report R060 Rev 0, Page 50
Coastal Engineering Research Centre, 1984. Shore Protection Manual. US
Army Corps of Engineers.
de Neufville, R. and Stafford, J.H., 1971. Systems Analysis for Engineers
and Managers. McGraw-Hill Book Company (UK) Ltd, Maidenhead,
Berkshire, 1971
Department of Transport (WA), 1997. Unpublished Data: Plan Set
DOT 871. Department of Transport, Fremantle, Western Australia.
Department of Transport (WA), 1998a. Quinns Seawall Proposal -
Preliminary Investigation. Department of Transport, Fremantle,
Western Australia, May 1998.
Department of Transport (WA), 1998b. Quinns Foreshore - Review of the
December 1997 Survey Monitoring Results. Department of Transport,
Fremantle, Western Australia, November 1998.
Elliott, K., O'Connor, A. and Shepherd, R., 1986. A Pilot Study of Social
and Biophysical Attributes of the Perth Metropolitan Coast Between
Trigg Island and Sorrento Beach. Department of Geography,
University of Western Australia, 1986.
Evans, M. D. and Burgan, B. J., 1993. The Economic Value of the Adelaide
Metropolitan Beaches. Prepared for the Coast Protection Board, SA
Department of Environment and Land Management, by University of
Adelaide, May 1993.
Hassell et al, 1986. Adelaide Metropolitan Beaches - Beach User Study.
Prepared for the Coast Protection Board, Adelaide, by Hassell
Planning Consultants Pty Ltd & McGregor Harrison Marketing Pty
Ltd, July 1986.
Houghton, D.S., 1988. Beach Use in the Perth Metropolitan Area.
Prepared for the State Planning Commission, by Department of
Geography, University of Western Australia, July 1988.
Rogers & Associates, 1999. Quinns Beach Coastal Protection Works Stage
1 Report. Prepared for the Shire of Wanneroo by M P Rogers and
Associates Pty Ltd, January 1999.
South Australian Coastal Protection Board, 1993. Coastline - The Value of
the Adelaide Beaches. South Australian Coast Protection Board, SA
Department of Environment and Land Management, November 1993.
Smith Corporation, 1985. Environmental Review and Management
Program for: Mindarie Keys Project. Smith Corporation Pty Ltd,

M P ROGERS & ASSOCIATES Quinns Beach Coastal Protection Works Report R060 Rev 0, Page 51
March 1985.
Steedman Science & Engineering, 1988. Design Waves and Water Levels -
Mindarie Keys - Final Report Volume 1. Steedman Science &
Engineering, Perth, Western Australia, 1988.
Tremarfon Pty Ltd, 1997. Quinns Coastal Processes Study. Tremarfon Pty
Ltd, Perth, Western Australia, May 1997.
Water Research Laboratory, 1997. Collapsible Block Mattress, Wave
Flume Physical Model Testing. University of Sydney, Sydney, New
South Wales, October 1997.
Water Research Laboratory, 1997. Seabees for coastal and Embankment
Protection - Design Manual. University of Sydney, Sydney, New
South Wales, January 1997.
Woods, P.J., 1989. Coastal Development and Management Study - Quinns
Rocks North and Jindalee, City of Wanneroo. Prepared for
Department of Planning and Urban Development, City of Wanneroo,
and the owners of Superlots 1, 2, 5, 10 and 12, Wanneroo, by Peter J.
Woods and Associates, November 1989.

Figures
M P ROGERS & ASSOCIATES Quinns Beach Coastal Protection Works Report R060 Rev 0, Page 52
Figure 1.1 Location Diagram
Figure 4.1 Possible Future Erosion Contours for the Northern Beach
Figure 4.2 SBEACH Results - Northern Beach with Seawall & 25m Erosion (20 to 30 yr ARI)
Figure 4.3 SBEACH Results - Northern Beach with Seawall & 25m Erosion (50 to 100 yr ARI)
Figure 4.4 SBEACH Results - Northern Beach with Seawall & 35m Erosion (20 to 30 yr ARI)
Figure 4.5 Seawall Preliminary Design
Figure 4.6 SBEACH Results - Northern Beach with Seawall & Renourishment (20 to 30 yr ARI)
Figure 4.7 SBEACH Results - Northern Beach with Seawall & Renourishment (50 - 100 yr ARI)
Figure 4.8 Revetment Mattress Preliminary Design
Figure 4.9 Geotube Seawall Preliminary Design
Figure 4.10 Rubble Seawall Preliminary Design
Figure 4.11 Groyne / Headland Beach Angle Diagram
Figure 4.12 Groyne / Headland Configuration Diagram
Figure 4.13 SBEACH Results for Groyne/Headland Design (20 to 30 year ARI)
Figure 4.14 Groyne Preliminary Design
Figure 4.15 Headland Preliminary Design
Figure 6.1 Net Present Value of the Costs of the Management of the Southern Beach
Figure 6.2 Net Present Value of the Costs of the Management of the Northern Beach No.1
Figure 6.3 Net Present Value of the Costs of the Management of the Northern Beach No.2

M P ROGERS & ASSOCIATES Quinns Beach Coastal Protection Works Report R060 Rev 0, Page 53
Figure 1.1 - Location Diagram
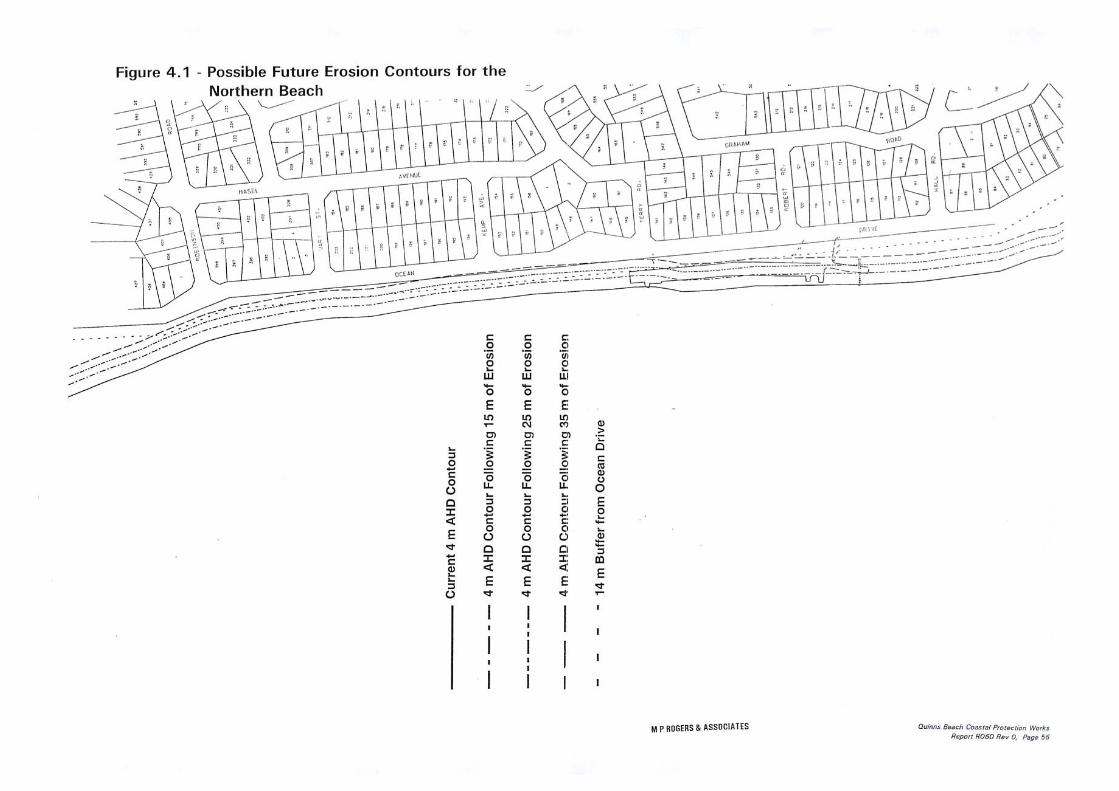
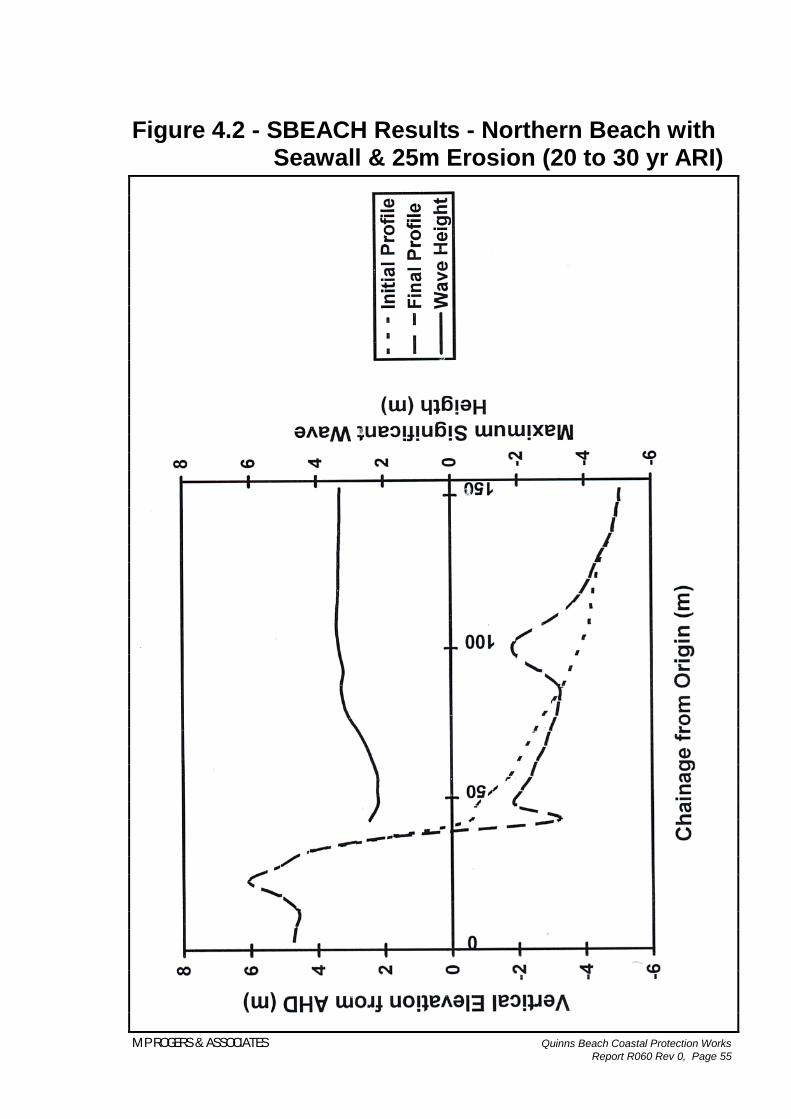
M P ROGERS & ASSOCIATES Quinns Beach Coastal Protection Works Report R060 Rev 0, Page 55
Figure 4.2 - SBEACH Results - Northern Beach with Seawall & 25m Erosion (20 to 30 yr ARI)

M P ROGERS & ASSOCIATES Quinns Beach Coastal Protection Works Report R060 Rev 0, Page 56
Figure 4.3 - SBEACH Results - Northern Beach with Seawall & 25m Erosion (50 to 100 yr ARI)
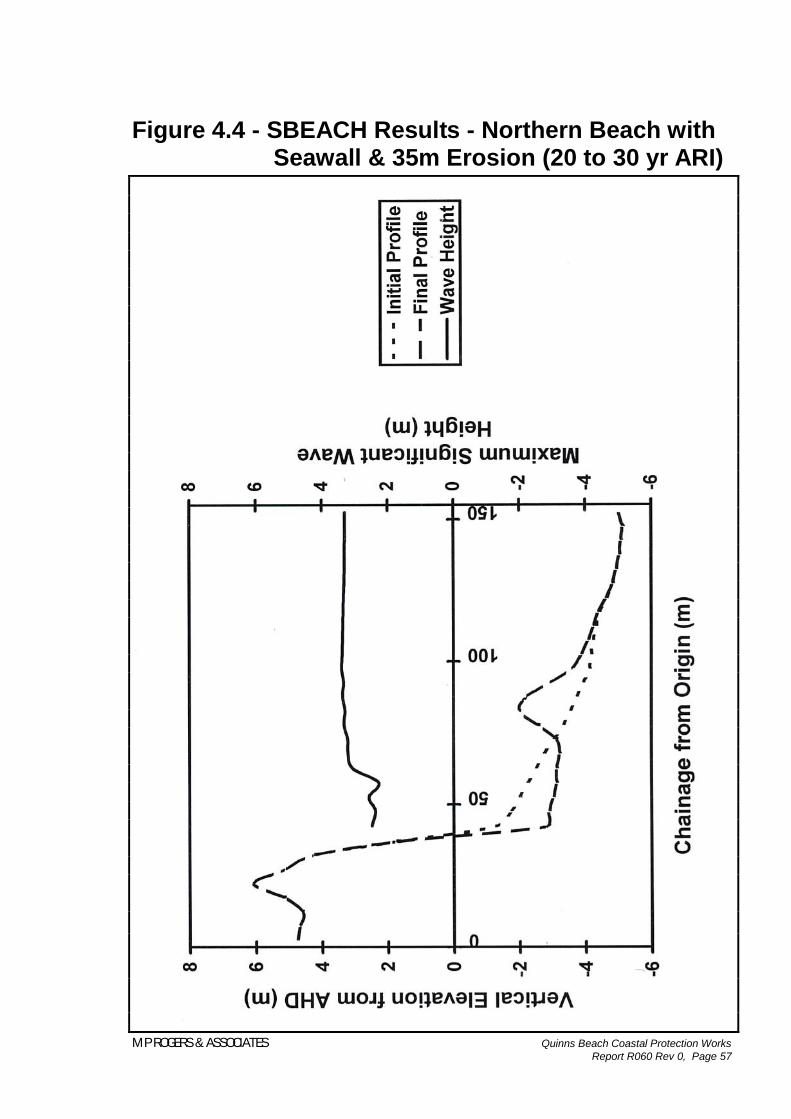
M P ROGERS & ASSOCIATES Quinns Beach Coastal Protection Works Report R060 Rev 0, Page 57
Figure 4.4 - SBEACH Results - Northern Beach with Seawall & 35m Erosion (20 to 30 yr ARI)

M P ROGERS & ASSOCIATES Quinns Beach Coastal Protection Works Report R060 Rev 0, Page 58
Figure 4.5 - Seawall Preliminary Design
Filter Layer:
0.85 m thick
Armour: 2 Layers
6t Limestone
2
1
3 m
-2.85 m AHD
6 m AHD
-2 m AHD
2
1
1 m AHD
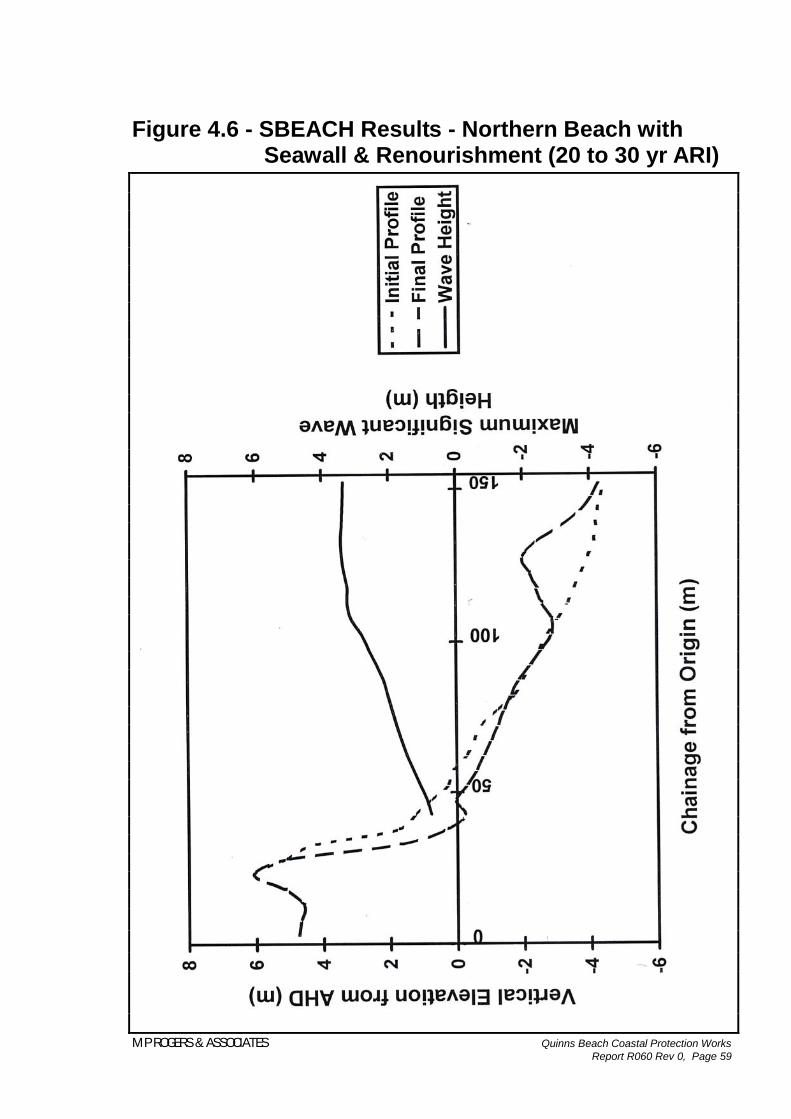
M P ROGERS & ASSOCIATES Quinns Beach Coastal Protection Works Report R060 Rev 0, Page 59
Figure 4.6 - SBEACH Results - Northern Beach with Seawall & Renourishment (20 to 30 yr ARI)

M P ROGERS & ASSOCIATES Quinns Beach Coastal Protection Works Report R060 Rev 0, Page 60
Figure 4.7 - SBEACH Results - Northern Beach with Seawall & Renourishment (50 - 100 yr ARI)

M P ROGERS & ASSOCIATES Quinns Beach Coastal Protection Works Report R060 Rev 0, Page 61
Figure 4.8 - Revetment Mattress Preliminary Design
4 m AHD
-1 m AHD
3 m AHD
1
2
1 m thick filter layer
1 m
2 m
16 m
4 m
Collapsible Block Mattress

M P ROGERS & ASSOCIATES Quinns Beach Coastal Protection Works Report R060 Rev 0, Page 62
Figure 4.9 - Geotube Seawall Preliminary Design
Geotube 35
Geotube 35
Scour Apron
2 m
2 m
4 m
4 m
-0.8 m AHD
3.8 m AHD

M P ROGERS & ASSOCIATES Quinns Beach Coastal Protection Works Report R060 Rev 0, Page 63
Figure 4.10 - Rubble Seawall Preliminary Designs
-1 m AHD
3.5 m AHD
2
1
Armour: 2 Layers
1t Limestone
Toe Protection: 2x2 Layers
1t Limestone
Filter Layer:
0.4 m thick
Filter Layer:
0.4 m thick
Armour: 2 Layers
1t Limestone
1.6 m
2
1 1.6 m
-2 m AHD
3.5 m AHD
Figure 5.5A - Standard Seawall
Figure 5.5B - Seawall with Reduced Depth and Armoured Toe

M P ROGERS & ASSOCIATES Quinns Beach Coastal Protection Works Report R060 Rev 0, Page 64
Figure 4.11 - Groyne / Headland Beach Angle
Diagram
Not to Scale
Mean Beach Angle Change ( 1 degree)
Maximum Seasonal Beach Angle Rotation ( 3-4 degrees)
20 m

M P ROGERS & ASSOCIATES Quinns Beach Coastal Protection Works Report R060 Rev 0, Page 65
Figure 4.12 - Groyne / Headland Configuration Diagram

M P ROGERS & ASSOCIATES Quinns Beach Coastal Protection Works Report R060 Rev 0, Page 66
Figure 4.13 - SBEACH Results - Northern Beach with Groynes / Headlands (20 to 30 year ARI)

M P ROGERS & ASSOCIATES Quinns Beach Coastal Protection Works Report R060 Rev 0, Page 67
Figure 4.14 - Groyne Preliminary Design
Note: 2 Layers of Armour on the sides, 1 Layer of Armour on the top.
SECTION B-B
SECTION C-C
SECTION A-A
4 m
5 m
10 m
14 m
4 m
10 m
16 m
26 m
PLAN
C
C
B
B
A A
-2.5 m CD
2 m CD 3.5 m CD
0 m CD 3 m CD
40 m 20 m
1.5 1
1.5
1
Core
0.4t Armour
5t Armour
3.5 m CD
2 m CD
-2.1 m CD
0 m CD
3 m CD
2 m CD
Sand

M P ROGERS & ASSOCIATES Quinns Beach Coastal Protection Works Report R060 Rev 0, Page 68
Figure 4.15 - Headland Preliminary Design
Note: 2 Layers of Armour on the front and ends, 1 Layer of Armour on the top
and rear.
30 m
5 m
A A
Core
5t Armour
Sand Fill
4 m
7 m
1.5
1
-2 m CD
2 m CD 3 m CD

M P ROGERS & ASSOCIATES Quinns Beach Coastal Protection Works Report R060 Rev 0, Page 69
Figure 6.1 - Net Present Value of the Costs of the Management of the Southern Beach
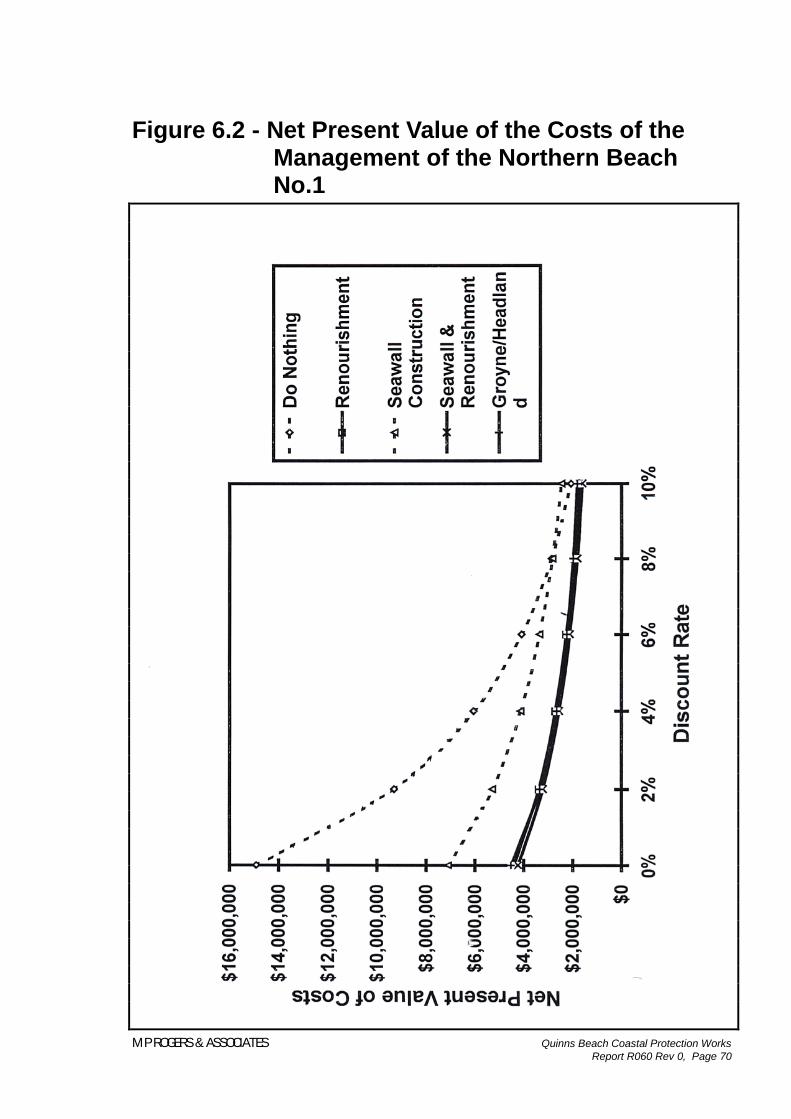
M P ROGERS & ASSOCIATES Quinns Beach Coastal Protection Works Report R060 Rev 0, Page 70
Figure 6.2 - Net Present Value of the Costs of the Management of the Northern Beach No.1

M P ROGERS & ASSOCIATES Quinns Beach Coastal Protection Works Report R060 Rev 0, Page 71
Figure 6.3 - Net Present Value of the Costs of the Management of the Northern Beach No.2
Appendix A - Discounted Cost Analysis of Options
M P ROGERS & ASSOCIATES Quinns Beach Coastal Protection Works Report R060 Rev 0, Page 72

M P ROGERS & ASSOCIATES Cables Artificial Surf Reef, Wave Climate Study
Report R057 Rev 1, Page 73

M P ROGERS & ASSOCIATES Cables Artificial Surf Reef, Wave Climate Study
Report R057 Rev 1, Page 74

M P ROGERS & ASSOCIATES Cables Artificial Surf Reef, Wave Climate Study
Report R057 Rev 1, Page 75
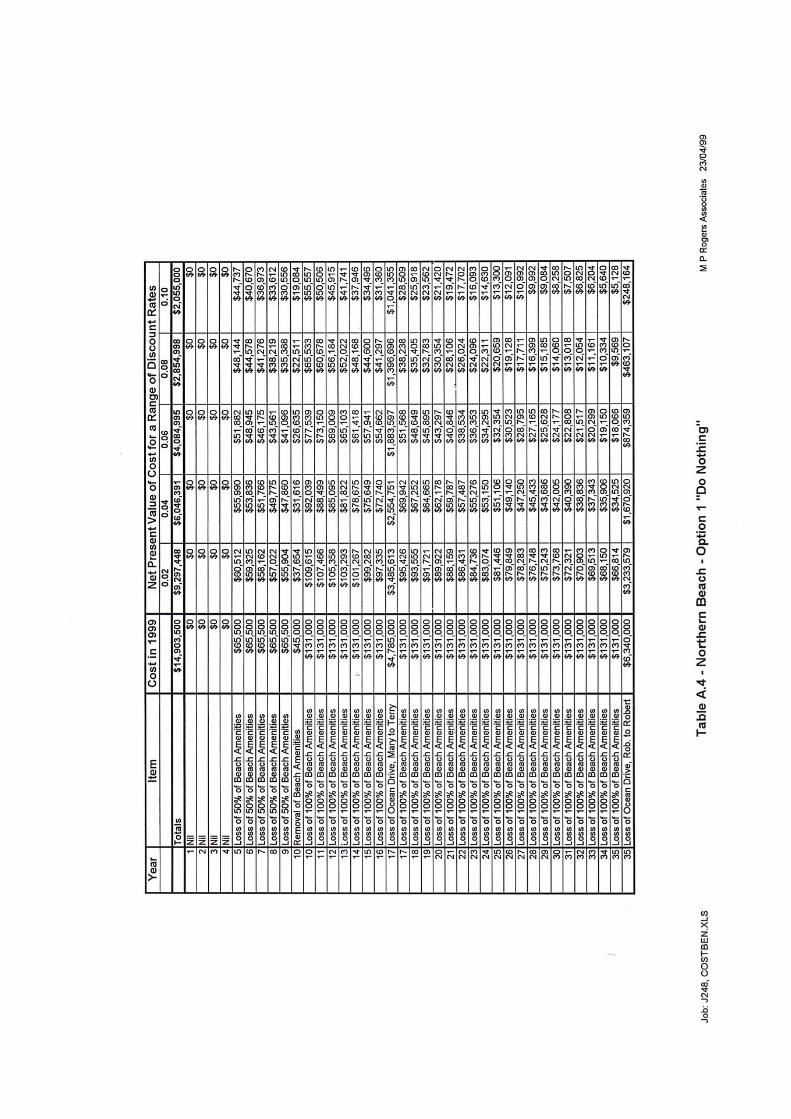
M P ROGERS & ASSOCIATES Cables Artificial Surf Reef, Wave Climate Study
Report R057 Rev 1, Page 76

M P ROGERS & ASSOCIATES Cables Artificial Surf Reef, Wave Climate Study
Report R057 Rev 1, Page 77

M P ROGERS & ASSOCIATES Cables Artificial Surf Reef, Wave Climate Study
Report R057 Rev 1, Page 78

M P ROGERS & ASSOCIATES Cables Artificial Surf Reef, Wave Climate Study
Report R057 Rev 1, Page 79

M P ROGERS & ASSOCIATES Cables Artificial Surf Reef, Wave Climate Study
Report R057 Rev 1, Page 80

M P ROGERS & ASSOCIATES Cables Artificial Surf Reef, Wave Climate Study
Report R057 Rev 1, Page 81

Appendix B – Public Meeting 7/9/99 Minutes
M P ROGERS & ASSOCIATES Quinns Beach Coastal Protection Works Report R060 Rev 0, Page 84

M P ROGERS & ASSOCIATES Cables Artificial Surf Reef, Wave Climate Study
Report R057 Rev 1, Page 83

M P ROGERS & ASSOCIATES Cables Artificial Surf Reef, Wave Climate Study
Report R057 Rev 1, Page 84

M P ROGERS & ASSOCIATES Cables Artificial Surf Reef, Wave Climate Study
Report R057 Rev 1, Page 85

M P ROGERS & ASSOCIATES Cables Artificial Surf Reef, Wave Climate Study
Report R057 Rev 1, Page 86

M P ROGERS & ASSOCIATES Cables Artificial Surf Reef, Wave Climate Study
Report R057 Rev 1, Page 87

M P ROGERS & ASSOCIATES Cables Artificial Surf Reef, Wave Climate Study
Report R057 Rev 1, Page 88

M P ROGERS & ASSOCIATES Cables Artificial Surf Reef, Wave Climate Study
Report R057 Rev 1, Page 89

M P ROGERS & ASSOCIATES Cables Artificial Surf Reef, Wave Climate Study
Report R057 Rev 1, Page 90