Quick Cash Flow Projections - University Of Illinois · 2006-08-29 · Fast Tools & Resources Quick...
17
Fast Tools & Resources Quick Cash Flow Projections The Quick Cash Flow Projections tool assists farm operators in projecting cash needs, farm profitability, and debt servicing capabilities. The program also aids users in performing sensitivity analysis. This tool generates a quarterly cash flow projection for the upcoming crop year and allows the user to perform sensitivity analysis on assumptions made in expense and revenue estimates. The program is designed for farm data to be entered in a streamlined, step-by-step process. The user chooses the level of detail to include in the model to generate cash flow projections. Revenue and expense items for the upcoming year can be estimated from the previous year’s actual data, based on University of Illinois projected crop budgets, or entered directly by the user. This program description documents all input sections of the tool. However, this does not mean that each data-entry screen must be completed depending on how the user wants to project cash flows. Data entry begins with the below Setup Screen. This page asks for selected user information. The default parameters allow the user to incorporate crop budgets from the Illinois Farm Business Farm Management (FBFM) Association. Selecting an Illinois region in the Cost Budget input enters the default budget for that region. The user can begin the analysis with this budget data and make changes based on cost and revenue projections specific to the farm operation.
Transcript of Quick Cash Flow Projections - University Of Illinois · 2006-08-29 · Fast Tools & Resources Quick...

Fast Tools & Resources
Quick Cash Flow Projections
The Quick Cash Flow Projections tool assists farm operators in projecting cash needs, farm profitability, and debt servicing capabilities. The program also aids users in performing sensitivity analysis.
This tool generates a quarterly cash flow projection for the upcoming crop year and allows the user to perform sensitivity analysis on assumptions made in expense and revenue estimates. The program is designed for farm data to be entered in a streamlined, step-by-step process. The user chooses the level of detail to include in the model to generate cash flow projections. Revenue and expense items for the upcoming year can be estimated from the previous year’s actual data, based on University of Illinois projected crop budgets, or entered directly by the user. This program description documents all input sections of the tool. However, this does not mean that each data-entry screen must be completed depending on how the user wants to project cash flows. Data entry begins with the below Setup Screen. This page asks for selected user information.
The default parameters allow the user to incorporate crop budgets from the Illinois Farm Business Farm Management (FBFM) Association. Selecting an Illinois region in the Cost Budget input enters the default budget for that region. The user can begin the analysis with this budget data and make changes based on cost and revenue projections specific to the farm operation.

Fast Tools & Resources
Click to move to the next screen where crop enterprises are entered. Each worksheet has a Next button that takes the user to the succeeding page. Program Navigation
The menu button shown above aids in guiding the user through the program. Clicking this button lists the sections of the spreadsheet, as well as printing options and a choice to clear all input data from the tool. This menu is a toolbar located in the upper left corner of the computer screen. Setup Crop Enterprises The user enters the different crops produced by the farm operation in this worksheet.
Clicking expands the list of enterprises to choose from. To select a crop, enter “1” in the # of budgets (farms) column for the specific enterprise. The user may prepare multiple budgets for each enterprise selected. For example, the above screen shot shows that two budgets are to be designed for corn and soybeans. This indicates that the user wants to assign different cost and revenue estimates for two different collections of farmland.
Clicking and reveals the yield and cost defaults for corn and soybeans. This data is based on the selections made in the Default Parameters section of the Setup worksheet. The user can edit this information in the Production and Per-Acre Cost Parameters worksheet explained on the following page. Options for Entering Crop and Whole Farm Expenses The program provides the user with three methods for recording cost projections for the upcoming year. The user can use all three methods to enter cost data, compare the expense projections, and determine which estimate to use for each cost item. This procedure is conducted in the Projected Expenses worksheet.
Next >>>

Fast Tools & Resources
Per Acre Basis Crop and whole farm expenses can be entered on a per acre basis. The user can start by using a FBFM default budget and edit cost items where desired. This process is described on the following page. Last Year’s Costs The previous year’s actual crop and whole farm expenses can be entered. The user can use these cost items as next year’s projections or specify a percent increase or decrease for the upcoming year. This procedure is explained further in the Previous Year’s Cash Expenses section of this program description. Budgeted Total Costs The final method for recording cost data is to enter projections for the upcoming year’s crop directly into the program. This process is described in more detail in the Projected Expenses section of this document. Production and Per-Acre Cost Parameters This section of the program asks for farmland information and yield projections. Furthermore, the user can enter per-acre cost estimates.
The above screen shows where the user enters the number of acres operated for each enterprise under the various farmland control options. In addition, the user can enter cash rental rates and the operator’s portion of crop-shared acres. Two lines are provided for each commodity, as indicated on the crop enterprises setup page. This example shows that the user wants to enter different production and cost data for the Jones Farm. That is, budget information specific to the Jones Farm is entered, while the remaining farms operated are bunched together and assigned cost and yield estimates collectively.
Clicking returns the user to the crop enterprises setup worksheet where additional crops and/or budgets can be inserted.

Fast Tools & Resources
Clicking inserts expected production, estimated using FBFM data, for the upcoming year and historical county yield lows in the program. Yield data are derived for the county entered in the Default Parameters section of the setup page. The user can change the yield parameters to reflect his or her own projections and historical data.
Clicking enters the default cost budget for the Illinois region specified in the Default Parameters section of the setup worksheet. Default crop and whole farm cost projections are estimated from FBFM records.
Clicking reveals the default cost data and allows the user to edit crop and whole farm expenses. The below graphic displays a portion of this crop budget screen. The user can change the cost values, as well as the operator’s percentage share of the expense items.
Expected Crop Prices and Sales The next section of the program asks for the user’s grain marketing plan for the upcoming year. The top portion of the screen shot on the following page allows entry of beginning inventory - units (bushels remaining from the previous year’s crop), beginning inventory (the per-unit dollar value of that inventory), and the expected average price for each quarter of the upcoming year. The user should incorporate the collection of LDP’s into the quarterly price estimations if appropriate.

Fast Tools & Resources
The midsection of the above worksheet asks for the expected number of units sold for each quarter of the forthcoming year. The bottom portion of the worksheet computes expected quarterly sales in dollars. Government Payment Parameters The Cash Flow Projections tool accounts for government farm program payments in the cash flow analysis. The below screen shows the entry for base acres and program yields for each enterprise. The worksheet provides the loan rate, target price, and direct payment rate. However, the user can change these values to examine the financial implications of possible changes to farm bill payments.
The above example lists two commodities. Selecting the “Enter commodity” cell allows the user to display additional enterprises or enter more than one row per commodity if different program yields and base acres are needed for the same commodity. The far right column titled “Estimated Payments DP & CC” totals the expected direct and counter-cyclical payments received. Counter-cyclical payments are based on the price in the Season Average Price column. This average is calculated from the expected quarterly prices discussed above.

Fast Tools & Resources
The next section of the government payments worksheet, shown below, accounts for payments earned during the previous year but not received until the following year. In this example, $22,936 in farm bill payments was earned from the 2005 crop but will not be received until the third quarter in 2006, as indicated. These receivables are typically counter-cyclical payments owed for the previous year’s crop. In addition, this section allows to user to determine the timing of receiving the upcoming year’s government program payments by allocating the percentage received in each quarter. Setup Bank and Loan Accounts This section of the program asks the user for checking and savings account balances, as well as operating loan information. The tool is designed so that money used for the farm operation for the upcoming year is drawn from the checking account first. Once this source reaches its minimum cash balance, as determined by the user, funds are withdrawn from the savings account until reaching the minimum savings balance. From this point on, money needed is borrowed from the operating loan.

Fast Tools & Resources
Operating loan information includes the current loan balance and interest accrued on the note as of the time the cash flow projection is prepared. The input asking “Pay balance and accrued interest 1st quarter?” specifies if the previous year’s operating note is paid off at the end of the year and a new loan starts at the beginning of the upcoming year. If so, select “yes” for this entry. The final input in this section asks for expected total depreciation for the upcoming year. This information is used in preparing a projected accrual income statement. Loan Details The program asks for information on term loans and capital leases. The user specifies the number of lines needed for data entry. Next, the worksheet, shown below, asks for the current outstanding balance, interest rate, and years remaining on each loan. The program can calculate the upcoming year’s total loan payment for each note, as well as compute the interest and principal portions. The user can also choose to directly enter the loan payment data.

Fast Tools & Resources
Previous Year’s Cash Income The below worksheet allows entry of the previous year’s actual cash income. The user can choose to enter this data and use it as a base for projecting next year’s cash income. This step is outlined in the Projected Income section of this document.
Clicking reveals two columns for entering the farm business’ account receivables for the beginning and end of the previous year. This information is used in preparing a projected accrual income statement for the upcoming year.

Fast Tools & Resources
Previous Year’s Cash Expenses The screenshot below reflects a portion of the worksheet where the user can enter last year’s actual cash expenses in the Total Cash Expense column. Entering last year’s actual crop and whole farm costs allows the user to project next year’s expenses from this historical data. This represents one of the three methods for estimating next year’s expenses.
Clicking and reveals columns where the user can enter the values of prepaid expenses and account payables for the beginning and end of the year. The program computes accrual expenses based on last year’s actual cash expenses, prepaid expenses, and account payables, seen in the Accrual Expenses column (shaded blue). In addition, the tool calculates per-acre costs based on both total tillable acres and operator acres. Cost per operator acre measures the farm operator’s costs over acres the operator generates revenue from. For example, if the farmer operates ground under a 50-50 share rent arrangement, half of the acres farmed under this agreement are operator acres.

Fast Tools & Resources
Projected Income The entry page shown below allows the user to estimate revenue for the upcoming year. There are two methods for developing these projections:
1. The user can use last year’s income, entered in the Previous Year’s Cash Income worksheet, as a starting point and choose to change these values by a specified percentage level or use last year’s numbers. Percent increases or decreases are entered in the Proposed % Increase column. The Default Value column states next year’s projections based on last year’s revenue figures adjusted for percentage changes specified by the user.
2. The second method for forecasting next year’s income is to enter
estimates directly in the Override Value column. An entry overrides, or shades, the accompanying figure in the Default Value column and is used in income projections for the upcoming year. If the user wants to eliminate an income source from last year for next year’s projection, type “0” in that item’s cell in the Override Value column. In the below example, last year’s crop insurance payments totaled $7,500. The user does not want to rely on this revenue source for the upcoming year, so “0” is entered in the Override Value column, which produces a dash in that cell, as seen below.
The Accrual Income column reports the final revenue projections used in the cash flow analysis.

Fast Tools & Resources
Clicking reveals a data-entry column for the user to enter projected account receivables for the end of the upcoming year. Projected Expenses The Projected Expenses worksheet allows the user to specify cost projections for the next year. A portion of the input screen is shown below.
Similar to the Projected Income page, the user can choose from three methods to estimate each crop and whole farm expense item:
1. The From Per Acre Budget Info column reports expenses entered by the user in the Production and Per-Acre Cost Parameters section of the tool. This represents the FBFM default cost budget inserted in the program and reflects any changes made by the user to cost items. To use this method to project an expense item, select “Per Acre” in the Base Calculation column. This operation shades the value in the Last Year column (this is last year’s cost for this expense item as entered in the Previous Year’s Cash Expenses section) and reports the budget value in the Base Value column. In the above example, the estimated herbicide expense for the upcoming year is based on the budget information.

Fast Tools & Resources
2. The user can also choose to enter last year’s actual cost as a projection for next year by selecting “Last Year” in the Base Calculation column, which shades the value in the From Per Acre Budget Info column. The Proposed % Increase column allows the user to adjust this cost by specifying the percent increase or decrease for next year’s estimate. The final value used in the cash flow analysis is reported in the Base Value column. The above example shows that last year’s actual cost for machine hire/lease plus a 3% increase is used as the base value for projecting this cost item.
3. The third method for forecasting a crop or whole farm expense item is to
enter the estimate directly in the Override Value column. This shades the figure in the Base Value column and incorporates this override value into the cash flow analysis. The example on the previous page shows an override value entry of $18,000 for labor costs.
If an expense incurred last year or reported in the budget will not exist next year, enter “0” in the Override Value column for that cost item to remove it from the projection analysis.
Clicking and reveals columns where the user can enter end-of-year prepaid expense and account payable estimates for the upcoming year. This information is used in the preparation of a projected accrual income statement. The table to the right displays cost projections for the next year (Accrual Expense column), forecasted per-acre costs, and the percent change in expenses from last year to the upcoming year. Furthermore, total acres farmed and operator acres are reported. Operator acres represent the acres the farm operator generates revenue from.

Fast Tools & Resources
Distribution of Projected Expenses and Income This section of the program allows the user to determine the quarterly distribution of expense and revenue items for the upcoming year. The screen shot below represents a portion of this worksheet.
In the Distribution of Cash Flow column, select the cell for the corresponding farm expense or income item to choose the timing of cash flows. The program reports the distribution in the quarter columns. Cash Flow Projection Reports The tool generates the following documents: Quarterly Cash Flow The Quarterly Cash Flow report lists projected expense and revenue figures for each quarter of the upcoming year. Total cash flows for the year are computed and compared to the previous year. Term Debt Coverage A capital replacement and term debt repayment margin is estimated. This figure indicates the ability of the farm business to satisfy all financial obligations by stating the amount left over after paying all farm and family living expenses and servicing all debt commitments for the year. A negative value signifies the inability of the business to meet all financial demands, while a positive value indicates a surplus of funds.
Fast Tools & Resources
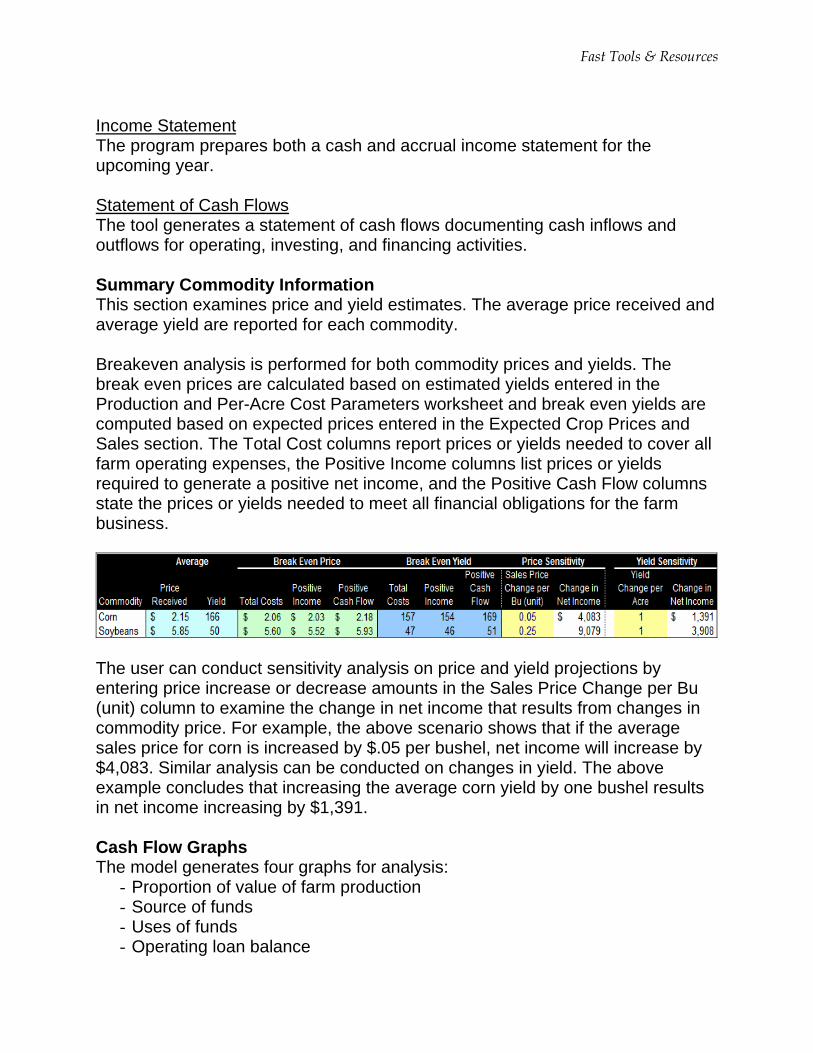
Income Statement The program prepares both a cash and accrual income statement for the upcoming year. Statement of Cash Flows The tool generates a statement of cash flows documenting cash inflows and outflows for operating, investing, and financing activities. Summary Commodity Information This section examines price and yield estimates. The average price received and average yield are reported for each commodity. Breakeven analysis is performed for both commodity prices and yields. The break even prices are calculated based on estimated yields entered in the Production and Per-Acre Cost Parameters worksheet and break even yields are computed based on expected prices entered in the Expected Crop Prices and Sales section. The Total Cost columns report prices or yields needed to cover all farm operating expenses, the Positive Income columns list prices or yields required to generate a positive net income, and the Positive Cash Flow columns state the prices or yields needed to meet all financial obligations for the farm business.
The user can conduct sensitivity analysis on price and yield projections by entering price increase or decrease amounts in the Sales Price Change per Bu (unit) column to examine the change in net income that results from changes in commodity price. For example, the above scenario shows that if the average sales price for corn is increased by $.05 per bushel, net income will increase by $4,083. Similar analysis can be conducted on changes in yield. The above example concludes that increasing the average corn yield by one bushel results in net income increasing by $1,391. Cash Flow Graphs The model generates four graphs for analysis:
- Proportion of value of farm production - Source of funds - Uses of funds - Operating loan balance

Fast Tools & Resources
Sensitivity Analysis The tool allows the user to conduct in-depth sensitivity analysis on the assumptions made in the cash flow projection. Up to three different scenarios can be examined side-by-side. Below is a portion of the Sensitivity Analysis page where changes to cash flow estimates are entered.
For each scenario, the user can adjust yields, sales prices, and farm expense and revenue figures. Yields and sales prices can be changed for all enterprises or for specific commodities. For example, to change the corn yield projection, highlight the cell in the Yields column and the Corn row and choose from the list of possible changes to test. The same procedure applies to entering changes in price. The above example shows three possible outcomes:
- Scenario 1: 1 in 4 year yield decline - Scenario 2: 1 in 10 year yield decline - Scenario 3: 1 in 20 year yield decline
To change farm expenses and income, enter the percent increase or decrease in the Change % column. The resulting dollar change is reported in the Change $ column.

Fast Tools & Resources
Sensitivity Report Results from the sensitivity analysis are reported in the below screen. The Baseline column represents the assumptions made in the cash flow projections. The remaining columns report the financial implications of the three scenarios developed on the previous page.
In the example above, if expenses are incurred and income is earned as outlined in the cash flow estimates, net farm income before taxes will be $33,321, as seen in the Baseline column. However, if Scenario 1 occurs, net farm income before taxes will be -$11,678. Net farm income declines even more if Scenarios 2 and 3 materialize. Similar comparisons can be made with the other financial performance indicators. Because key assumptions are made in the initial cash flow plan, this tool allows the user to expose the financial health of the farm business to the possibility of projections not being accurate.

Fast Tools & Resources
Break Even Price and Yield Combinations The final section of the program extends the breakeven analysis previously discussed. The results reported are the same calculations made in the Summary Commodity Information worksheet. However, the below screen shows that the user can fix price and/or yield figures for each commodity in the present section. That is, if the user is confident of receiving a certain sales price and/or raising a specific yield, entering these values in the Fix Price or Fix Yield columns and
clicking calculates break even prices and yields based on the price and yield entries.