Queensland Comparable Assessment Tasks (QCATs) 2012 Model ... · Queensland Comparable Assessment...
16
Given name: . . . . . . . . . . . . . . . . . . . . . . . . . . . . . . . . . . . . . . . . . . . . . . . . . . . . . . . . . . . . . . . . . . . . . Family name: . . . . . . . . . . . . . . . . . . . . . . . . . . . . . . . . . . . . . . . . . . . . . . . . . . . . . . . . . . . . . . . . . . . . . School: . . . . . . . . . . . . . . . . . . . . . . . . . . . . . . . . . . . . . . . . . . . . . . . . . . . . . . . . . . . . . . . . . . . . . . . . . . Science Queensland Comparable Assessment Tasks (QCATs) 2012 6 Model behaviour Student booklet
-
Upload
phungtuong -
Category
Documents
-
view
219 -
download
0
Transcript of Queensland Comparable Assessment Tasks (QCATs) 2012 Model ... · Queensland Comparable Assessment...
Given name: . . . . . . . . . . . . . . . . . . . . . . . . . . . . . . . . . . . . . . . . . . . . . . . . . . . . . . . . . . . . . . . . . . . . .
Family name: . . . . . . . . . . . . . . . . . . . . . . . . . . . . . . . . . . . . . . . . . . . . . . . . . . . . . . . . . . . . . . . . . . . . .
School: . . . . . . . . . . . . . . . . . . . . . . . . . . . . . . . . . . . . . . . . . . . . . . . . . . . . . . . . . . . . . . . . . . . . . . . . . .
ScienceQueensland Comparable Assessment Tasks (QCATs) 2012 6Model behaviourStudent booklet

2
Setting the scene
Weather is a “snapshot” of the atmosphere at a particular time.
Wind is a key feature of the weather.
How does the wind affect us and our environment?
Use these images below to discuss how the wind affects us and our environment.
| QCATs 2012 Student booklet Year 6 Science

What causes the wind to move?Together read the ideas of the students below.
In the space provided write one of your ideas about the wind and what causes it to move.
Discuss your ideas with your class.
The wind is caused by processes we cannot see.
In Science we can model processes in nature to help explain the weather we observe, such as wind.
Discuss some models you have used in class to show features of weather or other phenomena such as electric currents, earthquakes, our solar system or erosion.
How were the models similar to and different from nature?
In this assessment, you will:• model two ways fluids move in nature• explain wind patterns and wind speed in nature• explain cyclone data and observations• describe the effects of cyclones on the environment• describe how new technology can reduce the impacts of cyclones.
Rotation of the earthmight cause wind. How can we
investigatethe wind?
Trees makethe wind move.
Storms and cyclonescause wind.
© The State of Queensland (QSA) 2012 Please read our copyright notice <www.qsa.qld.edu.au/copyright.html>.Queensland Studies Authority PO Box 307 Spring Hill Qld 4004Phone: (07) 3864 0299 Fax: (07) 3221 2533 Email: [email protected] Website: www.qsa.qld.edu.auImages p. 2 Beach erosion: <www.123rf.com/photo_7637530_beach-erosion-a-dead-tree-on-the-beach.html>; Wind surfer: <www.123rf.com/photo_10577497_windsurfing-champion-playing-in-the-waves.html>; Wind farm: Drew Broadley, “Wind farm” <www.sxc.hu/browse.phtml?f=view&id=395675>; Wave: <www.123rf.com/photo_8647503_rough-windswept-waves-off-the-south-african-shore.html>; Cyclone from space: <www.123rf.com/photo_9396382_cyclone.html>; p. 6 Photo: <www.123rf.com/photo_3811402_engineer-at-wind-farm-portrait.html>; p. 13 Satellite image: Satellite image(s) originally processed by the Bureau of Meteorology from the geostationary meteorological satellite MTSAT-2 operated by the Japan Meteorological Agency; p. 15 Photo: www.123rf.com/photo_8026232_asian-business-woman-outdoors-in-thailand.html.All other images © QSA.
| 3Queensland Studies Authority

4
Modelling weather: Wind
Investigation 1: Modelling how fluids move
Investigate: How can we model one way fluids (water and air) move in nature?
Materials:
• transparent container• dropper• 2 cups• 700 mL room temperature (tap water)• 200 mL hot water• 2 mL tap water (coloured red)• ice cube frozen with paperclip (coloured blue)
Procedure: Follow your teacher’s safety instructions and the steps below to set up a model in your group.
1. Fill the transparent container with tap water. Keep the container and water still until there is no movement.
2. Carefully fill one cup with hot water and the other cup with tap water.
3. Place the cups next to each other.
4. Slowly lift the plastic container onto the cups, keeping the water as still as possible.
5. Carefully hang the paperclip with ice over the edge of the container above the room temperature cup.
6. Use a dropper to gently squeeze the red water onto the bottom of the container above the hot water cup.
Observe: At eye level, observe the movement of the blue and red water for 2–3 minutes.
A fluid is a substance that can flow, such as water (a liquid) and air (a gas).
red colouredwater
blue colouredice cube
hotwater
roomtemperature
water
Recall that heat moves from one object to another.
In this model heat moves from the heat source (hot water) to the fluid above.
| QCATs 2012 Student booklet Year 6 Science

1. Complete the scientific diagram below to record your observations of how the cool (blue) and warm (red) water moved in the container.
2. Describe the pattern of each fluid’s movement.
Warmer fluid . . . . . . . . . . . . . . . . . . . . . . . . . . . . . . . . . . . . . . . . . . . . . . . . . . . . . . . . . . . . . . . . . . . . . . . . .
. . . . . . . . . . . . . . . . . . . . . . . . . . . . . . . . . . . . . . . . . . . . . . . . . . . . . . . . . . . . . . . . . . . . . . . . . . . . . . . . . . . .
Cooler fluid . . . . . . . . . . . . . . . . . . . . . . . . . . . . . . . . . . . . . . . . . . . . . . . . . . . . . . . . . . . . . . . . . . . . . . . . . .
. . . . . . . . . . . . . . . . . . . . . . . . . . . . . . . . . . . . . . . . . . . . . . . . . . . . . . . . . . . . . . . . . . . . . . . . . . . . . . . . . . . .
Work individually to answer the following questions.
container
cup
Hint: Use arrows to show movement of fluids.
| 5Queensland Studies Authority

6
Explaining wind patterns
Group discussion
With your class compare convection in the model with convection in nature:
• Draw lines to label the diagrams below.
• Complete these sentences using words from the box and the diagram above.
In the model, the heat source is the . . . . . . . . . . . . . . . . . . . . . . . . . . . . . . . . . . . . . . . . . . . . . . . . . . .
In nature the heat source can be the . . . . . . . . . . . . . . . . . . . . . or the . . . . . . . . . . . . . . . . . . . . . . .
In both the model and nature, heat moves from the heat source to the . . . . . . . . . . . . . . . . . above
and causes it to move. This movement of fluids is called convection.
Convection
wind.
is the movement of fluids caused by
differences in temperature.
In nature, warm land and ocean warm the air above.
When air moves we call it
Engineer, wind farm
Hint: Each label may be joined to one or both diagrams.
Convection in Model 1 Convection in natureLabels
convection in water
convection in air
heat source
land ocean wind hot water fluid
| QCATs 2012 Student booklet Year 6 Science
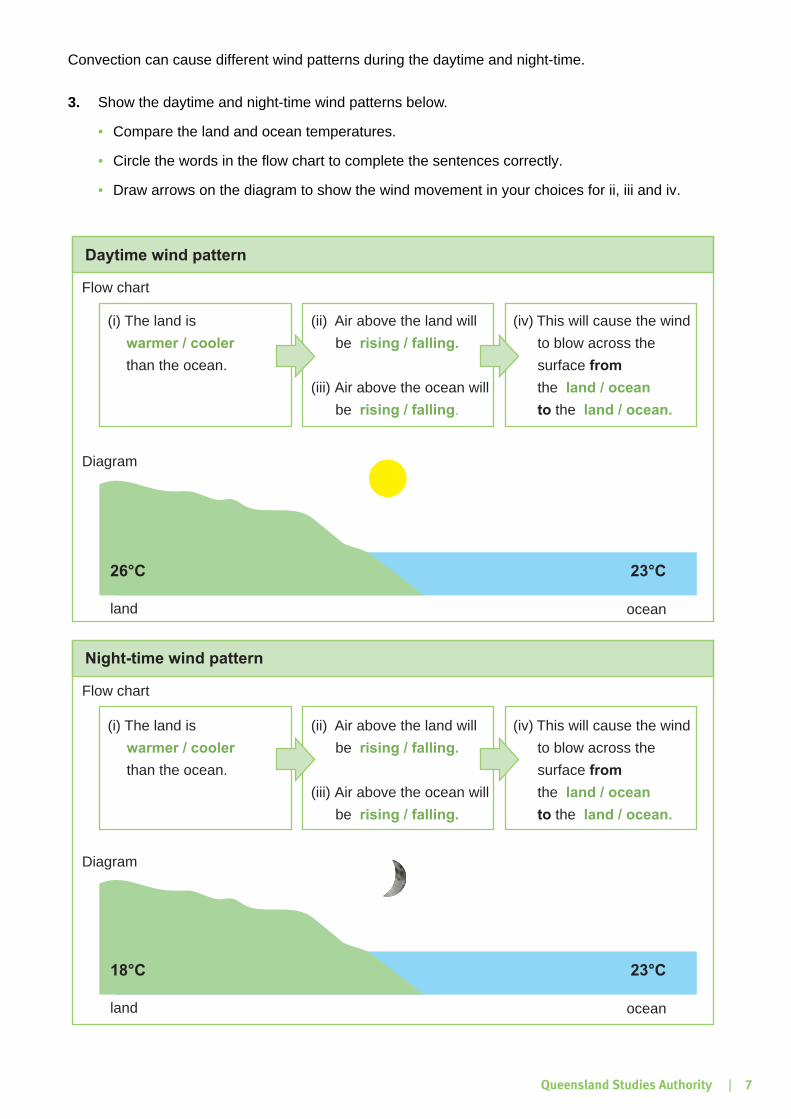
Convection can cause different wind patterns during the daytime and night-time.
3. Show the daytime and night-time wind patterns below.
• Compare the land and ocean temperatures.
• Circle the words in the flow chart to complete the sentences correctly.
• Draw arrows on the diagram to show the wind movement in your choices for ii, iii and iv.
Night-time wind pattern
(i) The land is
than the ocean.
warmer / cooler
(ii) Air above the land will
be
(iii) Air above the ocean will
be
rising / falling.
rising / falling.
(iv)
the
the
This will cause the wind
to blow across the
surface from
to
land / ocean
land / ocean.
Daytime wind pattern
(i) The land is
than the ocean.
warmer / cooler
(ii) Air above the land will
be
(iii) Air above the ocean will
be
rising / falling.
rising / falling.
(iv) This will cause the wind
to blow across the
surface
the
the
from
to
land / ocean
land / ocean.
land
Diagram
Flow chart
Diagram
Flow chart
ocean
26°C 23°C
land ocean
18°C 23°C
| 7Queensland Studies Authority
8
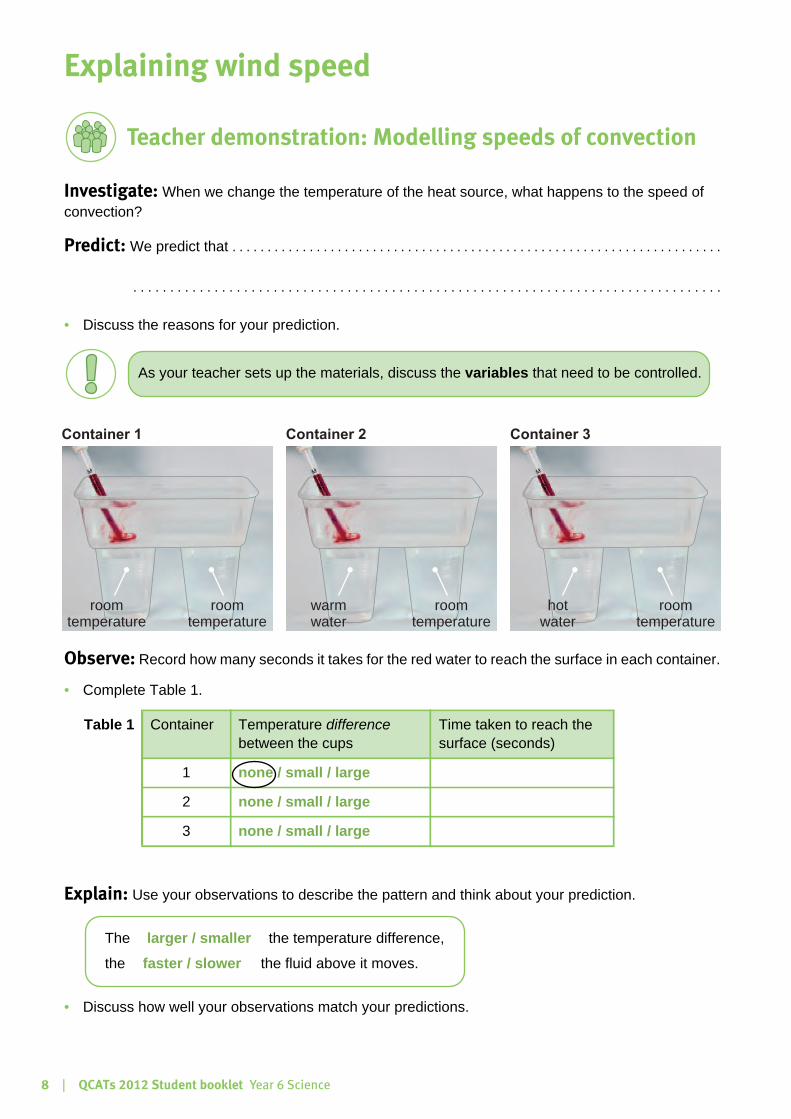
Explaining wind speed
Teacher demonstration: Modelling speeds of convection
Investigate: When we change the temperature of the heat source, what happens to the speed of convection?
Predict: We predict that . . . . . . . . . . . . . . . . . . . . . . . . . . . . . . . . . . . . . . . . . . . . . . . . . . . . . . . . . . . . . . . . . . . . . .
. . . . . . . . . . . . . . . . . . . . . . . . . . . . . . . . . . . . . . . . . . . . . . . . . . . . . . . . . . . . . . . . . . . . . . . . . . . . . . . .
• Discuss the reasons for your prediction.
Observe: Record how many seconds it takes for the red water to reach the surface in each container.
• Complete Table 1.
Explain: Use your observations to describe the pattern and think about your prediction.
• Discuss how well your observations match your predictions.
Table 1 Container Temperature difference between the cups
Time taken to reach the surface (seconds)
1 none / small / large
2 none / small / large
3 none / small / large
As your teacher sets up the materials, discuss the variables that need to be controlled.
Container 1 Container 2 Container 3
roomtemperature
roomtemperature
warmwater
roomtemperature
hotwater
roomtemperature
The larger / smaller the temperature difference,
the faster / slower the fluid above it moves.
| QCATs 2012 Student booklet Year 6 Science
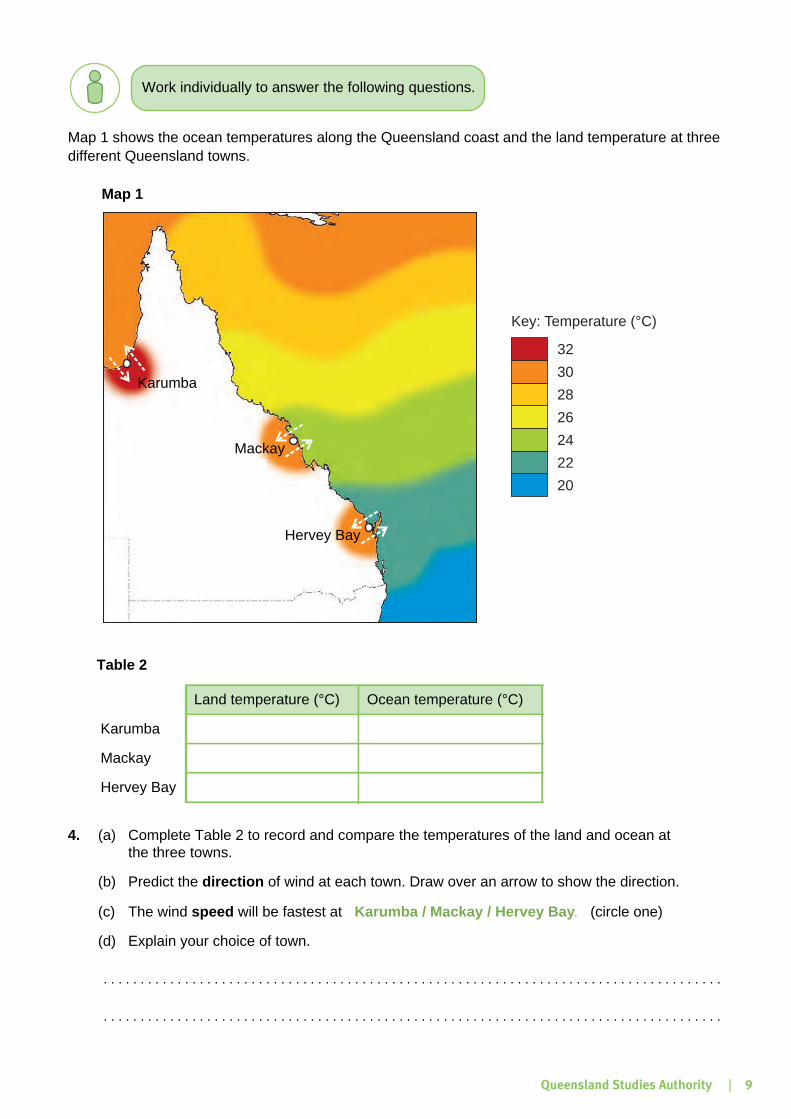
Map 1 shows the ocean temperatures along the Queensland coast and the land temperature at three different Queensland towns.
Table 2
4. (a) Complete Table 2 to record and compare the temperatures of the land and ocean at the three towns.
(b) Predict the direction of wind at each town. Draw over an arrow to show the direction.
(c) The wind speed will be fastest at Karumba / Mackay / Hervey Bay. (circle one)
(d) Explain your choice of town.
. . . . . . . . . . . . . . . . . . . . . . . . . . . . . . . . . . . . . . . . . . . . . . . . . . . . . . . . . . . . . . . . . . . . . . . . . . . . . . . . . . . .
. . . . . . . . . . . . . . . . . . . . . . . . . . . . . . . . . . . . . . . . . . . . . . . . . . . . . . . . . . . . . . . . . . . . . . . . . . . . . . . . . . . .
Land temperature (°C) Ocean temperature (°C)
Karumba
Mackay
Hervey Bay
Work individually to answer the following questions.
Mackay
Hervey Bay
Karumba
20
22
24
26
28
30
32
Key: Temperature (°C)
Map 1
| 9Queensland Studies Authority
10
Modelling extreme weather: Wind in a cyclone
Group discussion
Fast winds are part of many extreme weather events, including cyclones.
Did you know? Cyclones are classified by their wind speed.
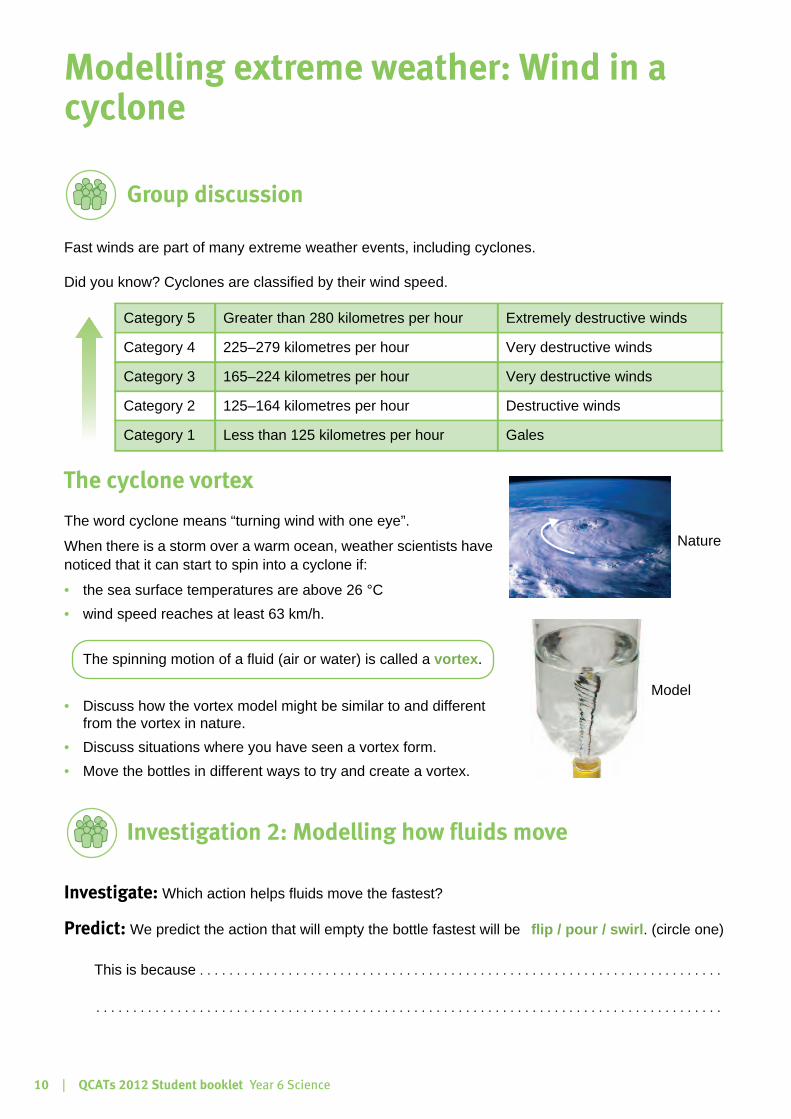
The cyclone vortex
The word cyclone means “turning wind with one eye”.
When there is a storm over a warm ocean, weather scientists have noticed that it can start to spin into a cyclone if:
• the sea surface temperatures are above 26 °C • wind speed reaches at least 63 km/h.
• Discuss how the vortex model might be similar to and different from the vortex in nature.
• Discuss situations where you have seen a vortex form. • Move the bottles in different ways to try and create a vortex.
Investigation 2: Modelling how fluids move
Investigate: Which action helps fluids move the fastest?
Predict: We predict the action that will empty the bottle fastest will be flip / pour / swirl. (circle one)
This is because . . . . . . . . . . . . . . . . . . . . . . . . . . . . . . . . . . . . . . . . . . . . . . . . . . . . . . . . . . . . . . . . . . . . . . .
. . . . . . . . . . . . . . . . . . . . . . . . . . . . . . . . . . . . . . . . . . . . . . . . . . . . . . . . . . . . . . . . . . . . . . . . . . . . . . . . . . . . .
Category 5 Greater than 280 kilometres per hour Extremely destructive winds
Category 4 225–279 kilometres per hour Very destructive winds
Category 3 165–224 kilometres per hour Very destructive winds
Category 2 125–164 kilometres per hour Destructive winds
Category 1 Less than 125 kilometres per hour Gales
Nature
Model
The spinning motion of a fluid (air or water) is called a vortex.
| QCATs 2012 Student booklet Year 6 Science

Observe: Use the given actions in Table 3 to empty the water from one bottle to the other.
• Record how many seconds it takes to empty the bottle for each action.• Observe how the air and water move in each action.
5. Record times and observations for each action in Table 3.
Table 3
Explain:
6. The action that emptied the bottle fastest was flip / pour / swirl. (circle one)
This is because . . . . . . . . . . . . . . . . . . . . . . . . . . . . . . . . . . . . . . . . . . . . . . . . . . . . . . . . . . . . . . . . . . . . . .
. . . . . . . . . . . . . . . . . . . . . . . . . . . . . . . . . . . . . . . . . . . . . . . . . . . . . . . . . . . . . . . . . . . . . . . . . . . .
• Draw lines to label the following diagram:
• Move the vortex bottles to model how a cyclone might travel across the ocean.• Move the vortex bottles to model how a cyclone might travel across a town on the coast.
Action Forms a vortex(yes/no)
Time taken to empty the bottle (seconds)
Observations (how the water and air moved)
flip
pour
swirl
Work individually to answer the following questions.
Hint: Compare your prediction with your observations in Table 3.Group discussion
slower water movement
faster water movement
the “eye”
direction of spinning fluid
| 11Queensland Studies Authority
12
Explaining observations of a cycloneWatch the video of satellite data showing the path of cyclone Ului in 2010.
As you watch, think about:
• how the fluid moved in the vortex model• the direction of spinning cloud in the animation• how the cyclone changes as it moves along its path.
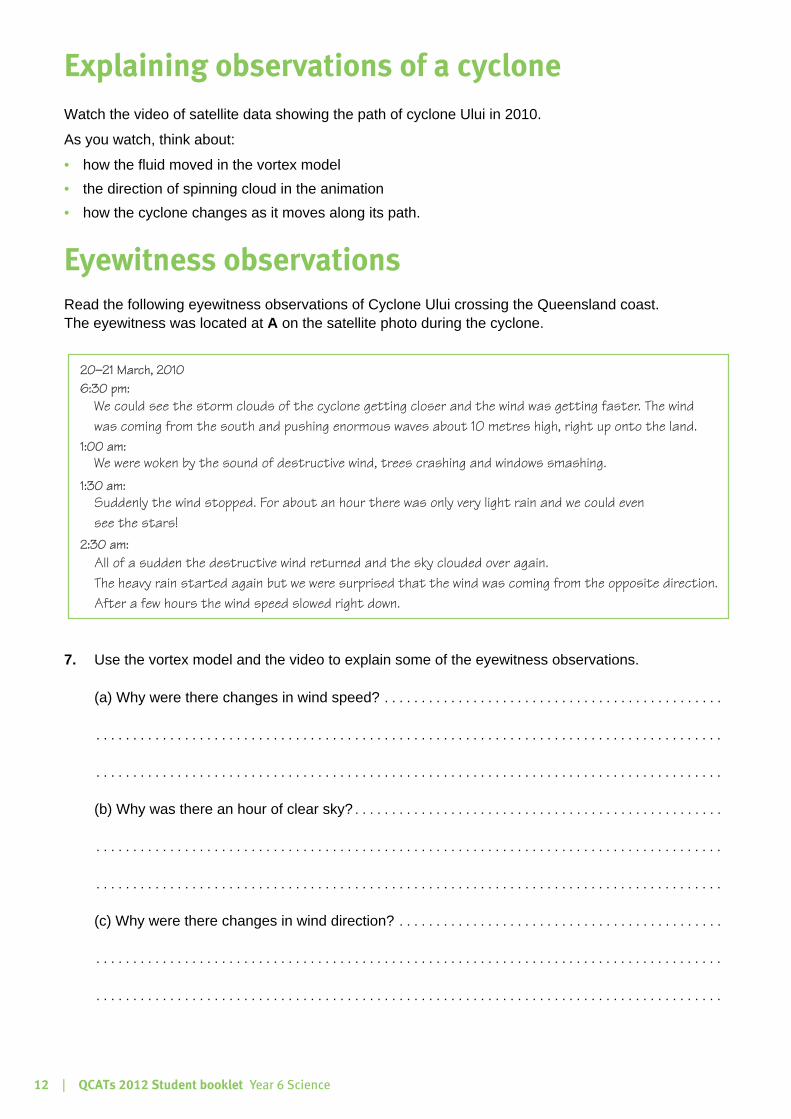
Eyewitness observationsRead the following eyewitness observations of Cyclone Ului crossing the Queensland coast. The eyewitness was located at A on the satellite photo during the cyclone.
7. Use the vortex model and the video to explain some of the eyewitness observations.
(a) Why were there changes in wind speed? . . . . . . . . . . . . . . . . . . . . . . . . . . . . . . . . . . . . . . . . . . . . . .
. . . . . . . . . . . . . . . . . . . . . . . . . . . . . . . . . . . . . . . . . . . . . . . . . . . . . . . . . . . . . . . . . . . . . . . . . . . . . . . . . . . . .
. . . . . . . . . . . . . . . . . . . . . . . . . . . . . . . . . . . . . . . . . . . . . . . . . . . . . . . . . . . . . . . . . . . . . . . . . . . . . . . . . . . . .
(b) Why was there an hour of clear sky? . . . . . . . . . . . . . . . . . . . . . . . . . . . . . . . . . . . . . . . . . . . . . . . . . .
. . . . . . . . . . . . . . . . . . . . . . . . . . . . . . . . . . . . . . . . . . . . . . . . . . . . . . . . . . . . . . . . . . . . . . . . . . . . . . . . . . . . .
. . . . . . . . . . . . . . . . . . . . . . . . . . . . . . . . . . . . . . . . . . . . . . . . . . . . . . . . . . . . . . . . . . . . . . . . . . . . . . . . . . . . .
(c) Why were there changes in wind direction? . . . . . . . . . . . . . . . . . . . . . . . . . . . . . . . . . . . . . . . . . . . .
. . . . . . . . . . . . . . . . . . . . . . . . . . . . . . . . . . . . . . . . . . . . . . . . . . . . . . . . . . . . . . . . . . . . . . . . . . . . . . . . . . . . .
. . . . . . . . . . . . . . . . . . . . . . . . . . . . . . . . . . . . . . . . . . . . . . . . . . . . . . . . . . . . . . . . . . . . . . . . . . . . . . . . . . . . .
We could see the storm clouds of the cyclone getting closer and the wind was getting faster. The wind
was coming from the south and pushing enormous waves about 10 metres high, right up onto the land.
20–21 March, 201020–21 March, 2010
We were woken by the sound of destructive wind, trees crashing and windows smashing.
1:00 am:1:00 am:
Suddenly the wind stopped. For about an hour there was only very light rain and we could even
see the stars!
1:30 am:1:30 am:
All of a sudden the destructive wind returned and the sky clouded over again.
The heavy rain started again but we were surprised that the wind was coming from the opposite direction.
After a few hours the wind speed slowed right down.
2:30 am:2:30 am:
6:30 pm:6:30 pm:
| QCATs 2012 Student booklet Year 6 Science
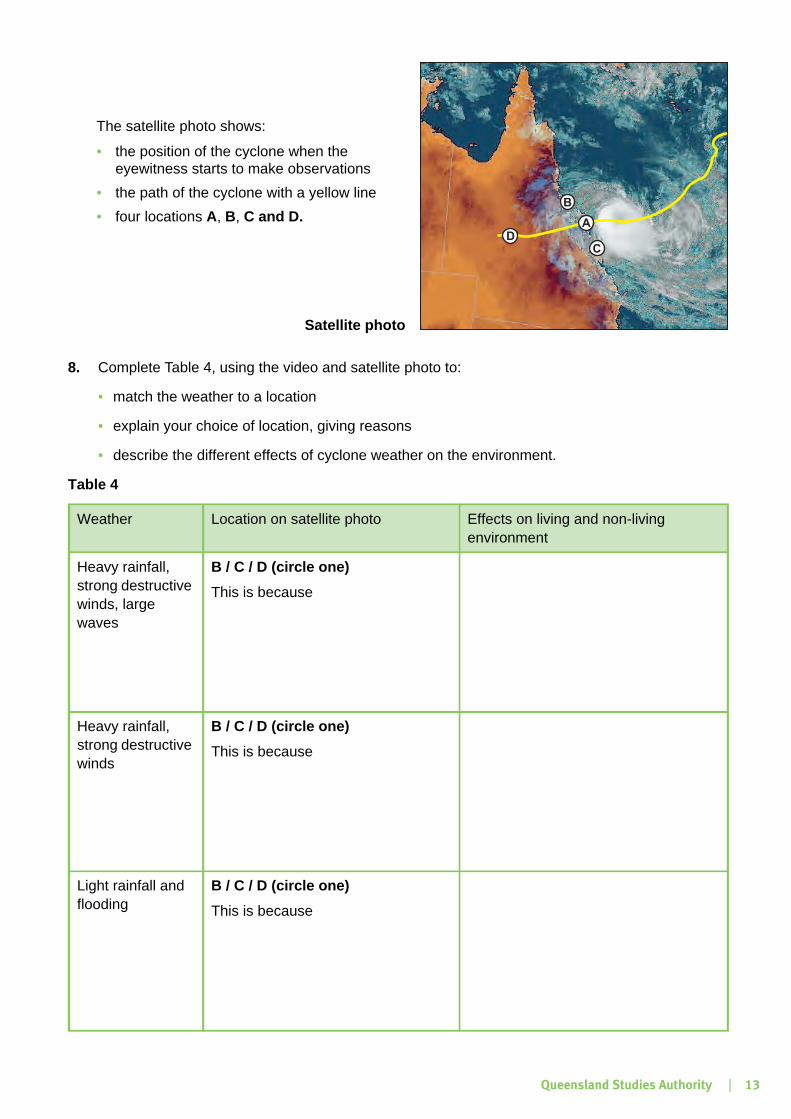
8. Complete Table 4, using the video and satellite photo to:
• match the weather to a location
• explain your choice of location, giving reasons
• describe the different effects of cyclone weather on the environment.
Table 4
Weather Location on satellite photo Effects on living and non-living environment
Heavy rainfall, strong destructive winds, large waves
B / C / D (circle one)This is because
Heavy rainfall, strong destructive winds
B / C / D (circle one)This is because
Light rainfall and flooding
B / C / D (circle one)This is because
DC
A
B
The satellite photo shows:
• the position of the cyclone when the eyewitness starts to make observations
• the path of the cyclone with a yellow line• four locations A, B, C and D.
Satellite photo
| 13Queensland Studies Authority

14
Predicting cyclones
Read the case studies of two cyclones that have crossed the Queensland coast.
Case study Mackay cyclone 1918:
Warnings and predictions:
Measurements:
Impacts:
About 12 hours before cyclone crossed the coast
No record of warning or prediction
Category: predicted to be 5
Wind speed: estimated 194 km/h
Maximum wave height: 7.6 m
(Most measurements and observations were made
by local residents.)
Widespread destruction to buildings
Loss of gas and water supplies
Loss of communication for five days
Trees uprooted
Case study Cyclone Ului 2010:
Warnings and predictions:
Measurements:
Impacts:
�
�
�
�
�
Identified as Tropical cyclone: 12 March, Solomon Islands by satellite dataCyclone warning issued: 18 March, 10:00 am(2 days before crossing the Qld coast)Computer modelling predicted the cyclone to cross the coast: 1–2 am, 21 MarchHeight of waves predicted by wave-monitoring sitesRainfall up to 200 mm, issued flood warnings inland
Category: 3Wind speed: 215 km/h (290 km/h gusts)Maximum wave height: 9.4 m
Minor to moderate damage to buildingsSome loss of electricitySugar cane fields flattenedForest trees stripped of foliageNo deaths
| QCATs 2012 Student booklet Year 6 Science

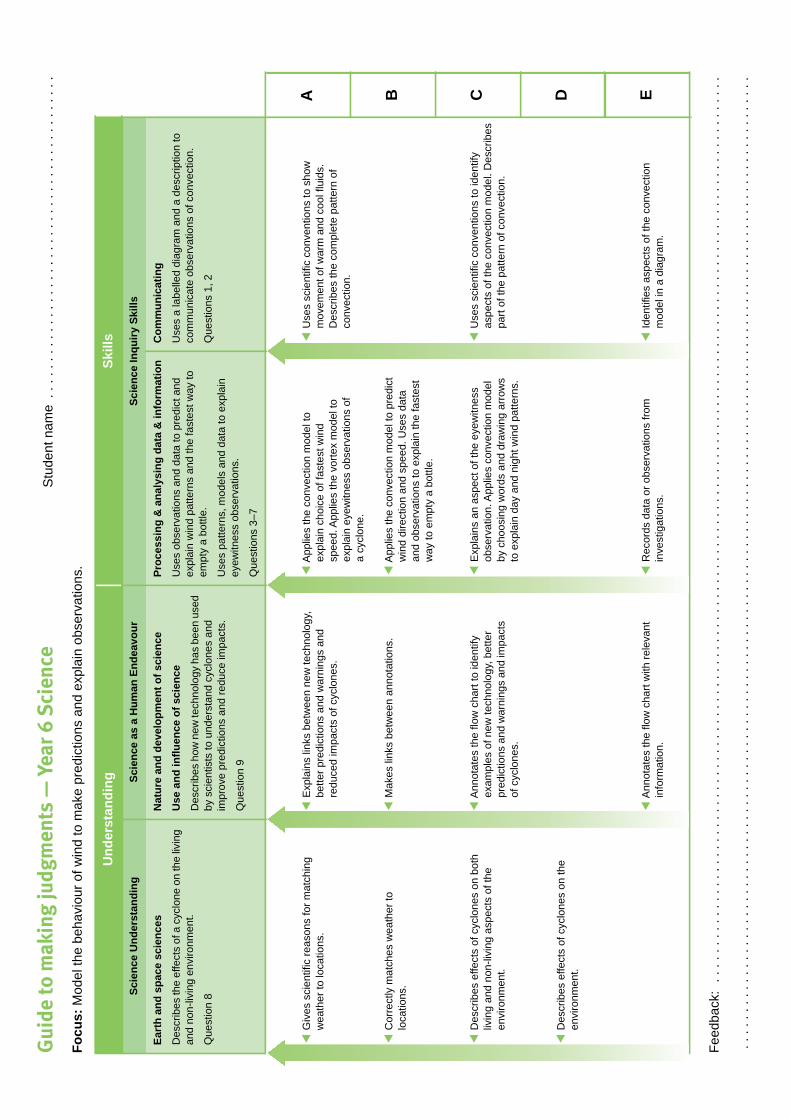
9. (a) Annotate the flow chart below. Use your knowledge and the information in the Case studies on page 14.
(b) Draw lines between annotations to show links between ideas.
(c) Explain the links between ideas to show how the impacts of cyclones can be reduced.
• . . . . . . . . . . . . . . . . . . . . . . . . . . . . . . . . . . . . . . . . . . . . . . . . . . . . . . . . . . . . . . . . . . . . . . . . . . . . . . .
. . . . . . . . . . . . . . . . . . . . . . . . . . . . . . . . . . . . . . . . . . . . . . . . . . . . . . . . . . . . . . . . . . . . . . . . . . . . . . . .
New technology has allowed scientists to understand
cyclones and make better predictions and warnings.
This can reduce the impacts of cyclones.
Meteorologist
Newtechnology
Predictionsand warnings
Impacts ofcyclones
fast communication
patterns in datacan be used
collect data fromremote locations
gives us better
which reduces
| 15Queensland Studies Authority
Gui
de to
mak
ing
judg
men
ts �
Yea
r 6 S
cien
ceS
tude
nt n
ame
. . .
. . .
. . .
. . .
. . .
. . .
. . .
. . .
. . .
. . .
. . .
. . .
. . .
. . .
. .
Focu
s: M
odel
the
beha
viou
r of w
ind
to m
ake
pred
ictio
ns a
nd e
xpla
in o
bser
vatio
ns.
Feed
back
: . .
. . .
. . .
. . .
. . .
. . .
. . .
. . .
. . .
. . .
. . .
. . .
. . .
. . .
. . .
. . .
. . .
. . .
. . .
. . .
. . .
. . .
. . .
. . .
. . .
. . .
. . .
. . .
. . .
. . .
. . .
. . .
. . .
. . .
. . .
. . .
. . .
. . .
. . .
. . .
. . .
.
. . .
. . .
. . .
. . .
. . .
. . .
. . .
. . .
. . .
. . .
. . .
. . .
. . .
. . .
. . .
. . .
. . .
. . .
. . .
. . .
. . .
. . .
. . .
. . .
. . .
. . .
. . .
. . .
. . .
. . .
. . .
. . .
. . .
. . .
. . .
. . .
. . .
. . .
. . .
. . .
. . .
. . .
. . .
. . .
Und
erst
andi
ngSk
ills
Scie
nce
Und
erst
andi
ngSc
ienc
e as
a H
uman
End
eavo
urSc
ienc
e In
quiry
Ski
lls
Eart
h an
d sp
ace
scie
nces
Des
crib
es th
e ef
fect
s of
a c
yclo
ne o
n th
e liv
ing
and
non-
livin
g en
viro
nmen
t.
Que
stio
n 8
Nat
ure
and
deve
lopm
ent o
f sci
ence
Use
and
influ
ence
of s
cien
ce
Des
crib
es h
ow n
ew te
chno
logy
has
bee
n us
ed
by s
cien
tists
to u
nder
stan
d cy
clon
es a
nd
impr
ove
pred
ictio
ns a
nd re
duce
impa
cts.
Que
stio
n 9
Proc
essi
ng &
ana
lysi
ng d
ata
& in
form
atio
n
Use
s ob
serv
atio
ns a
nd d
ata
to p
redi
ct a
nd
expl
ain
win
d pa
ttern
s an
d th
e fa
stes
t way
to
empt
y a
bottl
e.
Use
s pa
ttern
s, m
odel
s an
d da
ta to
exp
lain
ey
ewitn
ess
obse
rvat
ions
.
Que
stio
ns 3
–7
Com
mun
icat
ing
Use
s a
labe
lled
diag
ram
and
a d
escr
iptio
n to
co
mm
unic
ate
obse
rvat
ions
of c
onve
ctio
n.
Que
stio
ns 1
, 2
A B C D E
G
ives
sci
entif
ic re
ason
s fo
r mat
chin
g w
eath
er to
loca
tions
.
D
escr
ibes
effe
cts
of c
yclo
nes
on b
oth
livin
g an
d no
n-liv
ing
aspe
cts
of th
e en
viro
nmen
t.
D
escr
ibes
effe
cts
of c
yclo
nes
on th
e en
viro
nmen
t.
E
xpla
ins
links
bet
wee
n ne
w te
chno
logy
, be
tter p
redi
ctio
ns a
nd w
arni
ngs
and
redu
ced
impa
cts
of c
yclo
nes.
A
nnot
ates
the
flow
cha
rt to
iden
tify
exam
ples
of n
ew te
chno
logy
, bet
ter
pred
ictio
ns a
nd w
arni
ngs
and
impa
cts
of c
yclo
nes.
A
pplie
s th
e co
nvec
tion
mod
el to
ex
plai
n ch
oice
of f
aste
st w
ind
spee
d. A
pplie
s th
e vo
rtex
mod
el to
ex
plai
n ey
ewitn
ess
obse
rvat
ions
of
a cy
clon
e.
A
pplie
s th
e co
nvec
tion
mod
el to
pre
dict
w
ind
dire
ctio
n an
d sp
eed.
Use
s da
ta
and
obse
rvat
ions
to e
xpla
in th
e fa
stes
t w
ay to
em
pty
a bo
ttle.
E
xpla
ins
an a
spec
t of t
he e
yew
itnes
s ob
serv
atio
n. A
pplie
s co
nvec
tion
mod
el
by c
hoos
ing
wor
ds a
nd d
raw
ing
arro
ws
to e
xpla
in d
ay a
nd n
ight
win
d pa
ttern
s.
U
ses
scie
ntifi
c co
nven
tions
to s
how
m
ovem
ent o
f war
m a
nd c
ool f
luid
s.
Des
crib
es th
e co
mpl
ete
patte
rn o
f co
nvec
tion.
U
ses
scie
ntifi
c co
nven
tions
to id
entif
y as
pect
s of
the
conv
ectio
n m
odel
. Des
crib
es
part
of th
e pa
ttern
of c
onve
ctio
n.
Id
entif
ies
aspe
cts
of th
e co
nvec
tion
mod
el in
a d
iagr
am.
C
orre
ctly
mat
ches
wea
ther
to
loca
tions
.
Mak
es li
nks
betw
een
anno
tatio
ns.
A
nnot
ates
the
flow
cha
rt w
ith re
leva
nt
info
rmat
ion.
R
ecor
ds d
ata
or o
bser
vatio
ns fr
om
inve
stig
atio
ns.