Quarterly Report Q2 2011 - Company | Circa … · 2011-08-23 · QUARTERLY REPORT – Q2 2011 ......
35
QUARTERLY REPORT – Q2 2011 Second Quarter Report for the period ended June 30, 2011
Transcript of Quarterly Report Q2 2011 - Company | Circa … · 2011-08-23 · QUARTERLY REPORT – Q2 2011 ......
QUARTERLY REPORT – Q2 2011
Second Quarter Report for the period ended June 30, 2011

2
CIRCA ENTERPRISES INC.
MANAGEMENT’S DISCUSSION AND ANALYSIS
AS AT AND FOR THE THREE AND SIX MONTH PERIODS ENDED JUNE 30, 2011 The following Management’s Discussion and Analysis ("MD&A ") of the financial condition and results of operations of Circa Enterprises Inc. ("Circa" or the "Company") is dated August 5, 2011 and has been prepared taking into consideration information available to August 11, 2011. This MD&A should be read in conjunction with the consolidated financial statements of the Company as at and for the period ended June 30, 2011. References in this MD&A to the Company’s financial position or results of operations are presented on a consolidated basis and include the accounts of the Company and its wholly-owned subsidiaries, Circa Telecom (USA), Inc. ("Circa USA") and Circa Metals Inc. ("Circa Metals"). The Company and such wholly-owned subsidiaries are sometimes hereinafter referred to as the "Circa Group". The consolidated financial statements of the Company (and the financial information presented in this MD&A) have been prepared in accordance with International Financial Reporting Standards ("IFRS") and are reported in Canadian dollars. Additional information, including the Company’s Annual Information Form, is available on SEDAR at www.sedar.com.
FORWARD-LOOKING STATEMENTS
Certain information set out in this MD&A constitutes forward looking information, including: (i) expectations concerning the ability of the Company to generate funds from operations to meet its financial obligations (ii) expectations concerning the amount of capital expenditures anticipated in 2011 and the funding of such capital expenditures (as set out under the heading "Consolidated Statements of Financial Position"); (iii) expectations considering the decrease in inventory levels (as set out under the heading “Consolidated Statement of Cash Flows”) (iv) expectations concerning improvements in the markets for products distributed by members of the Circa Group in 2011 (as set out under the heading "Outlook"); and (v) expectations concerning the Company’s positioning to benefit from any increase in residential and commercial construction activity (as set out under the heading "Outlook").
Readers should review the cautionary statement respecting forward-looking information that appears below.
Forward-looking statements are often, but not always, identified by the use of words such as "seek", "anticipate", "hope", "plan", "continue", "estimate", "expect", "may", "will", "intend", "could", "might", "should", "believe" and similar expressions. Forward-looking statements are based upon the opinions, expectations and estimates of management as at the date the statements are made and, in some cases, information received from or disseminated by third parties, and are subject to a variety of risks and uncertainties and other factors that could cause actual events or outcomes to differ materially from those anticipated or implied by such forward-looking statements.
In respect of the expectations of generating sufficient cash from operations to meet obligations as they become due, those risks, uncertainties and factors include, but are not limited to, such things as the continuing demand for the Company’s products, the ability of the Company to generate sufficient sales and the solvency and ability of the Company’s customers to pay their obligations as they become due. In respect of expectations concerning the amount of capital expenditures anticipated in 2011 and the funding of such capital expenditures, those risks, uncertainties and factors include, but are not limited to, such things as the necessity to incur capital spending if other outsourcing alternatives are more economical, the ability to control capital spending in line with management’s estimates and the ability
3 to generate cash flow or utilize bank financing for capital expenditures. In respect of expectations concerning the decrease in inventory levels, those risks, uncertainties and factors include, but are not limited to, such things as the ability of the Company to achieve increased sales in a similar pattern to prior years and the continuation of the production output at current levels. In respect of expectations concerning improvements in the markets for products distributed by members of the Circa Group in 2011, those risks, uncertainties and factors include, but are not limited to, such things as the intensification of competition within the product markets, the continuation or intensification (or both) of the current economic slowdown and the emergence of new technologies. In respect of expectations concerning the Company’s positioning to benefit from any increase in residential and commercial construction activity, those risks, uncertainties and factors include, but are not limited to, such things as the ability of the Company to maintain its current staff and operating performance if sales increase. Accordingly, readers should not place undue reliance upon forward-looking information contained herein.
Forward-looking information respecting:
(i) the ability of the Company to generate funds from operations to meet its financial obligations is based on management’s forecast and estimate of sales and operating expenses in 2011;
(ii) the amount of capital expenditures anticipated in 2011 and the funding of such capital expenditures, is based upon management’s estimate of the anticipated volume of business, required capital resources and anticipated cash flows in 2011;
(iii) the decrease in inventory levels over the Company’s next quarters is based on management’s planned and expected production levels and expectations of future sales;
(iv) improvements in the markets for products distributed by members of the Circa Group in 2011, is based upon management’s assessment of the product markets; and
(v) the Company’s positioning to benefit from any increase in residential and commercial construction activity, is based upon the ability of the Company to retain customers and management’s assessment of the recovery of the economy.
Although Circa believes that the assumptions underlying such forward looking statements are reasonable, and information received or disseminated by third parties is reliable, it can give no assurance that the expectations reflected in such forward-looking statements will prove to have been correct. Circa does not assume responsibility for the accuracy and completeness of the forward-looking statements and such forward-looking statements should not be taken as guarantees of future outcomes. Subject to applicable securities laws, the Company does not undertake any obligation to publicly revise these forward-looking statements to reflect subsequent events or circumstances. The forward-looking statements of the Company contained in this MD&A are expressly qualified, in their entirety, by this cautionary statement.
CHANGES IN ACCOUNTING POLICIES
Canadian publicly traded companies are required to prepare their financial statements in accordance with IFRS as issued by the International Accounting Standards Board, for financial years beginning on or after January 1, 2011. On January 1, 2011, Circa adopted IFRS for financial reporting purposes, using a transition date of January 1, 2010. The financial statements for the three and six month periods ended June 30, 2011, including required comparative information, have been prepared in accordance

4 with International Financial Reporting Standards 1, First-time Adoption of International Financial Reporting Standards, and with International Accounting Standard ("IAS") 34, Interim Financial Reporting, as issued by the International Accounting Standards Board ("IASB"). Previously, the Company prepared its Interim and Annual Consolidated Financial Statements in accordance with Canadian generally accepted accounting principles ("Canadian GAAP"). Unless otherwise noted, 2010 comparative information has been prepared in accordance with IFRS.
The adoption of IFRS has not had an impact on the Company’s operations, strategic decisions and Cash Flow. Further information on the IFRS impacts is provided in the Company’s consolidated financial statements, including reconciliations between Canadian GAAP and IFRS Net Earnings, Operating Earnings and other financial metrics.
GENERAL AND OVERVIEW
Circa's operations consist of two distinct business lines – the first being surge protection and related products ("Telecom"), sold primarily to the United States market (through Circa Telecom (USA) Inc., a wholly-owned subsidiary of the Company) and the second being metal fabrication (through the Company's wholly owned subsidiary, Circa Metals Inc.). The Telecom business consists of the design, manufacture, marketing and sale of surge protection products, which provide primary protection to telephone systems and data transmission equipment against voltage surges. Circa Metals provides custom metal fabrication services to Circa Enterprises itself and to third parties. Circa Metals also designs, manufactures, markets and sells fabricated enclosures, pole line hardware and other products to the Canadian electrical industry through its Hydel ("Hydel") product line.
In the second quarter of 2011, Circa recorded a loss from continuing operations attributable to owners of the Company of $22,000, compared to a profit of $0.5 million in Q2 2010. The Company experienced a decline in sales during the quarter compared to Q2 2010 – from $6.8 million in 2010 to $5.7 million in 2011. As a result of this decrease in sales, the Company realized a decline in its gross profit in Q2 2011 compared to Q2 2010. This decrease, combined with higher selling, general and administrative expenses resulted in this small loss. Selling, general and administrative costs went from $1.0 million in Q2 2010 to $1.1 million in Q2 2011 as a result of increased management and administrative resources as well as expenses relating to moving the Company’s Calgary head office and operations. There was a small foreign currency exchange gain on the translation of the Company’s U.S. subsidiary which caused total comprehensive income to decline compared to the same quarter in the prior year.
For the six month period ended June 30, 2011, the Company recorded a profit from continuing operations of $54,000, compared to a profit of $0.5 million for the six month period ended June 30, 2010. Sales and margins for the six month period declined to $11.3 million and $2.5 million respectively, compared to $12.0 million and $2.9 million for the same period in 2010. The lower margins, combined with higher selling, general and administrative expenses, resulted in lower earnings for the six month period, compared to the prior year.
5
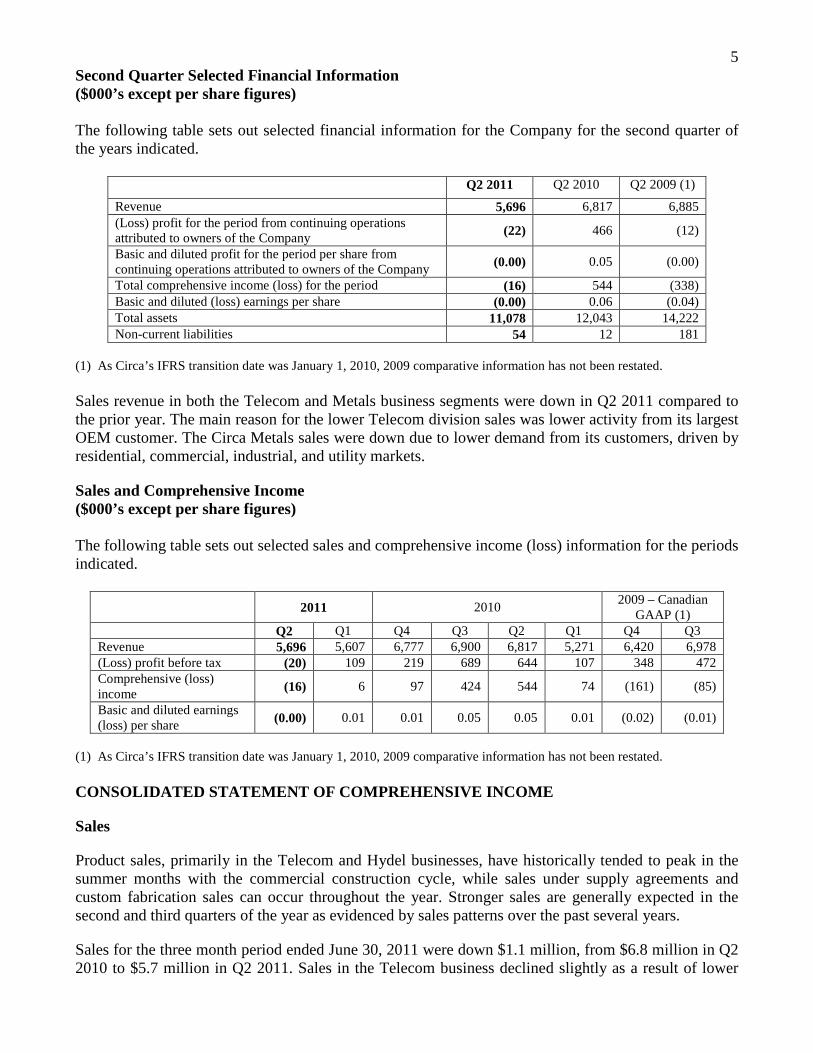
Second Quarter Selected Financial Information ($000’s except per share figures) The following table sets out selected financial information for the Company for the second quarter of the years indicated.
Q2 2011 Q2 2010 Q2 2009 (1)
Revenue 5,696 6,817 6,885 (Loss) profit for the period from continuing operations attributed to owners of the Company (22) 466 (12)
Basic and diluted profit for the period per share from continuing operations attributed to owners of the Company (0.00) 0.05 (0.00)
Total comprehensive income (loss) for the period (16) 544 (338) Basic and diluted (loss) earnings per share (0.00) 0.06 (0.04) Total assets 11,078 12,043 14,222 Non-current liabilities 54 12 181
(1) As Circa’s IFRS transition date was January 1, 2010, 2009 comparative information has not been restated. Sales revenue in both the Telecom and Metals business segments were down in Q2 2011 compared to the prior year. The main reason for the lower Telecom division sales was lower activity from its largest OEM customer. The Circa Metals sales were down due to lower demand from its customers, driven by residential, commercial, industrial, and utility markets.
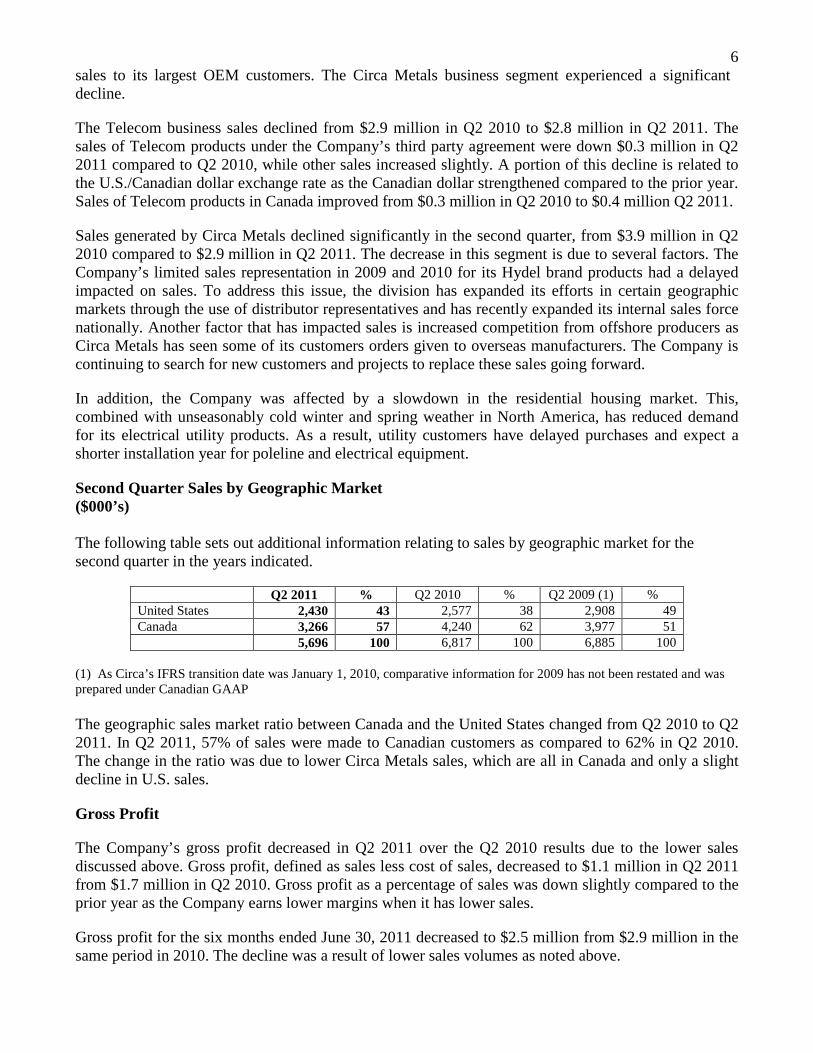
Sales and Comprehensive Income ($000’s except per share figures) The following table sets out selected sales and comprehensive income (loss) information for the periods indicated.
2011 2010 2009 – Canadian
GAAP (1) Q2 Q1 Q4 Q3 Q2 Q1 Q4 Q3 Revenue 5,696 5,607 6,777 6,900 6,817 5,271 6,420 6,978 (Loss) profit before tax (20) 109 219 689 644 107 348 472 Comprehensive (loss) income (16) 6 97 424 544 74 (161) (85)
Basic and diluted earnings (loss) per share (0.00) 0.01 0.01 0.05 0.05 0.01 (0.02) (0.01)
(1) As Circa’s IFRS transition date was January 1, 2010, 2009 comparative information has not been restated. CONSOLIDATED STATEMENT OF COMPREHENSIVE INCOME
Sales
Product sales, primarily in the Telecom and Hydel businesses, have historically tended to peak in the summer months with the commercial construction cycle, while sales under supply agreements and custom fabrication sales can occur throughout the year. Stronger sales are generally expected in the second and third quarters of the year as evidenced by sales patterns over the past several years.
Sales for the three month period ended June 30, 2011 were down $1.1 million, from $6.8 million in Q2 2010 to $5.7 million in Q2 2011. Sales in the Telecom business declined slightly as a result of lower
6 sales to its largest OEM customers. The Circa Metals business segment experienced a significant decline.
The Telecom business sales declined from $2.9 million in Q2 2010 to $2.8 million in Q2 2011. The sales of Telecom products under the Company’s third party agreement were down $0.3 million in Q2 2011 compared to Q2 2010, while other sales increased slightly. A portion of this decline is related to the U.S./Canadian dollar exchange rate as the Canadian dollar strengthened compared to the prior year. Sales of Telecom products in Canada improved from $0.3 million in Q2 2010 to $0.4 million Q2 2011.
Sales generated by Circa Metals declined significantly in the second quarter, from $3.9 million in Q2 2010 compared to $2.9 million in Q2 2011. The decrease in this segment is due to several factors. The Company’s limited sales representation in 2009 and 2010 for its Hydel brand products had a delayed impacted on sales. To address this issue, the division has expanded its efforts in certain geographic markets through the use of distributor representatives and has recently expanded its internal sales force nationally. Another factor that has impacted sales is increased competition from offshore producers as Circa Metals has seen some of its customers orders given to overseas manufacturers. The Company is continuing to search for new customers and projects to replace these sales going forward.
In addition, the Company was affected by a slowdown in the residential housing market. This, combined with unseasonably cold winter and spring weather in North America, has reduced demand for its electrical utility products. As a result, utility customers have delayed purchases and expect a shorter installation year for poleline and electrical equipment.
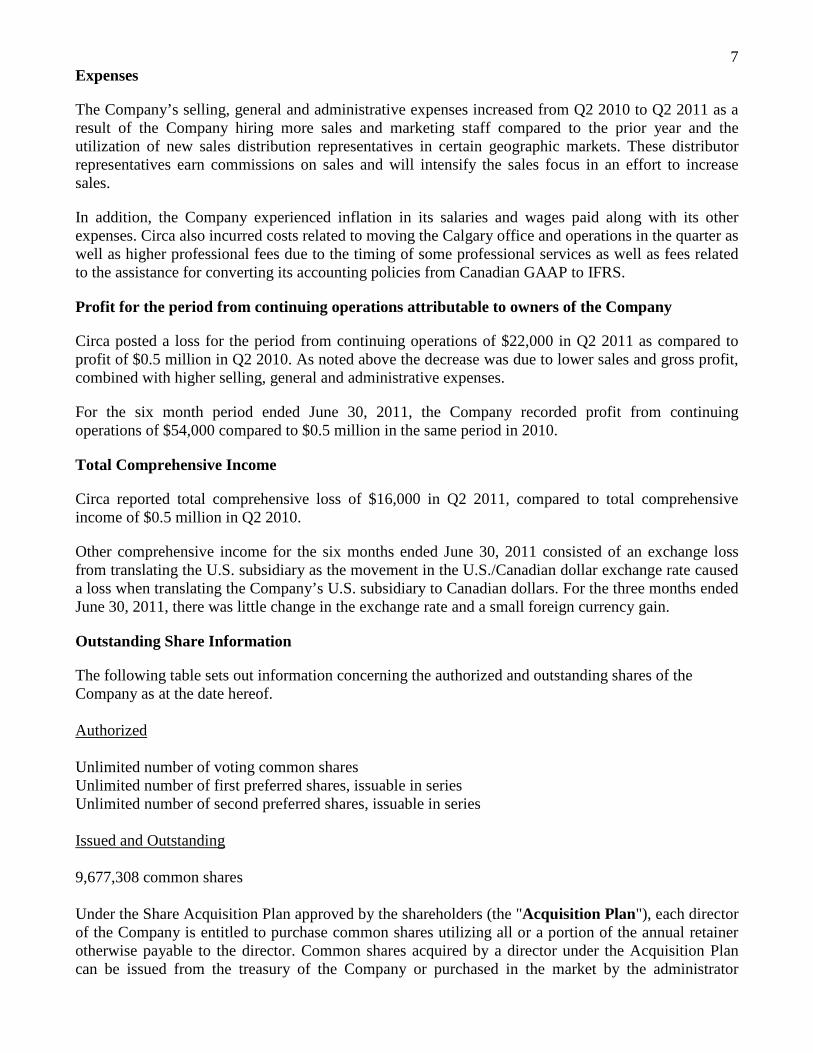
Second Quarter Sales by Geographic Market ($000’s) The following table sets out additional information relating to sales by geographic market for the second quarter in the years indicated.
Q2 2011 % Q2 2010 % Q2 2009 (1) % United States 2,430 43 2,577 38 2,908 49 Canada 3,266 57 4,240 62 3,977 51 5,696 100 6,817 100 6,885 100
(1) As Circa’s IFRS transition date was January 1, 2010, comparative information for 2009 has not been restated and was prepared under Canadian GAAP The geographic sales market ratio between Canada and the United States changed from Q2 2010 to Q2 2011. In Q2 2011, 57% of sales were made to Canadian customers as compared to 62% in Q2 2010. The change in the ratio was due to lower Circa Metals sales, which are all in Canada and only a slight decline in U.S. sales.
Gross Profit
The Company’s gross profit decreased in Q2 2011 over the Q2 2010 results due to the lower sales discussed above. Gross profit, defined as sales less cost of sales, decreased to $1.1 million in Q2 2011 from $1.7 million in Q2 2010. Gross profit as a percentage of sales was down slightly compared to the prior year as the Company earns lower margins when it has lower sales.
Gross profit for the six months ended June 30, 2011 decreased to $2.5 million from $2.9 million in the same period in 2010. The decline was a result of lower sales volumes as noted above.
7
Expenses
The Company’s selling, general and administrative expenses increased from Q2 2010 to Q2 2011 as a result of the Company hiring more sales and marketing staff compared to the prior year and the utilization of new sales distribution representatives in certain geographic markets. These distributor representatives earn commissions on sales and will intensify the sales focus in an effort to increase sales.
In addition, the Company experienced inflation in its salaries and wages paid along with its other expenses. Circa also incurred costs related to moving the Calgary office and operations in the quarter as well as higher professional fees due to the timing of some professional services as well as fees related to the assistance for converting its accounting policies from Canadian GAAP to IFRS.
Profit for the period from continuing operations attributable to owners of the Company
Circa posted a loss for the period from continuing operations of $22,000 in Q2 2011 as compared to profit of $0.5 million in Q2 2010. As noted above the decrease was due to lower sales and gross profit, combined with higher selling, general and administrative expenses.
For the six month period ended June 30, 2011, the Company recorded profit from continuing operations of $54,000 compared to $0.5 million in the same period in 2010.
Total Comprehensive Income
Circa reported total comprehensive loss of $16,000 in Q2 2011, compared to total comprehensive income of $0.5 million in Q2 2010.
Other comprehensive income for the six months ended June 30, 2011 consisted of an exchange loss from translating the U.S. subsidiary as the movement in the U.S./Canadian dollar exchange rate caused a loss when translating the Company’s U.S. subsidiary to Canadian dollars. For the three months ended June 30, 2011, there was little change in the exchange rate and a small foreign currency gain.
Outstanding Share Information
The following table sets out information concerning the authorized and outstanding shares of the Company as at the date hereof. Authorized Unlimited number of voting common shares Unlimited number of first preferred shares, issuable in series Unlimited number of second preferred shares, issuable in series Issued and Outstanding 9,677,308 common shares Under the Share Acquisition Plan approved by the shareholders (the "Acquisition Plan"), each director of the Company is entitled to purchase common shares utilizing all or a portion of the annual retainer otherwise payable to the director. Common shares acquired by a director under the Acquisition Plan can be issued from the treasury of the Company or purchased in the market by the administrator
8 appointed under the Acquisition Plan. On the initial adoption of this plan, 100,000 common shares were reserved for issuance under the Acquisition Plan and all 100,000 shares were issued.
At the Annual and Special Meeting of Shareholders in June 2010, the Acquisition Plan was amended to allow for an additional 200,000 common shares to be authorized for distribution. During the second quarter, the Company did not issue any shares under the plan (Q2 2010 – nil). For the six months ended June 30, 2011, there were 26,158 shares issued under the plan for total consideration of $18,050 or $0.69 per share (six months ended June 30, 2010 – nil), representing the weighted average trading price of the common shares in accordance with the plan.
Under the Amended and Restated Stock Option Plan approved by the shareholders (the "Option Plan"), the Company may grant options to its officers, directors, employees and consultants. Options granted under the Option Plan have a maximum term of ten years, with vesting terms and conditions determined by the board of directors at the time of grant. The price at which common shares may be acquired upon the exercise of options granted under the Option Plan may not be less than the market price of the common shares at the date of grant. At June 30, 2011, 967,731 common shares remained reserved under the Option Plan. No options were granted during the three or six month periods ended June 30, 2011 and no options were outstanding as at June 30, 2011.
CONSOLIDATED STATEMENTS OF FINANCIAL POSITION
At June 30, 2011, the Company’s working capital, defined as current assets less current liabilities, stood at $6.1 million. There was no change in the net working capital, however there were some relatively small changes in the balance sheet items that comprised working capital.
Accounts receivable increased slightly at June 30, 2011 compared to the December 31, 2010 balance as collections for some of the Company’s larger customers slowed slightly. Inventory was also slightly higher as the Telecom division built up its inventory in anticipation of higher sales activity in Q3 2011.
The Company has historically relied on cash from operations and access to a line of credit in order to meet its financial obligation. Although Q2 sales were sluggish, the Company expects to generate sufficient funds from operations in 2011 to meet its obligations as they become due. Circa maintains access to capital through its line of credit, which is available to meet short term operating and capital requirements. In addition, the Company relies upon cash from its operating activities in order to meet its obligations and fund working capital and investment objectives. At times, the Company has relied upon its operating line of credit to fund its operating losses and meet its obligations as they become due.
In 2011, the Company plans on investing $414,000 in capital expenditures related to property, plant and equipment. It is expected that these expenditures will be funded with operating cash flow.
9
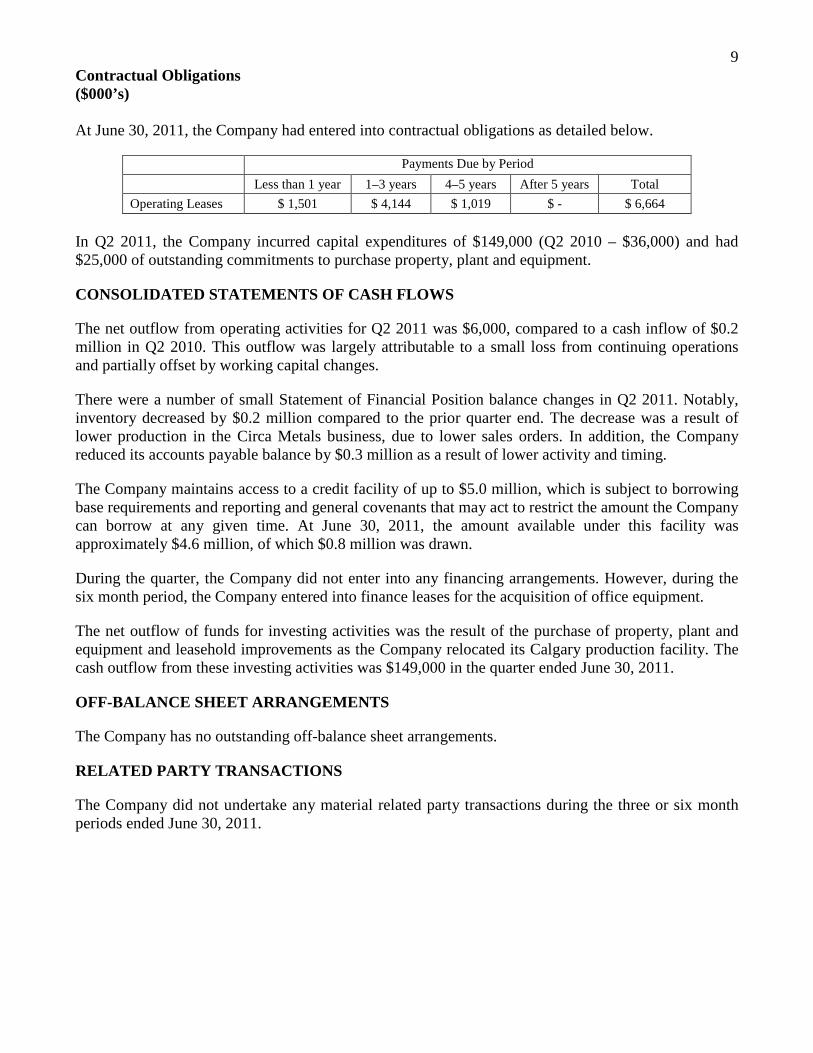
Contractual Obligations ($000’s) At June 30, 2011, the Company had entered into contractual obligations as detailed below.
Payments Due by Period
Less than 1 year 1–3 years 4–5 years After 5 years Total
Operating Leases $ 1,501 $ 4,144 $ 1,019 $ - $ 6,664
In Q2 2011, the Company incurred capital expenditures of $149,000 (Q2 2010 – $36,000) and had $25,000 of outstanding commitments to purchase property, plant and equipment.
CONSOLIDATED STATEMENTS OF CASH FLOWS
The net outflow from operating activities for Q2 2011 was $6,000, compared to a cash inflow of $0.2 million in Q2 2010. This outflow was largely attributable to a small loss from continuing operations and partially offset by working capital changes.
There were a number of small Statement of Financial Position balance changes in Q2 2011. Notably, inventory decreased by $0.2 million compared to the prior quarter end. The decrease was a result of lower production in the Circa Metals business, due to lower sales orders. In addition, the Company reduced its accounts payable balance by $0.3 million as a result of lower activity and timing.
The Company maintains access to a credit facility of up to $5.0 million, which is subject to borrowing base requirements and reporting and general covenants that may act to restrict the amount the Company can borrow at any given time. At June 30, 2011, the amount available under this facility was approximately $4.6 million, of which $0.8 million was drawn.
During the quarter, the Company did not enter into any financing arrangements. However, during the six month period, the Company entered into finance leases for the acquisition of office equipment.
The net outflow of funds for investing activities was the result of the purchase of property, plant and equipment and leasehold improvements as the Company relocated its Calgary production facility. The cash outflow from these investing activities was $149,000 in the quarter ended June 30, 2011.
OFF-BALANCE SHEET ARRANGEMENTS
The Company has no outstanding off-balance sheet arrangements.
RELATED PARTY TRANSACTIONS
The Company did not undertake any material related party transactions during the three or six month periods ended June 30, 2011.
10
RISKS AND UNCERTAINTIES
Ongoing business risks and uncertainties that may have an effect on the Company's business include the following.
Economic Climate
Circa's Telecom business in the U.S. is substantially driven by economic conditions and any downturn in the U.S. economy has historically represented a business risk for Circa. The ongoing weakness and current uncertainty in the U.S. economy is an example of a situation having a significant negative effect on Circa's marketing and sales efforts. Continued weakness in certain sectors and regions in the North American economy, the U.S. residential and commercial construction sectors in particular and the impact of changing lending rates affecting construction activity may have an adverse effect on sales of Telecom equipment to U.S. markets and that effect may be material.
Foreign Currency Exchange
Circa is exposed to foreign currency risk due to its export of Canadian manufactured goods. The timing of foreign exchange rate fluctuations can have a material effect on Circa's operating results, the effect and magnitude of which depend on the product mix of sales and materials purchased. During the six month period ended June 30, 2011, the Canadian/U.S. dollar exchange rate fluctuated between $0.99 and $1.06 as compared to an average of $0.97 in the same period in 2010. Movement in the U.S. dollar can affect sales reported in Canadian dollars and resulting gross profits. In addition, Circa must translate the accounts of Circa USA to Canadian dollars for financial reporting purposes.
Additional Capital Requirements
Circa may be required to raise additional capital in the future to fund operations or acquisitions. The availability of future borrowings and access to capital markets depends on prevailing market conditions and the acceptability of financing terms offered to the Company. There can be no assurance that future borrowings or equity financing will be available to Circa, or available on acceptable terms, in amounts sufficient to fund its needs.
Customer Concentration and Customer Credit
The wide range of customers that purchase products from members of the Circa Group has helped to mitigate the Circa Group's exposure to any one customer or small group of customers. Nonetheless, the top five customers of the Circa Group accounted for 42% of consolidated sales in for the six month period ended June 30, 2011. Economic weakness may adversely affect the financial condition of certain Circa Group customers, which, in turn, could create uncertainty with respect to the collection of receivables.
Raw Materials
The price of raw materials, in particular plastic, steel and copper, represent a significant portion of the manufacturing costs incurred by members of the Circa Group. There is considerable volatility in the price of these products, which is outside the control of the Company and its subsidiaries. Significant price volatility or raw materials disruptions or shortages would be detrimental to the operations of the Circa Group, and the effect could be material.
11
Product Market
Sales of Telecom equipment and related devices continue to be a significant contributor to overall consolidated sales and net earnings. Electrical codes in Canada and the United States require the use of the types of products supplied by the Company and its subsidiaries, while other forms of communication transmission, such as voice over internet, wireless and fiber optic cable, may not require the installation of Telecom equipment. Changes in building codes or the widespread adoption of forms of communication transmission that do not entail the use of surge protection equipment could materially adversely affect the volumes of Telecom products sold by members of the Circa Group and could materially adversely affect the financial condition, liquidity and results of operations of the Company.
Although many applications continue to rely upon copper-based solutions, a significant shift to communication transmission systems that do not use copper infrastructure could have a material adverse effect on the business of the Company.
Reliance on Telecommunications Industry
The Company's core Telecom business is dependent on the North American telecommunications industry and sales are influenced by economic and other factors affecting that industry. In particular, demand for telecom products is driven primarily by the installation of telecommunications infrastructure, which in turn is strongly influenced by commercial construction activity. Accordingly, the strength of the North American economy, job growth, the level of consumer confidence, availability of consumer credit, fluctuations in interest rates, demographics and migration of populations all have an indirect affect on the Company's operations. The ongoing economic slowdown has had, and the continuation or intensification of that slowdown will have, an adverse effect on commercial building activity, particularly in the United States. Any sustained slowdown in commercial building activity will adversely affect the Company's business, financial condition, liquidity and results of operations and the effect may be material.
Competition
The markets for products manufactured and distributed by members of the Circa Group is highly competitive, and a number of competitors in those markets have longer operating histories, greater name recognition, larger customer bases and greater financial, technical, engineering, product development and marketing resources than members of the Circa Group. These resources may allow them to respond more quickly than members of the Circa Group to new or emerging technologies and to changes in customer requirements. It also allows them to devote greater resources to the development, promotion and sale of their products. An inability to compete with other suppliers in the markets in which members of the Circa Group are active will adversely affect the Company's business, financial condition, liquidity and results of operations and the effect may be material.
Reliance on Manufacturing Facilities
Members of the Circa Group manufacture a significant percentage of the products sold by them at facilities owned by the Company and Circa Metals. The manufacturing operations of Circa Group members use certain equipment, which, if damaged or otherwise rendered inoperable or unavailable, could result in a material disruption in those operations. Any interruption of operations at a manufacturing facility could have a material adverse effect on Circa's consolidated financial condition, liquidity and results of operations.
12 Members of the Circa Group utilize certain contract manufacturers in China to manufacture products. While Circa maintains contact with alternative manufacturers in China that could produce products for members of the Circa Group, if any of the current contract manufacturers or manufacturers of components and sub-assemblies were rendered inoperable or otherwise became unable to supply Circa with product, this could represent a significant disruption to product availability and could disrupt relationships between members of the Circa Group and their customers and have an adverse affect on the Circa Group's reputation as a reliable supplier.
Further risks are disclosed in the Company's Annual Information Form which is available on SEDAR at www.sedar.com.
OUTLOOK
Sales of the Company’s products, particularly in the Telecom division, have leveled off in the past two years compared to the levels achieved in 2006 through 2008. Management believes this is due to the ongoing weakness in the U.S. economy. Although certain regions have shown signs of recovery, the Company continues to face challenges growing the markets for its products. In the Circa Metals business segment, sales have recently weakened and management believes this is partially driven by the market, but that a renewed sales effort and more aggressive approach can boost sales. These efforts will be the focus in the second half of the year and the Company will pursue a strategy to continue these efforts going forward.
The Company’s initiatives to combat the recession and achieve profitability in 2009 and 2010 have yielded positive results as evidenced by the previous five quarters operating results. However, with declining sales, management has recognized the need to add sales and marketing resources across both divisions of the Company and expects these additions and other initiatives will increase topline sales.
Management anticipates the market for the products distributed by members of the Circa Group will remain steady and expects to benefit from any increases in residential and commercial construction activity in 2011. The Company has seen a modest increase in sales in the Telecom business attributed to its competitors exiting certain product markets and anticipates this activity to continue in 2011.
Management continues to seek and evaluate opportunities for growth and to leverage its existing capabilities and distribution networks in an effort to generate new opportunities. The Company has allocated additional resources to continue this activity in 2011.
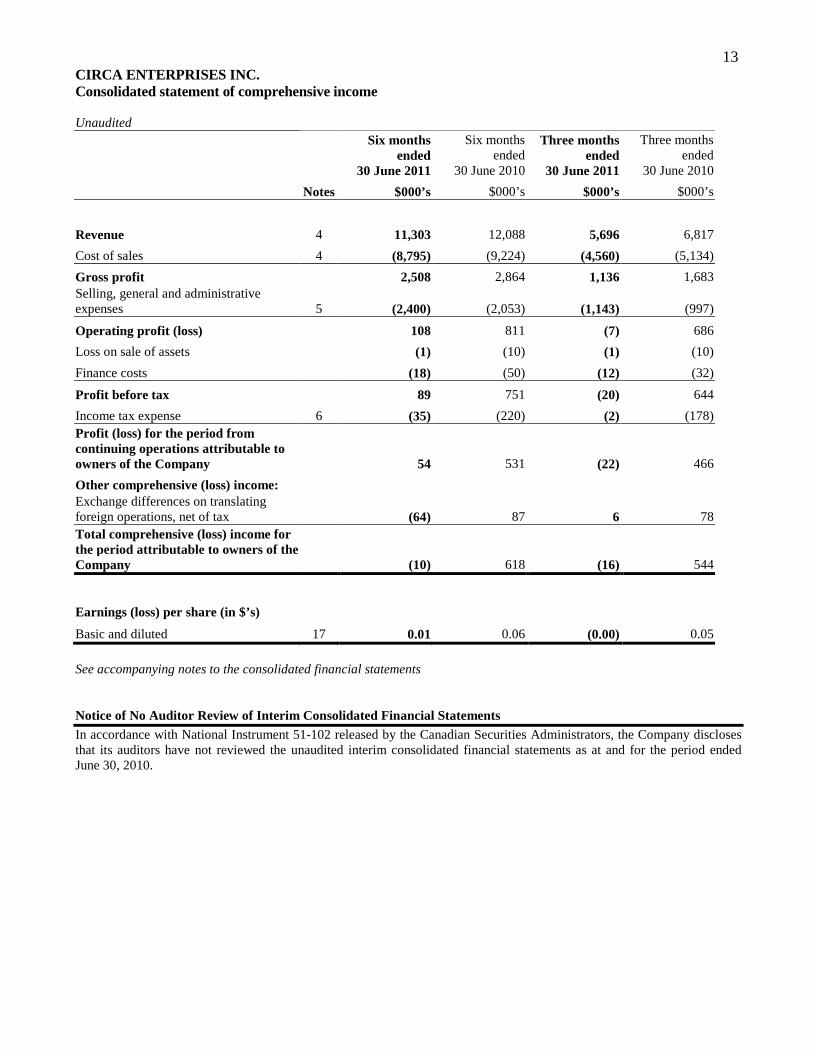
13 CIRCA ENTERPRISES INC. Consolidated statement of comprehensive income Unaudited
Six months ended
30 June 2011
Six months ended
30 June 2010
Three months ended
30 June 2011
Three months ended
30 June 2010
Notes $000’s $000’s $000’s $000’s
Revenue 4 11,303 12,088 5,696 6,817
Cost of sales 4 (8,795) (9,224) (4,560) (5,134)
Gross profit 2,508 2,864 1,136 1,683 Selling, general and administrative expenses 5 (2,400) (2,053) (1,143) (997)
Operating profit (loss) 108 811 (7) 686
Loss on sale of assets (1) (10) (1) (10)
Finance costs (18) (50) (12) (32)
Profit before tax 89 751 (20) 644
Income tax expense 6 (35) (220) (2) (178) Profit (loss) for the period from continuing operations attributable to owners of the Company 54 531 (22) 466
Other comprehensive (loss) income: Exchange differences on translating foreign operations, net of tax (64) 87 6 78 Total comprehensive (loss) income for the period attributable to owners of the Company (10) 618 (16) 544
Earnings (loss) per share (in $’s)
Basic and diluted 17 0.01 0.06 (0.00) 0.05
See accompanying notes to the consolidated financial statements Notice of No Auditor Review of Interim Consolidated Financial Statements In accordance with National Instrument 51-102 released by the Canadian Securities Administrators, the Company discloses that its auditors have not reviewed the unaudited interim consolidated financial statements as at and for the period ended June 30, 2010.
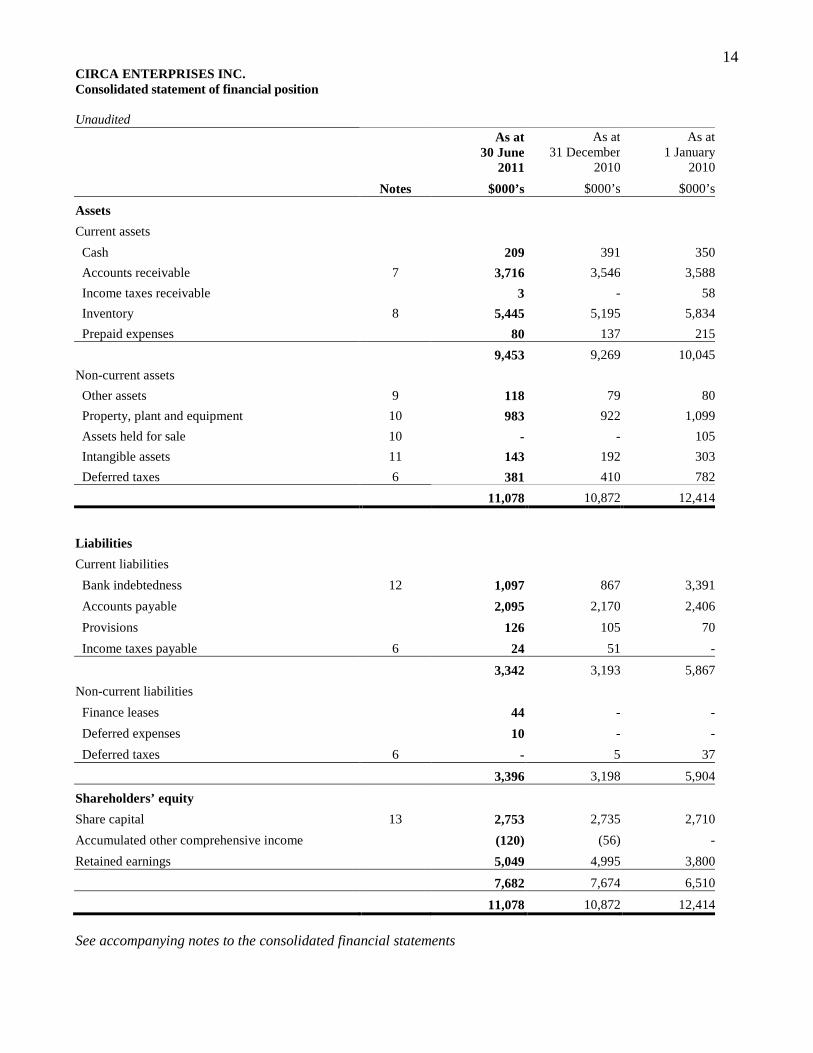
14 CIRCA ENTERPRISES INC. Consolidated statement of financial position Unaudited
As at 30 June
2011
As at31 December
2010
As at 1 January
2010
Notes $000’s $000’s $000’s
Assets
Current assets
Cash 209 391 350
Accounts receivable 7 3,716 3,546 3,588
Income taxes receivable 3 - 58
Inventory 8 5,445 5,195 5,834
Prepaid expenses 80 137 215
9,453 9,269 10,045
Non-current assets
Other assets 9 118 79 80
Property, plant and equipment 10 983 922 1,099
Assets held for sale 10 - - 105
Intangible assets 11 143 192 303
Deferred taxes 6 381 410 782
11,078 10,872 12,414
Liabilities
Current liabilities
Bank indebtedness 12 1,097 867 3,391
Accounts payable 2,095 2,170 2,406
Provisions 126 105 70
Income taxes payable 6 24 51 -
3,342 3,193 5,867
Non-current liabilities
Finance leases 44 - -
Deferred expenses 10 - -
Deferred taxes 6 - 5 37
3,396 3,198 5,904
Shareholders’ equity
Share capital 13 2,753 2,735 2,710
Accumulated other comprehensive income (120) (56) -
Retained earnings 5,049 4,995 3,800
7,682 7,674 6,510
11,078 10,872 12,414
See accompanying notes to the consolidated financial statements
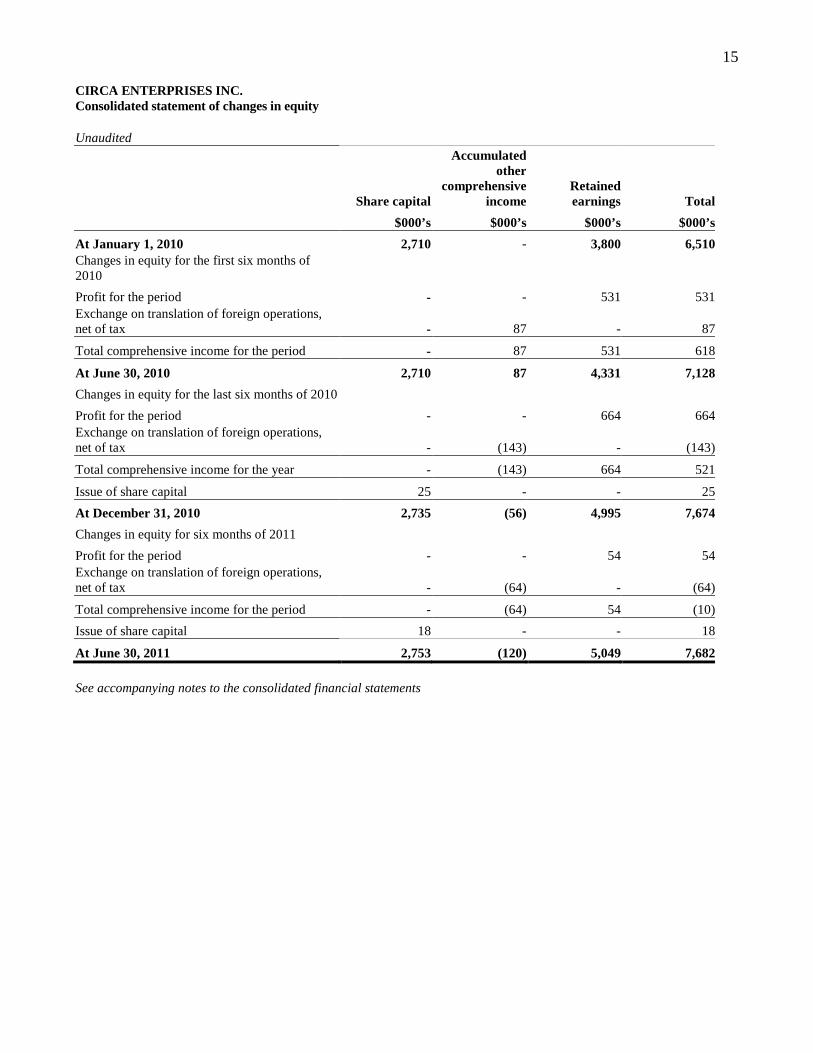
15 CIRCA ENTERPRISES INC. Consolidated statement of changes in equity Unaudited
Share capital
Accumulated other
comprehensive income
Retained earnings Total
$000’s $000’s $000’s $000’s
At January 1, 2010 2,710 - 3,800 6,510Changes in equity for the first six months of 2010
Profit for the period - - 531 531Exchange on translation of foreign operations, net of tax - 87 - 87
Total comprehensive income for the period - 87 531 618
At June 30, 2010 2,710 87 4,331 7,128
Changes in equity for the last six months of 2010
Profit for the period - - 664 664Exchange on translation of foreign operations, net of tax - (143) - (143)
Total comprehensive income for the year - (143) 664 521
Issue of share capital 25 - - 25
At December 31, 2010 2,735 (56) 4,995 7,674
Changes in equity for six months of 2011
Profit for the period - - 54 54Exchange on translation of foreign operations, net of tax - (64) - (64)
Total comprehensive income for the period - (64) 54 (10)
Issue of share capital 18 - - 18
At June 30, 2011 2,753 (120) 5,049 7,682
See accompanying notes to the consolidated financial statements

16 CIRCA ENTERPRISES INC. Consolidated statement of cash flows Unaudited
Six months ended
30 June 2011
Six months ended
30 June 2010
Three months ended
30 June 2011
Three months ended
30 June 2010
Notes $000’s $000’s $000’s $000’s
Operating activities Profit for the period from continuing operations attributable to owners of the Company 54 531 (22) 466
Add back items not affecting cash:
Depreciation 135 146 62 77
Amortization of intangible assets 49 53 25 31
Loss on sale of assets 1 10 1 10
Deferred taxes 24 141 (21) 121
Directors’ fees paid in shares 13 18 - - -
Non-cash working capital items:
(Increase) decrease in accounts receivable (170) (429) 35 (1,076)
(Increase) decrease in income taxes receivable (3) 58 - 32
(Increase) decrease in inventory (250) 202 154 446
Decrease in prepaid expenses 75 31 45 20
(Increase) decrease in other assets (57) 1 (18) 1
Decrease in accounts payable (75) (438) (250) (51)
Increase (decrease) in provisions 21 55 (22) 47
(Decrease) increase in income taxes payable (27) 60 (5) 60
Increase in deferred expenses 10 - 10 -Cash (used in) generated from operating activities (195) 421 (6) 184
Financing activities
Increase (decrease) in bank indebtedness 230 (642) 120 (374)
Increase in finance leases 44 - 44 -Cash generated from (used in) financing activities 274 (642) 164 (374)
Investing activities
Purchase of property, plant and equipment (198) (50) (149) (36)
Additions to intangible assets - (3) - -
Cash used in investing activities (198) (53) (149) (36)
Foreign exchange translation differences (63) 77 6 67
Net (decrease) increase in cash (182) (197) 15 (159)
Cash, beginning of period 391 350 194 312
Cash, end of period 209 153 209 153
Taxes paid 106 53 70 6
Interest paid 18 45 12 31
See accompanying notes to the consolidated financial statements
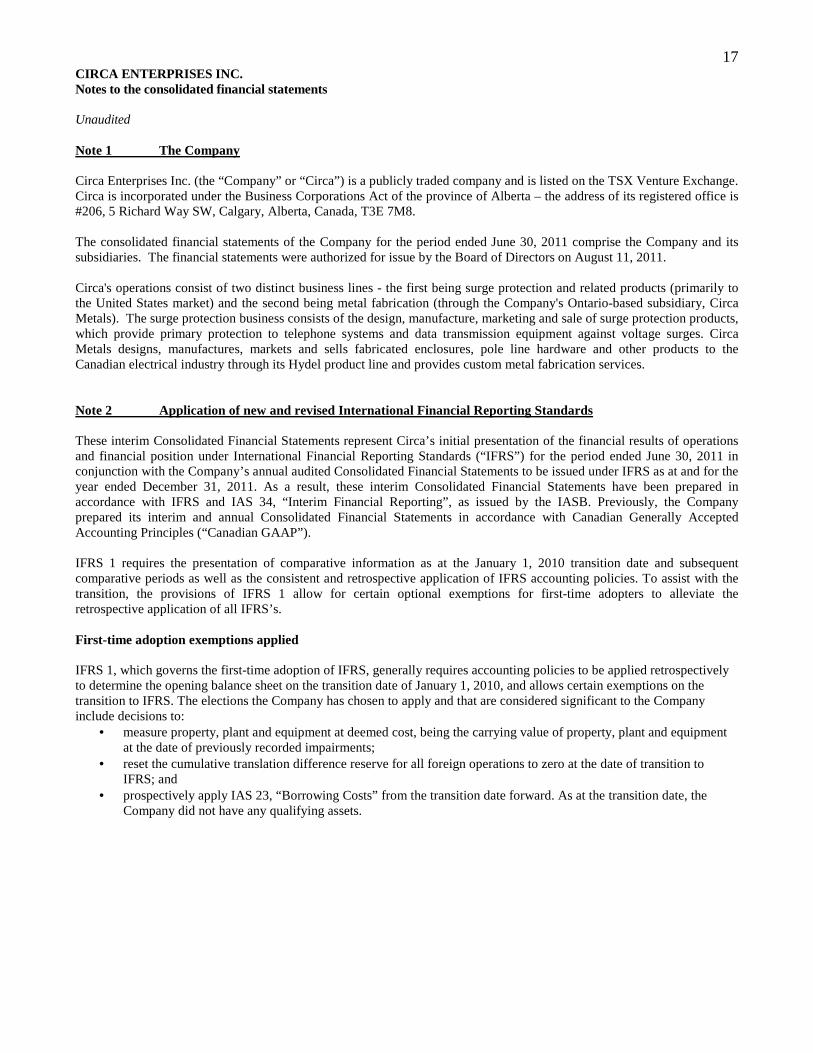
17 CIRCA ENTERPRISES INC. Notes to the consolidated financial statements Unaudited Note 1 The Company Circa Enterprises Inc. (the “Company” or “Circa”) is a publicly traded company and is listed on the TSX Venture Exchange. Circa is incorporated under the Business Corporations Act of the province of Alberta – the address of its registered office is #206, 5 Richard Way SW, Calgary, Alberta, Canada, T3E 7M8. The consolidated financial statements of the Company for the period ended June 30, 2011 comprise the Company and its subsidiaries. The financial statements were authorized for issue by the Board of Directors on August 11, 2011. Circa's operations consist of two distinct business lines - the first being surge protection and related products (primarily to the United States market) and the second being metal fabrication (through the Company's Ontario-based subsidiary, Circa Metals). The surge protection business consists of the design, manufacture, marketing and sale of surge protection products, which provide primary protection to telephone systems and data transmission equipment against voltage surges. Circa Metals designs, manufactures, markets and sells fabricated enclosures, pole line hardware and other products to the Canadian electrical industry through its Hydel product line and provides custom metal fabrication services. Note 2 Application of new and revised International Financial Reporting Standards These interim Consolidated Financial Statements represent Circa’s initial presentation of the financial results of operations and financial position under International Financial Reporting Standards (“IFRS”) for the period ended June 30, 2011 in conjunction with the Company’s annual audited Consolidated Financial Statements to be issued under IFRS as at and for the year ended December 31, 2011. As a result, these interim Consolidated Financial Statements have been prepared in accordance with IFRS and IAS 34, “Interim Financial Reporting”, as issued by the IASB. Previously, the Company prepared its interim and annual Consolidated Financial Statements in accordance with Canadian Generally Accepted Accounting Principles (“Canadian GAAP”). IFRS 1 requires the presentation of comparative information as at the January 1, 2010 transition date and subsequent comparative periods as well as the consistent and retrospective application of IFRS accounting policies. To assist with the transition, the provisions of IFRS 1 allow for certain optional exemptions for first-time adopters to alleviate the retrospective application of all IFRS’s. First-time adoption exemptions applied IFRS 1, which governs the first-time adoption of IFRS, generally requires accounting policies to be applied retrospectively to determine the opening balance sheet on the transition date of January 1, 2010, and allows certain exemptions on the transition to IFRS. The elections the Company has chosen to apply and that are considered significant to the Company include decisions to:
• measure property, plant and equipment at deemed cost, being the carrying value of property, plant and equipment at the date of previously recorded impairments;
• reset the cumulative translation difference reserve for all foreign operations to zero at the date of transition to IFRS; and
• prospectively apply IAS 23, “Borrowing Costs” from the transition date forward. As at the transition date, the Company did not have any qualifying assets.
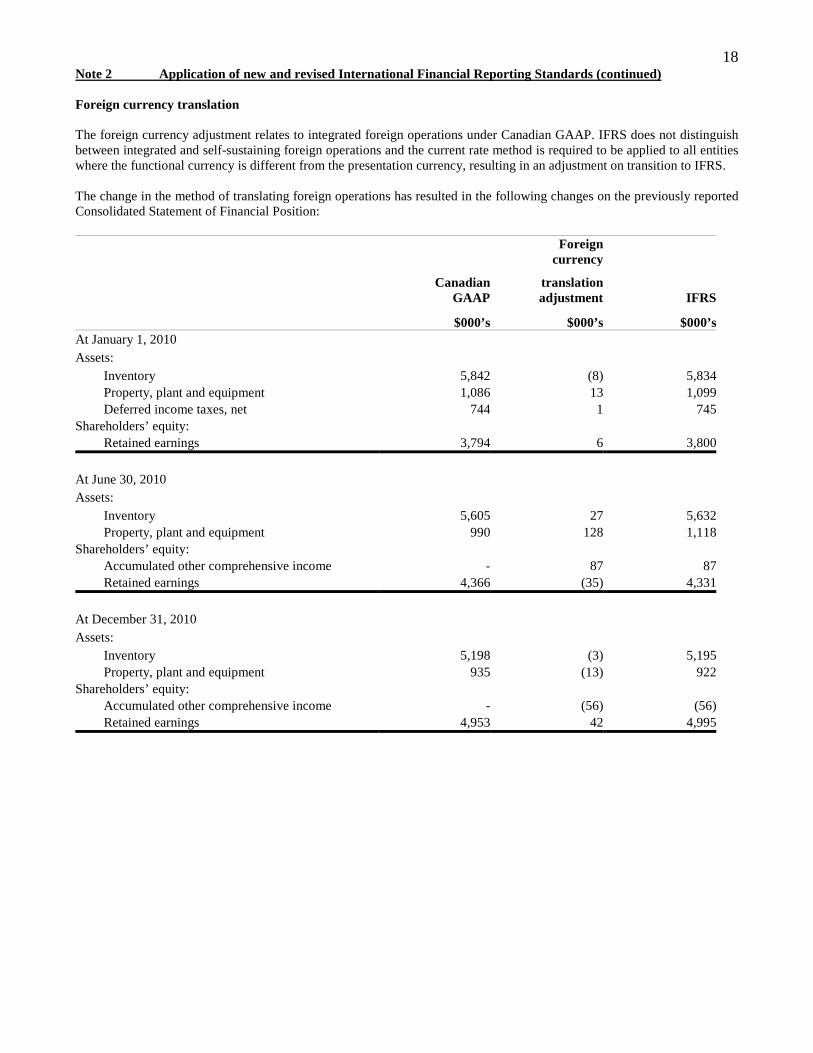
18 Note 2 Application of new and revised International Financial Reporting Standards (continued) Foreign currency translation The foreign currency adjustment relates to integrated foreign operations under Canadian GAAP. IFRS does not distinguish between integrated and self-sustaining foreign operations and the current rate method is required to be applied to all entities where the functional currency is different from the presentation currency, resulting in an adjustment on transition to IFRS. The change in the method of translating foreign operations has resulted in the following changes on the previously reported Consolidated Statement of Financial Position:
Canadian GAAP
Foreign currency
translation adjustment IFRS
$000’s $000’s $000’sAt January 1, 2010 Assets:
Inventory 5,842 (8) 5,834Property, plant and equipment 1,086 13 1,099Deferred income taxes, net 744 1 745
Shareholders’ equity: Retained earnings 3,794 6 3,800
At June 30, 2010 Assets:
Inventory 5,605 27 5,632Property, plant and equipment 990 128 1,118
Shareholders’ equity: Accumulated other comprehensive income - 87 87Retained earnings 4,366 (35) 4,331
At December 31, 2010 Assets:
Inventory 5,198 (3) 5,195Property, plant and equipment 935 (13) 922
Shareholders’ equity: Accumulated other comprehensive income - (56) (56)Retained earnings 4,953 42 4,995

19 Note 2 Application of new and revised International Financial Reporting Standards (continued) The change in the method of translating foreign operations has resulted in the following changes on the previously reported Consolidated Statement of Comprehensive Income:
Canadian GAAP
Foreign currency
translation adjustment IFRS
$000’s $000’s $000’sFor the three months ended June 30, 2010
Cost of sales (5,137) 3 (5,134)Selling, general and administrative expenses (1,004) 7 (997)Foreign currency translation gain 14 (14) -Income tax expense (151) (27) (178)Other comprehensive income - 78 78
For the six months ended June 30, 2010
Cost of sales (9,285) 61 (9,224)Selling, general and administrative expenses (2,006) (47) (2,053)Foreign currency translation gain 49 (49) -Income tax expense (217) (3) (220)Other comprehensive income - 87 87
For the year ended December 30, 2010
Cost of sales (19,859) (11) (19,870) Selling, general and administrative expenses (4,224) (13) (4,237) Foreign currency translation loss (24) 24 - Income tax expense (498) 34 (464) Other comprehensive income - (56) (56)
Financial statement presentation changes The transition to IFRS has resulted in numerous financial statement presentation changes in the financial statements, most significantly on the consolidated statement of income. The changes to the Consolidated Statement of Financial Position relate only to the further break-out of balances on the face of the statement including provisions, other assets, cumulative translation difference and deferred taxes. The changes to the Consolidated Statement of Cash Flows statement are a further break-out of the working capital items in cash from operations. The following is a summary of the significant changes to the Consolidated Statement of Comprehensive Income:
• Expenses by function and nature – the Consolidated Statement of Comprehensive Income presents expenses by function. Accordingly, depreciation and amortization is no longer presented as a separate item on the Consolidated Statement of Comprehensive Income but is included in cost of sales.
• Finance expense – under IFRS, finance expense includes interest on debt along with other items related to financing costs; however none of these other types of costs are applicable to Circa in these consolidated financial statements.
The above changes are reclassifications within the Consolidated Statement of Comprehensive Income so there is no net impact to profit as a result of these presentation changes.
20 Note 3 Significant accounting policies Basis of presentation These consolidated financial statements have been prepared in accordance with IFRS as adopted by the International Accounting Standards Board. These consolidated financial statements are the Company’s first financial statements prepared under IFRS. The Company adopted IFRS in accordance with IFRS 1 First-time Adoption of International Financial Reporting Standards (“IFRS 1”) with a transition date to IFRS of January 1, 2010. Consequently the comparative figures for 2010 and the Company’s statement of financial position as at January 1, 2010 have been restated from Canadian generally accounting principles (“Canadian GAAP”) to comply with IFRS. The reconciliations to IFRS from the previously published Canadian GAAP consolidated financial statements are summarized in Note 2. In addition, IFRS 1 allows certain exemptions from retrospective application of IFRS in the opening statement of financial position. Where these have been used they are explained in Note 2. Any standards and interpretations that have been issued but are not yet effective, and that are available for early application, have not been applied to the Company in these financial statements. Application of the majority of these standards and interpretations is not expected to have a material effect on the financial statements in the future. These adjusted financial statements have not been audited and therefore the 2011 annual financial statements may differ for differences in interpretation of IFRS standards, new pronouncements or other items that may be identified during an audit. Basis of consolidation The financial statements of Circa consolidate the financial statements of Circa and its subsidiaries, Circa Telecom (U.S.A.) Inc. (“Circa U.S.A.”) and Circa Metals Inc. (“Circa Metals”). Businesses acquired or disposed during the period are consolidated from the effective date of acquisition or until the effective date of disposal. All intra-company transactions, balances, income and expenses are eliminated on consolidation. Basis of measurement These interim consolidated financial statements are stated in Canadian dollars and were prepared on a going concern basis, under historical cost convention except for available-for-sale financial assets which are measured at fair value. Foreign currency translation Items included in the consolidated financial statements of each of the Company's subsidiaries are measured using the currency of the primary economic environment in which the entity operates (the "functional currency"). Foreign currency transactions are translated into the functional currency using the exchange rates prevailing at the dates of the transaction. Foreign exchange gains and losses resulting from the settlement of such transactions and from the translation of monetary assets and liabilities not denominated in the functional currency of an entity are recognized in the Consolidated Statement of Comprehensive Income. Assets and liabilities of foreign operations with functional currencies other than Canadian dollars are translated at the period end rates of exchange, and the results of their operations are translated at average rates of exchange for the period. The resulting translation adjustments are included in Translation Reserve in shareholders' equity.
21 Note 3 Accounting policies (continued) Significant accounting estimates and assumptions The preparation of the consolidated financial statements in conformity with IFRS requires management to make estimates, assumptions and judgments that affect the reported amounts of assets, liabilities and contingent liabilities at the date of the consolidated financial statements and reported amounts of revenues and expenses during the reporting period. Estimates, assumptions and judgments are continuously evaluated and are based on management’s experience and other factors, including expectations of future events that are believed to be reasonable under the circumstances. Actual outcomes can differ from these estimates. The key sources of estimation uncertainty that have a significant risk of causing material adjustment to the amounts recognized in the consolidated financial statements are: Useful lives of property and equipment The Company estimates the useful lives of property and equipment based on the period over which the assets are expected to be available for use. The estimated useful lives of property and equipment are reviewed periodically and are updated if expectations differ from previous estimates due to physical wear and tear, technical or commercial obsolescence and legal or other limits on the use of the relevant assets. In addition, the estimation of the useful lives of property and equipment are based on internal evaluation and experience with similar assets. It is possible, however, that future results of operations could be materially affected by changes in the estimates brought about by changes in factors mentioned above. The amounts and timing of recorded expenses for any period would be affected by changes in these factors and circumstances. A reduction in the estimated useful lives of the property and equipment would increase the recorded expenses and decrease the non-current assets. Fair value of financial instruments The estimated fair value of financial assets and liabilities, by their very nature, are subject to measurement uncertainty. Impairment of non-financial assets Impairment exists when the carrying value of an asset or cash generating unit exceeds its recoverable amount, which is the higher of its fair value less costs to sell and its value in use. The fair value less costs to sell calculation is based on available data from binding sales transactions in an arm’s length transaction of similar assets or observable market prices less incremental costs for disposing of the asset. The value in use calculation is based on a discounted cash flow model. The estimated future cash flows are derived from management estimates, budgets and past performance and do not include activities that the Company is not yet committed to or significant future investments that will enhance the asset’s performance of the cash generating unit being tested. The recoverable amount is sensitive to the discount rate used for the discounted cash flow model as well as the expected future cash inflows and the growth rate used for extrapolation purposes. Taxes Provisions for taxes are made using the best estimate of the amount expected to be paid based on a qualitative assessment of all relevant factors. The Company reviews the adequacy of these provisions at the end of the reporting period. However, it is possible that at some future date an additional liability could result from audits by taxing authorities. Where the final outcome of these tax-related matters is different from the amounts that were initially recorded, such differences will affect the tax provisions in the period in which such determination is made. Transfer pricing The Company has conducted a study of its internal policies with respect to cross-border transfer pricing on surge protection sales between Canada and the United States. The consolidated income tax provision provided herein has been based on management’s best estimate of the pricing as documented in its transfer pricing study. All other intersegment sales are recorded at the exchange amount which approximates amounts charged to or by unrelated parties.
22 Note 3 Accounting policies (continued) Revenue recognition The Company recognizes revenue when the product is shipped and ownership is transferred to the customer and the price charged to customers is fixed and determinable and collectability is reasonably assured. Taxes Tax expense comprises current and deferred tax. Tax is recognized in the Consolidated Statement of Comprehensive Income except to the extent it relates to items recognized in other comprehensive income or directly in equity. Current Income tax Current tax expense is based on the results for the period as adjusted for items that are not taxable or not deductible. Current tax is calculated using tax rates and laws that were enacted or substantively enacted at the end of the reporting period. Management periodically evaluates positions taken in tax returns with respect to situations in which applicable tax regulation is subject to interpretation. Provisions are established where appropriate on the basis of amounts expected to be paid to the tax authorities. Deferred tax Deferred taxes are the taxes expected to be payable or recoverable on differences between the carrying amounts of assets in the Consolidated Statement of Financial Position and their corresponding tax bases used in the computation of taxable profit, and are accounted for using the balance sheet asset and liability method. Deferred tax liabilities are generally recognized for all taxable temporary differences between the carrying amounts of assets and their corresponding tax bases. Deferred tax assets are recognized to the extent that it is probable that taxable profits will be available against which deductible temporary differences can be utilized. Such assets and liabilities are not recognized if the temporary difference arises from the initial recognition of goodwill or from the initial recognition (other than in a business combination) of other assets in a transaction that affects neither the taxable profit nor the accounting profit. Earnings per share Basic earnings per share is calculated based on the weighted average number of common shares outstanding during the year. Diluted earnings per share is calculated based on the treasury stock method which takes into consideration the dilutive effect of the potential exercise of stock options as though they occurred at the beginning of the year. Cash Cash represents cash on hand, and balances with banks. Inventory Raw materials are valued at the lower of standard cost, which approximates actual cost, and net realizable value. Finished goods and work in process are valued at the lower of standard cost and net realizable value. Standard cost, which approximates actual cost, includes raw material, labour, and manufacturing overhead. The Company reverses previously recorded write-downs to realizable value when there is clear evidence that net realizable value has increased.
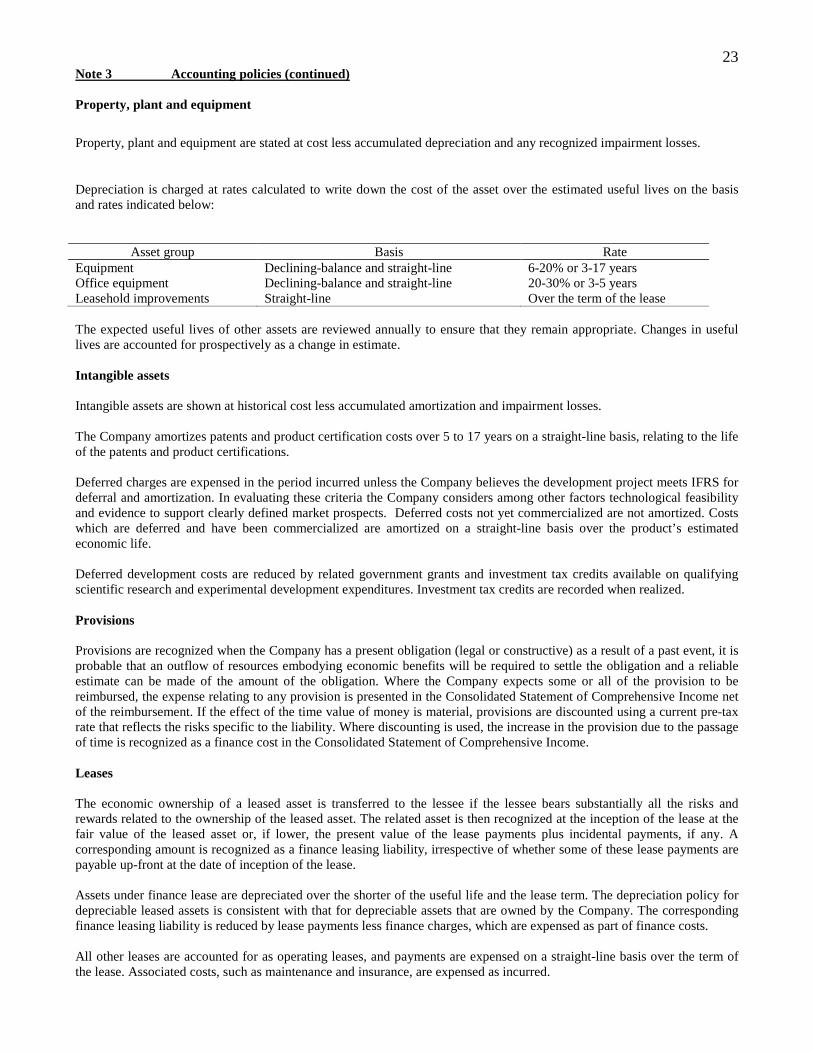
23 Note 3 Accounting policies (continued) Property, plant and equipment
Property, plant and equipment are stated at cost less accumulated depreciation and any recognized impairment losses.
Depreciation is charged at rates calculated to write down the cost of the asset over the estimated useful lives on the basis and rates indicated below:
Asset group Basis Rate Equipment Declining-balance and straight-line 6-20% or 3-17 years Office equipment Declining-balance and straight-line 20-30% or 3-5 years Leasehold improvements Straight-line Over the term of the lease The expected useful lives of other assets are reviewed annually to ensure that they remain appropriate. Changes in useful lives are accounted for prospectively as a change in estimate. Intangible assets Intangible assets are shown at historical cost less accumulated amortization and impairment losses. The Company amortizes patents and product certification costs over 5 to 17 years on a straight-line basis, relating to the life of the patents and product certifications. Deferred charges are expensed in the period incurred unless the Company believes the development project meets IFRS for deferral and amortization. In evaluating these criteria the Company considers among other factors technological feasibility and evidence to support clearly defined market prospects. Deferred costs not yet commercialized are not amortized. Costs which are deferred and have been commercialized are amortized on a straight-line basis over the product’s estimated economic life. Deferred development costs are reduced by related government grants and investment tax credits available on qualifying scientific research and experimental development expenditures. Investment tax credits are recorded when realized. Provisions Provisions are recognized when the Company has a present obligation (legal or constructive) as a result of a past event, it is probable that an outflow of resources embodying economic benefits will be required to settle the obligation and a reliable estimate can be made of the amount of the obligation. Where the Company expects some or all of the provision to be reimbursed, the expense relating to any provision is presented in the Consolidated Statement of Comprehensive Income net of the reimbursement. If the effect of the time value of money is material, provisions are discounted using a current pre-tax rate that reflects the risks specific to the liability. Where discounting is used, the increase in the provision due to the passage of time is recognized as a finance cost in the Consolidated Statement of Comprehensive Income. Leases The economic ownership of a leased asset is transferred to the lessee if the lessee bears substantially all the risks and rewards related to the ownership of the leased asset. The related asset is then recognized at the inception of the lease at the fair value of the leased asset or, if lower, the present value of the lease payments plus incidental payments, if any. A corresponding amount is recognized as a finance leasing liability, irrespective of whether some of these lease payments are payable up-front at the date of inception of the lease. Assets under finance lease are depreciated over the shorter of the useful life and the lease term. The depreciation policy for depreciable leased assets is consistent with that for depreciable assets that are owned by the Company. The corresponding finance leasing liability is reduced by lease payments less finance charges, which are expensed as part of finance costs. All other leases are accounted for as operating leases, and payments are expensed on a straight-line basis over the term of the lease. Associated costs, such as maintenance and insurance, are expensed as incurred.

24 Note 3 Accounting policies (continued) Impairment of non-financial assets Property, plant and equipment and intangible assets are tested at least annually for impairment. At the end of each reporting period, the Company reviews the carrying amounts of its assets that are subject to depreciation and amortization to determine whether there is any indication that those assets have suffered an impairment loss. If any such indication exists, the recoverable amount of the asset or group of assets is estimated in order to determine the extent of the impairment loss (if any). Recoverable amount is the higher of fair value less costs to sell and value in use. In assessing value in use, the estimated future cash flows are discounted to their present value using a pre-tax discount rate that reflects current market assessments of the time value of money and the risks specific to the asset for which the estimates of future cash flows have not been adjusted. If the recoverable amount of an asset or group of assets is estimated to be less than its carrying amount, the carrying amount is reduced to its recoverable amount. An impairment loss is recognized immediately in profit or loss. When there are indicators that the conditions giving rise to the impairment previously recognized have reversed, then the reversal of the impairment loss is reversed in the Statement of Comprehensive Income in the period. Share based compensation Equity-settled share-based payments to employees and others providing similar services are measured at the fair value of the equity instruments at the grant date. The fair value determined at the grant date of the equity-settled share-based payments is expensed on a straight-line basis over the vesting period, based on the Company’s estimate of equity instruments that will eventually vest. At the end of each reporting period, the Company revises its estimate of the number of equity instruments expected to vest. The impact of the revision of the original estimates, if any, is recognized in profit or loss such that the cumulative expense reflects the revised estimate, with a corresponding adjustment to the equity-settled employee benefits reserve. Equity-settled share-based payment transactions with parties other than employees are measured at the fair value of the goods or services received, except where that fair value cannot be estimated reliably, in which case they are measured at the fair value of the equity instruments granted, measured at the date the entity obtains the goods or the counterparty renders the service. Share acquisition plan Under the terms of the share acquisition plan, common shares may be issued at fair value from the treasury of the Company or may be purchased in the market by a plan administrator under the direction of the board of directors. If the shares are issued from treasury, the fair value is calculated as the weighted average trading price per share for the common shares for the 10 consecutive trading days preceding the date the director provides notification to the Company in accordance with the plan. Financial instruments All financial instruments must initially be recognized at fair value on the statement of financial position. The Corporation has classified each financial instrument into the following categories:
Financial assets and financial liabilities at fair value through profit or loss; Loans and receivables; Held to maturity; Financial assets available for sale; and Other financial liabilities.
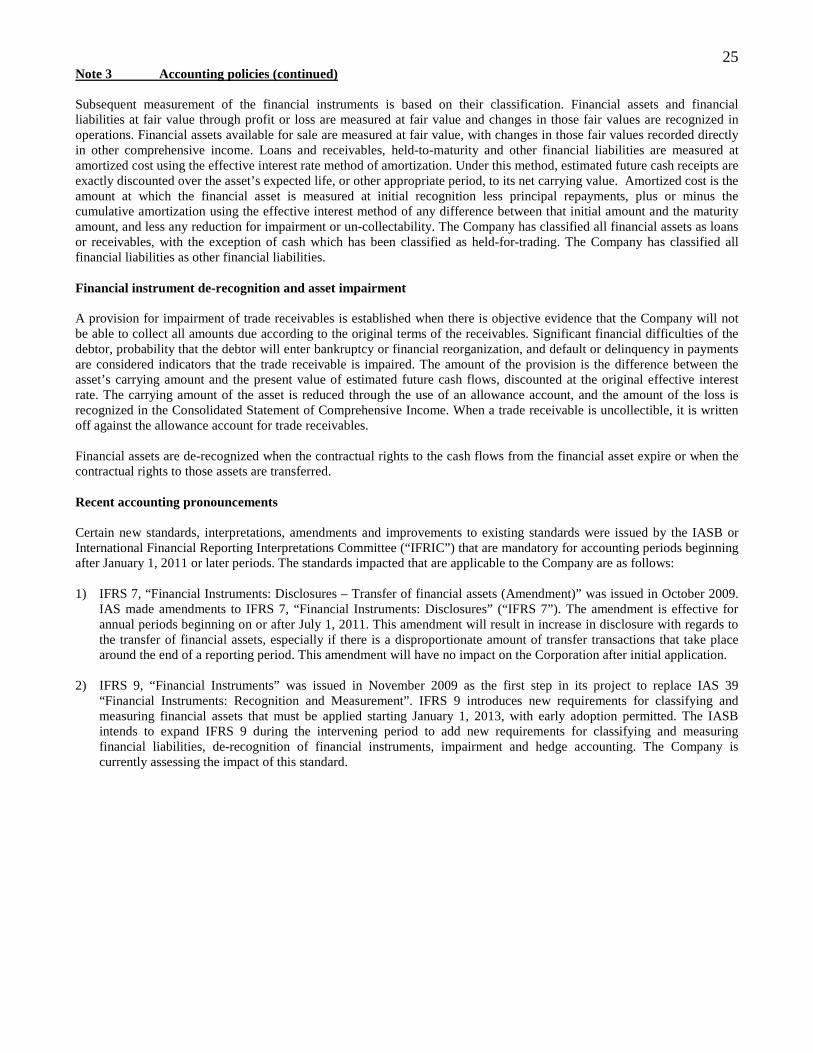
25 Note 3 Accounting policies (continued) Subsequent measurement of the financial instruments is based on their classification. Financial assets and financial liabilities at fair value through profit or loss are measured at fair value and changes in those fair values are recognized in operations. Financial assets available for sale are measured at fair value, with changes in those fair values recorded directly in other comprehensive income. Loans and receivables, held-to-maturity and other financial liabilities are measured at amortized cost using the effective interest rate method of amortization. Under this method, estimated future cash receipts are exactly discounted over the asset’s expected life, or other appropriate period, to its net carrying value. Amortized cost is the amount at which the financial asset is measured at initial recognition less principal repayments, plus or minus the cumulative amortization using the effective interest method of any difference between that initial amount and the maturity amount, and less any reduction for impairment or un-collectability. The Company has classified all financial assets as loans or receivables, with the exception of cash which has been classified as held-for-trading. The Company has classified all financial liabilities as other financial liabilities. Financial instrument de-recognition and asset impairment A provision for impairment of trade receivables is established when there is objective evidence that the Company will not be able to collect all amounts due according to the original terms of the receivables. Significant financial difficulties of the debtor, probability that the debtor will enter bankruptcy or financial reorganization, and default or delinquency in payments are considered indicators that the trade receivable is impaired. The amount of the provision is the difference between the asset’s carrying amount and the present value of estimated future cash flows, discounted at the original effective interest rate. The carrying amount of the asset is reduced through the use of an allowance account, and the amount of the loss is recognized in the Consolidated Statement of Comprehensive Income. When a trade receivable is uncollectible, it is written off against the allowance account for trade receivables. Financial assets are de-recognized when the contractual rights to the cash flows from the financial asset expire or when the contractual rights to those assets are transferred. Recent accounting pronouncements Certain new standards, interpretations, amendments and improvements to existing standards were issued by the IASB or International Financial Reporting Interpretations Committee (“IFRIC”) that are mandatory for accounting periods beginning after January 1, 2011 or later periods. The standards impacted that are applicable to the Company are as follows: 1) IFRS 7, “Financial Instruments: Disclosures – Transfer of financial assets (Amendment)” was issued in October 2009.
IAS made amendments to IFRS 7, “Financial Instruments: Disclosures” (“IFRS 7”). The amendment is effective for annual periods beginning on or after July 1, 2011. This amendment will result in increase in disclosure with regards to the transfer of financial assets, especially if there is a disproportionate amount of transfer transactions that take place around the end of a reporting period. This amendment will have no impact on the Corporation after initial application.
2) IFRS 9, “Financial Instruments” was issued in November 2009 as the first step in its project to replace IAS 39 “Financial Instruments: Recognition and Measurement”. IFRS 9 introduces new requirements for classifying and measuring financial assets that must be applied starting January 1, 2013, with early adoption permitted. The IASB intends to expand IFRS 9 during the intervening period to add new requirements for classifying and measuring financial liabilities, de-recognition of financial instruments, impairment and hedge accounting. The Company is currently assessing the impact of this standard.
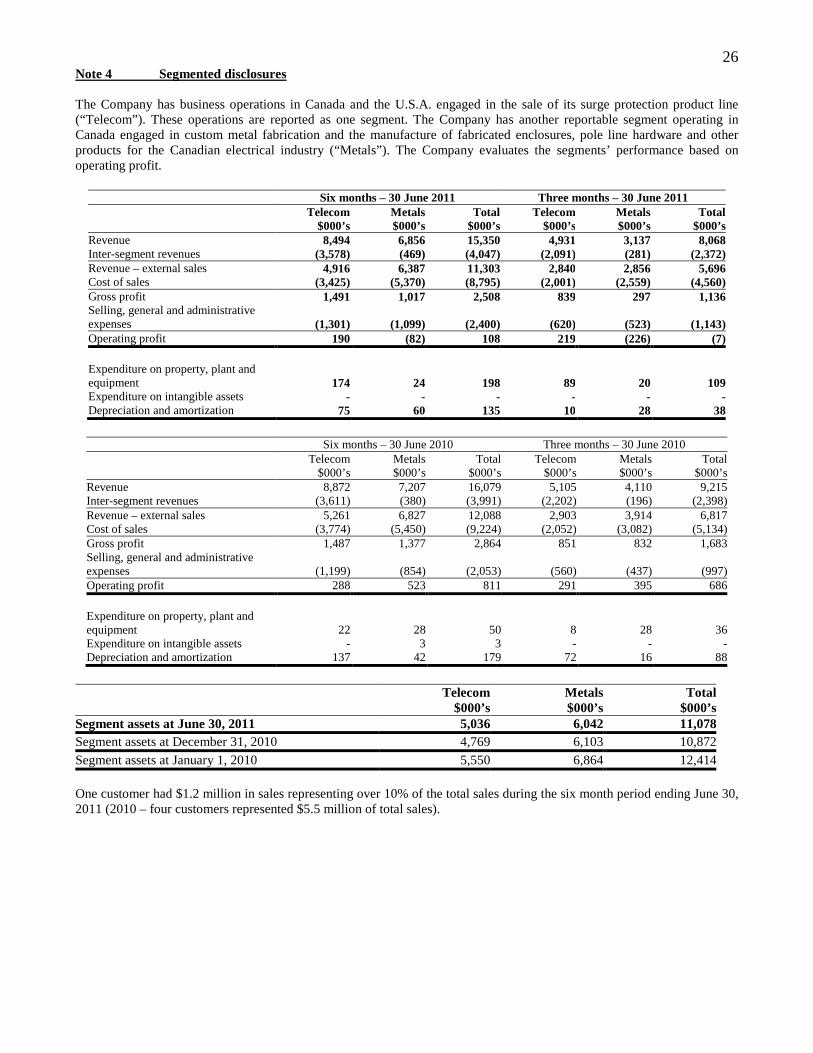
26 Note 4 Segmented disclosures The Company has business operations in Canada and the U.S.A. engaged in the sale of its surge protection product line (“Telecom”). These operations are reported as one segment. The Company has another reportable segment operating in Canada engaged in custom metal fabrication and the manufacture of fabricated enclosures, pole line hardware and other products for the Canadian electrical industry (“Metals”). The Company evaluates the segments’ performance based on operating profit.
Six months – 30 June 2011 Three months – 30 June 2011 Telecom Metals Total Telecom Metals Total $000’s $000’s $000’s $000’s $000’s $000’sRevenue 8,494 6,856 15,350 4,931 3,137 8,068Inter-segment revenues (3,578) (469) (4,047) (2,091) (281) (2,372)Revenue – external sales 4,916 6,387 11,303 2,840 2,856 5,696Cost of sales (3,425) (5,370) (8,795) (2,001) (2,559) (4,560)Gross profit 1,491 1,017 2,508 839 297 1,136Selling, general and administrative expenses (1,301) (1,099) (2,400) (620) (523) (1,143)Operating profit 190 (82) 108 219 (226) (7) Expenditure on property, plant and equipment 174 24 198 89 20 109Expenditure on intangible assets - - - - - -Depreciation and amortization 75 60 135 10 28 38
Six months – 30 June 2010 Three months – 30 June 2010 Telecom Metals Total Telecom Metals Total $000’s $000’s $000’s $000’s $000’s $000’s Revenue 8,872 7,207 16,079 5,105 4,110 9,215 Inter-segment revenues (3,611) (380) (3,991) (2,202) (196) (2,398) Revenue – external sales 5,261 6,827 12,088 2,903 3,914 6,817 Cost of sales (3,774) (5,450) (9,224) (2,052) (3,082) (5,134) Gross profit 1,487 1,377 2,864 851 832 1,683 Selling, general and administrative expenses (1,199) (854) (2,053) (560) (437) (997) Operating profit 288 523 811 291 395 686
Expenditure on property, plant and equipment 22 28 50 8 28 36 Expenditure on intangible assets - 3 3 - - - Depreciation and amortization 137 42 179 72 16 88
Telecom Metals Total $000’s $000’s $000’sSegment assets at June 30, 2011 5,036 6,042 11,078Segment assets at December 31, 2010 4,769 6,103 10,872Segment assets at January 1, 2010 5,550 6,864 12,414 One customer had $1.2 million in sales representing over 10% of the total sales during the six month period ending June 30, 2011 (2010 – four customers represented $5.5 million of total sales).
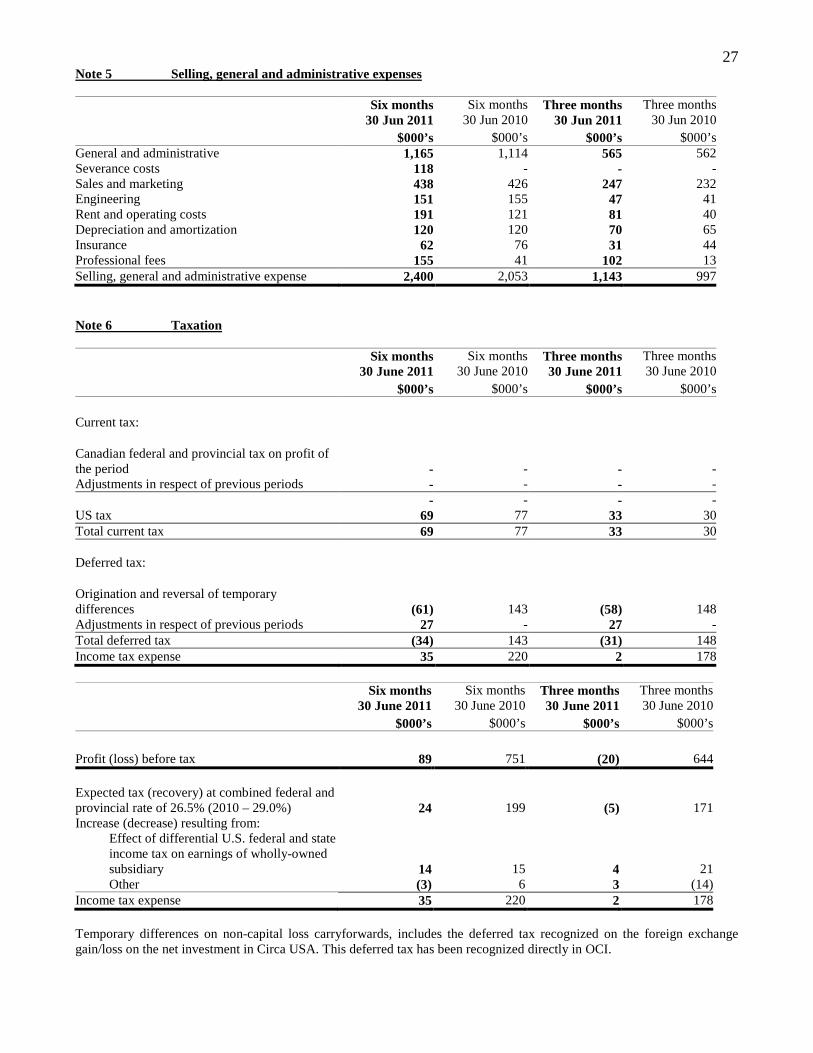
27 Note 5 Selling, general and administrative expenses
Six months 30 Jun 2011
Six months 30 Jun 2010
Three months 30 Jun 2011
Three months 30 Jun 2010
$000’s $000’s $000’s $000’sGeneral and administrative 1,165 1,114 565 562 Severance costs 118 - - -Sales and marketing 438 426 247 232 Engineering 151 155 47 41 Rent and operating costs 191 121 81 40 Depreciation and amortization 120 120 70 65 Insurance 62 76 31 44 Professional fees 155 41 102 13 Selling, general and administrative expense 2,400 2,053 1,143 997 Note 6 Taxation
Six months
30 June 2011Six months
30 June 2010Three months 30 June 2011
Three months 30 June 2010
$000’s $000’s $000’s $000’s Current tax:
Canadian federal and provincial tax on profit of the period - - - -Adjustments in respect of previous periods - - - - - - - -US tax 69 77 33 30Total current tax 69 77 33 30 Deferred tax:
Origination and reversal of temporary differences (61) 143 (58) 148Adjustments in respect of previous periods 27 - 27 -Total deferred tax (34) 143 (31) 148Income tax expense 35 220 2 178
Six months
30 June 2011Six months
30 June 2010Three months 30 June 2011
Three months 30 June 2010
$000’s $000’s $000’s $000’s Profit (loss) before tax 89 751 (20) 644 Expected tax (recovery) at combined federal and provincial rate of 26.5% (2010 – 29.0%) 24 199 (5) 171Increase (decrease) resulting from:
Effect of differential U.S. federal and state income tax on earnings of wholly-owned subsidiary 14 15 4 21Other (3) 6 3 (14)
Income tax expense 35 220 2 178 Temporary differences on non-capital loss carryforwards, includes the deferred tax recognized on the foreign exchange gain/loss on the net investment in Circa USA. This deferred tax has been recognized directly in OCI.
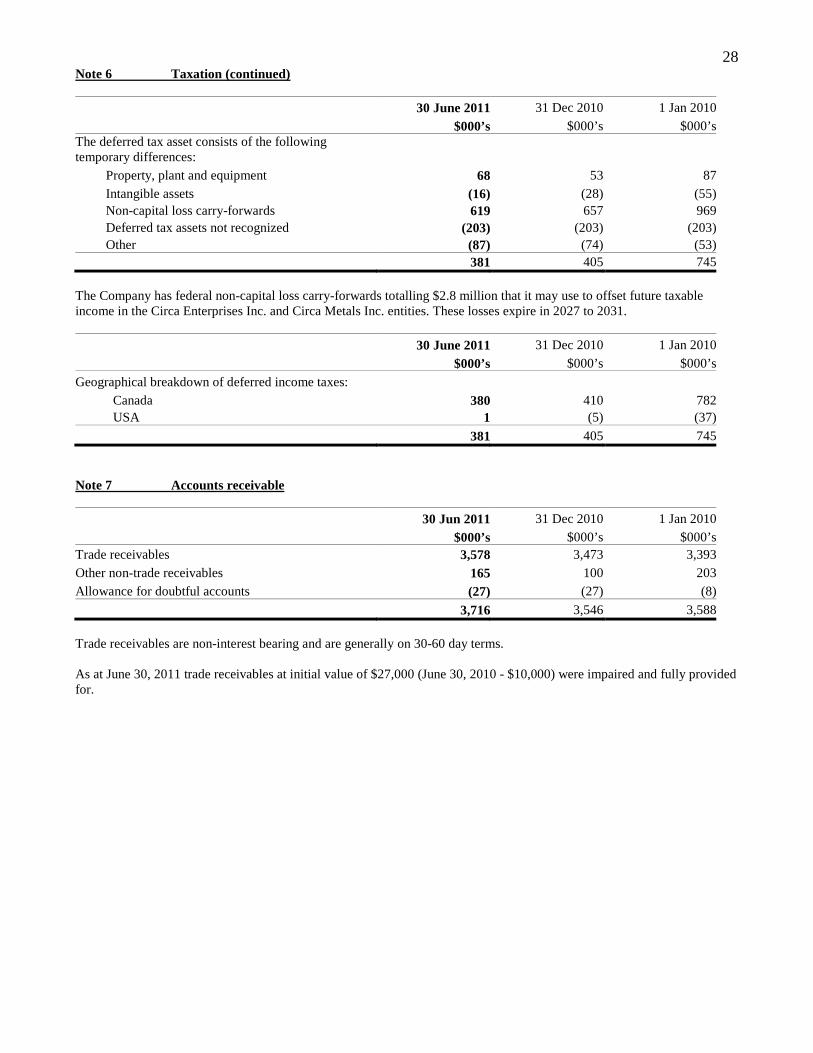
28 Note 6 Taxation (continued)
30 June 2011 31 Dec 2010 1 Jan 2010 $000’s $000’s $000’sThe deferred tax asset consists of the following temporary differences:
Property, plant and equipment 68 53 87Intangible assets (16) (28) (55)Non-capital loss carry-forwards 619 657 969Deferred tax assets not recognized (203) (203) (203)Other (87) (74) (53)
381 405 745 The Company has federal non-capital loss carry-forwards totalling $2.8 million that it may use to offset future taxable income in the Circa Enterprises Inc. and Circa Metals Inc. entities. These losses expire in 2027 to 2031.
30 June 2011 31 Dec 2010 1 Jan 2010 $000’s $000’s $000’s
Geographical breakdown of deferred income taxes: Canada 380 410 782USA 1 (5) (37)
381 405 745 Note 7 Accounts receivable
30 Jun 2011 31 Dec 2010 1 Jan 2010 $000’s $000’s $000’sTrade receivables 3,578 3,473 3,393Other non-trade receivables 165 100 203Allowance for doubtful accounts (27) (27) (8)
3,716 3,546 3,588 Trade receivables are non-interest bearing and are generally on 30-60 day terms. As at June 30, 2011 trade receivables at initial value of $27,000 (June 30, 2010 - $10,000) were impaired and fully provided for.
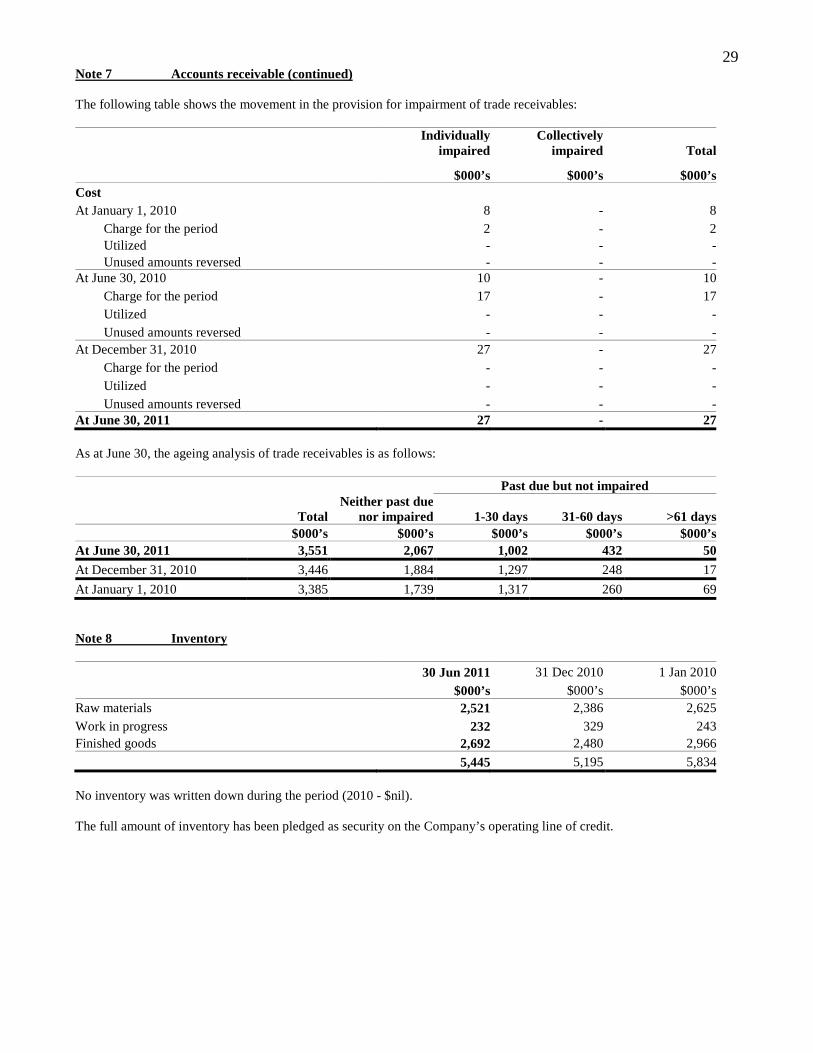
29 Note 7 Accounts receivable (continued) The following table shows the movement in the provision for impairment of trade receivables:
Individually impaired
Collectively impaired Total
$000’s $000’s $000’sCost At January 1, 2010 8 - 8
Charge for the period 2 - 2Utilized - - -Unused amounts reversed - - -
At June 30, 2010 10 - 10Charge for the period 17 - 17Utilized - - -Unused amounts reversed - - -
At December 31, 2010 27 - 27Charge for the period - - -Utilized - - -Unused amounts reversed - - -
At June 30, 2011 27 - 27 As at June 30, the ageing analysis of trade receivables is as follows:
Past due but not impaired
TotalNeither past due
nor impaired 1-30 days 31-60 days >61 days $000’s $000’s $000’s $000’s $000’sAt June 30, 2011 3,551 2,067 1,002 432 50
At December 31, 2010 3,446 1,884 1,297 248 17
At January 1, 2010 3,385 1,739 1,317 260 69 Note 8 Inventory
30 Jun 2011 31 Dec 2010 1 Jan 2010 $000’s $000’s $000’sRaw materials 2,521 2,386 2,625Work in progress 232 329 243Finished goods 2,692 2,480 2,966
5,445 5,195 5,834 No inventory was written down during the period (2010 - $nil). The full amount of inventory has been pledged as security on the Company’s operating line of credit.
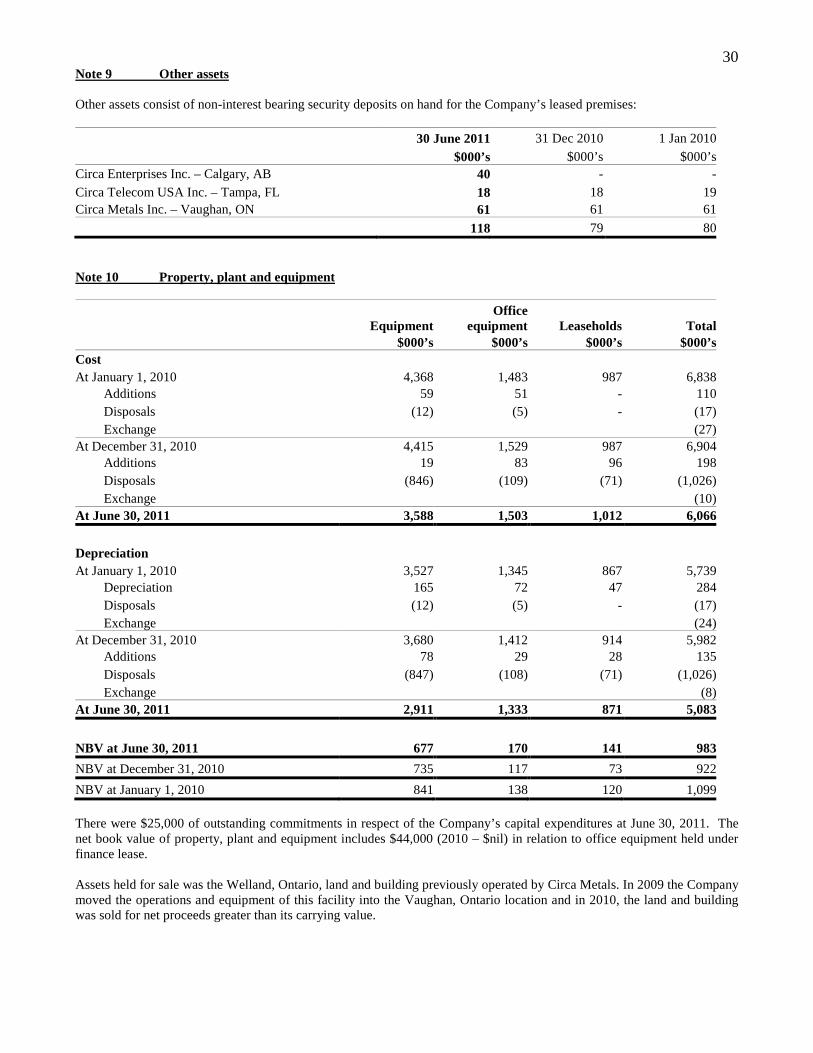
30 Note 9 Other assets Other assets consist of non-interest bearing security deposits on hand for the Company’s leased premises:
30 June 2011 31 Dec 2010 1 Jan 2010 $000’s $000’s $000’sCirca Enterprises Inc. – Calgary, AB 40 - -Circa Telecom USA Inc. – Tampa, FL 18 18 19Circa Metals Inc. – Vaughan, ON 61 61 61
118 79 80 Note 10 Property, plant and equipment
EquipmentOffice
equipment Leaseholds Total $000’s $000’s $000’s $000’sCost At January 1, 2010 4,368 1,483 987 6,838
Additions 59 51 - 110Disposals (12) (5) - (17)Exchange (27)
At December 31, 2010 4,415 1,529 987 6,904Additions 19 83 96 198Disposals (846) (109) (71) (1,026)Exchange (10)
At June 30, 2011 3,588 1,503 1,012 6,066
Depreciation At January 1, 2010 3,527 1,345 867 5,739
Depreciation 165 72 47 284Disposals (12) (5) - (17)Exchange (24)
At December 31, 2010 3,680 1,412 914 5,982Additions 78 29 28 135Disposals (847) (108) (71) (1,026)Exchange (8)
At June 30, 2011 2,911 1,333 871 5,083
NBV at June 30, 2011 677 170 141 983
NBV at December 31, 2010 735 117 73 922
NBV at January 1, 2010 841 138 120 1,099 There were $25,000 of outstanding commitments in respect of the Company’s capital expenditures at June 30, 2011. The net book value of property, plant and equipment includes $44,000 (2010 – $nil) in relation to office equipment held under finance lease. Assets held for sale was the Welland, Ontario, land and building previously operated by Circa Metals. In 2009 the Company moved the operations and equipment of this facility into the Vaughan, Ontario location and in 2010, the land and building was sold for net proceeds greater than its carrying value.
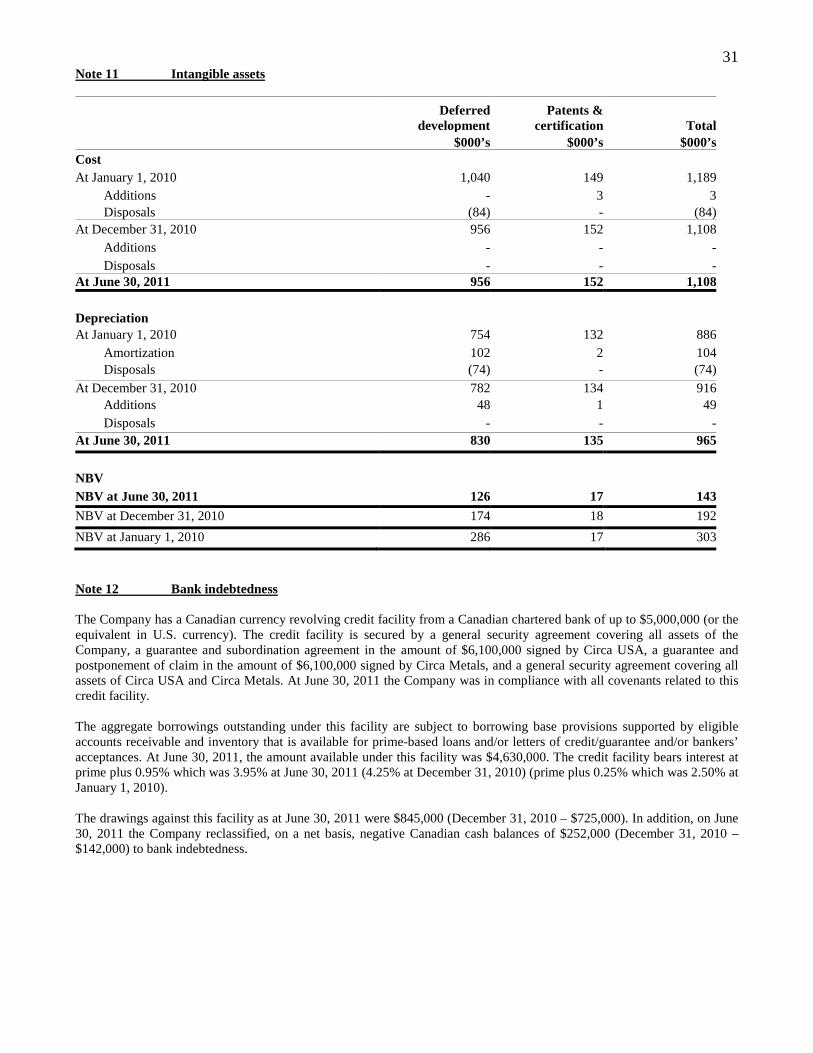
31 Note 11 Intangible assets
Deferred
developmentPatents &
certification Total $000’s $000’s $000’sCost At January 1, 2010 1,040 149 1,189
Additions - 3 3Disposals (84) - (84)
At December 31, 2010 956 152 1,108Additions - - -Disposals - - -
At June 30, 2011 956 152 1,108 Depreciation At January 1, 2010 754 132 886
Amortization 102 2 104Disposals (74) - (74)
At December 31, 2010 782 134 916Additions 48 1 49Disposals - - -
At June 30, 2011 830 135 965
NBV NBV at June 30, 2011 126 17 143
NBV at December 31, 2010 174 18 192
NBV at January 1, 2010 286 17 303
Note 12 Bank indebtedness The Company has a Canadian currency revolving credit facility from a Canadian chartered bank of up to $5,000,000 (or the equivalent in U.S. currency). The credit facility is secured by a general security agreement covering all assets of the Company, a guarantee and subordination agreement in the amount of $6,100,000 signed by Circa USA, a guarantee and postponement of claim in the amount of $6,100,000 signed by Circa Metals, and a general security agreement covering all assets of Circa USA and Circa Metals. At June 30, 2011 the Company was in compliance with all covenants related to this credit facility. The aggregate borrowings outstanding under this facility are subject to borrowing base provisions supported by eligible accounts receivable and inventory that is available for prime-based loans and/or letters of credit/guarantee and/or bankers’ acceptances. At June 30, 2011, the amount available under this facility was $4,630,000. The credit facility bears interest at prime plus 0.95% which was 3.95% at June 30, 2011 (4.25% at December 31, 2010) (prime plus 0.25% which was 2.50% at January 1, 2010). The drawings against this facility as at June 30, 2011 were $845,000 (December 31, 2010 – $725,000). In addition, on June 30, 2011 the Company reclassified, on a net basis, negative Canadian cash balances of $252,000 (December 31, 2010 – $142,000) to bank indebtedness.
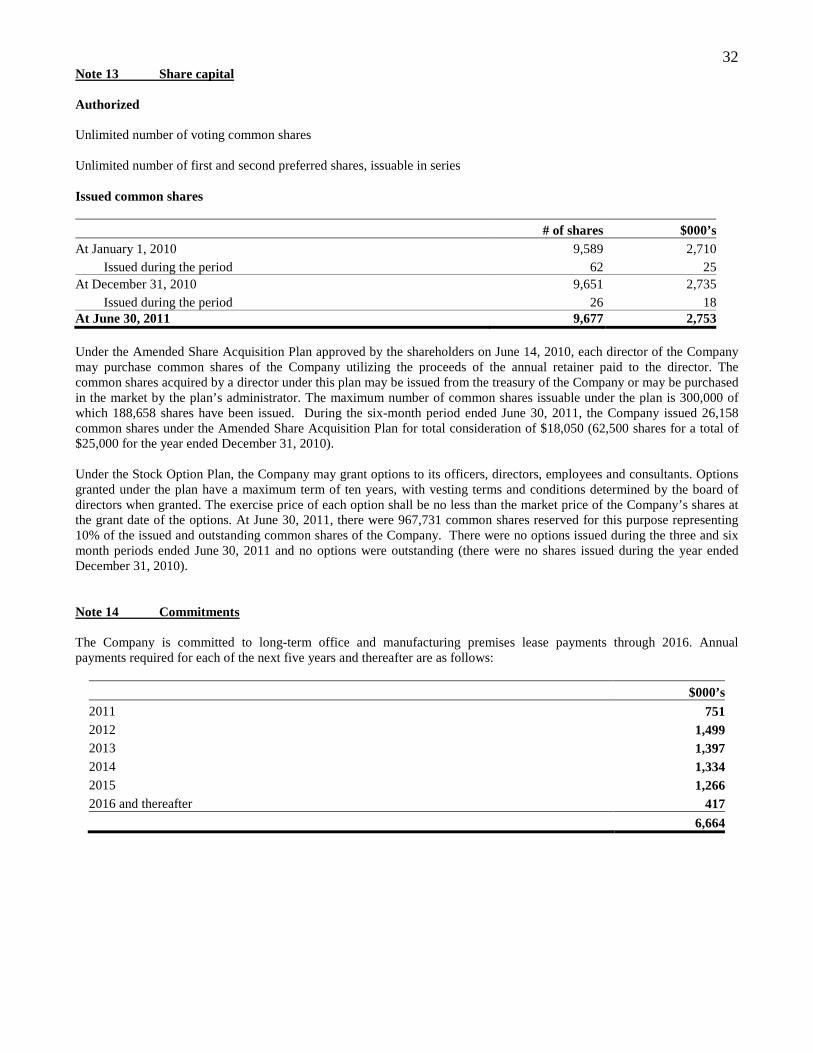
32 Note 13 Share capital Authorized Unlimited number of voting common shares Unlimited number of first and second preferred shares, issuable in series Issued common shares
# of shares $000’s At January 1, 2010 9,589 2,710
Issued during the period 62 25At December 31, 2010 9,651 2,735
Issued during the period 26 18At June 30, 2011 9,677 2,753 Under the Amended Share Acquisition Plan approved by the shareholders on June 14, 2010, each director of the Company may purchase common shares of the Company utilizing the proceeds of the annual retainer paid to the director. The common shares acquired by a director under this plan may be issued from the treasury of the Company or may be purchased in the market by the plan’s administrator. The maximum number of common shares issuable under the plan is 300,000 of which 188,658 shares have been issued. During the six-month period ended June 30, 2011, the Company issued 26,158 common shares under the Amended Share Acquisition Plan for total consideration of $18,050 (62,500 shares for a total of $25,000 for the year ended December 31, 2010). Under the Stock Option Plan, the Company may grant options to its officers, directors, employees and consultants. Options granted under the plan have a maximum term of ten years, with vesting terms and conditions determined by the board of directors when granted. The exercise price of each option shall be no less than the market price of the Company’s shares at the grant date of the options. At June 30, 2011, there were 967,731 common shares reserved for this purpose representing 10% of the issued and outstanding common shares of the Company. There were no options issued during the three and six month periods ended June 30, 2011 and no options were outstanding (there were no shares issued during the year ended December 31, 2010). Note 14 Commitments The Company is committed to long-term office and manufacturing premises lease payments through 2016. Annual payments required for each of the next five years and thereafter are as follows:
$000’s2011 7512012 1,4992013 1,3972014 1,3342015 1,2662016 and thereafter 417 6,664
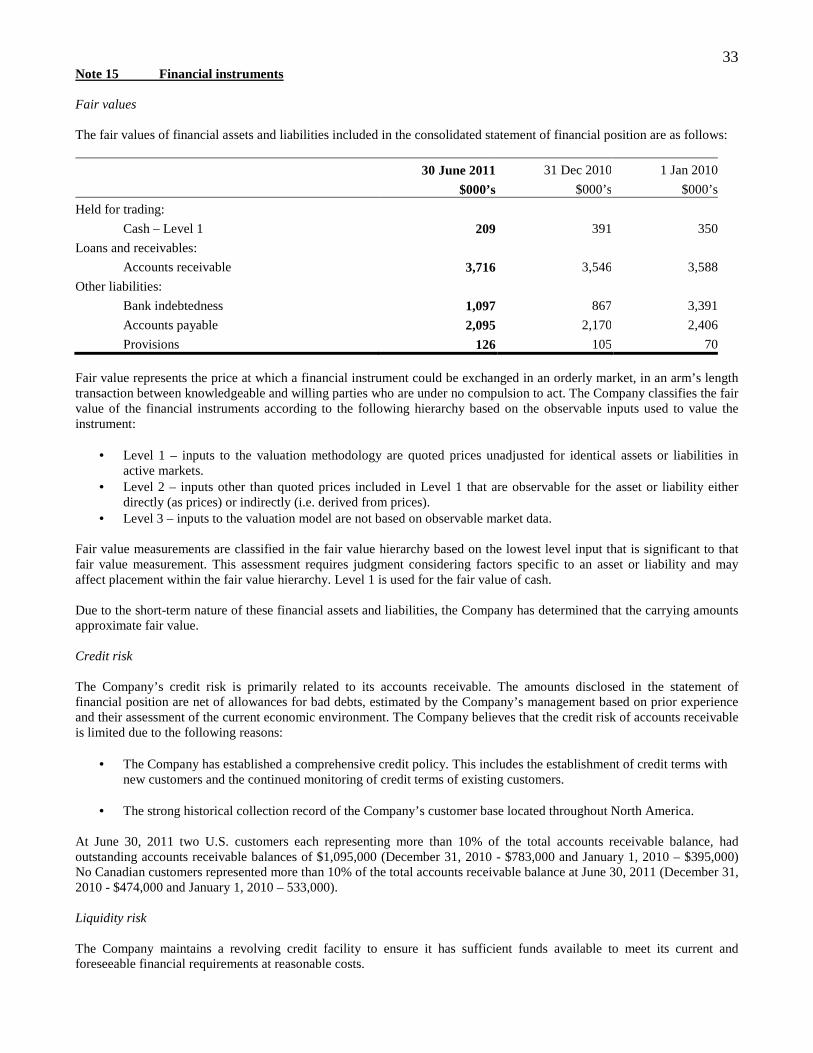
33 Note 15 Financial instruments Fair values The fair values of financial assets and liabilities included in the consolidated statement of financial position are as follows:
30 June 2011 31 Dec 2010 1 Jan 2010
$000’s $000’s $000’s
Held for trading:
Cash – Level 1 209 391 350
Loans and receivables:
Accounts receivable 3,716 3,546 3,588
Other liabilities:
Bank indebtedness 1,097 867 3,391
Accounts payable 2,095 2,170 2,406
Provisions 126 105 70 Fair value represents the price at which a financial instrument could be exchanged in an orderly market, in an arm’s length transaction between knowledgeable and willing parties who are under no compulsion to act. The Company classifies the fair value of the financial instruments according to the following hierarchy based on the observable inputs used to value the instrument:
• Level 1 – inputs to the valuation methodology are quoted prices unadjusted for identical assets or liabilities in active markets.
• Level 2 – inputs other than quoted prices included in Level 1 that are observable for the asset or liability either directly (as prices) or indirectly (i.e. derived from prices).
• Level 3 – inputs to the valuation model are not based on observable market data. Fair value measurements are classified in the fair value hierarchy based on the lowest level input that is significant to that fair value measurement. This assessment requires judgment considering factors specific to an asset or liability and may affect placement within the fair value hierarchy. Level 1 is used for the fair value of cash. Due to the short-term nature of these financial assets and liabilities, the Company has determined that the carrying amounts approximate fair value. Credit risk The Company’s credit risk is primarily related to its accounts receivable. The amounts disclosed in the statement of financial position are net of allowances for bad debts, estimated by the Company’s management based on prior experience and their assessment of the current economic environment. The Company believes that the credit risk of accounts receivable is limited due to the following reasons:
• The Company has established a comprehensive credit policy. This includes the establishment of credit terms with new customers and the continued monitoring of credit terms of existing customers.
• The strong historical collection record of the Company’s customer base located throughout North America.
At June 30, 2011 two U.S. customers each representing more than 10% of the total accounts receivable balance, had outstanding accounts receivable balances of $1,095,000 (December 31, 2010 - $783,000 and January 1, 2010 – $395,000) No Canadian customers represented more than 10% of the total accounts receivable balance at June 30, 2011 (December 31, 2010 - $474,000 and January 1, 2010 – 533,000). Liquidity risk The Company maintains a revolving credit facility to ensure it has sufficient funds available to meet its current and foreseeable financial requirements at reasonable costs.
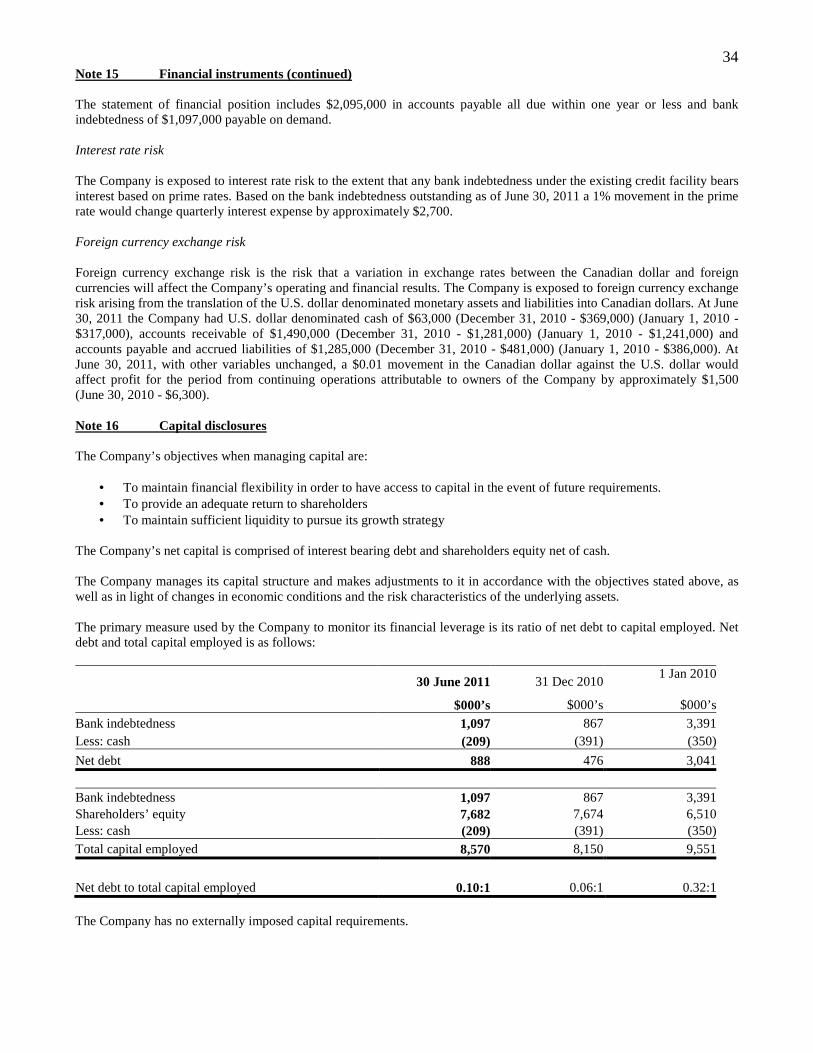
34 Note 15 Financial instruments (continued) The statement of financial position includes $2,095,000 in accounts payable all due within one year or less and bank indebtedness of $1,097,000 payable on demand. Interest rate risk The Company is exposed to interest rate risk to the extent that any bank indebtedness under the existing credit facility bears interest based on prime rates. Based on the bank indebtedness outstanding as of June 30, 2011 a 1% movement in the prime rate would change quarterly interest expense by approximately $2,700. Foreign currency exchange risk Foreign currency exchange risk is the risk that a variation in exchange rates between the Canadian dollar and foreign currencies will affect the Company’s operating and financial results. The Company is exposed to foreign currency exchange risk arising from the translation of the U.S. dollar denominated monetary assets and liabilities into Canadian dollars. At June 30, 2011 the Company had U.S. dollar denominated cash of $63,000 (December 31, 2010 - $369,000) (January 1, 2010 - $317,000), accounts receivable of $1,490,000 (December 31, 2010 - $1,281,000) (January 1, 2010 - $1,241,000) and accounts payable and accrued liabilities of $1,285,000 (December 31, 2010 - $481,000) (January 1, 2010 - $386,000). At June 30, 2011, with other variables unchanged, a $0.01 movement in the Canadian dollar against the U.S. dollar would affect profit for the period from continuing operations attributable to owners of the Company by approximately $1,500 (June 30, 2010 - $6,300). Note 16 Capital disclosures The Company’s objectives when managing capital are:
• To maintain financial flexibility in order to have access to capital in the event of future requirements. • To provide an adequate return to shareholders • To maintain sufficient liquidity to pursue its growth strategy
The Company’s net capital is comprised of interest bearing debt and shareholders equity net of cash. The Company manages its capital structure and makes adjustments to it in accordance with the objectives stated above, as well as in light of changes in economic conditions and the risk characteristics of the underlying assets. The primary measure used by the Company to monitor its financial leverage is its ratio of net debt to capital employed. Net debt and total capital employed is as follows:
30 June 2011 31 Dec 20101 Jan 2010
$000’s $000’s $000’s
Bank indebtedness 1,097 867 3,391Less: cash (209) (391) (350)
Net debt 888 476 3,041
Bank indebtedness 1,097 867 3,391Shareholders’ equity 7,682 7,674 6,510Less: cash (209) (391) (350)Total capital employed 8,570 8,150 9,551
Net debt to total capital employed 0.10:1 0.06:1 0.32:1 The Company has no externally imposed capital requirements.
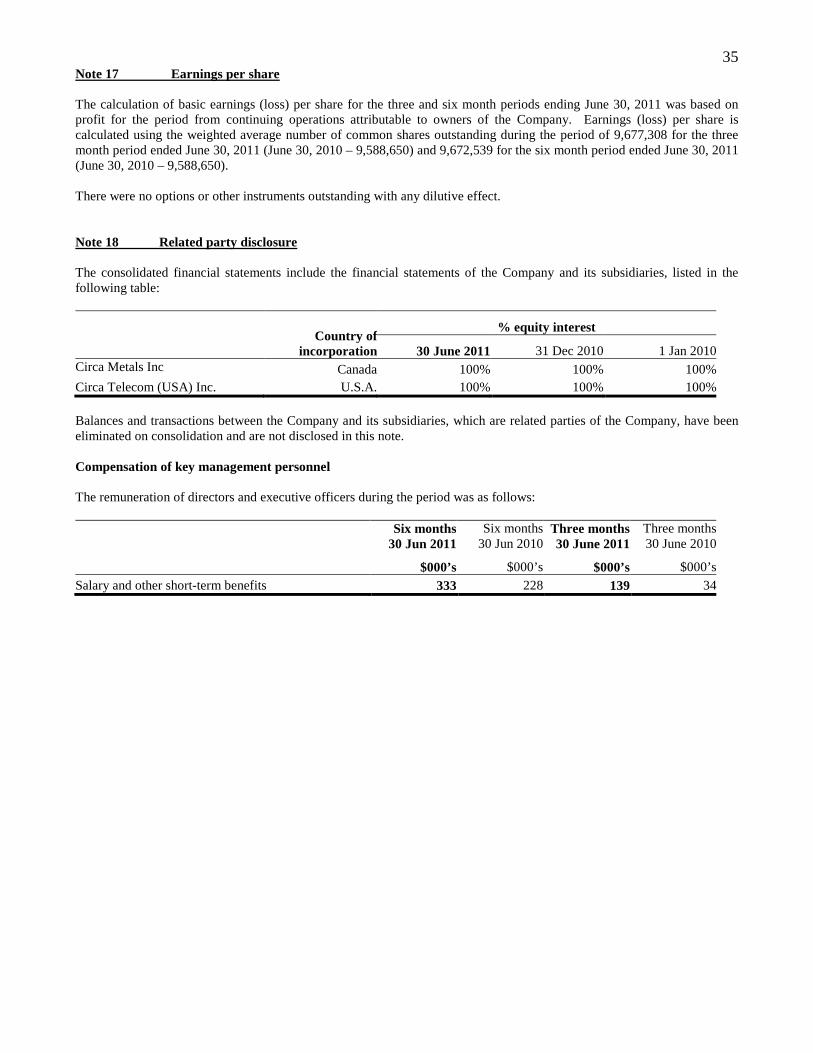
35 Note 17 Earnings per share The calculation of basic earnings (loss) per share for the three and six month periods ending June 30, 2011 was based on profit for the period from continuing operations attributable to owners of the Company. Earnings (loss) per share is calculated using the weighted average number of common shares outstanding during the period of 9,677,308 for the three month period ended June 30, 2011 (June 30, 2010 – 9,588,650) and 9,672,539 for the six month period ended June 30, 2011 (June 30, 2010 – 9,588,650). There were no options or other instruments outstanding with any dilutive effect. Note 18 Related party disclosure The consolidated financial statements include the financial statements of the Company and its subsidiaries, listed in the following table:
Country of
incorporation
% equity interest
30 June 2011 31 Dec 2010 1 Jan 2010Circa Metals Inc Canada 100% 100% 100%Circa Telecom (USA) Inc. U.S.A. 100% 100% 100% Balances and transactions between the Company and its subsidiaries, which are related parties of the Company, have been eliminated on consolidation and are not disclosed in this note. Compensation of key management personnel The remuneration of directors and executive officers during the period was as follows:
Six months 30 Jun 2011
Six months 30 Jun 2010
Three months 30 June 2011
Three months 30 June 2010
$000’s $000’s $000’s $000’s
Salary and other short-term benefits 333 228 139 34