Creative Solutions for Today's Educational Facilities' Needs - Kobet

Quarterly Report on Facilities and Capital Needs Assessment
Board of Education
February 23, 2016

Agenda
2015 Quarterly Reports Overview
Profile of Facilities Inventory and Investment
2016 Presentation of Capital Needs
2

“BUILDING BLOCKS” for Capital Needs Assessment2015 Quarterly BOE Reports on CMS Facilities
February 24 – Overview of inventory and current facilities condition; 12-month goals and objectives
June 9 – Sustainment plan for facilities and benchmarks; capacity utilization; baseline school standards; real estate overview (leased and vacant)
September 22 – 2007 and 2013 bond projects overview; alignment with BOE student assignment review; “highest and best use” of all property – surplus recommendations
December 8 – 5-year facility sustainment plan (operating and capital needs); projected 2020 growth patterns; land bank review and needs
3

4
CMS Facilities Inventory and Investment
Over 650 school buildings consisting of 21.5 million square feet of space, located on more than 5,100 acres
• 91 elementary schools + K-6
• 22 middle schools
• 17 Pre-K-8 and K-8
• 31 high schools
• 3 special programs/schools
Approximately 1,100 mobile units in use:
• 568 mobile classrooms at elementary schools
• 67 mobile classrooms at middle schools
• 195 mobile classrooms at Pre-K-8 schools
• 264 mobile classrooms at high schools
5
CMS Long Range Facilities Master Plan (LRFMP)
Capital Needs Assessment (CNA)
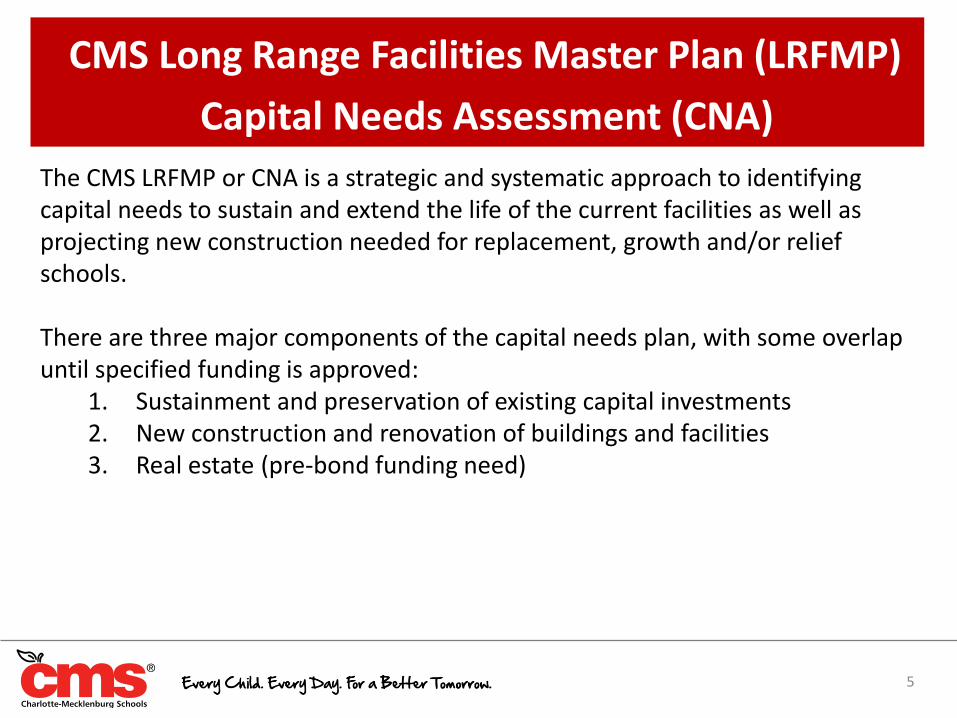
The CMS LRFMP or CNA is a strategic and systematic approach to identifying capital needs to sustain and extend the life of the current facilities as well as projecting new construction needed for replacement, growth and/or relief schools.
There are three major components of the capital needs plan, with some overlap until specified funding is approved:
1. Sustainment and preservation of existing capital investments2. New construction and renovation of buildings and facilities3. Real estate (pre-bond funding need)

6
Long Range Facilities Master Plan (LRFMP)
Capital Needs Assessment (CNA) Facility Sustainment Plan (5-year model)
Preventive maintenance (operating)
Major repair and replacement (capital)
Unscheduled repairs (operational emergencies)
Capital Needs/Capital Improvement Plan (CIP)
Facility condition
Facility utilization and capacity
Projected student growth and population trends
Educational adequacy/standards
Real Estate – existing and potential land bank sites

The five-year model will be assessed and updated annually.Variables include:
Updated facility assessmentReplacement cycle of systems
Building utilization ratePreventive maintenance and inspection results
Rate of new construction – more square footage
5-Year Facility Sustainment Plan
7
5-Year Sustainment Funding Projection FY 2017 - FY 2021
Preventive Maintenance and Minor Repairs (Operating) $84,595,000Repair and Replacement (Capital) $150,625,351Unscheduled Repairs $37,825,985Total $273,046,336

8
Roofing, $59,047,501
Paving/Sitework, $32,677,950
Athletic Facilities, $18,260,000
HVAC, $14,355,000
Electrical, $8,583,000
Finishes & Specialties, $7,983,000
Concrete, Masonry, Steel, $2,500,000
Playgrounds, $2,470,000
Stormwater, $2,126,900 Plumbing, $2,072,000
Conveying Systems, $550,000
Cabinetry & Casework, $0
Doors, Windows, Glass, $0
Fire Protection, $0
Thermal & Moisture, $0
Total $150,625,351
Sustainment Plan 5-Year Projections Capital Repair and Replacement
HVAC = Heating, ventilation and air conditioning

9
Capital Needs Assessment Methodology
• Approved methodology/rubric has been used since 2006 to serve as basis for annual Capital Needs Assessment and successful 2007 and 2013 bond referendums.
• Received Building Owners and Managers Association (BOMA) Facilities Management Excellence (FMX) award.
• Follow the Guiding Principles of the Charlotte-Mecklenburg Board of Education.

11
Ranking Methodology•
Rank, in relative order, competing capital needs on a single list for multiple subcategories:
Project Type/Category Number
Project Type/Category Rank
Weighted Criteria
Priority Score
Balance major categories of work:
New square footage and acreage
Existing square footage
Mandated improvements or district initiatives

12
Project Type/Category Number•
• Category Number 1: Growth projects, comprehensive renovations, replacement schools
• Category Number 2: Instructional programming and technology, support facilities, demolition
• Category Number 3: Americans with Disabilities Act, indoor air quality
• Category Number 4: Site acquisition, food service upgrades
• Category Number 5: Fire alarm upgrades, roofing, sitework
• Category Number 6: Heating, ventilation and air conditioning, electrical, plumbing
• Category Number 7: Paving/sitework, surveillance systems
• Category Number 8: Structural evaluation/repair
• Category Number 9: High school athletics, playgrounds

Weighted Criteria - Definitions
• Health and Safety – Review of Facility Condition Index greater than .55 for replacement and .40+/- considered for renovation
• Mandates – Legal requirements or regulations
• Continuity – To the extent that a project has been partially funded, or may already be in progress or there is an impact to schedule then it may have continuity. Some new school projects were given continuity points in the district’s continued efforts to create more seats (eliminating the need for multiple separate projects).
13

Weighted Criteria - Definitions cont.
• Core Overcapacity:
‐ Current capacity greater than 126%
‐ Five-Year Overcapacity – current capacity between 117-125%
‐ Ten-Year Overcapacity – current capacity between 110-116%
• Initiatives – District goals or program plans.
• Lifecycle Replacements – Systems and components have a reasonable, usable life. At the end of this cycle, these systems must be refurbished or replaced. Points given for buildings greater than 50 years old.
• Logistical Impacts – Points are deducted if there are practical issues that would prevent the project from proceeding as planned.
14

Weighted Criteria
• Health and Safety 300
• Mandates 200
• Continuity 200
• Overcapacity:
‐ Current at 126%+ 400
‐ Current at 117-125% 200
‐ Current at 110-116% 100
• Initiatives 200
• Lifecycle Replacements 300
• Logistical Impacts -1,000
15
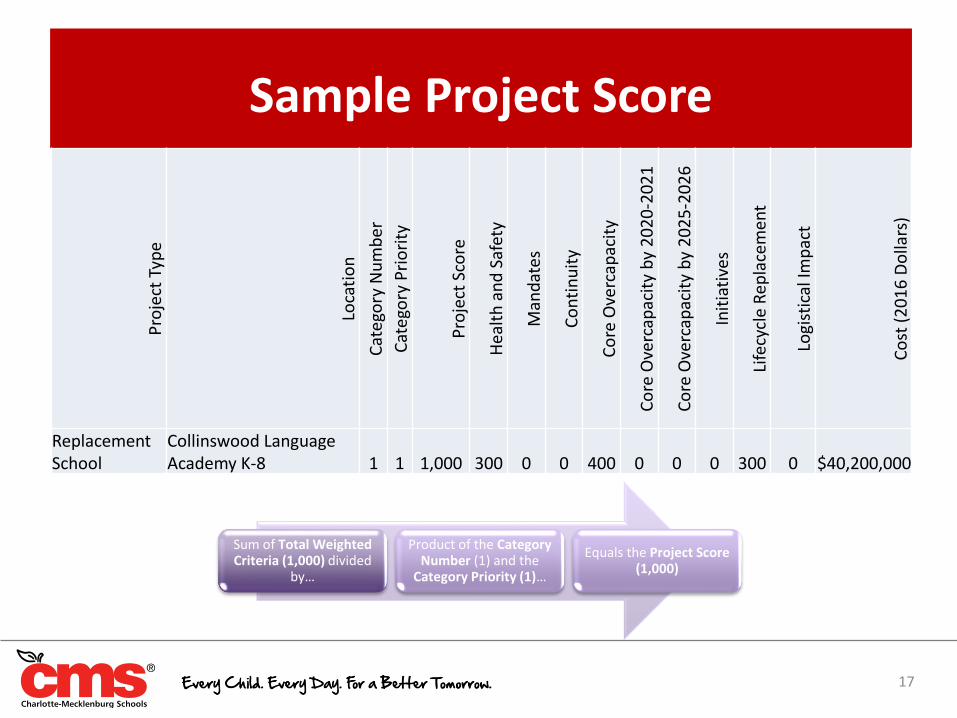
Sample Project ScoreP
roje
ct T
ype
Loca
tio
n
Cat
ego
ry N
um
ber
Cat
ego
ry P
rio
rity
Pro
ject
Sco
re
Hea
lth
an
d S
afet
y
Man
dat
es
Co
nti
nu
ity
Co
re O
verc
apac
ity
Co
re O
verc
apac
ity
by
20
20
-20
21
Co
re O
verc
apac
ity
by
20
25
-20
26
Init
iati
ves
Life
cycl
e R
epla
cem
ent
Logi
stic
al Im
pac
t
Co
st (
20
16
Do
llars
)
Replacement School
Collinswood LanguageAcademy K-8 1 1 1,000 300 0 0 400 0 0 0 300 0 $40,200,000
17
Sum of Total Weighted Criteria (1,000) divided
by…
Product of the Category Number (1) and the
Category Priority (1)…
Equals the Project Score (1,000)
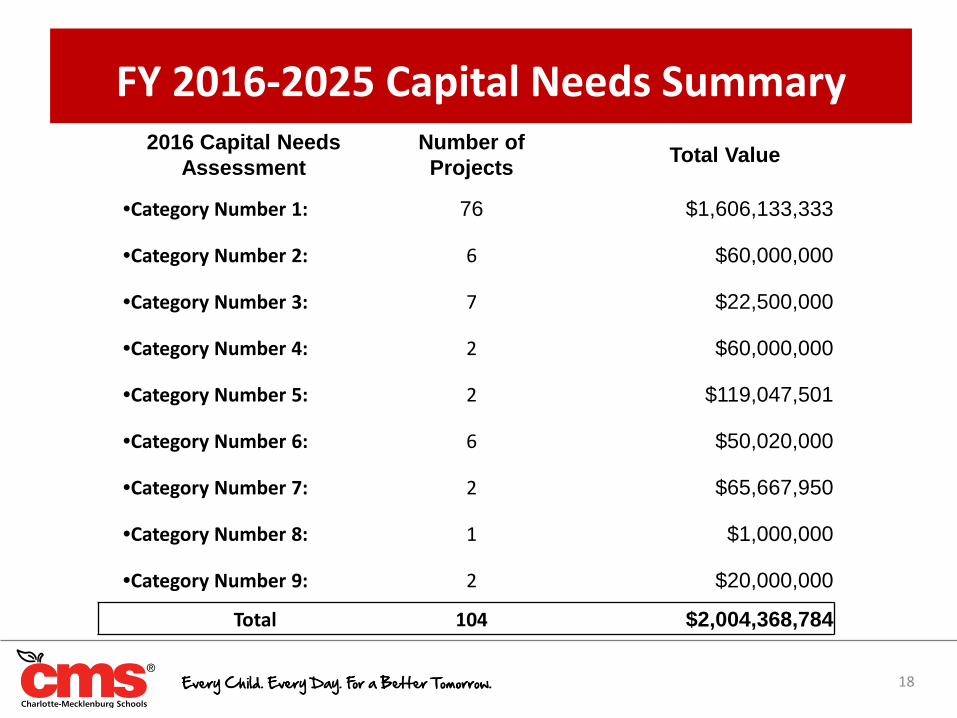
FY 2016-2025 Capital Needs Summary2016 Capital Needs
Assessment
Number of
ProjectsTotal Value
•Category Number 1: 76 $1,606,133,333
•Category Number 2: 6 $60,000,000
•Category Number 3: 7 $22,500,000
•Category Number 4: 2 $60,000,000
•Category Number 5: 2 $119,047,501
•Category Number 6: 6 $50,020,000
•Category Number 7: 2 $65,667,950
•Category Number 8: 1 $1,000,000
•Category Number 9: 2 $20,000,000
Total 104 $2,004,368,784
18

CMS Schools Baseline Standards
LevelCurrent
BaselineClassrooms
CurrentBaseline Acreage
Modified Baseline
Classrooms
ModifiedBaseline Acreage
Elementary School
39 8 – 15 45 8 – 15
K-8 School 54 8 – 20 54 10 - 30
Middle School
54 20 – 30 54 20 – 30
High School 100 30 – 60 125 30 – 60
19

Potential Funding ThresholdsCapital Improvement Plans
Dollar Amount Number of Projects *
$500 Million 22
$750 Million 34
$1 Billion 41
* The CIP may be modified based on further review and final approval. Stated number of projects in above example reflects the priority noted in the FY 2016-2025 CNA.
20

21

Land Bank Proposed Areas by Learning Communities
22
Key:Red – Proposed areas for ESBlue – Proposed areas for HS

23
Capital Needs Assessment (CNA)2016-2025 projection
Greater than $2 billion
Land Bank (pre-bond funding required to purchase sites and readiness to design and construct)
$60 million
Facility Sustainment Plan – 5-YearCapital Repair and Replacement
$151 million
CMS Estimated Capital Funding Needs

Next Steps
• Align facility needs and educational standards, to the extent possible, with the Board of Education-approved guiding principles and student assignment comprehensive plan
• Gain approval for the final capital improvement plan to inform a bond referendum
• Obtain funding for land acquisitions in support of the 2016-2025 CNA
• Monitor progress on county’s recommendation for additional capital preservation funds to support the CMS repair and replacement sustainment projects
24

Charlotte‐Mecklenburg Schools Facility Sustainment Plan
The five‐year model will be assessed and updated annually.
Variables include:
Updated facility assessment
Replacement cycle of systems
Building utilization rate
Preventive maintenance and inspection results
Rate of new construction – more square footage
Funding level from previous year(s) – deferred maintenance
5‐Year Sustainment Funding Projection FY 2017 ‐ FY 2021
Preventive Maintenance and Minor Repairs $84,595,000
Repair and Replacement $150,625,351
Unscheduled Repairs $37,825,985
Total $273,046,336
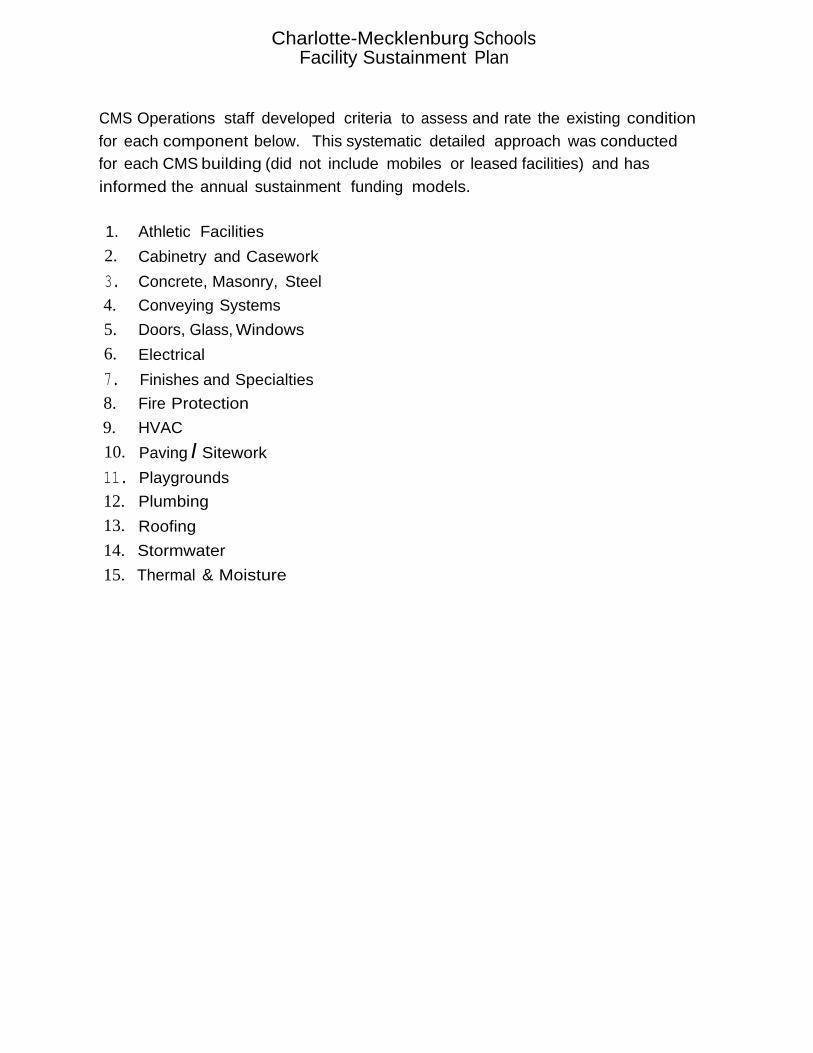
Charlotte-Mecklenburg SchoolsFacility Sustainment Plan
CMS Operations staff developed criteria to assess and rate the existing condition
for each component below. This systematic detailed approach was conducted
for each CMS building (did not include mobiles or leased facilities) and has
informed the annual sustainment funding models.
1. Athletic Facilities
2. Cabinetry and Casework
3. Concrete, Masonry, Steel
4. Conveying Systems
5. Doors, Glass, Windows
6. Electrical
7. Finishes and Specialties
8. Fire Protection
9. HVAC
10. Paving I Sitework
11. Playgrounds
12. Plumbing
13. Roofing
14. Stormwater
15. Thermal & Moisture

Charlotte‐Mecklenburg SchoolsFacility Sustainment Plan
Preventive Maintenance (PM)
1
Category 1 Preventive Maintenance (PM) and minor repair consists of scheduled tasks that sustain a component’s level of service during a prescribed lifetime (Operational Funds). Increased preventive maintenance will include inspections and minor repairs that are presently not funded.
1. Athletic Facilities
Tracks ‐ quarterly Inspect the track and events for wear and damage etc. Patch any damaged spots. Clean the track using a blower. Pressure wash track using low pressure prior to season opening. Edge areas around the track and use an appropriate herbicide (only licensed applicators). Six years after the installation of a new surface: Clean and patch, apply coatings and 2 lifts of rubber (first maintenance cycle only). Stripe and letter the track. Track Drains – semi‐annual Inspect the drains and repair broken grates. Clean and flush to ensure proper flow.
Tennis Courts ‐ annual Inspect the court for wear, damage cracks, and faded lines. Inspect the nets and posts and fence. Repair damaged cracks. Touch up or repaint lines and surface if needed. Clean the court using a surface washer head for the pressure washer. Edge areas around the court and use an appropriate herbicide (only licensed applicators). Six years after the installation of a new surface: Clean and patch, apply coatings (first maintenance
cycle only). Stripe and letter the tennis court. Football Field / Synthetic Turf Field – semi‐annual Clean field, inspect lines and seams, logos, letters and numbers and repair as needed. Measure depth of fill and length of grass and record. Level infill adding rubber as needed. Relieve infill compaction via spring tine. Inspect Uprights, pads, fences, scoreboards etc. for damage/wear and functioning and repair as needed.
Football Field / Natural Turf – semi annual Inspect the field for weeds, bare spots, hard ground, non‐working sprinklers etc.
Aerate, over seed, top dress, fertilize etc. at least twice a year or as needed. Inspect uprights, pads, fences, scoreboards etc. for damage/wear and functioning and repair as needed.
Bleachers – annual Inspect all bleacher seats and structure for safety. This includes a visual inspection of the support structure, the seats, footings, uprights fencing, etc. Repairs should be made prior to occupancy.
Baseball Fields / Softball Fields / Practice Fields – semi annual Inspect the field for weeds, bare spots, hard ground, non‐working sprinklers etc. Aerate, over‐seed, top dress, fertilize etc. at least twice a year or as needed. Inspect facilities, fences, scoreboards etc. for damage/wear and functioning and repair as needed.
2. Cabinetry and Casework Any work we do in this category will be on an as needed basis.
3. Concrete, Masonry, Steel A third‐party Engineering firm to analysis, assess and monitor facilities with known or suspected structural issues.

Charlotte‐Mecklenburg SchoolsFacility Sustainment Plan
Preventive Maintenance (PM)
2
4. Conveying Systems A third‐party vendor to perform required inspections, preventive maintenance as well as minor repairs.
5. Doors, Glass, Windows Doors – semi‐annual
All doors will be inspected for proper alignment, damage etc.
Center mullions will be inspected for tightness and alignment
Exterior doors will be checked for excessive bottom clearance
Door sweeps and seals will be adjusted and replaced if necessary ‐ Damaged doors will be replaced
Door hardware will be checked and repaired if necessary: ‐ Exit devices ‐ Door latches ‐ Hinges ‐ Closers ‐ Strikes ‐ Etc.
Broken or damaged components will be replaced Glass and Windows ‐ annual
Windows will be inspected for the following: ‐ IGF units – loss of seal (fogged up) will be replaced or repaired ‐ Identify acrylic or polycarbonate or boarded up windows and replace with glass units ‐ Repair or replace cracked glass units ‐ Check all operable window hardware ‐ Check and replace bad glazing, rubber seals, calk etc. ‐ Touch up damaged paint
6. Electrical
Contracted PM services are semi‐annual major and minor PMs. Repairs result from the contracted
PMs and the monthly tests performed internally. PMs are performed internally while repairs are contracted out.
The majority of the systems are new. The repair allowance resulting from PMs is expected to rise significantly as equipment ages and warranties run out.
Inspections are contracted out while the resulting actual repairs are performed internally so allowance represents material cost.
This is proposed. Dimmers are for theatrical stage lighting
This is proposed. Fluorescent lamps degrade over time as a result of age and the frequency of switching. Some will just fail and many will just get dimmer and dimmer. Historic repairs are reactive to those that have actually failed or groups that have reduced their output to the point of providing unacceptably low light levels. Group relamping consists of periodical wholesale replacement of all.
7. Finishes and Specialties
Flooring ‐ semi‐annual Inspect the floors for wear and damage. Patch or replace any damaged spots. Carpets professionally cleaned and deodorized. Gym floors finished or sanded and finished as needed.
Walls ‐ semi‐annual
Charlotte‐Mecklenburg SchoolsFacility Sustainment Plan
Preventive Maintenance (PM)
3
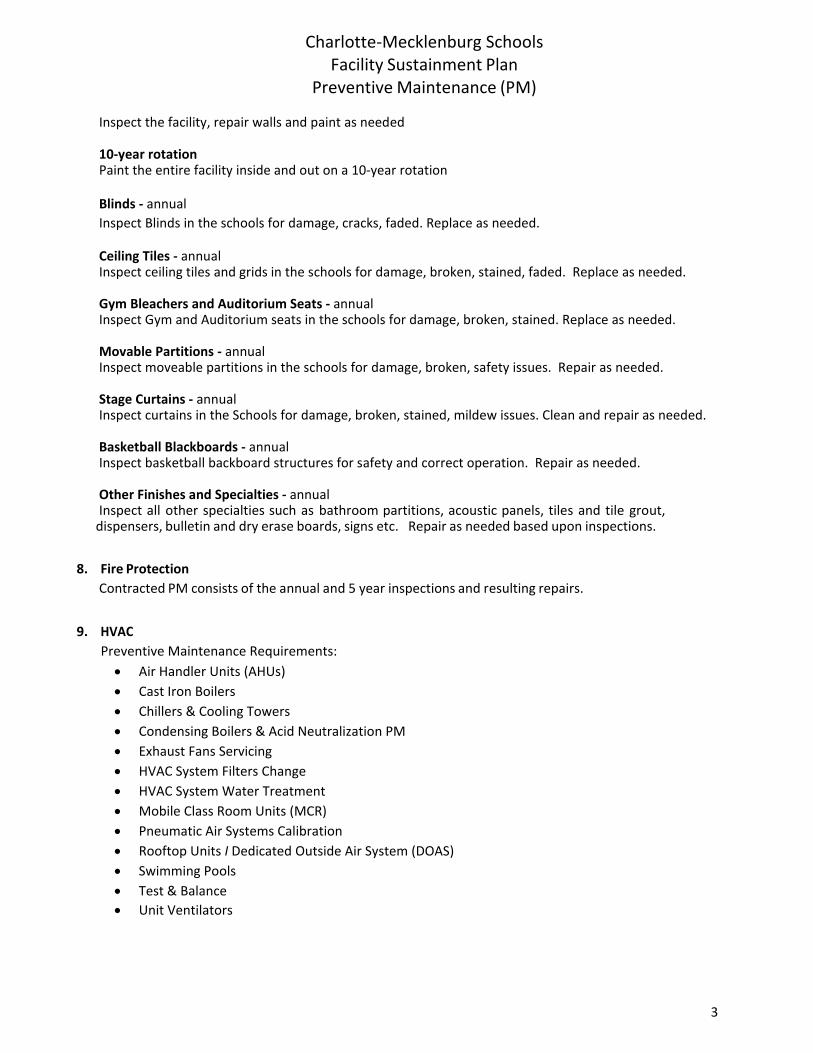
Inspect the facility, repair walls and paint as needed
10‐year rotation Paint the entire facility inside and out on a 10‐year rotation Blinds ‐ annual
Inspect Blinds in the schools for damage, cracks, faded. Replace as needed. Ceiling Tiles ‐ annual Inspect ceiling tiles and grids in the schools for damage, broken, stained, faded. Replace as needed. Gym Bleachers and Auditorium Seats ‐ annual Inspect Gym and Auditorium seats in the schools for damage, broken, stained. Replace as needed. Movable Partitions ‐ annual Inspect moveable partitions in the schools for damage, broken, safety issues. Repair as needed. Stage Curtains ‐ annual Inspect curtains in the Schools for damage, broken, stained, mildew issues. Clean and repair as needed. Basketball Blackboards ‐ annual Inspect basketball backboard structures for safety and correct operation. Repair as needed. Other Finishes and Specialties ‐ annual Inspect all other specialties such as bathroom partitions, acoustic panels, tiles and tile grout, dispensers, bulletin and dry erase boards, signs etc. Repair as needed based upon inspections.
8. Fire Protection
Contracted PM consists of the annual and 5 year inspections and resulting repairs.
9. HVAC
Preventive Maintenance Requirements:
Air Handler Units (AHUs)
Cast Iron Boilers
Chillers & Cooling Towers
Condensing Boilers & Acid Neutralization PM
Exhaust Fans Servicing
HVAC System Filters Change
HVAC System Water Treatment
Mobile Class Room Units (MCR)
Pneumatic Air Systems Calibration
Rooftop Units I Dedicated Outside Air System (DOAS)
Swimming Pools
Test & Balance
Unit Ventilators

Charlotte‐Mecklenburg SchoolsFacility Sustainment Plan
Preventive Maintenance (PM)
4
11. Playgrounds Vendors to inspect and adjust all playground components as well as install kid cushion to appropriate
depths.
12. Plumbing Systems
13. Roofing
Roofs – semi‐annual
All roofs need to have leaves and debris removed and surfaces blown off at least twice a year.
10. Paving / Sitework Paving Facilities will be divided into six regions and one region per year will be inspected and preventive maintenance conducted. The intention is to prolong the life of asphalt and concrete surfaces as well as improving the safety of these surfaces.
One region (approx. 30 locations) of asphalt surface and curbing will be inspected for damage as follows: ‐ cracks ‐ potholes ‐ isolated cracks ‐ subsurface softening ‐ pumping ‐ Etc.
Repairs will be completed based upon the results of the inspection to include: ‐ patching ‐ full depth patching ‐ crack sealing ‐ partial overlay
coatings where beneficial ‐ restriping ‐ curb section repair/ replacement
Sitework/Concrete One region (approx. 30 locations) of concrete walkway and surfaces will be inspected for,
damage as follows: ‐ cracks ‐ potholes ‐ isolated cracks ‐ surface deterioration ‐ un‐levelness
Repairs will be completed based upon the results of the inspection to include: ‐ patching ‐ crack sealing ‐ coatings where beneficial ‐ section replacement
Preventive Maintenance Requirements:
Backflow Preventer Testing & PM
Grease Trap Cleaning
Hot Water Heater (Tank Type) Servicing PM
Irrigation PM

Charlotte‐Mecklenburg SchoolsFacility Sustainment Plan
Preventive Maintenance (PM)
5
Roofs that are surrounded by trees need this more frequently during the fall and spring. Special
attention should be paid to making sure drains are clear.
Areas of ponding water should be recorded and investigated to eliminate the problem.
Roof areas should be inspected for obvious damage. Any damage should be recorded, reported and
repaired. Roof flashing, coping etc. should be inspected for damage.
Vents & Roof Penetration
Roof vents and penetrations should be inspected to verify that boots, flashing etc. is in good shape. Any
damaged boots and flashing should be replaced
HVAC Condensate Lines
HVAC condensate lines should be inspected to make sure they are intact and piped to a nearby drain to
avoid water ponding continuously in one area.
Drains
Drains should be inspected and checked annually to make sure they are not obstructed or clogged.
Drain grates should be checked to make sure they are present and seated correctly and not
broken.
Replace missing or damaged drain grates.
Downspouts
Down spouts and overflow pipes need to be checked for Clogs, gaps in the flashing, properly
secured to building. If connected to underground drain pipes, verify connections are made and
secure.
Annual
The district roofs are divided equally in number into 6 regions. One region per year should
inspected thoroughly and basic preventive maintenance conducted to include calking, sealing, re‐
hashing etc. where needed.
14. Stormwater
Vendors to remove over‐growth and debris as needed and minor repair stormwater features in
accordance with the Mecklenburg County Phase II Stormwater Permit, in addition required inspections
will be conducted in accordance with said permit.
15. Thermal and Moisture
Any work we do in this category will be on an as needed basis.

Charlotte‐Mecklenburg Schools Facility Sustainment Plan Repair and Replacement
Category 2 Repair and Replacement costs are capital replacement costs short of major infrastructure projects. Costs are based on assuming the facilities are to be programed as they currently are, as of September, 2015. Component Review Includes:
1. Athletic Facilities
2. Cabinetry and Casework
3. Concrete, Masonry, Steel
4. Conveying Systems
5. Doors, Glass, Windows
6. Electrical
7. Finishes and Specialties
8. Fire Protection
9. HVAC
10. Paving / Sitework
11. Playgrounds
12. Plumbing
13. Roofing
14. Stormwater
15. Thermal & Moisture
The following spreadsheets reflect estimated cost over five years sorted in various ways.

Facility Sustainment Plan
Category 2
Repair and Replacement Cost Estimates
(Component By Year)
Athletic Facilities 4,000,000$ 3,390,000$ 3,390,000$ 3,690,000$ 3,790,000$ $18,260,000
Cabinetry & Casework $0
Concrete, Masonry, Steel 500,000$ 500,000$ 500,000$ 500,000$ 500,000$ $2,500,000
Conveying Systems 100,000$ 150,000$ 100,000$ 100,000$ 100,000$ $550,000
Doors, Windows, Glass $0
Electrical 1,930,000$ 1,657,000$ 1,533,000$ 1,585,000$ 1,878,000$ $8,583,000
Finishes & Specialties 2,217,000$ 1,816,000$ 1,360,000$ 1,250,000$ 1,340,000$ $7,983,000
Fire Protection $0
HVAC 4,232,000$ 2,968,000$ 2,761,000$ 2,154,000$ 2,240,000$ $14,355,000
Paving/Sitework 6,229,990$ 6,149,780$ 6,698,140$ 6,616,370$ 6,983,670$ $32,677,950
Playgrounds 570,000$ 475,000$ 380,000$ 570,000$ 475,000$ $2,470,000
Plumbing 520,000$ 530,000$ 312,000$ 335,000$ 375,000$ $2,072,000
Roofing 14,662,073$ 11,553,100$ 9,775,705$ 10,580,374$ 12,476,249$ $59,047,501
Stormwater 908,400$ 313,400$ 398,000$ 252,900$ 254,200$ $2,126,900
Thermal & Moisture $0
COMPONENTS BY YEARLY ESTIMATES $35,869,463 $29,502,280 $27,207,845 $27,633,644 $30,412,119 $150,625,351
5 Yrs Budget
EstimatesFacility Sustainment Component
Estimated
Costs
FY 16‐17
Estimated
Costs
FY 17‐18
Estimated
Costs
FY 18‐19
Estimated
Costs
FY 19‐20
Estimated
Costs
FY 20‐21

Facility Sustainment Plan
Category 2
Repair and Replacment Cost Estimates
( By School By Year )
2/3/201612:02 PM
Ada Jenkins $0 $0 $0 $0 $0 $0
Albemarle Road ES $60,000 $45,000 $181,010 $0 $95,000 $381,010
Albemarle Road MS $110,000 $740,000 $0 $851,385 $0 $1,701,385
Alexander (JM) $0 $47,000 $6,000 $0 $1,323,800 $1,376,800
Alexander (Nathaniel) $65,000 $0 $15,000 $40,000 $30,000 $150,000
Allenbrook $82,000 $65,000 $861,779 $0 $0 $1,008,779
Amay James $0 $0 $0 $0 $395,000 $395,000
Ardrey Kell $194,000 $400,000 $350,000 $0 $30,000 $974,000
Ashley Park $245,143 $86,180 $0 $9,500 $350,400 $691,223
Atrium $0 $0 $0 $0 $0 $0
Bailey $0 $0 $87,000 $0 $184,000 $271,000
Bain $0 $0 $0 $0 $0 $0
Bain (Old) $0 $195,751 $468,667 $0 $334,370 $998,788
Ballantyne $15,000 $0 $0 $0 $10,000 $25,000
Barnette $0 $0 $116,000 $0 $0 $116,000
Barringer Academic Center $85,000 $110,000 $0 $0 $0 $195,000
Berewick $0 $27,000 $80,000 $0 $0 $107,000
Berry (Phillip O.) Academy of Tech. $103,000 $320,000 $0 $650,000 $264,000 $1,337,000
Berryhill $42,000 $140,000 $15,000 $0 $0 $197,000
Beverly Woods $0 $160,000 $12,000 $0 $0 $172,000
SCHOOL/FACILITY (alphabetically listed)5 Yrs Budget
Estimates
Estimated Costs
FY 18‐19
Estimated Costs
FY 19‐20
Estimated Costs
FY 20‐21
Estimated Costs
FY 16‐17
Estimated Costs
FY 17‐18
Page 1 of 10

Facility Sustainment Plan
Category 2
Repair and Replacment Cost Estimates
( By School By Year )
2/3/201612:02 PM
SCHOOL/FACILITY (alphabetically listed)5 Yrs Budget
Estimates
Estimated Costs
FY 18‐19
Estimated Costs
FY 19‐20
Estimated Costs
FY 20‐21
Estimated Costs
FY 16‐17
Estimated Costs
FY 17‐18
Billingsville/Rosenwald (1927 Bldg) $0 $0 $0 $0 $0 $0
Billingsville $20,000 $80,000 $20,000 $100,000 $20,000 $240,000
Blythe $95,000 $75,000 $15,000 $30,000 $10,000 $225,000
Bradley (Francis) $15,000 $94,000 $20,000 $595,000 $60,000 $784,000
Briarwood $145,000 $386,217 $40,000 $40,000 $40,000 $651,217
Bruns Avenue $1,745,798 $0 $40,000 $0 $0 $1,785,798
Butler (David) $660,000 $475,000 $76,000 $15,000 $310,000 $1,536,000
Byers (Walter G.) $115,000 $60,000 $0 $0 $0 $175,000
Carmel $595,944 $23,000 $0 $70,000 $650,580 $1,339,524
Cato Middle College $0 $0 $0 $0 $0 $0
Chantilly $177,000 $0 $0 $95,000 $10,000 $282,000
Clear Creek $12,000 $75,000 $557,596 $0 $59,286 $703,882
Cochrane $9,000 $165,000 $665,000 $0 $250,000 $1,089,000
Collinswood $102,500 $776,750 $90,000 $20,000 $58,560 $1,047,810
Community House $11,000 $0 $0 $110,000 $0 $121,000
Cornelius $861,775 $419,000 $32,000 $0 $36,798 $1,349,573
Cotswold $194,525 $0 $241,455 $42,000 $60,000 $537,980
Coulwood $326,050 $30,000 $595,000 $0 $215,510 $1,166,560
Craig Avenue $0 $0 $0 $0 $60,000 $60,000
Crestdale $0 $0 $20,000 $0 $665,000 $685,000
Page 2 of 10

Facility Sustainment Plan
Category 2
Repair and Replacment Cost Estimates
( By School By Year )
2/3/201612:02 PM
SCHOOL/FACILITY (alphabetically listed)5 Yrs Budget
Estimates
Estimated Costs
FY 18‐19
Estimated Costs
FY 19‐20
Estimated Costs
FY 20‐21
Estimated Costs
FY 16‐17
Estimated Costs
FY 17‐18
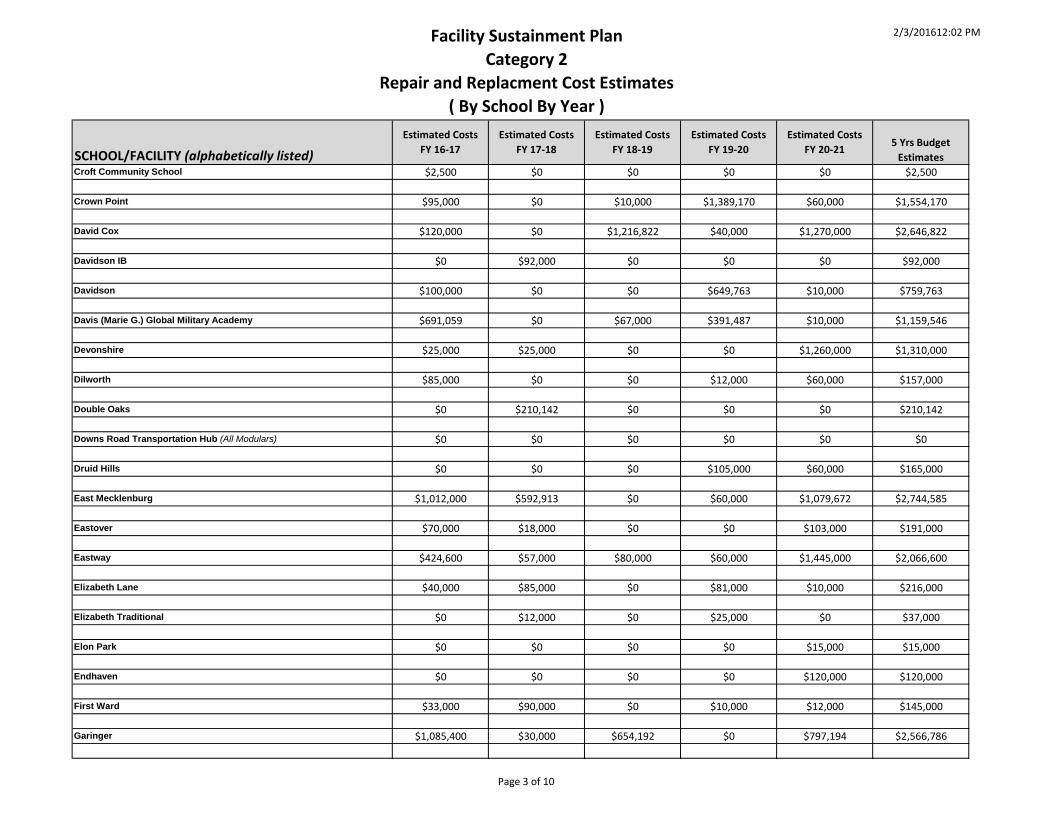
Croft Community School $2,500 $0 $0 $0 $0 $2,500
Crown Point $95,000 $0 $10,000 $1,389,170 $60,000 $1,554,170
David Cox $120,000 $0 $1,216,822 $40,000 $1,270,000 $2,646,822
Davidson IB $0 $92,000 $0 $0 $0 $92,000
Davidson $100,000 $0 $0 $649,763 $10,000 $759,763
Davis (Marie G.) Global Military Academy $691,059 $0 $67,000 $391,487 $10,000 $1,159,546
Devonshire $25,000 $25,000 $0 $0 $1,260,000 $1,310,000
Dilworth $85,000 $0 $0 $12,000 $60,000 $157,000
Double Oaks $0 $210,142 $0 $0 $0 $210,142
Downs Road Transportation Hub (All Modulars) $0 $0 $0 $0 $0 $0
Druid Hills $0 $0 $0 $105,000 $60,000 $165,000
East Mecklenburg $1,012,000 $592,913 $0 $60,000 $1,079,672 $2,744,585
Eastover $70,000 $18,000 $0 $0 $103,000 $191,000
Eastway $424,600 $57,000 $80,000 $60,000 $1,445,000 $2,066,600
Elizabeth Lane $40,000 $85,000 $0 $81,000 $10,000 $216,000
Elizabeth Traditional $0 $12,000 $0 $25,000 $0 $37,000
Elon Park $0 $0 $0 $0 $15,000 $15,000
Endhaven $0 $0 $0 $0 $120,000 $120,000
First Ward $33,000 $90,000 $0 $10,000 $12,000 $145,000
Garinger $1,085,400 $30,000 $654,192 $0 $797,194 $2,566,786
Page 3 of 10

Facility Sustainment Plan
Category 2
Repair and Replacment Cost Estimates
( By School By Year )
2/3/201612:02 PM
Ada Jenkins $0 $0 $0 $0 $0 $0
Albemarle Road ES $60,000 $45,000 $181,010 $0 $95,000 $381,010
Albemarle Road MS $110,000 $740,000 $0 $851,385 $0 $1,701,385
Alexander (JM) $0 $47,000 $6,000 $0 $1,323,800 $1,376,800
Alexander (Nathaniel) $65,000 $0 $15,000 $40,000 $30,000 $150,000
Allenbrook $82,000 $65,000 $861,779 $0 $0 $1,008,779
Amay James $0 $0 $0 $0 $395,000 $395,000
Ardrey Kell $194,000 $400,000 $350,000 $0 $30,000 $974,000
Ashley Park $245,143 $86,180 $0 $9,500 $350,400 $691,223
Atrium $0 $0 $0 $0 $0 $0
Bailey $0 $0 $87,000 $0 $184,000 $271,000
Bain $0 $0 $0 $0 $0 $0
Bain (Old) $0 $195,751 $468,667 $0 $334,370 $998,788
Ballantyne $15,000 $0 $0 $0 $10,000 $25,000
Barnette $0 $0 $116,000 $0 $0 $116,000
Barringer Academic Center $85,000 $110,000 $0 $0 $0 $195,000
Berewick $0 $27,000 $80,000 $0 $0 $107,000
Berry (Phillip O.) Academy of Tech. $103,000 $320,000 $0 $650,000 $264,000 $1,337,000
Berryhill $42,000 $140,000 $15,000 $0 $0 $197,000
Beverly Woods $0 $160,000 $12,000 $0 $0 $172,000
SCHOOL/FACILITY (alphabetically listed)5 Yrs Budget
Estimates
Estimated Costs
FY 18‐19
Estimated Costs
FY 19‐20
Estimated Costs
FY 20‐21
Estimated Costs
FY 16‐17
Estimated Costs
FY 17‐18
Page 1 of 10

Facility Sustainment Plan
Category 2
Repair and Replacment Cost Estimates
( By School By Year )
2/3/201612:02 PM
SCHOOL/FACILITY (alphabetically listed)5 Yrs Budget
Estimates
Estimated Costs
FY 18‐19
Estimated Costs
FY 19‐20
Estimated Costs
FY 20‐21
Estimated Costs
FY 16‐17
Estimated Costs
FY 17‐18
Billingsville/Rosenwald (1927 Bldg) $0 $0 $0 $0 $0 $0
Billingsville $20,000 $80,000 $20,000 $100,000 $20,000 $240,000
Blythe $95,000 $75,000 $15,000 $30,000 $10,000 $225,000
Bradley (Francis) $15,000 $94,000 $20,000 $595,000 $60,000 $784,000
Briarwood $145,000 $386,217 $40,000 $40,000 $40,000 $651,217
Bruns Avenue $1,745,798 $0 $40,000 $0 $0 $1,785,798
Butler (David) $660,000 $475,000 $76,000 $15,000 $310,000 $1,536,000
Byers (Walter G.) $115,000 $60,000 $0 $0 $0 $175,000
Carmel $595,944 $23,000 $0 $70,000 $650,580 $1,339,524
Cato Middle College $0 $0 $0 $0 $0 $0
Chantilly $177,000 $0 $0 $95,000 $10,000 $282,000
Clear Creek $12,000 $75,000 $557,596 $0 $59,286 $703,882
Cochrane $9,000 $165,000 $665,000 $0 $250,000 $1,089,000
Collinswood $102,500 $776,750 $90,000 $20,000 $58,560 $1,047,810
Community House $11,000 $0 $0 $110,000 $0 $121,000
Cornelius $861,775 $419,000 $32,000 $0 $36,798 $1,349,573
Cotswold $194,525 $0 $241,455 $42,000 $60,000 $537,980
Coulwood $326,050 $30,000 $595,000 $0 $215,510 $1,166,560
Craig Avenue $0 $0 $0 $0 $60,000 $60,000
Crestdale $0 $0 $20,000 $0 $665,000 $685,000
Page 2 of 10
Facility Sustainment Plan
Category 2
Repair and Replacment Cost Estimates
( By School By Year )
2/3/201612:02 PM
SCHOOL/FACILITY (alphabetically listed)5 Yrs Budget
Estimates
Estimated Costs
FY 18‐19
Estimated Costs
FY 19‐20
Estimated Costs
FY 20‐21
Estimated Costs
FY 16‐17
Estimated Costs
FY 17‐18
Croft Community School $2,500 $0 $0 $0 $0 $2,500
Crown Point $95,000 $0 $10,000 $1,389,170 $60,000 $1,554,170
David Cox $120,000 $0 $1,216,822 $40,000 $1,270,000 $2,646,822
Davidson IB $0 $92,000 $0 $0 $0 $92,000
Davidson $100,000 $0 $0 $649,763 $10,000 $759,763
Davis (Marie G.) Global Military Academy $691,059 $0 $67,000 $391,487 $10,000 $1,159,546
Devonshire $25,000 $25,000 $0 $0 $1,260,000 $1,310,000
Dilworth $85,000 $0 $0 $12,000 $60,000 $157,000
Double Oaks $0 $210,142 $0 $0 $0 $210,142
Downs Road Transportation Hub (All Modulars) $0 $0 $0 $0 $0 $0
Druid Hills $0 $0 $0 $105,000 $60,000 $165,000
East Mecklenburg $1,012,000 $592,913 $0 $60,000 $1,079,672 $2,744,585
Eastover $70,000 $18,000 $0 $0 $103,000 $191,000
Eastway $424,600 $57,000 $80,000 $60,000 $1,445,000 $2,066,600
Elizabeth Lane $40,000 $85,000 $0 $81,000 $10,000 $216,000
Elizabeth Traditional $0 $12,000 $0 $25,000 $0 $37,000
Elon Park $0 $0 $0 $0 $15,000 $15,000
Endhaven $0 $0 $0 $0 $120,000 $120,000
First Ward $33,000 $90,000 $0 $10,000 $12,000 $145,000
Garinger $1,085,400 $30,000 $654,192 $0 $797,194 $2,566,786
Page 3 of 10

Facility Sustainment Plan
Category 2
Repair and Replacment Cost Estimates
( By School By Year )
2/3/201612:02 PM
SCHOOL/FACILITY (alphabetically listed)5 Yrs Budget
Estimates
Estimated Costs
FY 18‐19
Estimated Costs
FY 19‐20
Estimated Costs
FY 20‐21
Estimated Costs
FY 16‐17
Estimated Costs
FY 17‐18
Graham (Alexander) $0 $841,965 $0 $15,000 $0 $856,965
Grand Oak $19,000 $0 $0 $0 $0 $19,000
Graphic Production Center $0 $11,000 $0 $0 $0 $11,000
Greenway Park $0 $55,000 $12,000 $74,000 $1,219,949 $1,360,949
Grier (Joseph W.) Academy $168,000 $0 $13,000 $60,000 $0 $241,000
Gunn (JH) $0 $175,000 $0 $60,000 $239,547 $474,547
Harding University $542,360 $543,889 $704,740 $60,000 $50,000 $1,900,989
Hawk Ridge $70,000 $0 $25,000 $60,000 $139,000 $294,000
Hawthorne HS $0 $0 $1,194,582 $0 $0 $1,194,582
Hickory Grove $136,631 $25,000 $0 $0 $85,000 $246,631
Hickory Grove (Old) $0 $48,000 $0 $16,000 $217,127 $281,127
Hidden Valley $85,000 $25,000 $20,000 $1,008,952 $328,356 $1,467,308
Highland Creek $0 $0 $0 $0 $0 $0
Highland Mill $95,000 $10,000 $5,000 $8,000 $0 $118,000
Highland Renaissance Academy $0 $64,600 $0 $20,000 $0 $84,600
Hopewell $187,000 $625,000 $0 $125,000 $0 $937,000
Hornets Nest $0 $40,000 $0 $309,000 $1,270,000 $1,619,000
Hough (WA) $23,000 $0 $0 $0 $435,000 $458,000
Huntersville $120,000 $34,000 $466,282 $0 $198,881 $819,163
Huntingtowne Farms $0 $109,000 $122,864 $0 $60,000 $291,864
Page 4 of 10

Facility Sustainment Plan
Category 2
Repair and Replacment Cost Estimates
( By School By Year )
2/3/201612:02 PM
SCHOOL/FACILITY (alphabetically listed)5 Yrs Budget
Estimates
Estimated Costs
FY 18‐19
Estimated Costs
FY 19‐20
Estimated Costs
FY 20‐21
Estimated Costs
FY 16‐17
Estimated Costs
FY 17‐18
Idlewild $0 $56,700 $60,000 $0 $22,000 $138,700
Independence $2,401,280 $47,000 $670,000 $150,000 $310,000 $3,578,280
Irwin Avenue $0 $132,000 $10,000 $5,000 $10,000 $157,000
Kennedy (Robert F.) $163,800 $160,000 $544,610 $0 $454,000 $1,322,410
King (Martin Luther, Jr.) $0 $68,000 $30,000 $15,000 $5,000 $118,000
Lake Wylie $40,000 $1,336,439 $608,510 $0 $0 $1,984,949
Lakeview $0 $0 $0 $0 $0 $0
Lansdowne $759,574 $15,000 $0 $105,000 $0 $879,574
Leadership Academy (at Governer's Village) $0 $0 $0 $0 $0 $0
Lebanon Road $0 $80,000 $369,000 $1,210,000 $40,000 $1,699,000
Levine Middle College $0 $0 $0 $0 $0 $0
LIFT Academy (at Graham Center) $20,000 $25,000 $20,000 $170,000 $20,000 $255,000
Lincoln Heights $40,000 $25,000 $155,000 $12,000 $0 $232,000
Long Creek $8,800 $15,000 $0 $0 $0 $23,800
Mallard Creek ES $746,188 $0 $120,000 $1,200,000 $0 $2,066,188
Mallard Creek HS $77,000 $0 $600,000 $30,000 $430,000 $1,137,000
Martin (James) $785,000 $35,000 $15,000 $0 $30,000 $865,000
Matthews $85,000 $15,000 $0 $49,500 $1,115,625 $1,265,125
McAlpine $1,039,482 $20,000 $40,000 $0 $0 $1,099,482
McClintock $0 $0 $0 $0 $0 $0
Page 5 of 10

Facility Sustainment Plan
Category 2
Repair and Replacment Cost Estimates
( By School By Year )
2/3/201612:02 PM
SCHOOL/FACILITY (alphabetically listed)5 Yrs Budget
Estimates
Estimated Costs
FY 18‐19
Estimated Costs
FY 19‐20
Estimated Costs
FY 20‐21
Estimated Costs
FY 16‐17
Estimated Costs
FY 17‐18
McKee Road $140,000 $8,000 $0 $380,000 $0 $528,000
Merry Oaks $87,100 $67,600 $20,000 $80,000 $140,000 $394,700
Metro School (Old Metro/Morgan) $0 $0 $0 $0 $0 $0
Metro School (405 S Davidson St) $0 $145,000 $0 $220,000 $10,000 $375,000
Midwood $0 $36,577 $0 $0 $0 $36,577
Mint Hill $26,000 $80,000 $0 $15,000 $30,000 $151,000
Montclaire $0 $95,000 $40,000 $60,000 $259,840 $454,840
Morehead (Nathaniel Alexander) $0 $80,000 $15,000 $110,000 $30,000 $235,000
Morgan School (Abandoned/Shut Down) $0
Morgan School (Old, Torrence Ave) $172,049 $20,000 $20,000 $20,000 $20,000 $252,049
Mountain Island $155,500 $0 $12,000 $95,000 $60,000 $322,500
Myers Park $1,009,605 $40,000 $0 $595,000 $10,000 $1,654,605
Myers Park Traditional $0 $40,000 $95,000 $0 $70,000 $205,000
Nations Ford $120,031 $40,000 $40,000 $40,000 $40,000 $280,031
Newell $255,950 $468,000 $0 $45,000 $0 $768,950
North Mecklenburg $889,578 $140,000 $470,433 $590,000 $695,000 $2,785,011
North Ridge $0 $70,000 $0 $758,500 $0 $828,500
Northeast $0 $595,000 $100,000 $42,000 $0 $737,000
Northwest School of the Arts $467,448 $40,000 $40,000 $120,000 $69,000 $736,448
Oakdale $0 $0 $0 $65,000 $88,800 $153,800
Page 6 of 10

Facility Sustainment Plan
Category 2
Repair and Replacment Cost Estimates
( By School By Year )
2/3/201612:02 PM
SCHOOL/FACILITY (alphabetically listed)5 Yrs Budget
Estimates
Estimated Costs
FY 18‐19
Estimated Costs
FY 19‐20
Estimated Costs
FY 20‐21
Estimated Costs
FY 16‐17
Estimated Costs
FY 17‐18
Oakhurst $0 $80,000 $0 $461,342 $27,000 $568,342
Oaklawn $15,000 $0 $0 $712,547 $14,000 $741,547
Olde Providence $46,000 $0 $60,000 $756,120 $5,000 $867,120
Olympic $3,540,694 $611,730 $557,200 $425,000 $0 $5,134,624
Lawrence Orr $0 $0 $0 $0 $0 $0
Orr Road Transportation $0 $0 $0 $0 $10,000 $10,000
Pallisades $13,300 $0 $0 $0 $0 $13,300
Park Road $95,000 $0 $70,000 $0 $173,430 $338,430
Parkside $0 $0 $0 $0 $0 $0
Paw Creek $15,000 $52,000 $60,000 $40,000 $12,000 $179,000
Pawtuckett $0 $0 $342,677 $0 $0 $342,677
Perf. Learning Center (at Derita) $30,000 $20,000 $70,000 $60,000 $30,000 $210,000
Piedmont Open $0 $272,580 $1,292,000 $30,000 $0 $1,594,580
Pineville $15,000 $0 $0 $0 $0 $15,000
Pinewood $0 $0 $175,000 $0 $11,600 $186,600
Piney Grove $30,000 $130,000 $12,000 $0 $902,564 $1,074,564
Plaza Road $0 $485,874 $0 $0 $0 $485,874
Polo Ridge $15,000 $0 $0 $0 $55,000 $70,000
Providence $1,403,000 $3,336,488 $555,000 $50,000 $100,000 $5,444,488
Providence Spring $145,000 $0 $0 $0 $8,500 $153,500
Page 7 of 10

Facility Sustainment Plan
Category 2
Repair and Replacment Cost Estimates
( By School By Year )
2/3/201612:02 PM
SCHOOL/FACILITY (alphabetically listed)5 Yrs Budget
Estimates
Estimated Costs
FY 18‐19
Estimated Costs
FY 19‐20
Estimated Costs
FY 20‐21
Estimated Costs
FY 16‐17
Estimated Costs
FY 17‐18
Quail Hollow $0 $0 $1,440,000 $2,124,950 $0 $3,564,950
Rama Road $0 $154,421 $0 $940,442 $39,677 $1,134,540
Randolph $1,480,000 $0 $15,000 $0 $38,000 $1,533,000
Ranson $40,000 $0 $175,660 $5,000 $642,200 $862,860
Reedy Creek $133,748 $60,000 $97,000 $0 $36,500 $327,248
Reid Park $45,000 $1,293,595 $40,000 $0 $0 $1,378,595
Ridge Road $0 $0 $16,000 $0 $15,000 $31,000
River Gate $10,500 $0 $0 $0 $12,000 $22,500
River Oaks Academy $0 $0 $0 $15,000 $12,000 $27,000
Robinson (Jay M.) $595,000 $0 $130,000 $39,000 $0 $764,000
Rocky River $0 $0 $0 $0 $435,000 $435,000
Sedgefield ES $94,000 $70,000 $89,800 $69,000 $0 $322,800
Sedgefield MS $40,000 $30,000 $78,638 $15,000 $71,000 $234,638
Selwyn $15,000 $318,612 $95,000 $12,000 $0 $440,612
Shamrock Gardens $112,000 $235,000 $190,000 $100,000 $100,000 $737,000
Sharon $9,000 $0 $185,000 $12,000 $0 $206,000
Smith Admin $311,849 $545,120 $150,480 $5,000 $265,690 $1,278,139
Smithfield $0 $15,000 $72,000 $1,321,147 $0 $1,408,147
South Charlotte $50,000 $2,040,943 $140,000 $15,000 $0 $2,245,943
South Mecklenburg $0 $350,000 $183,395 $79,000 $879,818 $1,492,213
Page 8 of 10

Facility Sustainment Plan
Category 2
Repair and Replacment Cost Estimates
( By School By Year )
2/3/201612:02 PM
SCHOOL/FACILITY (alphabetically listed)5 Yrs Budget
Estimates
Estimated Costs
FY 18‐19
Estimated Costs
FY 19‐20
Estimated Costs
FY 20‐21
Estimated Costs
FY 16‐17
Estimated Costs
FY 17‐18
Southwest $0 $69,600 $0 $16,400 $0 $86,000
Spaugh (Herbert) $0 $0 $158,000 $0 $150,000 $308,000
Stafford Drive Facility $0 $0 $0 $0 $2,343,864 $2,343,864
Starmount $517,373 $0 $10,000 $514,069 $102,080 $1,143,522
Statesville Road $254,365 $1,200,000 $2,800 $0 $50,000 $1,507,165
Steele Creek $584,200 $46,560 $1,585,378 $0 $0 $2,216,138
Sterling $0 $0 $129,500 $0 $5,000 $134,500
Stoney Creek $18,100 $0 $0 $0 $15,000 $33,100
Thomasboro $22,000 $0 $60,000 $95,000 $9,400 $186,400
Torrence Creek $0 $0 $0 $85,000 $95,000 $180,000
Tryon Hills $0 $0 $1,200,000 $0 $7,600 $1,207,600
Trillium Springs (at Old Long Creek) $320,000 $0 $0 $10,000 $30,000 $360,000
Tuckaseegee $635,720 $0 $0 $0 $0 $635,720
University Meadows $0 $0 $162,000 $0 $0 $162,000
University Park $442,000 $170,000 $0 $0 $60,000 $672,000
Vance $0 $3,100,000 $80,000 $300,000 $840,000 $4,320,000
Villa Heights $0 $0 $658,623 $1,200,000 $0 $1,858,623
Waddell $180,000 $343,000 $60,000 $15,000 $150,000 $748,000
Washam (JV) $0 $11,600 $0 $0 $0 $11,600
West Charlotte $380,000 $237,433 $544,800 $650,000 $578,160 $2,390,393
Page 9 of 10

Facility Sustainment Plan
Category 2
Repair and Replacment Cost Estimates
( By School By Year )
2/3/201612:02 PM
SCHOOL/FACILITY (alphabetically listed)5 Yrs Budget
Estimates
Estimated Costs
FY 18‐19
Estimated Costs
FY 19‐20
Estimated Costs
FY 20‐21
Estimated Costs
FY 16‐17
Estimated Costs
FY 17‐18
West Mecklenburg $1,287,029 $168,000 $310,000 $556,000 $1,453,448 $3,774,477
West Mecklenburg Transportation $0 $0 $0 $0 $0 $0
Westerly Hills $15,000 $0 $60,000 $0 $80,000 $155,000
Whitewater Academy $162,000 $0 $0 $0 $12,000 $174,000
Whitewater MS $0 $0 $0 $10,000 $15,000 $25,000
Williams (John Taylor) $1,732,430 $0 $0 $280,000 $110,000 $2,122,430
Wilkerson Blvd. Transportation $0 $0 $0 $3,016,370 $0 $3,016,370
Wilmore Building $0 $0 $1,200,000 $0 $0 $1,200,000
Wilson $0 $0 $0 $0 $0 $0
Winding Springs $60,000 $1,215,000 $1,374,354 $0 $40,000 $2,689,354
Windsor Park $64,000 $15,000 $5,000 $109,000 $188,293 $381,293
Winget Park $90,480 $0 $16,000 $0 $85,000 $191,480
Winterfield $0 $15,000 $9,000 $0 $60,000 $84,000
SCHOOLS BY YEARLY ESTIMATES $35,869,458 $29,502,279 $27,207,847 $27,633,644 $30,412,119 $150,625,347
Page 10 of 10

Facility Sustainment Plan
Category 2
Repair and Replacement Cost Estimates
(School By Component ‐ 5 Year Totals)
2/3/201612:03 PM
Ada Jenkins $0 $0 $0 $0 $0 $0 $0 $0 $0 $0 $0 $0 $0 $0 $0 $0
Albemarle Road ES $0 $0 $0 $181,010 $0 $60,000 $0 $0 $0 $0 $95,000 $45,000 $0 $0 $0 $381,010
Albemarle Road MS $0 $0 $0 $801,385 $0 $60,000 $0 $100,000 $0 $0 $100,000 $45,000 $595,000 $0 $0 $1,701,385
Alexander (JM) $0 $0 $0 $1,273,800 $0 $12,000 $6,000 $0 $0 $50,000 $35,000 $0 $0 $0 $0 $1,376,800
Alexander (Nathaniel) $0 $0 $0 $0 $0 $0 $0 $0 $0 $0 $105,000 $45,000 $0 $0 $0 $150,000
Allenbrook $0 $0 $0 $861,779 $0 $130,000 $0 $0 $0 $0 $0 $17,000 $0 $0 $0 $1,008,779
Amay James $0 $0 $0 $0 $0 $0 $0 $0 $0 $0 $395,000 $0 $0 $0 $0 $395,000
Ardrey Kell $0 $0 $0 $0 $0 $0 $14,000 $0 $0 $0 $180,000 $380,000 $400,000 $0 $0 $974,000
Ashley Park $0 $0 $0 $218,143 $0 $60,000 $9,500 $0 $0 $0 $0 $27,000 $0 $376,580 $0 $691,223
Atrium $0 $0 $0 $0 $0 $0 $0 $0 $0 $0 $0 $0 $0 $0 $0 $0
Bailey $0 $0 $0 $0 $0 $0 $49,000 $0 $0 $0 $172,000 $50,000 $0 $0 $0 $271,000
Bain $0 $0 $0 $0 $0 $0 $0 $0 $0 $0 $0 $0 $0 $0 $0 $0
Bain (Old) $0 $0 $0 $916,788 $0 $0 $0 $0 $0 $60,000 $10,000 $12,000 $0 $0 $0 $998,788
Ballantyne $0 $0 $0 $0 $0 $0 $0 $0 $0 $15,000 $0 $10,000 $0 $0 $0 $25,000
Barnette $0 $0 $0 $0 $0 $0 $116,000 $0 $0 $0 $0 $0 $0 $0 $0 $116,000
Barringer Academic Center $0 $0 $0 $0 $0 $0 $0 $0 $0 $15,000 $80,000 $5,000 $0 $0 $95,000 $195,000
Berewick $0 $0 $0 $0 $0 $0 $27,000 $0 $0 $0 $80,000 $0 $0 $0 $0 $107,000
Berry (Phillip O.) Academy of Technology $0 $0 $0 $0 $0 $0 $14,000 $0 $0 $0 $63,000 $410,000 $850,000 $0 $0 $1,337,000
Berryhill $0 $0 $0 $0 $0 $60,000 $15,000 $0 $0 $0 $80,000 $42,000 $0 $0 $0 $197,000
Beverly Woods $0 $0 $0 $0 $0 $0 $12,000 $50,000 $0 $40,000 $70,000 $0 $0 $0 $0 $172,000
Billingsville/Rosenwald $0 $0 $0 $0 $0 $0 $0 $0 $0 $0 $0 $0 $0 $0 $0 $0
Billingsville $100,000 $0 $0 $0 $0 $60,000 $0 $0 $0 $0 $80,000 $0 $0 $0 $0 $240,000
Blythe $0 $0 $0 $0 $0 $60,000 $0 $0 $0 $15,000 $10,000 $45,000 $0 $0 $95,000 $225,000
Bradley (Francis) $0 $0 $0 $0 $0 $60,000 $34,000 $0 $0 $65,000 $10,000 $20,000 $595,000 $0 $0 $784,000
Briarwood $200,000 $0 $0 $271,217 $0 $60,000 $0 $0 $0 $15,000 $40,000 $65,000 $0 $0 $0 $651,217
Bruns Avenue $0 $0 $0 $520,798 $0 $5,000 $0 $0 $0 $0 $40,000 $20,000 $0 $1,200,000 $0 $1,785,798
Butler (David) $0 $0 $0 $0 $0 $150,000 $46,000 $0 $0 $0 $10,000 $370,000 $960,000 $0 $0 $1,536,000
Byers (Walter G.) $0 $0 $0 $0 $0 $60,000 $0 $0 $0 $0 $0 $20,000 $0 $0 $95,000 $175,000
Athletic
Facilities Paving
5 Yrs Budget
Estimates
Doors &
Windows
Finishes &
Specialties Stormwater
Conveying
Systems
Fire
Protection Plumbing HVAC Electrical Playgrounds
SCHOOL / FACILITY (alphabetically
listed) Concrete Casework
Thermal &
Moisture Roofing
Page 1 of 7
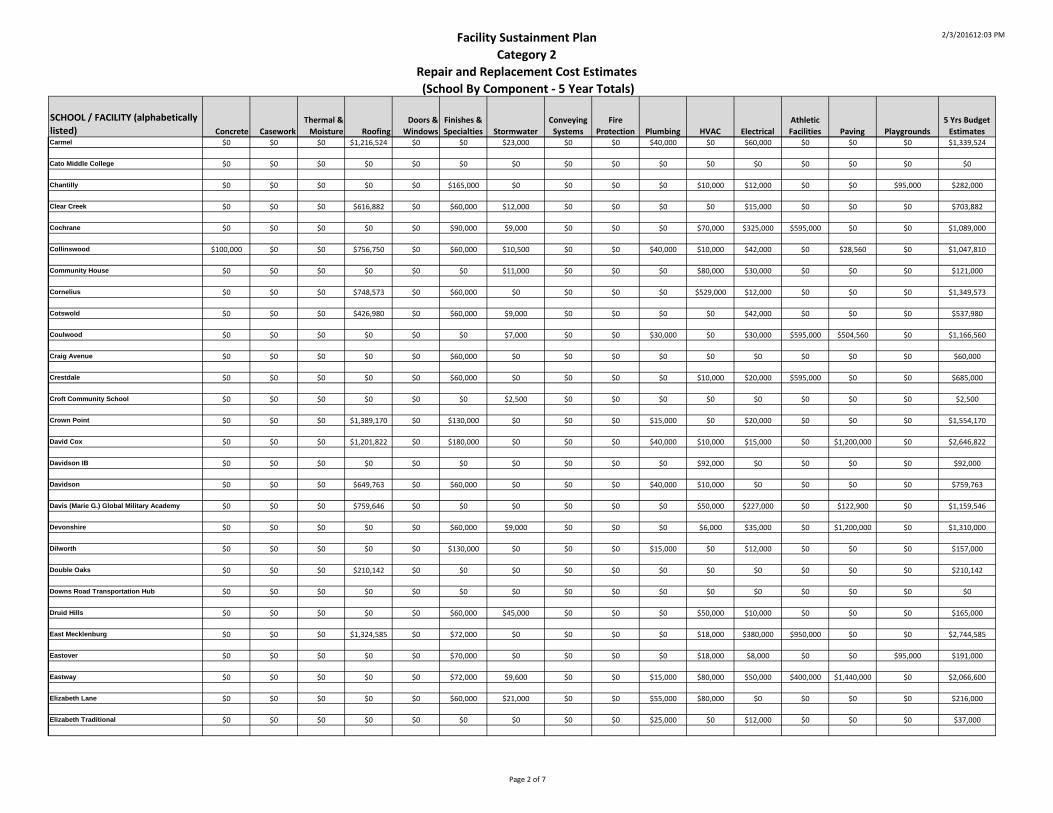
Facility Sustainment Plan
Category 2
Repair and Replacement Cost Estimates
(School By Component ‐ 5 Year Totals)
2/3/201612:03 PM
Athletic
Facilities Paving
5 Yrs Budget
Estimates
Doors &
Windows
Finishes &
Specialties Stormwater
Conveying
Systems
Fire
Protection Plumbing HVAC Electrical Playgrounds
SCHOOL / FACILITY (alphabetically
listed) Concrete Casework
Thermal &
Moisture RoofingCarmel $0 $0 $0 $1,216,524 $0 $0 $23,000 $0 $0 $40,000 $0 $60,000 $0 $0 $0 $1,339,524
Cato Middle College $0 $0 $0 $0 $0 $0 $0 $0 $0 $0 $0 $0 $0 $0 $0 $0
Chantilly $0 $0 $0 $0 $0 $165,000 $0 $0 $0 $0 $10,000 $12,000 $0 $0 $95,000 $282,000
Clear Creek $0 $0 $0 $616,882 $0 $60,000 $12,000 $0 $0 $0 $0 $15,000 $0 $0 $0 $703,882
Cochrane $0 $0 $0 $0 $0 $90,000 $9,000 $0 $0 $0 $70,000 $325,000 $595,000 $0 $0 $1,089,000
Collinswood $100,000 $0 $0 $756,750 $0 $60,000 $10,500 $0 $0 $40,000 $10,000 $42,000 $0 $28,560 $0 $1,047,810
Community House $0 $0 $0 $0 $0 $0 $11,000 $0 $0 $0 $80,000 $30,000 $0 $0 $0 $121,000
Cornelius $0 $0 $0 $748,573 $0 $60,000 $0 $0 $0 $0 $529,000 $12,000 $0 $0 $0 $1,349,573
Cotswold $0 $0 $0 $426,980 $0 $60,000 $9,000 $0 $0 $0 $0 $42,000 $0 $0 $0 $537,980
Coulwood $0 $0 $0 $0 $0 $0 $7,000 $0 $0 $30,000 $0 $30,000 $595,000 $504,560 $0 $1,166,560
Craig Avenue $0 $0 $0 $0 $0 $60,000 $0 $0 $0 $0 $0 $0 $0 $0 $0 $60,000
Crestdale $0 $0 $0 $0 $0 $60,000 $0 $0 $0 $0 $10,000 $20,000 $595,000 $0 $0 $685,000
Croft Community School $0 $0 $0 $0 $0 $0 $2,500 $0 $0 $0 $0 $0 $0 $0 $0 $2,500
Crown Point $0 $0 $0 $1,389,170 $0 $130,000 $0 $0 $0 $15,000 $0 $20,000 $0 $0 $0 $1,554,170
David Cox $0 $0 $0 $1,201,822 $0 $180,000 $0 $0 $0 $40,000 $10,000 $15,000 $0 $1,200,000 $0 $2,646,822
Davidson IB $0 $0 $0 $0 $0 $0 $0 $0 $0 $0 $92,000 $0 $0 $0 $0 $92,000
Davidson $0 $0 $0 $649,763 $0 $60,000 $0 $0 $0 $40,000 $10,000 $0 $0 $0 $0 $759,763
Davis (Marie G.) Global Military Academy $0 $0 $0 $759,646 $0 $0 $0 $0 $0 $0 $50,000 $227,000 $0 $122,900 $0 $1,159,546
Devonshire $0 $0 $0 $0 $0 $60,000 $9,000 $0 $0 $0 $6,000 $35,000 $0 $1,200,000 $0 $1,310,000
Dilworth $0 $0 $0 $0 $0 $130,000 $0 $0 $0 $15,000 $0 $12,000 $0 $0 $0 $157,000
Double Oaks $0 $0 $0 $210,142 $0 $0 $0 $0 $0 $0 $0 $0 $0 $0 $0 $210,142
Downs Road Transportation Hub $0 $0 $0 $0 $0 $0 $0 $0 $0 $0 $0 $0 $0 $0 $0 $0
Druid Hills $0 $0 $0 $0 $0 $60,000 $45,000 $0 $0 $0 $50,000 $10,000 $0 $0 $0 $165,000
East Mecklenburg $0 $0 $0 $1,324,585 $0 $72,000 $0 $0 $0 $0 $18,000 $380,000 $950,000 $0 $0 $2,744,585
Eastover $0 $0 $0 $0 $0 $70,000 $0 $0 $0 $0 $18,000 $8,000 $0 $0 $95,000 $191,000
Eastway $0 $0 $0 $0 $0 $72,000 $9,600 $0 $0 $15,000 $80,000 $50,000 $400,000 $1,440,000 $0 $2,066,600
Elizabeth Lane $0 $0 $0 $0 $0 $60,000 $21,000 $0 $0 $55,000 $80,000 $0 $0 $0 $0 $216,000
Elizabeth Traditional $0 $0 $0 $0 $0 $0 $0 $0 $0 $25,000 $0 $12,000 $0 $0 $0 $37,000
Page 2 of 7

Facility Sustainment Plan
Category 2
Repair and Replacement Cost Estimates
(School By Component ‐ 5 Year Totals)
2/3/201612:03 PM
Athletic
Facilities Paving
5 Yrs Budget
Estimates
Doors &
Windows
Finishes &
Specialties Stormwater
Conveying
Systems
Fire
Protection Plumbing HVAC Electrical Playgrounds
SCHOOL / FACILITY (alphabetically
listed) Concrete Casework
Thermal &
Moisture RoofingElon Park $0 $0 $0 $0 $0 $0 $0 $0 $0 $0 $0 $15,000 $0 $0 $0 $15,000
Endhaven $0 $0 $0 $0 $0 $0 $0 $0 $0 $25,000 $0 $0 $0 $0 $95,000 $120,000
First Ward $0 $0 $0 $0 $0 $0 $0 $0 $0 $15,000 $108,000 $22,000 $0 $0 $0 $145,000
Garinger $0 $0 $0 $2,026,786 $0 $0 $0 $100,000 $0 $0 $110,000 $30,000 $300,000 $0 $0 $2,566,786
Graham (Alexander) $0 $0 $0 $841,965 $0 $0 $0 $0 $0 $0 $0 $15,000 $0 $0 $0 $856,965
Grand Oak $0 $0 $0 $0 $0 $0 $4,000 $0 $0 $15,000 $0 $0 $0 $0 $0 $19,000
Graphic Production Center $0 $0 $0 $0 $0 $0 $11,000 $0 $0 $0 $0 $0 $0 $0 $0 $11,000
Greenway Park $0 $0 $0 $1,219,949 $0 $60,000 $14,000 $0 $0 $40,000 $0 $27,000 $0 $0 $0 $1,360,949
Grier (Joseph W.) Academy $0 $0 $0 $0 $0 $60,000 $13,000 $0 $0 $15,000 $58,000 $0 $0 $0 $95,000 $241,000
Gunn (JH) $0 $0 $0 $239,547 $0 $60,000 $0 $0 $0 $0 $80,000 $0 $0 $0 $95,000 $474,547
Harding University $0 $0 $0 $211,079 $0 $60,000 $12,000 $0 $0 $50,000 $375,000 $65,000 $950,000 $177,910 $0 $1,900,989
Hawk Ridge $0 $0 $0 $0 $0 $130,000 $9,000 $0 $0 $25,000 $130,000 $0 $0 $0 $0 $294,000
Hawthorne $0 $0 $0 $1,194,582 $0 $0 $0 $0 $0 $0 $0 $0 $0 $0 $0 $1,194,582
Hickory Grove $0 $0 $0 $136,631 $0 $0 $0 $0 $0 $15,000 $80,000 $15,000 $0 $0 $0 $246,631
Hickory Grove (Old) $0 $0 $0 $217,127 $0 $0 $16,000 $0 $0 $0 $40,000 $8,000 $0 $0 $0 $281,127
Hidden Valley $100,000 $0 $0 $1,197,308 $0 $110,000 $0 $0 $0 $40,000 $0 $20,000 $0 $0 $0 $1,467,308
Highland Creek $0 $0 $0 $0 $0 $0 $0 $0 $0 $0 $0 $0 $0 $0 $0 $0
Highland Mill $0 $0 $0 $0 $0 $0 $0 $0 $0 $0 $0 $23,000 $0 $0 $95,000 $118,000
Highland Renaissance Academy $0 $0 $0 $0 $0 $0 $8,600 $0 $0 $0 $56,000 $20,000 $0 $0 $0 $84,600
Hopewell $0 $0 $0 $0 $0 $150,000 $5,000 $0 $0 $0 $112,000 $370,000 $300,000 $0 $0 $937,000
Hornets Nest $0 $0 $0 $0 $0 $60,000 $0 $0 $0 $40,000 $309,000 $10,000 $0 $1,200,000 $0 $1,619,000
Hough (WA) $0 $0 $0 $0 $0 $0 $23,000 $0 $0 $0 $0 $435,000 $0 $0 $0 $458,000
Huntersville $0 $0 $0 $645,163 $0 $120,000 $17,000 $0 $0 $0 $10,000 $27,000 $0 $0 $0 $819,163
Huntingtowne Farms $0 $0 $0 $82,864 $0 $60,000 $14,000 $0 $0 $0 $0 $40,000 $0 $0 $95,000 $291,864
Idlewild $0 $0 $0 $0 $0 $0 $21,700 $0 $0 $0 $105,000 $12,000 $0 $0 $0 $138,700
Independence $0 $0 $0 $1,484,880 $0 $162,000 $6,400 $0 $0 $70,000 $190,000 $315,000 $1,350,000 $0 $0 $3,578,280
Irwin Avenue $0 $0 $0 $0 $0 $120,000 $0 $0 $0 $0 $10,000 $27,000 $0 $0 $0 $157,000
Kennedy (Robert F.) $0 $0 $0 $0 $0 $200,000 $0 $0 $0 $50,000 $544,000 $50,000 $0 $478,410 $0 $1,322,410
Page 3 of 7

Facility Sustainment Plan
Category 2
Repair and Replacement Cost Estimates
(School By Component ‐ 5 Year Totals)
2/3/201612:03 PM
Athletic
Facilities Paving
5 Yrs Budget
Estimates
Doors &
Windows
Finishes &
Specialties Stormwater
Conveying
Systems
Fire
Protection Plumbing HVAC Electrical Playgrounds
SCHOOL / FACILITY (alphabetically
listed) Concrete Casework
Thermal &
Moisture RoofingKing (Martin Luther, Jr.) $0 $0 $0 $0 $0 $0 $53,000 $0 $0 $15,000 $0 $50,000 $0 $0 $0 $118,000
Lake Wylie $0 $0 $0 $1,298,759 $0 $60,000 $5,500 $0 $0 $40,000 $0 $0 $0 $580,690 $0 $1,984,949
Lakeview $0 $0 $0 $0 $0 $0 $0 $0 $0 $0 $0 $0 $0 $0 $0 $0
Lansdowne $0 $0 $0 $749,574 $0 $0 $0 $0 $0 $55,000 $65,000 $10,000 $0 $0 $0 $879,574
Leadership Academy (at Governer's Village) $0 $0 $0 $0 $0 $0 $0 $0 $0 $0 $0 $0 $0 $0 $0 $0
Lebanon Road $0 $0 $0 $0 $0 $130,000 $0 $0 $0 $40,000 $309,000 $20,000 $0 $1,200,000 $0 $1,699,000
Levine Middle College $0 $0 $0 $0 $0 $0 0 $0 $0 $0 $0 $0 $0 $0 $0 $0
LIFT Academy (at Graham Center) $100,000 $0 $0 $0 $0 $0 $0 $0 $0 $0 $150,000 $5,000 $0 $0 $0 $255,000
Lincoln Heights $0 $0 $0 $0 $0 $0 $0 $0 $0 $0 $65,000 $167,000 $0 $0 $0 $232,000
Long Creek $0 $0 $0 $0 $0 $0 $8,800 $0 $0 $15,000 $0 $0 $0 $0 $0 $23,800
Mallard Creek ES $0 $0 $0 $746,188 $0 $60,000 $0 $0 $0 $0 $60,000 $0 $0 $1,200,000 $0 $2,066,188
Mallard Creek HS $0 $0 $0 $0 $0 $60,000 $17,000 $0 $0 $0 $0 $410,000 $650,000 $0 $0 $1,137,000
Martin (James) $0 $0 $0 $0 $0 $110,000 $35,000 $0 $0 $0 $90,000 $35,000 $595,000 $0 $0 $865,000
Matthews $0 $0 $0 $1,020,625 $0 $85,000 $19,500 $0 $0 $0 $0 $45,000 $0 $0 $95,000 $1,265,125
McAlpine $0 $0 $0 $979,482 $0 $60,000 $0 $0 $0 $40,000 $0 $20,000 $0 $0 $0 $1,099,482
McClintock $0 $0 $0 $0 $0 $0 $0 $0 $0 $0 $0 $0 $0 $0 $0 $0
McKee Road $0 $0 $0 $0 $0 $110,000 $30,000 $0 $0 $0 $275,000 $18,000 $0 $0 $95,000 $528,000
Merry Oaks $100,000 $0 $0 $0 $0 $60,000 $19,500 $0 $0 $0 $25,000 $0 $0 $95,200 $95,000 $394,700
Metro School (Old) $0 $0 $0 $0 $0 $0 $0 $0 $0 $0 $0 $0 $0 $0 $0 $0
Metro School $0 $0 $0 $0 $0 $0 $0 $0 $0 $50,000 $70,000 $160,000 $0 $0 $95,000 $375,000
Midwood $0 $0 $0 $36,577 $0 $0 $0 $0 $0 $0 $0 $0 $0 $0 $0 $36,577
Mint Hill $0 $0 $0 $0 $0 $0 $26,000 $0 $0 $0 $80,000 $45,000 $0 $0 $0 $151,000
Montclaire $0 $0 $0 $0 $0 $60,000 $0 $0 $0 $40,000 $0 $0 $0 $259,840 $95,000 $454,840
Morehead $0 $0 $0 $0 $0 $60,000 $0 $0 $0 $0 $130,000 $45,000 $0 $0 $0 $235,000
Morgan School (Abandoned/Shut Down) $0
Morgan School-Old (Torrence Ave) $100,000 $0 $0 $152,049 $0 $0 $0 $0 $0 $0 $0 $0 $0 $0 $0 $252,049
Mountain Island $0 $0 $0 $0 $0 $60,000 $15,500 $0 $0 $15,000 $125,000 $12,000 $0 $0 $95,000 $322,500
Myers Park $0 $0 $0 $889,605 $0 $0 $0 $0 $0 $0 $200,000 $15,000 $550,000 $0 $0 $1,654,605
Page 4 of 7

Facility Sustainment Plan
Category 2
Repair and Replacement Cost Estimates
(School By Component ‐ 5 Year Totals)
2/3/201612:03 PM
Athletic
Facilities Paving
5 Yrs Budget
Estimates
Doors &
Windows
Finishes &
Specialties Stormwater
Conveying
Systems
Fire
Protection Plumbing HVAC Electrical Playgrounds
SCHOOL / FACILITY (alphabetically
listed) Concrete Casework
Thermal &
Moisture RoofingMyers Park Traditional $0 $0 $0 $0 $0 $60,000 $0 $0 $0 $0 $40,000 $10,000 $0 $0 $95,000 $205,000
Nations Ford $200,000 $0 $0 $61,331 $0 $0 $18,700 $0 $0 $0 $0 $0 $0 $0 $0 $280,031
Newell $0 $0 $0 $175,950 $0 $0 $0 $0 $0 $0 $593,000 $0 $0 $0 $0 $768,950
North Mecklenburg $700,000 $0 $0 $676,351 $0 $160,000 $144,000 $0 $0 $0 $80,000 $5,000 $850,000 $169,660 $0 $2,785,011
North Ridge $0 $0 $0 $0 $0 $180,000 $8,500 $0 $0 $0 $0 $45,000 $595,000 $0 $0 $828,500
Northeast $0 $0 $0 $0 $0 $0 $0 $100,000 $0 $0 $0 $42,000 $595,000 $0 $0 $737,000
Northwest School of the Arts $200,000 $0 $0 $412,448 $0 $0 $9,000 $0 $0 $0 $100,000 $15,000 $0 $0 $0 $736,448
Oakdale $0 $0 $0 $0 $0 $60,000 $8,800 $0 $0 $0 $80,000 $5,000 $0 $0 $0 $153,800
Oakhurst $0 $0 $0 $461,342 $0 $0 $17,000 $0 $0 $0 $80,000 $10,000 $0 $0 $0 $568,342
Oaklawn $0 $0 $0 $617,547 $0 $0 $14,000 $0 $0 $0 $0 $15,000 $0 $0 $95,000 $741,547
Olde Providence $0 $0 $0 $756,120 $0 $60,000 $0 $0 $0 $40,000 $0 $11,000 $0 $0 $0 $867,120
Olympic $0 $0 $0 $1,660,694 $0 $150,000 $0 $100,000 $0 $12,000 $65,000 $290,000 $550,000 $2,306,930 $0 $5,134,624
Orr (Lawrence) $0 $0 $0 $0 $0 $0 $0 $0 $0 $0 $0 $0 $0 $0 $0 $0
Orr Road Transportation $0 $0 $0 $0 $0 $0 $10,000 $0 $0 $0 $0 $0 $0 $0 $0 $10,000
Pallisades $0 $0 $0 $0 $0 $0 $13,300 $0 $0 $0 $0 $0 $0 $0 $0 $13,300
Park Road $0 $0 $0 $0 $0 $60,000 $0 $0 $0 $0 $0 $10,000 $0 $173,430 $95,000 $338,430
Parkside $0 $0 $0 $0 $0 $0 $0 $0 $0 $0 $0 $0 $0 $0 $0 $0
Paw Creek $0 $0 $0 $0 $0 $60,000 $12,000 $0 $0 $55,000 $30,000 $22,000 $0 $0 $0 $179,000
Pawtuckett $0 $0 $0 $92,677 $0 $0 $0 $0 $0 $0 $250,000 $0 $0 $0 $0 $342,677
Perf. Learning Center (@ Derita) $100,000 $0 $0 $0 $0 $0 $0 $0 $0 $0 $65,000 $45,000 $0 $0 $0 $210,000
Piedmont Open $0 $0 $0 $272,580 $0 $0 $0 $0 $0 $30,000 $80,000 $12,000 $0 $1,200,000 $0 $1,594,580
Pineville $0 $0 $0 $0 $0 $0 $0 $0 $0 $15,000 $0 $0 $0 $0 $0 $15,000
Pinewood $0 $0 $0 $0 $0 $0 $11,600 $0 $0 $0 $80,000 $0 $0 $0 $95,000 $186,600
Piney Grove $0 $0 $0 $902,564 $0 $130,000 $0 $0 $0 $0 $0 $42,000 $0 $0 $0 $1,074,564
Plaza Road $0 $0 $0 $485,874 $0 $0 $0 $0 $0 $0 $0 $0 $0 $0 $0 $485,874
Polo Ridge $0 $0 $0 $0 $0 $0 $40,000 $0 $0 $15,000 $0 $15,000 $0 $0 $0 $70,000
Providence $0 $0 $0 $2,946,488 $0 $150,000 $0 $100,000 $0 $0 $1,293,000 $405,000 $550,000 $0 $0 $5,444,488
Providence Spring $0 $0 $0 $0 $0 $50,000 $8,500 $0 $0 $0 $0 $0 $0 $0 $95,000 $153,500
Page 5 of 7

Facility Sustainment Plan
Category 2
Repair and Replacement Cost Estimates
(School By Component ‐ 5 Year Totals)
2/3/201612:03 PM
Athletic
Facilities Paving
5 Yrs Budget
Estimates
Doors &
Windows
Finishes &
Specialties Stormwater
Conveying
Systems
Fire
Protection Plumbing HVAC Electrical Playgrounds
SCHOOL / FACILITY (alphabetically
listed) Concrete Casework
Thermal &
Moisture RoofingQuail Hollow $0 $0 $0 $2,109,950 $0 $0 $0 $0 $0 $0 $0 $15,000 $0 $1,440,000 $0 $3,564,950
Rama Road $0 $0 $0 $1,017,540 $0 $60,000 $0 $0 $0 $0 $40,000 $17,000 $0 $0 $0 $1,134,540
Randolph $0 $0 $0 $0 $0 $0 $8,000 $0 $0 $40,000 $0 $45,000 $0 $1,440,000 $0 $1,533,000
Ranson $0 $0 $0 $145,660 $0 $0 $7,200 $0 $0 $40,000 $40,000 $35,000 $595,000 $0 $0 $862,860
Reedy Creek $0 $0 $0 $3,748 $0 $110,000 $6,500 $0 $0 $0 $160,000 $47,000 $0 $0 $0 $327,248
Reid Park $0 $0 $0 $1,233,595 $0 $60,000 $0 $0 $0 $40,000 $0 $45,000 $0 $0 $0 $1,378,595
Ridge Road $0 $0 $0 $0 $0 $0 $16,000 $0 $0 $0 $0 $15,000 $0 $0 $0 $31,000
River Gate $0 $0 $0 $0 $0 $0 $10,500 $0 $0 $0 $0 $12,000 $0 $0 $0 $22,500
River Oaks Academy $0 $0 $0 $0 $0 $0 $15,000 $0 $0 $0 $0 $12,000 $0 $0 $0 $27,000
Robinson (Jay M.) $0 $0 $0 $0 $0 $110,000 $39,000 $0 $0 $0 $0 $20,000 $595,000 $0 $0 $764,000
Rocky River $0 $0 $0 $0 $0 $0 $0 $0 $0 $0 $0 $435,000 $0 $0 $0 $435,000
Sedgefield ES $0 $0 $0 $0 $0 $130,000 $14,000 $0 $0 $0 $134,000 $15,000 $0 $29,800 $0 $322,800
Sedgefield MS $0 $0 $0 $48,638 $0 $0 $0 $0 $0 $0 $111,000 $75,000 $0 $0 $0 $234,638
Selwyn $0 $0 $0 $318,612 $0 $0 $0 $0 $0 $15,000 $0 $12,000 $0 $0 $95,000 $440,612
Shamrock Gardens $500,000 $0 $0 $0 $0 $60,000 $0 $0 $0 $55,000 $90,000 $32,000 $0 $0 $0 $737,000
Sharon $0 $0 $0 $0 $0 $60,000 $9,000 $0 $0 $0 $125,000 $12,000 $0 $0 $0 $206,000
Smith Admin $0 $0 $0 $311,849 $0 $60,000 $0 $0 $0 $0 $488,000 $5,000 $0 $413,290 $0 $1,278,139
Smithfield $0 $0 $0 $1,305,147 $0 $60,000 $16,000 $0 $0 $0 $0 $27,000 $0 $0 $0 $1,408,147
South Charlotte $0 $0 $0 $2,040,943 $0 $110,000 $0 $0 $0 $0 $50,000 $45,000 $0 $0 $0 $2,245,943
South Mecklenburg $0 $0 $0 $363,213 $0 $150,000 $9,000 $0 $0 $70,000 $0 $0 $900,000 $0 $0 $1,492,213
Southwest $0 $0 $0 $0 $0 $0 $16,400 $0 $0 $0 $0 $0 $0 $69,600 $0 $86,000
Spaugh (Herbert) $0 $0 $0 $0 $0 $150,000 $8,000 $0 $0 $0 $0 $150,000 $0 $0 $0 $308,000
Stafford Drive Facility $0 $0 $0 $2,331,264 $0 $0 $12,600 $0 $0 $0 $0 $0 $0 $0 $0 $2,343,864
Starmount $0 $0 $0 $741,502 $0 $0 $0 $0 $0 $30,000 $0 $10,000 $0 $362,020 $0 $1,143,522
Statesville Road $0 $0 $0 $124,365 $0 $0 $2,800 $0 $0 $50,000 $130,000 $0 $0 $1,200,000 $0 $1,507,165
Steele Creek $0 $0 $0 $1,163,678 $0 $60,000 $8,700 $0 $0 $40,000 $283,000 $42,000 $0 $618,760 $0 $2,216,138
Sterling $0 $0 $0 $0 $0 $0 $9,500 $0 $0 $25,000 $0 $5,000 $0 $0 $95,000 $134,500
Stoney Creek $0 $0 $0 $0 $0 $0 $18,100 $0 $0 $0 $0 $15,000 $0 $0 $0 $33,100
Page 6 of 7

Facility Sustainment Plan
Category 2
Repair and Replacement Cost Estimates
(School By Component ‐ 5 Year Totals)
2/3/201612:03 PM
Athletic
Facilities Paving
5 Yrs Budget
Estimates
Doors &
Windows
Finishes &
Specialties Stormwater
Conveying
Systems
Fire
Protection Plumbing HVAC Electrical Playgrounds
SCHOOL / FACILITY (alphabetically
listed) Concrete Casework
Thermal &
Moisture RoofingThomasboro $0 $0 $0 $0 $0 $60,000 $9,400 $0 $0 $0 $5,000 $17,000 $0 $0 $95,000 $186,400
Torrence Creek $0 $0 $0 $0 $0 $0 $0 $0 $0 $0 $85,000 $0 $0 $0 $95,000 $180,000
Tryon Hills (Leased) $0 $0 $0 $0 $0 $0 $7,600 $0 $0 $0 $0 $0 $0 $1,200,000 $0 $1,207,600
Trillium Springs (Old Long Creek) $0 $0 $0 $0 $0 $0 $0 $0 $0 $0 $0 $40,000 $0 $320,000 $0 $360,000
Tuckaseegee $0 $0 $0 $545,720 $0 $0 $90,000 $0 $0 $0 $0 $0 $0 $0 $0 $635,720
University Meadows $0 $0 $0 $0 $0 $60,000 $80,000 $0 $0 $0 $0 $22,000 $0 $0 $0 $162,000
University Park $0 $0 $0 $0 $0 $60,000 $40,000 $0 $0 $40,000 $522,000 $10,000 $0 $0 $0 $672,000
Vance $0 $0 $0 $0 $0 $150,000 $0 $0 $0 $50,000 $460,000 $60,000 $800,000 $2,800,000 $0 $4,320,000
Villa Heights $0 $0 $0 $658,623 $0 $0 $0 $0 $0 $0 $0 $0 $0 $1,200,000 $0 $1,858,623
Waddell $0 $0 $0 $0 $0 $150,000 $180,000 $0 $0 $0 $78,000 $340,000 $0 $0 $0 $748,000
Washam (JV) $0 $0 $0 $0 $0 $0 $11,600 $0 $0 $0 $0 $0 $0 $0 $0 $11,600
West Charlotte $0 $0 $0 $177,433 $0 $150,000 $0 $0 $0 $0 $550,000 $0 $550,000 $962,960 $0 $2,390,393
West Mecklenburg $0 $0 $0 $2,430,477 $0 $150,000 $0 $0 $0 $0 $744,000 $0 $450,000 $0 $0 $3,774,477
West Mecklenburg Transportation $0 $0 $0 $0 $0 $0 $0 $0 $0 $0 $0 $0 $0 $0 $0 $0
Westerly Hills $0 $0 $0 $0 $0 $60,000 $0 $0 $0 $40,000 $40,000 $15,000 $0 $0 $0 $155,000
Whitewater Academy ES $0 $0 $0 $0 $0 $0 $162,000 $0 $0 $0 $0 $12,000 $0 $0 $0 $174,000
Whitewater MS $0 $0 $0 $0 $0 $0 $10,000 $0 $0 $0 $0 $15,000 $0 $0 $0 $25,000
Williams (John Taylor) $0 $0 $0 $1,241,430 $0 $110,000 $0 $0 $0 $0 $496,000 $275,000 $0 $0 $0 $2,122,430
Wilkerson Blvd. Transportation $0 $0 $0 $0 $0 $0 $0 $0 $0 $0 $0 $0 $0 $3,016,370 $0 $3,016,370
Wilmore Building $0 $0 $0 $0 $0 $0 $0 $0 $0 $0 $0 $0 $0 $1,200,000 $0 $1,200,000
Wilson $0 $0 $0 $0 $0 $0 $0 $0 $0 $0 $0 $0 $0 $0 $0 $0
Winding Springs $0 $0 $0 $1,322,354 $0 $60,000 $40,000 $0 $0 $40,000 $0 $27,000 $0 $1,200,000 $0 $2,689,354
Windsor Park $0 $0 $0 $173,293 $0 $0 $14,000 $0 $0 $15,000 $64,000 $20,000 $0 $0 $95,000 $381,293
Winget Park $0 $0 $0 $0 $0 $0 $16,000 $0 $0 $0 $85,000 $0 $0 $90,480 $0 $191,480
Winterfield $0 $0 $0 $0 $0 $60,000 $9,000 $0 $0 $15,000 $0 $0 $0 $0 $0 $84,000
SCHOOLS BY 5 YEAR COMPONENT ESTIMATES $2,500,000 $0 $0 $59,047,497 $0 $7,983,000 $2,126,900 $550,000 $0 $2,072,000 $14,355,000 $8,583,000 $18,260,000 $32,677,950 $2,470,000 $150,625,347
Page 7 of 7

Charlotte‐Mecklenburg Schools Facility Sustainment Plan Unscheduled Maintenance
Category 3 Unscheduled Maintenance consists of service calls, emergency response, and other tasks that cannot be individually anticipated. Phasing of our proactive 5‐year sustainment model will reduce reactive unscheduled maintenance over time.

Draft as of 16 February 2016 126% 117% 110%
0.55 300 200 200 400 200 100 200 300 -1000Le
arn
ing
Co
mm
un
ity
BO
E D
istr
ict
Pro
ject
Ty
pe
Loca
tio
n
Ca
mp
us
FCI
20
15
Hig
he
st B
uil
din
g F
CI
20
15
Sta
ff B
uil
din
g U
tili
zati
on
w/o
Mo
bil
es
20
15
-20
16
Ca
teg
ory
Nu
mb
er
Ca
teg
ory
Pri
ori
ty
Pro
ject
Sco
re
He
alt
h a
nd
Sa
fety
Ma
nd
ate
s
Co
nti
nu
ity
Co
re O
ve
r C
ap
aci
ty
Co
re O
ve
r C
ap
aci
ty b
y
20
20
-20
21
Co
re O
ve
r C
ap
aci
ty b
y
20
25
-20
26
Init
iati
ve
s
Life
cycl
e R
ep
lace
me
nt
Log
isti
cal
Imp
act
No
tes
Co
st (
20
16
Do
lla
rs)
Est
ima
ted
Cu
mu
lati
ve
To
tal
S District 5 Replacement School Collinswood K8 0.59 187% 1 1 1000 300 0 0 400 0 0 0 300 0 On Former Smith Site $40,200,000 $40,200,000
NE - GA District 4 New Construction New Elementary School 141% 1 1 800 0 0 200 400 0 0 200 0 0 Relieve Windsor Park(.24/149%), Winterfield(.34/132%), Idlewild(.16/143%) $26,326,667 $66,526,667
W-HA/POB District 2 Renovation/Addition Harding HS 0.40 0.58 125% 1 1 800 300 0 0 0 200 0 0 300 0 Renovate/Replace Cafeteria and Gym Building $17,000,000 $83,526,667
C District 2 Classroom Addition Marie G Davis K12 0.30 0.63 75% 1 1 600 300 0 0 0 0 0 0 300 0 Addition at Upper Campus to Replace Lower Campus $20,000,000 $103,526,667
S New Construction New High School 141% 1 1 600 0 0 0 400 0 0 200 0 0 Relieve South Meck (.47/142%), Ardrey Kell (.13/140%) $98,400,000 $201,926,667
W-HA/POB District 5 Replacement School Montclaire ES 0.60 0.61 133% 1 2 500 300 0 0 400 0 0 0 300 0 Improve Facility Condition - Replace onsite $26,326,667 $228,253,333
W-WM District 2 Renovation/Addition West Mecklenburg HS 0.41 0.55 112% 1 2 450 300 0 200 0 0 100 0 300 0 Renovate/Replace Gymnasium $10,000,000 $238,253,333
S District 2 New Construction New K8 School 1 1 400 0 0 200 0 0 0 200 0 0 Language Immersion Program South - Smith Site $40,200,000 $278,453,333
E District 6 New Construction New Elementary School 132% 1 2 400 0 0 200 400 0 0 200 0 0 Relieve Bain(.44/118%), Lebanon RD (.39/139%), Piney Grove(.41/138%) $26,326,667 $304,780,000
S District 2 Renovation E. E. Waddell 0.25 0.26 112% 1 1 300 0 0 0 0 0 100 200 0 0 Renovate to reopen as Magnet HS $4,000,000 $308,780,000
Replacement Facility Smith Family Center 0.58 2 1 300 300 0 0 0 0 0 0 300 0 Office Replacement to open up Smith Site $15,000,000 $323,780,000
C District 5 Classroom Addition Sharon ES 0.32 0.36 141% 1 2 300 0 0 0 400 0 0 200 0 0 Additional Classroom Capacity to Allow Growth $7,000,000 $330,780,000
NE - VA District 3 New Construction New Elementary School 131% 1 3 267 0 0 200 400 0 0 200 0 0 Relieve Hidden Valley (.37/146%), JW Grier (.12/140%), Newell(.00/108%) $26,326,667 $357,106,667
LIFT District 2 Renovation/Addition West Charlotte HS 0.43 0.55 94% 1 3 267 300 0 200 0 0 0 0 300 0 Renovate/Replace Classroom Building A, E, and I $10,000,000 $367,106,667
NE - GA District 4 Replacement School Shamrock Gardens ES 0.48 0.55 97% 1 3 267 300 0 0 0 0 0 200 300 0 New Baseline School - Improve Facility Condition $26,326,667 $393,433,333
NE - GA District 4 Replacement School Briarwood ES 0.54 0.64 157% 1 4 250 300 0 0 400 0 0 0 300 0 New Baseline School - Improve Facility Condition $26,326,667 $419,760,000
S District 5 Renovation/Addition South Mecklenburg HS 0.47 0.72 142% 1 5 240 300 0 200 400 0 0 0 300 0 Renovate/Replace Classroom Buildings C and D $11,000,000 $430,760,000
Demolition Demolition of Facilities 2 1 200 0 0 200 0 0 0 200 0 0 Removal of Existing Facilities to Support Initiatives $5,000,000 $435,760,000
HVAC Upgrades IAQ Projects Phase 1 3 1 200 0 200 200 0 0 0 200 0 0 Upgrade Air Quality Measures $6,000,000 $441,760,000
Renovation ADA Phase 1 3 1 200 0 200 200 0 0 0 200 0 0 Minor Renovations to Bring Facilities into Current Code Compliance $1,000,000 $442,760,000
Renovation John Taylor Williams 0.44 0.45 1 1 200 0 0 0 0 0 0 200 0 0 Comprehensive Renovation to reopen (potential Secondary Montessori) $15,500,000 $458,260,000
Sustainment CTE Upgrades Phase 1 2 1 200 0 0 200 0 0 0 200 0 0 Renovations to support current standards $9,000,000 $467,260,000
N District 1 New Construction New K8 School 1 2 200 0 0 200 0 0 0 200 0 0 Language Immersion Program North $40,200,000 $507,460,000
C /EC District 3 New Construction Specialty EC Program 1 2 200 0 0 200 0 0 0 200 0 0 New Specialty Facility for EC Program on Former Statesville Rd Site $18,000,000 $525,460,000
Replacement Facility Transportation - Northpointe 2 2 200 300 0 0 0 0 0 200 300 0 New Bus Maintenance Facility $13,000,000 $538,460,000
S District 2 New Construction New High School 152% 1 3 200 0 0 0 400 0 0 200 0 0 Relieve Olympic(.47/152%) $98,400,000 $636,860,000
S District 6 New Construction New Elementary School 128% 1 4 200 0 0 200 400 0 0 200 0 0 Relieve Elon Park(.17/136%), Hawk Ridge(.22/121%), Polo Ridge(.11/126%) $26,326,667 $663,186,667
E District 2 Renovation/Addition Northwest School of the Arts 0.39 0.61 122% 1 7 171 300 0 200 0 200 0 200 300 0 Replace Classroom Building B. Classroom Addition to support Curriculum $15,000,000 $678,186,667
C District 4 Renovation/Addition East Mecklenburg HS 0.46 0.61 121% 1 6 167 300 0 200 0 200 0 0 300 0 Renovate/Replace Classroom Buildings A, C, and D $11,000,000 $689,186,667
S District 2 New Construction New Elementary School 126% 1 5 160 0 0 200 400 0 0 200 0 0 Relieve Nations Ford(.00/118%), Sterling(.22/131%), Steele Creek(.50/130%) $26,326,667 $715,513,333
N District 1 Classroom Addition Mountain Island K8 0.20 136% 1 4 150 0 0 0 400 0 0 200 0 0 K8 Conversion Phase 2 - Gymnasium and Specialty Classrooms $8,000,000 $723,513,333
NE - GA District 3 Renovation/Addition Garinger HS 0.30 0.40 129% 1 8 138 0 0 200 400 0 0 200 300 0 Additional Classroom Capacity - Replace older areas $12,000,000 $735,513,333
S District 6 Classroom Addition Community House MS 0.20 138% 1 3 133 0 0 0 400 0 0 0 0 0 Needs Relief or Addition within 10 years $8,000,000 $743,513,333
C /EC District 2 Renovation Lincoln Heights ES 0.19 1 3 133 0 0 200 0 0 0 200 0 0 Reopen as Montessori $1,000,000 $744,513,333
E District 4 Renovation Albemarle Road MS 0.44 0.47 125% 1 4 125 0 0 0 0 200 0 0 300 0 Improve Facility Condition $18,000,000 $762,513,333
S District 2 New Construction New Middle School 113% 1 1 100 0 0 0 0 0 100 0 0 0 Relieve Kennedy (.35/99%), Southwest (.22/127%) $39,900,000 $802,413,333
New Construction Site Acquisition Phase 1 4 1 100 0 0 200 0 0 0 200 0 0 Support future growth/replacement $30,000,000 $832,413,333
Sustainment Roofing Phase 1 5 1 100 0 0 200 0 0 0 0 300 0 Replacement of Roofing Past Warranty 5 Year Program $59,047,501 $891,460,834
HVAC Upgrades IAQ Projects Phase 2 3 2 100 0 200 200 0 0 0 200 0 0 Upgrade Air Quality Measures $6,000,000 $897,460,834
E New Construction New High School 124% 1 2 100 0 0 0 0 200 0 0 0 0 Relieve Independence(.32/133%), Garinger(.30/129%), East Meck(.46/121%) $98,400,000 $995,860,834
Renovation ADA Phase 2 3 2 100 0 200 200 0 0 0 200 0 0 Minor Renovations to Facilities $1,000,000 $996,860,834
N District 1 Renovation Huntersville ES 0.46 0.50 105% 1 2 100 0 0 0 0 0 0 200 0 0 Improve Facility Condition $15,000,000 $1,011,860,834
N District 1 New Construction New High School 124% 1 4 100 0 0 0 0 200 0 200 0 0 Relieve Hough (.07/121%), Mallard Creek (.14/127%) $98,400,000 $1,110,260,834
E District 6 Renovation/Addition Independence HS 0.32 0.53 133% 1 4 100 0 0 0 400 0 0 0 0 0 Auditorium Addition $13,000,000 $1,123,260,834
W-WM District 1 Replacement School Coulwood MS 0.44 0.52 78% 1 5 100 0 0 0 0 0 0 200 300 0 New Baseline School - Improve Facility Condition $39,900,000 $1,163,160,834
N District 3 New Construction New Elementary School 123% 1 6 100 0 0 200 0 200 0 200 0 0 Relieve Stoney Creek(.15/126%), University Meadows(.44/120%) $26,326,667 $1,189,487,501
LIFT District 2 Renovation Bruns Academy 0.36 0.51 129% 1 6 100 0 0 200 400 0 0 0 0 0 Renovation/Replacement of Facility $20,000,000 $1,209,487,501
C District 5 Replacement School Lansdowne ES 0.57 109% 1 6 100 300 0 0 0 0 0 0 300 0 New Baseline School - Improve Facility Condition $26,326,667 $1,235,814,168
LIFT District 2 Replacement School Allenbrook ES 0.45 148% 1 7 100 0 0 0 400 0 0 0 300 0 New Baseline School - Provide Relief $26,326,667 $1,262,140,834
C District 5 New Construction New Elementary School 129% 1 8 100 0 0 200 400 0 0 200 0 0 Relieve Dilworth (.30/129%) $26,326,667 $1,288,467,501
N District 1 New Construction New Elementary School 121% 1 7 86 0 0 200 0 200 0 200 0 0 Relieve Blythe(.24/124%), JV Washam(.16/118%) $26,326,667 $1,314,794,168
S District 6 Classroom Addition Elon Park ES 0.17 136% 1 5 80 0 0 0 400 0 0 0 0 0 Needs Relief or Addition within 10 years $6,000,000 $1,320,794,168
Sustainment Structural Evaluation/Repairs 8 1 75 300 0 0 0 0 0 0 300 0 Continuous monitoring and repair of structural components $1,000,000 $1,321,794,168
S District 5 Renovation/Addition South Mecklenburg HS 0.47 0.72 142% 1 16 75 300 0 200 400 0 0 0 300 0 Replace Gymnasium $10,000,000 $1,331,794,168
W-HA/POB District 2 Renovation/Addition Harding HS 0.40 0.58 125% 1 11 73 300 0 0 0 200 0 0 300 0 Renovate/Replace Classroom Building E $5,000,000 $1,336,794,168
E District 2 Renovation/Addition Northwest School of the Arts 0.39 0.61 122% 1 17 71 300 0 200 0 200 0 200 300 0 Renovate Building C $6,500,000 $1,343,294,168
C District 5 Renovation/Addition Myers Park HS 0.44 0.62 115% 1 10 70 300 0 0 0 0 100 0 300 0 Renovate/Replace Auditorium and Music Classrooms $12,000,000 $1,355,294,168
W-WM District 2 Renovation/Addition West Mecklenburg HS 0.41 0.55 112% 1 13 69 300 0 200 0 0 100 0 300 0 Renovate/Replace Classroom Buildings B and K $8,000,000 $1,363,294,168
Charlotte-Mecklenburg Schools Proposed Ten Year Capital Needs in Priority Order

Draft as of 16 February 2016 126% 117% 110%
0.55 300 200 200 400 200 100 200 300 -1000Le
arn
ing
Co
mm
un
ity
BO
E D
istr
ict
Pro
ject
Ty
pe
Loca
tio
n
Ca
mp
us
FCI
20
15
Hig
he
st B
uil
din
g F
CI
20
15
Sta
ff B
uil
din
g U
tili
zati
on
w/o
Mo
bil
es
20
15
-20
16
Ca
teg
ory
Nu
mb
er
Ca
teg
ory
Pri
ori
ty
Pro
ject
Sco
re
He
alt
h a
nd
Sa
fety
Ma
nd
ate
s
Co
nti
nu
ity
Co
re O
ve
r C
ap
aci
ty
Co
re O
ve
r C
ap
aci
ty b
y
20
20
-20
21
Co
re O
ve
r C
ap
aci
ty b
y
20
25
-20
26
Init
iati
ve
s
Life
cycl
e R
ep
lace
me
nt
Log
isti
cal
Imp
act
No
tes
Co
st (
20
16
Do
lla
rs)
Est
ima
ted
Cu
mu
lati
ve
To
tal
Charlotte-Mecklenburg Schools Proposed Ten Year Capital Needs in Priority Order
Renovation Toilet Facility Upgrades 3 1 67 0 200 0 0 0 0 0 0 0 Upgrade Facilities based on current codes and requirements $1,500,000 $1,364,794,168
N District 1 Classroom Addition Bailey MS 0.11 126% 1 6 67 0 0 0 400 0 0 0 0 0 Needs Relief or Addition within 10 years $5,000,000 $1,369,794,168
N District 1 Renovation/Addition North Mecklenburg HS 0.43 0.63 98% 1 9 67 300 0 0 0 0 0 0 300 0 Renovate/Replace Auditorium and Classroom Building $10,000,000 $1,379,794,168
E District 6 Replacement School Matthews ES 0.47 0.48 128% 1 11 64 0 0 0 400 0 0 0 300 0 Improve Facility Condition $26,326,667 $1,406,120,834
C District 5 Replacement School Park Road Montessori 0.49 0.51 120% 1 8 63 0 0 0 0 200 0 0 300 0 New Baseline School - Improve Facility Condition $26,326,667 $1,432,447,501
N District 1 Renovation Trillium Springs Montessori 0.51 67% 1 5 60 0 0 0 0 0 0 0 300 0 Renovation/Replacement of Facility $26,326,667 $1,458,774,168
S District 2 Replacement School Steele Creek ES 0.50 130% 1 12 58 0 0 0 400 0 0 0 300 0 New Baseline School - Improve Facility Condition $26,326,667 $1,485,100,834
LIFT District 2 Renovation/Addition West Charlotte HS 0.43 0.55 94% 1 15 53 300 0 200 0 0 0 0 300 0 Renovate/Replace Classroom Buildings E and I $5,000,000 $1,490,100,834
Sustainment Electrical Phase 1 6 1 50 0 0 0 0 0 0 0 300 0 5 Year Replacement Program $8,583,000 $1,498,683,834
Sustainment HVAC Phase 1 6 1 50 0 0 0 0 0 0 0 300 0 5 Year Replacement Program $14,355,000 $1,513,038,834
Sustainment Plumbing Phase 1 6 1 50 0 0 0 0 0 0 0 300 0 5 Year Replacement Program $2,072,000 $1,515,110,834
New Construction Site Acquisition Phase 2 4 2 50 0 0 200 0 0 0 200 0 0 Support future growth/replacement $30,000,000 $1,545,110,834
Sustainment CTE Upgrades Phase 2 2 2 50 0 0 0 0 0 0 200 0 0 Renovations to support current standards $9,000,000 $1,554,110,834
Sustainment Roofing Phase 2 5 2 50 0 0 200 0 0 0 0 300 0 Replacement of Roofing Past Warranty 5 Year Program $60,000,000 $1,614,110,834
N District 1 Renovation/Addition North Mecklenburg HS 0.43 0.63 98% 1 12 50 300 0 0 0 0 0 0 300 0 Renovate/Replace Classroom Buildings L and N $8,000,000 $1,622,110,834
S District 2 Renovation/Addition Olympic HS 0.47 0.50 152% 1 14 50 0 0 0 400 0 0 0 300 0 Renovate Building A $20,000,000 $1,642,110,834
NE - VA District 3 Renovation Hidden Valley ES 0.37 0.60 146% 1 15 47 300 0 0 400 0 0 0 0 0 Renovate 1976 building (8525 sf) $1,100,000 $1,643,210,834
C District 4 Replacement School Chantilly Montessori 0.56 97% 1 13 46 300 0 0 0 0 0 0 300 0 New Baseline School - Provide Program Expansion $26,326,667 $1,669,537,501
HVAC Upgrades IAQ Projects Phase 3 3 3 44 0 200 0 0 0 0 200 0 0 Upgrade Air Quality Measures $6,000,000 $1,675,537,501
Renovation ADA Phase 3 3 3 44 0 200 0 0 0 0 200 0 0 Minor Renovations to Facilities $1,000,000 $1,676,537,501
N District 3 Renovation Winding Springs ES 0.43 156% 1 9 44 0 0 0 400 0 0 0 0 0 Improve Facility Condition $13,500,000 $1,690,037,501
Sustainment Site Paving Phase 1 7 1 43 0 0 0 0 0 0 0 300 0 5 Year Replacement Program $32,667,950 $1,722,705,451
NE - GA District 4 Classroom Addition Windsor Park ES 0.24 0.48 149% 1 10 40 0 0 0 400 0 0 0 0 0 Needs Relief or Addition within 10 years $5,000,000 $1,727,705,451
W-WM District 2 Replacement School Berryhill PK8 0.40 0.49 173% 1 10 40 0 0 0 400 0 0 0 0 0 Relief coming with New K8 $26,326,667 $1,754,032,118
NE - GA District 4 Renovation Hickory Grove ES 0.16 0.58 119% 1 20 40 300 0 0 0 200 0 0 300 0 Relieved with new schools. Renovate original building $10,000,000 $1,764,032,118
C District 4 Replacement Facility East Meck HS Stadium Athletics 0.45 9 2 39 0 0 200 0 0 0 200 300 0 Support county wide equity. Provide Turf Field $10,000,000 $1,774,032,118
NE - GA District 4 Classroom Addition Devonshire ES 0.37 0.48 113% 1 8 38 0 0 0 0 0 100 200 0 0 Additional Classroom Capacity to Allow Growth $3,000,000 $1,777,032,118
C District 4 Classroom Addition Idlewild ES 0.16 143% 1 11 36 0 0 0 400 0 0 0 0 0 Needs Relief or Addition within 10 years $5,000,000 $1,782,032,118
Sustainment CTE Upgrades Phase 3 2 3 33 0 0 0 0 0 0 200 0 0 Renovations to support current standards $9,000,000 $1,791,032,118
S District 5 Classroom Addition Providence HS 0.47 0.48 111% 1 9 33 0 0 0 0 0 100 200 0 0 Additional Classroom Capacity to Allow Growth $12,000,000 $1,803,032,118
E District 4 Renovation Piney Grove ES 0.41 138% 1 12 33 0 0 0 400 0 0 0 0 0 Improve Facility Condition $11,000,000 $1,814,032,118
N District 1 Renovation/Addition North Mecklenburg HS 0.43 0.63 98% 1 18 33 300 0 0 0 0 0 0 300 0 Renovate/Replace Classroom Buildings D and H $6,000,000 $1,820,032,118
W-HA/POB District 5 Renovation Starmount ES 0.57 0.57 104% 1 20 30 300 0 0 0 0 0 0 300 0 Improve Facility Condition $9,000,000 $1,829,032,118
Renovation Wilson 0.57 1 20 30 300 0 0 0 0 0 0 300 0 Depends on future use. Improve Facility Condition $17,000,000 $1,846,032,118
S District 6 Classroom Addition Hawk Ridge ES 0.22 121% 1 7 29 0 0 0 0 200 0 0 0 0 Additional Classroom Capacity to Allow Growth $4,000,000 $1,850,032,118
E District 6 Renovation Lebanon Road ES 0.39 139% 1 14 29 0 0 0 400 0 0 0 0 0 Improve Facility Condition $11,500,000 $1,861,532,118
W-WM District 1 Renovation Paw Creek ES 0.41 0.47 95% 1 11 27 0 0 0 0 0 0 0 300 0 Improve Facility Condition $13,000,000 $1,874,532,118
W-HA/POB District 2 Replacement Facility Harding HS Stadium Athletics 0.37 9 3 26 0 0 200 0 0 0 200 300 0 Support county wide equity. Provide Turf Field $10,000,000 $1,884,532,118
Sustainment Electrical Phase 2 6 2 25 0 0 0 0 0 0 0 300 0 5 Year Replacement Program $8,583,000 $1,893,115,118
Sustainment HVAC Phase 2 6 2 25 0 0 0 0 0 0 0 300 0 5 Year Replacement Program $14,355,000 $1,907,470,118
Sustainment Plumbing Phase 2 6 2 25 0 0 0 0 0 0 0 300 0 5 Year Replacement Program $2,072,000 $1,909,542,118
NE - VA District 3 Renovation University Meadows ES 0.44 120% 1 8 25 0 0 0 0 200 0 0 0 0 Improve Facility Condition $12,500,000 $1,922,042,118
E District 4 Renovation Albemarle Road ES 0.37 0.40 151% 1 16 25 0 0 0 400 0 0 0 0 0 Relief coming with New K8. Improve Facility Condition $14,000,000 $1,936,042,118
Sustainment Site Paving Phase 2 7 2 21 0 0 0 0 0 0 0 300 0 5 Year Replacement Program $33,000,000 $1,969,042,118
N District 1 Replacement School Cornelius ES 0.46 0.56 77% 1 14 21 300 0 0 0 0 0 0 0 0 New Baseline School - Improve Facility Condition $26,326,667 $1,995,368,784
NE - GA District 4 Renovation Winterfield ES 0.34 0.45 132% 1 19 21 0 0 0 400 0 0 0 0 0 Improve Facility Condition $9,000,000 $2,004,368,784
S District 6 Renovation/Addition Ardrey Kell HS 0.13 140% 1 20 20 0 0 0 400 0 0 0 0 0 $2,004,368,784
N District 1 Renovation/Addition Mallard Creek HS 0.14 127% 1 20 20 0 0 0 400 0 0 0 0 0 $2,004,368,784
C District 5 Alexander Graham MS 0.22 0.71 112% 1 20 20 300 0 0 0 0 100 0 0 0 $2,004,368,784
LIFT District 2 Ashley Park PK8 0.18 0.35 129% 1 20 20 0 0 0 400 0 0 0 0 0 $2,004,368,784
C District 5 Cotswold ES 0.27 0.33 141% 1 20 20 0 0 0 400 0 0 0 0 0 $2,004,368,784
NE - GA District 4 Eastway MS 0.38 0.40 111% 1 20 20 0 0 0 0 0 100 0 300 0 $2,004,368,784
S District 6 Elizabeth Lane ES 0.41 131% 1 20 20 0 0 0 400 0 0 0 0 0 $2,004,368,784
E District 3 Joseph W. Grier ES 0.12 140% 1 20 20 0 0 0 400 0 0 0 0 0 $2,004,368,784
NE - GA District 4 Merry Oaks ES 0.19 0.60 110% 1 20 20 300 0 0 0 0 100 0 0 0 $2,004,368,784
W-WM District 2 Oaklawn Language Academy 0.29 146% 1 20 20 0 0 0 400 0 0 0 0 0 $2,004,368,784
S District 6 Polo Ridge ES 0.11 126% 1 20 20 0 0 0 400 0 0 0 0 0 $2,004,368,784
W-HA/POB District 2 Reid Park PK8 0.38 164% 1 20 20 0 0 0 400 0 0 0 0 0 $2,004,368,784
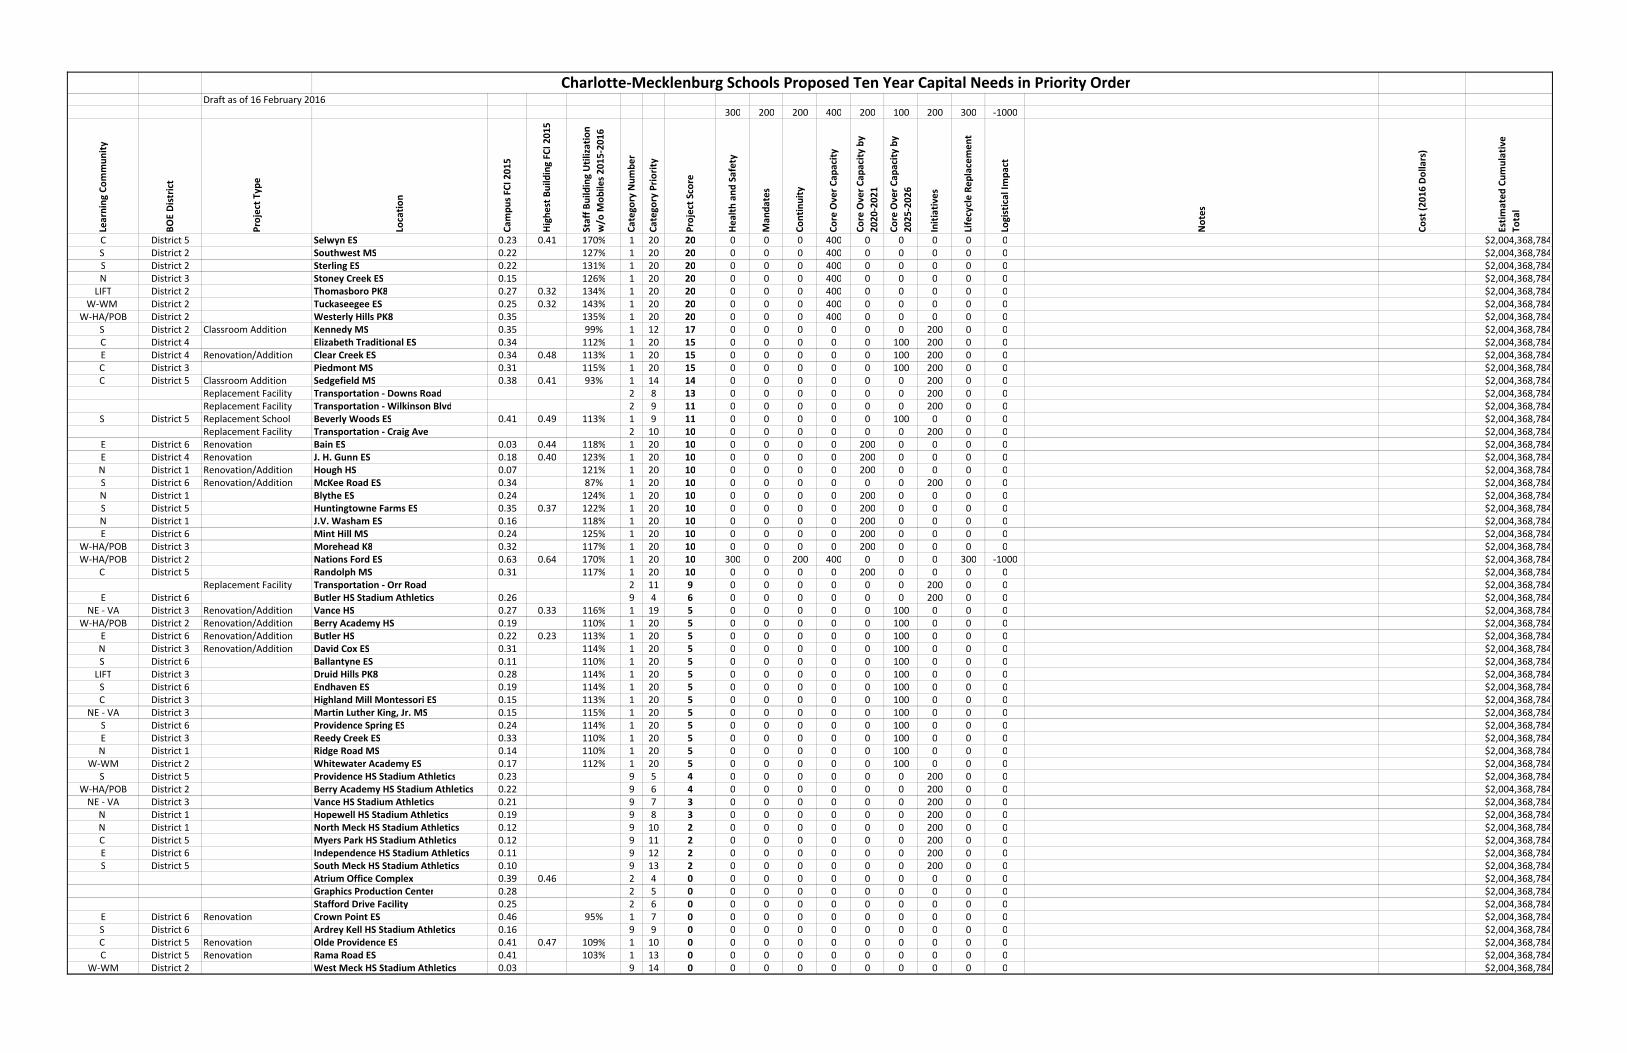
Draft as of 16 February 2016 126% 117% 110%
0.55 300 200 200 400 200 100 200 300 -1000Le
arn
ing
Co
mm
un
ity
BO
E D
istr
ict
Pro
ject
Ty
pe
Loca
tio
n
Ca
mp
us
FCI
20
15
Hig
he
st B
uil
din
g F
CI
20
15
Sta
ff B
uil
din
g U
tili
zati
on
w/o
Mo
bil
es
20
15
-20
16
Ca
teg
ory
Nu
mb
er
Ca
teg
ory
Pri
ori
ty
Pro
ject
Sco
re
He
alt
h a
nd
Sa
fety
Ma
nd
ate
s
Co
nti
nu
ity
Co
re O
ve
r C
ap
aci
ty
Co
re O
ve
r C
ap
aci
ty b
y
20
20
-20
21
Co
re O
ve
r C
ap
aci
ty b
y
20
25
-20
26
Init
iati
ve
s
Life
cycl
e R
ep
lace
me
nt
Log
isti
cal
Imp
act
No
tes
Co
st (
20
16
Do
lla
rs)
Est
ima
ted
Cu
mu
lati
ve
To
tal
Charlotte-Mecklenburg Schools Proposed Ten Year Capital Needs in Priority Order
C District 5 Selwyn ES 0.23 0.41 170% 1 20 20 0 0 0 400 0 0 0 0 0 $2,004,368,784
S District 2 Southwest MS 0.22 127% 1 20 20 0 0 0 400 0 0 0 0 0 $2,004,368,784
S District 2 Sterling ES 0.22 131% 1 20 20 0 0 0 400 0 0 0 0 0 $2,004,368,784
N District 3 Stoney Creek ES 0.15 126% 1 20 20 0 0 0 400 0 0 0 0 0 $2,004,368,784
LIFT District 2 Thomasboro PK8 0.27 0.32 134% 1 20 20 0 0 0 400 0 0 0 0 0 $2,004,368,784
W-WM District 2 Tuckaseegee ES 0.25 0.32 143% 1 20 20 0 0 0 400 0 0 0 0 0 $2,004,368,784
W-HA/POB District 2 Westerly Hills PK8 0.35 135% 1 20 20 0 0 0 400 0 0 0 0 0 $2,004,368,784
S District 2 Classroom Addition Kennedy MS 0.35 99% 1 12 17 0 0 0 0 0 0 200 0 0 $2,004,368,784
C District 4 Elizabeth Traditional ES 0.34 112% 1 20 15 0 0 0 0 0 100 200 0 0 $2,004,368,784
E District 4 Renovation/Addition Clear Creek ES 0.34 0.48 113% 1 20 15 0 0 0 0 0 100 200 0 0 $2,004,368,784
C District 3 Piedmont MS 0.31 115% 1 20 15 0 0 0 0 0 100 200 0 0 $2,004,368,784
C District 5 Classroom Addition Sedgefield MS 0.38 0.41 93% 1 14 14 0 0 0 0 0 0 200 0 0 $2,004,368,784
Replacement Facility Transportation - Downs Road 2 8 13 0 0 0 0 0 0 200 0 0 $2,004,368,784
Replacement Facility Transportation - Wilkinson Blvd 2 9 11 0 0 0 0 0 0 200 0 0 $2,004,368,784
S District 5 Replacement School Beverly Woods ES 0.41 0.49 113% 1 9 11 0 0 0 0 0 100 0 0 0 $2,004,368,784
Replacement Facility Transportation - Craig Ave 2 10 10 0 0 0 0 0 0 200 0 0 $2,004,368,784
E District 6 Renovation Bain ES 0.03 0.44 118% 1 20 10 0 0 0 0 200 0 0 0 0 $2,004,368,784
E District 4 Renovation J. H. Gunn ES 0.18 0.40 123% 1 20 10 0 0 0 0 200 0 0 0 0 $2,004,368,784
N District 1 Renovation/Addition Hough HS 0.07 121% 1 20 10 0 0 0 0 200 0 0 0 0 $2,004,368,784
S District 6 Renovation/Addition McKee Road ES 0.34 87% 1 20 10 0 0 0 0 0 0 200 0 0 $2,004,368,784
N District 1 Blythe ES 0.24 124% 1 20 10 0 0 0 0 200 0 0 0 0 $2,004,368,784
S District 5 Huntingtowne Farms ES 0.35 0.37 122% 1 20 10 0 0 0 0 200 0 0 0 0 $2,004,368,784
N District 1 J.V. Washam ES 0.16 118% 1 20 10 0 0 0 0 200 0 0 0 0 $2,004,368,784
E District 6 Mint Hill MS 0.24 125% 1 20 10 0 0 0 0 200 0 0 0 0 $2,004,368,784
W-HA/POB District 3 Morehead K8 0.32 117% 1 20 10 0 0 0 0 200 0 0 0 0 $2,004,368,784
W-HA/POB District 2 Nations Ford ES 0.63 0.64 170% 1 20 10 300 0 200 400 0 0 0 300 -1000 $2,004,368,784
C District 5 Randolph MS 0.31 117% 1 20 10 0 0 0 0 200 0 0 0 0 $2,004,368,784
Replacement Facility Transportation - Orr Road 2 11 9 0 0 0 0 0 0 200 0 0 $2,004,368,784
E District 6 Butler HS Stadium Athletics 0.26 9 4 6 0 0 0 0 0 0 200 0 0 $2,004,368,784
NE - VA District 3 Renovation/Addition Vance HS 0.27 0.33 116% 1 19 5 0 0 0 0 0 100 0 0 0 $2,004,368,784
W-HA/POB District 2 Renovation/Addition Berry Academy HS 0.19 110% 1 20 5 0 0 0 0 0 100 0 0 0 $2,004,368,784
E District 6 Renovation/Addition Butler HS 0.22 0.23 113% 1 20 5 0 0 0 0 0 100 0 0 0 $2,004,368,784
N District 3 Renovation/Addition David Cox ES 0.31 114% 1 20 5 0 0 0 0 0 100 0 0 0 $2,004,368,784
S District 6 Ballantyne ES 0.11 110% 1 20 5 0 0 0 0 0 100 0 0 0 $2,004,368,784
LIFT District 3 Druid Hills PK8 0.28 114% 1 20 5 0 0 0 0 0 100 0 0 0 $2,004,368,784
S District 6 Endhaven ES 0.19 114% 1 20 5 0 0 0 0 0 100 0 0 0 $2,004,368,784
C District 3 Highland Mill Montessori ES 0.15 113% 1 20 5 0 0 0 0 0 100 0 0 0 $2,004,368,784
NE - VA District 3 Martin Luther King, Jr. MS 0.15 115% 1 20 5 0 0 0 0 0 100 0 0 0 $2,004,368,784
S District 6 Providence Spring ES 0.24 114% 1 20 5 0 0 0 0 0 100 0 0 0 $2,004,368,784
E District 3 Reedy Creek ES 0.33 110% 1 20 5 0 0 0 0 0 100 0 0 0 $2,004,368,784
N District 1 Ridge Road MS 0.14 110% 1 20 5 0 0 0 0 0 100 0 0 0 $2,004,368,784
W-WM District 2 Whitewater Academy ES 0.17 112% 1 20 5 0 0 0 0 0 100 0 0 0 $2,004,368,784
S District 5 Providence HS Stadium Athletics 0.23 9 5 4 0 0 0 0 0 0 200 0 0 $2,004,368,784
W-HA/POB District 2 Berry Academy HS Stadium Athletics 0.22 9 6 4 0 0 0 0 0 0 200 0 0 $2,004,368,784
NE - VA District 3 Vance HS Stadium Athletics 0.21 9 7 3 0 0 0 0 0 0 200 0 0 $2,004,368,784
N District 1 Hopewell HS Stadium Athletics 0.19 9 8 3 0 0 0 0 0 0 200 0 0 $2,004,368,784
N District 1 North Meck HS Stadium Athletics 0.12 9 10 2 0 0 0 0 0 0 200 0 0 $2,004,368,784
C District 5 Myers Park HS Stadium Athletics 0.12 9 11 2 0 0 0 0 0 0 200 0 0 $2,004,368,784
E District 6 Independence HS Stadium Athletics 0.11 9 12 2 0 0 0 0 0 0 200 0 0 $2,004,368,784
S District 5 South Meck HS Stadium Athletics 0.10 9 13 2 0 0 0 0 0 0 200 0 0 $2,004,368,784
Atrium Office Complex 0.39 0.46 2 4 0 0 0 0 0 0 0 0 0 0 $2,004,368,784
Graphics Production Center 0.28 2 5 0 0 0 0 0 0 0 0 0 0 $2,004,368,784
Stafford Drive Facility 0.25 2 6 0 0 0 0 0 0 0 0 0 0 $2,004,368,784
E District 6 Renovation Crown Point ES 0.46 95% 1 7 0 0 0 0 0 0 0 0 0 0 $2,004,368,784
S District 6 Ardrey Kell HS Stadium Athletics 0.16 9 9 0 0 0 0 0 0 0 0 0 0 $2,004,368,784
C District 5 Renovation Olde Providence ES 0.41 0.47 109% 1 10 0 0 0 0 0 0 0 0 0 0 $2,004,368,784
C District 5 Renovation Rama Road ES 0.41 103% 1 13 0 0 0 0 0 0 0 0 0 0 $2,004,368,784
W-WM District 2 West Meck HS Stadium Athletics 0.03 9 14 0 0 0 0 0 0 0 0 0 0 $2,004,368,784

Draft as of 16 February 2016 126% 117% 110%
0.55 300 200 200 400 200 100 200 300 -1000Le
arn
ing
Co
mm
un
ity
BO
E D
istr
ict
Pro
ject
Ty
pe
Loca
tio
n
Ca
mp
us
FCI
20
15
Hig
he
st B
uil
din
g F
CI
20
15
Sta
ff B
uil
din
g U
tili
zati
on
w/o
Mo
bil
es
20
15
-20
16
Ca
teg
ory
Nu
mb
er
Ca
teg
ory
Pri
ori
ty
Pro
ject
Sco
re
He
alt
h a
nd
Sa
fety
Ma
nd
ate
s
Co
nti
nu
ity
Co
re O
ve
r C
ap
aci
ty
Co
re O
ve
r C
ap
aci
ty b
y
20
20
-20
21
Co
re O
ve
r C
ap
aci
ty b
y
20
25
-20
26
Init
iati
ve
s
Life
cycl
e R
ep
lace
me
nt
Log
isti
cal
Imp
act
No
tes
Co
st (
20
16
Do
lla
rs)
Est
ima
ted
Cu
mu
lati
ve
To
tal
Charlotte-Mecklenburg Schools Proposed Ten Year Capital Needs in Priority Order
E District 6 Rocky River HS Stadium Athletics 0.02 9 15 0 0 0 0 0 0 0 0 0 0 $2,004,368,784
N District 1 Hough HS Stadium Athletics 0.02 9 16 0 0 0 0 0 0 0 0 0 0 $2,004,368,784
S District 2 Renovation Lake Wylie ES 0.35 105% 1 17 0 0 0 0 0 0 0 0 0 0 $2,004,368,784
NE - GA District 3 Garinger HS Stadium Athletics 0.01 9 17 0 0 0 0 0 0 0 0 0 0 $2,004,368,784
C District 2 Renovation Irwin Ave. ES 0.35 78% 1 18 0 0 0 0 0 0 0 0 0 0 $2,004,368,784
S District 2 Olympic HS Stadium Athletics 0.01 9 18 0 0 0 0 0 0 0 0 0 0 $2,004,368,784
N District 1 Mallard Creek HS Stadium Athletics 0.00 9 19 0 0 0 0 0 0 0 0 0 0 $2,004,368,784
N District 3 Renovation Hornets Nest ES 0.24 94% 1 20 0 0 0 0 0 0 0 0 0 0 $2,004,368,784
S District 6 Renovation McAlpine ES 0.33 86% 1 20 0 0 0 0 0 0 0 0 0 0 $2,004,368,784
N District 1 Renovation/Addition Hopewell HS 0.24 0.26 89% 1 20 0 0 0 0 0 0 0 0 0 0 $2,004,368,784
E District 6 Renovation/Addition Rocky River HS 0.07 92% 1 20 0 0 0 0 0 0 0 0 0 0 $2,004,368,784
N District 1 Barnette ES 0.10 90% 1 20 0 0 0 0 0 0 0 0 0 0 $2,004,368,784
W-HA/POB District 2 Barringer ES 0.17 97% 1 20 0 0 0 0 0 0 0 0 0 0 $2,004,368,784
S District 2 Berewick ES 0.10 82% 1 20 0 0 0 0 0 0 0 0 0 0 $2,004,368,784
C District 4 Billingsville ES 0.18 64% 1 20 0 0 0 0 0 0 0 0 0 0 $2,004,368,784
N District 1 Bradley MS 0.26 106% 1 20 0 0 0 0 0 0 0 0 0 0 $2,004,368,784
C District 5 Carmel MS 0.33 103% 1 20 0 0 0 0 0 0 0 0 0 0 $2,004,368,784
E District 3 Cato 1 20 0 0 0 0 0 0 0 0 0 0 $2,004,368,784
NE - GA District 4 Cochrane Collegiate Academy 0.31 101% 1 20 0 0 0 0 0 0 0 0 0 0 $2,004,368,784
E District 6 Crestdale MS 0.27 79% 1 20 0 0 0 0 0 0 0 0 0 0 $2,004,368,784
N District 1 Croft Community ES 0.09 85% 1 20 0 0 0 0 0 0 0 0 0 0 $2,004,368,784
N District 1 Davidson ES 0.38 100% 1 20 0 0 0 0 0 0 0 0 0 0 $2,004,368,784
E District 3 First Ward ES 0.17 0.18 87% 1 20 0 0 0 0 0 0 0 0 0 0 $2,004,368,784
N District 1 Grand Oak ES 0.01 77% 1 20 0 0 0 0 0 0 0 0 0 0 $2,004,368,784
C District 5 Greenway Park ES 0.27 92% 1 20 0 0 0 0 0 0 0 0 0 0 $2,004,368,784
NE - VA District 3 Hawthorne Academy 0.32 0.40 1 20 0 0 0 0 0 0 0 0 0 0 $2,004,368,784
N District 1 Highland Creek ES 0.12 87% 1 20 0 0 0 0 0 0 0 0 0 0 $2,004,368,784
NE - GA District 3 Highland Renaissance ES 0.13 97% 1 20 0 0 0 0 0 0 0 0 0 0 $2,004,368,784
NE - GA District 4 Lawrence Orr ES 0.00 93% 1 20 0 0 0 0 0 0 0 0 0 0 $2,004,368,784
E District 6 Levine Middle College 60% 1 20 0 0 0 0 0 0 0 0 0 0 $2,004,368,784
N District 1 Long Creek ES 0.11 72% 1 20 0 0 0 0 0 0 0 0 0 0 $2,004,368,784
N District 1 Mallard Creek ES 0.34 99% 1 20 0 0 0 0 0 0 0 0 0 0 $2,004,368,784
NE - VA District 3 Martin MS 0.23 0.24 98% 1 20 0 0 0 0 0 0 0 0 0 0 $2,004,368,784
C District 4 McClintock MS 0.01 96% 1 20 0 0 0 0 0 0 0 0 0 0 $2,004,368,784
C /EC District 3 Metro School 0.19 0.20 1 20 0 0 0 0 0 0 0 0 0 0 $2,004,368,784
C District 5 Myers Park Traditional ES 0.26 0.31 92% 1 20 0 0 0 0 0 0 0 0 0 0 $2,004,368,784
NE - VA District 3 Nathaniel Alexander ES 0.21 93% 1 20 0 0 0 0 0 0 0 0 0 0 $2,004,368,784
NE - VA District 3 Newell ES 0.00 108% 1 20 0 0 0 0 0 0 0 0 0 0 $2,004,368,784
E District 6 Northeast MS 0.28 0.29 81% 1 20 0 0 0 0 0 0 0 0 0 0 $2,004,368,784
E District 3 Northridge MS 0.21 106% 1 20 0 0 0 0 0 0 0 0 0 0 $2,004,368,784
W-WM District 1 Oakdale ES 0.23 103% 1 20 0 0 0 0 0 0 0 0 0 0 $2,004,368,784
C District 4 Oakhurst ES 0.23 95% 1 20 0 0 0 0 0 0 0 0 0 0 $2,004,368,784
S District 2 Palisades ES 0.00 97% 1 20 0 0 0 0 0 0 0 0 0 0 $2,004,368,784
N District 1 Parkside ES 0.00 67% 1 20 0 0 0 0 0 0 0 0 0 0 $2,004,368,784
S District 6 Pineville ES 0.01 108% 1 20 0 0 0 0 0 0 0 0 0 0 $2,004,368,784
W-HA/POB District 5 Pinewood ES 0.12 91% 1 20 0 0 0 0 0 0 0 0 0 0 $2,004,368,784
S District 5 Quail Hollow MS 0.32 83% 1 20 0 0 0 0 0 0 0 0 0 0 $2,004,368,784
LIFT District 3 Ranson MS 0.23 0.33 90% 1 20 0 0 0 0 0 0 0 0 0 0 $2,004,368,784
S District 2 River Gate ES 0.15 100% 1 20 0 0 0 0 0 0 0 0 0 0 $2,004,368,784
W-WM District 1 River Oaks Academy ES 0.16 94% 1 20 0 0 0 0 0 0 0 0 0 0 $2,004,368,784
S District 6 Robinson MS 0.20 102% 1 20 0 0 0 0 0 0 0 0 0 0 $2,004,368,784
C District 5 Sedgefield ES 0.15 0.28 78% 1 20 0 0 0 0 0 0 0 0 0 0 $2,004,368,784
S District 5 Smithfield ES 0.39 93% 1 20 0 0 0 0 0 0 0 0 0 0 $2,004,368,784
N District 1 Torrence Creek ES 0.21 74% 1 20 0 0 0 0 0 0 0 0 0 0 $2,004,368,784
NE - VA District 3 Turning Point 76% 1 20 0 0 0 0 0 0 0 0 0 0 $2,004,368,784
E District 3 UNC-Charlotte Early College 80% 1 20 0 0 0 0 0 0 0 0 0 0 $2,004,368,784
E District 2 University Park ES 0.36 0.36 82% 1 20 0 0 0 0 0 0 0 0 0 0 $2,004,368,784
LIFT District 2 Walter G. Byers PK8 0.17 0.22 91% 1 20 0 0 0 0 0 0 0 0 0 0 $2,004,368,784

Draft as of 16 February 2016 126% 117% 110%
0.55 300 200 200 400 200 100 200 300 -1000Le
arn
ing
Co
mm
un
ity
BO
E D
istr
ict
Pro
ject
Ty
pe
Loca
tio
n
Ca
mp
us
FCI
20
15
Hig
he
st B
uil
din
g F
CI
20
15
Sta
ff B
uil
din
g U
tili
zati
on
w/o
Mo
bil
es
20
15
-20
16
Ca
teg
ory
Nu
mb
er
Ca
teg
ory
Pri
ori
ty
Pro
ject
Sco
re
He
alt
h a
nd
Sa
fety
Ma
nd
ate
s
Co
nti
nu
ity
Co
re O
ve
r C
ap
aci
ty
Co
re O
ve
r C
ap
aci
ty b
y
20
20
-20
21
Co
re O
ve
r C
ap
aci
ty b
y
20
25
-20
26
Init
iati
ve
s
Life
cycl
e R
ep
lace
me
nt
Log
isti
cal
Imp
act
No
tes
Co
st (
20
16
Do
lla
rs)
Est
ima
ted
Cu
mu
lati
ve
To
tal
Charlotte-Mecklenburg Schools Proposed Ten Year Capital Needs in Priority Order
W-WM District 2 Whitewater MS 0.13 91% 1 20 0 0 0 0 0 0 0 0 0 0 $2,004,368,784
S District 2 Winget Park ES 0.16 72% 1 20 0 0 0 0 0 0 0 0 0 0 $2,004,368,784
E District 3 Graham Center 0.70 2 10 -10 300 200 0 0 0 0 0 300 -1000 $2,004,368,784
N District 1 JM Alexander MS 0.47 0.59 1 20 -10 300 0 200 0 0 0 0 300 -1000 $2,004,368,784
LIFT District 3 Statesville Road ES 0.64 0.66 1 20 -10 300 0 200 0 0 0 0 300 -1000 $2,004,368,784
C District 5 Renovation/Addition Dilworth ES 0.30 0.41 129% 1 20 -20 0 0 0 400 0 0 200 0 -1000 $2,004,368,784
X Davidson IB 0.68 0.69 1 20 -20 300 0 0 0 0 0 0 300 -1000 $2,004,368,784
C District 5 Classroom Addition Eastover ES 0.25 0.34 92% 1 15 -33 0 0 0 0 0 0 200 300 -1000 $2,004,368,784
X Pawtuckett 0.50 1 20 -35 0 0 0 0 0 0 0 300 -1000 $2,004,368,784
X Villa Heights 0.44 1 20 -50 0 0 0 0 0 0 0 0 -1000 $2,004,368,784
S District 6 Classroom Addition South Charlotte MS 0.43 99% 1 13 -62 0 0 0 0 0 0 200 0 -1000 $2,004,368,784
X Spaugh 0.49 2 3 -117 0 0 0 0 0 0 0 300 -1000 $2,004,368,784
X Totals $2,004,368,784

Facility Condition Index (FCI)
Facility Condition Review and Analysis – CMS facility staff performed facility assessments with the aid
of consultants for roofing and some of the paving components. The process for each of the components
was structured and conducted with a defined criteria for each (criteria sheets included in binder). The
results of these assessments are the basis for the FCI score for each building and campus.
The FCI does not take into account educational adequacy, bringing facility to code or CMS standards.
Description of the FCI Score
There are 16 categories in the FCI (listed below)
Athletic Facilities HVAC Cabinetry & Casework Kitchen Concrete Paving Conveying Systems Playgrounds Doors & Windows Plumbing Electrical Roofing Finishes & Specialties Stormwater Fire Protection Thermal & Moisture
Each Component for each building is scored 0‐10 based upon the FCI criteria sheet. 0 indicated new or
nearly new and 10 indicated failing or nearly failing, in need of immediate action, or out of use.
Each components contribution to the FCI score is based on current replacement value (CRV) percentage
it contributes. Example Concrete was 32.75%, Conveying Systems only 0.6%, HVAC 15.2 %.
The Building FCI
The component FCI score divided by 10, times the CRV percentage for each component
Then add each component.
The Campus FCI / School Roll‐up FCI is calculated by
Building FCI and multiply by its percentage of sq‐ft on campus
Then add all buildings.
Building FCI Score – is between 0.00 ‐ 1.00
Campus FCI Score / School Roll‐up FCI – is between 0.00 ‐ 1.00
Generally the lower the score the better overall condition of the building.
Campus FCI / School Roll‐up FCI may be potentially misleading as one newer building may lower the FCI
score and cause the campus to look better than it is. The vice versa is also possible.
February 2016

Charlotte‐Mecklenburg Schools Facilities Sustainment Plan
Facilities Condition Index (FCI) – Criteria Plan
11/18/2015 1 | P a g e
Athletics Facilities And non‐building items associated with the fields High Schools ‐ this section covers the football field (grass or artificial turf), practice field and/or soccer field, baseball field,
softball field, track, tennis courts, track drain, high jump, long jump, pole vault, discus, shot‐put, as well as all the fencing,
bleachers, football goal posts, foul poles associated with the previously mentioned. Moveable goals not included (i.e. soccer,
lacrosse, field hockey, etc...)
Middle Schools ‐ items are similar to High Schools except bleacher capacity is typically lower and the track surface is a lower
grade, typically no tennis courts, pole vault, shot put, or discus. Middle school may have a bocce court and exterior basketball
goals.
Elementary Schools ‐ N/A
SCORING 0‐2 Fields and equipment are in good condition. Very few bare spots, no significant rust, bleachers in good working order.
Track numbers and painting easily read with minimal fading. Tennis courts have no cracks or defects. Fields drain appropriately.
Fences are acceptable and the gates are functioning properly. Artificial Turf is well groomed with no or minor issues. 3∙4 Typically everything is functioning properly perhaps some cosmetic issues or following may be evident at the site; fields
may have a couple of bare spots, a fence or two may require some modification I replacement. Tennis courts may have a
crack or two. Track might be deteriorating in spots. Tennis courts might require a new net. Etc... 5∙6 The fields in general are starting to show some age. Two‐ Five of these items may be occurring. Tracks is worn almost I to
the asphalt in spots, Turf has significant number of seams in need of repair, tennis courts have major cracks running through
multiple courts, fencing has damaged areas in need of repair. Rust is noticeable. Bleachers require major repairs (could be boards
splitting, toe plates missing, handrails loose, end caps removed) Gates need major adjustments. Fields have multiple bare spots
and require re‐sprigging; there are several areas insider the official lines on fields that have standing water 24 hours after a rain
event. The items listed above require more than routine PM to correct.
7‐8 Six or more of the previous category above are visible on the campus.
9 As deemed by the Director of Maintenance and Senior Construction Engineer 3 or more items require funds in excess of $100,000 to bring them back to an acceptable condition.
10 Multiple fields and/or equipment in a state of dis‐repair, fields closed and deemed unsafe.
Turf Field 12∙15 years
EXPECTED USEFULE LIFE EXAMPLES
Tracks every 5 years resurface, with a full replacement every 15∙20 years.
Tennis courts‐ resurface every 20 years.
Bleachers 25 years Scoring to be completed with input from the CMS Athletic Department, CMS Grounds Department, Engineering, and property
management staff. Scoring to be updated once per year and for the field based on its use as some sports are in different
seasons and CMS completes routing maintenance prior to.
Bare spots on grass fields will not be scored if Mecklenburg County has issued a drought warning.

Charlotte‐Mecklenburg Schools Facilities Sustainment Plan
Facilities Condition Index (FCI) – Criteria Plan
11/18/2015 1 | P a g e
Cabinetry & Casework
This section covers the casework, interior trim, and shelving inside the building.
Scoring is completed by the engineering and architectural staff based on site visits, work requests
submitted by the school and feedback from the planning and property management groups.
Information provided during previous Facility Condition Index reports is also a component for the
scoring process.
Scoring
0‐2 Components are new and show little to no wear structurally or cosmetically.
3‐4 Components show minor wear and tear. Operating mechanisms may need minor repair or
adjustment.
5‐6 Components show wear and tear. Some minor delamination of veneers. Operating mechanisms
may need repair or adjustment.
7‐8 Components are damaged and may need replacing in spots. Significant delamination of veneers.
Operating mechanisms are mostly worn out and may need replacement.
9 Components are severely damaged and are beyond repair or refinishing. Extensive delamination
or rot.
10 Components do not exist
Most of the components in this section have an expected life of about 30 years.

Charlotte‐Mecklenburg Schools Facilities Sustainment Plan
Facilities Condition Index (FCI) – Criteria Plan
11/18/2015 1 | P a g e
Concrete I Masonry I Steel
This section covers the walls, footings, structural steel and miscellaneous metals in the building.
Scoring is completed by the engineering and architectural staff based on site visits, third party
reports, work requests submitted by the school and feedback from the planning and property
management groups. In addition to information provided during previous Facility Condition Index
reports.
Scoring
0-2 Building that is holding up well both structurally and cosmetically. Little to no defects. Brick and
Block are new.
3-4 Building that has some minor cosmetic issues however is holding up well. Could be some minor
mortar joint issues. Could be some cracking through mortar joints. Could be some issues with the
concrete, steps, loading docks, and other non-structural components (i.e. privacy walls).
5-6 Building showing signs of structural issues including but not limited to minor cracking in bricks and
block. Brick may be spalling in places, mortar joints may need work. Building may be settling, however
differential settlement is minor. Could be some issues with the lintels and miscellaneous components.
Could be some roof deflection
7-8 Building could be showing significant structural issues that could require monitoring, differential
settlement is noticed in one or more areas. Brick and block may be deteriorating. Lintels may have
issues. Retaining walls may be deflecting. Concrete may be flaking or deteriorating. The building is
showing multiple signs of distress. There could be significant roof deflection.
9- Building is in need of imminent repair. Significant issues, ongoing structural monitoring and/or
geotechnical analysis.
10- Building has been determined structurally unsound and cannot be occupied, there is a third
party engineering report with an analysis and/or inspection to support this determination.
Buildings with scores higher than a 5 probably have had some cosmetic work done to building to repair
the cracking and/or settlement issues that have occurred.
Most of the components in this section have an expected life in excess of 50.

Charlotte‐Mecklenburg Schools Facilities Sustainment Plan
Facilities Condition Index (FCI) – Criteria Plan
11/18/2015 1 | P a g e
Conveying Systems
Elevator (age) FCI Score
0-5 years 0
6-10 years 1
11-15 years 2
16-20 years 3
Life expectancy of an elevator is 20-30 years (without modernization)
21-25 years 6
26-30 years 7
31-35 years 8
36-40 years 9
An elevator that is non- functional receives a 10.
High number of work service requests engineer can add between 1-3 points to the above
Modernization of the cab- subtract 1-3 point from the above.
If more than one elevator- take the average score with each elevator receiving the same weight. Chair
lifts are not scored however on list (low cost of install I replacement)

Charlotte‐Mecklenburg Schools Facilities Sustainment Plan
Facilities Condition Index (FCI) – Criteria Plan
10/19/2015 1 | P a g e
DOORS, WINDOWS, GLASS
A visual survey of the Windows and Doors is performed for the exposed components only. Each facility
is assigned a grade for its windows and doors as follows: good, fair or poor. These grades along with a
weighted value of the remaining life span of the doors produces an index from 1‐10.
FCI Condition
9‐10 Poor has gone beyond normal useful life consider replacing
7‐8 Fair condition shows age needs repairs
3‐6 Good condition some repairs may be needed
0‐2 Excellent
Criterion:
The Fannie Mae condition assessment appendix F was used for the estimated life of the windows and doors. 30 years were chosen as the useful life of windows and doors and aluminum frames. The lifespan of the windows and doors was determined for each building based upon the age of the building and whether the windows or doors had been replaced. This number composes 80 percent of the overall score. The additional 20 percent was based upon known issues or appearance through drive by inspections and previous FCI numbers. Electronic Security locks which have a 10 year lifespan along with locks and door closers etc. were looked at but the overall cost was small enough to be insignificant to the overall FCI and was ignored for the purposes. They are included however in the Sustainment plan if applicable. FCI = 80% life + 20 % apparent defect
Apparent Defect Scale:
Good = 0 points (looks new just a few issues) Fair = 1 point (more than 30 issues) Poor = 2 points (more than 50 issues campus wide)
Windows The following are inspection point for windows: fogged windows, cracked or broken panes, holes in frames, damaged trim, single pane windows, not closing properly, missing fasteners, visual appeal, frame misalignment, discoloration of frame, wood rot, etc. This is for both inside and outside the building in question. Doors The following are inspection points for doors: dented or damaged door frames, damaged doors, rust, bad paint or discoloration, holes left from previous hardware, warped or rusted, rotten areas – wood doors. Broken or non‐functioning door hardware such as door closers, door locks, handles etc. Damaged center mullions, seals and door sweeps missing or damaged. This is for both inside and outside doors.

Charlotte‐Mecklenburg Schools Facilities Sustainment Plan
Facilities Condition Index (FCI) – Criteria Plan
11/18/2015 1 | P a g e
ELECTRICAL
The electrical scope covers power, lighting, fire alarms, intercoms, sound systems and surveillance cameras. The ratings cover a 0‐10 scale with 0 being the best and 10 the worst.
0‐1 = excellent condition with only normal maintenance required
2‐3 = excellent to very good condition, but may need modernization initiatives like conversion of outside lights to LED or cameras converted from analog to IP
4‐5 = good condition, but in need of miscellaneous power and lighting upgrades
6‐7 = fair condition, but specific deficiencies should be addressed soon
8 = all systems working, but well below standard
9 = failure imminent on a major system
10 = failed systems
Power – This consists of the power distribution infrastructure including panels, transformers, cables, wires, receptacles etc. This equipment has a long life and usually only normal maintenance is required, but is subject to physical damage, damage from lightning strikes and short circuits, overloads and eventual obsolescence. Most often upgrades are triggered by increased power demand beyond that which the infrastructure can safely support.
General interior lighting – Substantially all sites have modern T8 lighting which is readily maintainable. Lamps degrade and ultimately burn out, but are routinely replaced and fixtures cleaned to maintain acceptable lighting levels. While they may have modern lamps and ballasts in them, some older (usually egg crate style) fixtures are subject to replacement to produce a more modern appearance. The use of LED fixtures is limited to hard to reach and specialty situations, but will eventually evolve to the mainstream.
Gym lights – In recent years gym, multipurpose room, café and corridor lights have substantially been converted away from metal halide to fluorescent and in some cases LED lights mostly for energy saving reasons. They are readily maintainable.
Outside Lights – All existing outside lighting is readily maintainable, but presently our major initiative is to migrate away from HID or CFL lights to LEDs to save energy, reduce maintenance, enhance security and appearance. Due to the longer burn time it is also the best payback opportunity. Note that approximately 2/3 of the parking lot lights are leased from the utility and maintained by them.
Outdoor athletic lighting – All field lighting is metal halide and readily maintainable. Those older sites were an upgrade is very desirable have either wood poles (2 football and 1 baseball) or 5 football with low lamp count compared to the contemporary norm.

Charlotte‐Mecklenburg Schools Facilities Sustainment Plan
Facilities Condition Index (FCI) – Criteria Plan
11/18/2015 2 | P a g e
Fire alarms – Fire alarm systems are life safety and must be continually inspected, monitored and maintained to a high standard to be code compliant. The need for panel replacements are usually tied to lightning damage or gradual obsolesce of older units. It is usually a relatively easy matter of just replacing the control panel as required while maintaining the field devices.
Intercoms – Due to their critical use in schools, intercoms are maintained to a high degree of functionality. Their need for replacement is usually triggered by lightning damage or gradual obsolescence of older units. In these cases they can usually be relatively quickly repaired by replacing just the headend or component part with spares while maintaining the field devices.
Sound systems – These consist of microphones, amplifiers and speaker and are found in gyms, multipurpose rooms, auditoriums and ball fields. These are usually readily repairable by replacing component parts.
Surveillance cameras – We have had analog systems in high schools and admin sits for about 15 years. The recent security initiative has provided IP camera systems in elementary and middle schools. The initiative now is to migrate the old analog systems in high schools to IP cameras in part for the enhanced picture quality and functionality and in part to replace old failing components. Much of our infrastructure is new, but with IP cameras having a 7‐10 year life, a replacement cycle is inevitable. In these cases, the most unreliable systems are replaced and salvaged parts are used to maintain other systems and the process repeats subject to things like physical and lightning damage and obsolescence by the manufacturer.
Weighting
Power (25%) – Planned replacements are minimal. Actual replacements are usually responses to acute situations where we are responding to some form of damage or some change in use necessitates the need to increase capacity.
Lighting (35%) – Interior lighting is sustainable with short term needs being more isolated driven by energy saving opportunities or aesthetics. Beyond maintenance, outside lighting is focused on conversion of building mounted lights (wall packs & canopy lights) and the 1/3 of the parking lot lights that are CMS owned and maintained. These changes save considerable energy and maintenance as the outside lights have more burn time then other types plus they are brighter and enhance security and maintenance.
Low voltage systems (40%) – Sound system have just a relatively small effect on the weight as they are regularly sustainable. Fire alarms and intercoms have a heavy weight as while they are all operational, being electronic devices, there is a continual cycle of obsolescence and resulting need for replacements when they fail. The bulk of our camera systems are new, but the major expense in the shorter term will be the migration of the older analog systems in high schools to digital IP systems as the result of obsolescence and the desire to have the better imaging and functionality that IP provides. As IP cameras have a 7‐10 year life, future iterations of the FCI will migrate to sustaining the IP infrastructure as it ages.

Charlotte‐Mecklenburg Schools Facilities Sustainment Plan
Facilities Condition Index (FCI) – Criteria Plan
11/18/2015 1 | P a g e
Finishes and Specialties
This section covers the painting, vinyl wall coverings, drywall, ceiling tiles, plaster, acoustical panels, VCT, carpet, terrazzo, hard tile, grout, wood flooring, stair treads, operable partitions, bathroom partitions, paper towel dispensers, soap dispensers, blinds, bulletin boards, dry erase boards, signage inside the building, stage floors, curtains, auditorium seating, basketball goals, climbing walls, and like items in the building.
Scoring is completed by the carpentry department, senior engineer, and project managers. Work requests, backlog information and input from the custodial department and the property management group are incorporated.
Scoring
0-2 Building that is holding up well and newly constructed very little wear and tear on the individual
finishes. Building was probably renovated or constructed within the last 5 years.
3-4 Building that has some minor issues such as paint starting to show some wear, carpet with some
minor stains. However, generally speaking most of the finishes are holding up well. Perhaps a couple of
locations where the VCT is cracked, a stair tread or two is damaged.
5-6 Building Finishes are showing some age, operable wall may have a tear or two, ceiling tiles are
stained; grout in the tiles may start to yellow. Door frames and metal handrails are showing chipped
paint. Carpet is showing the high traffic areas. Multiple finishes are showing they should be refreshed.
7-8 Building finishes are showing wear- most of the items need refreshing and/or replacement,
operable wall may not be functioning, blinds discolored, VCT is cracked in multiple locations, grout is
stained and dirty, grab bars rusting, Bulletin boards stained spots, dry erase boards not coming clean.
Most of the finishes have not been refreshed in 10 or more years and simple cleaning no longer is
acceptable.
9- Building has significant issues; most of the finishes are in need of refreshment or replacement. Paint
is peeling or bubbling, Bathroom partitions are failing, ceiling tiles yellowing. carpet is failing (matted),
tiles are cracked in multiple locations. Finishes in general are 25 or more years old and dated, in
appearance or style or both. 10- Building finishes not being maintained and a comprehensive renovation is required, as most if not
all are unacceptable for student occupancy.
High FCI score buildings may have significant costs as the individual components of the finishes may
require sustainment for example building may need to be repainted, new carpet or other items based
on the component. The score is based on the appearance of all components given similar weights.
Most of the components in this section have an expected life of 20 years or longer.

Charlotte‐Mecklenburg Schools Facilities Sustainment Plan
Facilities Condition Index (FCI) – Criteria Plan
1 | P a g e 11/18/2015
FIRE PROTECTION
The fire protection system consists of an assembly of pipes, sprinkler heads, valves and fire pumps. They can
be found in newer buildings and those that have undergone major renovations. Many older buildings do not
have sprinkler systems as they were not required at the time of their construction. Those without sprinklers
are indicated as “N/A” in the index.
Because of the life safety aspect, the inspection, testing and repair of these systems is heavily regulated and
monitored by the Fire Marshal. There is some level of testing and inspection and resulting repairs that occur
weekly, quarterly, semi‐annually, annually and every 5 years. Some portion of this is carried out internally and
some by contractors. Due to the level of scrutiny the condition of our systems are not allowed to drift far
from optimum.
As such on our 0‐10 scale, none are rated worse than a 3 with the following criteria:
0‐1 = excellent condition ‐ with only normal maintenance required
2 = very good condition ‐ with extra caution taken on pumps and motors of older systems due to age
3 = good condition ‐ but with some surface rust observed on the surface of riser pipes

Charlotte-Mecklenburg Schools Facilities Sustainment Plan
Facilities Condition Index (FCI) – Criteria Plan
11/20/2015 1 | P a g e
HVAC An assessment of HVAC system is performed based on visual survey / walk through, service / remaining life of HVAC systems’ components and defect history. For this purpose, the HVAC system is divided into following major components depending upon their contribution towards satisfactory performance of the overall system; their weightage is mentioned beside each:
2-Pipe / 4-Pipe VAV System:
1. Chillers (Air Cooled / Water Cooled) - 15% 2. Boilers (Condensing / Non-Condensing) - 15% 3. Control System (DDC / Pneumatic) - 15% 4. Piping configuration (2-Pipe / 4-Pipe) - 5% 5. Outside Air (OA) Capability Status - 5% 6. Piping and Ducting condition - 20% 7. Air Handling Units (AHUs) / Unit Ventilators (UVs) / - 25%
Variable Air Volume (VAV) Units
Roof Top Units System:
1. Roof Top Units (RTUs) - 65% 2. Control System - 15% 3. Variable Air Volume (VAV) Units / Ducting - 20%
Based on the above, the HVAC system is assessed and Facility Control Index (FCI) is assigned to each component per its weightage in the system which adds up to the total FCI rating for that particular building / school, such that 1 (one) indicates an excellent system with no operation / maintenance issues and 9 (nine) indicates a bad system requiring immediate remedial measures.
These FCI ratings gives us a “Look Ahead Plan” i.e. these ratings for individual components facilitate in determining and prioritizing repair / maintenance works over next 5-10 years in order to plan and execute them in a befitting manner.
It is pertinent to mention that an overall low FCI rating for a building / school HVAC system does not necessarily mean that there will be no works / budgetary requirements in near future; this will primarily be dependent on the FCI ratings of individual HVAC components listed above e.g. a school with an overall HVAC FCI rating of 3.0 while having Chiller FCI rating of 10/15 would mean that the chiller is at about 70% of its service life and will need replacement in about 5 years.
The above mentioned HVAC components are explained in ensuing paragraphs.
Chillers (Air Cooled / Water Cooled). The chiller is a major component of the HVAC system, however, its change out is easy and can be done during the school year or during the summer break, as planned. Per experience, the normal service life of a chiller is about 20-25 years for air cooled chillers and close to 30 years for water cooled chillers. The Cooling Towers, associated with water cooled chillers, have a normal service lifespan

Charlotte-Mecklenburg Schools Facilities Sustainment Plan
Facilities Condition Index (FCI) – Criteria Plan
11/20/2015 2 | P a g e
between 15-20 years for those having galvanized steel water basin and in excess of 30 years for cooling towers having stainless steel water basin.
Boilers (Condensing / Non-Condensing). Boilers are also one of the critical components in HVAC system; again, its change out is easy which can be performed during school year or during summer break, as planned. Per experience, the normal service life of boiler is about 35-40 years for non-condensing / cast iron boilers and about 15-20 years for condensing boilers.
Roof Top Units (RTUs). Schools with this system comprise multiple RTUs for whole building(s) cooling / heating. The total number of RTUs per school range from 5 to 35 depending upon the size of the building(s) and/or capacity of the unit itself. RTUs HVAC system is either configured as Heat Pump (heat & cool) or DX (cooling) with VAV (hot water or electric heat). Change out of RTUs is normally planned during winter, spring or summer break because of the complexity / work scope of the activity. The normal service life of an RTU is about 15 years.
Outside Air (OA) Capability Status. The Outside Air (OA) is introduced in the spaces through Air Handling Units (AHUs), Roof Top Units (RTUs) or Unit Ventilators (UVs). The older schools have UVs in each classroom, whereas the newer schools have AHUs. The schools built during 2005-2010 mostly have Roof Top Units (RTUs). The OA is introduced in the spaces primarily to keep the CO2 levels within acceptable limits and the humidity is controlled through the hot water reheat coils in the AHUs/VAVs and gas reheat in RTUs. In a 2-pipe system, the humidity cannot be controlled by the UVs. The schools which are without OA capability need either equipment upgrade or supplemental system to provide this capability; with this the humidity control is also achieved. This cannot be done during the school year and is required to be planned / executed during summer break or as part of major renovation project due to the longevity of the activity. Due to the high costs involved (in excess of $ 0.5 M), these projects are handled by CMS Capital Projects team. The requirement is to pursue progressive upgrade of schools’ systems for having OA capability in all buildings.
Piping Configuration and Condition. The older schools have 2-Pipe HVAC systems and newer ones have 4-Pipe systems. In a 2-Pipe system, it is either cooling or heating at any one time. That means same piping is used for chilled water in summers and for hot water during winters. Due to this reason, it is also called a dual temp piping system. A 4-Pipe system can heat and cool at the same time; it has separate pipes for chilled and hot water runs. A dual temp piping system undergoes higher stresses during its service life compared to a 4-Pipe system. The problem with HVAC piping is that these cannot be completely changed / replaced unless it is part of a major renovation project of about a year’s duration; still it would be a costly proposition. The normal lifespan of pipes is 50+ years, however per experience, the pipes routed underground / below grade crawl space have much lesser lifespan compared to the above ceiling routed pipes. During normal circumstances, repair / maintenance philosophy is based on “Fix When Fail” policy.

Charlotte-Mecklenburg Schools Facilities Sustainment Plan
Facilities Condition Index (FCI) – Criteria Plan
11/20/2015 3 | P a g e
Ducting Insulation and Cleanliness. The normal lifespan of ducting insulation is 50+ years; however, it is greatly dependent upon the cleanliness and air tightness of ducting together with environmental conditions (thermal / moisture). Because of these factors, the insulation tends to dislodge from the duct which causes condensation leading to insulation failure. However, this instance is localized and not system wide; the ducting insulation in non-conditioned spaces will have less life compared to the conditioned air spaces. Complete replacement of ducting insulation can only be done during major renovations and not during normal operations. Due to this reason, in normal circumstances, repair / maintenance philosophy is based on “Fix When Fail” policy.
The HVAC system uses MERV-8 filters but still the ducting gets dirty through normal use. The filter efficiency of MERV-8 is 70-85% and all dust particles of size ≥ 3.0 micron are filtered. Some percentage of energy used in HVAC system is not utilized due to the presence of dirt in the ducting. Therefore, there is a need to keep the ducting clean. Plans were made to perform ducts cleaning at 5 yearly intervals; however, due to the paucity of funding together with the availability of schools, this target could not be met. Notwithstanding, a more practicable approach is to perform duct cleaning for each school one after the other and then keep repeating this sequence. The requirement for duct cleaning is primarily based on years of operation in service. Therefore, the older schools will have high “Duct Cleanliness” FCI compared to the new schools.
Air Handling Units (AHUs) / Unit Ventilators (UVs). These are the critical components of HVAC system that delivers cold / hot air to the space. These have hot & chilled water coils. In dual temp systems, UVs have one coil; whereas in 4-pipes system they have two coils (separate for hot & chilled water). The air is supplied in the space through AHUs / VAVs and UVs (also called as fan coil units) located in the space where they provide air. The Outside Air (OA) is introduced in the space through AHUs / UVs. Therefore, in case of dual temp UVs with OA capability, coil rupture / burst as a result of water freezing is most common phenomenon. This in most cases is avoided by scheduling HVAC to run continuously during extreme cold weather conditions. The replacement of AHUs / UVs can be done with little complexities on the concept of “Like for Like Replacement” during non-operational days. Their service life is normally greater than 40 years.
Control System (Direct Digital Control / Pneumatic Systems). This controls the complete functionality of HVAC system; it also controls the lighting schedules for the schools. The older systems are based on pneumatic control, whereas all the newer systems are based on DDC control. There are many operation / maintenance difficulties associated with the pneumatic control systems e.g. we don’t have remote control (unless it has a DDC overlay), small sized air tubing runs throughout the system and air leakages are difficult to be traced, correct air pressure is essential for correct functionality control, etc. On the other hand, DDC system is easy to operate, control and monitor. There is a need to progressively replace all pneumatic systems with DDC control which can only be done during the summer break due to the longevity of the activity.

Charlotte‐Mecklenburg Schools Facilities Sustainment Plan
Facilities Condition Index (FCI) – Criteria Plan
11/18/2015 1 | P a g e
Paving and Sitework
The overall FCI for combined pavement and walkway for each facility will be based on a formula of 80 percent of the Pavement FCI plus 20 percent of the Walkway and concrete surface FCI.
FCI Range Condition 9 Failed 8 Serious 7 Very Poor
6-5 Poor 4-3 Fair 2-1 Satisfactory 0 Good
Good (PCI 86-100, FCI 0): Routine Maintenance – Some climate and construction related distresses, but little to no notable failure or load related distresses. May be prescribed routine maintenance. Satisfactory (PCI 71-85, FCI 2-1): Minor Repairs Needed – Possible isolated failure related to load distresses, but most likely climate and other related distresses.
Fair (PCI 56-70, FCI 4-3): Potential Resurface – Address all isolated failures, and based on the overall condition, it may be cost effective to perform a resurface an overlay or patch. Poor (PCI 41-55, FCI 6-5): Repairs as Needed – Pavement and/or surfaces are still functioning, however moderate deterioration is present. Perform repairs as needed to maintain desirable use. Very Poor (PCI 26-40, FCI 7): Reconstruction Probable –Major deterioration present with potential for surface performance to not meet necessary requirements.
Serious (PCI 11-25, FCI 8): Reconstruction Needed – Extensive deterioration present. The condition is likely affecting the use of the surface structure. Failed (PCI 0-10, FCI 9): Reconstruction Critical – The Pavement/concrete surface section is beyond its service life with extensive failure present throughout. This condition is likely allowing water to reach the subgrade potentially effecting the necessary reconstruction requirements.

Charlotte‐Mecklenburg Schools Facilities Sustainment Plan
Facilities Condition Index (FCI) – Criteria Plan
11/18/2015 2 | P a g e
PAVEMENT CONDITION INDEX A visual survey of the pavement surfaces is performed for visible distresses only, no core cuts or removal of the surface is performed, in order to determine the overall condition of each pavement section. The pavement asset management program, PAVER, is used to database all pavement system information. Each pavement section is assigned a pavement condition index (PCI) in PAVER. PCI is a numerical representation determined by critical analysis of data gathered during a visual survey of each individual pavement section; the PCI number is a relative indication of the condition of each pavement section. General PCI categories assigned to the areas are as follows along with the correlation to CMS Facility Condition Index (FCI)
The visible distresses used to develop the PCI for asphalt pavement include, but are not limited to: alligator cracking, block cracking, depressions, and lane drop off, utility cut/patching, potholing, rutting, and slippage cracking and weathering. The overall condition of each of the visible pavement areas is determined and weighted by location and use as necessary to determine the overall condition of the pavement section. Pavement system components not used in determining a PCI include, but are not limited to the stone base and subgrade. REI defines the condition of each PCI category as follows: Good (PCI 86-100, FCI 0): Routine Maintenance – Some climate and construction related distresses, but little to no notable failure or load related distresses. May be prescribed routine maintenance such as seal coating, crack filling, and restriping.
Satisfactory (PCI 71-85, FCI 2-1): Minor Repairs Needed – Possible isolated failure related to load distresses, but most likely climate and other related distresses. Patching may be prescribed based on the anticipated performance of the surrounding pavement.
Fair (PCI 56-70, FCI 4-3): Potential Resurface – Address all isolated failures, and based on the overall condition, it may be cost effective to perform a resurface or an overlay to reset the PCI.
Poor (PCI 41-55, FCI 6-5): Repairs as Needed – Pavement is still functioning, however moderate deterioration is present. Perform repairs as needed to maintain desirable use. Very Poor (PCI 26-40, FCI 7): Reconstruction Probable –Major deterioration present with potential for pavement performance to not meet necessary requirements.
Serious (PCI 11-25, FCI 8): Reconstruction Needed – Extensive deterioration present. The condition is likely affecting the use of the pavement structure. Failed (PCI 0-10, FCI 9): Reconstruction Critical – The pavement section is beyond its service life with extensive failure present throughout. This condition is likely allowing water to reach the subgrade due to the alligator cracking and potholes, potentially effecting the necessary reconstruction requirements.
PCI Range FCI Range Condition 0-10 9 Failed
11-25 8 Serious 26-40 7 Very Poor 41-55 6-5 Poor 56-70 4-3 Fair 71-85 2-1 Satisfactory
86-100 0 Good

Charlotte‐Mecklenburg Schools Facilities Sustainment Plan
Facilities Condition Index (FCI) – Criteria Plan
11/18/2015 3 | P a g e
WALKWAY AND CONCRETE A visual survey of the concrete surfaces is performed for visible distresses only, no core cuts or removal of the surface is performed, in order to determine the overall condition of each section. The overall facility concrete surface is assigned a condition index WCI. Surfaces include: concrete and asphalt walkways, concrete drives, concrete pads and other concrete surfaces.
WCI Range Condition 7-9 Failed 3-6 Fair 0-2 Good
The visible distresses used to develop the WCI for concrete surfaces include, but are not limited to: cracking, block cracking, depressions, utility cut/patching, surface failures, slab lifting/sinking, slippage cracking and weathering. The overall condition of each of the visible areas is determined by location and use as necessary to determine the overall condition of the pavement section. We define the condition of each WCI category as follows: Good (WCI 0-2): Routine Maintenance – Some climate and construction related distresses, but little to no notable failure or load related distresses.
Fair (WCI 3-6): Potential Resurface – Addresses all isolated failures, and based on the overall condition, it may be cost effective to remove and replace broken, uneven or damaged sections/areas. Failed (WCI 7-9): Reconstruction Critical – The surface is beyond its service life with extensive failure present throughout.
References: ASTM D6433: Standard Practice for Roads and Parking Lots Pavement Condition Index Surveys PAVER, An Engineering Management System for Pavement Systems developed by U.S. Army Corps of Engineers Pavement Management for Airports, Roads, and Parking Lots, Mo Y. Shahin Paving criterion prepared by REI Engineers Inc.

1 | P a g e
FCI Scoring
Playgrounds
Playground (Age) FCI Score
0-5 years 4
5—10 6
10-15 8
15+ 9
Use factors:
Vandalism 5
Use level:
Low 2
Medium 5
High 9
ADA Compliant
Yes 0
No 9
Age Appropriate
Yes 0
No 9
Surfacing
9-12 inches 3
6-9 inches 6
0-6 inches 9

2 | P a g e
Drainage
Satisfactory drainage 0
Moist surface 5
Standing water 8
Hazards
Protrusion/ Entanglement
Entrapment
“S” hooks
Trip Hazards
Slides
Hardware:
Fastening devices
Loose
Worn
Durability of Equipment:
Broken/Missing components
Securely anchored

Charlotte‐Mecklenburg Schools Facilities Sustainment Plan
Facilities Condition Index (FCI) – Criteria Plan
11/18/2015 P a g e | 1
PLUMBING A detailed survey of the schools’ plumbing systems is physically carried out based on the following factors to determine their condition vis‐à‐vis repair / maintenance /replacement requirements; their weightage is mentioned beside each:
1. Water System ‐ 25% 2. Water Heaters ‐ 20% 3. Drain‐Waste‐Vent (DWV) System ‐ 15% 4. Fire Utilities ‐ 15% 5. Fixtures / Faucets ‐ 10% 6. Gas Piping ‐ 10% 7. Irrigation System ‐ 5%
Based on the above factors, the individual plumbing system components are assessed and Facility Control Index (FCI) is assigned to each component per its weightage which adds up to the total FCI rating for that particular building / school, such that 1 (one) indicates an excellent system with no issues and 9 (nine) indicates a bad system requiring immediate remedial measures.
These FCI ratings gives us a “Look Ahead Plan” i.e. these ratings for individual components facilitate in determining and prioritizing repair / maintenance works over next 5‐10 years in order to plan and execute them in a befitting manner.
The above mentioned plumbing system components are explained in ensuing paragraphs.
1. Water System This includes all the hot, cold and return water piping and valves. Piping external to the building is normally routed underground for the reasons of freeze protection, whereas the internal buildings’ piping is routed above ceiling, inside walls and/or through below grade crawl spaces; the older buildings also have piping routed under the slab. The normal service life of these pipes is 50+ years. This greatly depends upon the location of piping as well e.g. piping in the crawl spaces, under the slab and underground deteriorates earlier compared to the piping routed above ceiling. The valves change out can be done anytime during the school year. However, there are limitations to replacement of complete piping based on their high FCI rating; unless there is a major renovation project going on. FCI rating in this case indicates probability of failures / leaks and repair / maintenance philosophy is based on “Fix When Fail” policy.
2. Water Heaters The plumbing department has embarked upon the initiative of phased replacement of conventional domestic water heaters with tankless energy efficient instantaneous water heaters at all schools. This is in line with the CMS A/E Guidelines and CMS energy efficiency initiative. However, to save on the cost this phased replacement is mainly based on the condition assessment of existing water heaters and the priority of replacement is based on its FCI rating. This process involves engineering followed

Charlotte‐Mecklenburg Schools Facilities Sustainment Plan
Facilities Condition Index (FCI) – Criteria Plan
11/18/2015 P a g e | 2
by installation. Therefore, engineering part of these projects is completed during the school year and normally installed during summer breaks.
3. Drain‐Waste‐Vent (DWV) System
The DWV system is considered to have 50+ years life based on experience. The drain / waste piping for the first floor run under the slab. Per A/E guidelines, all under slab sewerage piping is to be of cast iron due to its longevity. The rest of the sewerage piping is a mix of cast iron and PVC. The FCI rating for DWV system is based on the age. FCI rating indicates the probability of leaks and repair / maintenance philosophy is based on “Fix When Fail” policy.
4. Fire Utilities The plumbing department looks after the water main and fire hydrants of the fixed firefighting / sprinkling system. These are considered to have the same life as the building. The defect occurrence in this category is occasional and the FCI rating is based on the age of system. Repair / maintenance philosophy is based on “Fix When Fail” policy.
5. Fixtures/Faucets The fixtures / faucets have a long life span. The fixtures are replaced either due to breakage or renovation works. The faucets are normally repairable and occasionally require replacement owing to internal erosion beyond repairs or as part of renovation works. FCI rating is based on their age. Repair / maintenance philosophy is based on “Fix When Fail” policy.
6. Gas Piping The criterion of FCI rating for gas piping is same as for domestic water piping. The gas piping has higher longevity compared to water piping. FCI rating is based on their age. Repair / maintenance philosophy is based on “Fix When Fail” policy.
7. Irrigation System
The irrigation system is available for schools having athletic facilities. The criterion of FCI rating for irrigation system piping is same as for domestic water piping. Normally, all systems’ parts / components such as controllers, sprinkler heads etc. are repairable / replaceable upon defect occurrence. Repair / maintenance philosophy is based on “Fix When Fail” policy. FCI rating for the system is based on their age.

Charlotte‐Mecklenburg Schools Facilities Sustainment Plan
Facilities Condition Index (FCI) – Criteria Plan
11/18/2015 1 | P a g e
Roofing
A visual survey of the roof surfaces is performed for exposed components only, no core cuts or removal of surfacing
is performed, in order to determine the overall condition of each roof section. The roof asset management
program, Roof Manager, is utilized to house and maintain all roof system information. Each roof section is assigned
a roof condition index (RCI) in Roof Manager. RCI is a numerical expression determined by critical analysis of data
gathered during a visual survey of each individual roof area; the RCI number is a relative indication of the
condition of each roof area. General roof index categories assigned to the areas are as follows along with the
correlation to CMS Facility Condition Index (FCI):
Each roof section consists of multiple roof system components. The typical visible components included in
the survey to develop the RCI included but are not limited to: roof membrane, base flashings, penetration
flashings, roof drain flashings, drainage conditions, sheet metal flashings, roof surfacing, and
rooftop mechanical equipment, etc. The overall condition of each of the visible roof system
components is determined and weighted as necessary to determine the overall condition of the roof
section. Roof system components not typically visible and which are not included to determine the RCI
include but are not limited to: roof insulation, roof deck, perimeter wood blocking, wall substrates, etc.
RCI Range FCI Range Condition
0 ‐ 10 9 Failed
11 ‐ 25 8 Very Poor
26 ‐ 40 7 Poor
41 ‐ 55 6 ‐ 5 Fair
56 ‐ 70 4 ‐ 3 Good
71 ‐ 85 2 ‐ 1 Very Good
86 ‐ 100 0 Excellent

Charlotte‐Mecklenburg Schools Facilities Sustainment Plan
Facilities Condition Index (FCI) – Criteria Plan
11/18/2015 2 | P a g e
The roof criteria evaluation model defines the condition of each roof section as follows: ∙
Excellent (FCI 0): Routine Maintenance ‐ Typical roof system age less than 2 years old with no noticeable distresses anomalies Very Good (FCI 1‐2): Minor Repairs Needed‐Typical roof system age between 3 to 6 years. Minor anomalies; example of typical built‐up asphalt roof anomalies are small blisters in roof membrane, minor open base flashing laps, deteriorated pitch pan sealer, etc.) Good (FCI 3‐4): Moderate Repairs Needed ‐ Typical roof system age between 7 to 10 years. Presence of some distresses; example of typical built‐up asphalt roof distresses are minor Splits or larger blisters in membrane dis bonded base flashings or open base flashing laps, minor deteriorated penetration flashings) Fair (FCI 5‐6): Major Repairs Needed‐ Typical roof system age between II to 14 years. Water tightness is still adequate however moderate deterioration is present.
Poor (FCI 7): Replacement Probable ‐Typical roof system age between 15 to 19 years. Major deterioration present with potential for loss of water tightness.
Very Poor (FCI 8): Replacement Needed ‐ Typical roof system age between 20 to 24 years. Extensive deterioration present with localized active leaks.
Failed (FCI 9): Replacement Critical ‐ Typical roof system age of 25 years or greater. Roof section beyond service life with extensive active leaks or leak history.
References: National Roofing Contractors Association (NRCA)
Roof Manager by Propeller Head Software ROOFER: An Engineered Management System for Bituminous Built-up Roofs by US Army Corps of Engineers

Charlotte‐Mecklenburg Schools Facilities Sustainment Plan
Facilities Condition Index (FCI) – Criteria Plan
11/18/2015 1 | P a g e
Stormwater Control Measures
Types of Stormwater Control Measures (SCMs) 1) Bioretention Facilities 2) Dry Detention Basins 3) Enhanced Grassed Swales 4) Grassed Channels 5) Infiltration Trenches 6) Sand Filters 7) Stormwater Wetlands 8) Stormwater Wet Ponds
Very Good – FCI Score 0 No deficiency or minor deficiencies can be corrected with routine maintenance of SCM. Example: Mulch washed away from mouth of inlet pipe or minor sedimentation within rip rap apron. Good – FCI Score 1‐2 Minor repairs should consist of 1 to 3 deficiencies within the SCM that are easily/inexpensively repaired and has not caused any structural damage. Example: Formation of a small erosion rill. Fair – FCI Score 3‐4 Multiple deficiencies observed but the SCM remains fully functional. Example: Dry detention basin is overgrown and has small woody debris growing within the basin and on the embankment but is functional. Poor – FCI Score 5‐6 Performance of SCM has been compromised and is not fully functional. Example: Dry detention basin is ponding water. Very Poor – FCI Score 7 Conditions within the SCM will lead to structural damage. Example: Trees greater than 5 inches in caliper growing on an embankment that could lead to stormwater piping/embankment breach. Serious – FCI Score 8 Structural damage to one or more components within the SCM. Damage has caused the SCM to be non‐functional and could lead to complete failure. Failed – FCI Score 9 The SCM is non‐functional and in need of replacement. Reason to maintain SCMs – Charlotte‐Mecklenburg Schools shares a National Pollutant Discharge Elimination System (NPDES) Permit “Phase II Permit” with Mecklenburg County, the six Towns and CPCC. As a part of the condition of the Phase II Permit and Phase II Stormwater Management Plan, CMS is required to maintain their SCMs in perpetuity. In addition to the Phase II Permit, North Carolina Division of Environmental Quality (NCDEQ) formally known as NCDENR requires SCMs to be part of construction activities to control the flow of stormwater and to maintain the SCMs in perpetuity.

Charlotte‐Mecklenburg Schools Facilities Sustainment Plan
Facilities Condition Index (FCI) – Criteria Plan
11/18/2015 2 | P a g e
SCM Definitions
Bioretention Facilities – Shallow storm water basin or landscaped area that utilizes engineered soils and vegetation to capture
and treat runoff. Bioretention facilities are intended to provide water quality functions by filtering stormwater runoff and
allowing vegetation uptake of nutrients. Treatment area consists of grass filter, sand bed, ponding area, organic/mulch or sod
layer, planting soil, and vegetation. The primary processes that this SCM uses for pollutant removal are filtration and biological
uptake.
Dry Detention Basin ‐ A storage facility designed to provide water quantity control and some water quality control through
detention and/or extended detention of storm water runoff. It has an outlet structure that detains and attenuates runoff
inflows and promotes the settlement of pollutants. Facility normally remains dry between storm events. A subsurface extended
detention basin is located entirely below the ground surface in a vault, pipe, or stone bed.
Enhanced Grassed Swale – Enhanced grassed swales (also called vegetated open channels, water quality swales or engineered
swales) are vegetated open channels that are explicitly designed and constructed to capture and treat storm water runoff by
limiting the slope in the direction of flow or within dry cells formed by check dams or other means. Swale pollution removal
effectiveness is provided by sedimentation, biologic activity, and infiltration. Swales can also be designed without check dams
or engineered media as grass channels but with greatly reduced pollution removal rates.
Grassed Channels – Grassed channels provide nominal water quality treatment of runoff. These channels can provide good pre‐
treatment for other BMPs. They can reduce impervious cover, accent the natural landscape, provide aesthetic benefits and
reduce flow velocity as compared to other channel linings. Channels remove pollutants from stormwater by filtration through
grasses and other vegetation, settling, and infiltration through soil.
Infiltration Trenches ‐ Infiltration trenches are excavated trenches filled with stone aggregate used to capture and allow
exfiltration of stormwater runoff into the surrounding soils from the bottom and sides of the trench. Infiltration trenches are
used to remove pollutants and to infiltrate stormwater back into the ground. The infiltration also helps to reduce increases in
both the peak rate and total volume of runoff caused by land development. Pollutant removal is achieved through filtration of
the runoff through the stone aggregate and soil as well as biological and chemical activity within the soil.
Sand Filter ‐ Multi‐chamber structure designed to treat stormwater runoff through filtration, using a sediment forebay, a sand
bed as its primary filter media and, typically, an underdrain collection system. It can be configured as either a surface or
subsurface facility. In sand filter systems, storm water pollutants are removed primarily through filtration with some additional
treatment from gravitational settling and adsorption.
Stormwater Wet Pond – These wet ponds have a permanent pool, a temporary pool and typically a littoral shelf with planted
vegetation. Runoff from each rain event is detained and pollutants are treated in the pond. Temporary storage (live storage) is
provided above the permanent pool elevation and is released at a controlled rate. Pollutant removal is primarily accomplished
through sedimentation and biological processing.
Stormwater Wetlands – These wetlands temporarily store runoff in relatively shallow pools that support conditions suitable for
the growth of wetland plants. Stormwater wetlands are wetland systems designed to maximize the removal of pollutants from
storm water runoff through settling and both uptake and filtering by vegetation. Wetlands typically consist of four zones:
shallow land (temporary storage), shallow water, open water (forebay and micro‐pool), and upland areas. The runoff volume is
both stored and treated in the wetland permanent pool and temporary storage volume above the surface of the wetland.

SCHOOL / FACILITYYEAR BUILT
(Original)
BUILDING TYPE
BUILDING FCI
CAMPUS FCI(Weighted
averages based on size of each
building)
Albemarle Road ES - Bldg A - 1968, 1991 1968 ES 0.40Albemarle Road ES - Bldg B - 1975 1975 ES 0.38Albemarle Road ES - Bldg C - 1991 1991 ES 0.37Albemarle Road ES - Bldg D - 2006 (Classroom Addition) 2006 ES 0.26
Albemarle Road ES - Campus Roll-up ES 0.37Albemarle Road MS - Bldg A - 1967, 1970, 1980 1967 MS 0.47Albemarle Road MS - Bldg B - 1967 1967 MS 0.41
Albemarle Road MS - Bldg C - 1992, 1999 1992 MS 0.32
Albemarle Road MS - Campus Roll-up MS 0.44Alexander (JM) - Bldg A - 1959, 1968, 1982 (Classrooms, Media Ctr) 1959 MS 0.58Alexander (JM) - Bldg B - 1959, 1992 (Cafeteria, Classrooms) 1959 MS 0.62Alexander (JM) - Bldg C - 1959 (Boiler) 1959 MS 0.57Alexander (JM) - Bldg D - 1962 (Field House) 1962 MS 0.58Alexander (JM) - Bldg E - 1963 (Gym) 1963 MS 0.54
Alexander (JM) - Bldg F - 1968 (Media Ctr) 1968 MS 0.52Alexander (JM) - Bldg G - 1968 (Multi Purpose, Classrooms) 1968 MS 0.49Alexander (JM) - Bldg H - 1982, 1992 (Classrooms) 1982 MS 0.49
Alexander (JM) - Bldg J - 1982 (Career Ctr) 1982 MS 0.49
Alexander (JM) - Bldg K - 2004 (Science) 2004 MS 0.17Alexander (JM) - Campus Roll-up MS 0.50Alexander (Nathaniel) - 1996, 1997 1996 ES 0.21 0.21Allenbrook - 1966, 1969, 1991 1966 ES 0.45 0.45
Amay James - Bldg A - 1959, 1969 (Café, Admin, Classrooms) - vacant 1959 Pre‐K 0.49Amay James - Bldg B - 1969 (Multi Purpose, Media Ctr) - vacant 1969 Pre‐K 0.41
Amay James - Campus Roll-up Pre‐K 0.46Ardrey Kell - 2006 2006 HS 0.13Ardrey Kell - 2006 - Athletic Facilities 2006 HS 0.16Ardrey Kell - Campus Roll-up HS 0.13
Ashley Park - Bldg A - 1970, 1990, (Admin, Café, Multi-Purpose) 1951 PK8 0.35Ashley Park - Bldg B - 1951, 1990, 1999 (Classrooms) 2005 PK8 0.14Ashley Park - Campus Roll-up PK8 0.18Atrium - Building 4421 (6 story) - 1984 1984 ADM 0.40Atrium - Building 4339 (1 story) - 1984 1984 ADM 0.46Atrium - Building 4335 (1 story) - 1984 1984 ADM 0.30Atrium - Campus Roll-up ADM 0.39Bailey - 2006 2006 MS 0.11 0.11
Summary Facility Condition Index (FCI) Scores The lower the FCI the better the condition of the building/campus
See scoring criteria (included in binder)
Scoring based on fall 2015
February 2016 Board Meeting Summary FCI 1 of 14

SCHOOL / FACILITYYEAR BUILT
(Original)
BUILDING TYPE
BUILDING FCI
CAMPUS FCI(Weighted
averages based on size of each
building)
Summary Facility Condition Index (FCI) Scores The lower the FCI the better the condition of the building/campus
See scoring criteria (included in binder)
Scoring based on fall 2015
Bain - 2013 2013 ES 0.03 0.03
Bain - Bldg A - 1924, 1934, 1951 - Not Used 1924 ES 0.70Bain - Bldg B - 1970, 1983, 1993, 1994 1970 ES 0.40Bain - Bldg C - 1952, 1994 1952 ES 0.44Bain - "Old " Campus Roll-up ES 0.47Ballantyne - 2008 2008 ES 0.11 0.11Barnette - 2008 2008 ES 0.10 0.10Barringer Academic Center - 2002 2002 ES 0.17 0.17Berewick - 2009 2009 ES 0.10 0.10
Berry (Phillip O.) Academy of Tech. - 2002 2002 HS 0.19Berry (Phillip O.) Academy of Tech. - 2002 - Athletic Facilities 2002 HS 0.22Berry (Phillip O.) Academy of Tech. - Campus Roll-up HS 0.19Berryhill - Bldg A - 1978, 2008 1978 PK8 0.49Berryhill - Bldg B - 2007 2007 PK8 0.18Berryhill - Campus Roll-up PK8 0.40
Beverly Woods - Bldg A - 1969, 1980, 1991 1969 ES 0.49Beverly Woods - Bldg B - 1997 1997 ES 0.21Beverly Woods - Campus Roll-up ES 0.41Billingsville/Rosenwald - 1927 Bldg - leased 1927 ES 0.56 0.56Billingsville - 1972, 1994, 1998, 2005 1972 ES 0.18 0.18Blythe - 1998 1998 ES 0.24 0.24Bradley (Francis) - 1998 1998 MS 0.26 0.26
Briarwood - Bldg A - 1976 (Classrooms) 1976 ES 0.53
Briarwood - Bldg B - 1972 (Classrooms) 1972 ES 0.48
Briarwood - Bldg C - 1956, 1959, 1971, 1976 (Admin, Café, MP, Classrooms) 1956 ES 0.64
Briarwood - Bldg D - 1997 (Gym, Media Ctr) 1997 ES 0.28Briarwood - Campus Roll-up ES 0.54Bruns Avenue - 1969 1969 PK8 0.51Bruns Avenue - 1999 1999 PK8 0.27Bruns Avenue - Campus Roll-up PK8 0.36Butler (David) - Bldg A - 1997 1997 HS 0.23Butler (David) - Bldg B - 2007 2007 HS 0.16Butler (David) - Athletic Facilities - 1997 1997 HS 0.26Butler (David) - Campus Roll-up HS 0.22Byers (Walter G.) - Bldg A - 2001 (Café) 2001 PK8 0.22Byers (Walter G.) - Bldg B - 2001 (2 Story Classrooms) 2001 PK8 0.21Byers (Walter G.) - Bldg C - 2001 (Media Center, Admin) 2001 PK8 0.21Byers (Walter G.) - Campus Roll-up PK8 0.17Carmel - 1970, 1973, 1980, 2006 1970 MS 0.33 0.33Chantilly - 1948, 1953, 1998 1948 ES 0.56 0.56Clear Creek - Bldg A - 1969, 1982 (Admin, Café, MP, Classrooms) 1969 ES 0.34
February 2016 Board Meeting Summary FCI 2 of 14

SCHOOL / FACILITYYEAR BUILT
(Original)
BUILDING TYPE
BUILDING FCI
CAMPUS FCI(Weighted
averages based on size of each
building)
Summary Facility Condition Index (FCI) Scores The lower the FCI the better the condition of the building/campus
See scoring criteria (included in binder)
Scoring based on fall 2015
Clear Creek - Bldg B - 1960 (Classrooms) 1960 ES 0.48Clear Creek - Bldg C - 1989, 2008 (Classrooms, Multi Purpose) 1989 ES 0.32Clear Creek - Campus Roll-up ES 0.34Cochrane - 1961, 1964, 1965, 1968, 1985, 2003, 2004, 2008 1961 MS 0.31 0.31Collinswood - 1959, 1968, 1974 1959 ES 0.59 0.59Community House - 2005 2005 MS 0.20 0.20
Cornelius - Bldg A - 1971, 1980, 1989, 1998 1971 ES 0.62Cornelius - Bldg B - 1930 (Storage) 1930 ES 0.18Cornelius - Bldg C - 1997, 2005 1997 ES 0.38Cornelius - Campus Roll-up ES 0.50Cotswold - Bldg A - 1955, 1957, 2007 (Admin, Café, MP, Classrooms) 1955 ES 0.26Cotswold - Bldg B - 1991 (Media Ctr, Classrooms) 1991 ES 0.33Cotswold - Campus Roll-up ES 0.27Coulwood - Bldg A - 1960, 1969, 1982 1960 MS 0.52Coulwood - Bldg B - 1960, 1971 1960 MS 0.45Coulwood - Bldg C - 1965 1965 MS 0.47Coulwood - Bldg D - 2001 2001 MS 0.27Coulwood - Activities Field Storage Bldg - 1999 NS 0.00Coulwood - Campus Roll-up MS 0.44Craig Avenue Bus Facility - Bldg A - 1964, 1972, 1991 ADM 0.54Craig Avenue Warehouse - Bldg B - 1966, 1975 1966 ADM 0.52
Craig Avenue Warehouse - Bldg C - 1987 1987 ADM 0.43Craig Avenue - Roll-up ADM 0.51Crestdale - 1998 1998 MS 0.27 0.27Croft Community School - 2008 2008 ES 0.09 0.09Crown Point - 1993 1993 ES 0.46 0.46David Cox - 1994 1994 ES 0.31 0.31Davidson IB - Bldg A - 1937 - leased 1935 MS 0.62Davidson IB - Bldg B - 1948 - leased 1948 MS 0.69
Davidson IB - Campus Roll-up - leased MS 0.68Davidson - 1994 1994 ES 0.38 0.38Davis (Marie G.) Global Military Acad. - 2011 2011 K‐12 0.06Davis (Marie G.) Global Military Acad. - Bldg G (13) - 1954 (Gym) 1954 K‐12 0.61
Davis (Marie G.) Global Military Acad. - Bldg H (12) - 1954 (Classrooms) 1954 K‐12 0.59
Davis (Marie G.) Global Military Acad. - Bldg J (9) - 1957 (Café, Classrooms) 1957 K‐12 0.63
Davis (Marie G.) Global Military Acad. - Bldg K (10) - 1971 (Auditorium) 1971 K‐12 0.60
Davis (Marie G.) Global Military Acad. - Bldg L (11) - 1954, 1957 (Classrooms) 1954 K‐12 0.59Davis (Marie G.) Global Military Acad - Campus Roll-up K‐12 0.30
February 2016 Board Meeting Summary FCI 3 of 14

SCHOOL / FACILITYYEAR BUILT
(Original)
BUILDING TYPE
BUILDING FCI
CAMPUS FCI(Weighted
averages based on size of each
building)
Summary Facility Condition Index (FCI) Scores The lower the FCI the better the condition of the building/campus
See scoring criteria (included in binder)
Scoring based on fall 2015
Derita - Bldg A - 1953, 1982 (Classrooms) 1953 ES 0.52Derita - Bldg B - 1992 (Classrooms) 1992 ES 0.38Derita - Bldg C - 1937 (Gym) 1937 ES 0.54Derita - Bldg D - 1971, 1982 (Admin, Café, MP, Classrooms) 1971 ES 0.48Derita - Campus Roll-up ES 0.48Devonshire - Bldg A - 1964, 1965 (Admin, Café, Classrooms) 1964 ES 0.48Devonshire - Bldg B - 1976, 1999 (Media Center) 1976 ES 0.32Devonshire - Bldg C - 1971 (Modular) 1971 ES 0.00Devonshire - Bldg D - 1977 (Modular) 1977 ES 0.00
Devonshire - Bldg E - 1999 (Multi Purpose) 1999 ES 0.19Devonshire - Campus Roll-up ES 0.37Dilworth - Bldg A - 1966 (Admin, Café, MP, Classrooms) 1966 ES 0.41Dilworth - Bldg B - 1991 (Media Ctr) 1991 ES 0.27
Dilworth - Bldg C - 2006 (Multi Purpose) 2006 ES 0.14Dilworth - Bldg D - 1922 [aka Euclid Ceter] (Classrooms) 1922 ES 0.38Dilworth - Campus Roll-up ES 0.30Double Oaks - leased Pre‐K 0.64 0.64Downs Road Transportation Hub - All Modulars ADM 0.15 N/ADruid Hills - 2001 2001 PK8 0.28 0.28East Mecklenburg - Bldg A - 1949, 100/200/300 Halls (Classrooms) 1949 HS 0.55East Mecklenburg - Bldg B - 1949, 700 Bldg (Auditorium) 1949 HS 0.37East Mecklenburg - Bldg C - 1956, 300 Hall (Classrooms) 1956 HS 0.52East Mecklenburg - Bldg D - 1956, 100 Hall (Classrooms) 1956 HS 0.52East Mecklenburg - Bldg E/J - 1954, 1968, 1998 (Gym) 1954 HS 0.44East Mecklenburg - Bldg F - 1949, 1980, 400 Bldg (Classrooms) 1949 HS 0.46East Mecklenburg - Bldg G - 1954, 400 Bldg (Classrooms) 1954 HS 0.51East Mecklenburg - Bldg H - 1998, Science Bldg (Classrooms) 1998 HS 0.25East Mecklenburg - Bldg K - 1961, 900 Bldg (Shop/Old Bus Garage) 1961 HS 0.61East Mecklenburg - Bldg I - 1963, 1968, 600 Bldg (Café, Classrooms) 1963 HS 0.43East Mecklenburg - Bldg M - 1955 (ROTC in Residential House) 1955 HS 0.66East Mecklenburg - Bldg N - 1976 (Media Ctr) 1976 HS 0.51
East Mecklenburg - Bldg P - 1997 (Admin) 1997 HS 0.36
East Mecklenburg - Athletic Facilites - 2001 HS 0.45East Mecklenburg - Campus Roll-up HS 0.46Eastover - Bldg A - Original - 1935, 1940, 1972, 2005 1935 ES 0.34
February 2016 Board Meeting Summary FCI 4 of 14

SCHOOL / FACILITYYEAR BUILT
(Original)
BUILDING TYPE
BUILDING FCI
CAMPUS FCI(Weighted
averages based on size of each
building)
Summary Facility Condition Index (FCI) Scores The lower the FCI the better the condition of the building/campus
See scoring criteria (included in binder)
Scoring based on fall 2015
Eastover - Bldg B - Addition - 2005 2005 ES 0.14Eastover - Bldg C - Addition - 2005 (Storage Bldg) 2005 ES 0.14Eastover - Campus Roll-up ES 0.25Eastway - Bldg A - 1956 1956 MS 0.38Eastway - Bldg B - 1954, 1956, 1966 1954 MS 0.37Eastway - Bldg C - 1954 1954 MS 0.37Eastway - Bldg D - 1956, 1966 1956 MS 0.40Eastway - Campus Roll-up MS 0.38Elizabeth Lane - 1996 1996 ES 0.41 0.41Elizabeth Traditional - 1925, 1951, 1971, 2001 1925 ES 0.34 0.34Elon Park - 2008 2008 ES 0.17 0.17Endhaven - 2003 2003 ES 0.19 0.19First Ward - Bldg D - 1989 1989 ES 0.17First Ward - Bldg E - 1989 1989 ES 0.16First Ward Arts Academy - 2003 2003 ES 0.18First Ward - Campus Roll-up ES 0.17Garinger - Bldg A - 1959 (Classrooms) 1959 HS 0.30Garinger - Bldg B - 1960 (Classrooms) 1960 HS 0.28Garinger - Bldg C - 1959 (Classrooms) 1959 HS 0.34Garinger - Bldg D - 1959 (Classrooms) 1959 HS 0.35Garinger - Bldg E - 1959 (Café) 1959 HS 0.36Garinger - Bldg F - 1959 (Gym) 1959 HS 0.28Garinger - Bldg G - 1959 (Classrooms) 1959 HS 0.29Garinger - Bldg H - 1959 (Admin) 1959 HS 0.39Garinger - Bldg I - 1960 (Field House) 1960 HS 0.52Garinger - Bldg J - 1967, 1976, 2013 (Auditorium, Science) 1967 HS 0.22Garinger - Bldg L - 1976 (Auto Shop) 1976 HS 0.39Garinger - Bldg M - 1976 (Media Ctr) 1976 HS 0.40Garinger - Bldg N - 1967 (Boiler) 1967 HS 0.39Garinger - Athletic Facilities - 2014 2014 HS 0.01Garinger - Campus Roll-up HS 0.30
Graham (Alexander) - Bldg A - 1958, 2008 1958 MS 0.22
Graham (Alexander) - Bldg B - 1958, 1969 1958 MS 0.26Graham (Alexander) - Bldg C - 1958 1958 MS 0.25Graham (Alexander) - Bldg D - 1958, 1969, 2013 1958 MS 0.23Graham (Alexander) - Bldg E - 2008 2008 MS 0.08Graham (Alexander) - Bldg F - 1958 (Music Building out in woods) 1958 MS 0.71
Graham (Alexander) - Campus Roll-up MS 0.22Grand Oak - 2013 2013 ES 0.01 0.01Graphic Production Center - 1975 1975 ADM 0.28 0.28Greenway Park - 1995 1995 ES 0.27 0.27Grier (Joseph W.) Academy - 2001 2001 ES 0.12 0.12Gunn (JH) - Bldg A - 2003 2003 ES 0.15Gunn (JH) - Bldg B - 1963, 1966 (Gym) 1963 ES 0.40Gunn (JH) - Campus Roll-up ES 0.18
February 2016 Board Meeting Summary FCI 5 of 14

SCHOOL / FACILITYYEAR BUILT
(Original)
BUILDING TYPE
BUILDING FCI
CAMPUS FCI(Weighted
averages based on size of each
building)
Summary Facility Condition Index (FCI) Scores The lower the FCI the better the condition of the building/campus
See scoring criteria (included in binder)
Scoring based on fall 2015
Harding University - Bldg A - 1961, 2010 (Classrooms) 1961 HS 0.42Harding University - Bldg B - 1961 (Admin, Classrooms) 1961 HS 0.44Harding University - Bldg C - 1961, 1976 (Auditorium, Classrooms) 1961 HS 0.44Harding University - Bldg D - 1969 (Gym, Boiler, Café) 1969 HS 0.58Harding University - Bldg E - 1961, 1969 (JROTC, Weight Room) 1961 HS 0.54Harding University - Bldg F - 1981 (Media Center) 1981 HS 0.41Harding University - Bldg G - 2009 (Admin, Classrooms) 2009 HS 0.08
Harding University - Concessions - 2003 2003 HS 0.37
Harding University - Outside Storage - 2003 2003 HS 0.00Harding University - Campus Roll-up HS 0.40Hawk Ridge - 1999 ES 0.22 0.22Hawthorne (alt) - Bldg A - 1969 1969 HS 0.40Hawthorne (alt) - Bldg B - 1993 1993 HS 0.36Hawthorne (alt) - Bldg C - 1937, 1956, 1966, 1969 1937 HS 0.24Hawthorne (alt) - Athletic Facilities HS 0.11Hawthorne (alt) - Campus Roll-up HS 0.32Hickory Grove - 2006 2006 ES 0.16 0.16
Hickory Grove (Old) - Campus Roll-up 1951 ES 0.58 0.58Hidden Valley - Bldg A - 1965, 1967, 1976, 1994 1965 ES 0.35Hidden Valley - Bldg D - 1976 1976 ES 0.60Hidden Valley - Campus Roll-up ES 0.37Highland Creek - 2006 2006 ES 0.12 0.12Highland Mill - 2002 2002 ES 0.15 0.15
Highland Renaissance Academy - 2001 2001 ES 0.13 0.13Hopewell - Bldg A - 2001 2001 HS 0.26Hopewell - Bldg B - 2007 2007 HS 0.15Hopewell - Athletic Facilities HS 0.19Hopewell - Campus Roll-up HS 0.24Hornets Nest - 1991 1991 ES 0.24 0.24Hough (WA) - 2010 2010 HS 0.07Hough (WA) - 2010 - Athletic Facilities 2010 HS 0.02Hough (WA) - Campus Roll-up HS 0.07
Huntersville - Bldg A - 1954, 1968, 1991, 2000 (Admin, Café, Gym, Media, Class) 1954 ES 0.44
Huntersville - Bldg E - 1991 (Classrooms) 1991 ES 0.50Huntersville - 1938 (Orig 2-Story Brick) 1938 ADM 0.63Huntersville - Campus Roll-up ES 0.46Huntingtowne Farms - Bldg A - 1964, 1967, 1991, 2009 1964 ES 0.37Huntingtowne Farms - Bldg B - 1991 1991 ES 0.27
Huntingtowne Farms - Campus Roll-up ES 0.35
February 2016 Board Meeting Summary FCI 6 of 14

SCHOOL / FACILITYYEAR BUILT
(Original)
BUILDING TYPE
BUILDING FCI
CAMPUS FCI(Weighted
averages based on size of each
building)
Summary Facility Condition Index (FCI) Scores The lower the FCI the better the condition of the building/campus
See scoring criteria (included in binder)
Scoring based on fall 2015
Idlewild - Campus Roll-up 1992 ES 0.16 0.16Independence - Bldg A - 1966, 1969, 1973, 1976 1966 HS 0.45Independence - Bldg B - 1966, 1976 1966 HS 0.41
Independence - Bldg C (Gym) - 1965, 2014 1965 HS 0.05Independence - Bldg D - 1980 1980 HS 0.53Independence - Science - 2001 2001 HS 0.24Independence - 1986 (Concessions) 1986 HS 0.26Independence - 2004 2004 HS 0.15
Independence - Athletic Facilities - 2014 HS 0.11Independence - Campus Roll-up HS 0.32
Irwin Avenue - 1935, 1938, 1949, 1995 1935 ES 0.35 0.35Kennedy (Robert F.) - 1989 1989 MS 0.32 0.32King (Martin Luther, Jr.) - 2003 2003 MS 0.15 0.15Lake Wylie - 1992 1992 ES 0.35 0.35Lansdowne - 1959, 1968, 1974, 1981, 2001 1959 ES 0.57 0.57Leadership Academy (at Governer's Village) ADMLebanon Road - 1990 1990 ES 0.39 0.39Lincoln Heights - 2002 2002 ALT 0.19 0.19Long Creek - 2009 2009 ES 0.11 0.11
Long Creek (Trillium Springs) - Campus Roll-up 1923 ES 0.51 0.51Mallard Creek ES - 1987, 1989, 2000 1987 ES 0.34 0.34Mallard Creek HS - 2007 2007 HS 0.14 0.14Martin (James) - Bldg A - 1998 1998 MS 0.24Martin (James) - Bldg B - 1998 1998 MS 0.23Martin (James) - Bldg C - 1998 1998 MS 0.23Martin (James) - Bldg D - 1998 1998 MS 0.23Martin (James) - Bldg E - 1998 1998 MS 0.23Martin (James) - Campus Roll-up MS 0.23Matthews - Bldg A - 1954, 1969, 1976, 1980, 1989, 2000 1954 ES 0.48
Matthews - Bldg B - 1989 (Classrooms) 1989 ES 0.38Matthews - Campus Roll-up ES 0.47McAlpine - 1986, 1987 1986 ES 0.33 0.33McClintock - 2013 2013 MS 0.01 0.01McKee Road - 1989 1989 ES 0.34 0.34Merry Oaks - 2002 2002 ES 0.15Merry Oaks - Blue Wing- 1991 (Classrooms) 1991 ES 0.60Merry Oaks - Campus Roll-up ES 0.19Metro School - Old School - 1952, 1976 - vacant 1952 ALT 0.75 0.75Metro School - 2006 2006 ALT 0.20
Metro School - Underground Parking - 2006 2006 ALT 0.17Metro School - Campus Roll-up (405 S Davidson St) ALT 0.19Mint Hill - 2003 2003 MS 0.24 0.24
February 2016 Board Meeting Summary FCI 7 of 14

SCHOOL / FACILITYYEAR BUILT
(Original)
BUILDING TYPE
BUILDING FCI
CAMPUS FCI(Weighted
averages based on size of each
building)
Summary Facility Condition Index (FCI) Scores The lower the FCI the better the condition of the building/campus
See scoring criteria (included in binder)
Scoring based on fall 2015
Montclaire - Bldg A - 1958, 1964, 1997 1958 ES 0.61
Montclaire - Bldg B - 1971 (Multipurpose) 1971 ES 0.56Montclaire - Campus Roll-up ES 0.60Morehead - 1998 1998 ES 0.32 0.32Morgan School-Old (Torrence Ave) - 1925, 1948 - leased 1925 ALT 0.74 0.74
Mountain Island Lake Academy - 2002 2002 K‐8 0.20 0.20Myers Park - Bldg A - 1950, 1970, 2003 (Gym) 1950 HS 0.45Myers Park - Bldg B - 1950, 1963, 2003 (Class/Cafe) 1950 HS 0.53Myers Park - Bldg C - 1961, 1977 (Aud/Music) 1961 HS 0.60
Myers Park - Bldg D - 1954, 1977 (Math) 1954 HS 0.34Myers Park - Bldg E - 1950 (LA/Media Center) 1950 HS 0.58Myers Park - Bldg F - 1954 (Tech) 1954 HS 0.62Myers Park - Bldg G - 1963 (Class) 1963 HS 0.43Myers Park - Bldg H - 1950 (Physics) 1950 HS 0.55Myers Park - Bldg I - 1950 (Bio) 1950 HS 0.62Myers Park - Bldg J - 1950 (Boiler) - Demo'd 2014 1950 HS 0.00Myers Park - Bldg K - 1976 (Auto) 1976 HS 0.45Myers Park - Bldg L - 1977 (Voca) 1977 HS 0.48Myers Park - Bldg M - 1996 (Social Science) 1996 HS 0.28Myers Park - Bldg N - 2003 (Stud Serv) 2003 HS 0.28Myers Park - Athletic Facilites - 2013 HS 0.12Myers Park - Bldg O - 2015 (Gym) 2015 HS 0.06Myers Park - Campus Roll-up HS 0.44Myers Park Traditional - Old Building - 1928, 1948, 1953, 1972 1928 ES 0.31Myers Park Traditional - 2003 2003 ES 0.22
Myers Park Traditional - Campus Roll-up ES 0.26
Nations Ford - Bldg A - 1960, 1961, 1963 1960 ES 0.64Nations Ford - Bldg B - 1971 (Multi Purpose) 1971 ES 0.60
Nations Ford - Bldg C - 1974 (Classrooms) 1974 ES 0.56Nations Ford - Campus Roll-up ES 0.63
Newell - Bldg A - 1970, 1976, 1982, 2001 1970 ES 0.64Newell - Bldg B - 1958 (Classrooms) 1958 ES 0.52Newell - Campus Roll-up ES 0.62Newell - New 2015 ESNorth Mecklenburg - Bldg A, B, C - 1950 (Auditorium, Classrooms) 1950 HS 0.63North Mecklenburg - Bldg D - 1950 (Classrooms) 1950 HS 0.60North Mecklenburg - Bldg E - 1991 (Admin, Classrooms) 1991 HS 0.40
February 2016 Board Meeting Summary FCI 8 of 14

SCHOOL / FACILITYYEAR BUILT
(Original)
BUILDING TYPE
BUILDING FCI
CAMPUS FCI(Weighted
averages based on size of each
building)
Summary Facility Condition Index (FCI) Scores The lower the FCI the better the condition of the building/campus
See scoring criteria (included in binder)
Scoring based on fall 2015
North Mecklenburg - Bldg F - 1964, 2004 (Café, Classrooms) 1964 HS 0.42North Mecklenburg - Bldg G - 1954, 1975, 1996 (Gym, Media Ctr) 1954 HS 0.43North Mecklenburg - Bldg H - 1958 (Classrooms) 1958 HS 0.59
North Mecklenburg - Bldg I - Greenhouse HS 0.07
North Mecklenburg - Bldg J - 1950 (Shops) 1950 HS 0.57North Mecklenburg - Bldg L - 1970 (Classrooms) 1970 HS 0.56North Mecklenburg - Bldg N - 1976 (Vocat, Classrooms) 1976 HS 0.59North Mecklenburg - Bldg Z - 2009 (Classrooms) 2009 HS 0.07North Mecklenburg - Athletic Facilities HS 0.12
North Mecklenburg - Campus Roll-up HS 0.43North Ridge - 1996 1996 MS 0.21 0.21Northeast - Bldg A - 2009 2009 MS 0.20
Northeast - Bldg B/C - 1976, 1981, 2005 1976 MS 0.29Northeast - Campus Roll-up MS 0.28Northwest School of the Arts - Bldg A - 1952, 1969, 2005 (Café) 1952 HS 0.22Northwest School of the Arts - Bldg B - 1952, 1996 (Visual Arts) 1952 HS 0.54Northwest School of the Arts - Bldg C - 1937, 1947 (Admin, Auditorium) 1937 HS 0.61Northwest School of the Arts - Bldg D - 1969 (3-Story Classrooms) 1969 HS 0.51
Northwest School of the Arts - Bldg E - 1996 (Performing Arts (Blackbox) 1996 HS 0.21Northwest School of the Arts - Bldg F - 2005 (Gym) 2005 HS 0.12Northwest School of the Arts - Campus Roll-up HS 0.39Oakdale - 1952/2006 1952 ES 0.23 0.23Oakhurst - Bldg A - 1959 1952 ES 0.43Oakhurst - New Building - 2002 2002 ES 0.14Oakhurst - Campus Roll-up ES 0.23Oaklawn - 1964, 1965, 2004 1964 K‐8 0.29 0.29Olde Providence - Bldg A - 1968 (Admin, MP, Café, Classrooms) 1968 ES 0.47Olde Providence - Bldg B - 1980 (Classrooms) 1980 ES 0.46Olde Providence - Bldg C - 1992 (Media Ctr, Classrooms) 1992 ES 0.26Olde Providence - Campus Roll-up ES 0.41
Olympic - Bldg A - 1965, 1974, 1996 (Admin, Media Center, Café, Classrooms) 1965 HS 0.50Olympic - Bldg B - 1965, 2000 (Gym, Science Wing) 1965 HS 0.48Olympic - Bldg C - 1965, 1974, 1976 (Band, JROTC, Shops, Vocat) 1965 HS 0.45Olympic - Athletic Facilities - 2014 HS 0.01
February 2016 Board Meeting Summary FCI 9 of 14

SCHOOL / FACILITYYEAR BUILT
(Original)
BUILDING TYPE
BUILDING FCI
CAMPUS FCI(Weighted
averages based on size of each
building)
Summary Facility Condition Index (FCI) Scores The lower the FCI the better the condition of the building/campus
See scoring criteria (included in binder)
Scoring based on fall 2015
Olympic - Campus Roll-up HS 0.47Orr (Lawrence) 2015 ES 0.00 0.00Orr Road Transportation ADM 0.00 0.00Pallisades - 2014 2014 ES 0.00 0.00Park Road - Bldg A - 1949, 1971 (Main) 1949 ES 0.51
Park Road - Bldg B - 1954 (Classrooms) 1954 ES 0.49Park Road - Bldg C - 1971 (Gym) 1971 ES 0.49
Park Road - Bldg D - 1997 (Media Center) 1997 ES 0.26Park Road - Campus Roll-up ES 0.49Parkside - Campus Roll-up 2015 ES 0.00 0.00Paw Creek - Building A - 1954 (Café, Auditorium) 1954 ES 0.47Paw Creek - Building B - 1954 (Classrooms) 1954 ES 0.46Paw Creek - Building C - 1954 (Classrooms) 1954 ES 0.46Paw Creek - Building D - 1954 (Classrooms) 1954 ES 0.46Paw Creek - Building E - 1960 (Classrooms) 1960 ES 0.46Paw Creek - Building F - 1971, 1998 (Media Ctr, MP) 1971 ES 0.39Paw Creek - Building G - 1998 (Admin, Classrooms) 1998 ES 0.32Paw Creek - Campus Roll-up ES 0.41
Perf. Learning Center @ Graham - 1926 1926 HS 0.70 0.70
Piedmont Open - 1925, 1937, 1972, 2004 1925 MS 0.31 0.31Pineville - 2013 2013 ES 0.01 0.01Pinewood - 2005 2005 ES 0.12 0.12Piney Grove - 1977, 1981, 1991, 1998 1977 ES 0.41 0.41Polo Ridge - 2007 2007 ES 0.11 0.11Providence - Bldg A - 1989, 1996 1989 HS 0.48Providence - Bldg B - 1989 1989 HS 0.47Providence - Bldg C - 1989 1989 HS 0.47Providence - Athletic Facilities - 1989 HS 0.23Providence - Campus Roll-up HS 0.47Providence Spring - 2002 2002 ES 0.24 0.24Quail Hollow - 1964, 1968, 1991, 2006, 2008 1964 MS 0.32 0.32Rama Road - 1964, 1981, 1992, 2000 1964 ES 0.41 0.41Randolph - 1967, 1981, 2009 1967 MS 0.31 0.31Ranson - Bldg A - (100/200/500) - 1964, 2001 1964 MS 0.33Ranson - Bldg B - (300) - 1970 (Demolished 2015) 1970 MS 0.00Ranson - Bldg C - (400) - 1991 (Demolished 2015) 1991 MS 0.00Ranson - Bldg D - (600/700) - 2014 2014 MS 0.01Ranson - Campus Roll-up MS 0.24
Reedy Creek - Bldg A - 1981, 1991, 2007 1981 ES 0.33 0.33Reid Park - 1994 1994 PK8 0.38 0.38
February 2016 Board Meeting Summary FCI 10 of 14

SCHOOL / FACILITYYEAR BUILT
(Original)
BUILDING TYPE
BUILDING FCI
CAMPUS FCI(Weighted
averages based on size of each
building)
Summary Facility Condition Index (FCI) Scores The lower the FCI the better the condition of the building/campus
See scoring criteria (included in binder)
Scoring based on fall 2015
Ridge Road - 2009 2009 MS 0.14 0.14River Gate - 2009 2009 ES 0.15 0.15River Oaks Academy - 2009 2009 ES 0.16 0.16Robinson (Jay M.) - 2002 2002 MS 0.20 0.20Rocky River - 2010 2010 HS 0.07Rocky River - Athletic Facilities HS 0.02Rocky River - Campus Roll-up HS 0.07Sedgefield - Bldg A - 2002 2002 ES 0.14
Sedgefield - Bldg B - 1991 (Old Building J) 1991 ES 0.28Sedgefield - Campus Roll-up ES 0.15Sedgefield - Bldg A - 1955, 1971, 2009 1955 MS 0.41Sedgefield - Bldg B - 1955, 1956, 1971, 2001, 2009 1955 MS 0.41Sedgefield - Bldg C - 1956, 2009 1956 MS 0.27Sedgefield - Campus Roll-up MS 0.38Selwyn - Bldg A (New) - 2002 2002 ES 0.10Selwyn - Bldg B (Media) - 1988 1988 ES 0.41
Selwyn - Bldg C ("Hot Dog") - 1958, 1964 1958 ES 0.69Selwyn - Campus Roll-up ES 0.23Shamrock Gardens - Bldg A - 1954, 1971, 1998 1954 ES 0.58
Shamrock Gardens - Bldg B - 1954, 1998 1954 ES 0.57
Shamrock Gardens - Bldg C - 1954, 1998 1954 ES 0.59
Shamrock Gardens - Bldg D - 1954, 1971 1954 ES 0.59
Shamrock Gardens - Bldg E - 1957, 1998 1957 ES 0.59Shamrock Gardens - Bldg F - 1999 1999 ES 0.31Shamrock Gardens - Campus Roll-up ES 0.51Sharon - Bldg A - 1977, 2006 1977 ES 0.36Sharon - Bldg B - 2006 2006 ES 0.13Sharon - Campus Roll-up ES 0.32Smith Admin - 1960, 2000, 2002 1960 ADM 0.58 0.58Smithfield - 1994 1994 ES 0.39 0.39South Charlotte - 1992 1992 MS 0.43 0.43South Mecklenburg - Bldg A - 1958, 1976 (Gym) 1958 HS 0.66South Mecklenburg - Bldg B - 1962 (Classrooms) 1962 HS 0.69South Mecklenburg - Bldg C - 1958 (Classrooms) 1958 HS 0.66South Mecklenburg - Bldg D - 1958 (Classrooms) 1958 HS 0.72South Mecklenburg - Bldg E - 1958 (Classrooms) 1958 HS 0.69South Mecklenburg - Bldg F - 1958 (Media Center/Admin) 1958 HS 0.59South Mecklenburg - Bldg G - 1958, 1963 (Kitchen/Cafeteria) 1958 HS 0.58South Mecklenburg - Bldg I - 1958 (Boiler Plant) 1958 HS 0.59
February 2016 Board Meeting Summary FCI 11 of 14

SCHOOL / FACILITYYEAR BUILT
(Original)
BUILDING TYPE
BUILDING FCI
CAMPUS FCI(Weighted
averages based on size of each
building)
Summary Facility Condition Index (FCI) Scores The lower the FCI the better the condition of the building/campus
See scoring criteria (included in binder)
Scoring based on fall 2015
South Mecklenburg - Bldg J - 1966 (Weight Room) 1966 HS 0.66South Mecklenburg - Bldg K - 1964 (Sewage Treatment Plant) 1964 HS 0.58South Mecklenburg - Bldg M - 1970 (Choral/Music) 1970 HS 0.55South Mecklenburg - Bldg N - 1975 (Auditorium) 1975 HS 0.47South Mecklenburg - Bldg O - 2009 (3-Story Classrooms) 2009 HS 0.15
South Mecklenburg - Bldg P - 1976 (Shop) 1976 HS 0.61South Mecklenburg - Bldg Q - 1981 1981 HS 0.34South Mecklenburg - Bldg R - 1996 1996 HS 0.32South Mecklenburg - Athletic Facilities - 2004 HS 0.10
South Mecklenburg - Campus Roll-up HS 0.47Southwest - 2003 2003 MS 0.22 0.22
Spaugh (Herbert) - Campus Roll-up 1956 ADM 0.49 0.49Stafford Drive Facility - 1992 1992 ADM 0.25 0.25Starmount - Bldg A - 1962, 1964, 1968 1962 ES 0.57Starmount - Bldg B - 1988 1991 ES 0.53Starmount - Campus Roll-up ES 0.57Statesville Road - Bldg A - 1955, 1956, 1969, 1975, 1987, 1999 1955 ES 0.69Statesville Road - Bldg B - 1976 1976 ES 0.65Statesville Road - Campus Roll-up ES 0.67Statesville Road - 2016 2016 ES 0.00 0.00Steele Creek - 1968, 1976, 1989, 1998 1968 ES 0.50 0.50Sterling - 2002 2002 ES 0.22 0.22Stoney Creek - 2009 2009 ES 0.15 0.15Thomasboro - Bldg A - 2003 2003 Pre‐K 0.23Thomasboro - Bldg B - 1982 1982 Pre‐K 0.32Thomasboro - Bldg C - 1945 (Gym) 1945 Pre‐K 0.29Thomasboro - Campus Roll-up Pre‐K 0.27Torrence Creek - 2005 2005 ES 0.21 0.21Tuckaseegee - Bldg A - 1957, 1970, 1992 (Admin, Classrooms) 1957 ES 0.32Tuckaseegee - Bldg B - 1960, 1992 (Media Center, Classrooms) 1960 ES 0.32
Tuckaseegee - Bldg C - 2006 (Classrooms) 2006 ES 0.10Tuckaseegee - Bldg D - 2006 (Cafeteria/MultiPurpose) 2006 ES 0.10Tuckaseegee - Campus Roll-up ES 0.25University Meadows - 1992 1992 ES 0.44 0.44University Park - Campus Roll-up 1957 ES 0.36 0.36Vance (Zebulon) - 1997 (Roof) 1997 HS 0.33
Vance (Zebulon) - Science Building - 2014 2014 HS 0.00Vance - Athletic Facilities - 1997 HS 0.21Vance - Campus Roll-up HS 0.27
Waddell (EE) - 2001 (Language Academy) 2001 K8 0.25
February 2016 Board Meeting Summary FCI 12 of 14

SCHOOL / FACILITYYEAR BUILT
(Original)
BUILDING TYPE
BUILDING FCI
CAMPUS FCI(Weighted
averages based on size of each
building)
Summary Facility Condition Index (FCI) Scores The lower the FCI the better the condition of the building/campus
See scoring criteria (included in binder)
Scoring based on fall 2015
Waddell (EE) - Athletic Facilities - 2001 (Language Academy) K8 0.26Waddell - Campus Roll-up K8 0.25Washam (JV) - 2006 2006 ES 0.16 0.16West Charlotte - Bldg A - 1954, 1967 (Lang Arts) 1954 HS 0.48West Charlotte - Bldg B - 1954, 1966, 1992 (Science) 1954 HS 0.44
West Charlotte - Bldg C - 1966 (Biology) 1966 HS 0.41
West Charlotte - Bldg D - 1991 (Science) 1991 HS 0.31
West Charlotte - Bldg E - 1959 (Classrms) 1959 HS 0.48West Charlotte - Bldg F - 1966, 1992, 1999 (Classrms) 1966 HS 0.45West Charlotte - Bldg G - 1955, 1967, 1990, 2014 (Gym/Pool) 1955 HS 0.45West Charlotte - Bldg H - 1957 (Shop) 1957 HS 0.51
West Charlotte - Bldg I - 1955 (Classrms) 1955 HS 0.54West Charlotte - Bldg J - 1954, 1967, 1976 (Vocational) 1954 HS 0.48West Charlotte - Bldg K - 1954, 1966, 1967, 1981, 1991 (Cafeteria) 1954 HS 0.44
West Charlotte - Bldg L - 1967 (Auditorium) 1967 HS 0.43West Charlotte - Bldg M - 1954, 1981, 1999 (Media Ctr) 1954 HS 0.47West Charlotte - Bldg N - 1966 (Field House) 1966 HS 0.55
West Charlotte - Bldg P - 1998 (Classrms) 1998 HS 0.22West Charlotte - Athletic Facilities - 1966, 1985 HS 0.59West Charlotte - Campus Roll-up HS 0.43West Mecklenburg - Bldg A - 1950, 1957 (Adm, Aud, Class) 1950 HS 0.48West Mecklenburg - Bldg B - 1957 (Classroom) 1957 HS 0.50West Mecklenburg - Bldg C - 1954, 1973, 1997 (Gym) 1954 HS 0.55West Mecklenburg - Bldg D - 1950, 1997 (Ag) 1950 HS 0.44West Mecklenburg - Bldg E - 1961 1961 HS 0.47West Mecklenburg - Bldg F - 1954 1954 HS 0.48
West Mecklenburg - Bldg I - 1967 (Shop) 1967 HS 0.41West Mecklenburg - Bldg J - 1967 (Café/Media) 1967 HS 0.38West Mecklenburg - Bldg K - 1967 (Science) 1967 HS 0.50West Mecklenburg - Bldg M - 1991 (Classroom) 1991 HS 0.33West Mecklenburg - Bldg N - 1996 (Science and Math) 1996 HS 0.31
West Mecklenburg - Bldg P - 1997 (English) 1997 HS 0.28
February 2016 Board Meeting Summary FCI 13 of 14

SCHOOL / FACILITYYEAR BUILT
(Original)
BUILDING TYPE
BUILDING FCI
CAMPUS FCI(Weighted
averages based on size of each
building)
Summary Facility Condition Index (FCI) Scores The lower the FCI the better the condition of the building/campus
See scoring criteria (included in binder)
Scoring based on fall 2015
West Mecklenburg - Athletic Facilities - 2014 HS 0.03West Mecklenburg - Campus Roll-up HS 0.41Westerly Hills - 1968, 1976, 2001,2003, 2006 1968 PK8 0.35 0.35Whitewater Academy - 2008 2008 ES 0.17 0.17Whitewater - 2009 2009 MS 0.13 0.13Williams (John Taylor) - Bldg A - 1962, 1975, 1998 (100) 1962 MS 0.45
Williams (John Taylor) - Bldg B - 1962 (200) 1962 MS 0.43Williams (John Taylor) - Bldg C - 1962 (300) 1962 MS 0.43Williams (John Taylor) - Bldg D - 1962 (400) 1962 MS 0.43Williams (John Taylor) - Bldg E - 1962 (Gym) 1962 MS 0.43
Williams (John Taylor) - Campus Roll-up MS 0.44Wilson - 1955, 2001 - vacant 1955 MS 0.64 0.64Winding Springs - 1995 1995 ES 0.43 0.43Windsor Park - 2005 2005 ES 0.21Windsor Park - Bldg B - 1960 (old) 1960 ES 0.48Windsor Park - Bldg E - 1962 (old) 1962 ES 0.48Windsor Park - Bldg G - 1991 (old) 1991 ES 0.38Windsor Park - Campus Roll-up ES 0.24Winget Park - 2006 2006 ES 0.16 0.16Winterfield - Bldg A - 1964, 1965, 1997 1964 ES 0.45Winterfield - Bldg B - 2006 2006 ES 0.14Winterfield - Campus Roll-up ES 0.34
February 2016 Board Meeting Summary FCI 14 of 14

Capacity Utilization Chart 2015-2016 School YearSc
ho
ol N
um
be
r
CM
BE
Dis
tric
t
(201
1)
Lear
nin
g
Co
mm
un
ity
K-6
Sch
oo
ls
Mag
net
(Fu
ll o
r
Par
tial
)
Tota
l CR
Tea
che
rs
(Les
s EC
Res
ou
rce
and
ESL
Tea
che
rs)
Bu
ildin
g C
lass
roo
ms
(In
Co
re F
acili
ty)
Mo
bile
/Mo
du
lar/
Old
Bu
ildin
g
Cla
ssro
om
s In
Use
Tota
l Cla
ssro
om
s
2014
-201
5
Me
mb
ersh
ip, I
ncl
Pre
k
2015
-201
6
Me
mb
ersh
ip, I
ncl
Pre
k
Dif
fere
nce
2014
/201
5 To
tal
Me
mb
esh
ip
% E
DS
201
3-20
14
Rat
io (M
em
be
rsh
ip
Tota
l/To
tal C
R T
eac
he
rs)
Stu
den
t B
uild
ing
CR
Ca
pac
ity
(Rat
io x
Co
re
Faci
lity
CR
)
Staf
f B
uild
ing
Uti
lizat
ion
(To
tal C
R
Teac
he
rs/B
ldg
CR
in
Co
re)
Staf
f U
til.
To
tal A
dj.
CR
(To
tal C
R T
eac
he
rs/
Ad
j. C
R M
ob
iles)
4300 4 E Albemarle Road 63.5 42 36 78 1384 1131 -253 91% 17.81 748 151% 81%
4308 2 LIFT Allenbrook 31 21 10 31 580 568 -12 93% 18.32 385 148% 100%
4314 6 E Bain 46 39 7 46 899 941 42 22% 20.46 798 118% 100%
4437 6 S Ballantyne 43 39 2 41 850 882 32 14% 20.51 800 110% 105%
4328 1 N Barnette 35 39 0 39 682 704 22 19% 20.11 784 90% 90%
4316 2 W-HA/POB Barringer P 35 36 4 40 631 590 -41 55% 16.86 607 97% 88%
4369 2 S Berewick 32 39 0 39 625 636 11 53% 19.88 775 82% 82%
4322 5 S Beverly Woods 43 38 6 44 790 820 30 16% 19.07 725 113% 98%
4335 4 C Billingsville 22.5 35 0 35 656 395 -261 93% 17.56 614 64% 64%
4442 1 N Blythe P 62 50 13 63 1073 1118 45 45% 18.03 902 124% 98%
4329 4 NE -GA Briarwood 44 28 18 46 773 780 7 90% 17.73 496 157% 96%
4336 4 C Chantilly K-6 F 17.5 18 10 28 326 324 -2 18% 18.51 333 97% 63%
4338 4 E Clear Creek 34 30 10 40 671 656 -15 55% 19.29 579 113% 85%
4346 1 N Cornelius 30 39 0 39 589 634 45 30% 21.13 824 77% 77%
4349 5 C Cotswold P 45 32 7 39 828 842 14 37% 18.71 599 141% 115%
4418 1 N Croft Community 33 39 0 39 644 609 -35 39% 18.45 720 85% 85%
4352 6 E Crown Point 35 37 2 39 765 681 -84 57% 19.46 720 95% 90%
4362 3 N David Cox 42 37 11 48 829 720 -109 64% 17.14 634 114% 88%
4357 1 N Davidson 32 32 4 36 693 708 15 12% 22.13 708 100% 89%
4365 4 NE -GA Devonshire 36 32 7 39 668 624 -44 93% 17.33 555 113% 92%
4367 5 C Dilworth 36 28 2 30 698 730 32 19% 20.28 568 129% 120%
4379 5 C Eastover 24 26 0 26 465 415 -50 25% 17.29 450 92% 92%
4382 6 S Elizabeth Lane 46 35 12 47 925 1000 75 10% 21.74 761 131% 98%
4384 4 C Elizabeth Traditional F 29 26 0 26 534 542 8 44% 18.69 486 112% 112%
4383 6 S Elon Park 53 39 15 54 1115 1121 6 6% 21.15 825 136% 98%
4385 6 S Endhaven 40 35 3 38 744 770 26 27% 19.25 674 114% 105%
4368 3 E First Ward F 33 38 0 38 531 548 17 79% 16.61 631 87% 87%
4558 1 N Grand Oak 30 39 0 39 601 561 -40 7% 18.70 729 77% 77%
4398 5 C Greenway Park 34 37 2 39 644 609 -35 74% 17.91 663 92% 87%
4406 6 S Hawk Ridge 41 34 11 45 881 920 39 12% 22.44 763 121% 91%
4410 4 NE -GA Hickory Grove 43 36 10 46 1220 738 -482 87% 17.16 618 119% 93%
7408 4 NE -GA Lawrence Orr 51 55 0 55 0 923 n/a n/a 18.10 995 93% 93%
4412 3 NE - VA Hidden Valley 57 39 28 67 973 1012 39 95% 17.75 692 146% 85%
4411 1 N Highland Creek 34 39 0 39 1105 690 -415 23% 20.29 791 87% 87%
7409 1 N Parkside 26 39 0 39 0 473 473 23% 18.19 710 67% 67%
4413 3 C Highland Mill K-6 F 17 15 10 25 298 289 -9 32% 17.00 255 113% 68%
4414 3 NE -GA Highland Renaissance 35 36 0 36 542 561 19 89% 16.03 577 97% 97%
4416 3 N Hornets Nest 34 36 0 36 620 692 72 76% 20.35 733 94% 94%
4420 1 N Huntersville 39 37 17 54 729 750 21 27% 19.23 712 105% 72%
4422 5 S Huntingtowne Farms P 45 37 17 54 947 747 -200 84% 16.60 614 122% 83%
4424 4 C Idlewild P 55.8 39 18 57 938 1052 114 81% 18.85 735 143% 98%
Enrollment DataFacility Information Teachers Classrooms
Planning Services; 2/15/16 Page 1 of 3

Capacity Utilization Chart 2015-2016 School YearSc
ho
ol N
um
be
r
CM
BE
Dis
tric
t
(201
1)
Lear
nin
g
Co
mm
un
ity
K-6
Sch
oo
ls
Mag
net
(Fu
ll o
r
Par
tial
)
Tota
l CR
Tea
che
rs
(Les
s EC
Res
ou
rce
and
ESL
Tea
che
rs)
Bu
ildin
g C
lass
roo
ms
(In
Co
re F
acili
ty)
Mo
bile
/Mo
du
lar/
Old
Bu
ildin
g
Cla
ssro
om
s In
Use
Tota
l Cla
ssro
om
s
2014
-201
5
Me
mb
ersh
ip, I
ncl
Pre
k
2015
-201
6
Me
mb
ersh
ip, I
ncl
Pre
k
Dif
fere
nce
2014
/201
5 To
tal
Me
mb
esh
ip
% E
DS
201
3-20
14
Rat
io (M
em
be
rsh
ip
Tota
l/To
tal C
R T
eac
he
rs)
Stu
den
t B
uild
ing
CR
Ca
pac
ity
(Rat
io x
Co
re
Faci
lity
CR
)
Staf
f B
uild
ing
Uti
lizat
ion
(To
tal C
R
Teac
he
rs/B
ldg
CR
in
Co
re)
Staf
f U
til.
To
tal A
dj.
CR
(To
tal C
R T
eac
he
rs/
Ad
j. C
R M
ob
iles)
Enrollment DataFacility Information Teachers Classrooms
4571 2 C Irwin Avenue P 29 37 0 37 514 507 -7 26% 17.48 647 78% 78%
4478 4 E J. H. Gunn 43 35 7 42 695 779 84 80% 18.12 634 123% 102%
4433 1 N J.V. Washam 46 39 14 53 992 985 -7 18% 21.41 835 118% 87%
4432 3 E Joseph W. Grier 49 35 19 54 831 848 17 80% 17.31 606 140% 91%
4436 2 S Lake Wylie 41 39 5 44 698 717 19 58% 17.49 682 105% 93%
4438 5 C Lansdowne P 35 32 4 36 643 610 -33 48% 17.43 558 109% 97%
4440 6 E Lebanon Road 50 36 14 50 829 856 27 75% 17.12 616 139% 100%
4444 1 N Long Creek 28 39 0 39 483 491 8 54% 17.54 684 72% 72%
4446 1 N Mallard Creek P 39.4 40 6 46 803 723 -80 45% 18.35 734 99% 86%
4447 6 E Matthews 48 40 12 52 1030 1001 -29 30% 20.85 834 120% 92%
4449 6 S McAlpine 31.5 35 0 35 538 551 13 23% 17.49 612 90% 90%
4451 6 S McKee Road 29 31 0 31 493 538 45 15% 18.55 575 94% 94%
4453 4 NE -GA Merry Oaks 41 42 6 48 756 742 -14 90% 18.10 760 98% 85%
4459 5 W-HA/POB Montclaire 32 24 18 42 702 477 -225 93% 14.91 358 133% 76%
4462 1 N Mountain Island K-7 47.5 35 25 60 755 905 150 50% 19.05 667 136% 79%
4464 5 C Myers Park Traditional F 34 37 0 37 734 700 -34 31% 20.59 762 92% 92%
4468 3 NE - VA Nathaniel Alexander 49.5 53 4 57 868 883 15 77% 17.84 945 93% 87%
4471 2 W-HA/POB Nations Ford 46 27 20 47 767 804 37 88% 17.48 472 170% 98%
4474 3 NE - VA Newell 42 32 0 32 818 844 26 88% 20.10 643 131% 131%
4484 4 C Oakhurst STEAM P 35 37 0 37 0 607 607 0% 17.34 642 95% 95%
4485 1 W-WM Oakdale 36 35 5 40 646 664 18 83% 18.44 646 103% 90%
4491 5 C Olde Providence 35 32 6 38 717 732 15 15% 20.91 669 109% 92%
4493 2 S Palisades Park P 38 39 0 39 687 726 39 35% 19.11 745 97% 97%
4492 5 C Park Road K-6 F 24 20 20 40 514 517 3 11% 21.54 431 120% 60%
4494 1 W-WM Paw Creek 35 37 0 37 571 580 9 78% 16.57 613 95% 95%
4500 6 S Pineville 42 39 4 43 811 823 12 56% 19.60 764 108% 98%
4501 5 W-HA/POB Pinewood 32 35 0 35 587 521 -66 78% 16.28 570 91% 91%
4503 4 E Piney Grove 52.5 38 20 58 882 928 46 77% 17.68 672 138% 91%
4392 6 S Polo Ridge 49 39 8 47 1036 1053 17 5% 21.49 838 126% 104%
4507 6 S Providence Spring 41 36 5 41 871 901 30 4% 21.98 791 114% 100%
4512 5 C Rama Road 40 39 6 45 652 666 14 81% 16.65 649 103% 89%
4516 3 E Reedy Creek 44 40 11 51 775 821 46 70% 18.66 746 110% 86%
4590 2 S River Gate 39 39 0 39 828 821 -7 28% 21.05 821 100% 100%
4463 1 W-WM River Oaks Academy 36.6 39 0 39 642 659 17 72% 18.01 702 94% 94%
4519 5 C Sedgefield 28 36 0 36 482 434 -48 93% 15.50 558 78% 78%
4522 5 C Selwyn 42.5 25 12 37 850 859 9 19% 20.21 505 170% 115%
4527 4 NE -GA Shamrock Gardens P 29 30 0 30 469 492 23 76% 16.97 509 97% 97%
4530 5 C Sharon 39.5 28 10 38 809 818 9 17% 20.71 580 141% 104%
4534 5 S Smithfield 33.5 36 1 37 669 695 26 45% 20.75 747 93% 91%
4545 5 S Starmount Academy of Excellence 29 28 2 30 0 488 488 0% 16.83 471 104% 97%
4546 3 LIFT Statesville Road P 36 28 11 39 592 599 7 87% 16.64 466 129% 92%
Planning Services; 2/15/16 Page 2 of 3

Capacity Utilization Chart 2015-2016 School YearSc
ho
ol N
um
be
r
CM
BE
Dis
tric
t
(201
1)
Lear
nin
g
Co
mm
un
ity
K-6
Sch
oo
ls
Mag
net
(Fu
ll o
r
Par
tial
)
Tota
l CR
Tea
che
rs
(Les
s EC
Res
ou
rce
and
ESL
Tea
che
rs)
Bu
ildin
g C
lass
roo
ms
(In
Co
re F
acili
ty)
Mo
bile
/Mo
du
lar/
Old
Bu
ildin
g
Cla
ssro
om
s In
Use
Tota
l Cla
ssro
om
s
2014
-201
5
Me
mb
ersh
ip, I
ncl
Pre
k
2015
-201
6
Me
mb
ersh
ip, I
ncl
Pre
k
Dif
fere
nce
2014
/201
5 To
tal
Me
mb
esh
ip
% E
DS
201
3-20
14
Rat
io (M
em
be
rsh
ip
Tota
l/To
tal C
R T
eac
he
rs)
Stu
den
t B
uild
ing
CR
Ca
pac
ity
(Rat
io x
Co
re
Faci
lity
CR
)
Staf
f B
uild
ing
Uti
lizat
ion
(To
tal C
R
Teac
he
rs/B
ldg
CR
in
Co
re)
Staf
f U
til.
To
tal A
dj.
CR
(To
tal C
R T
eac
he
rs/
Ad
j. C
R M
ob
iles)
Enrollment DataFacility Information Teachers Classrooms
4549 2 S Steele Creek 43 33 11 44 737 783 46 69% 18.21 601 130% 98%
4550 2 S Sterling 47 36 12 48 777 745 -32 90% 15.85 571 131% 98%
4521 3 N Stoney Creek 49 39 7 46 853 790 -63 64% 16.12 629 126% 107%
4557 1 N Torrence Creek 26 35 0 35 483 514 31 18% 19.77 692 74% 74%
4435 1 N Trillium Springs Montessori PK-3 F 8 12 0 12 99 153 54 13% 19.13 230 67% 67%
4562 2 W-WM Tuckaseegee P 50 35 14 49 861 814 -47 81% 16.28 570 143% 102%
4566 3 NE - VA University Meadows 44.5 37 18 55 804 736 -68 71% 16.54 612 120% 81%
4565 2 E University Park F 28 34 0 34 404 481 77 81% 17.18 584 82% 82%
4318 2 W-WM Whitewater Academy 43.5 39 7 46 787 816 29 82% 18.76 732 112% 95%
4586 3 N Winding Springs 56.25 36 18 54 928 968 40 83% 17.21 620 156% 104%
4587 4 NE -GA Windsor Park 52 35 27 62 977 866 -111 85% 16.65 583 149% 84%
4588 2 S Winget Park 28 39 0 39 487 506 19 39% 18.07 705 72% 72%
4589 4 NE -GA Winterfield 45 34 14 48 768 785 17 90% 17.44 593 132% 94%
3,662.05 3,334 695 4,029 66,470 67,828 1,358 52% 18.52 110.6%95 Total Elementary
Planning Services; 2/15/16 Page 3 of 3

Capacity Utilization Chart 2015-2016 School YearSc
ho
ol N
um
be
r
CM
BE
Dis
tric
t
(20
11
)
Lear
nin
g
Co
mm
un
ity
Pre
-K -
8 a
nd
Mid
dle
Sch
oo
ls
Mag
ne
t (F
ull
or
Par
tial
)
To
tal C
R T
eac
he
rs
(Le
ss E
C R
eso
urc
e
Teac
he
rs)
Bu
ildin
g C
lass
roo
ms
(In
Co
re F
acili
ty)
Mo
bile
/Mo
du
lar
Cla
ssro
om
s
Co
re A
dju
ste
d
Teac
hin
g St
atio
ns
(Co
re C
R +
Mo
bile
s)
Tota
l 20
14
-20
15
Me
mb
ers
hip
, In
cl.
Pre
k
Tota
l 20
15
-20
16
Me
mb
ers
hip
, In
cl
Pre
k
Dif
fere
nce
20
14
/20
15
Me
mb
esh
ip
% E
DS
(20
13
-20
14
)
Rat
io (M
em
ber
ship
Tota
l/To
tal C
R T
each
ers)
Stu
de
nt
Bu
ildin
g C
R
Cap
acit
y (R
atio
x C
ore
Faci
lity
CR
)
Staf
f B
uild
ing
Uti
lizat
ion
(To
tal C
R
Teac
her
s/B
ldg
CR
in
Co
re)
Staf
f U
til.
To
tal A
dj.
CR
(To
tal C
R T
each
ers/
Ad
j. C
R N
o F
loat
)
5301 4 E Albemarle Road P 62.5 50 8 58 1198 1112 -86 87% 17.79 890 125% 108%
5305 1 N JM Alexander P 37.9 51 0 51 865 799 -66 41% 21.08 1075 74% 74%
5399 5 C Alexander Graham 73 65 0 65 1449 1428 -21 34% 19.56 1272 112% 112%
4311 2 LIFT Ashley Park Pre-K-8 36 28 10 38 616 650 34 92% 16.64 466 129% 95%
5313 1 N Bailey 72 57 8 65 1616 1557 -59 20% 21.63 1233 126% 111%
4319 2 W-WM Berryhill Pre-K-8 48.5 28 14 42 697 705 8 89% 13.90 389 173% 115%
5394 1 N Bradley 56 53 0 53 1140 1059 -81 33% 18.91 1002 106% 106%
4489 2 LIFT Bruns Avenue Pre-K-8 50.5 39 14 53 793 771 -22 91% 14.61 570 129% 95%
5333 5 C Carmel 55.5 54 0 54 1050 1039 -11 41% 18.72 1011 103% 103%
4344 5 S Collinswood K-8 F 43 23 24 47 752 758 6 52% 17.63 405 187% 91%
5345 6 S Community House 80 58 10 68 1750 1754 4 15% 21.93 1272 138% 118%
5351 1 W-WM Coulwood P 36.5 47 4 51 694 661 -33 79% 18.11 851 78% 72%
5353 6 E Crestdale 42 53 0 53 868 810 -58 23% 19.29 1022 79% 79%
4374 3 LIFT Druid Hills Pre-K-8 40 35 6 41 646 614 -32 97% 14.55 509 114% 98%
5532 2 S E. E. Waddell K-8 F 79.5 71 0 71 1405 1395 -10 30% 17.55 1246 112% 112%
5381 4 NE-GA Eastway 57.5 51 0 51 932 906 -26 91% 15.76 804 113% 113%
5434 2 S Kennedy P 44.5 45 0 45 722 764 42 64% 17.17 773 99% 99%
5428 3 NE-VA Martin 56.5 65 0 65 1113 1071 -42 78% 18.96 1232 87% 87%
5448 3 NE-VA Martin Luther King, Jr. 58.5 58 0 58 1102 1023 -79 78% 17.49 1014 101% 101%
5450 4 C McClintock P 55 54 0 54 855 926 71 82% 16.84 909 102% 102%
5455 6 E Mint Hill 62.5 50 11 61 1249 1158 -91 44% 18.53 926 125% 102%
4429 3 W-HA/POB Morehead K-8 F 62 53 4 57 1161 1094 -67 58% 17.65 935 117% 109%
5479 6 E Northeast 43.5 54 0 54 739 713 -26 67% 16.39 885 81% 81%
5481 3 E Northridge 42.5 40 2 42 779 719 -60 81% 16.92 677 106% 101%
4488 2 W-WM Oaklawn K-8 F 38 26 10 36 525 523 -2 75% 13.76 358 146% 106%
5497 3 C Piedmont F 48.2 42 0 42 991 1038 47 38% 21.54 904 115% 115%
5509 5 S Quail Hollow 47.5 57 1 58 946 907 -39 67% 19.09 1088 83% 82%
5513 5 C Randolph F 58.3 52 10 62 1181 1155 -26 43% 19.81 1030 112% 94%
5514 3 LIFT Ranson P 47 52 0 52 1138 934 -204 84% 19.87 1033 90% 90%
4517 2 W-HA/POB Reid Park Pre-K-8 57.5 35 17 52 891 857 -34 91% 14.10 494 164% 111%
5518 1 N Ridge Road 61.5 56 8 64 1285 1191 -94 49% 19.37 1084 110% 96%
5431 6 S Robinson 54 53 0 53 1101 1097 -4 12% 20.31 1077 102% 102%
5520 5 C Sedgefield 42 45 0 45 745 706 -39 85% 16.81 756 93% 93%
5537 6 S South Charlotte 39.5 40 0 40 856 868 12 16% 21.97 879 99% 99%
5538 2 S Southwest 71 56 5 61 1403 1382 -21 54% 19.46 1090 127% 116%
Facility Information Teachers Enrollment DataClassrooms
Planning Services; 2/15/16 Page 1 of 2
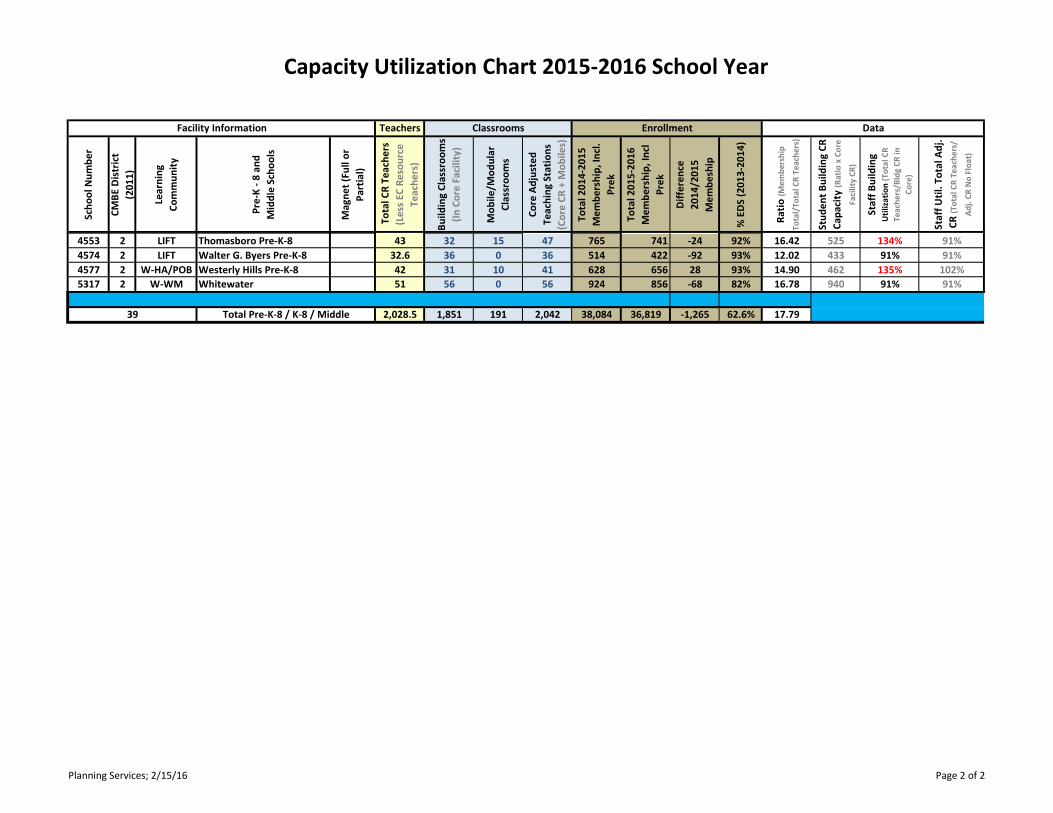
Capacity Utilization Chart 2015-2016 School YearSc
ho
ol N
um
be
r
CM
BE
Dis
tric
t
(20
11
)
Lear
nin
g
Co
mm
un
ity
Pre
-K -
8 a
nd
Mid
dle
Sch
oo
ls
Mag
ne
t (F
ull
or
Par
tial
)
To
tal C
R T
eac
he
rs
(Le
ss E
C R
eso
urc
e
Teac
he
rs)
Bu
ildin
g C
lass
roo
ms
(In
Co
re F
acili
ty)
Mo
bile
/Mo
du
lar
Cla
ssro
om
s
Co
re A
dju
ste
d
Teac
hin
g St
atio
ns
(Co
re C
R +
Mo
bile
s)
Tota
l 20
14
-20
15
Me
mb
ers
hip
, In
cl.
Pre
k
Tota
l 20
15
-20
16
Me
mb
ers
hip
, In
cl
Pre
k
Dif
fere
nce
20
14
/20
15
Me
mb
esh
ip
% E
DS
(20
13
-20
14
)
Rat
io (M
em
ber
ship
Tota
l/To
tal C
R T
each
ers)
Stu
de
nt
Bu
ildin
g C
R
Cap
acit
y (R
atio
x C
ore
Faci
lity
CR
)
Staf
f B
uild
ing
Uti
lizat
ion
(To
tal C
R
Teac
her
s/B
ldg
CR
in
Co
re)
Staf
f U
til.
To
tal A
dj.
CR
(To
tal C
R T
each
ers/
Ad
j. C
R N
o F
loat
)
Facility Information Teachers Enrollment DataClassrooms
4553 2 LIFT Thomasboro Pre-K-8 43 32 15 47 765 741 -24 92% 16.42 525 134% 91%
4574 2 LIFT Walter G. Byers Pre-K-8 32.6 36 0 36 514 422 -92 93% 12.02 433 91% 91%
4577 2 W-HA/POB Westerly Hills Pre-K-8 42 31 10 41 628 656 28 93% 14.90 462 135% 102%
5317 2 W-WM Whitewater 51 56 0 56 924 856 -68 82% 16.78 940 91% 91%
2,028.5 1,851 191 2,042 38,084 36,819 -1,265 62.6% 17.7939 Total Pre-K-8 / K-8 / Middle
Planning Services; 2/15/16 Page 2 of 2

Capacity Utilization Chart 2015-2016 School YearSc
ho
ol N
um
ber
CM
BE
Dis
tric
t
(20
11
)
Lear
nin
g
Co
mm
un
ity
K-1
2 a
nd
Hig
h
Sch
oo
ls
Mag
net
(Fu
ll o
r
Par
tial
)
To
tal C
R T
each
ers
(Les
s EC
Res
ou
rce
Teac
her
s)
Bu
ildin
g C
lass
roo
ms
(In
Co
re F
acili
ty)
Mo
bile
/Mo
du
lar
Cla
ssro
om
s
Co
re A
dju
sted
Teac
hin
g St
atio
ns
(Co
re C
R +
Mo
bile
s)
20
14
-20
15
20
th D
ay
Mem
ber
ship
20
15
-20
16
Act
ual
K-
12
Mem
ber
ship
Dif
fere
nce
20
14
/20
15
Mem
bes
hip
% E
DS
(20
13
-20
14
)
Rat
io (M
em
be
rsh
ip
Tota
l/To
tal C
R T
eac
he
rs)
Stu
den
t B
uild
ing
CR
Cap
acit
y (R
atio
X C
ore
Faci
lity
CR
)
Staf
f B
uild
ing
Uti
lizat
ion
(To
tal C
R
Teac
he
rs/B
ldg
CR
in
Co
re)
Staf
f U
til.
To
tal A
dj.
CR
(To
tal C
R T
eac
he
rs/
Ad
j. C
R N
o F
loat
)
7302 6 S Ardrey Kell 134.5 96 9 105 2701 2879 178 11% 20.94 2011 140% 128%
7496 2 W-HA/POB Berry Academy F 96.0 87 0 87 1714 1661 -53 66% 17.75 1544 110% 110%
7361 6 E Butler 110.5 98 0 98 2081 2135 54 43% 19.07 1869 113% 113%
5341 4 NE-GA Cochrane Collegiate Acad P 49.5 49 0 49 702 744 42 89% 15.11 740 101% 101%
7377 4 C East Mecklenburg P 108.5 90 21 111 1840 1864 24 61% 17.70 1593 121% 98%
7397 3 NE-GA Garinger 115.0 89 27 116 1748 1904 156 87% 16.73 1489 129% 99%
7405 2 W-HA/POB Harding P 97.5 78 17 95 1747 1632 -115 81% 18.52 1445 125% 103%
7386 4 E Hawthorne F 16.3 37 0 37 135 142 7 n/a 11.08 410 44% 44%
7415 1 N Hopewell 88.5 100 0 100 1653 1669 16 45% 18.62 1862 89% 89%
7312 1 N Hough 120.5 100 5 105 2453 2576 123 18% 21.38 2138 121% 115%
7426 6 E Independence 133.0 100 17 117 2349 2494 145 55% 18.90 1890 133% 114%
7445 1 N Mallard Creek 124.8 98 0 98 2472 2520 48 44% 20.68 2027 127% 127%
7364 2 C Marie G Davis K-12 F 50.0 67 20 87 642 713 71 79% 13.24 887 75% 57%
7466 5 C Myers Park P 146.0 127 21 148 2762 2865 103 31% 19.04 2418 115% 99%
7480 1 N North Mecklenburg P 106.0 108 2 110 1881 2022 141 59% 19.02 2054 98% 96%
8482 2 E Northwest 6-12 F 61.2 50 4 54 1019 1017 -2 41% 16.65 833 122% 113%
7490 2 S Olympic 137.0 90 34 124 2434 2472 38 52% 18.89 1700 152% 110%
7508 5 S Providence 98.0 88 6 94 1991 1994 3 10% 20.37 1792 111% 104%
7457 6 E Rocky River 91.5 100 0 100 1710 1697 -13 67% 18.49 1849 92% 92%
7535 5 S South Mecklenburg P 153.5 108 21 129 2913 2924 11 45% 19.87 2146 142% 119%
7592 3 NE-VA Vance 105.5 91 0 91 1714 1713 -1 79% 16.95 1542 116% 116%
7576 2 LIFT West Charlotte P 90.5 96 20 116 1777 1673 -104 86% 20.84 2001 94% 78%
7579 2 W-WM West Mecklenburg P 114.5 102 11 113 2040 2049 9 78% 18.44 1881 112% 101%
2,348.3 2,049 235 2,284 42,478 43,359 881 56% 18.19
Enrollment
23 Total K-12 / 6-12 / High
Facility Information Teachers Classrooms Data
Planning Services; 2/15/16 Page 1 of 1