Quarterly Report on Bank Trading and Derivatives Activities...Quarterly Report on Bank Trading and...
49
Quarterly Report on Bank Trading and Derivatives Activities Second Quarter 2018 Office of the Comptroller of the Currency Washington, D.C. September 2018
Transcript of Quarterly Report on Bank Trading and Derivatives Activities...Quarterly Report on Bank Trading and...
Quarterly Report on Bank Trading and Derivatives Activities
Second Quarter 2018
Office of the Comptroller of the Currency Washington, D.C.
September 2018
Quarterly Report on Bank Trading and Derivatives Activities, Second Quarter 2018
- 2 -
Contents
About This Report ......................................................................................................... 3
Executive Summary ...................................................................................................... 3
Revenue ......................................................................................................................... 4
Insured U.S. Commercial Banks and Savings Associations’ Trading Revenue ........... 4
Holding Company Trading Revenue ............................................................................ 4
Bank Trading Revenue as a Percentage of Consolidated Holding Company Trading Revenue ...................................................................................................................... 4
Counterparty Credit Risk .............................................................................................. 6
Market Risk .................................................................................................................. 11
Value-at-Risk ............................................................................................................. 11
Level 3 Trading Assets .............................................................................................. 12
Credit Derivatives ...................................................................................................... 13
Notional Amounts ...................................................................................................... 13
Compression Activity ................................................................................................. 14
Glossary of Terms ....................................................................................................... 16
Index of Tables and Figures ....................................................................................... 18
Appendix: Supplementary Graphs and Tables ......................................................... 19
Quarterly Report on Bank Trading and Derivatives Activities, Second Quarter 2018
- 3 -
About This Report
The Office of the Comptroller of the Currency’s (OCC) quarterly report on bank trading and derivatives activities is based on call report information provided by all insured U.S. commercial banks (including trust companies) and savings associations; reports filed by U.S. financial holding companies; and other published data. A total of 1,3581 insured U.S. commercial banks and savings associations reported trading and derivatives activities at the end of the second quarter of 2018. A small group of large financial institutions continues to dominate trading and derivatives activity in the U.S. commercial banking system. During the second quarter of 2018, four large commercial banks represented 89.9 percent of the total banking industry notional amounts and 84.6 percent of industry net current credit exposure (NCCE) (see table 4 in the appendix).
The OCC and other supervisors have dedicated examiners at the largest banks to continuously evaluate the credit, market, operational, reputation, and compliance risks of bank trading and derivatives activities. In addition to the OCC’s supervisory activities, the OCC works with other financial supervisors and major market participants to address infrastructure, clearing, and margining issues in over-the-counter (OTC) derivatives. OCC activities include development of objectives and milestones for stronger trade processing and improved market transparency across derivative categories, migration of certain highly liquid products to clearinghouses, and requirements for posting and collecting margin.
This is the 91st edition of the OCC’s Quarterly Report on Bank Trading and Derivatives Activities. The first report was published in 1995. In our continuous efforts to improve this report, we now incorporate an entity’s Legal Entity Identifier (LEI), if available, in the supplementary tables in the appendix. Please send any comments or feedback on the structure and content of this report to the OCC by email: [email protected].
Executive Summary
Insured U.S. commercial banks and savings associations (collectively, banks) reported trading revenue of $6.9 billion in the second quarter of 2018, $1.3 billion less (16.2 percent) than in the previous quarter and $0.2 billion more (3.5 percent) than a year earlier (see page 4).
Credit exposure from derivatives decreased in the second quarter of 2018 compared with the first quarter of 2018. NCCE decreased $0.4 billion, or 0.1 percent, to $361.7 billion (see page 8).
Trading risk, as measured by daily value-at-risk (VaR), decreased in the second quarter of 2018. Total VaR2 across the top five dealer banking companies decreased $42.0 million, or 13.6 percent, to $267 million (see page 11).
Derivative notional amounts increased in the second quarter of 2018 by $3.4 trillion, or 1.7 percent, to $207.2 trillion (see page 14).
Derivative contracts remained concentrated in interest rate products, which represented 76.0 percent of total derivative notional amounts (see page 14).
1 Beginning March 31, 2017, institutions with total assets of less than $1 billion have the option to file the FFIEC 051 call report. Due to the limited amount of derivatives data provided by FFIEC 051 call report filers, this report provides this information separately and distinctly in table 13 in the appendix.
2 Average daily VaR as reported by the firms 10Q and 10K U.S. Securities and Exchange Commission Reports.
Quarterly Report on Bank Trading and Derivatives Activities, Second Quarter 2018
- 4 -
Revenue
Insured U.S. Commercial Banks and Savings Associations’ Trading Revenue
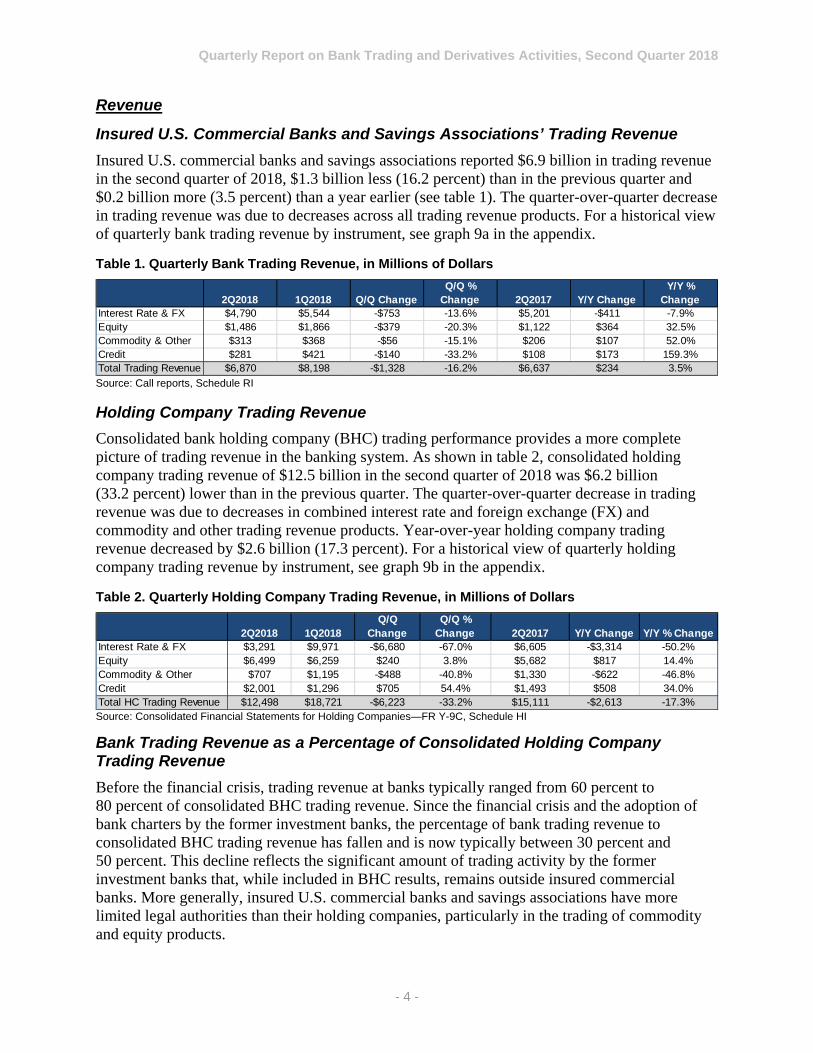
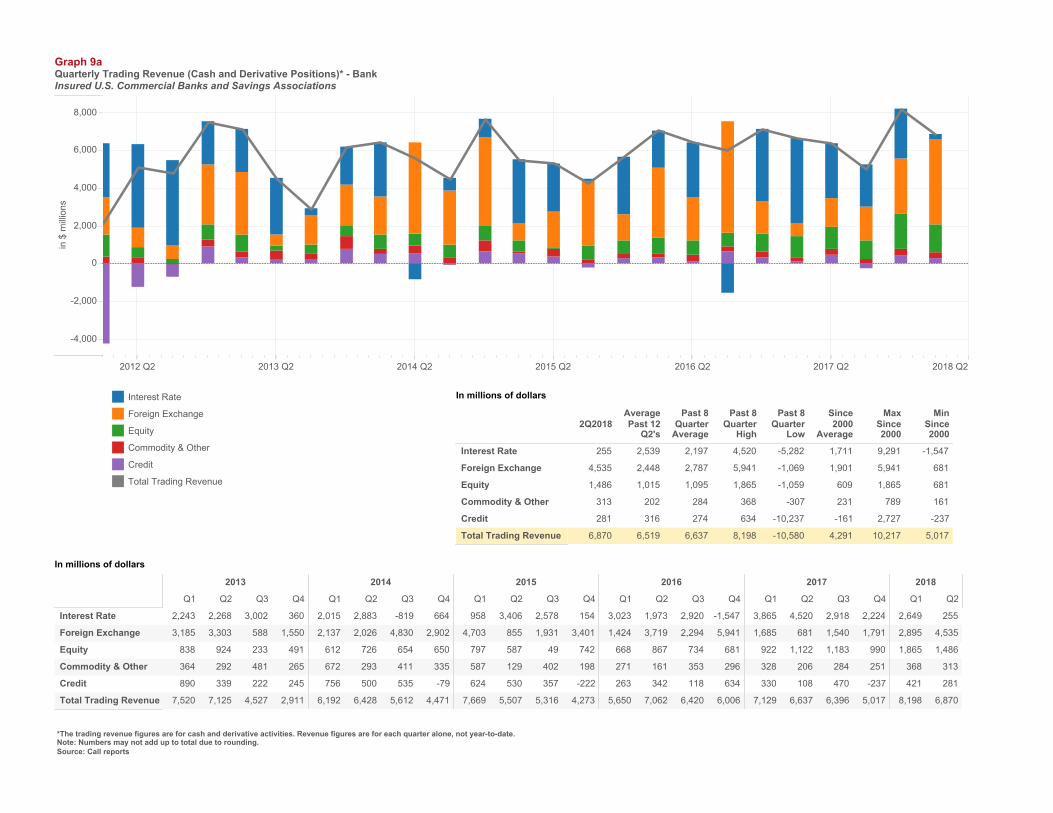
Insured U.S. commercial banks and savings associations reported $6.9 billion in trading revenue in the second quarter of 2018, $1.3 billion less (16.2 percent) than in the previous quarter and $0.2 billion more (3.5 percent) than a year earlier (see table 1). The quarter-over-quarter decrease in trading revenue was due to decreases across all trading revenue products. For a historical view of quarterly bank trading revenue by instrument, see graph 9a in the appendix.
Table 1. Quarterly Bank Trading Revenue, in Millions of Dollars
Source: Call reports, Schedule RI
Holding Company Trading Revenue
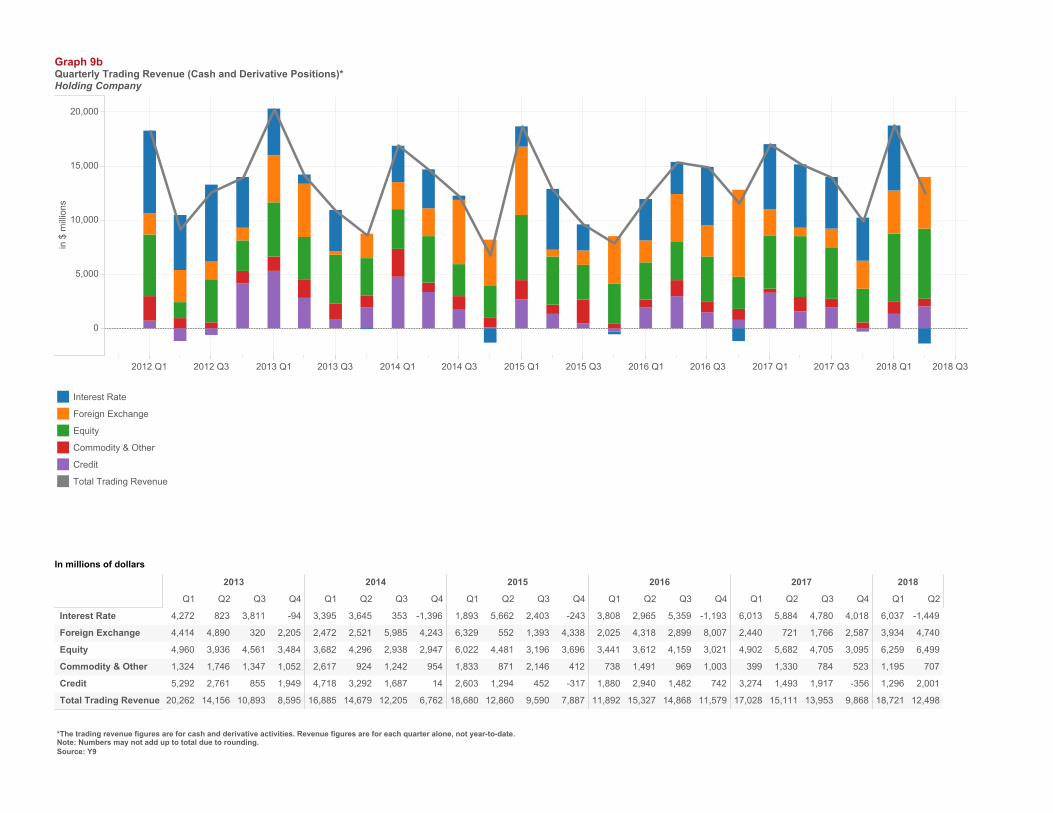
Consolidated bank holding company (BHC) trading performance provides a more complete picture of trading revenue in the banking system. As shown in table 2, consolidated holding company trading revenue of $12.5 billion in the second quarter of 2018 was $6.2 billion (33.2 percent) lower than in the previous quarter. The quarter-over-quarter decrease in trading revenue was due to decreases in combined interest rate and foreign exchange (FX) and commodity and other trading revenue products. Year-over-year holding company trading revenue decreased by $2.6 billion (17.3 percent). For a historical view of quarterly holding company trading revenue by instrument, see graph 9b in the appendix.
Table 2. Quarterly Holding Company Trading Revenue, in Millions of Dollars
Source: Consolidated Financial Statements for Holding Companies—FR Y-9C, Schedule HI
Bank Trading Revenue as a Percentage of Consolidated Holding Company Trading Revenue
Before the financial crisis, trading revenue at banks typically ranged from 60 percent to 80 percent of consolidated BHC trading revenue. Since the financial crisis and the adoption of bank charters by the former investment banks, the percentage of bank trading revenue to consolidated BHC trading revenue has fallen and is now typically between 30 percent and 50 percent. This decline reflects the significant amount of trading activity by the former investment banks that, while included in BHC results, remains outside insured commercial banks. More generally, insured U.S. commercial banks and savings associations have more limited legal authorities than their holding companies, particularly in the trading of commodity and equity products.
2Q2018 1Q2018 Q/Q ChangeQ/Q %
Change 2Q2017 Y/Y ChangeY/Y %
ChangeInterest Rate & FX $4,790 $5,544 -$753 -13.6% $5,201 -$411 -7.9%Equity $1,486 $1,866 -$379 -20.3% $1,122 $364 32.5%Commodity & Other $313 $368 -$56 -15.1% $206 $107 52.0%Credit $281 $421 -$140 -33.2% $108 $173 159.3%Total Trading Revenue $6,870 $8,198 -$1,328 -16.2% $6,637 $234 3.5%
2Q2018 1Q2018Q/Q
ChangeQ/Q %
Change 2Q2017 Y/Y Change Y/Y % ChangeInterest Rate & FX $3,291 $9,971 -$6,680 -67.0% $6,605 -$3,314 -50.2%Equity $6,499 $6,259 $240 3.8% $5,682 $817 14.4%Commodity & Other $707 $1,195 -$488 -40.8% $1,330 -$622 -46.8%Credit $2,001 $1,296 $705 54.4% $1,493 $508 34.0%Total HC Trading Revenue $12,498 $18,721 -$6,223 -33.2% $15,111 -$2,613 -17.3%

Quarterly Report on Bank Trading and Derivatives Activities, Second Quarter 2018
- 5 -
In the second quarter of 2018, banks generated 55.0 percent of consolidated holding company trading revenue, up from 43.8 percent in the previous quarter (see figure 1).
Figure 1. Bank Trading Revenue as a Percentage of Consolidated Holding Company Trading Revenue
Source: Consolidated Financial Statements for Holding Companies—FR Y-9C (Schedule HI) and call report (Schedule RI)

Quarterly Report on Bank Trading and Derivatives Activities, Second Quarter 2018
- 6 -
Counterparty Credit Risk
Counterparty credit risk is a significant risk in bank derivative trading activities. The notional amount of a derivative contract is a reference amount that determines contractual payments, but it is generally not an amount at risk. The credit risk in a derivative contract is a function of a number of variables, such as whether counterparties exchange notional principal, the volatility of the underlying market factors (interest rate, currency, commodity, equity, or corporate reference entity), the maturity and liquidity of the contract, and the creditworthiness of the counterparty.
Credit risk in derivatives differs from credit risk in loans because of the more uncertain nature of the potential credit exposure. Because the credit exposure is a function of movements in market factors, banks do not know, and can only estimate, how much the value of the derivative contract might be at various points in the future.
The credit exposure is bilateral in most derivative transactions, such as swaps (which make up the bulk of bank derivative contracts). Each party to the contract may (and, if the contract has a long enough tenor, probably will) have a credit exposure to the other party at various times during the contract’s life. With a funded traditional loan, the amount at risk is the amount advanced to the borrower. The credit risk is unilateral as the bank faces the credit exposure of the borrower.
Measuring credit exposure in derivative contracts involves identifying those contracts on which a bank would lose value if the counterparty to a contract defaulted. The total of all contracts with positive value (i.e., derivative receivables) to the bank is the gross positive fair value (GPFV) and represents an initial measurement of credit exposure. The total of all contracts with negative value (i.e., derivative payables) to the bank is the gross negative fair value (GNFV) and represents a measurement of the exposure the bank poses to its counterparties.
GPFV increased by $38.7 billion (2.1 percent) in the second quarter of 2018 to $1.9 trillion, driven by a $114.7 billion (25.3 percent) increase in receivables from FX contracts offset by a $74 billion (6.5 percent) decrease in receivables from interest rate contracts (see table 3).
Because banks mostly hedge the market risk of their derivative portfolios with other derivatives, a similar increase in GNFVs generally matched the change in GPFV. Derivative payables, GNFV, increased $43.3 billion (2.5 percent) to $1.8 trillion during the quarter, driven by a $118.7 billion (27.9 percent) increase in payables on FX contracts offset by a $71.8 billion (6.6 percent) decrease in interest rate contracts.
GPFV and GNFV interest rate contracts declined 35.2 percent and 35.5 percent, respectively year-over-year. Part of the decline is a result of the continued implementation of settled-to-market (STM) treatment for variation margin. STM allows for the characterization of variation margin for OTC derivatives that are cleared through central clearing parties (CCP) to constitute a settlement of the exposure, as opposed to collateralization.

Quarterly Report on Bank Trading and Derivatives Activities, Second Quarter 2018
- 7 -
Table 3. Gross Positive Fair Values and Gross Negative Fair Values, in Billions of Dollars
Source: Call reports, Schedule RC-L
A legally enforceable netting agreement between a bank and a counterparty creates a single legal obligation for all transactions (called a “netting set”) under the agreement. Therefore, when banks have such agreements with their counterparties, contracts with negative values (an amount a bank would pay to its counterparty) can offset contracts with positive values (an amount owed by the counterparty to the bank), leaving an NCCE as shown in table 4.
Table 4. Netting Contract Examples
Bank A Portfolio With Counterparty B Number of Contracts
Value of Contracts
Credit Measure/Metric
Contracts With Positive Value to Bank A 6 $500 Gross Positive Fair Value
Contracts With Negative Value to Bank A 4 -$350 Gross Negative Fair Value
Total Contracts 10 $150 NCCE to Bank A From Counterparty B
Most, but not necessarily all, derivative transactions that a bank has with an individual counterparty are subject to a legally enforceable netting agreement. Some transactions may be subject to the laws of a jurisdiction that does not provide legal certainty of netting agreements, in which case banks must regard such transactions as separate from the netting set. Other transactions may involve nonstandard contractual documentation. Transactions that are not subject to the same legally enforceable netting agreement have distinct values that cannot be netted and for which the appropriate current credit measure is the gross exposure to the bank, if that amount is positive. While banks can net exposures within a netting set under the same netting agreement, they cannot net exposures across netting sets without a separate legally enforceable netting agreement. As a result, a bank’s NCCE to a particular counterparty equals the sum of the GPFV of contracts less the dollar amount of netting benefits with that counterparty. A bank’s NCCE across all counterparties equals the sum of its NCCE to each of its counterparties.
2Q2018 1Q2018 Q/Q ChangeQ/Q %
Change 2Q2017 Y/Y ChangeY/Y %
ChangeInterest Rate $1,058 $1,132 -$74 -6.5% $1,634 -$576 -35.2%Foreign Exchange $569 $454 $115 25.3% $515 $54 10.5%Equity $123 $125 -$2 -1.6% $97 $26 26.4%Commodities $50 $44 $5 12.3% $42 $8 18.3%Credit $53 $59 -$6 -9.8% $69 -$16 -23.2%Gross Positive Fair Value $1,852 $1,814 $39 2.1% $2,357 -$504 -21.4%
2Q2018 1Q2018 Q/Q ChangeQ/Q %
Change 2Q2017 Y/Y ChangeY/Y %
ChangeInterest Rate $1,009 $1,081 -$72 -6.6% $1,565 -$556 -35.5%Foreign Exchange $545 $426 $119 27.9% $515 $30 5.7%Equity $118 $118 $0 -0.3% $102 $16 15.4%Commodities $48 $45 $3 7.5% $43 $5 12.0%Credit $53 $60 -$7 -11.1% $69 -$16 -23.4%Gross Negative Fair Value $1,773 $1,730 $43 2.5% $2,295 -$522 -22.7%
Quarterly Report on Bank Trading and Derivatives Activities, Second Quarter 2018
- 8 -
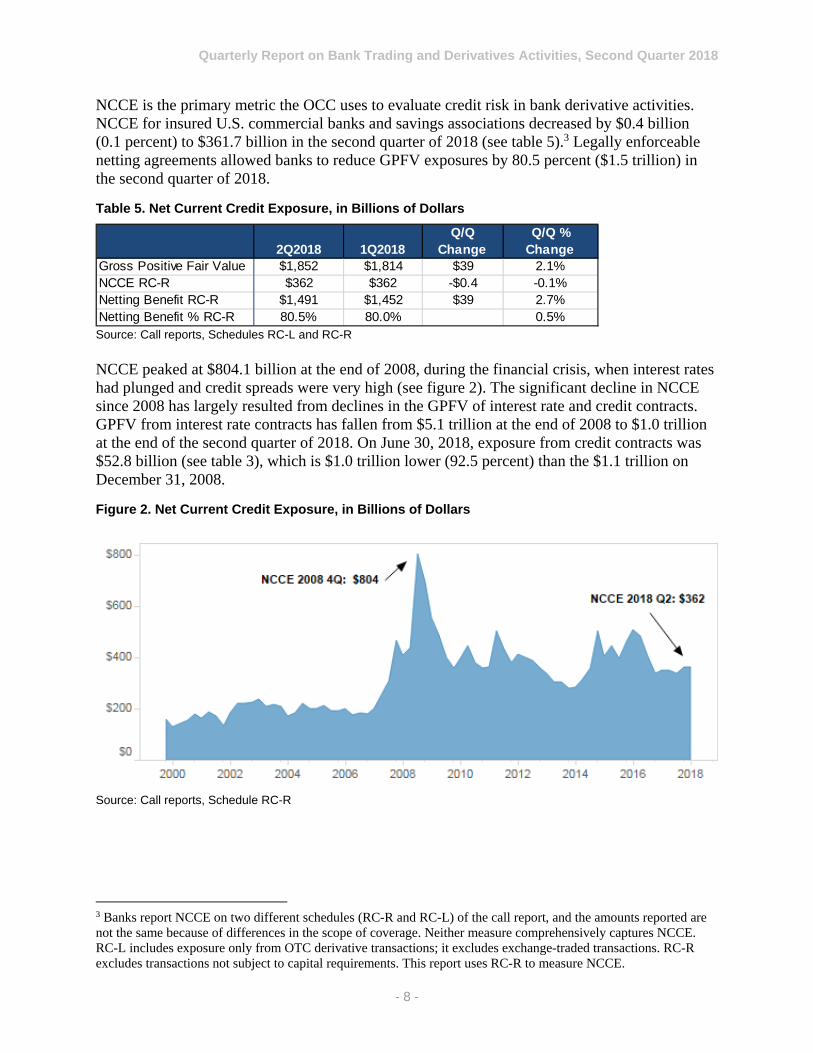
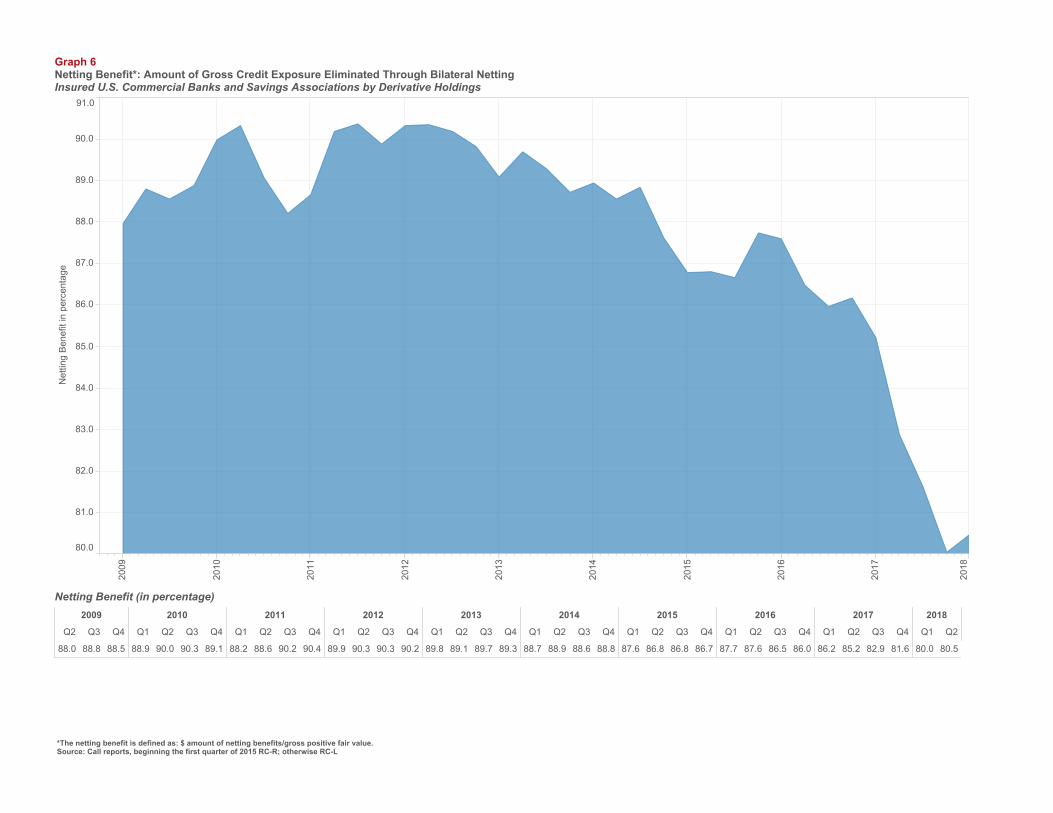
NCCE is the primary metric the OCC uses to evaluate credit risk in bank derivative activities. NCCE for insured U.S. commercial banks and savings associations decreased by $0.4 billion (0.1 percent) to $361.7 billion in the second quarter of 2018 (see table 5).3 Legally enforceable netting agreements allowed banks to reduce GPFV exposures by 80.5 percent ($1.5 trillion) in the second quarter of 2018.
Table 5. Net Current Credit Exposure, in Billions of Dollars
Source: Call reports, Schedules RC-L and RC-R NCCE peaked at $804.1 billion at the end of 2008, during the financial crisis, when interest rates had plunged and credit spreads were very high (see figure 2). The significant decline in NCCE since 2008 has largely resulted from declines in the GPFV of interest rate and credit contracts. GPFV from interest rate contracts has fallen from $5.1 trillion at the end of 2008 to $1.0 trillion at the end of the second quarter of 2018. On June 30, 2018, exposure from credit contracts was $52.8 billion (see table 3), which is $1.0 trillion lower (92.5 percent) than the $1.1 trillion on December 31, 2008.
Figure 2. Net Current Credit Exposure, in Billions of Dollars
Source: Call reports, Schedule RC-R
3 Banks report NCCE on two different schedules (RC-R and RC-L) of the call report, and the amounts reported are not the same because of differences in the scope of coverage. Neither measure comprehensively captures NCCE. RC-L includes exposure only from OTC derivative transactions; it excludes exchange-traded transactions. RC-R excludes transactions not subject to capital requirements. This report uses RC-R to measure NCCE.
2Q2018 1Q2018Q/Q
ChangeQ/Q %
ChangeGross Positive Fair Value $1,852 $1,814 $39 2.1%NCCE RC-R $362 $362 -$0.4 -0.1%Netting Benefit RC-R $1,491 $1,452 $39 2.7%Netting Benefit % RC-R 80.5% 80.0% 0.5%

Quarterly Report on Bank Trading and Derivatives Activities, Second Quarter 2018
- 9 -
The bulk of NCCE in the financial system is concentrated in banks and securities firms (39.7 percent) and in corporations and other counterparties (46.0 percent) (see table 6). The combined exposure to hedge funds and sovereign governments was small (14.3 percent in total).
Table 6. Net Current Credit Exposure by Counterparty Type as a Percentage of Total Net Current Credit Exposure
Source: Call reports (FFIEC 031), Schedule RC-L
A more risk-sensitive measure of credit exposure would consider the value of collateral held against counterparty exposures. Reporting banks held collateral valued at 109.7 percent of their total NCCE at the end of the second quarter of 2018, down from 111.0 percent in the first quarter of 2018 (see table 7). Collateral held against hedge fund exposures increased in the second quarter. Coverage remains very high at 340.3 percent. Bank exposures to hedge funds are secured, because banks take initial margin on transactions with hedge funds, in addition to fully securing any current credit exposure. Collateral coverage of corporate and sovereign exposures is much less than coverage of financial institutions and hedge funds, although coverage of corporate exposures has been increasing over the past several years because of increases in the volume of trades cleared at central counterparties.
Table 7. Ratio of Fair Value Collateral to Net Current Credit Exposure
Source: Call reports (FFIEC 031), Schedule RC-L
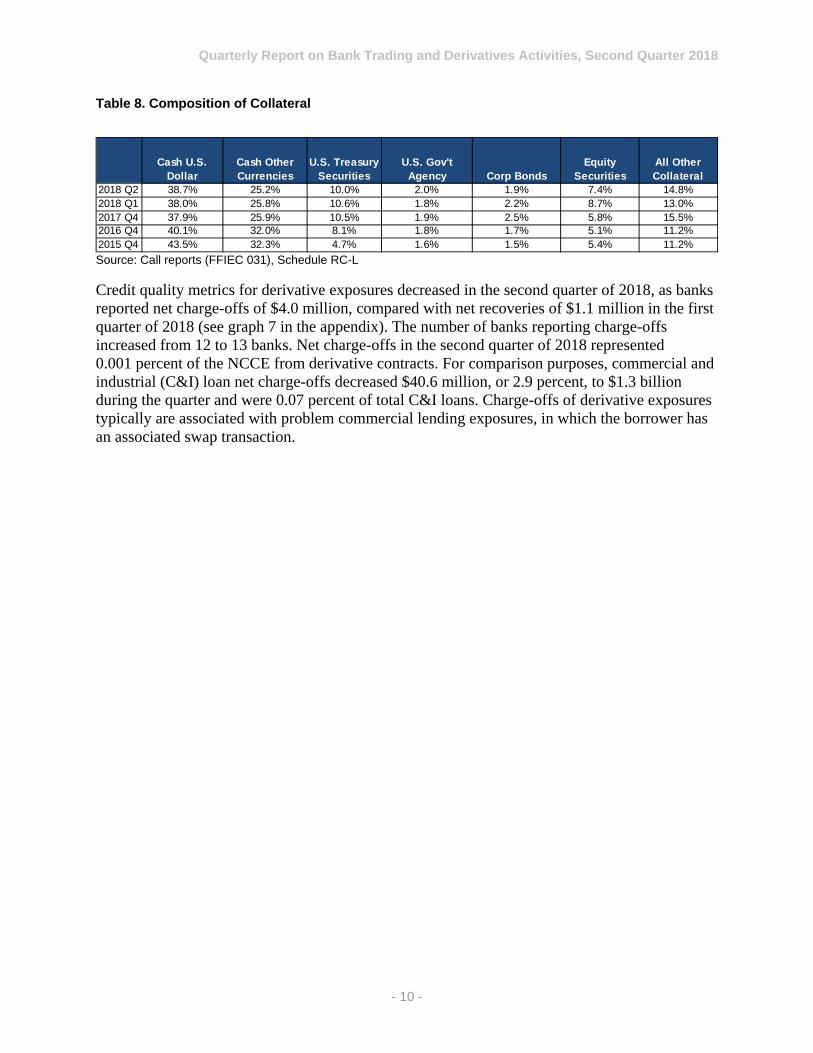
Collateral quality held by banks was very high and liquid during the quarter, with 63.9 percent held in cash (both U.S. dollar and non-dollar) and an additional 12.0 percent held in U.S. Treasuries and government agency securities (see table 8). Supervisors assess changes in the quality of collateral held as a key early indicator of potential easing in credit terms. Examiners review the collateral management practices of derivative dealers as a regular part of their supervision activities.
Banks & Securities
Firms Hedge FundsSovereign
GovernmentsCorp & All Other Counterparties
2018 Q2 39.7% 4.7% 9.6% 46.0%2018 Q1 39.7% 5.4% 7.5% 47.3%2017 Q4 41.7% 3.1% 8.0% 47.2%2016 Q4 48.3% 2.0% 6.6% 43.1%2015 Q4 53.2% 2.1% 6.1% 38.5%
FV Banks & Securities
FirmsFV Hedge
FundsFV Sovereign Governments
FV Corp and All Other
Counterparties FV/NCCE%2018 Q2 130.2% 340.3% 42.0% 82.4% 109.7%2018 Q1 125.0% 337.1% 23.3% 87.4% 111.0%2017 Q4 124.8% 496.4% 25.1% 87.4% 110.5%2016 Q4 118.8% 493.1% 34.2% 65.1% 97.4%2015 Q4 101.6% 437.0% 15.5% 64.9% 89.1%
Quarterly Report on Bank Trading and Derivatives Activities, Second Quarter 2018
- 10 -
Table 8. Composition of Collateral
Source: Call reports (FFIEC 031), Schedule RC-L
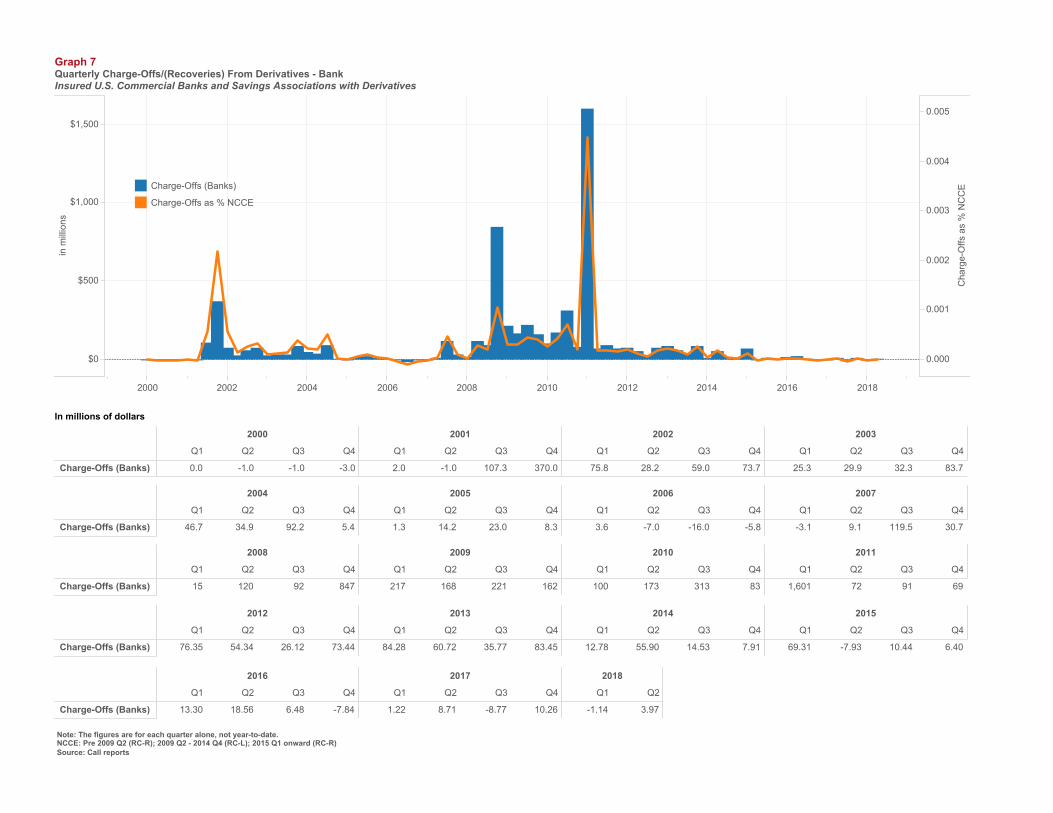
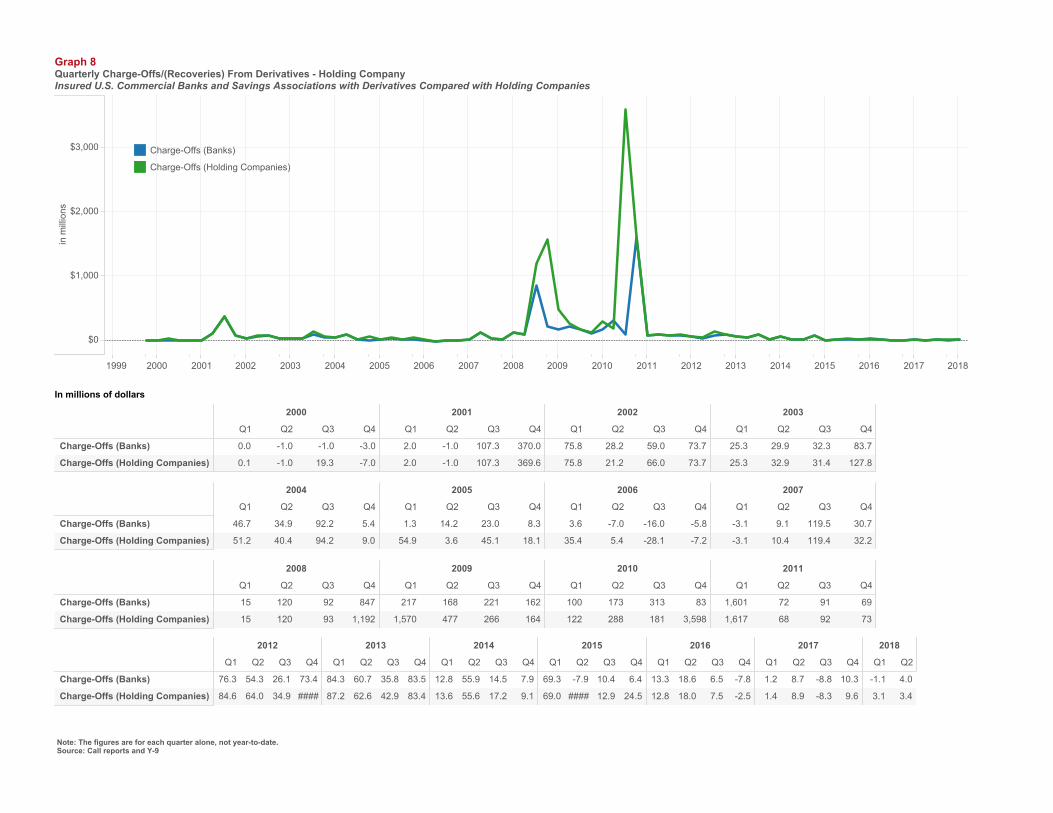
Credit quality metrics for derivative exposures decreased in the second quarter of 2018, as banks reported net charge-offs of $4.0 million, compared with net recoveries of $1.1 million in the first quarter of 2018 (see graph 7 in the appendix). The number of banks reporting charge-offs increased from 12 to 13 banks. Net charge-offs in the second quarter of 2018 represented 0.001 percent of the NCCE from derivative contracts. For comparison purposes, commercial and industrial (C&I) loan net charge-offs decreased $40.6 million, or 2.9 percent, to $1.3 billion during the quarter and were 0.07 percent of total C&I loans. Charge-offs of derivative exposures typically are associated with problem commercial lending exposures, in which the borrower has an associated swap transaction.
Cash U.S. Dollar
Cash Other Currencies
U.S. Treasury Securities
U.S. Gov't Agency Corp Bonds
Equity Securities
All Other Collateral
2018 Q2 38.7% 25.2% 10.0% 2.0% 1.9% 7.4% 14.8%2018 Q1 38.0% 25.8% 10.6% 1.8% 2.2% 8.7% 13.0%2017 Q4 37.9% 25.9% 10.5% 1.9% 2.5% 5.8% 15.5%2016 Q4 40.1% 32.0% 8.1% 1.8% 1.7% 5.1% 11.2%2015 Q4 43.5% 32.3% 4.7% 1.6% 1.5% 5.4% 11.2%
Quarterly Report on Bank Trading and Derivatives Activities, Second Quarter 2018
- 11 -
Market Risk
Value-at-Risk
Banks primarily control market risk in trading operations by establishing limits against potential losses. Banks use VaR to quantify the maximum expected loss over a specified time period and at a certain confidence level under relevant market conditions. Since VaR does not measure the maximum potential loss, banks stress test trading portfolios to assess the potential for loss beyond the VaR measure. Banks and supervisors have been working to expand the use of stress testing to complement the VaR risk measurement process that banks typically use to assess a bank’s exposure to market risk.
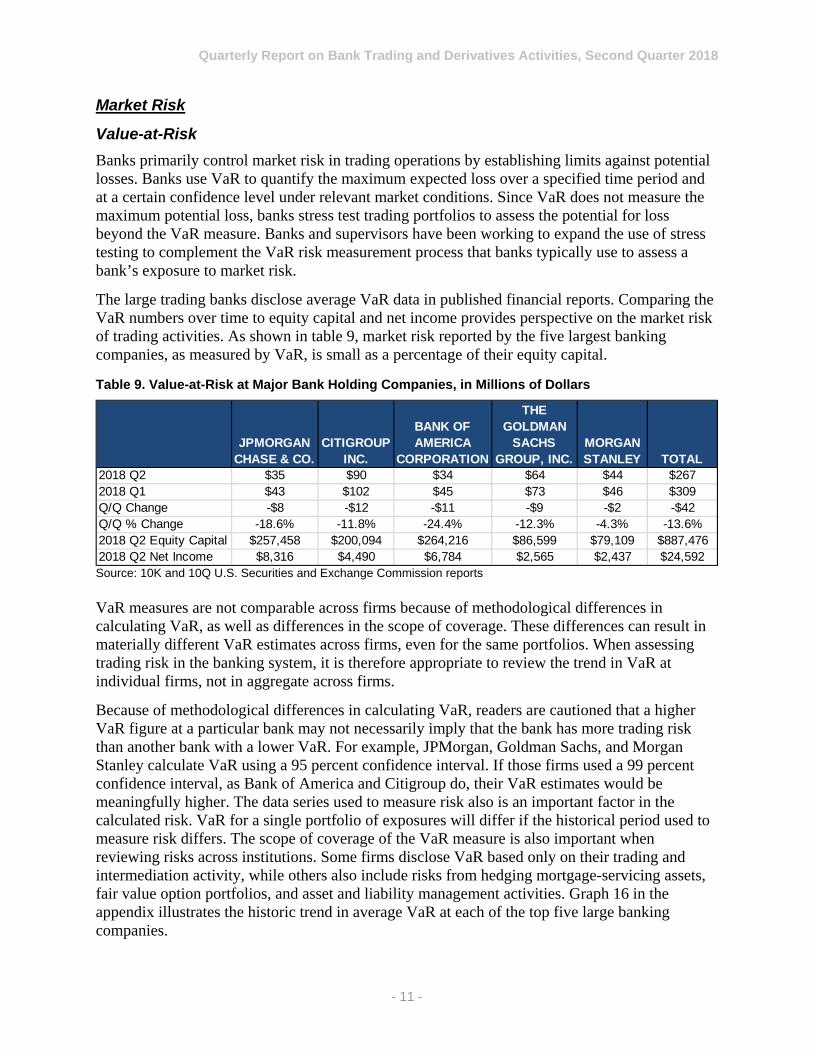
The large trading banks disclose average VaR data in published financial reports. Comparing the VaR numbers over time to equity capital and net income provides perspective on the market risk of trading activities. As shown in table 9, market risk reported by the five largest banking companies, as measured by VaR, is small as a percentage of their equity capital.
Table 9. Value-at-Risk at Major Bank Holding Companies, in Millions of Dollars
Source: 10K and 10Q U.S. Securities and Exchange Commission reports VaR measures are not comparable across firms because of methodological differences in calculating VaR, as well as differences in the scope of coverage. These differences can result in materially different VaR estimates across firms, even for the same portfolios. When assessing trading risk in the banking system, it is therefore appropriate to review the trend in VaR at individual firms, not in aggregate across firms.
Because of methodological differences in calculating VaR, readers are cautioned that a higher VaR figure at a particular bank may not necessarily imply that the bank has more trading risk than another bank with a lower VaR. For example, JPMorgan, Goldman Sachs, and Morgan Stanley calculate VaR using a 95 percent confidence interval. If those firms used a 99 percent confidence interval, as Bank of America and Citigroup do, their VaR estimates would be meaningfully higher. The data series used to measure risk also is an important factor in the calculated risk. VaR for a single portfolio of exposures will differ if the historical period used to measure risk differs. The scope of coverage of the VaR measure is also important when reviewing risks across institutions. Some firms disclose VaR based only on their trading and intermediation activity, while others also include risks from hedging mortgage-servicing assets, fair value option portfolios, and asset and liability management activities. Graph 16 in the appendix illustrates the historic trend in average VaR at each of the top five large banking companies.
JPMORGAN CHASE & CO.
CITIGROUP INC.
BANK OF AMERICA
CORPORATION
THE GOLDMAN
SACHS GROUP, INC.
MORGAN STANLEY TOTAL
2018 Q2 $35 $90 $34 $64 $44 $2672018 Q1 $43 $102 $45 $73 $46 $309Q/Q Change -$8 -$12 -$11 -$9 -$2 -$42Q/Q % Change -18.6% -11.8% -24.4% -12.3% -4.3% -13.6%2018 Q2 Equity Capital $257,458 $200,094 $264,216 $86,599 $79,109 $887,4762018 Q2 Net Income $8,316 $4,490 $6,784 $2,565 $2,437 $24,592
Quarterly Report on Bank Trading and Derivatives Activities, Second Quarter 2018
- 12 -
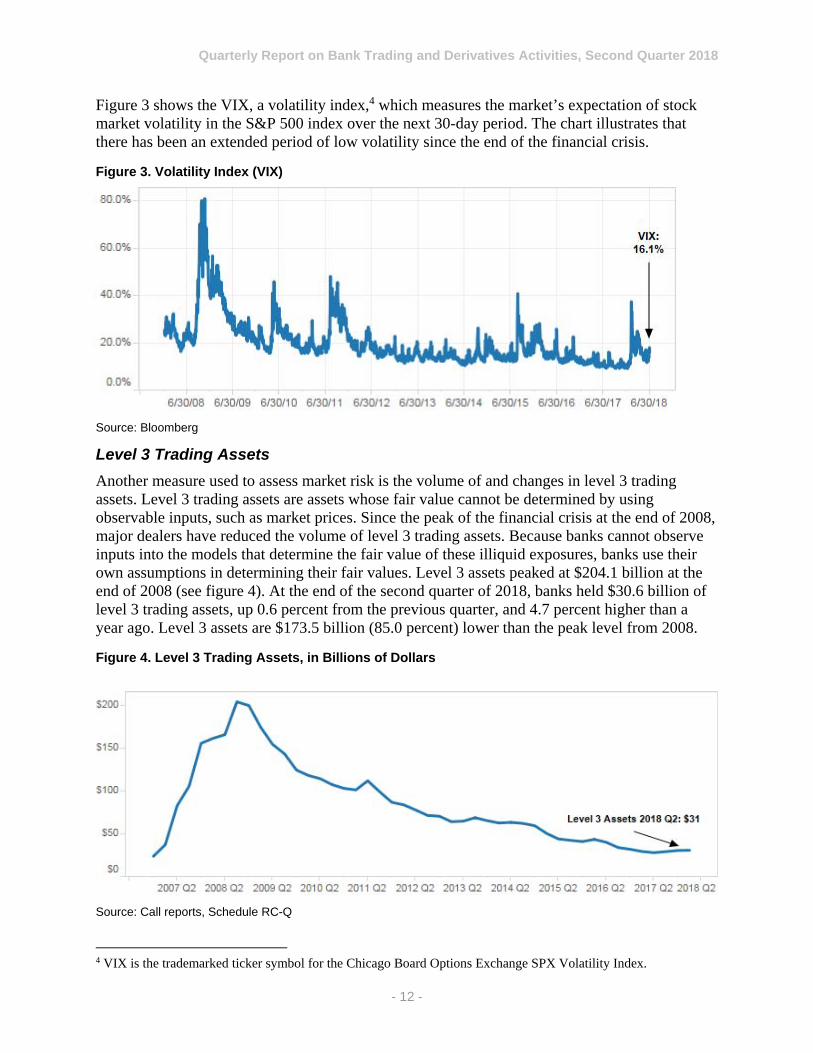
Figure 3 shows the VIX, a volatility index,4 which measures the market’s expectation of stock market volatility in the S&P 500 index over the next 30-day period. The chart illustrates that there has been an extended period of low volatility since the end of the financial crisis.
Figure 3. Volatility Index (VIX)
Source: Bloomberg
Level 3 Trading Assets
Another measure used to assess market risk is the volume of and changes in level 3 trading assets. Level 3 trading assets are assets whose fair value cannot be determined by using observable inputs, such as market prices. Since the peak of the financial crisis at the end of 2008, major dealers have reduced the volume of level 3 trading assets. Because banks cannot observe inputs into the models that determine the fair value of these illiquid exposures, banks use their own assumptions in determining their fair values. Level 3 assets peaked at $204.1 billion at the end of 2008 (see figure 4). At the end of the second quarter of 2018, banks held $30.6 billion of level 3 trading assets, up 0.6 percent from the previous quarter, and 4.7 percent higher than a year ago. Level 3 assets are $173.5 billion (85.0 percent) lower than the peak level from 2008.
Figure 4. Level 3 Trading Assets, in Billions of Dollars
Source: Call reports, Schedule RC-Q
4 VIX is the trademarked ticker symbol for the Chicago Board Options Exchange SPX Volatility Index.
Quarterly Report on Bank Trading and Derivatives Activities, Second Quarter 2018
- 13 -
Credit Derivatives
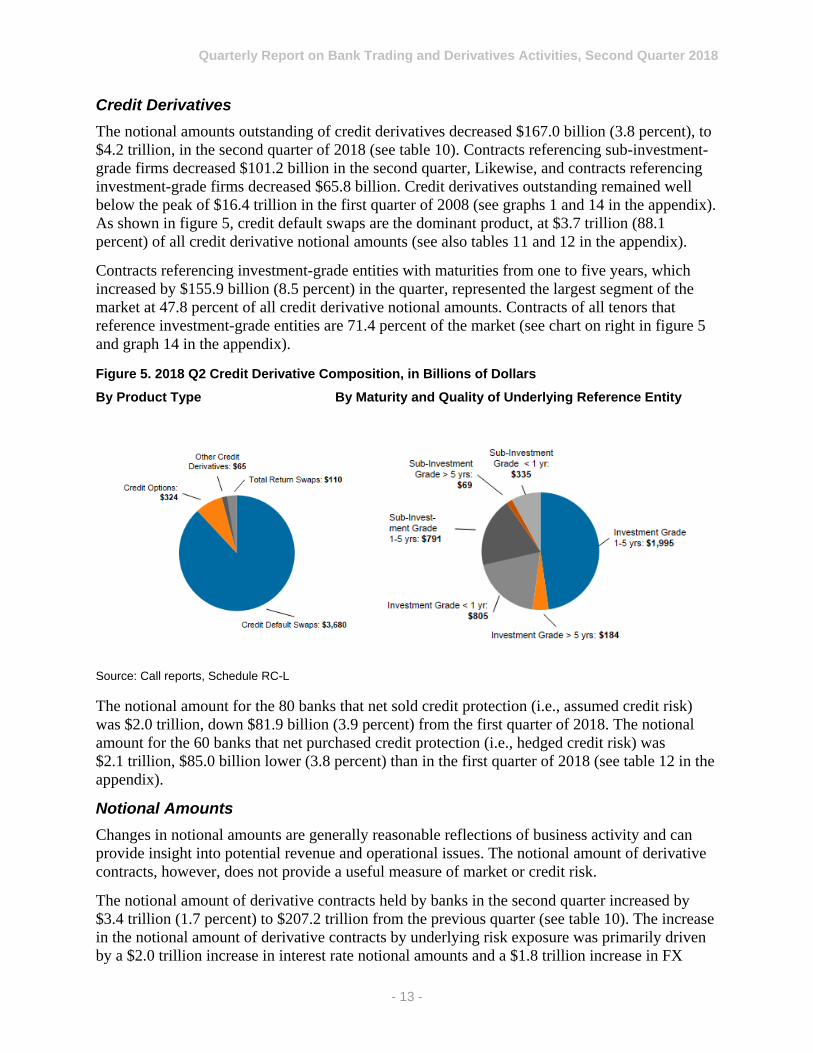
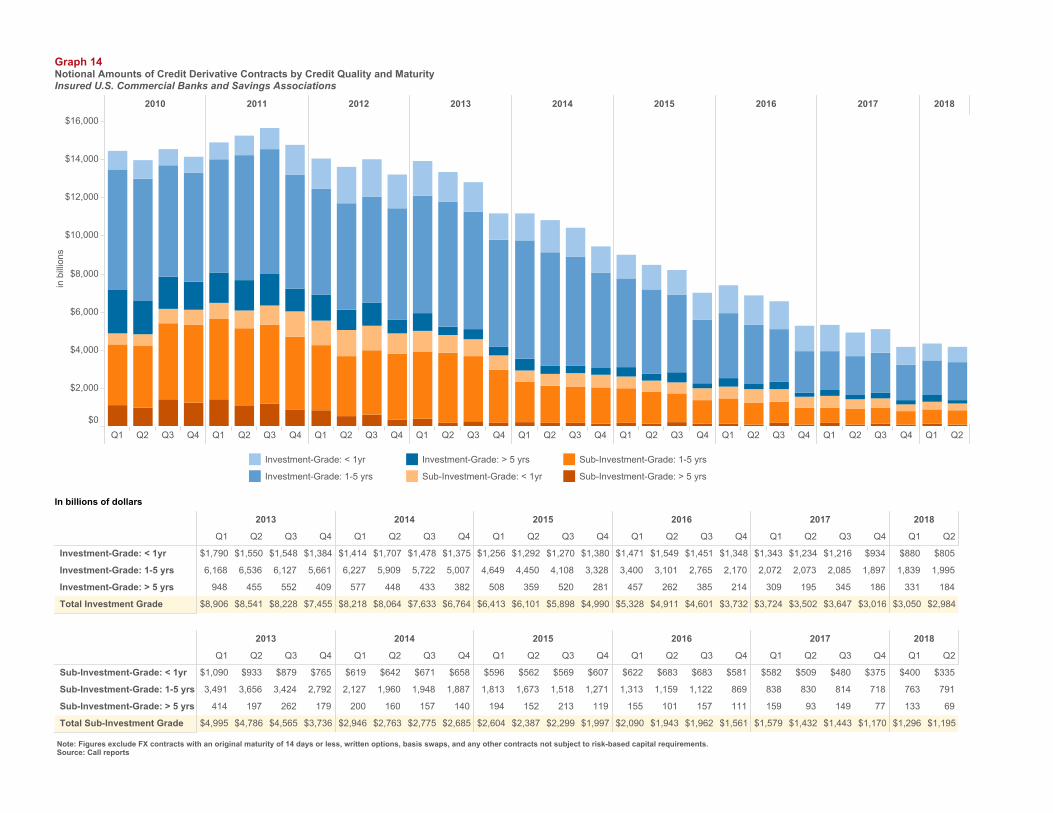
The notional amounts outstanding of credit derivatives decreased $167.0 billion (3.8 percent), to $4.2 trillion, in the second quarter of 2018 (see table 10). Contracts referencing sub-investment-grade firms decreased $101.2 billion in the second quarter, Likewise, and contracts referencing investment-grade firms decreased $65.8 billion. Credit derivatives outstanding remained well below the peak of $16.4 trillion in the first quarter of 2008 (see graphs 1 and 14 in the appendix). As shown in figure 5, credit default swaps are the dominant product, at $3.7 trillion (88.1 percent) of all credit derivative notional amounts (see also tables 11 and 12 in the appendix).
Contracts referencing investment-grade entities with maturities from one to five years, which increased by $155.9 billion (8.5 percent) in the quarter, represented the largest segment of the market at 47.8 percent of all credit derivative notional amounts. Contracts of all tenors that reference investment-grade entities are 71.4 percent of the market (see chart on right in figure 5 and graph 14 in the appendix).
Figure 5. 2018 Q2 Credit Derivative Composition, in Billions of Dollars
By Product Type By Maturity and Quality of Underlying Reference Entity
Source: Call reports, Schedule RC-L
The notional amount for the 80 banks that net sold credit protection (i.e., assumed credit risk) was $2.0 trillion, down $81.9 billion (3.9 percent) from the first quarter of 2018. The notional amount for the 60 banks that net purchased credit protection (i.e., hedged credit risk) was $2.1 trillion, $85.0 billion lower (3.8 percent) than in the first quarter of 2018 (see table 12 in the appendix).
Notional Amounts
Changes in notional amounts are generally reasonable reflections of business activity and can provide insight into potential revenue and operational issues. The notional amount of derivative contracts, however, does not provide a useful measure of market or credit risk.
The notional amount of derivative contracts held by banks in the second quarter increased by $3.4 trillion (1.7 percent) to $207.2 trillion from the previous quarter (see table 10). The increase in the notional amount of derivative contracts by underlying risk exposure was primarily driven by a $2.0 trillion increase in interest rate notional amounts and a $1.8 trillion increase in FX

Quarterly Report on Bank Trading and Derivatives Activities, Second Quarter 2018
- 14 -
notional amounts. Interest rate notional amounts continued to represent the majority of banks’ derivative holdings at $157.4 trillion, or 76.0 percent of total derivatives during the second quarter of 2018 (see table 10).
The increase in the notional amount of derivative contracts by contract type was driven by an increase in swap contracts (see table 11). Swap contracts remained the leading derivatives contract type at 52.1 percent of all notional amounts.
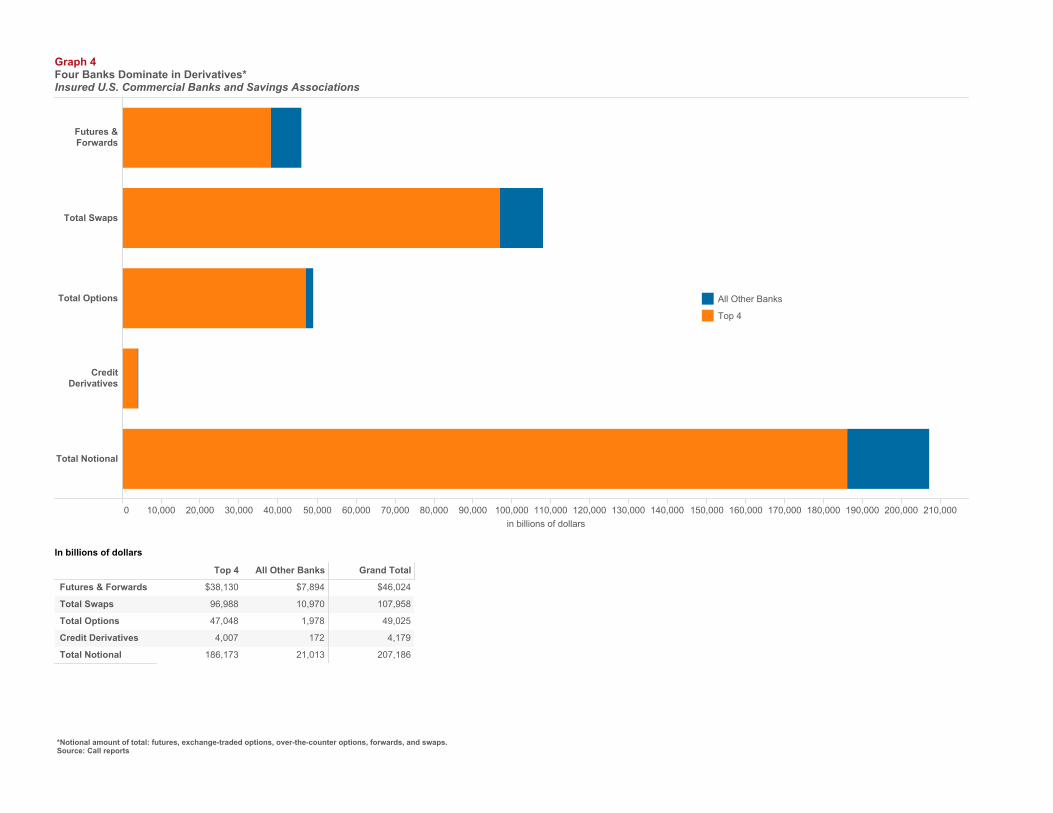
The four banks with the most derivative activity hold 89.9 percent of all bank derivatives, while the largest 25 banks account for nearly 100 percent of all contracts (see tables 3 and 5 and graph 4 in the appendix).
Table 10. Derivative Notional Amounts by Underlying Risk Exposure Quarter-Over-Quarter, in Billions of Dollars
Source: Call reports, Schedule RC-L
Table 11. Derivative Notional Amounts by Contract Type Quarter-Over-Quarter, in Billions of Dollars
Source: Call reports, Schedule RC-L
Compression Activity
Notional amounts of banks’ derivative contracts have generally declined since 2011 because of trade compression efforts, leading to less need for risk management products. Trade compression continues to be a significant factor in reducing the amount of notional derivatives outstanding. Trade compression aggregates a large number of swap contracts with similar factors, such as risk or cash flows, into fewer trades. Compression removes economic redundancy in a derivative book and reduces operational risk and capital costs for large banks. Trade compression activities increased in the second quarter of 2018, as shown in figure 6.
2Q2018 1Q2018Q/Q
ChangeQ/Q %
Change 2Q2017Y/Y
ChangeY/Y %
ChangeInterest Rate $157,427 $155,469 $1,958 1.3% $139,823 $17,604 12.6%Foreign Exchange $40,650 $38,839 $1,811 4.7% $36,521 $4,128 11.3%Equity $3,421 $3,467 -$46 -1.3% $2,908 $512 17.6%Commodity $1,511 $1,631 -$120 -7.4% $1,334 $176 13.2%Credit Derivatives $4,179 $4,345 -$167 -3.8% $4,935 -$756 -15.3%Total Notional $207,186 $203,752 $3,435 1.7% $185,522 $21,665 11.7%
2Q2018 1Q2018Q/Q
ChangeQ/Q %
Change 2Q2017Y/Y
ChangeY/Y %
ChangeFutures & Forwards $46,024 $45,498 $527 1.2% $39,847 $6,177 15.5%Swaps $107,958 $105,094 $2,864 2.7% $103,004 $4,954 4.8%Options $49,025 $48,814 $211 0.4% $37,736 $11,289 29.9%Credit Derivatives $4,179 $4,345 -$167 -3.8% $4,935 -$756 -15.3%Total Notional $207,186 $203,752 $3,435 1.7% $185,522 $21,665 11.7%

Quarterly Report on Bank Trading and Derivatives Activities, Second Quarter 2018
- 15 -
Figure 6. Quarterly Compression Activity, in Trillions of Dollars
Source: LCH.Clearnet
In the first quarter of 2015, banks began reporting their volumes of cleared and non-cleared derivative transactions, as well as risk weights for counterparties in each of these categories. In the second quarter of 2018, 41.0 percent of banks’ derivative holdings were centrally cleared (see table 12). From a market factor perspective, 51.5 percent of interest rate derivative contracts’ notional amounts outstanding were centrally cleared, while very little of the FX derivative market was centrally cleared. The bank-held credit derivative market remained largely uncleared, as 30.2 percent of investment grade and 25.9 percent of non-investment-grade transactions were centrally cleared (see graph 15 in the appendix).
Centrally cleared derivative transactions were heavily concentrated at qualified central counterparties, with 91.4 percent of notional amounts reflecting the 2 percent risk weight applicable to such counterparties.
Table 12. Centrally Cleared Derivative Contracts as a Percentage of Total Derivative Contracts
Source: Call reports, Schedule RC-R
Interest Rate Foreign
Exchange Equity Precious Metals Credit Other Total
2018 Q2 51.5% 1.6% 26.8% 9.5% 28.9% 17.3% 41.0%2018 Q1 49.6% 1.5% 27.9% 8.5% 28.9% 14.9% 39.8%2017 Q4 47.8% 1.0% 25.7% 7.8% 25.8% 15.0% 38.0%2017 Q3 50.2% 1.3% 28.6% 4.3% 26.2% 15.5% 39.6%2017 Q2 50.8% 1.1% 27.3% 4.9% 23.6% 15.5% 40.3%2017 Q1 49.8% 1.2% 25.1% 5.5% 22.3% 16.0% 39.2%2016 Q4 49.1% 1.0% 23.5% 5.6% 20.4% 15.0% 38.8%2016 Q3 49.2% 0.7% 24.3% 6.7% 21.2% 14.9% 39.0%2016 Q2 49.1% 0.5% 22.1% 6.0% 18.3% 13.7% 39.1%2016 Q1 45.4% 0.5% 21.4% 4.4% 19.4% 13.6% 36.5%2015 Q4 46.2% 0.5% 20.0% 3.7% 16.8% 14.0% 36.9%2015 Q3 44.6% 0.5% 14.5% 5.0% 20.4% 12.5% 36.0%2015 Q2 43.1% 0.3% 13.6% 2.6% 19.6% 10.7% 35.0%2015 Q1 44.7% 0.2% 13.6% 1.6% 19.7% 16.0% 36.5%

Quarterly Report on Bank Trading and Derivatives Activities, Second Quarter 2018
- 16 -
Glossary of Terms
Bilateral netting: A legally enforceable arrangement between a bank and a counterparty that creates a single legal obligation covering all included individual contracts. This arrangement means that a bank’s receivables or payables, in the event of the default or insolvency of one of the parties, would be the net sum of all positive and negative fair values of contracts included in the bilateral netting arrangement.
Centrally cleared derivative contract: A standardized derivative contract that is transacted bilaterally but submitted for clearing to a central counterparty, with the central counterparty becoming the ultimate counterparty to both the buyer and the seller.
Credit derivative: A financial contract that allows a party to take on or reduce credit exposure (generally on a bond, loan, or index). The OCC’s derivatives survey includes OTC credit derivatives, such as credit default swaps, total return swaps, and credit spread options.
Derivative: A financial contract in which the value is derived from the performance of underlying market factors, such as interest rates, currency exchange rates, and commodity, credit, and equity prices. Derivative transactions include a wide assortment of financial contracts, such as structured debt obligations and deposits, swaps, futures, options, caps, floors, collars, forwards, and various combinations thereof.
Gross negative fair value (GNFV): The sum total of the fair values of contracts when the bank owes money to its counterparties, without taking into account netting. This amount represents the maximum losses the bank’s counterparties would incur if the bank defaulted and there was no netting of contracts, and the counterparties held no bank collateral. GNFVs associated with credit derivatives are included.
Gross positive fair value (GPFV): The sum total of the fair values of contracts when the bank is owed money by its counterparties, without taking into account netting. This amount represents the maximum losses a bank would incur if all its counterparties defaulted and there was no netting of contracts, and the bank held no counterparty collateral. GPFVs associated with credit derivatives are included.
Net current credit exposure (NCCE): For a portfolio of derivative contracts, NCCE is the GPFV of contracts less the dollar amount of netting benefits. On any individual contract, current credit exposure (CCE) is the fair value of the contract if positive, and zero when the fair value is negative or zero. NCCE is also the net amount owed to banks if all contracts were immediately liquidated.
Notional amount: The nominal or face amount that is used to calculate payments made on swaps and other risk management products. This amount generally does not change hands and is thus referred to as notional.
OTC derivative contracts: Privately negotiated derivative contracts that are transacted off of organized exchanges.
Potential future exposure (PFE): An estimate of what the CCE could be over time, based on a supervisory formula in the agencies’ risk-based capital rules. PFE is generally determined by multiplying the notional amount of the contract by a credit conversion factor that is based on the underlying market factor (e.g., interest rates, commodity prices, or equity prices) and the contract’s remaining maturity. The risk-based capital rules, however, permit banks to adjust the

Quarterly Report on Bank Trading and Derivatives Activities, Second Quarter 2018
- 17 -
formulaic PFE measure by the net-to-gross ratio, which proxies the risk-reduction benefits attributable to a valid bilateral netting contract. PFE data in this report use the amounts on which banks hold risk-based capital.
Qualified central counterparty: Qualified central counterparties are defined in 12 CFR 3.2 as either a CCP that the Financial Stability Oversight Council has designated systemically important under Title VIII of the Dodd-Frank Wall Street Reform and Consumer Protection Act or meets a series of standards. See 12 CFR 3.2 for full definition.
Total credit exposure (TCE): The sum total of NCCE and PFE.
Total risk-based capital: The sum of tier 1 plus tier 2 capital. Tier 1 capital generally consists of common shareholders’ equity, perpetual preferred shareholders’ equity with noncumulative dividends, retained earnings, and tier 1 capital of consolidated subsidiaries that is not owned by the bank (minority interest), less regulatory adjustments and deductions. Tier 2 capital generally consists of subordinated debt, intermediate-term preferred stock, cumulative and long-term preferred stock, tier 2 capital of consolidated subsidiaries that is not owned by the bank (minority interest), and a portion of a bank’s allowance for loan and lease losses less regulatory adjustments and deductions.
Trade compression: A significant factor in reducing the amount of notional derivatives outstanding. Trade compression aggregates a large number of swap contracts with similar factors, such as risk or cash flows, into fewer trades. Compression removes economic redundancy in a derivative book and reduces operational risks and capital costs for large banks.
Volatility index (VIX): A measure of the market’s expectation of stock market volatility of S&P 500 index options over the next 30-day period.
Quarterly Report on Bank Trading and Derivatives Activities, Second Quarter 2018
- 18 -
Index of Tables and Figures
Table 1. Quarterly Bank Trading Revenue, in Millions of Dollars ................................................ 4
Table 2. Quarterly Holding Company Trading Revenue, in Millions of Dollars ........................... 4
Figure 1. Bank Trading Revenue as a Percentage of Consolidated Holding Company Trading Revenue........................................................................................................................................... 5
Table 3. Gross Positive Fair Values and Gross Negative Fair Values, in Billions of Dollars ........ 7
Table 4. Netting Contract Examples ............................................................................................... 7
Table 5. Net Current Credit Exposure, in Billions of Dollars ........................................................ 8
Figure 2. Net Current Credit Exposure, in Billions of Dollars ....................................................... 8
Table 6. Net Current Credit Exposure by Counterparty Type as a Percentage of Total Net Current Credit Exposure .............................................................................................................................. 9
Table 7. Ratio of Fair Value Collateral to Net Current Credit Exposure ....................................... 9
Table 8. Composition of Collateral ............................................................................................... 10
Table 9. Value-at-Risk at Major Bank Holding Companies, in Millions of Dollars .................... 11
Figure 3. Volatility Index (VIX) ................................................................................................... 12
Figure 4. Level 3 Trading Assets, in Billions of Dollars .............................................................. 12
Figure 5. 2018 Q2 Credit Derivative Composition, in Billions of Dollars ................................... 13
Table 10. Derivative Notional Amounts by Underlying Risk Exposure Quarter-Over-Quarter, in Billions of Dollars ......................................................................................................................... 14
Table 11. Derivative Notional Amounts by Contract Type Quarter-Over-Quarter, in Billions of Dollars ........................................................................................................................................... 14
Figure 6. Quarterly Compression Activity, in Trillions of Dollars ............................................... 15
Table 12. Centrally Cleared Derivative Contracts as a Percentage of Total Derivative Contracts....................................................................................................................................................... 15

Quarterly Report on Bank Trading and Derivatives Activities, Second Quarter 2018
- 19 -
Appendix: Supplementary Graphs and Tables
Graph 1. Derivative Notional Amounts by Type
Graph 2. Derivative Contracts by Product
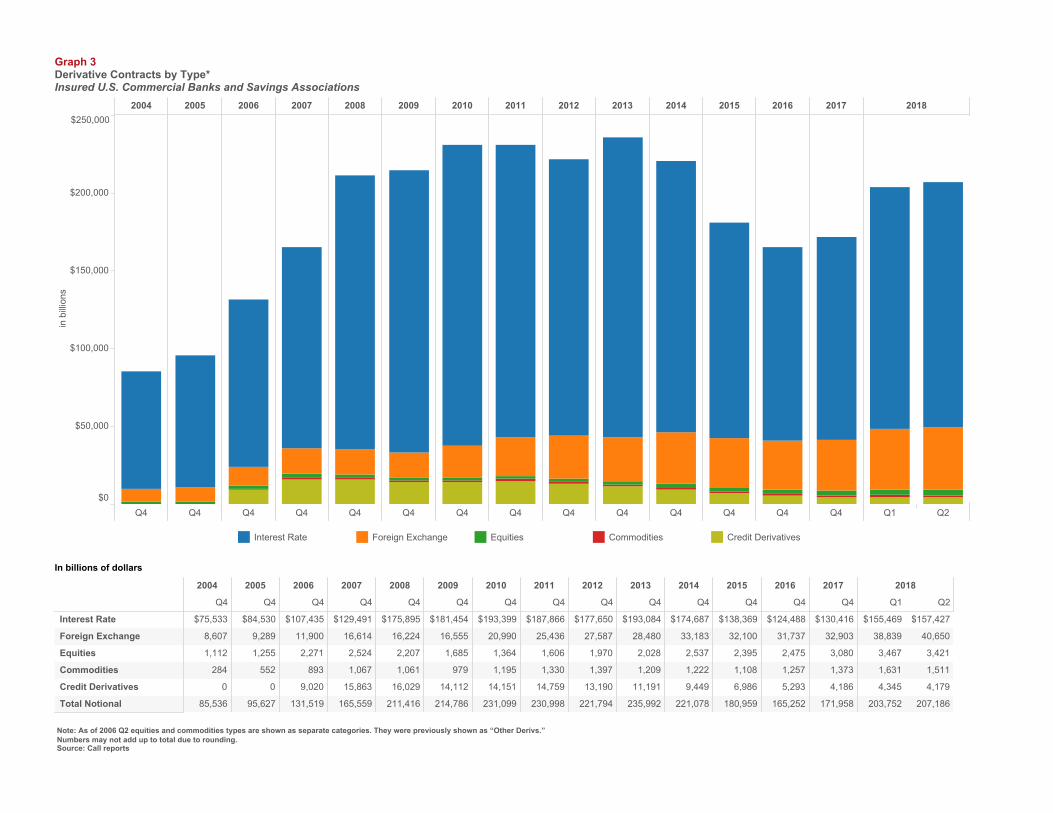
Graph 3. Derivative Contracts by Type
Graph 4. Four Banks Dominate in Derivatives
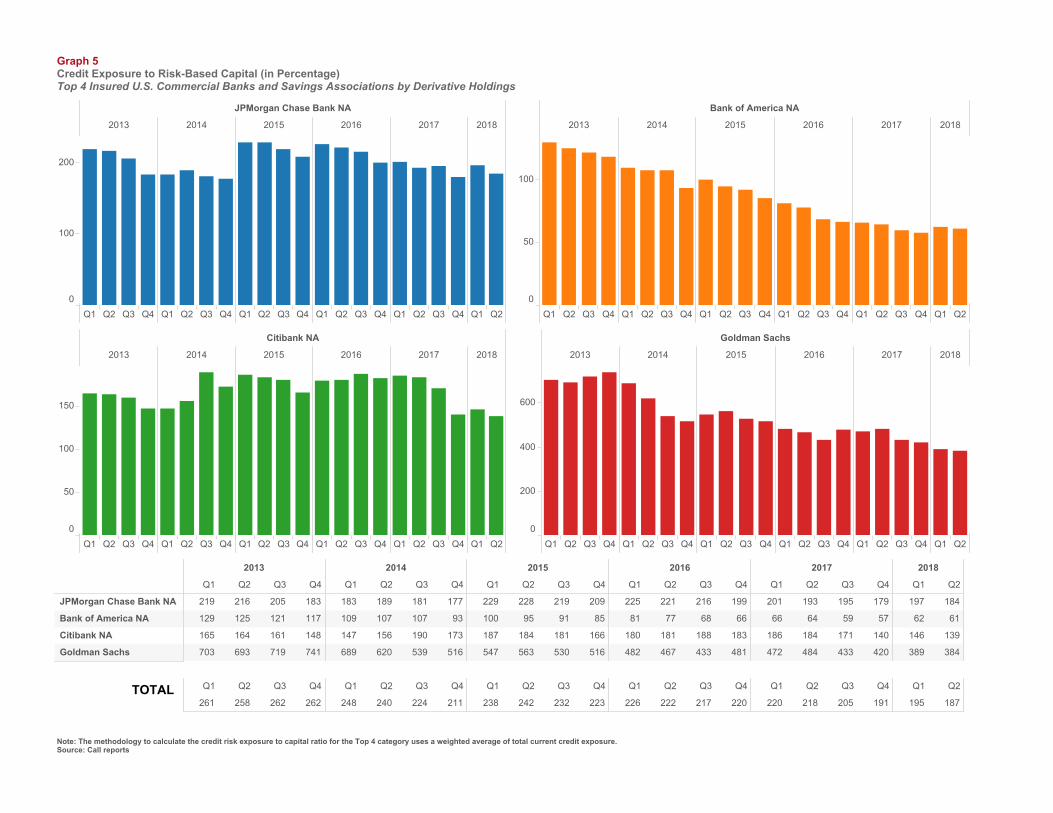
Graph 5. Credit Exposure to Risk-Based Capital (in Percentage)
Graph 6. Netting Benefit: Amount of Gross Credit Exposure Eliminated Through Bilateral Netting
Graph 7. Quarterly Charge-Offs/(Recoveries) From Derivatives – Bank
Graph 8. Quarterly Charge-Offs/(Recoveries) From Derivatives – Holding Company
Graph 9a. Quarterly Trading Revenue (Cash and Derivative Positions) – Bank
Graph 9b. Quarterly Trading Revenue (Cash and Derivative Positions) – Holding Company
Graph 10. Quarterly Trading Revenue (Cash and Derivative Positions) as a Percentage of Gross Revenue (in Percentage)
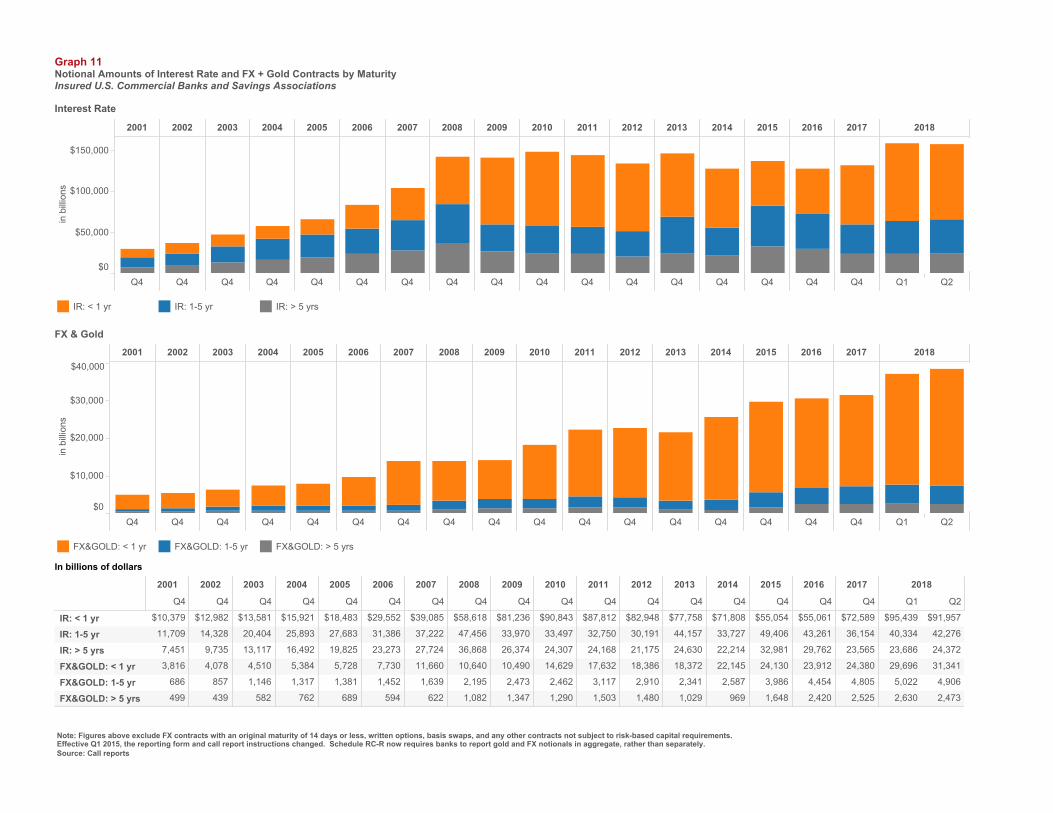
Graph 11. Notional Amounts of Interest Rate and FX + Gold Contracts by Maturity
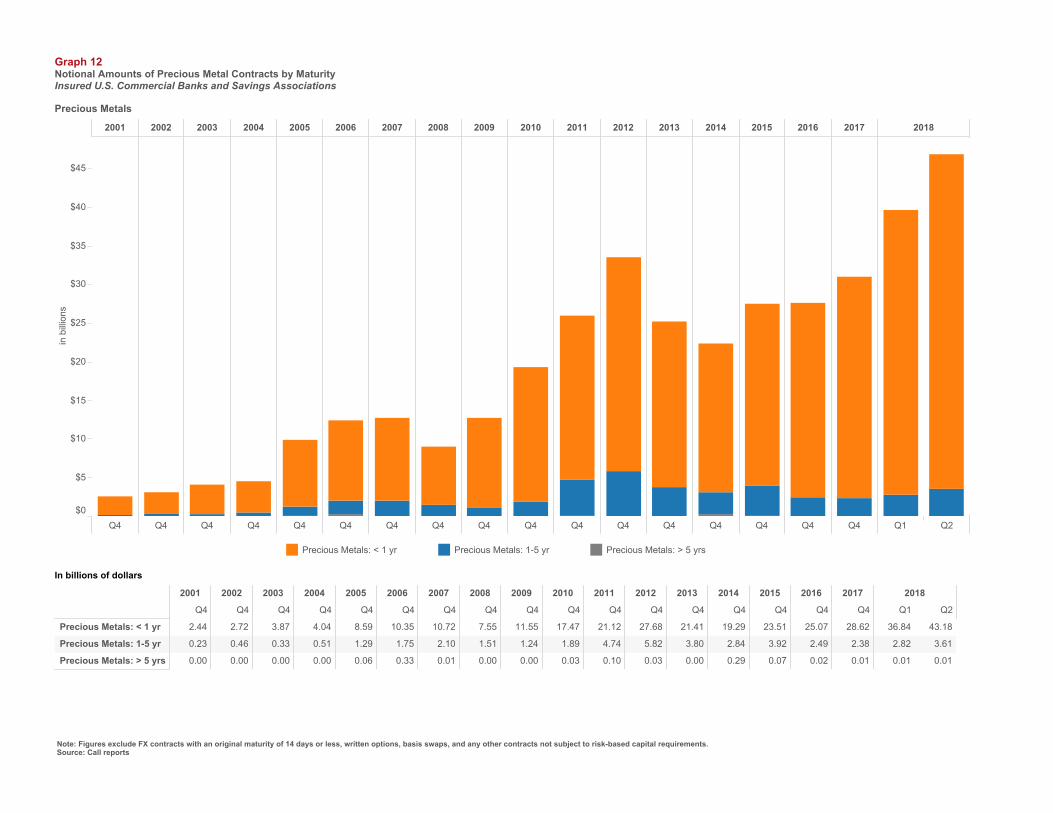
Graph 12. Notional Amounts of Precious Metal Contracts by Maturity
Graph 13. Notional Amounts of Commodity and Equity Contracts by Maturity
Graph 14. Notional Amounts of Credit Derivative Contracts by Credit Quality and Maturity
Graph 15. Notional Amounts of Over-the-Counter and Centrally Cleared Derivative Contracts
Graph 16. Value-at-Risk (VaR)
Table 1. Notional Amounts of Derivative Contracts
Table 2. Notional Amounts of Derivative Contracts (Holding Companies)
Table 3. Distribution of Derivative Contracts
Table 4. Credit Equivalent Exposures
Table 5. Notional Amounts of Derivative Contracts Held for Trading
Table 6. Gross Fair Values of Derivative Contracts
Table 7. Trading Revenues From Cash Instruments and Derivatives
Table 8. Notional Amounts of Derivative Contracts by Contract Type and Maturity (interest rate, FX and gold)
Table 9. Notional Amounts of Derivative Contracts by Contract Type and Maturity (precious metals)
Table 10. Notional Amounts of Derivative Contracts by Contract Type and Maturity (other commodity and equity)
Table 11. Notional Amounts of Credit Derivative Contracts by Contract Type and Maturity (investment grade and sub-investment grade)
Table 12. Distribution of Credit Derivative Contracts Held for Trading
Table 13. Derivatives Data Reported By FFIEC 051 Filers
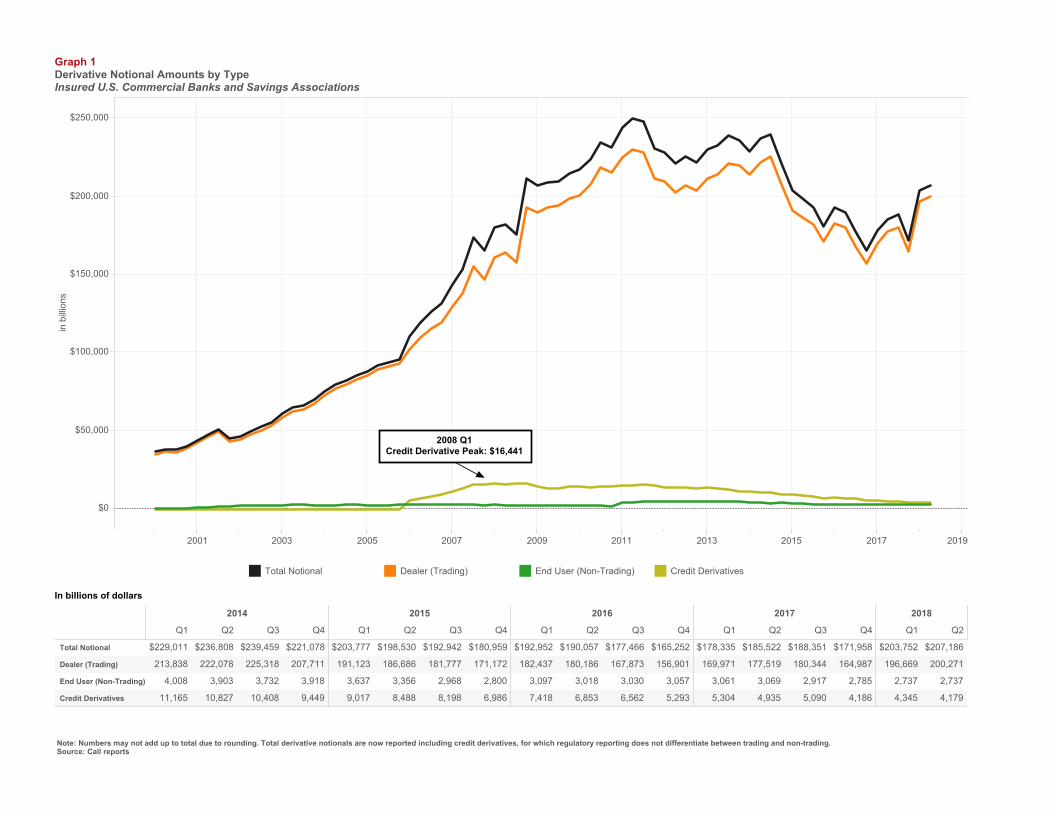
Note: Numbers may not add up to total due to rounding. Total derivative notionals are now reported including credit derivatives, for which regulatory reporting does not differentiate between trading and non-trading.Source: Call reports
2001 2003 2005 2007 2009 2011 2013 2015 2017 2019
$0
$50,000
$100,000
$150,000
$200,000
$250,000
in billions
2008 Q1Credit Derivative Peak: $16,441
Graph 1Derivative Notional Amounts by TypeInsured U.S. Commercial Banks and Savings Associations
Total Notional Dealer (Trading) End User (Non-Trading) Credit Derivatives
2014
Q1 Q2 Q3 Q4
2015
Q1 Q2 Q3 Q4
2016
Q1 Q2 Q3 Q4
2017
Q1 Q2 Q3 Q4
2018
Q1 Q2
Total Notional
Dealer (Trading)
End User (Non-Trading)
Credit Derivatives 9,449
3,918
207,711
$221,078
10,408
3,732
225,318
$239,459
10,827
3,903
222,078
$236,808
11,165
4,008
213,838
$229,011
6,986
2,800
171,172
$180,959
8,198
2,968
181,777
$192,942
8,488
3,356
186,686
$198,530
9,017
3,637
191,123
$203,777
5,293
3,057
156,901
$165,252
6,562
3,030
167,873
$177,466
6,853
3,018
180,186
$190,057
7,418
3,097
182,437
$192,952
4,186
2,785
164,987
$171,958
5,090
2,917
180,344
$188,351
4,935
3,069
177,519
$185,522
5,304
3,061
169,971
$178,335
4,179
2,737
200,271
$207,186
4,345
2,737
196,669
$203,752
In billions of dollars

*Notional amount of total: futures, exchange-traded options, over the counter options, forwards and swaps.Note: Numbers may not add up to total due to rounding.Source: Call reports
2004 2005 2006 2007 2008 2009 2010 2011 2012 2013 2014 2015 2016 2017 2018
Q4 Q4 Q4 Q4 Q4 Q4 Q4 Q4 Q4 Q4 Q4 Q4 Q4 Q4 Q1 Q2
$0
$50,000
$100,000
$150,000
$200,000
$250,000
in billions
Graph 2Derivative Contracts by Product*Insured U.S. Commercial Banks and Savings Associations
Futures & Forwards Total Options Total Swaps Credit Derivatives
2004
Q4
2005
Q4
2006
Q4
2007
Q4
2008
Q4
2009
Q4
2010
Q4
2011
Q4
2012
Q4
2013
Q4
2014
Q4
2015
Q4
2016
Q4
2017
Q4
2018
Q1 Q2
Futures & Forwards
Total Options
Total Swaps
Credit Derivatives
Total Notional 85,536
0
56,411
17,754
$11,370
95,627
0
64,712
18,858
$12,057
131,519
9,020
81,340
26,277
$14,882
165,559
15,863
103,102
27,727
$18,867
211,416
16,029
143,111
29,747
$22,529
214,786
14,112
139,138
31,884
$29,652
231,099
14,151
149,331
32,078
$35,539
230,998
14,759
146,266
32,505
$37,469
221,794
13,190
136,608
30,375
$41,621
235,992
11,191
152,469
32,305
$40,027
221,078
9,449
135,169
33,081
$43,380
180,959
6,986
107,392
30,889
$35,691
165,252
5,293
96,384
29,373
$34,201
171,958
4,186
94,524
38,841
$34,407
207,186
4,179
107,958
49,025
$46,024
203,752
4,345
105,094
48,814
$45,498
In billions of dollars
Note: As of 2006 Q2 equities and commodities types are shown as separate categories. They were previously shown as “Other Derivs.”Numbers may not add up to total due to rounding.Source: Call reports
2004 2005 2006 2007 2008 2009 2010 2011 2012 2013 2014 2015 2016 2017 2018
Q4 Q4 Q4 Q4 Q4 Q4 Q4 Q4 Q4 Q4 Q4 Q4 Q4 Q4 Q1 Q2
$0
$50,000
$100,000
$150,000
$200,000
$250,000
in billions
Graph 3Derivative Contracts by Type*Insured U.S. Commercial Banks and Savings Associations
2004
Q4
2005
Q4
2006
Q4
2007
Q4
2008
Q4
2009
Q4
2010
Q4
2011
Q4
2012
Q4
2013
Q4
2014
Q4
2015
Q4
2016
Q4
2017
Q4
2018
Q1 Q2
Interest Rate
Foreign Exchange
Equities
Commodities
Credit Derivatives
Total Notional 85,536
0
284
1,112
8,607
$75,533
95,627
0
552
1,255
9,289
$84,530
131,519
9,020
893
2,271
11,900
$107,435
165,559
15,863
1,067
2,524
16,614
$129,491
211,416
16,029
1,061
2,207
16,224
$175,895
214,786
14,112
979
1,685
16,555
$181,454
231,099
14,151
1,195
1,364
20,990
$193,399
230,998
14,759
1,330
1,606
25,436
$187,866
221,794
13,190
1,397
1,970
27,587
$177,650
235,992
11,191
1,209
2,028
28,480
$193,084
221,078
9,449
1,222
2,537
33,183
$174,687
180,959
6,986
1,108
2,395
32,100
$138,369
165,252
5,293
1,257
2,475
31,737
$124,488
171,958
4,186
1,373
3,080
32,903
$130,416
207,186
4,179
1,511
3,421
40,650
$157,427
203,752
4,345
1,631
3,467
38,839
$155,469
In billions of dollars
Interest Rate Foreign Exchange Equities Commodities Credit Derivatives
*Notional amount of total: futures, exchange-traded options, over-the-counter options, forwards, and swaps.Source: Call reports
0 10,000 20,000 30,000 40,000 50,000 60,000 70,000 80,000 90,000 100,000110,000120,000130,000140,000150,000160,000170,000180,000190,000200,000210,000in billions of dollars
Futures &Forwards
Total Swaps
Total Options
CreditDerivatives
Total Notional
Graph 4Four Banks Dominate in Derivatives*Insured U.S. Commercial Banks and Savings Associations
Top 4 All Other Banks Grand Total
Futures & Forwards
Total Swaps
Total Options
Credit Derivatives
Total Notional 207,186
4,179
49,025
107,958
$46,024
21,013
172
1,978
10,970
$7,894
186,173
4,007
47,048
96,988
$38,130
In billions of dollars
All Other Banks
Top 4
Note: The methodology to calculate the credit risk exposure to capital ratio for the Top 4 category uses a weighted average of total current credit exposure.Source: Call reports
Graph 5Credit Exposure to Risk-Based Capital (in Percentage)Top 4 Insured U.S. Commercial Banks and Savings Associations by Derivative Holdings
JPMorgan Chase Bank NA
2013 2014 2015 2016 2017 2018
Q1 Q2 Q3 Q4 Q1 Q2 Q3 Q4 Q1Q2 Q3Q4 Q1 Q2 Q3 Q4 Q1 Q2 Q3 Q4Q1 Q2
0
100
200
Bank of America NA
2013 2014 2015 2016 2017 2018
Q1 Q2 Q3 Q4 Q1 Q2 Q3 Q4 Q1 Q2 Q3 Q4 Q1 Q2 Q3 Q4 Q1 Q2 Q3 Q4 Q1 Q2
0
50
100
Citibank NA
2013 2014 2015 2016 2017 2018
Q1 Q2 Q3 Q4 Q1 Q2 Q3 Q4 Q1Q2 Q3Q4 Q1 Q2 Q3 Q4 Q1 Q2 Q3 Q4Q1 Q2
0
50
100
150
Goldman Sachs
2013 2014 2015 2016 2017 2018
Q1 Q2 Q3 Q4 Q1 Q2 Q3 Q4 Q1 Q2 Q3 Q4 Q1 Q2 Q3 Q4 Q1 Q2 Q3 Q4 Q1 Q2
0
200
400
600
2013
Q1 Q2 Q3 Q4
2014
Q1 Q2 Q3 Q4
2015
Q1 Q2 Q3 Q4
2016
Q1 Q2 Q3 Q4
2017
Q1 Q2 Q3 Q4
2018
Q1 Q2
JPMorgan Chase Bank NA
Bank of America NA
Citibank NA
Goldman Sachs 741
148
117
183
719
161
121
205
693
164
125
216
703
165
129
219
516
173
93
177
539
190
107
181
620
156
107
189
689
147
109
183
516
166
85
209
530
181
91
219
563
184
95
228
547
187
100
229
481
183
66
199
433
188
68
216
467
181
77
221
482
180
81
225
420
140
57
179
433
171
59
195
484
184
64
193
472
186
66
201
384
139
61
184
389
146
62
197
Q1 Q2 Q3 Q4 Q1 Q2 Q3 Q4 Q1 Q2 Q3 Q4 Q1 Q2 Q3 Q4 Q1 Q2 Q3 Q4 Q1 Q2
262262258261 211224240248 223232242238 220217222226 191205218220 187195TOTAL
2009
2010
2011
2012
2013
2014
2015
2016
2017
2018
80.0
81.0
82.0
83.0
84.0
85.0
86.0
87.0
88.0
89.0
90.0
91.0
Netting Benefit in percentage
Graph 6Netting Benefit*: Amount of Gross Credit Exposure Eliminated Through Bilateral NettingInsured U.S. Commercial Banks and Savings Associations by Derivative Holdings
2009
Q2 Q3 Q4
2010
Q1 Q2 Q3 Q4
2011
Q1 Q2 Q3 Q4
2012
Q1 Q2 Q3 Q4
2013
Q1 Q2 Q3 Q4
2014
Q1 Q2 Q3 Q4
2015
Q1 Q2 Q3 Q4
2016
Q1 Q2 Q3 Q4
2017
Q1 Q2 Q3 Q4
2018
Q1 Q2
88.588.888.0 89.190.390.088.9 90.490.288.688.2 90.290.390.389.9 89.389.789.189.8 88.888.688.988.7 86.786.886.887.6 86.086.587.687.7 81.682.985.286.2 80.580.0
Netting Benefit (in percentage)
*The netting benefit is defined as: $ amount of netting benefits/gross positive fair value.Source: Call reports, beginning the first quarter of 2015 RC-R; otherwise RC-L
Note: The figures are for each quarter alone, not year-to-date.NCCE: Pre 2009 Q2 (RC-R); 2009 Q2 - 2014 Q4 (RC-L); 2015 Q1 onward (RC-R)Source: Call reports
2000 2002 2004 2006 2008 2010 2012 2014 2016 2018
$0
$500
$1,000
$1,500
in millions
0.000
0.001
0.002
0.003
0.004
0.005
Charge-Offs as % NCCE
Graph 7Quarterly Charge-Offs/(Recoveries) From Derivatives - BankInsured U.S. Commercial Banks and Savings Associations with Derivatives
2000
Q1 Q2 Q3 Q4
2001
Q1 Q2 Q3 Q4
2002
Q1 Q2 Q3 Q4
2003
Q1 Q2 Q3 Q4
Charge-Offs (Banks) -3.0-1.0-1.00.0 370.0107.3-1.02.0 73.759.028.275.8 83.732.329.925.3
In millions of dollars
2004
Q1 Q2 Q3 Q4
2005
Q1 Q2 Q3 Q4
2006
Q1 Q2 Q3 Q4
2007
Q1 Q2 Q3 Q4
Charge-Offs (Banks) 5.492.234.946.7 8.323.014.21.3 -5.8-16.0-7.03.6 30.7119.59.1-3.1
2008
Q1 Q2 Q3 Q4
2009
Q1 Q2 Q3 Q4
2010
Q1 Q2 Q3 Q4
2011
Q1 Q2 Q3 Q4
Charge-Offs (Banks) 8479212015 162221168217 83313173100 6991721,601
2012
Q1 Q2 Q3 Q4
2013
Q1 Q2 Q3 Q4
2014
Q1 Q2 Q3 Q4
2015
Q1 Q2 Q3 Q4
Charge-Offs (Banks) 73.4426.1254.3476.35 83.4535.7760.7284.28 7.9114.5355.9012.78 6.4010.44-7.9369.31
2016
Q1 Q2 Q3 Q4
2017
Q1 Q2 Q3 Q4
2018
Q1 Q2
Charge-Offs (Banks) -7.846.4818.5613.30 10.26-8.778.711.22 3.97-1.14
Charge-Offs (Banks)
Charge-Offs as % NCCE
Note: The figures are for each quarter alone, not year-to-date.Source: Call reports and Y-9
1999 2000 2001 2002 2003 2004 2005 2006 2007 2008 2009 2010 2011 2012 2013 2014 2015 2016 2017 2018
$0
$1,000
$2,000
$3,000
in millions
Graph 8Quarterly Charge-Offs/(Recoveries) From Derivatives - Holding CompanyInsured U.S. Commercial Banks and Savings Associations with Derivatives Compared with Holding Companies
2000
Q1 Q2 Q3 Q4
2001
Q1 Q2 Q3 Q4
2002
Q1 Q2 Q3 Q4
2003
Q1 Q2 Q3 Q4
Charge-Offs (Banks)
Charge-Offs (Holding Companies) -7.0
-3.0
19.3
-1.0
-1.0
-1.0
0.1
0.0
369.6
370.0
107.3
107.3
-1.0
-1.0
2.0
2.0
73.7
73.7
66.0
59.0
21.2
28.2
75.8
75.8
127.8
83.7
31.4
32.3
32.9
29.9
25.3
25.3
In millions of dollars
2004
Q1 Q2 Q3 Q4
2005
Q1 Q2 Q3 Q4
2006
Q1 Q2 Q3 Q4
2007
Q1 Q2 Q3 Q4
Charge-Offs (Banks)
Charge-Offs (Holding Companies) 9.0
5.4
94.2
92.2
40.4
34.9
51.2
46.7
18.1
8.3
45.1
23.0
3.6
14.2
54.9
1.3
-7.2
-5.8
-28.1
-16.0
5.4
-7.0
35.4
3.6
32.2
30.7
119.4
119.5
10.4
9.1
-3.1
-3.1
2012
Q1 Q2 Q3 Q4
2013
Q1 Q2 Q3 Q4
2014
Q1 Q2 Q3 Q4
2015
Q1 Q2 Q3 Q4
2016
Q1 Q2 Q3 Q4
2017
Q1 Q2 Q3 Q4
2018
Q1 Q2
Charge-Offs (Banks)
Charge-Offs (Holding Companies) ####
73.4
34.9
26.1
64.0
54.3
84.6
76.3
83.4
83.5
42.9
35.8
62.6
60.7
87.2
84.3
9.1
7.9
17.2
14.5
55.6
55.9
13.6
12.8
24.5
6.4
12.9
10.4
####
-7.9
69.0
69.3
-2.5
-7.8
7.5
6.5
18.0
18.6
12.8
13.3
9.6
10.3
-8.3
-8.8
8.9
8.7
1.4
1.2
3.4
4.0
3.1
-1.1
2008
Q1 Q2 Q3 Q4
2009
Q1 Q2 Q3 Q4
2010
Q1 Q2 Q3 Q4
2011
Q1 Q2 Q3 Q4
Charge-Offs (Banks)
Charge-Offs (Holding Companies) 1,192
847
93
92
120
120
15
15
164
162
266
221
477
168
1,570
217
3,598
83
181
313
288
173
122
100
73
69
92
91
68
72
1,617
1,601
Charge-Offs (Banks)
Charge-Offs (Holding Companies)
*The trading revenue figures are for cash and derivative activities. Revenue figures are for each quarter alone, not year-to-date.Note: Numbers may not add up to total due to rounding.Source: Call reports
2013
Q1 Q2 Q3 Q4
2014
Q1 Q2 Q3 Q4
2015
Q1 Q2 Q3 Q4
2016
Q1 Q2 Q3 Q4
2017
Q1 Q2 Q3 Q4
2018
Q1 Q2
Interest Rate
Foreign Exchange
Equity
Commodity & Other
Credit
Total Trading Revenue 2,911
245
265
491
1,550
360
4,527
222
481
233
588
3,002
7,125
339
292
924
3,303
2,268
7,520
890
364
838
3,185
2,243
4,471
-79
335
650
2,902
664
5,612
535
411
654
4,830
-819
6,428
500
293
726
2,026
2,883
6,192
756
672
612
2,137
2,015
4,273
-222
198
742
3,401
154
5,316
357
402
49
1,931
2,578
5,507
530
129
587
855
3,406
7,669
624
587
797
4,703
958
6,006
634
296
681
5,941
-1,547
6,420
118
353
734
2,294
2,920
7,062
342
161
867
3,719
1,973
5,650
263
271
668
1,424
3,023
5,017
-237
251
990
1,791
2,224
6,396
470
284
1,183
1,540
2,918
6,637
108
206
1,122
681
4,520
7,129
330
328
922
1,685
3,865
6,870
281
313
1,486
4,535
255
8,198
421
368
1,865
2,895
2,649
In millions of dollars
2012 Q2 2013 Q2 2014 Q2 2015 Q2 2016 Q2 2017 Q2 2018 Q2
-4,000
-2,000
0
2,000
4,000
6,000
8,000
in $ millions
Graph 9aQuarterly Trading Revenue (Cash and Derivative Positions)* - BankInsured U.S. Commercial Banks and Savings Associations
Interest Rate
Foreign Exchange
Equity
Commodity & Other
Credit
Total Trading Revenue
2Q2018AveragePast 12Q2's
Past 8QuarterAverage
Past 8QuarterHigh
Past 8QuarterLow
Since2000
Average
MaxSince2000
MinSince2000
Interest Rate
Foreign Exchange
Equity
Commodity & Other
Credit
Total Trading Revenue 5,017
-237
161
681
681
-1,547
10,217
2,727
789
1,865
5,941
9,291
4,291
-161
231
609
1,901
1,711
-10,580
-10,237
-307
-1,059
-1,069
-5,282
8,198
634
368
1,865
5,941
4,520
6,637
274
284
1,095
2,787
2,197
6,519
316
202
1,015
2,448
2,539
6,870
281
313
1,486
4,535
255
In millions of dollars
*The trading revenue figures are for cash and derivative activities. Revenue figures are for each quarter alone, not year-to-date.Note: Numbers may not add up to total due to rounding.Source: Y9
2012 Q1 2012 Q3 2013 Q1 2013 Q3 2014 Q1 2014 Q3 2015 Q1 2015 Q3 2016 Q1 2016 Q3 2017 Q1 2017 Q3 2018 Q1 2018 Q3
0
5,000
10,000
15,000
20,000
in $ millions
Graph 9bQuarterly Trading Revenue (Cash and Derivative Positions)*Holding Company
Interest Rate
Foreign Exchange
Equity
Commodity & Other
Credit
Total Trading Revenue
2013
Q1 Q2 Q3 Q4
2014
Q1 Q2 Q3 Q4
2015
Q1 Q2 Q3 Q4
2016
Q1 Q2 Q3 Q4
2017
Q1 Q2 Q3 Q4
2018
Q1 Q2
Interest Rate
Foreign Exchange
Equity
Commodity & Other
Credit
Total Trading Revenue 8,595
1,949
1,052
3,484
2,205
-94
10,893
855
1,347
4,561
320
3,811
14,156
2,761
1,746
3,936
4,890
823
20,262
5,292
1,324
4,960
4,414
4,272
6,762
14
954
2,947
4,243
-1,396
12,205
1,687
1,242
2,938
5,985
353
14,679
3,292
924
4,296
2,521
3,645
16,885
4,718
2,617
3,682
2,472
3,395
7,887
-317
412
3,696
4,338
-243
9,590
452
2,146
3,196
1,393
2,403
12,860
1,294
871
4,481
552
5,662
18,680
2,603
1,833
6,022
6,329
1,893
11,579
742
1,003
3,021
8,007
-1,193
14,868
1,482
969
4,159
2,899
5,359
15,327
2,940
1,491
3,612
4,318
2,965
11,892
1,880
738
3,441
2,025
3,808
9,868
-356
523
3,095
2,587
4,018
13,953
1,917
784
4,705
1,766
4,780
15,111
1,493
1,330
5,682
721
5,884
17,028
3,274
399
4,902
2,440
6,013
12,498
2,001
707
6,499
4,740
-1,449
18,721
1,296
1,195
6,259
3,934
6,037
In millions of dollars
*The trading revenue figures are for cash and derivative activities. Revenue figures are quarterly, not year-to-date numbers.Note: Gross revenue equals interest income plus non-interest income.Source: Call reports
JPMorgan Chase Bank NA
2013 2014 2015 2016 2017 2018
Q1 Q2Q3 Q4Q1Q2 Q3Q4Q1 Q2Q3 Q4Q1 Q2Q3 Q4Q1Q2 Q3Q4Q1 Q2
0
5
10
15
Trading Revenue to Gross Revenue
Graph 10Quarterly Trading Revenue (Cash and Derivative Positions) as a Percentage of Gross Revenue (in Percentage)Top 4 Insured U.S. Commercial Banks and Savings Associations by Derivative Holdings
Bank of America NA
2013 2014 2015 2016 2017 2018
Q1Q2 Q3Q4 Q1Q2 Q3Q4 Q1Q2 Q3Q4 Q1Q2 Q3Q4 Q1Q2 Q3Q4 Q1 Q2
-5
0
5
Trading Revenue to Gross Revenue
Citibank NA
2013 2014 2015 2016 2017 2018
Q1 Q2Q3 Q4Q1Q2 Q3Q4Q1 Q2Q3 Q4Q1 Q2Q3 Q4Q1Q2 Q3Q4Q1 Q2
0
5
10
Trading Revenue to Gross Revenue
Goldman Sachs
2013 2014 2015 2016 2017 2018
Q1Q2 Q3Q4 Q1Q2 Q3Q4 Q1Q2 Q3Q4 Q1Q2 Q3Q4 Q1Q2 Q3Q4 Q1 Q2
0
10
20
30
Trading Revenue to Gross Revenue
2013
Q1 Q2 Q3 Q4
2014
Q1 Q2 Q3 Q4
2015
Q1 Q2 Q3 Q4
2016
Q1 Q2 Q3 Q4
2017
Q1 Q2 Q3 Q4
2018
Q1 Q2
JPMorgan Chase Bank NABank of America NACitibank NAGoldman Sachs 24.45
7.20-1.581.24
11.546.392.1410.67
37.3011.71-5.9718.73
32.657.453.3918.65
13.064.783.686.97
13.745.485.1113.47
22.217.439.1113.31
23.678.517.8012.63
6.166.301.727.03
13.326.545.1912.65
17.328.410.4913.25
15.859.176.7817.73
7.2210.973.2811.17
12.166.474.1813.83
9.549.416.8713.34
23.787.193.9012.26
2.156.943.877.94
7.109.124.0911.64
15.668.504.4912.16
17.7110.474.7013.84
1.8610.694.0410.24
10.7111.335.6213.97
Trading Revenue to Gross Revenue (in percentage)*
Q1 Q2 Q3 Q4 Q1 Q2 Q3 Q4 Q1 Q2 Q3 Q4 Q1 Q2 Q3 Q4 Q1 Q2 Q3 Q4 Q1 Q2
2.776.729.5610.42 5.358.5310.4510.06 5.038.417.6211.68 8.518.5110.148.45 6.208.478.7410.10 8.1810.57TOTAL
2001 2002 2003 2004 2005 2006 2007 2008 2009 2010 2011 2012 2013 2014 2015 2016 2017 2018
Q4 Q4 Q4 Q4 Q4 Q4 Q4 Q4 Q4 Q4 Q4 Q4 Q4 Q4 Q4 Q4 Q4 Q1 Q2
$0
$50,000
$100,000
$150,000
in billions
Graph 11Notional Amounts of Interest Rate and FX + Gold Contracts by MaturityInsured U.S. Commercial Banks and Savings Associations
Interest Rate
IR: < 1 yr IR: 1-5 yr IR: > 5 yrs
2001 2002 2003 2004 2005 2006 2007 2008 2009 2010 2011 2012 2013 2014 2015 2016 2017 2018
Q4 Q4 Q4 Q4 Q4 Q4 Q4 Q4 Q4 Q4 Q4 Q4 Q4 Q4 Q4 Q4 Q4 Q1 Q2
$0
$10,000
$20,000
$30,000
$40,000
in billions
FX & Gold
FX&GOLD: < 1 yr FX&GOLD: 1-5 yr FX&GOLD: > 5 yrs
2001
Q4
2002
Q4
2003
Q4
2004
Q4
2005
Q4
2006
Q4
2007
Q4
2008
Q4
2009
Q4
2010
Q4
2011
Q4
2012
Q4
2013
Q4
2014
Q4
2015
Q4
2016
Q4
2017
Q4
2018
Q1 Q2
IR: < 1 yr
IR: 1-5 yr
IR: > 5 yrs
FX&GOLD: < 1 yr
FX&GOLD: 1-5 yr
FX&GOLD: > 5 yrs 499
686
3,816
7,451
11,709
$10,379
439
857
4,078
9,735
14,328
$12,982
582
1,146
4,510
13,117
20,404
$13,581
762
1,317
5,384
16,492
25,893
$15,921
689
1,381
5,728
19,825
27,683
$18,483
594
1,452
7,730
23,273
31,386
$29,552
622
1,639
11,660
27,724
37,222
$39,085
1,082
2,195
10,640
36,868
47,456
$58,618
1,347
2,473
10,490
26,374
33,970
$81,236
1,290
2,462
14,629
24,307
33,497
$90,843
1,503
3,117
17,632
24,168
32,750
$87,812
1,480
2,910
18,386
21,175
30,191
$82,948
1,029
2,341
18,372
24,630
44,157
$77,758
969
2,587
22,145
22,214
33,727
$71,808
1,648
3,986
24,130
32,981
49,406
$55,054
2,420
4,454
23,912
29,762
43,261
$55,061
2,525
4,805
24,380
23,565
36,154
$72,589
2,473
4,906
31,341
24,372
42,276
$91,957
2,630
5,022
29,696
23,686
40,334
$95,439
In billions of dollars
Note: Figures above exclude FX contracts with an original maturity of 14 days or less, written options, basis swaps, and any other contracts not subject to risk-based capital requirements.Effective Q1 2015, the reporting form and call report instructions changed. Schedule RC-R now requires banks to report gold and FX notionals in aggregate, rather than separately.Source: Call reports
2001 2002 2003 2004 2005 2006 2007 2008 2009 2010 2011 2012 2013 2014 2015 2016 2017 2018
Q4 Q4 Q4 Q4 Q4 Q4 Q4 Q4 Q4 Q4 Q4 Q4 Q4 Q4 Q4 Q4 Q4 Q1 Q2
$0
$5
$10
$15
$20
$25
$30
$35
$40
$45
in billions
Graph 12Notional Amounts of Precious Metal Contracts by MaturityInsured U.S. Commercial Banks and Savings Associations
Precious Metals
2001
Q4
2002
Q4
2003
Q4
2004
Q4
2005
Q4
2006
Q4
2007
Q4
2008
Q4
2009
Q4
2010
Q4
2011
Q4
2012
Q4
2013
Q4
2014
Q4
2015
Q4
2016
Q4
2017
Q4
2018
Q1 Q2
Precious Metals: < 1 yr
Precious Metals: 1-5 yr
Precious Metals: > 5 yrs 0.00
0.23
2.44
0.00
0.46
2.72
0.00
0.33
3.87
0.00
0.51
4.04
0.06
1.29
8.59
0.33
1.75
10.35
0.01
2.10
10.72
0.00
1.51
7.55
0.00
1.24
11.55
0.03
1.89
17.47
0.10
4.74
21.12
0.03
5.82
27.68
0.00
3.80
21.41
0.29
2.84
19.29
0.07
3.92
23.51
0.02
2.49
25.07
0.01
2.38
28.62
0.01
3.61
43.18
0.01
2.82
36.84
In billions of dollars
Precious Metals: < 1 yr Precious Metals: 1-5 yr Precious Metals: > 5 yrs
Note: Figures exclude FX contracts with an original maturity of 14 days or less, written options, basis swaps, and any other contracts not subject to risk-based capital requirements.Source: Call reports

2001 2002 2003 2004 2005 2006 2007 2008 2009 2010 2011 2012 2013 2014 2015 2016 2017 2018
Q4 Q4 Q4 Q4 Q4 Q4 Q4 Q4 Q4 Q4 Q4 Q4 Q4 Q4 Q4 Q4 Q4 Q1 Q2
$0
$500
$1,000
in billions
Graph 13Notional Amounts of Commodity and Equity Contracts by MaturityInsured U.S. Commercial Banks and Savings Associations
Commodity
Commodity: < 1 yr Commodity: 1-5 yr Commodity: > 5yrs
2001 2002 2003 2004 2005 2006 2007 2008 2009 2010 2011 2012 2013 2014 2015 2016 2017 2018
Q4 Q4 Q4 Q4 Q4 Q4 Q4 Q4 Q4 Q4 Q4 Q4 Q4 Q4 Q4 Q4 Q4 Q1 Q2
$0
$1,000
$2,000
$3,000
in billions
Equity
2001
Q4
2002
Q4
2003
Q4
2004
Q4
2005
Q4
2006
Q4
2007
Q4
2008
Q4
2009
Q4
2010
Q4
2011
Q4
2012
Q4
2013
Q4
2014
Q4
2015
Q4
2016
Q4
2017
Q4
2018
Q1 Q2
Commodity: < 1 yr
Commodity: 1-5 yr
Commodity: > 5yrs
Equity: < 1 yr
Equity: 1-5 yr
Equity: > 5 yrs 18
209
121
2
25
$31
25
249
127
9
35
$55
84
674
197
14
103
$43
140
736
273
40
205
$64
383
1,428
321
175
707
$133
45
221
341
20
235
$185
70
297
473
25
297
$206
72
256
409
43
233
$179
82
228
312
33
198
$176
85
191
296
25
209
$203
94
210
427
46
209
$261
82
262
627
28
208
$261
136
291
645
6
144
$235
101
352
996
20
164
$257
130
628
1,743
22
197
$668
123
677
1,842
23
179
$750
113
733
2,296
25
202
$883
124
868
2,679
14
219
$898
139
843
2,747
11
193
$1,043
In billions of dollars
Equity: < 1 yr Equity: 1-5 yr Equity: > 5 yrs
Note: Figures above exclude foreign exchange contracts with an original maturity of 14 days or less, written options, basis swaps, and any other contracts not subject to risk-based capital requirements.Source: Call reports
2010 2011 2012 2013 2014 2015 2016 2017 2018
Q1 Q2 Q3 Q4 Q1 Q2 Q3 Q4 Q1 Q2 Q3 Q4 Q1 Q2 Q3 Q4 Q1 Q2 Q3 Q4 Q1 Q2 Q3 Q4 Q1 Q2 Q3 Q4 Q1 Q2 Q3 Q4 Q1 Q2
$0
$2,000
$4,000
$6,000
$8,000
$10,000
$12,000
$14,000
$16,000
in billions
Graph 14Notional Amounts of Credit Derivative Contracts by Credit Quality and MaturityInsured U.S. Commercial Banks and Savings Associations
2013
Q1 Q2 Q3 Q4
2014
Q1 Q2 Q3 Q4
2015
Q1 Q2 Q3 Q4
2016
Q1 Q2 Q3 Q4
2017
Q1 Q2 Q3 Q4
2018
Q1 Q2
Investment-Grade: < 1yr
Investment-Grade: 1-5 yrs
Investment-Grade: > 5 yrs
Total Investment Grade $7,455
409
5,661
$1,384
$8,228
552
6,127
$1,548
$8,541
455
6,536
$1,550
$8,906
948
6,168
$1,790
$6,764
382
5,007
$1,375
$7,633
433
5,722
$1,478
$8,064
448
5,909
$1,707
$8,218
577
6,227
$1,414
$4,990
281
3,328
$1,380
$5,898
520
4,108
$1,270
$6,101
359
4,450
$1,292
$6,413
508
4,649
$1,256
$3,732
214
2,170
$1,348
$4,601
385
2,765
$1,451
$4,911
262
3,101
$1,549
$5,328
457
3,400
$1,471
$3,016
186
1,897
$934
$3,647
345
2,085
$1,216
$3,502
195
2,073
$1,234
$3,724
309
2,072
$1,343
$2,984
184
1,995
$805
$3,050
331
1,839
$880
In billions of dollars
2013
Q1 Q2 Q3 Q4
2014
Q1 Q2 Q3 Q4
2015
Q1 Q2 Q3 Q4
2016
Q1 Q2 Q3 Q4
2017
Q1 Q2 Q3 Q4
2018
Q1 Q2
Sub-Investment-Grade: < 1yr
Sub-Investment-Grade: 1-5 yrs
Sub-Investment-Grade: > 5 yrs
Total Sub-Investment Grade $3,736
179
2,792
$765
$4,565
262
3,424
$879
$4,786
197
3,656
$933
$4,995
414
3,491
$1,090
$2,685
140
1,887
$658
$2,775
157
1,948
$671
$2,763
160
1,960
$642
$2,946
200
2,127
$619
$1,997
119
1,271
$607
$2,299
213
1,518
$569
$2,387
152
1,673
$562
$2,604
194
1,813
$596
$1,561
111
869
$581
$1,962
157
1,122
$683
$1,943
101
1,159
$683
$2,090
155
1,313
$622
$1,170
77
718
$375
$1,443
149
814
$480
$1,432
93
830
$509
$1,579
159
838
$582
$1,195
69
791
$335
$1,296
133
763
$400
Investment-Grade: < 1yr
Investment-Grade: 1-5 yrs
Investment-Grade: > 5 yrs
Sub-Investment-Grade: < 1yr
Sub-Investment-Grade: 1-5 yrs
Sub-Investment-Grade: > 5 yrs
Note: Figures exclude FX contracts with an original maturity of 14 days or less, written options, basis swaps, and any other contracts not subject to risk-based capital requirements.Source: Call reports

Interest Rate Foreign Exchange Equity Precious Metals Credit
Investment Grade Non-Investment Grade
OtherBank of America NA
Citibank NA
Goldman Sachs
HSBC NA
JPMorgan Chase Bank NA
Morgan Stanley Bank NA
Wells Fargo Bank NA
Bank of America NA
Citibank NA
Goldman Sachs
HSBC NA
JPMorgan Chase Bank NA
Morgan Stanley Bank NA
Wells Fargo Bank NA
Bank of America NA
Citibank NA
Goldman Sachs
HSBC NA
JPMorgan Chase Bank NA
Morgan Stanley Bank NA
Wells Fargo Bank NA
Bank of America NA
Citibank NA
Goldman Sachs
HSBC NA
JPMorgan Chase Bank NA
Morgan Stanley Bank NA
Wells Fargo Bank NA
Bank of America NA
Citibank NA
Goldman Sachs
HSBC NA
JPMorgan Chase Bank NA
Morgan Stanley Bank NA
Wells Fargo Bank NA
Bank of America NA
Citibank NA
Goldman Sachs
HSBC NA
JPMorgan Chase Bank NA
Morgan Stanley Bank NA
Wells Fargo Bank NA
Bank of America NA
Citibank NA
Goldman Sachs
HSBC NA
JPMorgan Chase Bank NA
Morgan Stanley Bank NA
Wells Fargo Bank NA
$0
$20,000
$40,000
in billions
Graph 152018 Q2 Notional Amounts of Over-the-Counter and Centrally Cleared Derivative ContractsInsured U.S. Commercial Banks and Savings Associations
Bank Name
Interest Rate
CentrallyCleared
Over-the-Counter
Foreign Exchange
CentrallyCleared
Over-the-Counter
Equity
CentrallyCleared
Over-the-Counter
Precious Metals
CentrallyCleared
Over-the-Counter
Credit
Investment Grade
CentrallyCleared
Over-the-Counter
Non-InvestmentGrade
CentrallyCleared
Over-the-Counter
Other
CentrallyCleared
Over-the-Counter
JPMorgan Chase Bank NACitibank NABank of America NAGoldman SachsHSBC NAWells Fargo Bank NAMorgan Stanley Bank NAGrand Total 75,806
61,906626
31,4394,1499,08728,593
80,0980
5,6823,4327,24612,48223,72227,534
34,8391774091,1182,6475,41413,08411,991
60700281166328174
2,65809181323095071,638
98503600
10537807
42021000922
40000040
1,9868110852751,070538
8640040
204233422
9382162768123336365
33300404559225
8840231521133700
1960340007389
In billions of dollars
Bank Name
Interest Rate
CentrallyCleared
Over-the-Counter
Foreign Exchange
CentrallyCleared
Over-the-Counter
Equity
CentrallyCleared
Over-the-Counter
Precious Metals
CentrallyCleared
Over-the-Counter
Credit
Investment Grade
CentrallyCleared
Over-the-Counter
Non-InvestmentGrade
CentrallyCleared
Over-the-Counter
Other
CentrallyCleared
Over-the-Counter
JPMorgan Chase Bank NACitibank NABank of America NAGoldman SachsHSBC NAWells Fargo Bank NAMorgan Stanley Bank NA 100%
25%15%81%25%28%51%
0%75%85%19%75%72%49%
100%100%98%100%99%98%99%
0%0%2%0%1%2%1%
100%71%100%100%75%93%67%
0%29%0%0%25%7%33%
100%100%
66%100%
0%0%
34%0%
100%70%71%100%57%82%56%
0%30%29%0%43%18%44%
100%99%88%100%73%85%62%
0%1%12%0%27%15%38%
40%100%100%100%65%89%
60%0%0%0%35%11%
% of Total
1,1351,567 3,2740 270 00 90 150 510
76,94181,664 38,113608 2,686985 424 1,995864 953333 935196
TotalCentrallyCleared
Over-the-
Counter
TotalNotional
200,2401938,2015,34141,53223,19348,68273,097
117,1531932,4481,87334,27610,29024,22643,847
83,0870
5,7533,4687,25612,90324,45629,250
6,0804,5121,568
206,320121,66584,655
TotalCentrallyClearedas a % ofTotal
Notional
TotalOver-the-Counteras a % ofTotal
Notional
100%30%35%83%44%50%60%
0%70%65%17%56%50%40%
Over-the-Counter
Total CentrallyCleared
$0
$50,000
$100,000
ALL BANKS
TOTAL
ALL OTHER
Source: Call reports, Schedule RC-R
Centrally Cleared
Over-the-Counter

2009 2010 2011 2012 2013 2014 2015 2016 2017 2018
$0
$50
$100
$150
$200
$250
$300
in millions
Graph 16Value-at-Risk (VaR)
Bank of America Corporation Citigroup Inc. JPMorgan Chase & Co. Morgan Stanley The Goldman Sachs Group, Inc.
2012
Q1 Q2 Q3 Q4
2013
Q1 Q2 Q3 Q4
2014
Q1 Q2 Q3 Q4
2015
Q1 Q2 Q3 Q4
2016
Q1 Q2 Q3 Q4
2017
Q1 Q2 Q3 Q4
2018
Q1 Q2
Bank of America Corporation
Citigroup Inc.
JPMorgan Chase & Co.
Morgan Stanley
The Goldman Sachs Group, Inc.
Total 513
76
78
122
137
$100
443
81
63
115
129
$55
581
92
76
201
149
$63
611
95
84
170
178
$84
403
79
51
43
139
$91
354
84
52
47
117
$54
376
81
61
45
120
$69
422
76
72
73
110
$91
329
61
48
39
120
$61
323
68
42
36
121
$56
374
77
48
55
135
$59
414
82
50
42
156
$84
329
72
50
47
108
$52
357
74
53
54
116
$60
347
77
54
42
113
$61
373
81
47
43
131
$71
268
61
39
40
86
$42
274
57
42
43
85
$47
295
62
46
45
88
$54
330
72
46
54
108
$50
260
54
38
34
93
$41
256
47
43
30
89
$47
273
51
51
27
96
$48
277
64
44
25
100
$44
267
64
44
35
90
$34
309
73
46
43
102
$45
In millions of dollars
Source: 10Q, 10k U.S.Securities and Exchange Commission Reports
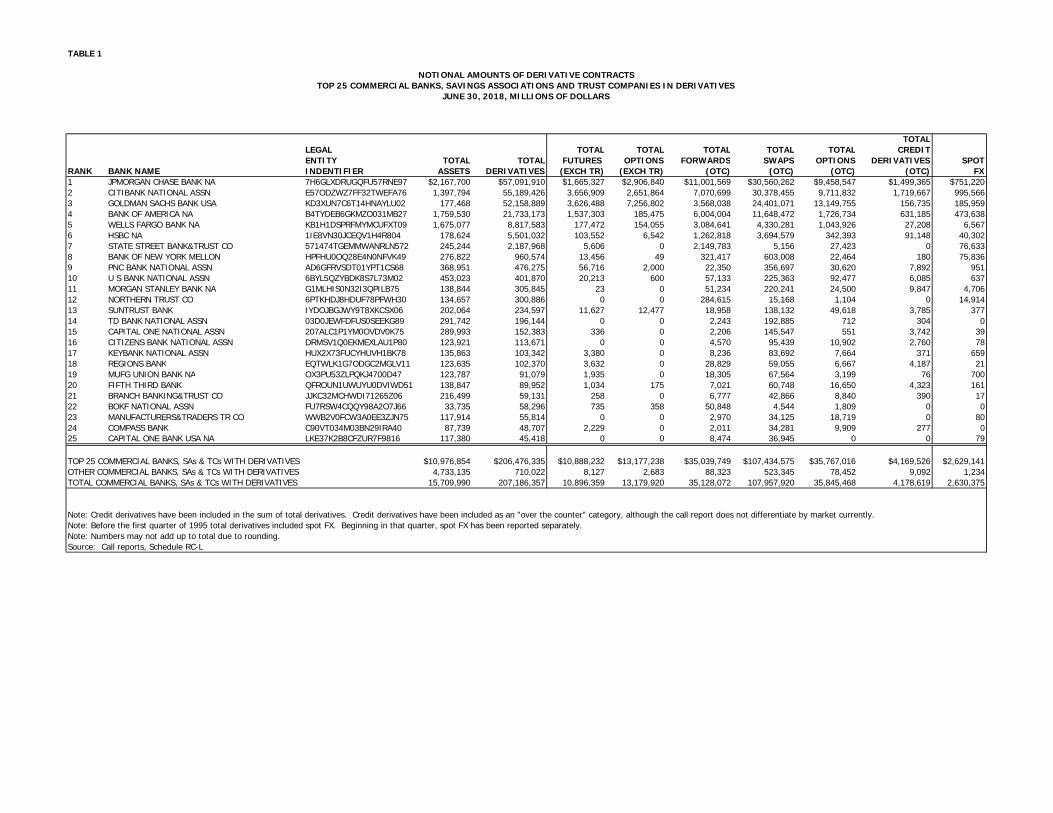
TABLE 1
TOTALLEGAL TOTAL TOTAL TOTAL TOTAL TOTAL CREDITENTITY TOTAL TOTAL FUTURES OPTIONS FORWARDS SWAPS OPTIONS DERIVATIVES SPOT
RANK BANK NAME INDENTIFIER ASSETS DERIVATIVES (EXCH TR) (EXCH TR) (OTC) (OTC) (OTC) (OTC) FX1 JPMORGAN CHASE BANK NA 7H6GLXDRUGQFU57RNE97 $2,167,700 $57,091,910 $1,665,327 $2,906,840 $11,001,569 $30,560,262 $9,458,547 $1,499,365 $751,2202 CITIBANK NATIONAL ASSN E57ODZWZ7FF32TWEFA76 1,397,794 55,189,426 3,656,909 2,651,864 7,070,699 30,378,455 9,711,832 1,719,667 995,5663 GOLDMAN SACHS BANK USA KD3XUN7C6T14HNAYLU02 177,468 52,158,889 3,626,488 7,256,802 3,568,038 24,401,071 13,149,755 156,735 185,9594 BANK OF AMERICA NA B4TYDEB6GKMZO031MB27 1,759,530 21,733,173 1,537,303 185,475 6,004,004 11,648,472 1,726,734 631,185 473,6385 WELLS FARGO BANK NA KB1H1DSPRFMYMCUFXT09 1,675,077 8,817,583 177,472 154,055 3,084,641 4,330,281 1,043,926 27,208 6,5676 HSBC NA 1IE8VN30JCEQV1H4R804 178,624 5,501,032 103,552 6,542 1,262,818 3,694,579 342,393 91,148 40,3027 STATE STREET BANK&TRUST CO 571474TGEMMWANRLN572 245,244 2,187,968 5,606 0 2,149,783 5,156 27,423 0 76,6338 BANK OF NEW YORK MELLON HPFHU0OQ28E4N0NFVK49 276,822 960,574 13,456 49 321,417 603,008 22,464 180 75,8369 PNC BANK NATIONAL ASSN AD6GFRVSDT01YPT1CS68 368,951 476,275 56,716 2,000 22,350 356,697 30,620 7,892 95110 U S BANK NATIONAL ASSN 6BYL5QZYBDK8S7L73M02 453,023 401,870 20,213 600 57,133 225,363 92,477 6,085 63711 MORGAN STANLEY BANK NA G1MLHIS0N32I3QPILB75 138,844 305,845 23 0 51,234 220,241 24,500 9,847 4,70612 NORTHERN TRUST CO 6PTKHDJ8HDUF78PFWH30 134,657 300,886 0 0 284,615 15,168 1,104 0 14,91413 SUNTRUST BANK IYDOJBGJWY9T8XKCSX06 202,064 234,597 11,627 12,477 18,958 138,132 49,618 3,785 37714 TD BANK NATIONAL ASSN 03D0JEWFDFUS0SEEKG89 291,742 196,144 0 0 2,243 192,885 712 304 015 CAPITAL ONE NATIONAL ASSN 207ALC1P1YM0OVDV0K75 289,993 152,383 336 0 2,206 145,547 551 3,742 3916 CITIZENS BANK NATIONAL ASSN DRMSV1Q0EKMEXLAU1P80 123,921 113,671 0 0 4,570 95,439 10,902 2,760 7817 KEYBANK NATIONAL ASSN HUX2X73FUCYHUVH1BK78 135,863 103,342 3,380 0 8,236 83,692 7,664 371 65918 REGIONS BANK EQTWLK1G7ODGC2MGLV11 123,635 102,370 3,632 0 28,829 59,055 6,667 4,187 2119 MUFG UNION BANK NA OX3PU53ZLPQKJ4700D47 123,787 91,079 1,935 0 18,305 67,564 3,199 76 70020 FIFTH THIRD BANK QFROUN1UWUYU0DVIWD51 138,847 89,952 1,034 175 7,021 60,748 16,650 4,323 16121 BRANCH BANKING&TRUST CO JJKC32MCHWDI71265Z06 216,499 59,131 258 0 6,777 42,866 8,840 390 1722 BOKF NATIONAL ASSN FU7RSW4CQQY98A2O7J66 33,735 58,296 735 358 50,848 4,544 1,809 0 023 MANUFACTURERS&TRADERS TR CO WWB2V0FCW3A0EE3ZJN75 117,914 55,814 0 0 2,970 34,125 18,719 0 8024 COMPASS BANK C90VT034M03BN29IRA40 87,739 48,707 2,229 0 2,011 34,281 9,909 277 025 CAPITAL ONE BANK USA NA LKE37K2B8CFZUR7F9816 117,380 45,418 0 0 8,474 36,945 0 0 79
TOP 25 COMMERCIAL BANKS, SAs & TCs WITH DERIVATIVES $10,976,854 $206,476,335 $10,888,232 $13,177,238 $35,039,749 $107,434,575 $35,767,016 $4,169,526 $2,629,141OTHER COMMERCIAL BANKS, SAs & TCs WITH DERIVATIVES 4,733,135 710,022 8,127 2,683 88,323 523,345 78,452 9,092 1,234TOTAL COMMERCIAL BANKS, SAs & TCs WITH DERIVATIVES 15,709,990 207,186,357 10,896,359 13,179,920 35,128,072 107,957,920 35,845,468 4,178,619 2,630,375
Note: Before the first quarter of 1995 total derivatives included spot FX. Beginning in that quarter, spot FX has been reported separately.Note: Numbers may not add up to total due to rounding.Source: Call reports, Schedule RC-L
NOTIONAL AMOUNTS OF DERIVATIVE CONTRACTSTOP 25 COMMERCIAL BANKS, SAVINGS ASSOCIATIONS AND TRUST COMPANIES IN DERIVATIVES
JUNE 30, 2018, MILLIONS OF DOLLARS
Note: Credit derivatives have been included in the sum of total derivatives. Credit derivatives have been included as an "over the counter" category, although the call report does not differentiate by market currently.
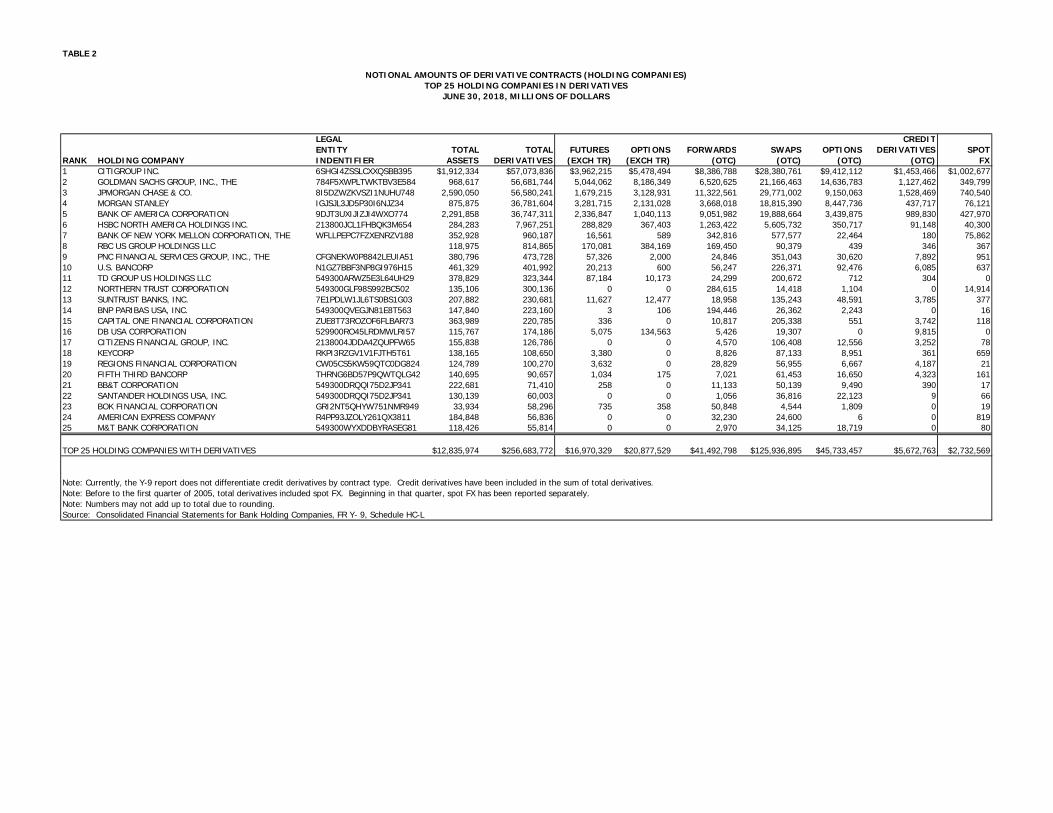
TABLE 2
LEGAL CREDITENTITY TOTAL TOTAL FUTURES OPTIONS FORWARDS SWAPS OPTIONS DERIVATIVES SPOT
RANK HOLDING COMPANY INDENTIFIER ASSETS DERIVATIVES (EXCH TR) (EXCH TR) (OTC) (OTC) (OTC) (OTC) FX1 CITIGROUP INC. 6SHGI4ZSSLCXXQSBB395 $1,912,334 $57,073,836 $3,962,215 $5,478,494 $8,386,788 $28,380,761 $9,412,112 $1,453,466 $1,002,6772 GOLDMAN SACHS GROUP, INC., THE 784F5XWPLTWKTBV3E584 968,617 56,681,744 5,044,062 8,186,349 6,520,625 21,166,463 14,636,783 1,127,462 349,7993 JPMORGAN CHASE & CO. 8I5DZWZKVSZI1NUHU748 2,590,050 56,580,241 1,679,215 3,128,931 11,322,561 29,771,002 9,150,063 1,528,469 740,5404 MORGAN STANLEY IGJSJL3JD5P30I6NJZ34 875,875 36,781,604 3,281,715 2,131,028 3,668,018 18,815,390 8,447,736 437,717 76,1215 BANK OF AMERICA CORPORATION 9DJT3UXIJIZJI4WXO774 2,291,858 36,747,311 2,336,847 1,040,113 9,051,982 19,888,664 3,439,875 989,830 427,9706 HSBC NORTH AMERICA HOLDINGS INC. 213800JCL1FHBQK3M654 284,283 7,967,251 288,829 367,403 1,263,422 5,605,732 350,717 91,148 40,3007 BANK OF NEW YORK MELLON CORPORATION, THE WFLLPEPC7FZXENRZV188 352,928 960,187 16,561 589 342,816 577,577 22,464 180 75,8628 RBC US GROUP HOLDINGS LLC 118,975 814,865 170,081 384,169 169,450 90,379 439 346 3679 PNC FINANCIAL SERVICES GROUP, INC., THE CFGNEKW0P8842LEUIA51 380,796 473,728 57,326 2,000 24,846 351,043 30,620 7,892 95110 U.S. BANCORP N1GZ7BBF3NP8GI976H15 461,329 401,992 20,213 600 56,247 226,371 92,476 6,085 63711 TD GROUP US HOLDINGS LLC 549300ARWZ5E3L64UH29 378,829 323,344 87,184 10,173 24,299 200,672 712 304 012 NORTHERN TRUST CORPORATION 549300GLF98S992BC502 135,106 300,136 0 0 284,615 14,418 1,104 0 14,91413 SUNTRUST BANKS, INC. 7E1PDLW1JL6TS0BS1G03 207,882 230,681 11,627 12,477 18,958 135,243 48,591 3,785 37714 BNP PARIBAS USA, INC. 549300QVEGJN81E8T563 147,840 223,160 3 106 194,446 26,362 2,243 0 1615 CAPITAL ONE FINANCIAL CORPORATION ZUE8T73ROZOF6FLBAR73 363,989 220,785 336 0 10,817 205,338 551 3,742 11816 DB USA CORPORATION 529900RO45LRDMWLRI57 115,767 174,186 5,075 134,563 5,426 19,307 0 9,815 017 CITIZENS FINANCIAL GROUP, INC. 2138004JDDA4ZQUPFW65 155,838 126,786 0 0 4,570 106,408 12,556 3,252 7818 KEYCORP RKPI3RZGV1V1FJTH5T61 138,165 108,650 3,380 0 8,826 87,133 8,951 361 65919 REGIONS FINANCIAL CORPORATION CW05CS5KW59QTC0DG824 124,789 100,270 3,632 0 28,829 56,955 6,667 4,187 2120 FIFTH THIRD BANCORP THRNG6BD57P9QWTQLG42 140,695 90,657 1,034 175 7,021 61,453 16,650 4,323 16121 BB&T CORPORATION 549300DRQQI75D2JP341 222,681 71,410 258 0 11,133 50,139 9,490 390 1722 SANTANDER HOLDINGS USA, INC. 549300DRQQI75D2JP341 130,139 60,003 0 0 1,056 36,816 22,123 9 6623 BOK FINANCIAL CORPORATION GRI2NT5QHYW751NMR949 33,934 58,296 735 358 50,848 4,544 1,809 0 1924 AMERICAN EXPRESS COMPANY R4PP93JZOLY261QX3811 184,848 56,836 0 0 32,230 24,600 6 0 81925 M&T BANK CORPORATION 549300WYXDDBYRASEG81 118,426 55,814 0 0 2,970 34,125 18,719 0 80
TOP 25 HOLDING COMPANIES WITH DERIVATIVES $12,835,974 $256,683,772 $16,970,329 $20,877,529 $41,492,798 $125,936,895 $45,733,457 $5,672,763 $2,732,569
Note: Currently, the Y-9 report does not differentiate credit derivatives by contract type. Credit derivatives have been included in the sum of total derivatives.Note: Before to the first quarter of 2005, total derivatives included spot FX. Beginning in that quarter, spot FX has been reported separately.Note: Numbers may not add up to total due to rounding.Source: Consolidated Financial Statements for Bank Holding Companies, FR Y- 9, Schedule HC-L
NOTIONAL AMOUNTS OF DERIVATIVE CONTRACTS (HOLDING COMPANIES)TOP 25 HOLDING COMPANIES IN DERIVATIVES
JUNE 30, 2018, MILLIONS OF DOLLARS
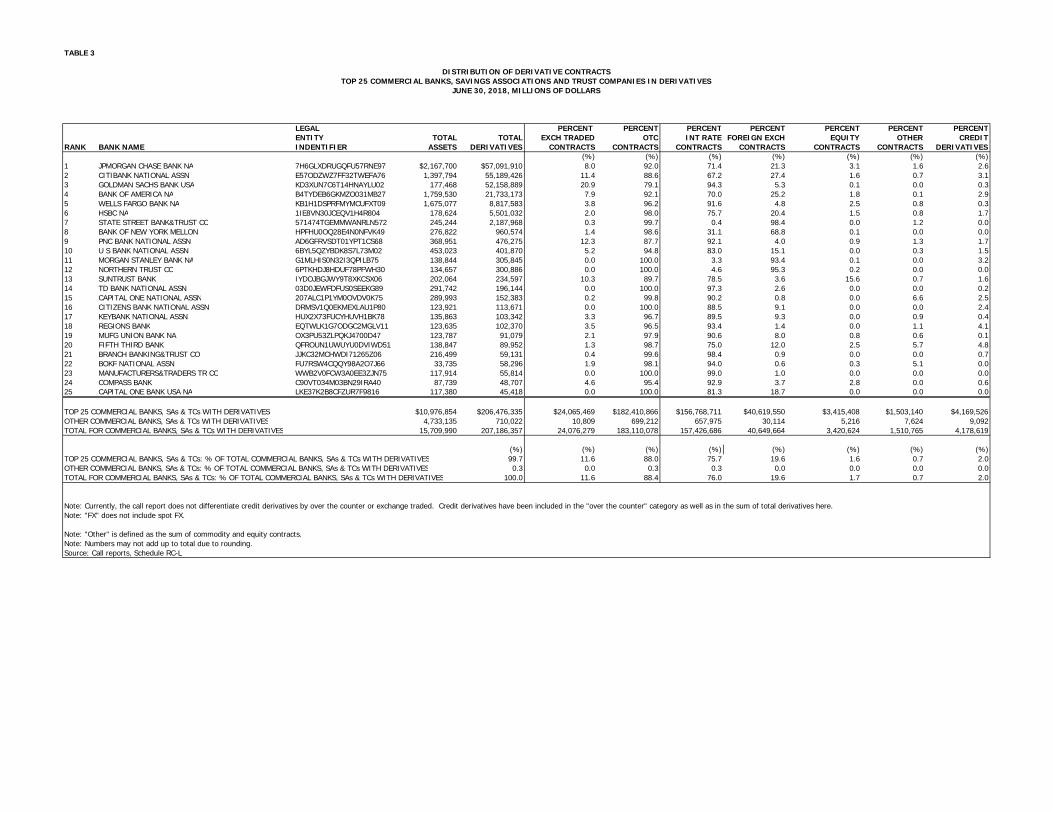
TABLE 3
LEGAL PERCENT PERCENT PERCENT PERCENT PERCENT PERCENT PERCENTENTITY TOTAL TOTAL EXCH TRADED OTC INT RATE FOREIGN EXCH EQUITY OTHER CREDIT
RANK BANK NAME INDENTIFIER ASSETS DERIVATIVES CONTRACTS CONTRACTS CONTRACTS CONTRACTS CONTRACTS CONTRACTS DERIVATIVES(%) (%) (%) (%) (%) (%) (%)
1 JPMORGAN CHASE BANK NA 7H6GLXDRUGQFU57RNE97 $2,167,700 $57,091,910 8.0 92.0 71.4 21.3 3.1 1.6 2.62 CITIBANK NATIONAL ASSN E57ODZWZ7FF32TWEFA76 1,397,794 55,189,426 11.4 88.6 67.2 27.4 1.6 0.7 3.13 GOLDMAN SACHS BANK USA KD3XUN7C6T14HNAYLU02 177,468 52,158,889 20.9 79.1 94.3 5.3 0.1 0.0 0.34 BANK OF AMERICA NA B4TYDEB6GKMZO031MB27 1,759,530 21,733,173 7.9 92.1 70.0 25.2 1.8 0.1 2.95 WELLS FARGO BANK NA KB1H1DSPRFMYMCUFXT09 1,675,077 8,817,583 3.8 96.2 91.6 4.8 2.5 0.8 0.36 HSBC NA 1IE8VN30JCEQV1H4R804 178,624 5,501,032 2.0 98.0 75.7 20.4 1.5 0.8 1.77 STATE STREET BANK&TRUST CO 571474TGEMMWANRLN572 245,244 2,187,968 0.3 99.7 0.4 98.4 0.0 1.2 0.08 BANK OF NEW YORK MELLON HPFHU0OQ28E4N0NFVK49 276,822 960,574 1.4 98.6 31.1 68.8 0.1 0.0 0.09 PNC BANK NATIONAL ASSN AD6GFRVSDT01YPT1CS68 368,951 476,275 12.3 87.7 92.1 4.0 0.9 1.3 1.710 U S BANK NATIONAL ASSN 6BYL5QZYBDK8S7L73M02 453,023 401,870 5.2 94.8 83.0 15.1 0.0 0.3 1.511 MORGAN STANLEY BANK NA G1MLHIS0N32I3QPILB75 138,844 305,845 0.0 100.0 3.3 93.4 0.1 0.0 3.212 NORTHERN TRUST CO 6PTKHDJ8HDUF78PFWH30 134,657 300,886 0.0 100.0 4.6 95.3 0.2 0.0 0.013 SUNTRUST BANK IYDOJBGJWY9T8XKCSX06 202,064 234,597 10.3 89.7 78.5 3.6 15.6 0.7 1.614 TD BANK NATIONAL ASSN 03D0JEWFDFUS0SEEKG89 291,742 196,144 0.0 100.0 97.3 2.6 0.0 0.0 0.215 CAPITAL ONE NATIONAL ASSN 207ALC1P1YM0OVDV0K75 289,993 152,383 0.2 99.8 90.2 0.8 0.0 6.6 2.516 CITIZENS BANK NATIONAL ASSN DRMSV1Q0EKMEXLAU1P80 123,921 113,671 0.0 100.0 88.5 9.1 0.0 0.0 2.417 KEYBANK NATIONAL ASSN HUX2X73FUCYHUVH1BK78 135,863 103,342 3.3 96.7 89.5 9.3 0.0 0.9 0.418 REGIONS BANK EQTWLK1G7ODGC2MGLV11 123,635 102,370 3.5 96.5 93.4 1.4 0.0 1.1 4.119 MUFG UNION BANK NA OX3PU53ZLPQKJ4700D47 123,787 91,079 2.1 97.9 90.6 8.0 0.8 0.6 0.120 FIFTH THIRD BANK QFROUN1UWUYU0DVIWD51 138,847 89,952 1.3 98.7 75.0 12.0 2.5 5.7 4.821 BRANCH BANKING&TRUST CO JJKC32MCHWDI71265Z06 216,499 59,131 0.4 99.6 98.4 0.9 0.0 0.0 0.722 BOKF NATIONAL ASSN FU7RSW4CQQY98A2O7J66 33,735 58,296 1.9 98.1 94.0 0.6 0.3 5.1 0.023 MANUFACTURERS&TRADERS TR CO WWB2V0FCW3A0EE3ZJN75 117,914 55,814 0.0 100.0 99.0 1.0 0.0 0.0 0.024 COMPASS BANK C90VT034M03BN29IRA40 87,739 48,707 4.6 95.4 92.9 3.7 2.8 0.0 0.625 CAPITAL ONE BANK USA NA LKE37K2B8CFZUR7F9816 117,380 45,418 0.0 100.0 81.3 18.7 0.0 0.0 0.0
TOP 25 COMMERCIAL BANKS, SAs & TCs WITH DERIVATIVES $10,976,854 $206,476,335 $24,065,469 $182,410,866 $156,768,711 $40,619,550 $3,415,408 $1,503,140 $4,169,526OTHER COMMERCIAL BANKS, SAs & TCs WITH DERIVATIVES 4,733,135 710,022 10,809 699,212 657,975 30,114 5,216 7,624 9,092TOTAL FOR COMMERCIAL BANKS, SAs & TCs WITH DERIVATIVES 15,709,990 207,186,357 24,076,279 183,110,078 157,426,686 40,649,664 3,420,624 1,510,765 4,178,619
(%) (%) (%) (%) (%) (%) (%) (%)TOP 25 COMMERCIAL BANKS, SAs & TCs: % OF TOTAL COMMERCIAL BANKS, SAs & TCs WITH DERIVATIVES 99.7 11.6 88.0 75.7 19.6 1.6 0.7 2.0OTHER COMMERCIAL BANKS, SAs & TCs: % OF TOTAL COMMERCIAL BANKS, SAs & TCs WITH DERIVATIVES 0.3 0.0 0.3 0.3 0.0 0.0 0.0 0.0TOTAL FOR COMMERCIAL BANKS, SAs & TCs: % OF TOTAL COMMERCIAL BANKS, SAs & TCs WITH DERIVATIVES 100.0 11.6 88.4 76.0 19.6 1.7 0.7 2.0
Note: "FX" does not include spot FX.
Note: "Other" is defined as the sum of commodity and equity contracts.Note: Numbers may not add up to total due to rounding.Source: Call reports, Schedule RC-L
DISTRIBUTION OF DERIVATIVE CONTRACTSTOP 25 COMMERCIAL BANKS, SAVINGS ASSOCIATIONS AND TRUST COMPANIES IN DERIVATIVES
JUNE 30, 2018, MILLIONS OF DOLLARS
Note: Currently, the call report does not differentiate credit derivatives by over the counter or exchange traded. Credit derivatives have been included in the "over the counter" category as well as in the sum of total derivatives here.

TABLE 4
BILATERALLY TOTAL CREDIT (%)LEGAL TOTAL NETTED CURRENT POTENTIAL EXPOSURE TOTAL CREDITENTITY TOTAL TOTAL RISK-BASED CREDIT FUTURE FROM ALL EXPOSURE
RANK BANK NAME INDENTIFIER ASSETS DERIVATIVES CAPITAL EXPOSURE EXPOSURE CONTRACTS TO CAPITAL1 JPMORGAN CHASE BANK NA 7H6GLXDRUGQFU57RNE97 $2,167,700 $57,091,910 $200,065 $139,436 $229,069 $368,505 1842 CITIBANK NATIONAL ASSN E57ODZWZ7FF32TWEFA76 1,397,794 55,189,426 154,654 68,544 146,274 214,818 1393 GOLDMAN SACHS BANK USA KD3XUN7C6T14HNAYLU02 177,468 52,158,889 31,150 55,041 64,473 119,514 3844 BANK OF AMERICA NA B4TYDEB6GKMZO031MB27 1,759,530 21,733,173 159,636 43,005 54,617 97,622 615 WELLS FARGO BANK NA KB1H1DSPRFMYMCUFXT09 1,675,077 8,817,583 163,069 15,701 27,338 43,039 266 HSBC NA 1IE8VN30JCEQV1H4R804 178,624 5,501,032 25,135 6,521 16,505 23,026 927 STATE STREET BANK&TRUST CO 571474TGEMMWANRLN572 245,244 2,187,968 17,633 8,429 12,868 21,297 1218 BANK OF NEW YORK MELLON HPFHU0OQ28E4N0NFVK49 276,822 960,574 21,234 4,865 5,346 10,211 489 PNC BANK NATIONAL ASSN AD6GFRVSDT01YPT1CS68 368,951 476,275 34,387 3,111 1,284 4,395 1310 U S BANK NATIONAL ASSN 6BYL5QZYBDK8S7L73M02 453,023 401,870 45,228 1,239 5,445 6,685 1511 MORGAN STANLEY BANK NA G1MLHIS0N32I3QPILB75 138,844 305,845 15,327 236 2,845 3,081 2012 NORTHERN TRUST CO 6PTKHDJ8HDUF78PFWH30 134,657 300,886 9,812 1,935 2,349 4,284 4413 SUNTRUST BANK IYDOJBGJWY9T8XKCSX06 202,064 234,597 22,380 1,081 2,583 3,664 1614 TD BANK NATIONAL ASSN 03D0JEWFDFUS0SEEKG89 291,742 196,144 26,398 2,578 1,160 3,737 1415 CAPITAL ONE NATIONAL ASSN 207ALC1P1YM0OVDV0K75 289,993 152,383 27,782 1,746 2,695 4,441 1616 CITIZENS BANK NATIONAL ASSN DRMSV1Q0EKMEXLAU1P80 123,921 113,671 14,143 319 773 1,092 817 KEYBANK NATIONAL ASSN HUX2X73FUCYHUVH1BK78 135,863 103,342 15,254 575 382 957 618 REGIONS BANK EQTWLK1G7ODGC2MGLV11 123,635 102,370 14,609 221 314 535 419 MUFG UNION BANK NA OX3PU53ZLPQKJ4700D47 123,787 91,079 15,016 566 272 838 620 FIFTH THIRD BANK QFROUN1UWUYU0DVIWD51 138,847 89,952 16,567 676 1,415 2,091 1321 BRANCH BANKING&TRUST CO JJKC32MCHWDI71265Z06 216,499 59,131 23,295 172 207 379 222 BOKF NATIONAL ASSN FU7RSW4CQQY98A2O7J66 33,735 58,296 3,186 3 12 16 023 MANUFACTURERS&TRADERS TR CO WWB2V0FCW3A0EE3ZJN75 117,914 55,814 12,569 82 208 290 224 COMPASS BANK C90VT034M03BN29IRA40 87,739 48,707 9,201 163 204 366 425 CAPITAL ONE BANK USA NA LKE37K2B8CFZUR7F9816 117,380 45,418 17,972 374 157 531 3
TOP 25 COMMERCIAL BANKS, SAs & TCs WITH DERIVATIVES $10,976,854 $206,476,335 $1,095,702 $356,618 $578,794 $935,412 85OTHER COMMERCIAL BANKS, SAs & TCs WITH DERIVATIVES 4,733,135 710,022 514,932 5,072 5,733 10,805 2TOTAL AMOUNT FOR COMMERCIAL BANKS, SAs & TCs WITH DERIVATIVES 15,709,990 207,186,357 1,610,634 361,690 584,527 946,218 59
Note: Total credit exposure is defined as the credit equivalent amount from derivative contracts (RC-R column B lines 20 and 21), which is the sum of netted current credit exposure and PFE.Note: The total credit exposure to capital ratio is calculated using risk based capital (tier 1 plus tier 2 capital). Note: Currently, the call report does not differentiate credit derivatives by contract type. Credit derivatives have been included in the sum of total derivatives here.Note: Numbers may not add up to total due to rounding.Source: Call reports, Schedule RC-R.
CREDIT EQUIVALENT EXPOSURESTOP 25 COMMERCIAL BANKS, SAVINGS ASSOCIATIONS AND TRUST COMPANIES IN DERIVATIVES
JUNE 30, 2018, MILLIONS OF DOLLARS
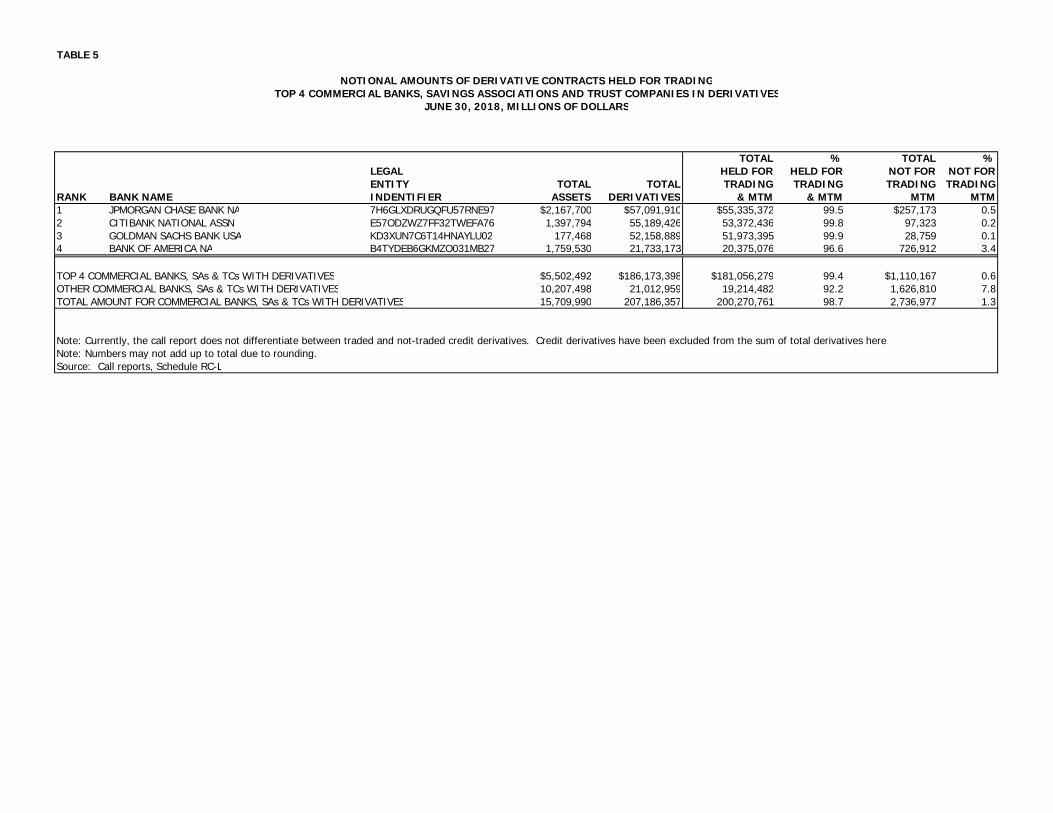
TABLE 5
TOTAL % TOTAL %LEGAL HELD FOR HELD FOR NOT FOR NOT FORENTITY TOTAL TOTAL TRADING TRADING TRADING TRADING
RANK BANK NAME INDENTIFIER ASSETS DERIVATIVES & MTM & MTM MTM MTM1 JPMORGAN CHASE BANK NA 7H6GLXDRUGQFU57RNE97 $2,167,700 $57,091,910 $55,335,372 99.5 $257,173 0.52 CITIBANK NATIONAL ASSN E57ODZWZ7FF32TWEFA76 1,397,794 55,189,426 53,372,436 99.8 97,323 0.23 GOLDMAN SACHS BANK USA KD3XUN7C6T14HNAYLU02 177,468 52,158,889 51,973,395 99.9 28,759 0.14 BANK OF AMERICA NA B4TYDEB6GKMZO031MB27 1,759,530 21,733,173 20,375,076 96.6 726,912 3.4
TOP 4 COMMERCIAL BANKS, SAs & TCs WITH DERIVATIVES $5,502,492 $186,173,398 $181,056,279 99.4 $1,110,167 0.6OTHER COMMERCIAL BANKS, SAs & TCs WITH DERIVATIVES 10,207,498 21,012,959 19,214,482 92.2 1,626,810 7.8TOTAL AMOUNT FOR COMMERCIAL BANKS, SAs & TCs WITH DERIVATIVES 15,709,990 207,186,357 200,270,761 98.7 2,736,977 1.3
Note: Currently, the call report does not differentiate between traded and not-traded credit derivatives. Credit derivatives have been excluded from the sum of total derivatives hereNote: Numbers may not add up to total due to rounding.Source: Call reports, Schedule RC-L
NOTIONAL AMOUNTS OF DERIVATIVE CONTRACTS HELD FOR TRADINGTOP 4 COMMERCIAL BANKS, SAVINGS ASSOCIATIONS AND TRUST COMPANIES IN DERIVATIVES
JUNE 30, 2018, MILLIONS OF DOLLARS
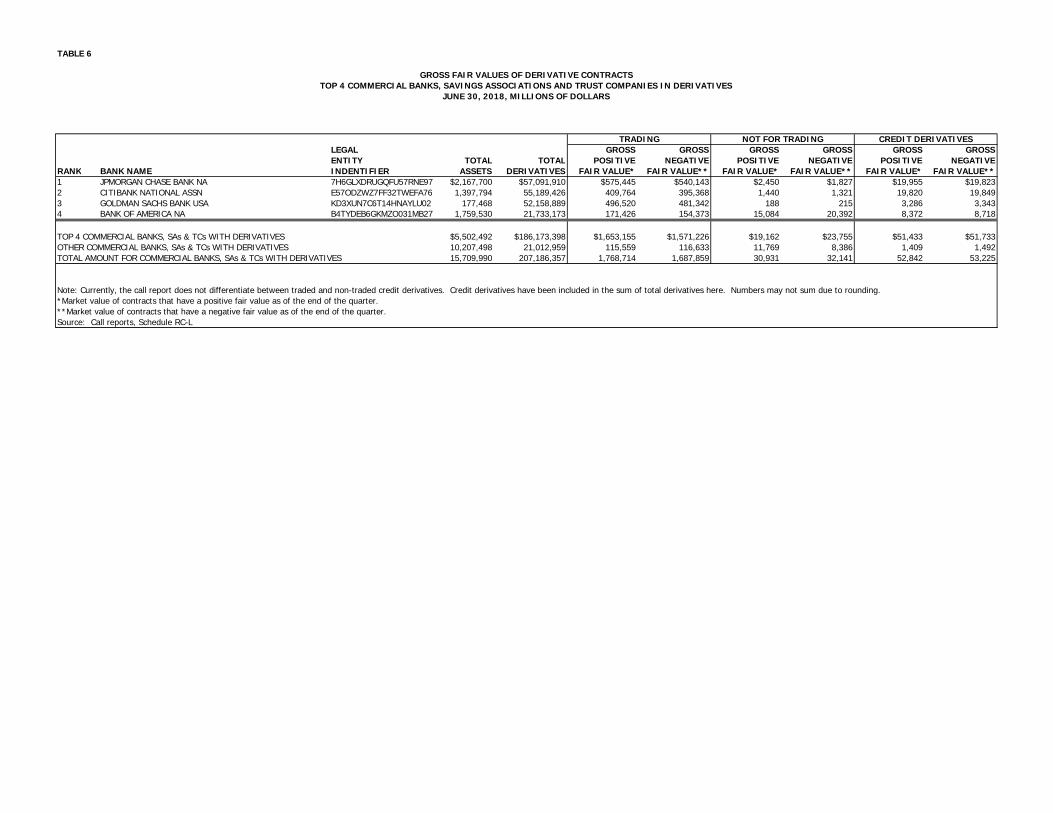
TABLE 6
LEGAL GROSS GROSS GROSS GROSS GROSS GROSSENTITY TOTAL TOTAL POSITIVE NEGATIVE POSITIVE NEGATIVE POSITIVE NEGATIVE
RANK BANK NAME INDENTIFIER ASSETS DERIVATIVES FAIR VALUE* FAIR VALUE** FAIR VALUE* FAIR VALUE** FAIR VALUE* FAIR VALUE**1 JPMORGAN CHASE BANK NA 7H6GLXDRUGQFU57RNE97 $2,167,700 $57,091,910 $575,445 $540,143 $2,450 $1,827 $19,955 $19,8232 CITIBANK NATIONAL ASSN E57ODZWZ7FF32TWEFA76 1,397,794 55,189,426 409,764 395,368 1,440 1,321 19,820 19,8493 GOLDMAN SACHS BANK USA KD3XUN7C6T14HNAYLU02 177,468 52,158,889 496,520 481,342 188 215 3,286 3,3434 BANK OF AMERICA NA B4TYDEB6GKMZO031MB27 1,759,530 21,733,173 171,426 154,373 15,084 20,392 8,372 8,718
TOP 4 COMMERCIAL BANKS, SAs & TCs WITH DERIVATIVES $5,502,492 $186,173,398 $1,653,155 $1,571,226 $19,162 $23,755 $51,433 $51,733OTHER COMMERCIAL BANKS, SAs & TCs WITH DERIVATIVES 10,207,498 21,012,959 115,559 116,633 11,769 8,386 1,409 1,492TOTAL AMOUNT FOR COMMERCIAL BANKS, SAs & TCs WITH DERIVATIVES 15,709,990 207,186,357 1,768,714 1,687,859 30,931 32,141 52,842 53,225
Note: Currently, the call report does not differentiate between traded and non-traded credit derivatives. Credit derivatives have been included in the sum of total derivatives here. Numbers may not sum due to rounding.*Market value of contracts that have a positive fair value as of the end of the quarter.**Market value of contracts that have a negative fair value as of the end of the quarter.Source: Call reports, Schedule RC-L
GROSS FAIR VALUES OF DERIVATIVE CONTRACTSTOP 4 COMMERCIAL BANKS, SAVINGS ASSOCIATIONS AND TRUST COMPANIES IN DERIVATIVES
JUNE 30, 2018, MILLIONS OF DOLLARS
TRADING NOT FOR TRADING CREDIT DERIVATIVES
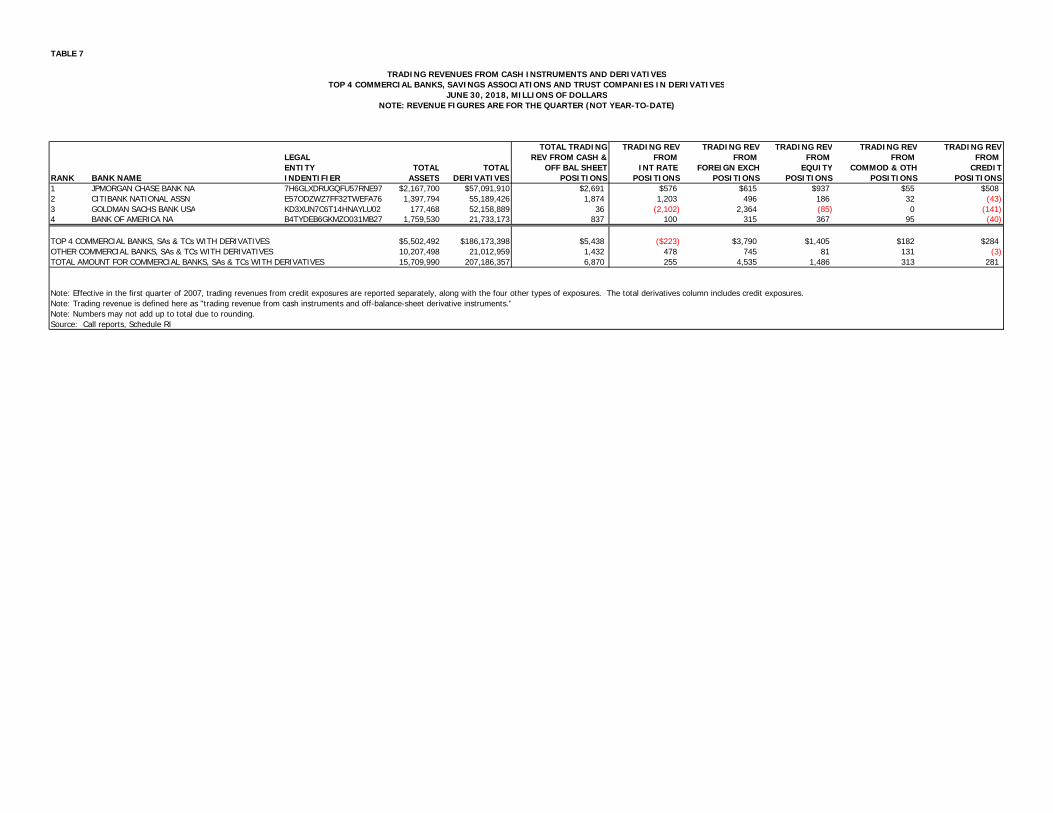
TABLE 7
TOTAL TRADING TRADING REV TRADING REV TRADING REV TRADING REV TRADING REVLEGAL REV FROM CASH & FROM FROM FROM FROM FROM ENTITY TOTAL TOTAL OFF BAL SHEET INT RATE FOREIGN EXCH EQUITY COMMOD & OTH CREDIT
RANK BANK NAME INDENTIFIER ASSETS DERIVATIVES POSITIONS POSITIONS POSITIONS POSITIONS POSITIONS POSITIONS1 JPMORGAN CHASE BANK NA 7H6GLXDRUGQFU57RNE97 $2,167,700 $57,091,910 $2,691 $576 $615 $937 $55 $5082 CITIBANK NATIONAL ASSN E57ODZWZ7FF32TWEFA76 1,397,794 55,189,426 1,874 1,203 496 186 32 (43)3 GOLDMAN SACHS BANK USA KD3XUN7C6T14HNAYLU02 177,468 52,158,889 36 (2,102) 2,364 (85) 0 (141)4 BANK OF AMERICA NA B4TYDEB6GKMZO031MB27 1,759,530 21,733,173 837 100 315 367 95 (40)
TOP 4 COMMERCIAL BANKS, SAs & TCs WITH DERIVATIVES $5,502,492 $186,173,398 $5,438 ($223) $3,790 $1,405 $182 $284OTHER COMMERCIAL BANKS, SAs & TCs WITH DERIVATIVES 10,207,498 21,012,959 1,432 478 745 81 131 (3)TOTAL AMOUNT FOR COMMERCIAL BANKS, SAs & TCs WITH DERIVATIVES 15,709,990 207,186,357 6,870 255 4,535 1,486 313 281
Note: Trading revenue is defined here as "trading revenue from cash instruments and off-balance-sheet derivative instruments."Note: Numbers may not add up to total due to rounding.Source: Call reports, Schedule RI
Note: Effective in the first quarter of 2007, trading revenues from credit exposures are reported separately, along with the four other types of exposures. The total derivatives column includes credit exposures.
TRADING REVENUES FROM CASH INSTRUMENTS AND DERIVATIVESTOP 4 COMMERCIAL BANKS, SAVINGS ASSOCIATIONS AND TRUST COMPANIES IN DERIVATIVES
JUNE 30, 2018, MILLIONS OF DOLLARSNOTE: REVENUE FIGURES ARE FOR THE QUARTER (NOT YEAR-TO-DATE)
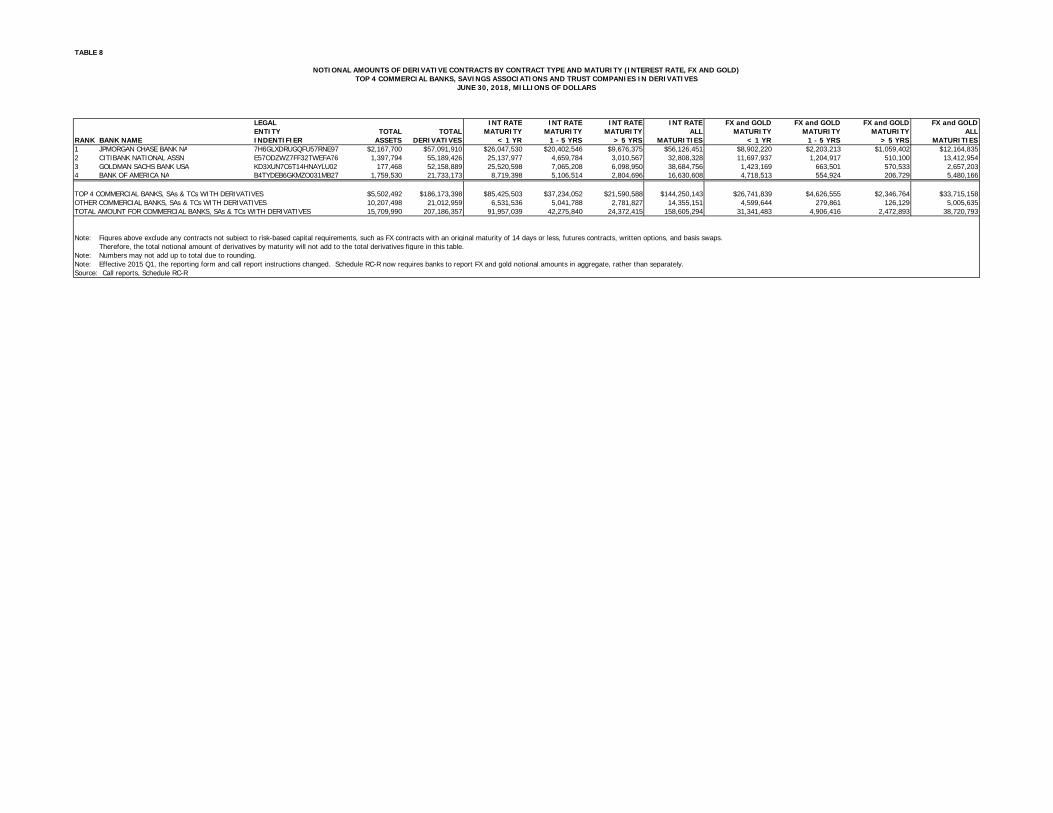
TABLE 8
LEGAL INT RATE INT RATE INT RATE INT RATE FX and GOLD FX and GOLD FX and GOLD FX and GOLDENTITY TOTAL TOTAL MATURITY MATURITY MATURITY ALL MATURITY MATURITY MATURITY ALL
RANK BANK NAME INDENTIFIER ASSETS DERIVATIVES < 1 YR 1 - 5 YRS > 5 YRS MATURITIES < 1 YR 1 - 5 YRS > 5 YRS MATURITIES1 JPMORGAN CHASE BANK NA 7H6GLXDRUGQFU57RNE97 $2,167,700 $57,091,910 $26,047,530 $20,402,546 $9,676,375 $56,126,451 $8,902,220 $2,203,213 $1,059,402 $12,164,8352 CITIBANK NATIONAL ASSN E57ODZWZ7FF32TWEFA76 1,397,794 55,189,426 25,137,977 4,659,784 3,010,567 32,808,328 11,697,937 1,204,917 510,100 13,412,9543 GOLDMAN SACHS BANK USA KD3XUN7C6T14HNAYLU02 177,468 52,158,889 25,520,598 7,065,208 6,098,950 38,684,756 1,423,169 663,501 570,533 2,657,2034 BANK OF AMERICA NA B4TYDEB6GKMZO031MB27 1,759,530 21,733,173 8,719,398 5,106,514 2,804,696 16,630,608 4,718,513 554,924 206,729 5,480,166
TOP 4 COMMERCIAL BANKS, SAs & TCs WITH DERIVATIVES $5,502,492 $186,173,398 $85,425,503 $37,234,052 $21,590,588 $144,250,143 $26,741,839 $4,626,555 $2,346,764 $33,715,158OTHER COMMERCIAL BANKS, SAs & TCs WITH DERIVATIVES 10,207,498 21,012,959 6,531,536 5,041,788 2,781,827 14,355,151 4,599,644 279,861 126,129 5,005,635TOTAL AMOUNT FOR COMMERCIAL BANKS, SAs & TCs WITH DERIVATIVES 15,709,990 207,186,357 91,957,039 42,275,840 24,372,415 158,605,294 31,341,483 4,906,416 2,472,893 38,720,793
Note: Figures above exclude any contracts not subject to risk-based capital requirements, such as FX contracts with an original maturity of 14 days or less, futures contracts, written options, and basis swaps.Therefore, the total notional amount of derivatives by maturity will not add to the total derivatives figure in this table.
Note: Numbers may not add up to total due to rounding.Note: Effective 2015 Q1, the reporting form and call report instructions changed. Schedule RC-R now requires banks to report FX and gold notional amounts in aggregate, rather than separately.Source: Call reports, Schedule RC-R
NOTIONAL AMOUNTS OF DERIVATIVE CONTRACTS BY CONTRACT TYPE AND MATURITY (INTEREST RATE, FX AND GOLD)TOP 4 COMMERCIAL BANKS, SAVINGS ASSOCIATIONS AND TRUST COMPANIES IN DERIVATIVES
JUNE 30, 2018, MILLIONS OF DOLLARS

TABLE 9
LEGAL PREC METALS PREC METALS PREC METALS PREC METALSENTITY TOTAL TOTAL MATURITY MATURITY MATURITY ALL
RANK BANK NAME INDENTIFIER ASSETS DERIVATIVES < 1 YR 1 - 5 YRS > 5 YRS MATURITIES1 JPMORGAN CHASE BANK NA 7H6GLXDRUGQFU57RNE97 $2,167,700 $57,091,910 $21,249 $737 $0 $21,9862 CITIBANK NATIONAL ASSN E57ODZWZ7FF32TWEFA76 1,397,794 55,189,426 10,852 2,239 0 13,0913 GOLDMAN SACHS BANK USA KD3XUN7C6T14HNAYLU02 177,468 52,158,889 0 0 0 04 BANK OF AMERICA NA B4TYDEB6GKMZO031MB27 1,759,530 21,733,173 0 0 0 0
TOP 4 COMMERCIAL BANKS, SAs & TCs WITH DERIVATIVES $5,502,492 $186,173,398 $32,101 $2,976 $0 $35,077OTHER COMMERCIAL BANKS, SAs & TCs WITH DERIVATIVES 10,207,498 21,012,959 11,083 632 12 11,727TOTAL FOR COMMERCIAL BANKS, SAs & TCs WITH DERIVATIVES 15,709,990 207,186,357 43,184 3,608 12 46,804
Note:
Note: Numbers may not add up to total due to rounding.Source: Call reports, Schedule RC-R
NOTIONAL AMOUNTS OF DERIVATIVE CONTRACTS BY CONTRACT TYPE & MATURITY (PRECIOUS METALS)TOP 4 COMMERCIAL BANKS, SAVINGS ASSOCIATIONS AND TRUST COMPANIES IN DERIVATIVES
JUNE 30, 2018, MILLIONS OF DOLLARS
Figures above exclude any contracts not subject to risk-based capital requirements, such as FX contracts with an original maturity of 14 days or less, futures contracts, written options, and basis swaps. Therefore, the total notional amount of derivatives by maturity will not add to the total derivatives figure in this table.

TABLE 10
LEGAL OTHER COMM OTHER COMM OTHER COMM OTHER COMM EQUITY EQUITY EQUITY EQUITYENTITY TOTAL TOTAL MATURITY MATURITY MATURITY ALL MATURITY MATURITY MATURITY ALL
RANK BANK NAME INDENTIFIER ASSETS DERIVATIVES < 1 YR 1 - 5 YRS > 5 YRS MATURITIES < 1 YR 1 - 5 YRS > 5 YRS MATURITIES1 JPMORGAN CHASE BANK NA 7H6GLXDRUGQFU57RNE97 $2,167,700 $57,091,910 $685,820 $94,500 $9,104 $789,424 $1,801,171 $548,400 $94,905 $2,444,4762 CITIBANK NATIONAL ASSN E57ODZWZ7FF32TWEFA76 1,397,794 55,189,426 149,041 52,829 4,233 206,103 373,706 150,508 19,187 543,4013 GOLDMAN SACHS BANK USA KD3XUN7C6T14HNAYLU02 177,468 52,158,889 2,848 2,403 40 5,291 17,179 12,416 2,134 31,7294 BANK OF AMERICA NA B4TYDEB6GKMZO031MB27 1,759,530 21,733,173 17,119 4,011 28 21,158 340,669 72,587 1,378 414,634
TOP 4 COMMERCIAL BANKS, SAs & TCs WITH DERIVATIVES $5,502,492 $186,173,398 $854,828 $153,743 $13,405 $1,021,976 $2,532,725 $783,911 $117,604 $3,434,240OTHER COMMERCIAL BANKS, SAs & TCs WITH DERIVATIVES 10,207,498 21,012,959 43,119 65,347 736 109,201 146,384 83,906 6,133 236,422TOTAL FOR COMMERCIAL BANKS, SAs & TCs WITH DERIVATIVES 15,709,990 207,186,357 897,947 219,090 14,141 1,131,177 2,679,109 867,817 123,737 3,670,662
Note: Figures above exclude any contracts not subject to risk-based capital requirements, such as FX contracts with an original maturity of 14 days or less, futures contracts, written options, and basis swaps. Therefore, the total notional amount of derivatives by maturity will not add to the total derivatives figure in this table.Note: Numbers may not add up to total due to rounding.Source: Call reports, Schedule RC-R
NOTIONAL AMOUNTS OF DERIVATIVE CONTRACTS BY CONTRACT TYPE AND MATURITY (OTHER COMMODITY AND EQUITYTOP 4 COMMERCIAL BANKS, SAVINGS ASSOCIATIONS AND TRUST COMPANIES IN DERIVATIVES
JUNE 30, 2018, MILLIONS OF DOLLARS
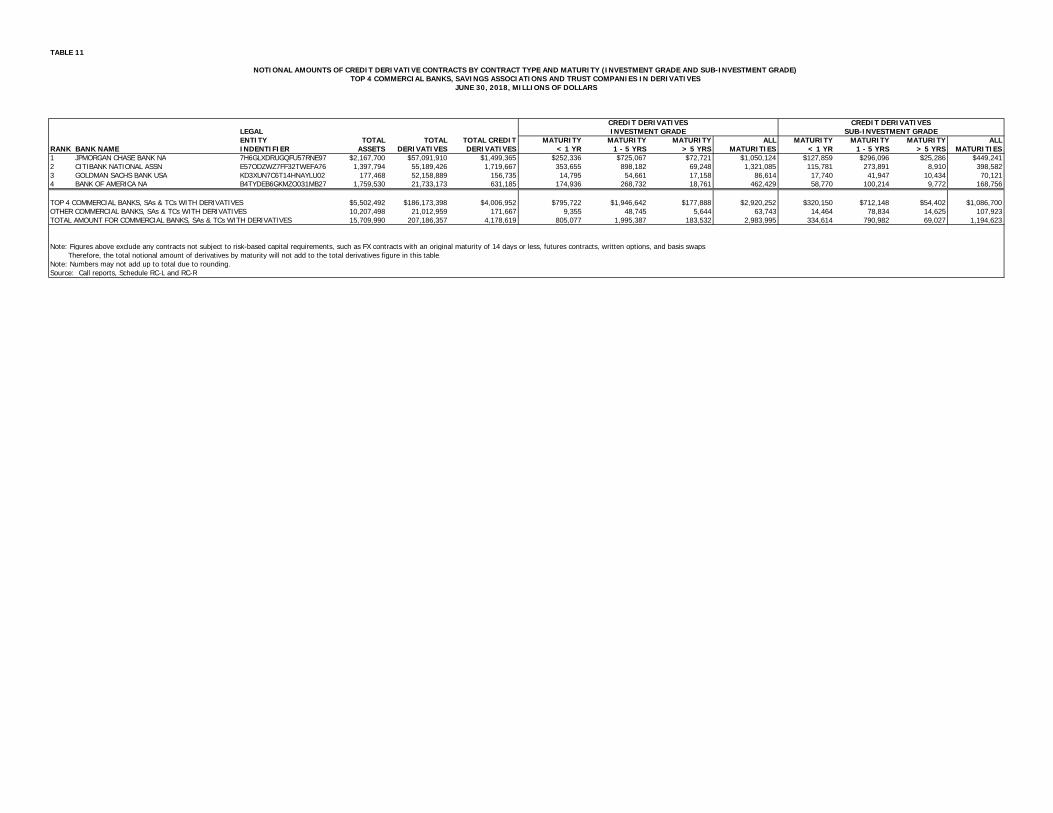
TABLE 11
LEGALENTITY TOTAL TOTAL TOTAL CREDIT MATURITY MATURITY MATURITY ALL MATURITY MATURITY MATURITY ALL
RANK BANK NAME INDENTIFIER ASSETS DERIVATIVES DERIVATIVES < 1 YR 1 - 5 YRS > 5 YRS MATURITIES < 1 YR 1 - 5 YRS > 5 YRS MATURITIES1 JPMORGAN CHASE BANK NA 7H6GLXDRUGQFU57RNE97 $2,167,700 $57,091,910 $1,499,365 $252,336 $725,067 $72,721 $1,050,124 $127,859 $296,096 $25,286 $449,2412 CITIBANK NATIONAL ASSN E57ODZWZ7FF32TWEFA76 1,397,794 55,189,426 1,719,667 353,655 898,182 69,248 1,321,085 115,781 273,891 8,910 398,5823 GOLDMAN SACHS BANK USA KD3XUN7C6T14HNAYLU02 177,468 52,158,889 156,735 14,795 54,661 17,158 86,614 17,740 41,947 10,434 70,1214 BANK OF AMERICA NA B4TYDEB6GKMZO031MB27 1,759,530 21,733,173 631,185 174,936 268,732 18,761 462,429 58,770 100,214 9,772 168,756
TOP 4 COMMERCIAL BANKS, SAs & TCs WITH DERIVATIVES $5,502,492 $186,173,398 $4,006,952 $795,722 $1,946,642 $177,888 $2,920,252 $320,150 $712,148 $54,402 $1,086,700OTHER COMMERCIAL BANKS, SAs & TCs WITH DERIVATIVES 10,207,498 21,012,959 171,667 9,355 48,745 5,644 63,743 14,464 78,834 14,625 107,923TOTAL AMOUNT FOR COMMERCIAL BANKS, SAs & TCs WITH DERIVATIVES 15,709,990 207,186,357 4,178,619 805,077 1,995,387 183,532 2,983,995 334,614 790,982 69,027 1,194,623
Note: Figures above exclude any contracts not subject to risk-based capital requirements, such as FX contracts with an original maturity of 14 days or less, futures contracts, written options, and basis swaps. Therefore, the total notional amount of derivatives by maturity will not add to the total derivatives figure in this table.Note: Numbers may not add up to total due to rounding.Source: Call reports, Schedule RC-L and RC-R
INVESTMENT GRADE SUB-INVESTMENT GRADE
NOTIONAL AMOUNTS OF CREDIT DERIVATIVE CONTRACTS BY CONTRACT TYPE AND MATURITY (INVESTMENT GRADE AND SUB-INVESTMENT GRADE)TOP 4 COMMERCIAL BANKS, SAVINGS ASSOCIATIONS AND TRUST COMPANIES IN DERIVATIVES
JUNE 30, 2018, MILLIONS OF DOLLARS
CREDIT DERIVATIVES CREDIT DERIVATIVES

TABLE 12
LEGAL TOTAL CREDIT TOTAL OTHER CREDIT TOTAL OTHERENTITY TOTAL TOTAL CREDIT DEFAULT RETURN CREDIT CREDIT DEFAULT RETURN CREDIT CREDIT
RANK BANK NAME INDENTIFIER ASSETS DERIVATIVES DERVATIVES PURCHASED SOLD SWAPS SWAPS OPTIONS DERIVATIVES SWAPS SWAPS OPTIONS DERIVATIVES1 JPMORGAN CHASE BANK NA 7H6GLXDRUGQFU57RNE97 $2,167,700 $55,592,545 $1,499,365 $761,978 $737,387 $696,969 $21,377 $39,046 $4,586 $682,260 $14,345 $40,638 $1442 CITIBANK NATIONAL ASSN E57ODZWZ7FF32TWEFA76 1,397,794 53,469,759 1,719,667 880,187 839,480 782,512 23,537 74,138 0 757,174 12,762 69,544 03 GOLDMAN SACHS BANK USA KD3XUN7C6T14HNAYLU02 177,468 52,002,154 156,735 86,772 69,963 78,738 2,602 5,341 91 63,787 2,602 3,524 504 BANK OF AMERICA NA B4TYDEB6GKMZO031MB27 1,759,530 21,101,988 631,185 320,720 310,465 264,230 9,796 46,694 0 253,349 12,444 44,672 05 WELLS FARGO BANK NA KB1H1DSPRFMYMCUFXT09 1,675,077 8,790,375 27,208 17,866 9,342 2,773 0 0 15,093 2,151 0 0 7,1916 HSBC NA 1IE8VN30JCEQV1H4R804 178,624 5,409,884 91,148 48,604 42,544 43,168 5,436 0 0 40,964 1,580 0 07 STATE STREET BANK&TRUST CO 571474TGEMMWANRLN572 245,244 2,187,968 0 0 0 0 0 0 0 0 0 0 08 BANK OF NEW YORK MELLON HPFHU0OQ28E4N0NFVK49 276,822 960,394 180 180 0 180 0 0 0 0 0 0 09 PNC BANK NATIONAL ASSN AD6GFRVSDT01YPT1CS68 368,951 468,384 7,892 3,072 4,820 15 0 0 3,057 0 0 0 4,82010 U S BANK NATIONAL ASSN 6BYL5QZYBDK8S7L73M02 453,023 395,786 6,085 1,820 4,265 0 0 0 1,820 0 0 0 4,26511 MORGAN STANLEY BANK NA G1MLHIS0N32I3QPILB75 138,844 295,998 9,847 9,837 10 9,837 0 0 0 10 0 0 012 NORTHERN TRUST CO 6PTKHDJ8HDUF78PFWH30 134,657 300,886 0 0 0 0 0 0 0 0 0 0 013 SUNTRUST BANK IYDOJBGJWY9T8XKCSX06 202,064 230,812 3,785 2,186 1,599 610 1,570 0 6 0 1,570 0 2814 TD BANK NATIONAL ASSN 03D0JEWFDFUS0SEEKG89 291,742 195,840 304 299 5 299 0 0 0 5 0 0 015 CAPITAL ONE NATIONAL ASSN 207ALC1P1YM0OVDV0K75 289,993 148,641 3,742 1,369 2,373 0 0 0 1,369 0 0 0 2,37316 CITIZENS BANK NATIONAL ASSN DRMSV1Q0EKMEXLAU1P80 123,921 110,911 2,760 0 2,760 0 0 0 0 0 0 0 2,76017 KEYBANK NATIONAL ASSN HUX2X73FUCYHUVH1BK78 135,863 102,971 371 247 124 247 0 0 0 31 93 0 018 REGIONS BANK EQTWLK1G7ODGC2MGLV11 123,635 98,183 4,187 1,334 2,852 43 0 0 1,292 43 0 0 2,81019 MUFG UNION BANK NA OX3PU53ZLPQKJ4700D47 123,787 91,003 76 76 0 76 0 0 0 0 0 0 020 FIFTH THIRD BANK QFROUN1UWUYU0DVIWD51 138,847 85,629 4,323 646 3,677 0 0 0 646 0 0 0 3,67721 BRANCH BANKING&TRUST CO JJKC32MCHWDI71265Z06 216,499 58,741 390 61 329 0 0 0 61 0 0 0 32922 BOKF NATIONAL ASSN FU7RSW4CQQY98A2O7J66 33,735 58,295 0 0 0 0 0 0 0 0 0 0 023 MANUFACTURERS&TRADERS TR CO WWB2V0FCW3A0EE3ZJN75 117,914 55,814 0 0 0 0 0 0 0 0 0 0 024 COMPASS BANK C90VT034M03BN29IRA40 87,739 48,430 277 0 277 0 0 0 0 277 0 0 025 CAPITAL ONE BANK USA NA LKE37K2B8CFZUR7F9816 117,380 45,418 0 0 0 0 0 0 0 0 0 0 0
TOP 25 COMMERCIAL BANKS, SAs & TCs WITH DERIVATIVES $10,976,854 $202,306,809 $4,169,526 $2,137,255 $2,032,272 $1,879,697 $64,319 $165,219 $28,020 $1,800,050 $45,396 $158,378 $28,447OTHER COMMERCIAL BANKS, SAs & TCs WITH DERIVATIVES 4,733,135 700,929 9,092 4,060 5,033 25 79 0 3,956 404 2 0 4,626TOTAL AMOUNT FOR COMMERCIAL BANKS, SAs & TCs WITH DERIVATIVES 15,709,990 203,007,738 4,178,619 2,141,314 2,037,304 1,879,721 64,398 165,219 31,976 1,800,455 45,398 158,378 33,073
(%) (%) (%) (%) (%) (%) (%) (%) (%) (%) (%)TOP 25 COMMERCIAL BANKS, SAs & TCs: % OF TOTAL COMMERCIAL BANKS, SAs & TCs WITH DERIVATIVES 99.8 51.1 48.6 45.0 1.5 4.0 0.7 43.1 1.1 3.8 0.7OTHER COMMERCIAL BANKS, SAs & TCs: % OF TOTAL COMMERCIAL BANKS, SAs & TCs WITH DERIVATIVES 0.2 0.1 0.1 0.0 0.0 0.0 0.1 0.0 0.0 0.0 0.1TOTAL AMOUNT FOR COMMERCIAL BANKS, SAs & TCs: % OF TOTAL COMMERCIAL BANKS, SAs & TCs WITH DERIVATIVES 100.0 51.2 48.8 45.0 1.5 4.0 0.8 43.1 1.1 3.8 0.8
Note: Credit derivatives have been excluded from the sum of total derivatives here.Note: Numbers may not add up to total due to rounding.Source: Call reports, Schedule RC-L
DERIVATIVES
DISTRIBUTION OF CREDIT DERIVATIVE CONTRACTS HELD FOR TRADINGTOP 25 COMMERCIAL BANKS, SAVINGS ASSOCIATIONS AND TRUST COMPANIES IN DERIVATIVES
JUNE 30, 2018, MILLIONS OF DOLLARS
TOTAL CREDIT PURCHASED SOLD
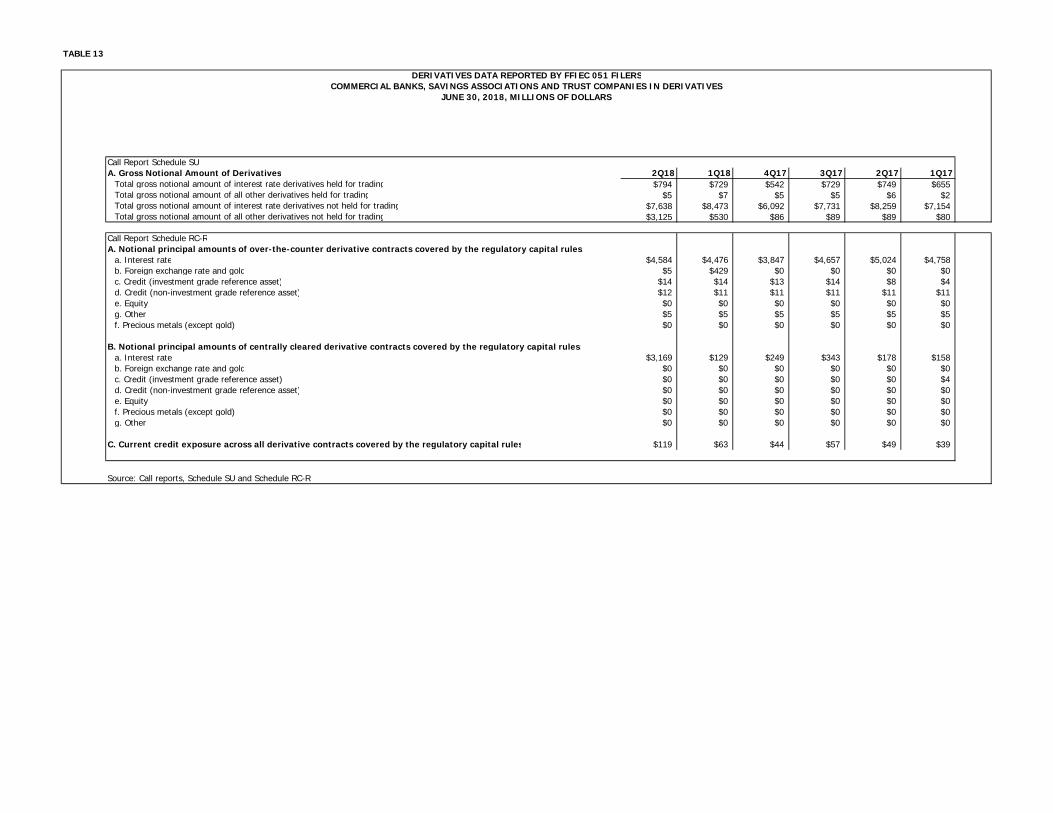
TABLE 13
Call Report Schedule SUA. Gross Notional Amount of Derivatives 2Q18 1Q18 4Q17 3Q17 2Q17 1Q17
Total gross notional amount of interest rate derivatives held for trading $794 $729 $542 $729 $749 $655Total gross notional amount of all other derivatives held for trading $5 $7 $5 $5 $6 $2Total gross notional amount of interest rate derivatives not held for trading $7,638 $8,473 $6,092 $7,731 $8,259 $7,154Total gross notional amount of all other derivatives not held for trading $3,125 $530 $86 $89 $89 $80
Call Report Schedule RC-RA. Notional principal amounts of over-the-counter derivative contracts covered by the regulatory capital rules:
a. Interest rate $4,584 $4,476 $3,847 $4,657 $5,024 $4,758b. Foreign exchange rate and gold $5 $429 $0 $0 $0 $0c. Credit (investment grade reference asset) $14 $14 $13 $14 $8 $4d. Credit (non-investment grade reference asset) $12 $11 $11 $11 $11 $11e. Equity $0 $0 $0 $0 $0 $0g. Other $5 $5 $5 $5 $5 $5f. Precious metals (except gold) $0 $0 $0 $0 $0 $0
B. Notional principal amounts of centrally cleared derivative contracts covered by the regulatory capital rules:a. Interest rate $3,169 $129 $249 $343 $178 $158b. Foreign exchange rate and gold $0 $0 $0 $0 $0 $0c. Credit (investment grade reference asset) $0 $0 $0 $0 $0 $4d. Credit (non-investment grade reference asset) $0 $0 $0 $0 $0 $0e. Equity $0 $0 $0 $0 $0 $0f. Precious metals (except gold) $0 $0 $0 $0 $0 $0g. Other $0 $0 $0 $0 $0 $0
C. Current credit exposure across all derivative contracts covered by the regulatory capital rules $119 $63 $44 $57 $49 $39
Source: Call reports, Schedule SU and Schedule RC-R
COMMERCIAL BANKS, SAVINGS ASSOCIATIONS AND TRUST COMPANIES IN DERIVATIVESDERIVATIVES DATA REPORTED BY FFIEC 051 FILERS
JUNE 30, 2018, MILLIONS OF DOLLARS