Quarterly Report - National Disability Insurance Scheme
333
COAG Disability Reform Council Quarterly Report 31 March 2019 ndis.gov.au
Transcript of Quarterly Report - National Disability Insurance Scheme

COAG Disability Reform CouncilQuarterly Report31 March 2019
ndis.gov.au

Executive Summary 6Introduction 15
Part One: Participants and their plans 171.1 Roll-out 171.2 Number of participants 181.3 Operational progress 191.4 Participant characteristics 20
Part Two: Participants in work, community service and social activities 252.1 Community and social participation 262.2 Employment 282.3 Two-year analysis of participant outcomes 302.4 Participant satisfaction 312.5 Unscheduled plan reviews 342.6 Plan activations 352.7 Plan utilisation 362.8 Actions to improve participant experience 39
Part Three: Providers and the growing market 433.1 Growth and diversity of providers 433.2 New NDIS Demand Tool 443.3 Innovative approaches to services and supports 443.4 NDIS pricing 453.5 Specialist Disability Accommodation (SDA) 46
Part Four: Information, Linkages and Capacity Building (ILC) 484.1 Building inclusive communities 48
Part Five: Financial sustainability 505.1 Delivering within budget 505.2 Addressing Scheme pressures 51
Part Six: Staff, advisory groups and the NDIS community 536.1 Official opening of the new NDIA National Office in Geelong 536.2 Collaborating with NDIS stakeholders 546.3 NDIS Contact Centre 556.4 Building a high performing NDIA 56
Contents

Appendix A: Key definitions 58Appendix B: Scheme roll-out: Timing and locations 60Appendix C: Operational progress 62Appendix D: Outcomes framework questionnaires 64Appendix E: National 65Appendix F – M: States/Territories 100Appendix N: Participants by region and support type 313Appendix O: Specialist Disability Accommodation 317

Key highlights
32,486 joined the
Scheme this quarter
85,489 people are receiving
supports for the first time
Workforce has grown from 2,300
at July 2016 to over
10,000 this quarter
Delivery sites have increased from 31
at July 2016 to
122this quarter
277,155 people with disability have joined the Scheme
The NDIA exceeded
its operational target for the number of participants
entering in the quarter
Now accessible in every region of every State and Territory, except for
part of Western Australia
The scale and complexity of the roll-out is unprecedented
Overall, participant satisfaction is high at 88%
94%
said their planner listened to them
91%
said they had enough time to tell
their story
92%
said their planning meeting
had gone well
4March 2019 | COAG Disability Reform Council Quarterly Report

Key highlights
Participants in the Scheme for two years show significantly improved outcomes
Call centre performance has continued to improve, with the average answer speed consistently at 28 seconds
11% increase in social and
community participation
9% increase in
independence for children aged 0 to 14 years
7% increase in
assistance with daily living for participants
aged 15 to 25
7% increase in choice and control for
participants aged 25 and over
Significant work is underway to further improve the participant experience.
5March 2019 | COAG Disability Reform Council Quarterly Report

Executive Summary
The NDIS is having a significant positive impact on the lives of people with disability, now reaching more Australians with disability than ever before, as the pace of the roll-out rapidly accelerates. However that pace is not without its challenges. This report outlines that progress and those challenges in the context of the overall roll-out of the Scheme.
1. The NDIS is reaching more Australians with disability sooner than ever beforeThe NDIS has reached a record number of participants this quarter and has exceeded its operational targets.
1.1 As the roll-out accelerates, a record number of participants have been reached this quarterThe accelerating pace of the roll-out is delivering NDIS funding to a rapidly increasing number of participants.
At 31 March 2019, 277,155 people with disabilities, including 11,504 children in the Early Childhood Early Intervention (ECEI) program, had joined the NDIS. This represents a 13% increase over the prior quarter.
An additional 32,486 participants (excluding ECEI) received approved plans this quarter. This is the largest number of additional participants in any one quarter. Indeed, it exceeds the number of plans approved in the entire three year Trial period. Additionally, more participants in remote and very remote areas of Australia joined the Scheme this quarter compared with any previous quarter.
1.2 A record number of participants are receiving supports for the first timeAs well as supporting people transitioning from existing State/Territory and Commonwealth systems, the NDIS is reaching people who have not previously received disability funding.
Of the 277,155 participants currently supported by the Scheme, 85,489 are receiving supports for the first time. 180,162 previously received support from State/Territory or Commonwealth programs. The increase in the March quarter in the number of participants without previous support was 11,804 (compared with 11,270 in the prior quarter).
1.3 Supports are being received soonerSeventy percent (70%) of plans were activated within 30 days during the quarter, and 86% of plans were activated within 90 days. This represents the time from when a participant's initial plan is approved to when they first receive support from a provider.
1.4 Operational targets for the roll-out are being exceededThe NDIA exceeded its operational target for the nine months to 31 March 2019, with approved plans exceeding actionable records during the period. Actionable records are provided by the Commonwealth and State/Territory governments to the NDIA, to transfer eligible participants to the NDIS. It represents people who can be contacted and who meet the NDIS access requirements.
The bilateral estimates across the states and territories during Transition (excluding Trial) is approximately 377,000 to 30 June 2019. The number of actionable records received by the NDIA is 287,000, leaving a difference of approximately 90,000 records. These 90,000 records include duplicates, some people who have died, or information that does not allow the NDIA to identify or contact an individual. As a result, performance against the bilateral estimates to date is 75%.
1.5 The combination of initial plans and reviews has increased significantlyPlan reviews for existing participants are an important undertaking.
6March 2019 | COAG Disability Reform Council Quarterly Report

Executive Summary continued
The number of plan reviews (both scheduled and unscheduled) was 51,924. When combined with the 32,486 new plans, approximately 1,320 plans were developed or reviewed each business day during the quarter. This represents a significant increase in the daily volume of plans.
1.6 The Scheme is now available in almost all of Australia Almost three years into Transition of the NDIS, all States/Territories have entered the Scheme on time and as scheduled.
Subject to phasing agreed with State/Territory governments, the Scheme is now able to be accessed in every region in Australia, except parts of Western Australia. It will be available in all regions in Western Australia from July 2019 as agreed with the Western Australian government.
More specifically, from 1 January 2019, the NDIS began operating in the Victorian areas of Goulburn, Mallee and Outer Gippsland; in the Queensland areas of Caboolture/Strathpine and Maroochydore; and in Tasmania for 50 to 64 year olds.
The roll-out continued its focus on transitioning Queensland and Victoria participants, with new plans in those States respectively representing 31.4% and 30.8% of the total. In Victoria 99% of people with actionable records received a plan, in Queensland this figure exceeded 100% as new records were provided during the quarter.
The scale and complexity of the roll-out is unprecedented. There are 122 service delivery sites across the country, including 18 new sites opened within the previous six months. The NDIA and Partners in the Community participated in over 10,000 engagement activities during the 2018 calendar year; and the NDIA and its partners have grown their workforce from approximately 2,300 at the
start of Transition in July 2016 to over 10,000 at the end of the March quarter.
2. Participant satisfaction with the rollout remains strong This quarter, 88% of participants rated their overall experience with the NDIS planning process as either ‘Very good’ or ‘Good’. This is an improvement on the last quarter’s satisfaction rate of 84%. Of participants surveyed this quarter, 94% felt their planner listened to them, 91% considered that they had enough time to tell their story, and 92% reported that their planning meeting went well.
3. Participant outcomes are highly encouragingThe Scheme’s overarching purpose is to help participants improve their life outcomes. As participants spend more time in the Scheme, evidence indicates that the NDIS is assisting in most areas.
3.1 Outcomes over time are improvingResults from longitudinal analysis show that outcomes are improving as participants spend more time in the Scheme
• Parents and carers of children starting school to aged 14 years thought their child was more independent as a result of the NDIS (65% in the second year, compared to 56% in their first year)
• Participants aged 15 to 24 years indicated that the NDIS had helped them with daily living activities (66% in their second year compared to 59% in their first year)
• Participants aged 25 years and over considered the NDIS helped them have more choice and more control over their lives (75% in the second year, compared with 68% in their first year).
7March 2019 | COAG Disability Reform Council Quarterly Report

Executive Summary continued
Some areas require more focus, in particular to help address some of the challenges facing people with disability seeking and maintaining employment. The NDIS Participant Employment Taskforce is committed to making progress towards improving opportunities in this area.
3.2 Participants are more involved in social, civic and community activitiesThe benefits for people with disability who participate in social, civic and community activities include improved wellbeing, lower longer term costs of care and support and increased employment opportunities.
A large increase in social and community participation has occurred, from 35% of participants at entry to the Scheme to 46% of participants after 2 years. The largest increases have been for participants aged 25 to 34 (14% increase) and 19 to 24 (12% increase), along with increases for participants with Down syndrome (18%), Cerebral Palsy (16%) and Intellectual Disability (13%).
Analysis indicates that volunteering and having a paid job are two key drivers of social and community engagement.
4. Work is underway to further enhance the participant experienceDespite high satisfaction rates, the NDIA recognises that it is not yet getting it right first time for each and every participant. Significant ongoing work has been directed to further improving the participant experience, in consultation with participants, families, carers, providers and sector representatives.
4.1 More individualised approaches occurring Changes have focused on embedding a more individualised approach for participants, and an emphasis on clearer communication to better support people with disability to achieve their goals. These changes include:
• Tailoring approaches around the needs of the NDIS participant, including a complex support needs pathway and Early Childhood Early Intervention pathway;
• Two service streams for psychosocial disability and hearing, to deliver targeted support to provide participants with an experience more suited to their specific disability needs; and
• Four service enhancements to meet the communication and engagement needs of people from different backgrounds or areas, including Aboriginal and Torres Strait Islander peoples, culturally and linguistically diverse people, remote and very remote communities, and people who identify as LGBTIQA+.
In response to participant feedback, a key improvement being rolled out is changes to the participant plan format, which now provides participants with a single point of contact. This contact is listed in each participant's plan document and in the myplace participant portal.
4.2 Roll-out of Complex Support Needs Participant PathwayThe Complex Support Needs Pathway is providing specialised support for people with disability that experience extraordinary complex support needs, and who have a greater need for coordination of multiple services. This may include voluntary or involuntary involvement in other government service systems (such as justice systems, child protection, and/or mental health programs) and transitional supports for returning to the community, for example, exiting incarceration or an acute rehabilitation environment.
8March 2019 | COAG Disability Reform Council Quarterly Report

Executive Summary continued
The Complex Support Needs Pathway is progressively rolling out across Australia. It commenced in parts of Victoria and New South Wales in November 2018. It is now also underway in all other States/Territories, except Western Australia. It will commence in Western Australia (Canning) from 1 July 2019.
As of March 2019, ninety planners with human service qualifications and/or extensive expertise in complex case coordination have been identified to transfer to the Complex Support Needs (CSN) Branch. These planners are supporting these complex participants to easily access the Scheme and are closely monitoring their plans, including how the plan links to other mainstream services. Skilled support co-ordinators are also being connected to these participants to further assist with implementing the plan and helping participants achieve their goals.
4.3 Streamlined access for participants with hearing disability occurringDuring the March 2019 quarter, 305 children benefited from streamlined access to early intervention supports, through a stream developed in 2018 for children aged 0 to 6 with newly diagnosed hearing loss. The NDIA is now working on developing further hearing streams for participants aged 7 to 64, and has commenced consultation with key external stakeholders in the deaf community to provide input across key life transition points.
In addition, work is underway to transition to the NDIS eligible clients within the Commonwealth’s Hearing Services Program (HSP). This commenced in partnership with Australian Hearing at the beginning of March 2019, with all eligible clients scheduled to transition by the end of June 2020.
4.4 Major changes to Specialist Disability Accommodation (SDA) underwaySDA is a fast growing and significant provider registration group that experienced a 19% growth in the quarter (118 to 140) for
active SDA providers. This coincided with the number of participants with SDA in their plan increasing by 13%. During the quarter an additional 746 spaces in SDA properties became available to NDIS participants.
A package of reforms to SDA is being implemented, following a review in 2018 by the Disability Reform Council of the SDA Pricing and Payments Framework. The changes recognise the centrality of choice and control in SDA for eligible participants, and provide greater visibility and certainty for investors in relation to pricing.
The NDIA has recently published an updated 2018-19 SDA Price Guide, and established an SDA Reference Group comprised of a range of SDA stakeholders. The first meeting was held in March 2019.
Additionally, the NDIA has launched an internal SDA Panel to improve the process for determining SDA eligibility. The SDA Panel is already leading to more consistent and timely SDA decisions as it assists with the implementation of the recently revised SDA Rules. The important revisions to the Rules has been central in the roll-out of these changes.
4.5 An increase in Young People in Residential Aged Care (YPIRAC) receiving NDIS support
The number of Younger People in Residential Aged Care receiving support from the NDIS increased by 439 in the quarter, and by 1,801 over the past year.
Of the 4,093 active participants as at 31 March 2019, 30 were under the age of 35, including 3 under the age of 25. A further 127 were aged 35 to 44, 686 aged 45 to 54, 2,477 aged 55 to 64, and 773 were aged 65 or over.
On 22 March 2019 the Minister for Families and Social Services announced a plan to reduce the number of younger people with disability living in aged care facilities. In support of this, the NDIA is expediting access
9March 2019 | COAG Disability Reform Council Quarterly Report

Executive Summary continued
to the Scheme for those who are eligible. Planners in the Complex Support Needs pathway will then, as a priority, work with eligible NDIS participants and their families to look at housing options, which may include funding for home modifications or SDA where required.
4.6 Early Childhood Early Intervention program refinement underwayThe NDIA acknowledges that delays are occurring for children aged from 0 to 6 in accessing supports through the Early Childhood Early Intervention program. The reasons include the rapidity of the roll-out in some jurisdictions, where large numbers of files may be transferred on a single day, also creating additional delays for new participants.
The NDIA is prioritising work to reduce the wait times for children and to ensure that early intervention supports are provided as quickly as possible.
This includes working with groups such as the Autism Advisory Group.
4.7 Access to the Scheme for people with psychosocial disability improvesThe NDIA continues to improve streamlined access for participants from Commonwealth psychosocial programs, and to build the capacity of the workforce to better understand psychosocial disability. During the quarter, foundational mental health training was extended to include Victoria, Queensland, Western Australia, the Australian Capital Territory and Northern Territory.
4.8 Access and service delivery in remote areas improvesThe number of participants in remote and very remote areas is increasing as the NDIA improves access and stimulates the service delivery market.
The number of participants in these areas increased from 802 at 31 March 2017, to 1,582 at 31 March 2018, to 3,148 as at 31 March 2019.
During the quarter, two new programs were announced in remote Western Australian. The Remote Community Connectors program will see people from remote communities employed by local Aboriginal Community Controlled Organisations to promote understanding and awareness of the NDIS, linking people with disability to access, planning and implementation pathways.
The Evidence, Access and Coordination of Planning program will enable Aboriginal Medical Services to recruit Evidence and Access Coordinators in remote clinics to facilitate the eligibility testing and access procedures of the NDIS, and to assist with organising NDIS planning meetings in remote areas.
4.9 Assistive Technology (AT) processes improveDelays have occurred in participants gaining funding for AT. Work is ongoing to improve this situation.
Since February 2019, participants who require replacement of their existing AT (valued between $1,500 and $15,000) that is not repairable or has reached the end of its service life, may have funding included in their plan without the need for reassessment. Repairs and maintenance to AT, including the addition of an annualised amount, can be included in a participant’s NDIS plan.
Further, as expenditure under $1,500 no longer requires a quote, wait times should reduce.
4.10 Contact Centre performance improves The NDIS Contact Centre has made consistent improvements during the March quarter. It is contracted to reach a weekly
10March 2019 | COAG Disability Reform Council Quarterly Report

Executive Summary continued
service level of 80% of calls answered within 60 seconds, which it exceeded by a little over three percentage points at the end of the quarter. Average abandonment rates are 1.25%, an improvement from 1.5% at the end of December 2018.
This improvement in performance follows the appointment of the current provider in June 2018, notwithstanding significant volumes of calls (over 890,000 between June 2018 and the end of March 2019) as the roll-out of the Scheme accelerates.
4.11 The Independent Assessment Pilot reaches its intended number of voluntary participantsThe Independent Assessment Pilot is being undertaken to ensure fairness and equity in access and planning decisions. It is on track to reach its intended number of participants before closing at the end of April 2019.
A high level of satisfaction with the process has been recorded with 93% of participants being “satisfied” or “very satisfied”. In addition, the opt-in rate of 73% has been high, indicating that participants have seen the benefit of being part of the pilot.
5. The provider market continues to growAccess to a growing, vibrant and competitive provider market is critical for participants to achieve their goals.
5.1 Number of providers continues to increaseThe total number of registered providers reached 20,208 at 31 March 2019, representing a 6% increase for the quarter.
High growth rates were experienced in Queensland and Victoria in particular, with the number of registered providers increasing by 17% and 12% respectively.
5.2 Improved access to NDIS demand information deliveredDuring the March 2019 quarter a new NDIS demand forecast tool was released by the Department of Social Services and the NDIA. The NDIS Demand Map is designed to provide information to providers on the nature and location of demand, with the objective being to stimulate market supply.
It includes forecasts of NDIS demand by postcode, the number of NDIS participants in an area, how much participants are expected to spend and on what types of supports, and how many workers may be required.
5.3 Pricing increases are being deliveredAgainst the backdrop of the rapid roll-out of the Scheme, the NDIA is acutely aware of its role as market steward and the need to set prices that encourage market development, particularly in thin markets.
Supplementing the work of the Independent Pricing Review, which is currently being implemented, and the Western Australia Market Review, the NDIA has undertaken extensive consultation on therapy prices and pricing for attendant care. That work, initiated and promoted by the NDIA, has been rigorous and fact-based, using extensive data not previously available to the Independent Pricing Review.
As a consequence of that detailed consideration, it was announced towards the end of the quarter, that from 1 July 2019 significant price increases will be made for both therapy and attendant care.
More specifically in the case of therapy supports, in New South Wales, Victoria, Queensland and the Australian Capital Territory, differential prices were set for psychology supports versus other types of therapy, with increases of 17% and 6%
11March 2019 | COAG Disability Reform Council Quarterly Report

Executive Summary continued
respectively. In addition, for South Australia, Western Australia, Tasmania and the Northern Territory, differential prices were set for psychology, physiotherapy and other therapies, with increases of 28%, 23% and 6% respectively.
In relation to attendant care, increases of between 5.6% and 15.4% to the base price for attendant care, depending on location, times and days of shifts, and skill level will be available from 1 July 20191. In addition, a Temporary Transformation Payment of 7.5% will also be made to providers, reducing by 1.5% each year over 5 years. This conditional loading will assist providers continue to transform their businesses as the market evolves.
Overall, the increases will help ensure the availability of supply in the attendant care and therapy markets, thereby assisting participants to achieve their goals.
The Western Australia Pricing Review is currently underway, with extensive consultation occurring.
5.4 Developing innovation in provider marketsThe NDIA is developing a strategy to encourage the growth of new and better services across Australia, which will increase opportunities for participant choice. The strategy will identify contemporary and innovative approaches to supports and services that build participant capacity, seek to increase independence, and encourage social inclusion.
The strategy will outline the NDIA’s vision for an innovative marketplace with informed participants and families, and how the NDIA plans to achieve this vision. The NDIA will consult with a range of stakeholders including participants, providers and industry
leaders, ahead of releasing the strategy later in the year.
6. Community engagement has significantly increasedThe NDIA is committed to a programme of extensive engagement with the disability sector. It permeates all facets of projects underway to improve the participant experience. Some examples of engagement undertaken during the Quarter, include:
• Engagement with the Specialist Disability Accommodation Reference Group;
• Extensive consultation with the sector in relation to prices for attendant care and therapy;
• Work undertaken with the Employment Task Force;
• Seeking input from members of peak organisations on the Independent Assessment Pilot;
• Ongoing discussions with the Autism Advisory Group, particularly in relation to improving wait times for children; and
• Collaboration on improved access to supports with the Aboriginal Health Council of WA and Aboriginal Medical Service in the Kimberley, Pilbara and Goldfields regions.
Regular consultation continues under the auspices of the Independent Advisory Council and the CEO Forum, along with ongoing frequent communication by senior management with sector leaders. In addition, the Board is undertaking a series of roving visits as part of a program of meeting with participants, providers, front line staff and peak bodies. In the quarter this included a visit to Broadmeadows in Melbourne.
1 These prices will also be increased for wage inflation on 1 July, 2019.
12March 2019 | COAG Disability Reform Council Quarterly Report

Executive Summary continued
6.1 Information, Linkages and Capacity (ILC) program expandsILC provides grants to organisations to carry out activities in the community, to create connections between people with disability and the communities in which they live, encouraging inclusion and participation and promoting a diverse Australian society. To date, the NDIA has allocated 222 grants totalling $85.9 million (excluding GST) to organisations across Australia to deliver a wide range of ILC initiatives.
The NDIA introduced the “ILC Strategy Towards 2022” in December 2018, which will guide investment of almost $400 million in ILC grants from 2019-20 to 2021-22. The overarching purpose of the strategy is to ensure that people with disability, their families and carers have the knowledge, skills and confidence to participate and contribute to their communities, have the information they need to make informed decisions, and benefit from the same mainstream services as everyone else. The strategy has been warmly welcomed.
7. The Scheme remains financially sustainableThe Scheme remains within budget, and has done so every year of its operation. It is projected to remain within budget for the rest of the financial year.
Notwithstanding specific pressures on the Scheme, the NDIA is committed to ensuring that funding for eligible participants is responsive to their needs within the reasonable and necessary provisions of the NDIS Act.
8. A high performing NDIA is being builtIn line with the accelerated roll-out of the Scheme, the NDIA has significantly increased the number of staff directly supporting the
development of plans for participants. In the second half of 2018, the number of Planners increased by 422 to 1,764. The total workforce (including partners in the community) increased by 2,210 in the same period (from 7,563 to 9,773). In addition, planners with deep experience were re-allocated to support the roll-out of the Complex Pathway.
Over 6,500 hours of training has been delivered to service delivery staff to support the pathways reform implementation, including in areas such as psychosocial disability, customer focus, disability awareness, and human rights. The training on disability awareness and human rights was developed with the Disability Advocacy Network of Australia (DANA).
Notwithstanding the pace of the roll-out, the NDIA’s focus is on growing its workforce capability at the same time as reducing reliance on consultants, evidenced by a decrease of over 50 per cent in consultant spend for the 12 months ending 31 December 2018.
In addition, the NDIA is committed to working with and employing people with disability or lived experience of disability. Currently 11.7% of the NDIA’s workforce have a disability.
The new NDIA National Office (which was officially opened on 8 March 2019), has many state-of-the-art accessibility features. Hence, with almost 12 per cent of NDIA employees identifying as having a disability, this new office will ensure accessible technologies and a suitable work environment for all employees. Overall, the new office houses approximately 600 staff and centralises the NDIA’s national operations in Geelong.
13March 2019 | COAG Disability Reform Council Quarterly Report

In conclusionRapid progress is being made on the Scheme’s roll-out. The continuing work, being undertaken in active collaboration with participants and the sector, will ensure that the NDIS meets the needs of participants, develops a vibrant and innovative provider market, and remains financially sustainable for generations to come.
Executive Summary continued
14March 2019 | COAG Disability Reform Council Quarterly Report

Introduction
This report is a summary of the performance and operations of the National Disability Insurance Agency (NDIA) for the 3 months from 1 January 2019 to 31 March 2019, as required by Section 174 of the NDIS Act 2013.2
Analysis and key insights are presented in the report, with detailed supplementary tables included in the appendices. The national results are contained in Appendix E, followed by individual appendices for each State and Territory. A list of key definitions of the terms used in this report is included in Appendix A.
2 The Board members must prepare a report on the operations of the Agency for each period of three months starting on 1 July, 1 October, 1 January or 1 April; and give the report to the Ministerial Council within one month after the end of the period to which the report relates.
Sean has benefited from the School Leaver Employment Support Program and is now enjoying full-time work at Yarra Ranges Nursery (Sean’s photo is also on the front cover)
15March 2019 | COAG Disability Reform Council Quarterly Report

Cathy receives funding for support workers who pick her up and take her to weekly bible studies class, and into the shops to buy the weekly Big League rugby league magazine.
“It gives her the opportunity to go with other people, talk with them, socialise, and that’s a pretty important part of life,” Cathy’s father Kevin said.
“We’ve noticed Cath’s confidence has increased, and she’s got new things to talk about when she comes home.”

Part One: Participants and their plansMore participants from diverse geographies experience improved outcomes with support from the NDIS.
1.1 Roll-outMore participants are receiving support as the NDIS transitions into the remaining areas of Australia in all States/Territories except Western Australia.
In January 2019 the NDIS began operating in the Victorian areas of Goulburn, Mallee and Outer Gippsland, in the Queensland areas of Caboolture/Strathpine and Maroochydore, and in Tasmania for 50 to 64 year olds. At 31 March 2019, the NDIS was operating fully in all regions of each State/Territory except Western Australia, with more people in these States/Territories expected to phase into the Scheme beyond 31 March 2019.
Western Australia continues its transition from the state-operated NDIS to the national Scheme. The Commonwealth and Western Australian Governments have agreed to provide additional time for people to transfer from the WA NDIS, to allow state-based participants to be appropriately supported and transitioned. The original timeframe has been extended to make sure the transfer process is smooth and effective for participants.
Figure 1: Phasing regions
Phasing not yet commenced
Region has commenced phasing for all ages including NDIS WA sites
Part One: Participants and their plans
17March 2019 | COAG Disability Reform Council Quarterly Report

1.2 Number of participantsOver 275,000 Australians with disabilities are now being supported by the NDIS, with close to one third of participants receiving support for the first time.
At 31 March 2019, 277,155 people with disabilities, including children in the ECEI program, were being supported by the NDIS. This represents a 13% increase in the number of participants over last quarter. An additional 32,486 participants, excluding children in the ECEI program, received approved plans this quarter.3
Importantly, the Scheme is supporting both people from existing State/Territory and Commonwealth systems and people who have not previously received support. Of the 277,155 participants currently supported by the Scheme, 180,162 previously received support from existing State/Territory or Commonwealth programs and 85,489 are now receiving support for the first time. In the March quarter, 36.3% of participants gained support for the first time, compared with 31.6% in previous quarters combined, excluding children supported in the ECEI program.
The number of children in the ECEI program has remained stable over the quarter, growing slightly from 11,489 to 11,504. The difference in the number of children in ECEI between quarters does not represent the number of additional children being supported in the ECEI program. Children in the ECEI program can exit from the program, remain in the program or go on to receive an NDIS plan under either Section 24 or Section 25 of the NDIS Act.
Figure 2: Growth in participants
0
50
100
150
200
250
300
‘000s
Jun-17
96,734
6,134
30,420
60,200
Jun-16
30,278
Jun-15
17,303
Jun-14
7,316
Jun-18
183,956
53,568
7,768
122,620
Sep-18
208,794
6,656
139,723
62,415
1.2 Annual growth in participants (Page TBC)
Dec-18 Mar-19
73,685
11,489
159,480
244,654 11,504
85,489
180,162
277,155
Children in the ECEI programParticipants who are receiving support for the first timeParticipants who received support from existing State/Territory and Commonwealth Systems
3 The difference in the number of children in ECEI between quarters does not represent additional children being supported in the ECEI program. Children in the ECEI program can exit from the program, remain in the program or go on to receive an NDIS plan. This means that simple addition will not produce total amounts of Scheme participants.
Part One: Participants and their plans
18March 2019 | COAG Disability Reform Council Quarterly Report

1.3 Operational progressThe NDIA performed strongly this quarter, achieving its operational target.
The NDIS is transitioning in sites across Australia in line with phasing schedules bilaterally agreed by State/Territory and Commonwealth governments. The bilateral agreements outline an estimate of the number of people who were predicted to participate in the NDIS from each State/Territory at particular points in time. The estimates are split into people who previously received support from State/Territory programs and those who have not previously received support.
The Agency has achieved its operational target for the 2018–19 year to date, meaning all actionable records were processed. Actionable records relate to those people who could be contacted, who met the access requirements and whose records were provided to the Agency.
At 31 March 2019, 75% of the Scheme-to-date bilateral estimate was reached and 67% of the 2018-19 year-to-date bilateral estimate was met.4 The availability of data and difficulties contacting transitioning participants from State/Territory and Commonwealth programs are the primary challenges in obtaining actionable records which is having a consequent impact on progress against bilateral estimates. Other reasons include some individuals making a decision not to apply to the Scheme, and others no longer requiring support.5
The Agency is undertaking a number of initiatives to ensure the Scheme is progressing towards bilateral estimates of all actionable records. As well as significant improvements to the participant and provider pathway, which will advance the consistency and efficiency of plan approvals, the NDIA continues to monitor the key performance metrics of each regional service delivery team.
Figure 3: Progress against bilateral estimates6
102%
of actionable records result in approved plans in 2018–19 year-to-date
75%
of Scheme-to-date bilateral estimate
achieved
67%
of year-to-date bilateral estimate
met
4 Detail on the bilateral estimates is included in Appendix C .5 There are a significant number of transitioning State/Territory and Commonwealth clients who have not been able to be contacted. The NDIA will attempt to contact an individual four times using the provided details, after which the person is deemed ‘unable to contact’. The NDIA communicates these details to the relevant State/Territory for follow-up, and is working proactively with each State/Territory government to connect with as many potential participants as possible.
6 Over 100% was achieved as additional actionable records were made available in the quarter and more new participants approached the Scheme in the quarter than anticipated
Part One: Participants and their plans
19March 2019 | COAG Disability Reform Council Quarterly Report

1.4 Participant characteristicsMore participants in remote and very remote areas of Australia joined the Scheme this quarter, along with higher numbers of children aged 0-6 years.
Over the transition period, there has been a steady increase in the diversity of participants, including:
• Remote and Very Remote: From 802 participants at 31 March 2017, to 1,582 at 31 March 2018, to 3,148 at 31 March 2019.
• 0-6 year olds: 20% of new participants in the March 2019 quarter were aged 0-6, compared with a total of 13% for the Scheme as a whole. This reflects the maturing of the Scheme, with more new entrants being children.
The proportion of participants living in remote and very remote regions has been increasing slowly over the past year, from 1,582 participants at 31 March 2018 to 3,148 participants at 31 March 2019. There were 508 new participants from remote and very remote regions in the March 2019 quarter, the largest number of any quarter to date.
A high proportion of active participants are in the 7 to 14 years age group, with 21% of participants entering the Scheme in the March 2019 quarter in this age group. 0 to 6 year olds represent a higher proportion of entrants compared with prior quarters, with 20% entering the Scheme within this age group during the quarter.
There has been a steady growth in the proportion of adults aged 45 years and over receiving support from the NDIS, increasing from 22.5% of participants at 31 March 2017, to 26.5% of participants at 31 March 2019. The proportion of participants in each age group reflects the phasing schedules outlined in some bilateral agreements which prioritise age group and/or people in existing State/Territory disability systems.
The proportion of participants with a CALD background was 9.3% in the March 2019 quarter, with the increase due in part to the significant number of participants phasing in metropolitan areas of Victoria. Considering the areas in which the NDIS has rolled out across Australia, the proportion of participants who are Aboriginal and/or Torres Strait Islander (5.5% total and 5.8% this quarter) is in line with expectations.
The number of Younger People in Residential Aged Care (YPIRAC) receiving support from the NDIS increased by 439 in the quarter, and by 1,801 over the past year. Of the 4,093 active participants as at 31 March 2019, 30 were under the age of 35, including 3 under the age of 25. A further 127 were aged 35 to 44, 686 aged 45 to 54, 2,477 aged 55 to 64, and 773 were aged 65 or over.
On 22 March 2019 the Minister for Families and Social Services announced a plan to reduce the number of younger people with disability living in aged care facilities. In support of this, the NDIA is expediting access to the Scheme for those who are eligible. Planners in the Complex Support Needs pathway will then, as a priority, work with eligible NDIS participants and their families to look at housing options, which may include funding for home modifications or SDA where required.
Part One: Participants and their plans
20March 2019 | COAG Disability Reform Council Quarterly Report

Figures 4 - 9 outline key participant characteristic trends from 31 March 2017 through to 31 March 2019.
Figure 4: Number of participants by disability7
0%
20%
40%
60%
80%
100%
Dec-18 Mar-19Sep-18Jun-18Mar-18Dec-17Sep-17Jun-17Mar-17
28%
28%6%5%5%
28%
28%
28%7%5%5%
27%
29%
29%7%5%5%
26%
29%
29%7%5%5%
25%
29%
29%7%5%5%
25%
29%
28%8%5%5%
26%
29%
27%8%5%5%
26%
29%
27%8%5%5%
26%
29%
26%8%5%5%
26%
Autism
Intellectual Disability
Psychosocial Disability
Cerebral Palsy
Other Neurological
Other
7 Percentages have been rounded in Figures 4 to 10, and totals may not add up to one hundred percent.
Figure 5: Number of participants by age group8
0%
20%
40%
60%
80%
100%
Dec-18 Mar-19Sep-18Jun-18Mar-18Dec-17Sep-17Jun-17Mar-17
14%
28%9%
28% 27% 26% 26% 25% 25% 25% 25%
9%8%
11%
14%
9% 9% 9% 8% 8% 8% 8% 8%
9% 9% 10% 10% 10% 10% 10% 9% 9%
9%8%
11%
13%
10%
9%
11%
13%
10%9%
11%
13%
10%9%
12%
13%
10%9%
12%
13%
10%
9%
12%
13%
10%9%
13%
13%
10%
9%
10% 11% 11% 11% 11% 11% 11% 12% 12%
13%2% 2% 1% 2% 2% 2% 2% 2% 2%
0–6
7–14
15–18
19–24
25–34
35–44
44–54
55–64
65+
Part One: Participants and their plans
21March 2019 | COAG Disability Reform Council Quarterly Report

Figure 6: Number of Aboriginal and/or Torres Strait Islander participants
Figure 7: Number of participants that identify as CALD
0
5
10
15
20
25‘000s
0%
1%
2%
3%
4%
5%
6%
7%
8%
9%
7.2% 7.4% 7.4% 7.2% 7.2% 7.5% 7.7% 8.0% 8.2%
Mar-17
5,421
Jun-17
6,735
Sep-17
8,119
Dec-17
9,422
Mar-18
10,801
Jun-18
12,984
Sep-18
15,254
Dec-18
18,246
Mar-19
21,201
Culturally and linguistically diverse
Proportion of plan approvals (cumulative)
‘000s
4,0914,878
5,946
Aboriginal and Torres Strait Islander
Proportion of plan approvals (cumulative)
0
5
10
15
20
0%
1%
2%
3%
4%
5%
6%
7%
Mar-19Dec-18Sep-18Jun-18Mar-18Dec-17Sep-17Jun-17Mar-17
5.4% 5.4% 5.3% 5.3% 5.5% 5.4%5.4% 5.5%5.5%14,303
12,46110,736
9,5007,972
6,974
Part One: Participants and their plans
22March 2019 | COAG Disability Reform Council Quarterly Report

0
1
2
3
4
‘000s
1.1% 1.1% 1.1% 1.1% 1.1% 1.1% 1.1%1.2% 1.2%
Remote/Very remote
Proportion of plan approvals (cumulative)
0%
1%
0.5%
1.5%
Mar-19Dec-18Sep-18Jun-18Mar-18Dec-17Sep-17Jun-17Mar-17
802 9651,195
3,148
2,649
2,1891,914
1,5821,401
Figure 8: Number of participants by remoteness8
8 Classified according to the Modified Monash Model, which categorises metropolitan, regional, rural and remote areas according to geographical remoteness and town size.
‘000s
1.2% 1.2%
1,0981,364
YPIRAC
Proportion of plan approvals (cumulative)
0
1
2
3
4
5
0%
1%
0.5%
1.5%
2%
Mar-19Dec-18Sep-18Jun-18Mar-18Dec-17Sep-17Jun-17Mar-17
4,0933,754
3,3453,038
2,6152,194
1.2%
1.7%1.8% 1.8%
1.7% 1.7%1.6%
881
Figure 9: Number of YPIRAC participants
Part One: Participants and their plans
23March 2019 | COAG Disability Reform Council Quarterly Report

Lacey is 32 and joined the National Disability Insurance Scheme in February 2018. She receives funding for support workers who visit the house for four hours a day, five days a week.
Her support workers Gillian and Rose spend time playing games with Lacey – a keen scrabble player – and they take her out to socialise in the community.
“When you’re on your own and you don’t have many resources, it’s very hard to get motivated to do all of these things,” Lacey’s mother Sharon said.
“The support workers have just opened Lacey up, she goes out with people in town, she goes to bingo and to the library, and plays virtual reality games on the television.”

Part Two: Participant experience and outcomesNew data this quarter shows participant outcomes continue to improve over time.
2.1 Community and social participationPeople of all abilities, ages, backgrounds and cultures, are participating in social, community, and civic activities.
Community and social participation improves the wellbeing of people with disability, lowers the long-term costs of care and support, and increases employment opportunities. The inclusion of people with disability in the community also benefits the wider community and promotes a more inclusive and diverse society.
The 2018-2022 Corporate Plan uses metrics and performance targets to measure the NDIA’s achievements against its aspirations. The ‘quality experience and outcomes for participants’ aspiration is measured by the percentage of participants currently employed (see page 28) and the number of participants involved in community and social activities, with initial results collected as a participant enters the Scheme.
For people who entered the Scheme between 1 July 2016 and 31 March 2017, participation in community and social activities has increased with time spent in the Scheme.
The level of community and social participation differs by age and disability when they enter the Scheme. Participants aged 25 and over have higher rates of participation compared with participants aged 15 to 24. Participants with Down Syndrome (48%) and sensory impairments (Hearing (48%), Visual Impairment (39%), and Other Sensory & Speech (40%)) have higher rates of participation compared with participants with Autism (28%) and Psychosocial Disability (30%).
Figure 10: Participants involved in community and social activities compared with the 2018-19 Target (participants who entered the Scheme between 1 July 2016 and 31 March 2017)
Participants in community and social activities
At Scheme entry
(Baseline9)
After two years in the
Scheme2018–19
Target
Aged 15 to 24 years 31% 44%
41%Aged 25+ 37% 47%
Aged 15+ (average) 35% 46%
9 Changes in baseline percentages between 2018-19 Q1, Q2 and Q3 are a result of new participants entering the Scheme in these quarters.
Part Two: Participant experience and outcomes
25March 2019 | COAG Disability Reform Council Quarterly Report

Figure 11: Participants involved in community and social activities after two years in the Scheme, by age group
Figure 12: Participants involved in community and social activities after two years in the Scheme, by disability group
0
10
20
40
30
50
Total65+55–6445–5435–4425–3419–2415–18
46%
11%
35%
47%4%
42%
45%9%
36%
47%10%
36%
46%8%
38%
14%
37%
51%
12%
32%
44%41%10%
31%
Age group
Part
icipa
tion
rate
%
% in a community group at baseline Increase after two years in the Scheme
0
10
20
40
30
50
Total65+55–6445–5435–4425–3419–2415–18
46%
11%
35%
47%4%
42%
45%9%
36%
47%10%
36%
46%8%
38%
14%
37%
51%
12%
32%
44%41%10%
31%
Age group
Part
icipa
tion
rate
%
% in a community group at baseline Increase after two years in the Scheme
0
10
20
40
30
50
60
70
ABI
Autis
m
Cere
bral
Pal
sy
Dow
n Sy
ndro
me
Hear
ing
Impa
irmen
t
Inte
llect
ual D
isabi
lity
Mul
tiple
Scl
eros
is
Othe
r
Othe
r Neu
rolo
gica
l
Othe
r Phy
sical
Othe
r Sen
sory
/Spe
ech
Psyc
holo
gica
l Disa
bilit
y
Spin
al C
ord
Inju
ry
Stro
ke
Visu
al Im
pairm
ent
Tota
l44%
9
35
41%12
28
50%16
34
66%18
48
50%2
48
51%13
3839%
633
47%13
34
37%4
33
38%7
31
47%7
4038%
8
30
43%7
3637%12
25
46%7
39
46%11
35
Part
icipa
tion
rate
%After two years in the Scheme community and social participation has increased from 35% to 46%. The largest increases have been for ages 25 to 34 (14%) and 19 to 24 (12%), and for participants with Down syndrome (18%), Cerebral Palsy (16%) and Intellectual Disability (13%).
Part Two: Participant experience and outcomes
26March 2019 | COAG Disability Reform Council Quarterly Report

Some participants who were not participating in a community and social group at entry to the Scheme later joined such a group, however unfortunately others who were in a group when they entered the Scheme were not in a group two years later. Specifically:
• Of the participants in a group when they entered the Scheme, 85% remained in a group
• Of the participants not in a group when they entered the Scheme, 25% were in a group two years later.
Statistical analysis indicates that the key drivers of engaging in social participation are:
• Volunteering
• Having friends other than family or paid staff
• Being from a CALD background
• Having a paid job
Figure 13: Participants involved in community and social activities, by type of community group
0
10
20
40
30
50
OverallGroup for peoplewith a disability
General communitygroup
46%
11%
25%1%
21%
Type of community group
Part
icipa
tion
rate
%
11%
10%24%
35%
% in a community group at baselineIncrease after two years in the Scheme
Part Two: Participant experience and outcomes
27March 2019 | COAG Disability Reform Council Quarterly Report

2.2 Employment The proportion of participants in employment remains static.
Figure 17 shows progress against the NDIA’s corporate plan metrics for ‘participants in work’, for people who entered the Scheme between 1 July 2016 and 31 March 2017.
There was an eight percentage point increase in the number of participants aged 15 to 24 years old in work, from 13% baseline to 21% this quarter. For participants aged 25 years or over, the percentage fell by two percentage points from 25% to 23%. The average across both cohorts was also 23%, two percentage points higher than the baseline result. The target for the number of employed participants in both cohorts is 26% for 2018-19.
Figure 14: Participants in work compared with the 2018-19 Target (participants who entered the Scheme between 1 July 2016 and 31 March 2017)
Participants in workAt Scheme
entry Baseline10
After two years in the
Scheme2018–19
Target
Aged 15 to 24 years 13% 21%
26%Aged 25+ 25% 23%
Aged 15+ (average) 21% 23%
There is a strong commitment from the Agency and the Department of Social Services to implement an employment strategy to improve job opportunities for people with disability (see page 54). The NDIA is acutely aware of the benefits employment brings to participants and the economy and has prioritised employment options in planning discussions.
10 Changes in baseline percentages between 2018-19 Q1, Q2 and Q3 are a result of new participants entering the Scheme in these quarters
Part Two: Participant experience and outcomes
28March 2019 | COAG Disability Reform Council Quarterly Report

Figure 15: Employment rates of participants aged 15 years and over who entered the Scheme in 2016-17 and 2017-18, by disability type
0%
10%
20%
30%
40%
50%
60%
Cere
bral
Pal
sy
Psyc
hoso
cial D
isabi
lity
ABI
Othe
r Neu
rolo
gica
l
Stro
ke
57%
32%30%30% 29%28%26%
23%23% 22%19%18%
15% 13%13%
5%
Hear
ing
Impa
irmen
t
Othe
r Sen
sory
/Spe
ech
Dow
n Sy
ndro
me
Visu
al Im
pairm
ent
Inte
llect
ual D
isabi
lity
Spin
al C
ord
Inju
ry
Othe
r Phy
sical
Aver
age
Othe
r
Mul
tiple
Scle
rosis
Autis
m
The average employment rate for participants aged 15 or more by disability type is 23%. The highest employment rates occur in participants with a hearing impairment at 57%, and other sensory or speech disabilities at 32%. Participants with an acquired brain injury (ABI) and other neurological disabilities are among those least likely to be employed, with baseline employment levels at 13%. The lowest percentage of employment by disability type is at 5% for people who have had a stroke, explained in part by age
Part Two: Participant experience and outcomes
29March 2019 | COAG Disability Reform Council Quarterly Report

2.3 Two-year analysis of participant outcomes Analysis of participant outcomes over two years demonstrates the positive long-term impact of the NDIS.
To assess the longitudinal impact of the NDIS, participants who entered the Scheme in 2016-17 were asked ‘Has the NDIS helped?’ after one and two years in Scheme, allowing the NDIA to gain a better understanding of the longer-term impact of the Scheme.
Survey results for participants who entered the Scheme in Quarter 3 of 2016-17, and who have now been in the Scheme for two years, have built on the results of the previous two quarters. These results support the trend that outcomes are improving as participants spend more time in the Scheme.
From transition to 31 March 2019, for participants that have been in the Scheme for two years, the following outcomes have been recorded:
For children aged 0 to before starting school: • 94% of parents and carers thought the NDIS improved their child’s development,
compared to 91% in their first year.
• 85% of parents and carers thought the NDIS helped increase their child’s ability to communicate what they want, compared to 82% in their first year.
For children starting school to 14 years: • 65% of parents and carers felt their child had become more independent as a result
of the NDIS in their second year of participation, compared to 56% in their first year.
• 50% of parents and carers felt the NDIS had improved their child’s relationship with family and friends in their second year of participation, compared to 46% in their first year.
For young adults aged 15 to 24 years: • 66% of participants said the NDIS had helped them with daily living activities in their
second year of participation, compared to 59% in their first year.
• 59% of participants felt the NDIS had helped them improve their participation in community and social activities, compared to 56% in their first year.
For adults aged 25 and over: • 75% of participants believed the NDIS helped them have more choice and more
control over their lives in their second year of participation in the NDIS, compared to 68% in their first year.
• 80% of participants believed the NDIS helped them with daily living activities in their second year of participation, compared to 72% in their first year.
Apart from the above results, the analysis indicates that there are areas for improvement in the outcomes for participants. Only 17% of participants aged 15 to 24 and 19% of participants aged 25 and over felt involvement in the NDIS had helped them to find a job that was right for them, compared to 19% and 20% respectively in their first year. Employment outcomes for participants have been prioritised within the NDIA and a Participant Employment Taskforce (see page 54) has been established to help address some of the challenges facing people with disability who are seeking and maintaining employment.
Part Two: Participant experience and outcomes
30March 2019 | COAG Disability Reform Council Quarterly Report

2.4 Participant satisfaction Participant satisfaction remains high with improvements this quarter compared with the previous quarter.
Plan development is a key milestone on the participant pathway. To better understand the impact of the NDIS on participants and their families and carers, the Agency conducts satisfaction surveys during the planning process each quarter. This quarter, 88% of participants rated their overall experience with the NDIS planning process as either ‘Very good’ or ‘Good’. This was an improvement on the last quarter’s satisfaction rate of 84%.
Figure 16: Historical satisfaction rates
11 Survey results were collected from 674 randomly selected participants. This sample size meets the required level of precision for estimating satisfaction at a 95% confidence level.
0
20
40
80
60
100
Q3 Q4 Q1 Q2 Q3 Q4 Q1 Q2 Q3 Q4 Q1 Q2 Q3 Q4 Q1 Q2 Q3
95%94%96%98%93%
100%
85%84%88%84%84%83%84%88%
93%84%88%
Quarter2014–15 2015–16 2016–17 2017–18 2018–19
Prop
ortio
n of
Par
ticip
ants
%
Figure 17: Participant satisfaction in 2018-19 Q311
Agree/Strongly
agreeNeutral
Disagree/ Strongly disagree
The planner listened to me 94% 3% 3%
I had enough time to tell my story and say what support I need 91% 5% 4%
The planner knows what I can do well 80% 14% 6%
The planner had some good ideas for my plan 84% 11% 5%
I know what is in my plan 81% 11% 8%
The planner helped me think about my future 75% 16% 10%
I think my plan will make my life better 84% 10% 6%
The planning meeting went well 92% 5% 3%
Of the participants surveyed this quarter, 94% felt their planner listened to them, 91% considered that they had enough time to tell their story, and 92% reported their planning meeting to have gone well.
Part Two: Participant experience and outcomes
31March 2019 | COAG Disability Reform Council Quarterly Report

2.4.1 New participant satisfaction survey New survey is providing a comprehensive view of participant experience.
Since September 2018 the Agency has been testing and refining a new participant satisfaction survey that allows for a more comprehensive understanding of the participant experience. It gathers responses at the four primary stages of the participant pathway – access, pre-planning, planning and plan review – whereas the original survey gathers responses at the planning stage only.
The new survey caters to analysis of the experience of different participant groups - for example for differences in age and disability. By gaining greater insight into varying experiences at different stages of the NDIS process, the NDIA will be better positioned to make meaningful and specific improvements to the participant pathway.
A new online version of the survey was launched at the end of the quarter, to complement the existing phone surveys. The online version asks the same questions as the phone survey. Participants receive an SMS or email message asking them to log into the myplace participant portal to complete the survey. Responses are private, and any identifying data is removed.
Part Two: Participant experience and outcomes
32March 2019 | COAG Disability Reform Council Quarterly Report

Comparing previous quarter (2018-19 Q2) with the current quarter (2018-19 Q3) indicates improvement in satisfaction, particularly in understanding the next stages in the process12:
Stage One: Access • 94% of respondents believed their NDIS contact to be respectful this quarter
compared with 94% in the previous quarter.
• 77% of respondents were happy with the process by which they entered the NDIS this quarter compared with 75% last quarter.
• 71% of respondents understood the next stage in their NDIS process this quarter compared with 64% last quarter.
Stage Two: Pre-planning • 96% of respondents understood what information they had to provide to prepare for
pre-planning this quarter compared with 94% last quarter.
• 87% of respondents believed their NDIS contact understood how disability impacts their life compared with 85% last quarter.
• 75% of respondents understood the next stage in their NDIS process this quarter compared with 70% last quarter.
Stage Three: Planning • 96% of respondents understood what information they had to provide for their plan
this quarter compared with 95% last quarter.
• 86% of respondents believed their NDIS contact understood how disability impacts their life this quarter which was consistent with last quarter.
• 75% of respondents understood the next stage in their NDIS process this quarter compared with 73%
Stage Four: Plan Review • 83% of respondents felt prepared for their plan review meeting this quarter compared
with 79% last quarter.
• 81% of respondents believed their NDIS contact understood how disability impacts their life this quarter compared with 78% last quarter.
• 85% of respondents believed their NDIS plan was helping them progress with their goals this quarter compared with 84% last quarter.
12 Survey results were collected from 6,269 randomly selected participants made up of 1,542 participants at access, 1,529 at pre-planning, 1,678 at planning, and 1,520 at plan review. The number of respondents at each of the four stages of the participant pathway were sufficient to meet the required level of precision for estimating satisfaction at a 95% confidence level.
Part Two: Participant experience and outcomes
33March 2019 | COAG Disability Reform Council Quarterly Report

The results show an overall improvement in satisfaction across the four stages.
Participants have responded with high levels of satisfaction for understanding what they need to prepare for pre-planning (96%) and what information they need to provide for their plan (96%).
Respondents found NDIA contacts and planners to be respectful (94% of Access respondents) and understanding of how their disability impacts their life (87% of pre-planning respondents and 86% of Planning respondents).
While there is still work to do, there has been a large improvement in the proportion of participants who understand the next stage of the process. Seventy-one percent (71%) of participants understood the next step after access compared with 64% in the previous quarter, and 75% understood what was next after pre-planning compared with 70% in the previous quarter.
2.5 Unscheduled plan reviews The rate of unscheduled plan reviews continues to decrease.
The rate of unscheduled plan revews has fallen for the eighth quarter in succession, indicating improvements in satisfaction with final plans.
Figure 18: Cumulative number and proportion of unscheduled plan reviews over time
‘000s
Unscheduled reviews
Rate of unscheduled reviews (cumulative)
0
10
20
30
40
50
60
0%
10%
15%
5%
25%
30%
20%
35%
Mar-19Dec-18Sep-18Jun-18Mar-18Dec-17Sep-17Jun-17Dec-16Sep-16 Mar-17
8614,681
11,58416,622
20,47925,052
30,673
36,332
43,152
50,374
59,109
10.1%
22.4%
30.5%28.3%
24.3%21.8%
20.4%
19.0% 18.1
% 17.2%
16.6%
Part Two: Participant experience and outcomes
34March 2019 | COAG Disability Reform Council Quarterly Report

2.6 Plan activations Plan activation rates increase.
Plan activation refers to the amount of time between a participant's initial plan being approved, and the date the participant first receives support from a provider.
Seventy percent (70%) of plans were activated within 30 days during the quarter, and 86% of plans were activated within 90 days. The number of days for plan activation improved slightly in the first quarter of 2018-19, with a one percentage point increase in durations of less than 30 days and a one percentage point reduction in durations of less than 90 days compared with previous quarters. There was a fall in the number of participants activating their plans after more than 90 days, but an increase in the number who had not commenced receiving support. There is a lag between when support is provided and when payment is made – hence, these figures under-estimate the number of participants who activated their plans.
The proportion of active participants with plans activated within 12 months is consistent at 94% to 95% across disability groups. The proportion is also 95% for CALD participants, and participants residing in major cities and regional centres, but slightly lower at 90% for Aboriginal and Torres Strait Islander participants and 88% for participants living in remote areas.
Figure 19: Duration to plan activation by quarter of initial plan approval for active participants13,14
Prior Quarters (Transition Only) 2018-19 Q1
Plan activation N % N %
Less than 30 days 97,580 69% 18,045 70%
30 to 59 days 16,273 11% 2,964 11%
60 to 89 days 7,828 6% 1,236 5%
Activated within 90 days 121,681 86% 22,245 86%
90 to 119 days 4,521 3% 665 3%
120 days and over 11,059 8% 949 4%
Activated after 90 days 15,580 11% 1,614 6%
No payments 4,753 3% 1,926 7%
Total plans approved 142,014 100% 25,785 100%
13 Plans approved after the end of 2018-19 Q1 have been excluded from the table. They are relatively new and it is too early to examine their durations to activation.
14 Activations include payments for in-kind supports.
Part Two: Participant experience and outcomes
35March 2019 | COAG Disability Reform Council Quarterly Report

2.7 Plan utilisation Utilisation increases the longer participants have been in the Scheme, and is higher for participants in supported independent living, and for those living in major cities.
The extent to which utilisation differs between groups of participants (e.g. age group), and types of supports in different geographies, provides insight into where markets are thin and also where there are opportunities for providers to expand their support offering.
The most significant drivers of utilisation are length of time in the Scheme (the longer a participant has been in the Scheme the higher the utilisation – Figure 20), and whether or not the participant is in Supported Independent Living – Figure 21.
Figure 20: Utilisation of supports by plan number15
Figure 21: Utilisation of supports for participants with and without SIL
48%
71% 72%
5+ plans4th plan3rd plan2nd plan1st plan0
20
40
60
80
2017
–201
8 Ut
ilisa
tion
rate
s %
65%74%
85%
60%
Supported independent living
Not in supported independent living
0
20
40
60
100
80
2017
–201
8 Ut
ilisa
tion
rate
s %
In addition, capacity building supports are less utilised than core support for participants with a second or later plan who do not have SIL. This is more evident for participants aged 15 and over (Figure 22). Capacity building supports for daily living are under-utilised. These supports are intended to build a participant’s independence, which reduces the need for core support.
15 Plans are generally for one year periods, but may be of shorter or longer duration depending on individual circumstances.
Part Two: Participant experience and outcomes
36March 2019 | COAG Disability Reform Council Quarterly Report

Lastly, a key driver of utilisation is location – with participants in less populated locations, including remote and very remote communities, having lower utilisation than participants in major cities and regional locations (Fig 24). This is driven by both core supports (non-SIL) and capacity building supports across all age groups (Fig 25). Capacity building supports for employment are particularly under-utilised in very remote areas.
Figure 22: Utilisation of capacity building supports by age group
0
20
60
40
80
65+45–5435–4425–3419–2415–187–140–6 55–64
64%57%
45%48% 50% 50% 50% 48% 48%
Age group
2017
–201
8 Ut
ilisa
tion
rate
s %
Figure 23: Map of Australia depicting remote locations with participants in the scheme as at 31 March 2019 – Utilisation of a percentage total committed
Queenslandn = 834 Committed Supports = $41.3mUtilisation = 52%
New South Walesn = 312 Committed Supports = $16.2mUtilisation = 53%
Victorian = 42 Committed Supports = $1.4mUtilisation = 59%
Tasmanian = 56 Committed Supports = $2.6mUtilisation = 55%
Western Australian = 355 Committed Supports = $17.5mUtilisation = 41%
Northern Territoryn = 892 Committed Supports = $113.2mUtilisation = 57%
South Australian = 656 Committed Supports = $34.0mUtilisation = 48%
Part Two: Participant experience and outcomes
37March 2019 | COAG Disability Reform Council Quarterly Report

Figure 24: Utilisation of supports by location16
Figure 25: Utilisation by support type in remote and very remote locations
0
20
60
40
80
TotalVeryRemote
RemotePop.<5,000
Pop.between5,000–15,000
Pop.between15,000–50,000
Pop.>50,000
Majorcities
70% 69% 68% 66%58%
65%
39%
69%
2017
–201
8 Ut
ilisa
tion
rate
s %
0
20
60
40
80
Capacity BuildingCore (Not in supported independent living)
49%
33%
63%
40%37%
52%
2017
–201
8 Ut
ilisa
tion
rate
s %
Remote Very remote All areas
16 Classified according to the Modified Monash Model, which categorises metropolitan, regional, rural and remote areas according to geographical remoteness and town size.
Overall, there are market opportunities for providers to assist in increasing participant capacity to improve independence and also reduce the need for core support. There are additional opportunities in remote and very remote areas for core and capacity building supports.
Part Two: Participant experience and outcomes
38March 2019 | COAG Disability Reform Council Quarterly Report

2.8 Actions to improve participant experience The NDIA makes improvements across different areas of the participant pathway to improve experience and outcomes for participants.
2.8.1 Participant Pathway New specialised pathways are being rolled-out progressively across the country.
Based on extensive consultation with participants, families, carers, providers and sector representatives, the NDIA has continued to make significant improvements to the participant pathway. Changes have focused on embedding a more individualised approach with participants, and an emphasis on clearer communication to better support people with disability to achieve their goals. The changes include.
• Three pathways for tailoring approaches around the needs of the NDIS participant, including complex support needs and Early Childhood Early Intervention pathways;
• Two service streams for psychosocial disability and hearing, to deliver targeted support to provide participants with an experience more suited to their specific disability needs; and
• Four service enhancements to meet the communication and engagement needs of people from different backgrounds or areas, including Aboriginal and Torres Strait Islander peoples, culturally and linguistically diverse people, remote and very remote communities, and people who identify as LGBTIQA+.
• In response to participant feedback, a key improvement being rolled out is changes to the participant plan format, which now provides participants with a single point of contact. This contact is listed in each participant's plan document and in the myplace participant portal.
The Complex Support Needs Pathway is providing specialised support for people with disability that experience extraordinary complex support needs, and who have a greater need for coordination of multiple services. This may include voluntary or involuntary involvement in other government service systems (such as justice systems, child protection, and/or mental health programs) and transitional supports for returning to the community, for example, exiting incarceration or an acute rehabilitation environment.
In March 2019, the complex support needs pathway began expanding to all States and Territories, with ninety planners who have human service qualifications and/or extensive expertise in complex case coordination being transferred to the Complex Support Needs (CSN) Branch. These planners are supporting complex participants to easily access the Scheme and are closely monitoring their plans, including how the plans link to other mainstream services. Skilled support co-ordinators are also being connected to these participants to further assist with implementing plans and helping participants achieve their goals.
During the March 2019 quarter 305 children benefited from streamlined access to early intervention supports, through a stream developed in 2018 for children aged 0 to 6 with newly diagnosed hearing loss. The NDIA is now working on developing further hearing streams for participants aged 7 to 64, and has commenced consultation with key external stakeholders in the deaf community to provide input across key life transition points.
Part Two: Participant experience and outcomes
39March 2019 | COAG Disability Reform Council Quarterly Report

In addition, work is underway to transition eligible clients within the Commonwealth’s Hearing Services Program (HSP) to the NDIS. This commenced in partnership with Australian Hearing at the beginning of March 2019. All eligible clients will transition by the end of June 2020.
The NDIA acknowledges that delays are occurring for children aged from 0 to 6 in accessing supports through the Early Childhood Early Intervention program. The reasons include the rapidity of the roll-out in some jurisdictions, where large numbers of files may be transferred on a single day, creating additional delays for new participants.
The NDIA is working expeditiously to reduce the wait times for children and to ensure that early intervention supports are provided as quickly as possible. This includes working with groups such as the Autism Advisory Group.
There is a continuing focus on improving supports for people with psychosocial disability. During the quarter foundational training was extended from the initial states of South Australia and Tasmania to include Victoria, Queensland, Western Australia, the Australian Capital Territory, and the Northern Territory. The training is designed to increase the skills of the workforce to better understand psychosocial disability. Its national rollout is expected to be completed by June 2019, and all new NDIA service delivery staff and Local Area Coordinators (LACs) will receive this training as part of their standard induction training.
Streamlined access for participants from Commonwealth psychosocial programs is available in all areas. Streamlined access for participants from State or Territory programs commenced in South Australia and Tasmania in November 2018, and in April 2019 the NDIA will finalise the timing for the remaining States/Territories. The NDIA has received positive feedback from mental health service providers in relation to improvements to the Streamlined Access process in South Australia and Tasmania. Service providers have also indicated improvements with consistency and responses from call centre staff when supporting clients to access the NDIS through Streamlined Access process.
The NDIA has produced 10 new resources on Access available to staff and providers. The NDIA has also held a series of Mental Health workshops in Tasmania and South Australia during February and March to health services and providers.
The NDIA continues to build staff skills and competencies, to improve the NDIS experience for participants from diverse backgrounds. This includes Aboriginal and Torres Strait Islander peoples, people from culturally and linguistically diverse groups, people living in remote or very remote communities, and participants identifying as LGBTIQA+. This is being achieved through:
• preparations for the implementation of service enhancements to support Aboriginal and Torres Strait Islanders in WA (Pilbara and surrounding communities);
• a new eLearning module “Contemporary Disability Rights” and a disability navigator for NDIA staff and partners —an online portal providing access to a suite of disability awareness resources which was released in February 2019; and
• a cultural awareness online training module, Celebrating Diversity: LGBTIQA+ Inclusion which was released to all NDIA employees in February 2019.
Part Two: Participant experience and outcomes
40March 2019 | COAG Disability Reform Council Quarterly Report

2.8.2 Independent Assessment Pilot (IAP)High levels of participant engagement to support the NDIA’s aim for greater consistency and reliability in access and planning decisions.
The IAP launched in November 2018 to better understand and assess the impact of disability for people accessing the NDIS. It aims to improve consistency, accuracy and reliability in access and planning decisions. People with autism spectrum disorder, intellectual disability and psychosocial disability, have been invited to join this voluntary pilot, to undertake a functional assessment with an independent assessor using standardised assessment tools.
The level of engagement from participants has been very positive, with 73% of those invited to join the pilot taking part and expressing high levels of satisfaction with the process (93% were “satisfied” or “very satisfied“). The pilot is on track to reach a target number of participants before closing at the end of April 2019. The NDIA will then conduct a detailed evaluation of its results.
2.8.3 Assistive TechologySince February 2019, participants who require replacement of their existing AT (valued between $1,500 and $15,000) that is not repairable or has reached the end of its service life, may have funding included in their plan without the need for reassessment. Repairs and maintenance to AT, including the addition of an annualised amount can be included in a participant’s NDIS plan
Further, as expenditure under $1,500 no longer requires a quote, the wait times that have been experienced should reduce.
2.8.4 Hospital DischargeThe NDIA has been working in collaboration with South Australia Health to develop a Hospital Discharge Framework. The Framework aims to improve outcomes for patients / NDIS participants, with a timely and supportive experience of transitioning from hospital to community in a safe and timely way and with the supports that they need.
The Framework is guided by the premise that Health and the NDIS are centred on the needs of participants, and it acknowledges the important role that families and other informal supports play in the lives of participants, alongside community and mainstream services, and the NDIS.
The Framework will be tested and evaluated in a six month pilot commencing on 1 April 2019, with the intent to implement a nationally consistent approach for hospital discharge in all jurisdictions. The Framework includes scope, roles and responsibilities, improved processes, and key performance indicators focused on improving timeliness and minimising delays in the discharge process.
Part Two: Participant experience and outcomes
41March 2019 | COAG Disability Reform Council Quarterly Report

Six year old Emma was born with a hearing impairment and several other health complications. She initially struggled with verbal communication and shed a lot of tears when she couldn’t express herself.
“Since the NDIS we have noticed big changes in Emma’s speech – she is able to chat with her friends and classmates and it’s just phenomenal” says Emma’s mum Jenny.

Part Three: Providers and the growing marketMore providers are registered to provide supports and work is underway to encourage innovation.
3.1 Growth and diversity of providersThe provider network grows, increasing participants’ capacity to exercise choice and control.
Access to a growing, vibrant and competitive provider market is vital to participants achieving their goals. At 31 March 2019, there were a total of 20,208 registered providers, representing 6% market growth on last quarter. Of the total number of providers, 57% (or 11,418) were active at 31 March 2019.
An active provider is an individual or organisation that has been registered with the NDIS and is offering services to participants. An inactive provider is an individual or organisation who has registered with the NDIS, but is not currently offering services to participants.
The jurisdictions that experienced the highest level of growth in active providers were Queensland with a 22% increase, and Western Australia with a 17% increase.
The largest registration groups in the NDIS, including both active and inactive providers, which experienced growth this quarter were:
• Therapeutic supports from 8,993 to 9,636 (7% increase)
• Household tasks from 5,283 to 5,883 (11% increase)
• Assistance with travel/transport arrangements from 3,912 to 4,334 (11% increase)
• Innovative Community Participation from 2,925 to 3,328 (14% increase)
• Early Intervention supports for early childhood from 2,997 to 3,151 (5% increase)
Of the total number of registered providers, 45% are individual / sole traders and 55% are organisations/companies.
The highest level of growth in active providers was demonstrated in the following registration groups:
• Specialist Disability Accommodation from 118 to 140 (19% increase)
• Innovative Community Participation from 314 to 361 (15% increase)
• Exercise Physiology and Physical Wellbeing activities from 653 to 743 (14% increase)
Specialist Disability Accommodation (SDA) is a fast growing and significant provider registration group. There are currently 12,356 participants with SDA in their plan, representing an increase of 13% since last quarter.
Part Three: Providers and the growing market
43March 2019 | COAG Disability Reform Council Quarterly Report

Figure 26: Growth in registered providers
Sep-16 Dec-16 Mar-17 Jun-17 Sep-17 Dec-7 Mar-18 Jun-18 Sep-18 Dec-18 Mar-190
5
10
15
20
25000’s
3,696
1,367
5,110
2,238
6,814
3,107
8,698
4,005
10,507
5,053
12,328
6,269
14,271
7,379
16,755
8,457
17,925
9,693
19,075
10,515
20,208
11,418
Active Registered Providers Registered Providers
The NDIA recognises the integral role a safe and competitive provider market plays in the success of the Scheme.
The NDIS Quality and Safeguards Commission, launched on 1 July 2019, continues to manage provider registrations in New South Wales and South Australia, and will commence operations in all other States and Territories by July 2020.
3.2 New NDIS Demand Tool Helping providers grow in the NDIS.
In a separate initiative, during the March 2019 quarter a new NDIS demand forecast tool was released by the Department of Social Services. The NDIS Demand Map is designed to help providers grow in the NDIS. It includes forecasts of the NDIS demand by postcode across Australia, including how many NDIS participants are expected to live in a postcode, how much participants are expected to spend and on what types of support, and how many workers may be required.17
3.3 Innovative approaches to services and supports Increasing opportunities for participant choice.
The NDIA is developing a strategy to encourage growth of new and better services across Australia, which will increase opportunities for participant choice. The strategy will identify contemporary and innovative approaches to supports and services that build participant capacity, seek to increase independence, and encourage social inclusion.
Contemporary approaches already exist either locally or internationally and have clear evidence to demonstrate improved outcomes for people with disability.
Innovation, or innovative support models, are novel approaches likely to have high demand across Australia. They can be evaluated to demonstrate how participants will be enabled to achieve their goals and improve their outcomes even further.
17 A beta version of the Demand Map is located at https://blcw.dss.gov.au/ndis-demand-map/
Part Three: Providers and the growing market
44March 2019 | COAG Disability Reform Council Quarterly Report

The strategy will outline the NDIA’s vision for an innovative marketplace with informed participants and families, and how the NDIA plans to achieve this vision. The NDIA will consult with a range of stakeholders including participants, providers and industry leaders, ahead of releasing the strategy later in the year.
3.4 NDIS Pricing Changes made to the NDIS Price Guide improve maximum prices available in the market.
The NDIA is acutely aware of its role as market steward and the need to set prices that encourage market development, particularly in thin markets.
Supplementing the work of the Independent Pricing Review, which is currently being implemented, and the Western Australia Market Review, the NDIA has undertaken extensive consultation on therapy prices and pricing for attendant care. That work, initiated and promoted by the NDIA, has been rigorous and fact-based, using extensive data not previously available to the Independent Pricing Review.
As a consequence, it was announced towards the end of the quarter that from 1 July 2019 significant price increases will be made for both therapy and attendant care.
More specifically in the case of therapy supports, in New South Wales, Victoria, Queensland and the Australian Capital Territory, differential prices were set for psychology supports versus other types of therapy, with increases of 17% and 6% respectively. In addition, for South Australia, Western Australia, Tasmania and the Northern Territory, differential prices were set for psychology, physiotherapy and other therapies, with increases of 28%, 23% and 6% respectively.
In relation to attendant care, increases of between 5.6% and 15.4% to the base price for attendant care, depending on location, times and days of shifts, and skill level will be available from 1 July 2019. In addition, a Temporary Transformation Payment of 7.5% will also be made to providers, reducing by 1.5% each year over 5 years. This conditional loading will assist providers continue to transform their businesses as the market evolves.
Overall, the increases will help ensure the availability of supply in the attendant care and therapy markets, thereby assisting participants to achieve their goals.
Part Three: Providers and the growing market
45March 2019 | COAG Disability Reform Council Quarterly Report

3.5 Specialist Disability Accommodation (SDA)SDA is a fast growing and significant provider registration group that experienced a 19% growth in the quarter (118 to 140) for active SDA providers. This coincided with the number of participants with SDA in their plan increasing by 13%. During the quarter an additional 746 places in SDA properties became available to NDIS participants.
On 8 February 2019 the Minister and Assistant Minister announced a package of reforms to SDA, following a review of the SDA Pricing and Payments Framework by the Disability Reform Council (DRC) in 2018.
The changes announced include a revised SDA Pricing and Payments Framework and revised SDA Rules, to:
• Recognise the centrality of choice and control in SDA for eligible participants
• Provide greater visibility and certainty to investors regarding pricing
• Embed a requirement for the NDIA to provide quarterly updates on SDA data
• Embed the establishment of an SDA Reference Group by the NDIA
• Remove the requirement for participants to exhaust all other options before they can have their eligibility for SDA considered
• Enable the NDIA to provide SDA funding in a plan even if a dwelling is not available or soon to be available.
Since the announcement the NDIA has:
• Published an updated 2018-19 SDA Price Guide which includes the final SDA pricing assumptions, adjusts SDA prices for the 2018-19 financial year using CPI, and confirms that CPI will be used to adjust prices going forward
• Internally launched the SDA Panel, an improved process for determining SDA eligibility that was initially trialled last year. Starting from February 2019, all new SDA eligibility decisions are now referred to an internal panel of experts for consideration. The SDA Panel is already leading to more consistent and timely SDA decisions as it assists to implement the recently revised SDA Rules.
• Published updated SDA data in its reports to COAG (including this report). The data provided expands on that provided last quarter and now includes more information on the distribution of demand, and improved detail on enrolled dwellings. The NDIA will continue to expand and update SDA data in future reports.
• Announced the establishment of the SDA Reference Group. The NDIA has appointed members who represent the variety of SDA stakeholders through an open expression of interest process. The first meeting was held in March 2019.
• The NDIA will continue improving SDA in 2019, with plans underway to:
– Launch a new third party dwelling certification program to increase the surety of providers that their dwellings comply. The certification process will allow providers to have their dwellings certified at the design phase.
– Announce an SDA Innovation Plan that will detail the actions the NDIA will take to encourage more innovation in SDA and accommodation and support models.
Part Three: Providers and the growing market
46March 2019 | COAG Disability Reform Council Quarterly Report

Kenny Dhurrkay is from Milingimbi Island which is part of the Crocodile Island Group in the Arafura Sea.
It is approximately half a kilometre off the north coast of Central Arnhem Land, 440 km east of Darwin and 200 km West of Nhulunbuy. This is the first ever scooter in Milingimbi. It will allow Kenny, who has demyelination syndrome, to have greater community access and participation.

Part Four: Information, Linkages and Capacity Building (ILC) New ILC grant rounds increase the capacity of Australian organisations to support people with disability.
4.1 Building inclusive communitiesNew Economic Participation grants announced to boost employment opportunities for people with disability.
The NDIA introduced the 'ILC Strategy Towards 2022' in December 2018, which will guide investment of almost $400 million in ILC funds from 2019-20 to 2021-22.
ILC provides grants to organisations to carry out activities in the community. Activities that are funded seek to create connections between people with disability and the communities in which they live, encouraging inclusion and participation and promoting a diverse Australian society. The outcome sought through these activities is that people with disability, their families and carers actively contribute to leading, shaping and influencing their community. In doing so ILC seeks to ensure that people with disability, their families and carers:
• Have the knowledge, skills and confidence to participate and contribute to the community
• Are connected and have the information they need to make choices and decisions
• Use and benefit from the same mainstream services as everyone else
• Use and benefit from the same community activities as everyone else
To date, the NDIA has allocated 222 grants totalling $85.9 million (excluding GST) to organisations across Australia to deliver a wide range of ILC initiatives.
In addition to this, the NDIA has recently announced that 114 Disabled Peoples Organisations and Families Organisations (DPFOs) will share in $13.8 million in grants, including 13 organisations led by Aboriginal and Torres Strait Islander, Culturally and Linguistically Diverse (CALD) or LGBTI communities, which will benefit from $1.6 million in grants.
The DPFO grant round will lay the foundations for a stronger DPFO sector, building the overall capacity of user led disability organisations to better support, connect and foster the capacity of people with disability in the community.
The ILC Economic Participation of People with Disability grant round 2019-20 opened on 15 February 2019. Working with the NDIS Participant Employment Taskforce, the goal of the Economic Participation of People with Disability grant round is to build the capacity of businesses and organisations to employ people with disability through community engagement, improved resources and training.
Part Four: Information, Linkages and Capacity Building (ILC)
48March 2019 | COAG Disability Reform Council Quarterly Report

For Elizabeth, getting a job was always going to happen,” says Elizabeth Frost’s mother Kim.
With no funded support when she left school, Elizabeth found the transition from school to employment challenging.
As an NDIS participant since 2017, and funding to support her goals and everyday needs, Elizabeth has one-to-one support to assist her to learn how to cook, perform household tasks, and access the community.
She now works as part of the team in the kindergarten room at JAC’s Learning World, employed with the same entitlements as the other child care assistants. Elizabeth is more independent, with a strong friendship group, and a network of colleagues and extended family.
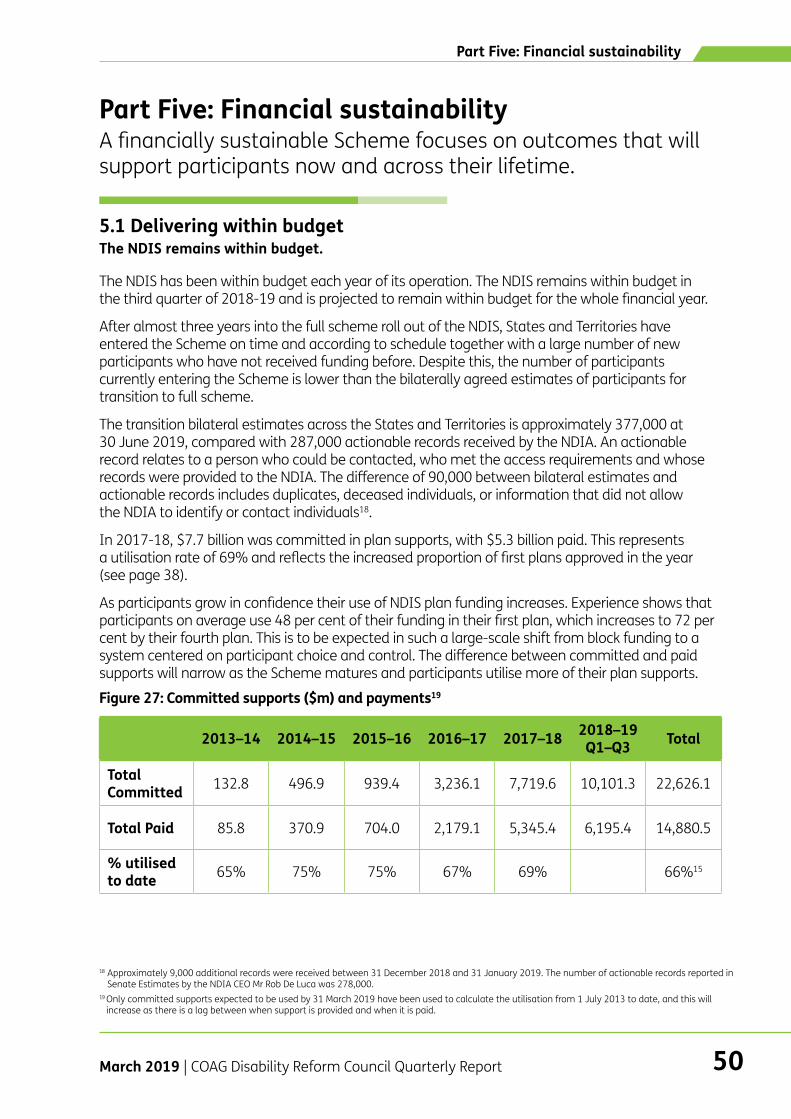
Part Five: Financial sustainabilityA financially sustainable Scheme focuses on outcomes that will support participants now and across their lifetime.
5.1 Delivering within budget The NDIS remains within budget.
The NDIS has been within budget each year of its operation. The NDIS remains within budget in the third quarter of 2018-19 and is projected to remain within budget for the whole financial year.
After almost three years into the full scheme roll out of the NDIS, States and Territories have entered the Scheme on time and according to schedule together with a large number of new participants who have not received funding before. Despite this, the number of participants currently entering the Scheme is lower than the bilaterally agreed estimates of participants for transition to full scheme.
The transition bilateral estimates across the States and Territories is approximately 377,000 at 30 June 2019, compared with 287,000 actionable records received by the NDIA. An actionable record relates to a person who could be contacted, who met the access requirements and whose records were provided to the NDIA. The difference of 90,000 between bilateral estimates and actionable records includes duplicates, deceased individuals, or information that did not allow the NDIA to identify or contact individuals18.
In 2017-18, $7.7 billion was committed in plan supports, with $5.3 billion paid. This represents a utilisation rate of 69% and reflects the increased proportion of first plans approved in the year (see page 38).
As participants grow in confidence their use of NDIS plan funding increases. Experience shows that participants on average use 48 per cent of their funding in their first plan, which increases to 72 per cent by their fourth plan. This is to be expected in such a large-scale shift from block funding to a system centered on participant choice and control. The difference between committed and paid supports will narrow as the Scheme matures and participants utilise more of their plan supports.
Figure 27: Committed supports ($m) and payments19
2013–14 2014–15 2015–16 2016–17 2017–18 2018–19 Q1–Q3 Total
Total Committed 132.8 496.9 939.4 3,236.1 7,719.6 10,101.3 22,626.1
Total Paid 85.8 370.9 704.0 2,179.1 5,345.4 6,195.4 14,880.5
% utilised to date 65% 75% 75% 67% 69% 66%15
18 Approximately 9,000 additional records were received between 31 December 2018 and 31 January 2019. The number of actionable records reported in Senate Estimates by the NDIA CEO Mr Rob De Luca was 278,000.
19 Only committed supports expected to be used by 31 March 2019 have been used to calculate the utilisation from 1 July 2013 to date, and this will increase as there is a lag between when support is provided and when it is paid.
Part Five: Financial sustainability
50March 2019 | COAG Disability Reform Council Quarterly Report

5.2 Addressing Scheme pressuresPressures on the NDIS have been identified and are being responsibly managed.
The primary drivers of costs to the NDIS include the number of participants, the amount of support allocated to each plan, how that allocated amount will change over time, the utilisation of individual supports, and the rate at which participants exit the Scheme. It is the responsibility of the NDIA to monitor primary pressures, detect any associated risks and manage them appropriately, using the insurance-based structure as a means to evaluate emerging experience against expectations. The current primary financial pressures relate to:
1. Scheme access and on-going eligibilityThe number of children in the Scheme is higher than expected, and the number of participants transitioning out of the Scheme who have entered under the early intervention criteria is lower than expected.
2. Participant costsPlan budgets continue to grow by more than expected solely due to inflation and ageing. This is particularly the case for participants in SIL and SDA, where costs are higher than expected.
Specific management responses are being developed to address the two primary sustainability pressures:
Participant Pathway ReviewThe NDIA is working on strengthening the ‘outcomes focus’ of the Participant Pathway Review to improve participant satisfaction and enable individuals to reach their goals, while also increasing the consistency and reliability of access and plan budget decisions.
This includes the Independent Assessment Pilot which was launched in November 2018.
Reference package and guided planning process To better align a participant’s support package with their level of function, the NDIA introduced the reference package and guided planning process, which works to ensure that the right assessment questions and tools are being used to inform plan decisions. A review has commenced to incorporate new learnings since the reference package and guided planning process was first implemented.
Supported Independent Living (SIL) and Specialist Disability Accommodation (SDA) The NDIA is working on consistent and equitable decisions for those seeking access to SIL and SDA, which constitutes a large proportion of NDIS cost.
The NDIA continues to monitor and address emerging pressures and implement strategies to combat risk. Improving data quality, tools and reporting supports the management team to make quick and efficient decisions. Consequently, the Scheme continues to remain financially sustainable and invested in the experience and outcomes of its participants.
Part Five: Financial sustainability
51March 2019 | COAG Disability Reform Council Quarterly Report

Shelly Lynde shed tears of happiness when she arrived at her son Alex’s school and was told by his support worker that a little boy in his class had asked to play with him. By the end of lunchtime, a little girl had joined the two boys and the seeds of friendship were firmly sown.
“Socialisation is a bit of a challenge for Alex,” Shelly said.
“But I’ve always found that the other children at kindy and at school are beautiful towards him. The kids don’t judge, they just think ‘that’s just Alex and he has a support worker but who cares’”.

Part Six: Staff, advisory groups and the NDIS community A strong and dedicated NDIS community delivers the best possible experience for participants.
6.1 Official opening of the new NDIA National Office in Geelong The new NDIA National Office was officially opened on 8 March 2019, with staff moving in from early April.
The state-of-the-art accessible building, located at the site of the heritage listed Carlton Hotel in Malop Street, Geelong, will house approximately 600 NDIA staff, centralising the NDIA’s national operations.
The new NDIA office exceeds building accessibility standards, with wider access to accommodate wheelchairs and scooters, self-opening and closing doors to cater for staff with varying abilities, and integrated braille signage throughout. Meeting rooms are equipped with hearing loops, the kitchens have accessible sinks and there is the ability to adjust lighting levels to meet staff needs, including for people who experience light sensitivity.
Almost 12 per cent of NDIA employees identify as having a disability, so this new office will ensure the NDIS’s workforce has the accessible facilities, technologies and work environment needed to continue the important work underway to deliver the NDIS to Australians with disability.
Part Six: Staff, advisory groups and the NDIS community
53March 2019 | COAG Disability Reform Council Quarterly Report

6.2 Collaborating with NDIS stakeholdersThe NDIS is improving participant experience with the support of the disability community.
The NDIA is working inclusively with stakeholder groups and the disability community to reflect participant needs. Specific sector engagement activities that occurred during the quarter are outlined below.
Participant Employment TaskforceIn November 2018 the Department of Social Services and the National Disability Insurance Agency formed a participant employment taskforce, to recommend measures to improve employment outcomes for NDIS participants (see page 41).
Since January 2019 the Taskforce has been engaging with a range of stakeholders who are active in the delivery of NDIS employment supports or invested in improving participant employment outcomes. These have included:
• Participants, Parents, Carers and Advocates
• Providers, including Australian Disability Enterprises (ADEs)
• NDIA Planners and Local Area Coordinators (LACs)
• Government, Education and Peak Bodies
Consultations have occurred in Geelong, Canberra, Sydney and Hobart. Further consultations will be undertaken with service delivery staff, rural and remote communities, Aboriginal and Torres Strait Islander people, and employers.
The insights from the stakeholder consultations will inform recommendations for the Taskforce and development of an NDIA Participant Employment strategy. This strategy will guide the NDIA over the next 3-5 years to become a leader and advocate of disability employment, and to improve employment outcomes for participants and people with disability more broadly.
Independent Assessment PilotThe Independent Assessment Pilot aims to improve consistency, accuracy and reliability in decision-making, delivering fair plan outcomes and access decisions for all participants (see page xx).
The NDIA has engaged with external stakeholders, including members of peak organisations for Autism Spectrum Disorder, Intellectual Disability and Psychosocial Disability, since the pilot was launched in November 2018. The NDIA continues to engage extensively with partner organisations, participants and participant representatives in evaluating the pilot’s success.
Autism Advisory GroupThe NDIA and Autism Advisory Group continue to work together to improve life outcomes for people with autism spectrum disorder. The current joint focus is on reducing the waiting time for children in the ECEI program who are waiting to receive supports.
Blind Citizens AustraliaIn January 2019 the NDIA launched a new NDIS website, to be more accessible, easier to navigate, user-friendly, and to improve the experience of people accessing it. Consultation with participants, families, carers, providers and sector representatives was vital in its development and testing. This included members of Blind Citizens Australia, who assisted the NDIA to better meet the needs of blind and vision-impaired people.
Part Six: Staff, advisory groups and the NDIS community
54March 2019 | COAG Disability Reform Council Quarterly Report

Specialist Disability Accommodation (SDA) Reference GroupA Specialist Disability Accommodation (SDA) Reference Group was formed in March 2019, with the aim to support the development of the SDA market, increase choice and control for participants, and ensure the long term viability of SDA investment.
Membership includes key Department of Social Services, NDIS Quality and Safeguards Commission and NDIA staff, participants, SDA providers, investors and financiers, developers, and research and policy organisations.
Deaf Australia and Deafness Forum Australia The NDIA has commenced working with peak organisations Deaf Australia and Deafness Forum Australia to provide input on how the NDIA can improve the experience of participants with a hearing loss, and on issues impacting the provider market.
6.3 NDIS Contact CentreCustomer experience improves for first point of contact with the NDIS.
The provider responsible for operating the NDIS Contact Centre since June 2018 has made consistent improvements to call response times, wait times and abandoned call rates for enquires made to the NDIS.
Between June 2018 and the end of March 2019 the Contact Centre answered over 890,000 phone calls and responded to over 65,000 emails.
The average answer speed is consistently at 28 seconds.
The Contact Centre is contracted to reach a weekly service level of 80% of calls answered within 60 seconds. At end of the March 2019 quarter it was achieving a service level of just over 83%.
Average abandonment rates are 1.25%, an improvement from 1.5% at the end of December 2018
The rate of email enquiries being resolved within the first response to the sender has risen from 80% in December 2018 to 83% in March 2019. The last reported resolution rate prior to commencement of the new contact centre provider was 70%.
The Contact Centre is striving to improve its customer service levels, to provide an improved experience for participants and providers, and increased public engagement with the Scheme.
Part Six: Staff, advisory groups and the NDIS community
55March 2019 | COAG Disability Reform Council Quarterly Report

6.4 Building a high performing NDIAThe NDIA invests in staff training to support Agency growth.
In line with the accelerated roll-out of the Scheme, the NDIA has significantly increased the number of staff directly supporting the development of plans for participants. In the second half of 2018, the number of Planners increased by 422 to 1,764. The total workforce (including partners in the community) increased by 2,210 in the sample period (from 7,563 to 9,773). In addition, planners with deep experience were re-allocated to support the roll-out of the Complex Pathway.
At 31 March 2019 the NDIS workforce was 10,664, including 3,327 Australian Public Service Employees and 5,283 people employed by NDIS Partners in the Community.
Since July 2018, approximately 2,000 new planners and Local Area Coordinators (LACs) have participated in a new 6 week induction program. The program includes face-to-face, eLearning and on-the-job training that covers the key knowledge and skills required for service delivery staff.
Over 6,500 hours of training has been delivered to service delivery staff to support the pathways reform implementation. Training has now been fully rolled out in Western Australia, Tasmania, Northern Territory, New South Wales and Australian Capital Territory, and will be completed by the end of May 2019 in the remaining locations.
Other areas of focus for skill development in 2019 has included disability awareness, cultural awareness of Aboriginal and Torres Strait Islander peoples, LGBTIQA+, and Culturally and Linguistically Diverse people. In addition, Family and Gender Based Violence Prevention eLearning was deployed as part of White Ribbon Accreditation, with over 80 per cent of NDIA managers completing the training within four weeks of release.
Part Six: Staff, advisory groups and the NDIS community
56March 2019 | COAG Disability Reform Council Quarterly Report

After struggling with fatigue but needing regular exercise to maintain her health, Sue was able to get funding for an exercise physiologist twice a week to tailor her workouts to suit her capabilities.
“The NDIS has been fabulous because exercising had been difficult. A lot of people don’t understand MS and therefore going to gyms was really hard.
“We went on holidays to Adelaide at the end of last year and I rode a bike for the first time, because in the past I had no balance at all.
“It’s been life-changing because my whole mental attitude has changed and I feel like I have hope and that I’m going to be strong in the future.”

March 2019 | COAG Disability Reform Council Quarterly Report 58
Appendix A: Appendix A:
Key definitions
Aboriginal and/or Torres Strait Islander: Response of: Aboriginal but not Torres Strait Islander; or Australian Aboriginal; or Torres Strait Islander. Access request: A formal request by an individual for a determination of eligibility to access the Scheme. Access requirements: The criteria someone must meet to become a participant in the NDIS. The access requirements are: age (under 65 years); residency (live in Australia and be an Australian citizen or have paperwork to live here permanently); disability: a disability which is permanent and significant, or early intervention (support is required early to help reduce the future needs for supports). Active participant: Those who have been determined eligible and have not exited the Scheme. Administrative Appeals Tribunal (AAT): An independent body that conducts reviews of administrative decisions made under Commonwealth laws. Assistive Technology (AT): The full range of technological solutions that allow people with disability to be more independent and more connected. The primary purpose of AT is to maintain or improve an individual’s functioning and independence to make participation possible (at home, school, workplace and/or community) and to enhance overall well-being. Bilateral Agreement: An agreement between the Commonwealth and a State or Territory that formalises the commitments of each party during the Scheme rollout. Bilateral estimates: Estimates for the number of people expected to enter the NDIS by quarter in each State and Territory over the next three years. These figures are estimates only.
Carer: Someone who provides personal care, support and assistance to a person with a disability and who is not contracted as a paid or voluntary worker. Culturally and Linguistically Diverse (CALD): Country of birth is not Australia, New Zealand, the United Kingdom, Ireland, the United States of America, Canada or South Africa, or primary language spoken at home is not English. Committed support: The cost of supports contained within a participant’s plan, approved to be provided to support a participant’s needs. In some sections of this report, this amount is annualised to allow for comparison of plans of different lengths. Early Childhood Early Intervention (ECEI): An approach which supports children aged 0-6 who have developmental delay or disability and their families/carers. Depending on individual circumstances a child may move through the ECEI program to become an NDIS participant on either an s.24 Permanent Disability (PD) or s.25 Early Intervention (EI) participant. Information, linkages and capacity building (ILC): The activities that will be supported by the NDIS to promote the social and economic inlusion of all people with disability. In-kind: Existing Commonwealth or State/ Territory government programs delivered under existing block grant funding arrangements. Mainstream services: The government systems providing services to the Australian public e.g. health, mental health, education, justice, housing, child protection and employment services.

March 2019 | COAG Disability Reform Council Quarterly Report 59
Market: Under the NDIS, the market is the place where participants and providers interact to trade for disability supports. National Disability Insurance Agency (NDIA): The Commonwealth government organisation administering the NDIS. In this report the NDIA is also referred to as ‘the Agency’. National Disability Insurance Scheme (NDIS): A new way of providing support for Australians with disability, their families and carers. In this report the NDIS is also referred to as ‘the Scheme.’ Outcomes framework questionnaires: One way in which the Agency is measuring success for people with disability across eight different life domains. Payment: Made to providers, participants or their nominees for supports received as part of a participant’s plan. Participant: An individual whose access request has been determined ‘eligible’. A participant can be made eligible under the permanent disability criteria of the NDIS Act (s.24) or the early intervention criteria of the NDIS Act (s.25). If a participant is in a “defined” program, they automatically meet the access criteria because that program is deemed to be eligible in line with the access criteria in the NDIS Act. Participant Provider Pathway: The process by which participants, their families, carers and providers interact with the NDIS. Plan: A written agreement worked out with each participant, stating their goals and needs and the reasonable and necessary supports the NDIS will fund for them. Pricing: Guidance on the price to be paid for each support item. For some items, such as personal care and community access, the amount indicates the maximum price the Agency will pay for that support. Revenue: The amount received from both States/Territories and the Commonwealth governments for participant supports as outlined in the bilateral agreement. This includes both cash and in-kind amounts.
Registered provider: An approved person or provider of supports that has met NDIS registration requirements. Specialist Disability Accommodation (SDA): Specialist Disability Accommodation (SDA) refers to accommodation for people who require specialist housing solutions, including to assist with the delivery of supports that cater for their extreme functional impairment or very high support needs. SDA does not refer to the support services, but the homes in which these are delivered. SDA may include specialist designs for people with very high needs or may have a location or features that make it feasible to provide complex or costly supports for independent living. Supported Independent Living (SIL): Supported Independent Living (SIL) is help with and/or supervision of daily tasks to develop the skills of an individual to live as independently as possible. Assistance provided to a participant will be included as part of their plan depending on the level of support they require to live independently in the housing option of their choice. Quality and safeguards: Quality is about ensuring people receive good supports and safeguarding is about keeping people safe from harm. Features of quality and safeguarding systems generally include systems for handling complaints, staff screening processes and service provider standards checks.

March 2019 | COAG Disability Reform Council Quarterly Report 60
Appendix B: Appendix B:
Scheme roll-out: Timing and locations
Figure B.1 outlines the timeline and roll-out of the NDIS, including the progress that has been made
to date and where the Scheme is being implemented next.
Figure B.1 NDIS roll-out schedule

March 2019 | COAG Disability Reform Council Quarterly Report 61

March 2019 | COAG Disability Reform Council Quarterly Report 62
Appendix C: Appendix C:
Operational progress
The following tables compare plan approvals (including ECEI) against operational targets and
bilateral estimates.
The comparisons are made on different bases:
- Table C.1 compares plan approvals in 2018-19 against operational targets.
- Table C.2 compares plan approvals in 2018-19 against bilateral estimates, split by Existing and
New or Commonwealth participants.
- Table C.3 compares total plan approvals to date (since 1 July 2013) against bilateral estimates,
split by trial and transition.
Operational targets are lower than bilateral estimates to reflect a shortfall in the number of
State/Territory participants that are able to enter the Scheme. There are multiple reasons for the
shortfall, including difficulties in contacting potential participants; some individuals not wanting to
enter the Scheme; insufficient records; and some individuals being ineligible or no longer requiring
support.
The 2018-19 bilateral agreements have estimates split by State/Territory transitioning participants
and those who are new or from Commonwealth programs, with the exception of ACT where the
NDIS was fully available from 1 July 2016 and there is no ongoing schedule of participant intake
estimates. For New South Wales and South Australia, the existing component of the transition
bilateral agreements has been completed. The relative mix of State/Territory and
New/Commonwealth participants estimated in the bilateral agreements differs by jurisdiction.

March 2019 | COAG Disability Reform Council Quarterly Report 63
Table C.1 Plan approvals operational progress in 2018-191,2
State/Territory 2018-19 Actionable
data available (operational target)
2018-19 Plans approved (incl.
ECEI), relating to actionable data
% of 2018-19 operational target
met
NSW 12,013 12,592 105%
VIC 29,929 29,776 99%
QLD 26,408 28,897 109%
WA 4,326 3,105 72%
SA 8,621 8,757 102%
TAS 1,768 2,048 116%
ACT
NT 1,801 1,446 80%
Total 84,865 86,621 102%
Table C.2 Plan approvals in 2018-19 (including confirmed ECEI referrals) compared to estimates3,4,5
2018-19 plans approved (incl.
ECEI) 2018-19 bilateral estimates
Comparison for 2018-19 plan approvals (incl. ECEI) with 2018-19 bilateral estimates
State/Territory Existing New/CW Total Existing New/CW Total Existing New/CW Total
NSW 1,222 11,370 12,592 19,803 19,803 57%
VIC 19,477 10,299 29,776 26,706 10,763 37,468 73% 96% 79%
QLD 17,654 11,243 28,897 25,313 21,499 46,812 70% 52% 62%
WA 1,988 1,117 3,105 3,020 2,014 5,034 66% 55% 62%
SA 4,704 4,053 8,757 4,745 4,745 85%
TAS 671 1,377 2,048 1,449 2,606 4,054 46% 53% 51%
ACT 11 812 823
NT 999 447 1,446 1,781 756 2,537 56% 59% 57%
Total* 40,789 39,906 80,695 58,269 62,185 120,454 70% 64% 67%
Total 46,726 40,718 87,444
*Total excluding jurisdictions with nil bilateral estimates in 2018-19.
Table C.3 Plan approvals to date (including confirmed ECEI referrals) compared to estimates6
All plans approved (incl. ECEI) Total bilateral estimates Comparison for all plan
approvals (incl. ECEI) with bilateral estimates
State/Territory Trial Transition Total Trial Transition Total Trial Transition Total
NSW 9,609 92,354 101,963 12,111 123,245 135,356 79% 75% 75%
VIC 5,282 66,488 71,770 5,289 82,876 88,165 100% 80% 81%
QLD 361 45,675 46,036 600 77,367 77,967 60% 59% 59%
WA 2,494 4,933 7,427 2,493 8,107 10,600 100% 61% 70%
SA 7,117 20,370 27,487 8,500 22,202 30,702 84% 92% 90%
TAS 1,162 5,152 6,314 1,125 7,804 8,929 103% 66% 71%
ACT 4,098 3,563 7,661 4,278 797 5,075 96% 447% 151%
NT 155 2,136 2,291 149 4,011 4,160 104% 53% 55%
Total 30,278 240,671 270,949 34,545 326,409 360,954 88% 74% 75%
1 Excludes ACT participants approved in 2018-19. Existing participants in NSW and SA are still subject to an operational target in 2018-19. 2 WA bilateral estimates and operational targets include NDIA trial sites only. Total plans approved exclude 6,011 WA participants who had transferred from the WA NDIS to the nationally delivered NDIS this year. 3 Ibid. 4 The total excluding jurisdictions with nil bilateral estimates in 2018-19 is not equal to the total in Table C.1 because it excludes Existing participants in NSW and SA approved in 2018-19. 5 Note: ‘CW’ stands for Commonwealth. 6 WA bilateral estimates include NDIA trial sites only. Total plans approved exclude 6,206 WA participants who had transferred from the WA NDIS to the nationally delivered NDIS.

March 2019 | COAG Disability Reform Council Quarterly Report 64
Appendix D: Appendix D:
Outcomes framework questionnaires
About the outcomes framework questionnaires
The NDIS outcomes framework questionnaires measure the medium and long-term benefits of the
Scheme on participants. These questionnaires are one way the NDIA is measuring scheme
outcomes. These questionnaires include baseline measures for assessing future outcomes.
Baseline meausres were collected from 99% of participants who received their initial plan since 1
July 2016.
The information collected from participants and their families and carers tracks how participants are
progressing across eight life domains:
Choice and Control: Includes independence, decision-making and whether the participant
would like to have more choice and control in their life.
Relationships: Relates to whether a participant has someone to call on for practical advice
or emotional support, about contact with family and friends and about relationships with
staff.
Health and Wellbeing: Relates to health, lifestyle and access to health services.
Work: Explores participants’ experiences in the workforce and goals for employment.
Daily Living Activities: Explores how independent participants are in nine areas of daily
living, for example shopping and home cleaning.
Home: Relates to participants’ satisfaction in their home now and in five years’ time, and
whether they feel safe.
Lifelong Learning: Includes educational, training and learning experiences.
Social, Community and Civic Participation: Relates to hobbies, volunteering,
involvement in community, voting, leisure activities and whether the participant feels they
have a voice.
The outcomes framework questionnaires adopt a lifespan approach to measuring outcomes,
recognising that different outcomes will be important to participants at different stages of their life.
The information is collected as participants enter the Scheme, and as their plans are reviewed, so
that the Agency can track the type of supports that lead to the best outcomes.

March 2019 | COAG Disability Reform Council Quarterly Report 65
Appendix E: Appendix E:
National
Part One: Participants and their plans
Table E.1 Plan approvals compared to estimates – NATIONAL7
Prior
Quarters 2018-19 Q3
Total excluding
ECEI
Total including
ECEI
Bilateral estimates
NATIONAL 233,165 32,486 265,651 277,155 360,954
Table E.2 Quarterly intake split by plan and entry type since 1 July 2013 – NATIONAL8
Prior Quarters 2018-19 Q3 Total
Access decisions 327,574 25,586 353,160
Access Met9 280,259 19,214 299,473
State 166,485 7,067 173,552
Commonwealth 26,803 2,218 29,021
New 86,971 9,929 96,900
Total Participant Plans 244,654 43,990 277,155
State 136,817 17,603 154,420
Commonwealth 22,663 3,079 25,742
New 73,685 11,804 85,489
ECEI10 11,489 11,504 11,504
Total Participant Plans 244,654 43,990 277,155
Early Intervention (s25) 43,498 5,298 48,796
Permanent Disability (s24) 189,667 27,188 216,855
ECEI11 11,489 11,504 11,504
Table E.3 Exits from the Scheme since 1 July 2013 as at 31 March 2019 – NATIONAL
Exits
Total participant exits 6,580
Early Intervention participants 1,993
Permanent disability participants 4,587
7 In this table the 265,651 participants include the 6,206 WA participants who had transferred from the WA NDIS to the nationally delivered NDIS. However, as the WA bilateral estimates include NDIA trial sites only, the calculation of the percentage of estimate excludes these WA transfer participants in subsequent tables where the percentage of estimate is shown. 8 The Joint Standing Committee on the NDIS, in its final report on Hearing Services, recommended that the NDIA better understand the eligibility rate for people with a hearing impairment. Of the number of access decisions in 2018-19 Q3, 86% of people with a hearing impairment met the access criteria compared to 75% overall. 9 The number of people who have had their access met is higher than the number of approved plans. This is because a large number of these people are due to phase in during future quarters. 10 The number of children supported in the ECEI gateway cannot be summed across quarters as they can transition to NDIS plans, hence the ECEI figure shown is cumulative. 11 Ibid.
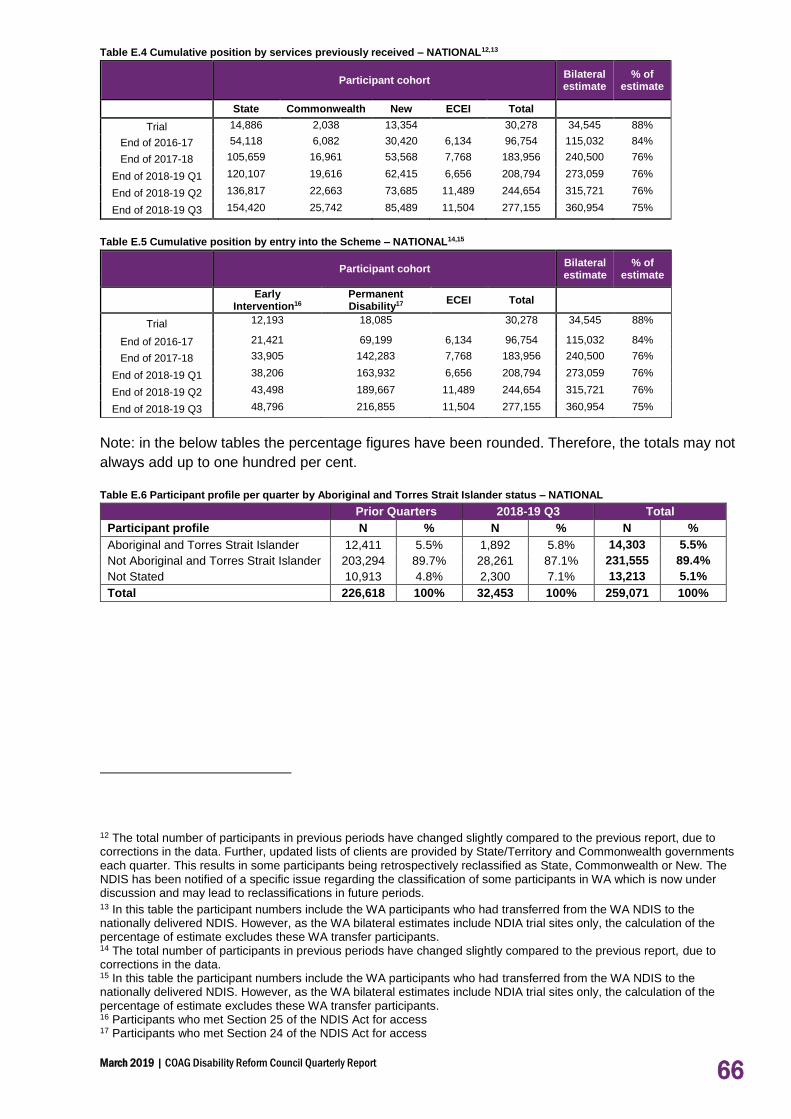
March 2019 | COAG Disability Reform Council Quarterly Report 66
Table E.4 Cumulative position by services previously received – NATIONAL12,13
Participant cohort Bilateral estimate
% of estimate
State Commonwealth New ECEI Total
Trial 14,886 2,038 13,354
30,278 34,545 88%
End of 2016-17 54,118 6,082 30,420 6,134 96,754 115,032 84%
End of 2017-18 105,659 16,961 53,568 7,768 183,956 240,500 76%
End of 2018-19 Q1 120,107 19,616 62,415 6,656 208,794 273,059 76%
End of 2018-19 Q2 136,817 22,663 73,685 11,489 244,654 315,721 76%
End of 2018-19 Q3 154,420 25,742 85,489 11,504 277,155 360,954 75%
Table E.5 Cumulative position by entry into the Scheme – NATIONAL14,15
Participant cohort Bilateral estimate
% of estimate
Early
Intervention16 Permanent Disability17
ECEI Total
Trial 12,193 18,085
30,278 34,545 88%
End of 2016-17 21,421 69,199 6,134 96,754 115,032 84%
End of 2017-18 33,905 142,283 7,768 183,956 240,500 76%
End of 2018-19 Q1 38,206 163,932 6,656 208,794 273,059 76%
End of 2018-19 Q2 43,498 189,667 11,489 244,654 315,721 76%
End of 2018-19 Q3 48,796 216,855 11,504 277,155 360,954 75%
Note: in the below tables the percentage figures have been rounded. Therefore, the totals may not
always add up to one hundred per cent.
Table E.6 Participant profile per quarter by Aboriginal and Torres Strait Islander status – NATIONAL
Prior Quarters 2018-19 Q3 Total
Participant profile N % N % N %
Aboriginal and Torres Strait Islander 12,411 5.5% 1,892 5.8% 14,303 5.5%
Not Aboriginal and Torres Strait Islander 203,294 89.7% 28,261 87.1% 231,555 89.4%
Not Stated 10,913 4.8% 2,300 7.1% 13,213 5.1%
Total 226,618 100% 32,453 100% 259,071 100%
12 The total number of participants in previous periods have changed slightly compared to the previous report, due to corrections in the data. Further, updated lists of clients are provided by State/Territory and Commonwealth governments each quarter. This results in some participants being retrospectively reclassified as State, Commonwealth or New. The NDIS has been notified of a specific issue regarding the classification of some participants in WA which is now under discussion and may lead to reclassifications in future periods. 13 In this table the participant numbers include the WA participants who had transferred from the WA NDIS to the nationally delivered NDIS. However, as the WA bilateral estimates include NDIA trial sites only, the calculation of the percentage of estimate excludes these WA transfer participants. 14 The total number of participants in previous periods have changed slightly compared to the previous report, due to corrections in the data. 15 In this table the participant numbers include the WA participants who had transferred from the WA NDIS to the nationally delivered NDIS. However, as the WA bilateral estimates include NDIA trial sites only, the calculation of the percentage of estimate excludes these WA transfer participants. 16 Participants who met Section 25 of the NDIS Act for access 17 Participants who met Section 24 of the NDIS Act for access

March 2019 | COAG Disability Reform Council Quarterly Report 67
Figure E.1 Number and proportion of Aboriginal and Torres Strait Islander participants over time incrementally (left) and
cumulatively (right) – NATIONAL 18
Table E.7 Participant profile per quarter by culturally and linguistically diverse (CALD) status – NATIONAL
Prior Quarters 2018-19 Q3 Total
Participant profile N % N % N %
CALD 18,190 8.0% 3,011 9.3% 21,201 8.2%
Not CALD 204,238 90.1% 27,561 84.9% 231,799 89.5%
Not Stated 4,190 1.8% 1,881 5.8% 6,071 2.3%
Total 226,618 100% 32,453 100% 259,071 100%
Figure E.2 Number and proportion of culturally and linguistically diverse participants over time incrementally (left) and
cumulatively (right) – NATIONAL19
Table E.8 Participant profile per quarter by Young people in Residential aged care (YPIRAC) status – NATIONAL20
Prior Quarters 2018-19 Q3 Total
Participant profile N % N % N %
YPIRAC 3,654 1.6% 439 1.4% 4,093 1.6%
Not YPIRAC 222,964 98.4% 32,014 98.6% 254,978 98.4%
Total 226,618 100% 32,453 100% 259,071 100%
18 The methodology for the cumulative chart has changed compared to the previous report. The chart now shows active
participants as at each quarter over time rather than active participants as at the current quarter. The incremental numbers represent the number of new participants that have entered in each quarter. Data is not available prior to March 2017. 19 Ibid. 20 Young People in Residential Aged Care (YPIRAC) refers to all people who enter an aged care facility prior to age 65. In the NDIS, at the end of the quarter, 157 participants (3.8%) were under 45 years, 2,477 (60.5%) were between 55 and 64 years and 773 (18.9%) were 65 years or over.
4,0914,878
5,9466,974
7,9729,500
10,736
12,461
14,303
5.4% 5.4% 5.3% 5.3% 5.4% 5.5% 5.4% 5.5% 5.5%
0.0%
1.5%
3.0%
4.5%
6.0%
7.5%
0
4,000
8,000
12,000
16,000
20,000
24,000
Mar-17 Jun-17 Sep-17 Dec-17 Mar-18 Jun-18 Sep-18 Dec-18 Mar-19
Aboriginal and Torres Strait Islander
Proportion of plan approvals (Cumulative)
717 787
1,1451,058 1,031
1,559
1,281
1,7851,892
5.0%5.2% 5.2% 5.3% 5.4%
6.4%
4.9%
5.8% 5.8%
0.0%
1.5%
3.0%
4.5%
6.0%
7.5%
0
500
1,000
1,500
2,000
2,500
3,000
Mar-17 Jun-17 Sep-17 Dec-17 Mar-18 Jun-18 Sep-18 Dec-18 Mar-19
Aboriginal and Torres Strait Islander
Proportion of plan approvals (Incremental)
5,4216,735
8,1999,422
10,801
12,984
15,254
18,246
21,2017.2% 7.4% 7.4% 7.2% 7.3%7.5% 7.7%
8.0% 8.2%
0.0%
2.0%
4.0%
6.0%
8.0%
10.0%
0
5,000
10,000
15,000
20,000
25,000
30,000
Mar-17 Jun-17 Sep-17 Dec-17 Mar-18 Jun-18 Sep-18 Dec-18 Mar-19
Culturally and linguistically diverse
Proportion of plan approvals (Cumulative)
1,274 1,3141,582
1,2821,431
2,250 2,330
3,056 3,011
8.9% 8.7%
7.1%
6.4%
7.4%
9.3%9.0%
9.9% 9.3%
0.0%
2.0%
4.0%
6.0%
8.0%
10.0%
0
500
1,000
1,500
2,000
2,500
3,000
3,500
4,000
Mar-17 Jun-17 Sep-17 Dec-17 Mar-18 Jun-18 Sep-18 Dec-18 Mar-19
Culturally and linguistically diverse
Proportion of plan approvals (Incremental)

March 2019 | COAG Disability Reform Council Quarterly Report 68
Figure E.3 Number and proportion of YPIRAC participants over time incrementally (left) and cumulatively (right) – NATIONAL21
Table E.9 Participant profile per quarter by remoteness – NATIONAL22,23
Prior Quarters 2018-19 Q3 Total
Participant profile N % N % N %
Major Cities 149,085 65.9% 23,427 72.3% 172,512 66.7%
Population > 50,000 25,893 11.5% 3,048 9.4% 28,941 11.2%
Population between 15,000 and 50,000 20,800 9.2% 2,264 7.0% 23,064 8.9%
Population between 5,000 and 15,000 11,462 5.1% 1,139 3.5% 12,601 4.9%
Population less than 5,000 16,257 7.2% 2,029 6.3% 18,286 7.1%
Remote 1,579 0.7% 371 1.1% 1,950 0.8%
Very Remote 1,061 0.5% 137 0.4% 1,198 0.5%
Missing 481 38 519
Total 226,618 100% 32,453 100% 259,071 100%
Figure E.4 Number and proportion of remote/very remote participants over time incrementally (left) and cumulatively (right) –
NATIONAL24
21 The methodology for the cumulative chart has changed compared to the previous report. The chart now shows active
participants as at each quarter over time rather than active participants as at the current quarter. The incremental numbers represent the number of new participants that have entered in each quarter. Data is not available prior to March 2017. 22 This table is based on the Modified Monash Model measure of remoteness. 23 The distributions are calculated excluding active participants with a missing remoteness classification. 24 The methodology for the cumulative chart has changed compared to the previous report. The chart now shows active
participants as at each quarter over time rather than active participants as at the current quarter. The incremental numbers represent the number of new participants that have entered in each quarter. Data is not available prior to March 2017.
8811,098
1,364
2,194
2,615
3,0383,345
3,7544,093
1.2% 1.2% 1.2%
1.7%1.8% 1.8%
1.7% 1.7%1.6%
0.0%
0.5%
1.0%
1.5%
2.0%
0
1,000
2,000
3,000
4,000
5,000
6,000
Mar-17 Jun-17 Sep-17 Dec-17 Mar-18 Jun-18 Sep-18 Dec-18 Mar-19
YPIRAC Proportion of plan approvals (Cumulative)
222 218
320
859
475 486
375
501
439
1.5% 1.4% 1.4%
4.3%
2.5%2.0%
1.4% 1.6%1.4%
0.0%
1.0%
2.0%
3.0%
4.0%
5.0%
6.0%
7.0%
8.0%
0
100
200
300
400
500
600
700
800
900
1,000
Mar-17 Jun-17 Sep-17 Dec-17 Mar-18 Jun-18 Sep-18 Dec-18 Mar-19
YPIRAC Proportion of plan approvals (Incremental)
802965
1,1951,401
1,582
1,9142,189
2,649
3,1481.1% 1.1% 1.1% 1.1%
1.1%
1.1%
1.1%
1.2%1.2%
0.0%
0.2%
0.4%
0.6%
0.8%
1.0%
1.2%
1.4%
0
500
1,000
1,500
2,000
2,500
3,000
3,500
4,000
4,500
Mar-17 Jun-17 Sep-17 Dec-17 Mar-18 Jun-18 Sep-18 Dec-18 Mar-19
Remote/Very Remote
Proportion of plan approvals (Cumulative)
189 163
249217 193
348292
476508
1.3%
1.1%1.1% 1.1%
1.0%
1.4%
1.1%
1.5% 1.6%
0.0%
0.4%
0.8%
1.2%
1.6%
0
250
500
750
1,000
Mar-17 Jun-17 Sep-17 Dec-17 Mar-18 Jun-18 Sep-18 Dec-18 Mar-19
Remote/Very Remote
Proportion of plan approvals (Incremental)

March 2019 | COAG Disability Reform Council Quarterly Report 69
Table E.10 Participant profile per quarter by disability group - NATIONAL25
Prior Quarters 2018-19 Q3 Total
Disability N % N % N %
Autism 66,944 30% 9,480 29% 76,424 29%
Intellectual Disability26 61,231 27% 7,103 22% 68,334 26%
Psychosocial disability 18,713 8% 3,033 9% 21,746 8%
Cerebral Palsy 11,211 5% 1,263 4% 12,474 5%
Other Neurological 10,696 5% 1,728 5% 12,424 5%
Developmental Delay 9,649 4% 2,000 6% 11,649 4%
Other Physical 9,432 4% 1,726 5% 11,158 4%
Hearing Impairment 8,004 4% 1,575 5% 9,579 4%
ABI 7,811 3% 1,265 4% 9,076 4%
Visual Impairment 5,658 2% 833 3% 6,491 3%
Multiple Sclerosis 4,912 2% 635 2% 5,547 2%
Global Developmental Delay 3,100 1% 692 2% 3,792 1%
Stroke 3,016 1% 456 1% 3,472 1%
Spinal Cord Injury 3,006 1% 444 1% 3,450 1%
Other Sensory/Speech 2,850 1% 175 1% 3,025 1%
Other 385 0% 45 0% 430 0%
Total 226,618 100% 32,453 100% 259,071 100%
Figure E.5 Participant profile by disability group over time incrementally (left) and cumulatively (right) – NATIONAL27
25 Note: Since 2017-18 Q1, the disability groups Developmental Delay and Global Developmental Delay have been reported separately to the Intellectual Disability group. 26 Down Syndrome is included in Intellectual Disability, representing 4% of all Scheme participants (9,333). 27 The methodology for the cumulative chart has changed compared to the previous report. The chart now shows active
participants as at each quarter over time rather than active participants as at the current quarter. The incremental numbers represent the number of new participants that have entered in each quarter. Data is not available prior to March 2017.
28% 28% 29% 29% 29% 29% 29% 29% 29%
28% 28% 29% 29% 29% 28% 27% 27% 26%
6% 7% 7% 7% 7% 8% 8% 8% 8%5% 5% 5% 5% 5% 5% 5% 5% 5%5% 5% 5% 5% 5% 5% 5% 5% 5%
28% 27% 26% 25% 25% 26% 26% 26% 26%
0%
10%
20%
30%
40%
50%
60%
70%
80%
90%
100%
Mar-17 Jun-17 Sep-17 Dec-17 Mar-18 Jun-18 Sep-18 Dec-18 Mar-19
Autism Intellectual Disability
Psychosocial disability Cerebral Palsy
Other Neurological Other
26% 28% 27% 27% 28% 28% 27% 28% 29%
29% 27% 32% 29% 23% 22% 25% 23% 22%
7% 8%6% 7%
10% 10% 9% 9% 9%
5% 5%6% 5% 4% 4% 4% 4% 4%
5% 5%5% 6%
5% 5% 6% 5% 5%
27% 28% 24% 26% 29% 31% 30% 29% 30%
0%
10%
20%
30%
40%
50%
60%
70%
80%
90%
100%
Mar-17 Jun-17 Sep-17 Dec-17 Mar-18 Jun-18 Sep-18 Dec-18 Mar-19
Autism Intellectual Disability
Psychosocial disability Cerebral Palsy
Other Neurological Other

March 2019 | COAG Disability Reform Council Quarterly Report 70
Table E.11 Participant profile per quarter by level of function – NATIONAL28,29
Prior Quarters 2018-19 Q3 Total
Level of Function N % N % N %
1 (High Function) 13,288 6% 1,997 6% 15,285 6%
2 (High Function) 491 0% 63 0% 554 0%
3 (High Function) 13,140 6% 1,774 5% 14,914 6%
4 (High Function) 15,721 7% 2,151 7% 17,872 7%
5 (High Function) 16,973 8% 1,920 6% 18,893 7%
6 (Moderate Function) 37,866 17% 5,899 18% 43,765 17%
7 (Moderate Function) 15,830 7% 1,582 5% 17,412 7%
8 (Moderate Function) 17,783 8% 2,398 7% 20,181 8%
9 (Moderate Function) 1,175 1% 157 0% 1,332 1%
10 (Moderate Function) 26,082 12% 3,741 12% 29,823 12%
11 (Low Function) 10,241 5% 1,037 3% 11,278 4%
12 (Low Function) 34,460 15% 4,948 15% 39,408 15%
13 (Low Function) 17,297 8% 4,186 13% 21,483 8%
14 (Low Function) 5,754 3% 593 2% 6,347 2%
15 (Low Function) 69 0% 7 0% 76 0%
Missing 448
0
448
Total 226,618 100% 32,453 100% 259,071 100%
Figure E.6 Participant profile by level of function over time incrementally (left) and cumulatively (right) – NATIONAL30
Table E.12 Participant profile per quarter by age group – NATIONAL
Prior Quarters 2018-19 Q3 Total
Age Group N % N % N %
0 to 6 26,427 12% 6,437 20% 32,864 13%
7 to 14 56,976 25% 6,967 21% 63,943 25%
15 to 18 17,917 8% 2,106 6% 20,023 8%
19 to 24 22,011 10% 2,228 7% 24,239 9%
25 to 34 22,601 10% 2,866 9% 25,467 10%
35 to 44 20,878 9% 3,081 9% 23,959 9%
45 to 54 26,037 11% 3,808 12% 29,845 12%
55 to 64 28,204 12% 4,529 14% 32,733 13%
65+ 5,567 2% 431 1% 5,998 2%
Total 226,618 100% 32,453 100% 259,071 100%
28 The distributions are calculated excluding participants with a missing level of function. 29 An ICT issue has been identified and as a result, reporting by level of function is not accurate. This issue is currently
under investigation and will be reconciled for reporting as at 30 June 2019. 30 The methodology for the cumulative chart has changed compared to the previous report. The chart now shows active
participants as at each quarter over time rather than active participants as at the current quarter. The incremental numbers represent the number of new participants that have entered in each quarter. Data is not available prior to March 2017.
39% 38% 35% 33% 31% 30% 29% 28% 26%
38% 38%40% 41% 42% 42% 43% 44% 44%
24% 23% 25% 27% 27% 27% 28% 28% 30%
Mar-17 Jun-17 Sep-17 Dec-17 Mar-18 Jun-18 Sep-18 Dec-18 Mar-19
Level of Function
High Medium Low
32% 36%28% 30% 31% 32%
27% 27% 24%
44%42%
43% 42%44% 44%
46% 46%42%
25% 22%29% 28% 25% 24% 27% 27%
33%
0%
10%
20%
30%
40%
50%
60%
70%
80%
90%
100%
Mar-17 Jun-17 Sep-17 Dec-17 Mar-18 Jun-18 Sep-18 Dec-18 Mar-19
Level of Function
High Medium Low

March 2019 | COAG Disability Reform Council Quarterly Report 71
Figure E.7 Participant profile by age group over time incrementally (left) and cumulatively (right) – NATIONAL31
Table E.13 Participant profile per quarter by gender – NATIONAL
Prior Quarters 2018-19 Q3 Total
Gender N % N % N %
Male 139,750 62% 19,941 61% 159,691 62%
Female 84,048 37% 12,109 37% 96,157 37%
Indeterminate 2,820 1% 403 1% 3,223 1%
Total 226,618 100% 32,453 100% 259,071 100%
Figure E.8 Participant profile by gender over time incrementally (left) and cumulatively (right) – NATIONAL32
31 Ibid. 32 Ibid.
14% 14% 13% 13% 13% 13% 13% 13% 13%
28% 28% 27% 26% 26% 25% 25% 25% 25%
9% 9% 9% 9% 8% 8% 8% 8% 8%
9% 9% 10% 10% 10% 10% 10% 9% 9%
9% 9% 10% 10% 10% 10% 10% 10% 10%
8% 8% 9% 9% 9% 9% 9% 9% 9%
10% 11% 11% 11% 11% 11% 11% 12% 12%
11% 11% 11% 11% 12% 12% 12% 13% 13%
2% 2% 1% 2% 2% 2% 2% 2% 2%
0%
10%
20%
30%
40%
50%
60%
70%
80%
90%
100%
Mar-17 Jun-17 Sep-17 Dec-17 Mar-18 Jun-18 Sep-18 Dec-18 Mar-19
0 to 6 7 to 14 15 to 18 19 to 24 25 to 34
35 to 44 45 to 54 55 to 64 65+
11%17%
12% 17% 21% 23%17% 17% 20%
22%
24%
21%19%
21% 20%
19% 21%21%
11%
7%
8%8%
7% 6%
6%7%
6%10%
7%
10%9%
7% 6%9% 6%
7%
10% 10%11% 10% 9% 9%
11% 9%9%
10% 9%11% 9% 9% 9% 10% 10%
9%
12% 12% 13% 12% 12% 12% 13% 13% 12%
13% 12% 13% 14% 14% 14% 14% 15% 14%
1% 1% 1% 1% 1% 1% 1% 1% 1%
0%
10%
20%
30%
40%
50%
60%
70%
80%
90%
100%
Mar-17 Jun-17 Sep-17 Dec-17 Mar-18 Jun-18 Sep-18 Dec-18 Mar-19
0 to 6 7 to 14 15 to 18 19 to 24 25 to 34
35 to 44 45 to 54 55 to 64 65+
63% 63% 63% 63% 62% 62% 62% 62% 62%
37% 37% 37% 37% 37% 37% 37% 37% 37%
0%
10%
20%
30%
40%
50%
60%
70%
80%
90%
100%
Mar-17 Jun-17 Sep-17 Dec-17 Mar-18 Jun-18 Sep-18 Dec-18 Mar-19
Male Female Indeterminate
62% 62% 63% 62% 60% 61% 60% 60% 61%
37% 37% 36% 36% 37% 37% 38% 39% 37%
0%
10%
20%
30%
40%
50%
60%
70%
80%
90%
100%
Mar-17 Jun-17 Sep-17 Dec-17 Mar-18 Jun-18 Sep-18 Dec-18 Mar-19
Male Female Indeterminate

March 2019 | COAG Disability Reform Council Quarterly Report 72
Part Two: Participant experience and outcomes
Table E.14 Number of questionnaires completed by SFOF version - NATIONAL33
Version
Number of questionnaires
collected 2016-17
Number of questionnaires
collected 2017-18
Number of questionnaires collected YTD
2018-19
Number of questionnaires
Participant 0 to school 7,659 11,894 11,366 30,919
Participant school to 14 14,217 21,632 23,964 59,813
Participant 15 to 24 9,588 12,401 12,109 34,098
Participant 25 and over 24,811 37,708 41,362 103,881
Total Participant 56,275 83,635 88,801 228,711
Family 0 to 14 20,587 32,637 33,564 86,788
Family 15 to 24 2,734 8,482 8,430 19,646
Family 25 and over 784 11,622 12,933 25,339
Total Family 24,105 52,741 54,927 131,773
Total 80,380 136,376 143,728 360,484
Table E.15 Selected key indicators for participants – Daily Living (DL) and Choice and Control (CC) – NATIONAL
Indicator 0 to before
school School to 14
15 to 24 25 and over
DL
% with concerns in 6 or more of the areas: gross motor skills, fine motor skills, self-care, eating, social interaction, communication, cognitive development, sensory processing
67%
CC % who say their child is able to tell them what he/she wants
71%
DL % developing functional, learning and coping skills appropriate to their ability and circumstances
28%
DL % who say their child is becoming more independent
41%
CC % of children who have a genuine say in decisions about themselves
65%
CC % who are happy with the level of independence/control they have now
36%
CC % who choose who supports them 34% 55%
CC % who choose what they do each day 43% 64%
CC % who had been given the opportunity to participate in a self-advocacy group meeting
21% 28%
CC % who want more choice and control in their life
81% 77%
33 Baseline outcomes for participants and/or their families and carers were collected for 99% of participants.

March 2019 | COAG Disability Reform Council Quarterly Report 73
Table E.16 Selected key indicators for participants – Relationships (REL) and Social/Community Participation (S/CP) –
NATIONAL
Indicator 0 to before
school School to
14 15 to 24
25 and over
REL % of children who can make friends with people outside the family
63% 61%
S/CP % of children who participate in age appropriate community, cultural or religious activities
53%
REL % of children who spend time after school and on weekends with friends and/or in mainstream programs
35%
REL Of these, % who are welcomed or actively included
63% 75%
REL % of children who spend time with friends without an adult present
12%
REL % with no friends other than family or paid staff
31% 28%
S/CP % who have been actively involved in a community, cultural or religious group in the last 12 months
34% 37%
Table E.17 Selected key indicators for participants – Lifelong Learning (LL), Work (WK), Home (HM) and Health and Wellbeing
(HW) – NATIONAL
Indicator 0 to before
school School to
14 15 to 24
25 and over
LL % of children attending school in a mainstream class
60%
HM % who are happy with their home 81% 74%
HM % who feel safe or very safe in their home
85% 75%
HW % who rate their health as good, very good or excellent
68% 47%
HW % who did not have any difficulties accessing health services
69% 66%
LL % who currently attend or previously attended school in a mainstream class
29%
LL % who participate in education, training or skill development
12%
LL Of those who participate, % who do so in mainstream settings
50%
LL % unable to do a course or training they wanted to do in the last 12 months
35%
WK % who have a paid job 17% 24%
WK % who volunteer 13% 12%

March 2019 | COAG Disability Reform Council Quarterly Report 74
Table E.18 Selected key indicators for families/carers of participants – NATIONAL
Indicator 0 to 14 15 to 24 25 and over
% receiving Carer Payment 23% 28% 24%
% receiving Carer Allowance 53% 52% 38%
% working in a paid job 47% 49% 35%
Of those in a paid job, % in permanent employment
76% 75% 77%
Of those in a paid job, % working 15 hours or more
78% 84% 83%
% who say they (and their partner) are able to work as much as they want
40% 46% 59%
Of those unable to work as much as they want, % who say the situation of their child/family member with disability is a barrier to working more
87% 90% 87%
Of those unable to work as much as they want, % who say insufficient flexibility of jobs is a barrier to working more
37% 29% 20%
% able to advocate for their child/family member
78% 72% 69%
% who have friends and family they see as often as they like
44% 43% 48%
% who feel very confident or somewhat confident in supporting their child's development
85%
% who know what their family can do to enable their family member with disability to become as independent as possible
42%
% who feel in control selecting services 41% 42%
% who have made plans (or begun to make plans) for when they are no longer able to care for their family member with disability
39%
% who rate their health as good, very good or excellent
72% 61% 59%
Table E.19 Results for “Has the NDIS helped?” questions answered at end of participant's first year in the Scheme, for SFOF
version ‘Participant 0 to school’ (n=4,254) – NATIONAL34
Question % Yes
DL Has the NDIS improved your child's development? 92%
DL Has the NDIS improved your child's access to specialist services? 89%
CC Has the NDIS helped increase your child's ability to communicate what they want?
83%
REL Has the NDIS improved how your child fits into family life? 73%
S/CP Has the NDIS improved how your child fits into community life? 60%
34 Results in Tables E.19 to E.22 exclude participants who had their first plan approved between 1 July 2016 and 31
March 2017, as these participants have been included in Tables E.23 to E.26.

March 2019 | COAG Disability Reform Council Quarterly Report 75
Table E.20 Results for “Has the NDIS helped?” questions answered at end of participant's first year in the Scheme, for SFOF
version ‘Participant school to 14' (n=17,766) – NATIONAL
Question % Yes
DL Has the NDIS helped your child to become more independent? 56%
LL Has the NDIS improved your child's access to education? 34%
REL Has the NDIS improved your child's relationships with family and friends?
44%
S/CP Has the NDIS improved your child's social and recreational life? 41%
Table E.21 Results for “Has the NDIS helped?” questions answered at end of participant's first year in the Scheme, for SFOF
versions ‘Participant 15 to 24' (n=9,943) and 'Participant 25 and over' (n=27,011) – NATIONAL
Question 15 to 24 % Yes
25+ % Yes
CC Has the NDIS helped you have more choices and more control over your life?
58% 66%
DL Has the NDIS helped you with daily living activities? 57% 70%
REL Has the NDIS helped you to meet more people? 48% 51%
HM Has your involvement with the NDIS helped you to choose a home that's right for you?
19% 27%
HW Has your involvement with the NDIS improved your health and wellbeing?
39% 47%
LL Has your involvement with the NDIS helped you to learn things you want to learn or to take courses you want to take?
34% 29%
WK Has your involvement with the NDIS helped you find a job that's right for you?
18% 19%
S/CP Has the NDIS helped you be more involved? 53% 57%
Table E.22 Results for “Has the NDIS helped?” questions answered at end of participant's first year in the Scheme, for SFOF
version ‘Family 0 to 14’ (n=20,517); and for SFOF versions ‘Family 15 to 24’ and ‘Family 25 and over’ combined (n=9,566) –
NATIONAL
Question 0 to 14 % Yes
15+ % Yes
Has the NDIS improved your capacity to advocate (stand up) for your child? / Has the NDIS helped you to know your rights and advocate effectively?
56% 47%
Has the NDIS improved the level of support for your family? 61% 60%
Has the NDIS improved your access to services, programs and activities in the community? / Has the NDIS helped you to access services, programs and activities in the community?
65% 57%
Has the NDIS improved your ability/capacity to help your child develop and learn?
69%
Has the NDIS improved your health and wellbeing? 37% 33%

March 2019 | COAG Disability Reform Council Quarterly Report 76
Table E.23 Results for “Has the NDIS helped?” questions answered at end of participant's first and second years in the
Scheme, for SFOF version ‘Participant 0 to school’ – NATIONAL35
Question Year 1 Year 2 Change
DL Has the NDIS improved your child's development? 91% 94% +3%
DL Has the NDIS improved your child's access to specialist services? 91% 92% +1%
CC Has the NDIS helped increase your child's ability to communicate what they want?
82% 85% +4%
REL Has the NDIS improved how your child fits into family life? 73% 75% +2%
S/CP Has the NDIS improved how your child fits into community life? 60% 62% +3%
Table E.24 Results for “Has the NDIS helped?” questions answered at end of participant's first and second years in the
Scheme, for SFOF version ‘Participant school to 14' – NATIONAL
Question Year 1 Year 2 Change
DL Has the NDIS helped your child to become more independent? 56% 65% +9%
LL Has the NDIS improved your child's access to education? 36% 38% +2%
REL Has the NDIS improved your child's relationships with family and friends?
46% 50% +5%
S/CP Has the NDIS improved your child's social and recreational life? 44% 48% +4%
Table E.25 Results for “Has the NDIS helped?” questions answered at end of participant's first and second years in the
Scheme, for SFOF versions ‘Participant 15 to 24' and 'Participant 25 and over' – NATIONAL
15 to 24 25 and over
Question Year 1 Year 2 Change Year 1 Year 2 Change
CC Has the NDIS helped you have more choices and more control over your life?
61% 65% +4% 68% 75% +7%
DL Has the NDIS helped you with daily living activities?
59% 66% +7% 72% 80% +8%
REL Has the NDIS helped you to meet more people?
53% 55% +2% 53% 59% +7%
HM Has your involvement with the NDIS helped you to choose a home that's right for you?
24% 20% -4% 30% 30% 0%
HW Has your involvement with the NDIS improved your health and wellbeing?
43% 45% +2% 51% 57% +6%
LL Has your involvement with the NDIS helped you to learn things you want to learn or to take courses you want to take?
41% 39% -2% 32% 33% +1%
WK Has your involvement with the NDIS helped you find a job that's right for you?
19% 17% -2% 20% 19% -1%
S/CP Has the NDIS helped you be more involved? 56% 59% +4% 60% 67% +7%
35 Results in Tables E.23 to E.27 include participants who had their first plan approved between 1 July 2016 and 31
March 2017. While this is a relatively small group of participants, the number of participants included in these tables will grow over time.

March 2019 | COAG Disability Reform Council Quarterly Report 77
Table E.26 Results for “Has the NDIS helped?” questions answered at end of participant's first and second years in the
Scheme, for SFOF version ‘Family 0 to 14’; and for SFOF versions ‘Family 15 to 24’ and ‘Family 25 and over’ combined –
NATIONAL
0 to 14 15 and over
Question Year 1 Year 2 Change Year 1 Year 2 Change
Has the NDIS improved your capacity to advocate (stand up) for your child? / Has the NDIS helped you to know your rights and advocate effectively?
54% 58% +4% 46% 50% +4%
Has the NDIS improved the level of support for your family?
63% 68% +5% 56% 63% +7%
Has the NDIS improved your access to services, programs and activities in the community? / Has the NDIS helped you to access services, programs and activities in the community?
66% 71% +5% 56% 63% +7%
Has the NDIS improved your ability/capacity to help your child develop and learn?
70% 74% +4%
Has the NDIS improved your health and wellbeing?
39% 40% 0% 34% 33% -1%
Table E.27 Progress against the NDIA’s corporate plan metrics for ‘participants in work’ and ‘participants in community and
social activities’ – NATIONAL36
Participants in work Baseline Year 2 2018–19 Target
Aged 15 to 24 years 13% 21%
26% Aged 25+ 25% 23%
Aged 15+ (average) 21% 23%
Participants in community and social activities Baseline Year 2 2018–19 Target
Aged 15 to 24 years 31% 44%
41% Aged 25+ 37% 47%
Aged 15+ (average) 35% 46%
36 Results are drawn from participants’ responses to SFOF questionnaires, and only include participants who had their
first plan approved between 1 July 2016 and 31 March 2017.

March 2019 | COAG Disability Reform Council Quarterly Report 78
Figure E.9 Proportion of participants describing satisfaction with the Agency planning process as good or very good by
quarter – Existing survey administered by NDIA regions (NATIONAL)*
*Of the participants describing satisfaction with the Agency planning process in Q3 of 2018-19, 88% gave a rating of good or very good,
5% gave a neutral rating and 7% gave a rating of poor or very poor.
Table E.28 Proportion of participants rating their level of agreement as strongly agree, agree, neutral, disagree or strongly
disagree in response to statements about the planning process – Existing survey administered by NDIA regions (NATIONAL)
Agree /
strongly agree
Neutral Disagree / strongly disagree
The planner listened to me 94% 3% 3%
I had enough time to tell my story and say what support I need
91% 5% 4%
The planner knows what I can do well 80% 14% 6%
The planner had some good ideas for my plan 84% 11% 5%
I know what is in my plan 81% 11% 8%
The planner helped me think about my future 75% 16% 10%
I think my plan will make my life better 84% 10% 6%
The planning meeting went well 92% 5% 3%
94% 96% 98%93%
100%95%
85% 84%88%
84% 84% 83% 84%88%
93%
84%88%
0%
10%
20%
30%
40%
50%
60%
70%
80%
90%
100%
Q314-15
Q414-15
Q115-16
Q215-16
Q315-16
Q415-16
Q116-17
Q216-17
Q316-17
Q416-17
Q117-18
Q217-18
Q317-18
Q417-18
Q118-19
Q218-19
Q318-19
Pro
po
rtio
n o
f P
art
icip
an
ts %
Quarter

March 2019 | COAG Disability Reform Council Quarterly Report 79
Table E.29 Plan reviews conducted per quarter – excluding plans less than 30 days – NATIONAL37
Prior Quarters
(Transition only) 2018-19 Q3 Transition Total
Total plan reviews 236,358 51,924 288,282
Early intervention plans 49,506 8,798 58,304
Permanent disability plans 186,852 43,126 229,978
Figure E.10 Number of plan reviews over time incrementally (left) and cumulatively (right) – NATIONAL
Table E.30 Scheduled plan reviews conducted by quarter – excluding plans less than 30 days – NATIONAL38
Prior Quarters
(Transition only) 2018-19 Q3 Transition Total
Total scheduled plan reviews 185,984 43,189 229,173
Trial participants 60,678 6,044 66,722
Transition participants 125,306 37,145 162,451
Figure E.11 Number and proportion of scheduled plan reviews over time incrementally (left) and cumulatively (right) –
NATIONAL
37 Plans less than 30 days in duration have been excluded from this tabulation, as these reviews are more likely to represent corrections to the plan rather than a new plan review to address a change in circumstance. 38 A plan was considered to be scheduled if the review occurred less than or equal to 100 days before the scheduled review date.
4,15112,349
23,62536,944
50,365
81,694
111,866
146,168
184,510
236,358
288,282
0
50,000
100,000
150,000
200,000
250,000
300,000
350,000
Sep-16 Dec-16 Mar-17 Jun-17 Sep-17 Dec-17 Mar-18 Jun-18 Sep-18 Dec-18 Mar-19
Plan Reviews
4,151
8,19811,276
13,319 13,421
31,32930,172
34,302
38,342
51,84851,924
0
15,000
30,000
45,000
60,000
Sep-16 Dec-16 Mar-17 Jun-17 Sep-17 Dec-17 Mar-18 Jun-18 Sep-18 Dec-18 Mar-19
Plan Reviews
3,290 7,66812,04120,322
29,886
56,662
81,193
109,836
141,358
185,984
229,173
38.6%36.7%
31.7%34.6%35.5%
49.3%
54.0%57.4%
59.2%63.4%64.5%
0%
10%
20%
30%
40%
50%
60%
0
50,000
100,000
150,000
200,000
250,000
Sep-16 Dec-16 Mar-17 Jun-17 Sep-17 Dec-17 Mar-18 Jun-18 Sep-18 Dec-18 Mar-19
Scheduled Reviews
Rate of Scheduled Reviews (Cumulative)
3,290 4,378 4,373
8,281 9,564
26,77624,531
28,64331,522
44,62643,189
38.6%35.4%
25.6%
39.9%37.6%
87.3%
68.9%69.8%66.7%
82.0%
69.3%
0%
15%
30%
45%
60%
75%
90%
0
10,000
20,000
30,000
40,000
50,000
60,000
Sep-16 Dec-16 Mar-17 Jun-17 Sep-17 Dec-17 Mar-18 Jun-18 Sep-18 Dec-18 Mar-19
Scheduled Reviews
Rate of Scheduled Reviews (Incremental)

March 2019 | COAG Disability Reform Council Quarterly Report 80
Table E.31 Unscheduled plan reviews conducted by quarter – excluding plans less than 30 days – NATIONAL39
Prior Quarters
(Transition only) 2018-19 Q3 Transition Total
Total unscheduled plan reviews 50,374 8,735 59,109
Trial participants 9,851 768 10,619
Transition participants 40,523 7,967 48,490
Table E.32 Estimated rate of unscheduled plan reviews – excluding plans less than 30 days – NATIONAL40
Prior Quarters
(Transition only) 2018-19 Q3 Transition Total
% unscheduled reviews 17.2% 14.0% 16.6%
Figure E.12 Number and proportion of unscheduled plan reviews over time incrementally (left) and cumulatively (right) –
NATIONAL
39 A plan was considered to be unscheduled if the review occurred more than 100 days before the scheduled review date. 40 This is calculated as the number of unscheduled reviews divided by the total number of participants. The number of participants used in the calculation considers the length of time the participants have been in the Scheme.
(latest plan as at each quarter end)
8614,681
11,584
16,62220,479
25,03230,673
36,332
43,152
50,374
59,109
10.1%
22.4%
30.5%28.3%
24.3%
21.8%20.4%
19.0% 18.1% 17.2%
16.6%
0%
5%
10%
15%
20%
25%
30%
35%
40%
0
10,000
20,000
30,000
40,000
50,000
60,000
70,000
Sep-16 Dec-16 Mar-17 Jun-17 Sep-17 Dec-17 Mar-18 Jun-18 Sep-18 Dec-18 Mar-19
Unscheduled Reviews
Rate of Unscheduled Reviews (Cumulative)
861
3,820
6,903
5,038
3,857
4,553
5,641 5,659
6,8207,222
8,735
10.1%
30.9%
40.4%
24.3%
15.2% 14.8%15.9%
13.8% 14.4%13.3%
14.0%
0%
5%
10%
15%
20%
25%
30%
35%
40%
0
1,000
2,000
3,000
4,000
5,000
6,000
7,000
8,000
9,000
10,000
Sep-16 Dec-16 Mar-17 Jun-17 Sep-17 Dec-17 Mar-18 Jun-18 Sep-18 Dec-18 Mar-19
Unscheduled Reviews
Rate of Unscheduled Reviews (Incremental)

March 2019 | COAG Disability Reform Council Quarterly Report 81
Table E.33 Complaints by quarter – NATIONAL41
Complaints made by or on behalf of As at 31 December 2018
(Transition only)42
Participants or those who have sought access
Complaints about service providers 1,629
Complaints about the Agency 27,989
Unclassified 2,807
Total 32,425
% of all people who have sought access43 6.5%
Registered providers
Complaints about the Agency 2,139
Unclassified 339
Total 2,478
% of all registered providers44 6.1%
Other
Complaints about the Agency 1,267
Unclassified 267
Total 1,534
Total 36,437
Figure E.13 Number and proportion of participant complaints over time incrementally (left) and cumulatively (right) –
NATIONAL45
41 An ICT issue has been identified which means that the number of complaints in the March 2019 quarter cannot be reliably reported. This issue is currently under investigation and will be reconciled for reporting as at 30 June 2019. 42 The number of complaints as at 31 December 2018 has changed slightly compared to the previous report, due to corrections in the data. 43 This is calculated as the number of complaints made by people who have sought access divided by the number of people who have sought access. The number of people who have sought access used in the calculation takes into account the length of time since access was sought. 44 This is calculated as the number of complaints made by registered providers divided by the number of registered providers. The number of registered providers used in the calculation considers the length of time since the providers have submitted a registration request for the Scheme. 45 An ICT issue has been identified which means that the number of complaints in the March 2019 quarter cannot be reliably reported. This issue is currently under investigation and will be reconciled for reporting as at 30 June 2019.

March 2019 | COAG Disability Reform Council Quarterly Report 82
Figure E.14 Number and proportion of provider complaints over time incrementally (left) and cumulatively (right) –
NATIONAL46,47
46 Ibid. 47 The sharp increase in September 2017 is due to improvements in data processes and back-capturing of data.

March 2019 | COAG Disability Reform Council Quarterly Report 83
Table E.34 Complaints by type – NATIONAL48
Complaints made by or on behalf of As at 31 December 2018
(Transition only)49
Participants or those who have sought access
Complaints about service providers
Supports being provided 359 (22%)
Service delivery 261 (16%)
Staff conduct 263 (16%)
Provider process 182 (11%)
Provider costs 171 (10%)
Other 393 (24%)
Total 1,629
Complaints about the Agency
Timeliness 9,523 (34%)
Individual needs 3,972 (14%)
Reasonable and necessary supports 3,597 (13%)
Information unclear 1,333 (5%)
The way the NDIA carried out its decision making
1,367 (5%)
Other 8,197 (29%)
Total 27,989
Unclassified 2,807
Registered providers
Complaints about the Agency
Timeliness 529 (25%)
Individual needs 322 (15%)
Provider Portal 344 (16%)
Information unclear 171 (8%)
Participation, engagement and inclusion 45 (2%)
Other 728 (34%)
Total 2,139
Unclassified 339
Other
Complaints about the Agency
Individual needs 366 (29%)
Timeliness 251 (20%)
Information unclear 142 (11%)
Participation, engagement and inclusion 56 (4%)
Staff conduct - Agency 39 (3%)
Other 413 (33%)
Total 1,267
Unclassified 267
48 An ICT issue has been identified which means that the number of complaints in the March 2019 quarter cannot be
reliably reported. This issue is currently under investigation and will be reconciled for reporting as at 30 June 2019. 49 The number of complaints as at 31 December 2018 has changed slightly compared to the previous report, due to corrections in the data.

March 2019 | COAG Disability Reform Council Quarterly Report 84
Table E.35 AAT Cases by category – NATIONAL
Prior Quarters 2018-19 Q3 Total
Category N % N % N %
Access 599 37% 54 18% 653 34%
Plan 765 47% 178 60% 943 49%
Plan Review 191 12% 31 11% 222 12%
Other 57 4% 32 11% 89 5%
Total 1,612 100% 295 100% 1,907 100%
% of all access decisions50
0.34% 0.35% 0.34%
Figure E.15 Number and proportion of AAT cases over time incrementally (left) and cumulatively (right) – NATIONAL
Table E.36 AAT cases by open/closed and decision – NATIONAL
N
AAT Cases 1,907
Open AAT Cases 642
Closed AAT Cases 1,265
Resolved before hearing 1,217
Gone to hearing and received a substantive decision 48*
*Of the 48 cases which went to hearing and received a substantive decision: 25 affirmed the Agency’s decision, 12 varied the Agency’s decision and 11
set aside the Agency’s decision. 51
50 This is calculated as the number of appeals divided by the number of access decisions made. The number of access decisions used in the calculation considers the length of time since the access decisions have been made. 51 The Tribunal will affirm the decision under review if it finds that the Agency has made the correct decision, or vary the decision under review if it finds the Agency’s decision should be altered in some way. The Tribunal will set aside the decision under review if it finds that the Agency has made a wholly or partially incorrect decision. In this case they can replace the Agency’s decision, or send the case back to the Agency with considerations to be taken when making a new decision.

March 2019 | COAG Disability Reform Council Quarterly Report 85
Table E.37 Distribution of active participants by method of Financial Plan Management and quarter of plan approval –
NATIONAL52,53
Prior Quarters
(Transition only) 2018-19 Q3 Total
Self-managed fully 14% 16% 15%
Self-managed partly 10% 13% 11%
Plan managed 25% 31% 27%
Agency managed 51% 41% 47%
Total 100% 100% 100%
Figure E.16 Distribution of active participants by method of financial plan management over time incrementally (left) and
cumulatively (right) – NATIONAL54
Table E.38 Distribution of active participants by support coordination and quarter of plan approval – NATIONAL55
Prior Quarters
(Transition only) 2018-19 Q3 Total
Support coordination 39% 41% 40%
52 Participants can use more than one method to manage their funding. This table is a hierarchy whereby each participant is only captured once. The hierarchy is: (1) self-managed fully, (2) self-managed partly (regardless of other methods being used), (3) anyone who does not fall into ‘self-managed partly’ and has a plan manager, and (4) anyone else. 53 Trial participants are not included. 54 This figure includes active participants as at each quarter over time whereas the previous table includes active participants as at the current quarter. Data is not available prior to March 2017. 55 Trial participants are not included.
6% 7% 8% 10% 11% 12% 13% 14% 15%14% 12% 10% 10% 9% 10% 10% 10% 11%9% 10% 12% 14% 16% 18%
21%24%
27%
71% 70% 70% 67% 64% 60% 56% 52% 47%
0%
10%
20%
30%
40%
50%
60%
70%
80%
90%
100%
Mar-17 Jun-17 Sep-17 Dec-17 Mar-18 Jun-18 Sep-18 Dec-18 Mar-19
Self Managed Fully Self Managed Partly
Plan Managed Agency Managed Fully
7% 9% 9% 10% 12% 13% 14% 15% 16%13% 10% 9% 9% 10% 10% 11% 11% 13%14% 12% 13% 15%
20% 21%26% 27%
31%
67% 68% 68% 66%58% 56%
50% 47%41%
0%
10%
20%
30%
40%
50%
60%
70%
80%
90%
100%
Mar-17 Jun-17 Sep-17 Dec-17 Mar-18 Jun-18 Sep-18 Dec-18 Mar-19
Self Managed Fully Self Managed Partly
Plan Managed Agency Managed Fully

March 2019 | COAG Disability Reform Council Quarterly Report 86
Table E.39 Duration to plan activation by quarter of initial plan approval for active participants – NATIONAL56,57
Prior Quarters (Transition Only) 2018-19 Q1
Plan activation N % N %
Less than 30 days 97,580 69% 18,045 70%
30 to 59 days 16,273 11% 2,964 11%
60 to 89 days 7,828 6% 1,236 5%
Activated within 90 days 121,681 86% 22,245 86%
90 to 119 days 4,521 3% 665 3%
120 days and over 11,059 8% 949 4%
Activated after 90 days 15,580 11% 1,614 6%
No payments 4,753 3% 1,926 7%
Total plans approved 142,014 100% 25,785 100%
Table E.40 Proportion of active participants with plan activated within 12 months – NATIONAL
Number of participants
activated within 12 months
All participants with duration of
at least 12 months
Proportion activated
by Aboriginal and Torres Strait Islander status
Aboriginal and Torres Strait Islander 7,204 7,815 92%
Not Aboriginal and Torres Strait Islander 126,443 132,013 96%
Not Stated 5,807 6,067 96%
Total 139,454 145,895 96%
by Culturally and Linguistically Diverse status
CALD 10,163 10,583 96%
Not CALD 128,360 134,349 96%
Not Stated 931 963 97%
Total 139,454 145,895 96%
by Remoteness
Major Cities 89,236 93,198 96%
Regional 48,531 50,829 95%
Remote 1,372 1,529 90%
Missing 315 339 93%
Total 139,454 145,895 96%
by Primary Disability type
Autism 42,325 44,299 96% Intellectual Disability (including Down Syndrome) 40,719 42,376 96%
Psychosocial Disability 10,508 11,084 95% Developmental Delay (including Global Developmental Delay) 6,083 6,438 94%
Other 39,819 41,698 95%
Total 139,454 145,895 96%
56 Note: Plans approved after the end of 2018-19 Q1 have been excluded from the table. They are relatively new and it is too early to examine their durations to activation. 57 There has been a change in methodology used to calculate these results since the previous quarter. Duration to plan
activation is now calculated as the time from a participant’s initial plan approval to when the participant first uses plan
supports (previously only the initial plan for each participant was considered). In-kind supports are now also included
(previously excluded). As a result, a higher proportion of participants are identified as activating their plans within 90
days, and a lower proportion have no payments.

March 2019 | COAG Disability Reform Council Quarterly Report 87
Table E.41 Distribution of plans by plan utilisation and quarter of plan approval for 2016-17, 2017-18 and quarter 1 of 2018-19 –
NATIONAL58,59
Plan utilisation Prior Quarters
(Transition only) 2018-19 Q1 Total
0% to 50% 39% 66% 41%
50% to 75% 23% 20% 23%
> 75% 38% 14% 36%
Total 100% 100% 100%
Table E.42 Proportion of active participants with approved plans accessing mainstream supports - NATIONAL60
Prior Quarters 2018-19 Q3 Total
Daily Activities 9% 10% 9%
Health & Wellbeing 46% 47% 47%
Lifelong Learning 11% 12% 12%
Other 11% 11% 11%
Non-categorised 33% 33% 33%
Any mainstream service 91% 92% 92%
Part Three: Providers and the growing market
Table E.43 Key provider indicators by quarter - NATIONAL61,62
Prior Quarters 2018-19 Q3 Total
Provider indicators
a) Registrations by profile
Individual/ sole trader 8,534 788 9,117
Company/ organisation 10,541 757 11,091
Total 19,075 1,545 20,208
b) Registration revoked 412
58 Plans less than 30 days in duration have been excluded from this tabulation, as these plans are more likely to represent corrections to the plan rather than an unscheduled plan review to address a change in circumstance. 59 This table only considers committed supports and payments for supports provided to 31 December 2018. This gives some allowance for the timing delay between when the support is provided and when it is paid. 60 Trial participants (participants with initial plans approved prior to 1 July 2016) are not included. 61 The total number of providers as at 31 March 2019 (20,208) is not the sum of the number of providers as at 31 December 2018 (19,075) and the providers registered in the third quarter of 2018-19 (1,545). This is due to 412 providers whose registration ended during the third quarter of 2018-19. 62 The large number of revoked providers in 2018-19 Q3 reflects differences in the renewal process for providers under the NDIS Quality and Safeguards Commission (NQSC).
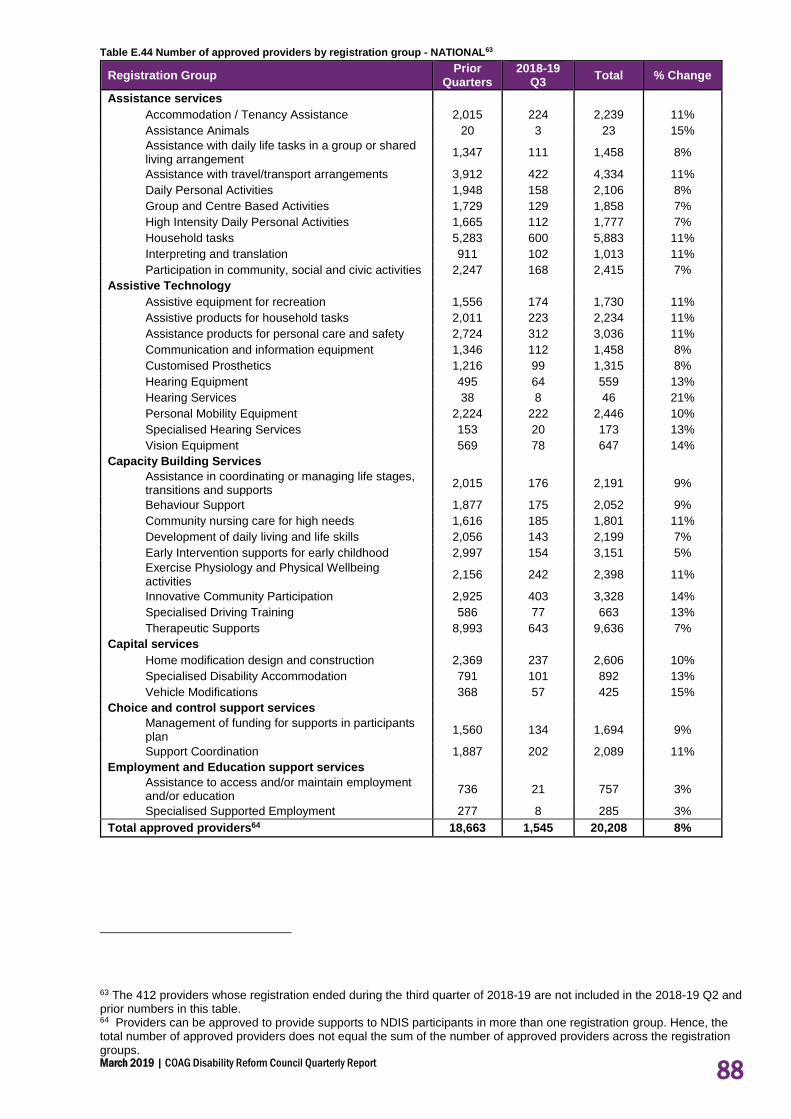
March 2019 | COAG Disability Reform Council Quarterly Report 88
Table E.44 Number of approved providers by registration group - NATIONAL63
Registration Group Prior
Quarters 2018-19
Q3 Total % Change
Assistance services
Accommodation / Tenancy Assistance 2,015 224 2,239 11%
Assistance Animals 20 3 23 15%
Assistance with daily life tasks in a group or shared living arrangement
1,347 111 1,458 8%
Assistance with travel/transport arrangements 3,912 422 4,334 11%
Daily Personal Activities 1,948 158 2,106 8%
Group and Centre Based Activities 1,729 129 1,858 7%
High Intensity Daily Personal Activities 1,665 112 1,777 7%
Household tasks 5,283 600 5,883 11%
Interpreting and translation 911 102 1,013 11%
Participation in community, social and civic activities 2,247 168 2,415 7%
Assistive Technology
Assistive equipment for recreation 1,556 174 1,730 11%
Assistive products for household tasks 2,011 223 2,234 11%
Assistance products for personal care and safety 2,724 312 3,036 11%
Communication and information equipment 1,346 112 1,458 8%
Customised Prosthetics 1,216 99 1,315 8%
Hearing Equipment 495 64 559 13%
Hearing Services 38 8 46 21%
Personal Mobility Equipment 2,224 222 2,446 10%
Specialised Hearing Services 153 20 173 13%
Vision Equipment 569 78 647 14%
Capacity Building Services
Assistance in coordinating or managing life stages, transitions and supports
2,015 176 2,191 9%
Behaviour Support 1,877 175 2,052 9%
Community nursing care for high needs 1,616 185 1,801 11%
Development of daily living and life skills 2,056 143 2,199 7%
Early Intervention supports for early childhood 2,997 154 3,151 5%
Exercise Physiology and Physical Wellbeing activities
2,156 242 2,398 11%
Innovative Community Participation 2,925 403 3,328 14%
Specialised Driving Training 586 77 663 13%
Therapeutic Supports 8,993 643 9,636 7%
Capital services
Home modification design and construction 2,369 237 2,606 10%
Specialised Disability Accommodation 791 101 892 13%
Vehicle Modifications 368 57 425 15%
Choice and control support services
Management of funding for supports in participants plan
1,560 134 1,694 9%
Support Coordination 1,887 202 2,089 11%
Employment and Education support services
Assistance to access and/or maintain employment and/or education
736 21 757 3%
Specialised Supported Employment 277 8 285 3%
Total approved providers64 18,663 1,545 20,208 8%
63 The 412 providers whose registration ended during the third quarter of 2018-19 are not included in the 2018-19 Q2 and prior numbers in this table. 64 Providers can be approved to provide supports to NDIS participants in more than one registration group. Hence, the total number of approved providers does not equal the sum of the number of approved providers across the registration groups.

March 2019 | COAG Disability Reform Council Quarterly Report 89
Table E.45 Key markets indicators by quarter - NATIONAL
Market indicators Prior Quarters 2018-19 Q3
a) Average number of providers per participant65 1.56 1.50
b) Number of providers delivering new supports 2,279 2,276
c) Change in the number of active/inactive providers:66
Active (%) 46% 45%
Not yet active (%) 45% 43%
Inactive (%) 10% 11%
d) Share of payments - top 25%67
Daily Tasks/Shared Living (%) 88% 88%
Therapeutic Supports (%) 88% 90%
Participate Community (%) 83% 83%
Early Childhood Supports (%) 89% 89%
Assist Personal Activities (%) 86% 86%
65 In-kind payments are not included. However, if in-kind payments were included, the average number of providers per participant would be higher. 66 ‘Active’ service providers received a payment in the quarter; ‘not yet active’ service providers have never received a payment from the NDIA, and ‘inactive’ providers have received payments from the NDIA, but did not receive any in the quarter. 67 Note: Share of payments going to the top 25% of active providers relates to the top five registration groups by payment amount.

March 2019 | COAG Disability Reform Council Quarterly Report 90
Table E.46 Cumulative number of providers that have been active by registration group - NATIONAL
Registration Group Prior
Quarters 2018-19
Q3 Total % Change
Assistance services
Accommodation / Tenancy Assistance 231 31 262 13%
Assistance Animals 9 0 9 0%
Assistance with daily life tasks in a group or shared living arrangement
784 79 863 10%
Assistance with travel/transport arrangements 1,159 113 1,272 10%
Daily Personal Activities 1,483 130 1,613 9%
Group and Centre Based Activities 1,046 63 1,109 6%
High Intensity Daily Personal Activities 1,209 77 1,286 6%
Household tasks 2,396 271 2,667 11%
Interpreting and translation 104 10 114 10%
Participation in community, social and civic activities 1,683 129 1,812 8%
Assistive Technology
Assistive equipment for recreation 202 22 224 11%
Assistive products for household tasks 189 26 215 14%
Assistance products for personal care and safety 1,135 149 1,284 13%
Communication and information equipment 236 22 258 9%
Customised Prosthetics 463 46 509 10%
Hearing Equipment 118 13 131 11%
Hearing Services 16 0 16 0%
Personal Mobility Equipment 616 56 672 9%
Specialised Hearing Services 28 0 28 0%
Vision Equipment 68 7 75 10%
Capacity Building Services
Assistance in coordinating or managing life stages, transitions and supports
1,439 126 1,565 9%
Behaviour Support 710 74 784 10%
Community nursing care for high needs 353 33 386 9%
Development of daily living and life skills 1,253 97 1,350 8%
Early Intervention supports for early childhood 1,565 111 1,676 7%
Exercise Physiology and Physical Wellbeing activities
653 90 743 14%
Innovative Community Participation 314 47 361 15%
Specialised Driving Training 137 17 154 12%
Therapeutic Supports 5,601 473 6,074 8%
Capital services
Home modification design and construction 338 37 375 11%
Specialised Disability Accommodation 118 22 140 19%
Vehicle Modifications 87 9 96 10%
Choice and control support services
Management of funding for supports in participants plan
791 86 877 11%
Support Coordination 477 65 542 14%
Employment and Education support services
Assistance to access and/or maintain employment and/or education
342 25 367 7%
Specialised Supported Employment 200 5 205 3%
Total approved active providers68 10,489 929 11,418 9%
68 Providers can be active in more than one registration group. Hence, the total number of approved active providers does not equal the sum of the number of approved active providers across the registration groups.

March 2019 | COAG Disability Reform Council Quarterly Report 91
Table E.47 Number of approved and active providers in each registration group by legal entity type as at 31 March 2019 –
NATIONAL
Registration Group
Approved Active
Individual/ sole trader
Company/ organisation
Total Approved
Individual/ sole trader
Company/ organisation
Total Active
Assistance services
Accommodation / Tenancy Assistance
451 1,788 2,239 53 209 262
Assistance Animals 0 23 23 0 9 9
Assistance with daily life tasks in a group or shared living arrangement
126 1,332 1,458 44 819 863
Assistance with travel/transport arrangements
1,106 3,228 4,334 206 1,066 1,272
Daily Personal Activities 191 1,915 2,106 126 1,487 1,613
Group and Centre Based Activities
154 1,704 1,858 53 1,056 1,109
High Intensity Daily Personal Activities
145 1,632 1,777 94 1,192 1,286
Household tasks 2,000 3,883 5,883 916 1,751 2,667
Interpreting and translation 164 849 1,013 31 83 114
Participation in community, social and civic activities
248 2,167 2,415 176 1,636 1,812
Assistive Technology Assistive equipment for recreation
515 1,215 1,730 29 195 224
Assistive products for household tasks
597 1,637 2,234 25 190 215
Assistance products for personal care and safety
765 2,271 3,036 204 1,080 1,284
Communication and information equipment
517 941 1,458 66 192 258
Customised Prosthetics 367 948 1,315 107 402 509
Hearing Equipment 78 481 559 11 120 131
Hearing Services 2 44 46 0 16 16
Personal Mobility Equipment 756 1,690 2,446 118 554 672
Specialised Hearing Services
48 125 173 1 27 28
Vision Equipment 143 504 647 7 68 75
Capacity Building Services Assistance in coordinating or managing life stages, transitions and supports
359 1,832 2,191 226 1,339 1,565
Behaviour Support 799 1,253 2,052 251 533 784
Community nursing care for high needs
280 1,521 1,801 53 333 386
Development of daily living and life skills
248 1,951 2,199 121 1,229 1,350
Early Intervention supports for early childhood
1,662 1,489 3,151 828 848 1,676
Exercise Physiology and Physical Wellbeing activities
795 1,603 2,398 235 508 743
Innovative Community Participation
1,177 2,151 3,328 125 236 361
Specialised Driving Training 132 531 663 55 99 154
Therapeutic Supports 5,120 4,516 9,636 3,077 2,997 6,074
Capital services Home modification design and construction
810 1,796 2,606 65 310 375
Specialised Disability Accommodation
104 788 892 4 136 140
Vehicle Modifications 49 376 425 11 85 96
Choice and control support services
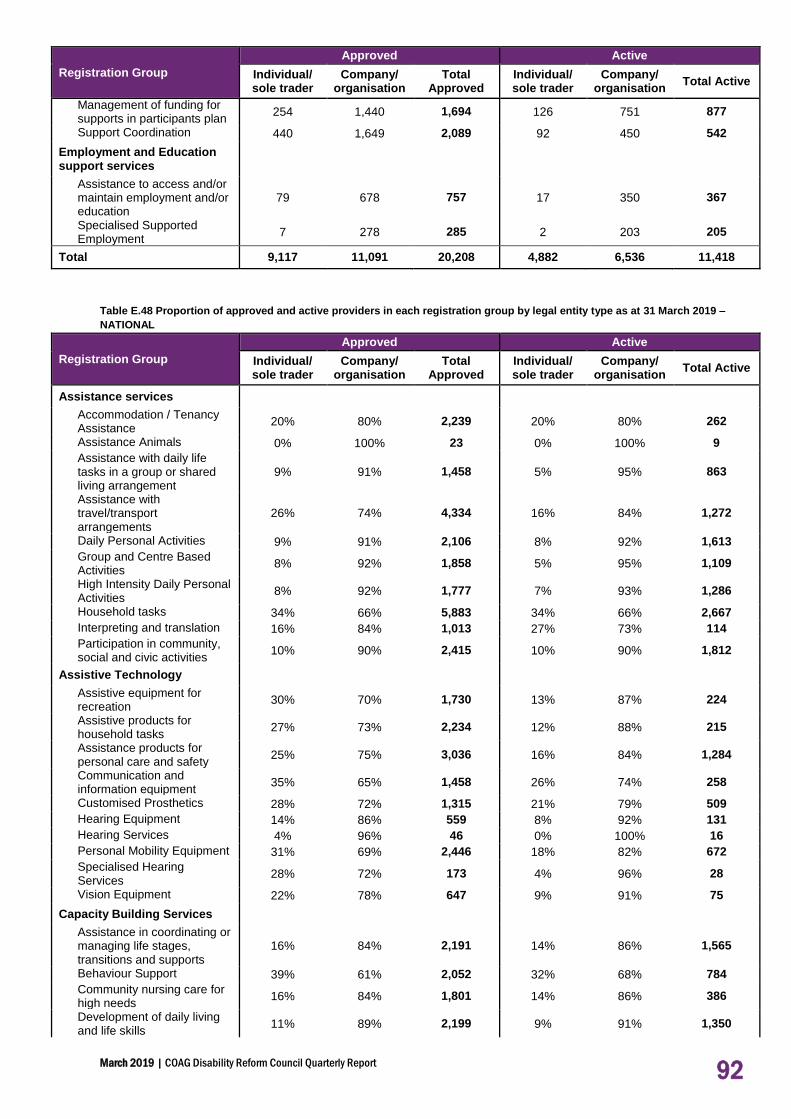
March 2019 | COAG Disability Reform Council Quarterly Report 92
Registration Group
Approved Active
Individual/ sole trader
Company/ organisation
Total Approved
Individual/ sole trader
Company/ organisation
Total Active
Management of funding for supports in participants plan
254 1,440 1,694 126 751 877
Support Coordination 440 1,649 2,089 92 450 542
Employment and Education support services
Assistance to access and/or maintain employment and/or education
79 678 757 17 350 367
Specialised Supported Employment
7 278 285 2 203 205
Total 9,117 11,091 20,208 4,882 6,536 11,418
Table E.48 Proportion of approved and active providers in each registration group by legal entity type as at 31 March 2019 –
NATIONAL
Registration Group
Approved Active
Individual/ sole trader
Company/ organisation
Total Approved
Individual/ sole trader
Company/ organisation
Total Active
Assistance services
Accommodation / Tenancy Assistance
20% 80% 2,239 20% 80% 262
Assistance Animals 0% 100% 23 0% 100% 9
Assistance with daily life tasks in a group or shared living arrangement
9% 91% 1,458 5% 95% 863
Assistance with travel/transport arrangements
26% 74% 4,334 16% 84% 1,272
Daily Personal Activities 9% 91% 2,106 8% 92% 1,613
Group and Centre Based Activities
8% 92% 1,858 5% 95% 1,109
High Intensity Daily Personal Activities
8% 92% 1,777 7% 93% 1,286
Household tasks 34% 66% 5,883 34% 66% 2,667
Interpreting and translation 16% 84% 1,013 27% 73% 114
Participation in community, social and civic activities
10% 90% 2,415 10% 90% 1,812
Assistive Technology Assistive equipment for recreation
30% 70% 1,730 13% 87% 224
Assistive products for household tasks
27% 73% 2,234 12% 88% 215
Assistance products for personal care and safety
25% 75% 3,036 16% 84% 1,284
Communication and information equipment
35% 65% 1,458 26% 74% 258
Customised Prosthetics 28% 72% 1,315 21% 79% 509
Hearing Equipment 14% 86% 559 8% 92% 131
Hearing Services 4% 96% 46 0% 100% 16
Personal Mobility Equipment 31% 69% 2,446 18% 82% 672
Specialised Hearing Services
28% 72% 173 4% 96% 28
Vision Equipment 22% 78% 647 9% 91% 75
Capacity Building Services Assistance in coordinating or managing life stages, transitions and supports
16% 84% 2,191 14% 86% 1,565
Behaviour Support 39% 61% 2,052 32% 68% 784
Community nursing care for high needs
16% 84% 1,801 14% 86% 386
Development of daily living and life skills
11% 89% 2,199 9% 91% 1,350

March 2019 | COAG Disability Reform Council Quarterly Report 93
Registration Group
Approved Active
Individual/ sole trader
Company/ organisation
Total Approved
Individual/ sole trader
Company/ organisation
Total Active
Early Intervention supports for early childhood
53% 47% 3,151 49% 51% 1,676
Exercise Physiology and Physical Wellbeing activities
33% 67% 2,398 32% 68% 743
Innovative Community Participation
35% 65% 3,328 35% 65% 361
Specialised Driving Training 20% 80% 663 36% 64% 154
Therapeutic Supports 53% 47% 9,636 51% 49% 6,074
Capital services Home modification design and construction
31% 69% 2,606 17% 83% 375
Specialised Disability Accommodation
12% 88% 892 3% 97% 140
Vehicle Modifications 12% 88% 425 11% 89% 96
Choice and control support services
Management of funding for supports in participants plan
15% 85% 1,694 14% 86% 877
Support Coordination 21% 79% 2,089 17% 83% 542
Employment and Education support services
Assistance to access and/or maintain employment and/or education
10% 90% 757 5% 95% 367
Specialised Supported Employment
2% 98% 285 1% 99% 205
Total 45% 55% 20,208 43% 57% 11,418

March 2019 | COAG Disability Reform Council Quarterly Report 94
Part Five: Financial sustainability
Table E.49 Committed supports by financial year ($m) - NATIONAL
2013-14 2014-15 2015-16 2016-17 2017-18 2018-19
Q1,Q2,Q369 Total
Total Committed
132.8 496.9 939.4 3,236.1 7,719.6 10,101.3
22,626.1
Figure E.17 Distribution of participants by annualised committed support band (including participants with Supported
Independent Living supports) – active participants with initial plan approvals as at 2018-19 Q3 compared with active
participants with initial plan approvals as at 2018-19 Q2 (NATIONAL)
69 Note: the $10.1 billion in respect of 2018-19 Q1, Q2 and Q3 only includes committed supports expected to be used to 31 March 2019.
0.00%
2.00%
4.00%
6.00%
8.00%
10.00%
12.00%
14.00%
16.00%
18.00%
Dis
trib
uti
on
o
f p
art
icip
an
ts
Average annualised committed supports band
As at Q2 2018-19 distribution of participants As at Q3 2018-19 distribution of participants

March 2019 | COAG Disability Reform Council Quarterly Report 95
Figure E.18 Distribution of participants by annualised committed support band (excluding participants with Supported
Independent Living supports) – active participants with initial plan approvals as at 2018-19 Q3 compared with active
participants with initial plan approvals as at 2018-19 Q2 (NATIONAL)
0.00%
2.00%
4.00%
6.00%
8.00%
10.00%
12.00%
14.00%
16.00%
18.00%
Dis
trib
uti
on
o
f p
art
icip
an
ts
Average annualised committed supports band
As at Q2 2018-19 distribution of participants As at Q3 2018-19 distribution of participants

March 2019 | COAG Disability Reform Council Quarterly Report 96
Figure E.19 Average committed support by age group (including participants with Supported Independent Living supports) –
active participants with initial plan approvals as at 2018-19 Q3 compared with active participants with initial plan approvals as
at 2018-19 Q2 (NATIONAL) 70
70 The average revenue amounts have been removed from the figure in this report as the amounts refer to revenue received under the bilateral agreements, and are not linked to age group, primary disability group, and level of function. Therefore, it is not appropriate to make comparisons between revenue and plan budgets in this chart. The amount of revenue received in aggregate should be compared with the amount spent in aggregate – the NDIA has been within budget in all years of operation (including 2018-19).
$0
$20,000
$40,000
$60,000
$80,000
$100,000
$120,000
0 to 6 7 to 14 15 to 18 19 to 24 25 to 34 35 to 44 45 to 54 55 to 64 65+
Av
era
ge
an
nu
ali
se
d c
om
mit
ted
su
pp
ort
s
Age group
As at Q3 2018-19 actual average annualised committed supports
As at Q2 2018-19 actual average annualised committed supports

March 2019 | COAG Disability Reform Council Quarterly Report 97
Figure E.20 Average committed support by primary disability group (including participants with Supported Independent Living
supports) – active participants with initial plan approvals as at 2018-19 Q3 compared with active participants with initial plan
approvals as at 2018-19 Q2 (NATIONAL) 71
71 Ibid.
$0 $20,000 $40,000 $60,000 $80,000 $100,000 $120,000 $140,000
Acquired Brain Injury
Autism
Cerebral Palsy
Developmental Delay
Global Developmental Delay
Hearing Impairment
Intellectual Disability
Multiple Sclerosis
Psychosocial disability
Spinal Cord Injury
Stroke
Visual Impairment
Other Neurological
Other Physical
Other Sensory/Speech
Other
Average annualised committed supports
Pri
ma
ry d
isa
bil
ity
As at Q2 2018-19 actual average annualised committed supports
As at Q3 2018-19 actual average annualised committed supports

March 2019 | COAG Disability Reform Council Quarterly Report 98
Figure E.21 Average committed support by level of function (including participants with Supported Independent Living
supports) – active participants with initial plan approvals as at 2018-19 Q3 compared with active participants with initial plan
approvals as at 2018-19 Q2 (NATIONAL) 72,73
Table E.50 Payments by financial year, compared to committed supports ($m) – NATIONAL
2013-14 2014-15 2015-16 2016-17 2017-18 2018-19
Q1, Q2, Q3 Total
Total Committed 132.8 496.9 939.4 3,236.1 7,719.6 10,101.3 22,626.1
Total Paid 85.8 370.9 704.0 2,179.1 5,345.4 6,195.4 14,880.5
% utilised to date 65% 75% 75% 67% 69% 61% 66%
72 Ibid. 73 An ICT issue has been identified and as a result, reporting by level of function is not accurate. This issue is currently
under investigation and will be reconciled for reporting as at 30 June 2019.
$0
$50,000
$100,000
$150,000
$200,000
$250,000
$300,000
$350,000
1 2 3 4 5 6 7 8 9 10 11 12 13 14 15
Av
era
ge
an
nu
ali
se
d c
os
t
Level of function
As at Q3 2018-19 actual average annualised committed supports
As at Q2 2018-19 actual average annualised committed supports

March 2019 | COAG Disability Reform Council Quarterly Report 99
Figure E.22 Utilisation of committed supports as at 31 December 2018 and 31 March 2019 (NATIONAL)
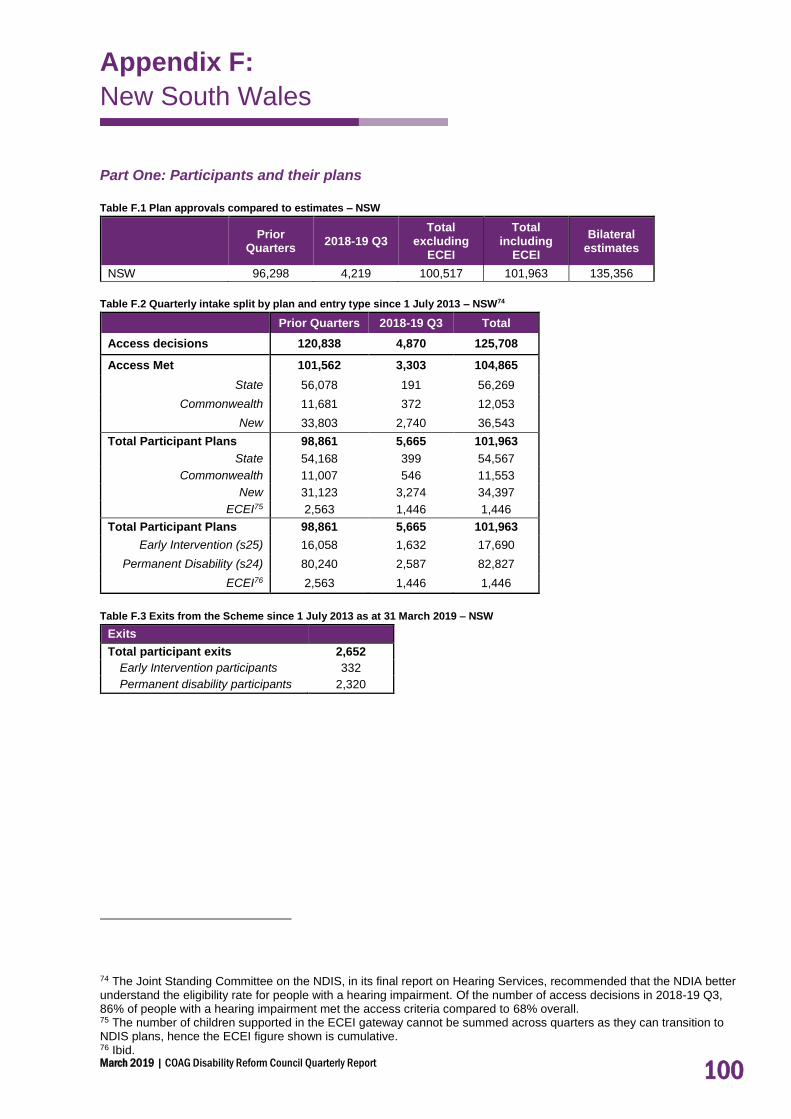
March 2019 | COAG Disability Reform Council Quarterly Report 100
Appendix F: Appendix F:
New South Wales
Part One: Participants and their plans
Table F.1 Plan approvals compared to estimates – NSW
Prior
Quarters 2018-19 Q3
Total excluding
ECEI
Total including
ECEI
Bilateral estimates
NSW 96,298 4,219 100,517 101,963 135,356
Table F.2 Quarterly intake split by plan and entry type since 1 July 2013 – NSW74
Prior Quarters 2018-19 Q3 Total
Access decisions 120,838 4,870 125,708
Access Met 101,562 3,303 104,865
State 56,078 191 56,269
Commonwealth 11,681 372 12,053
New 33,803 2,740 36,543
Total Participant Plans 98,861 5,665 101,963
State 54,168 399 54,567
Commonwealth 11,007 546 11,553
New 31,123 3,274 34,397
ECEI75 2,563 1,446 1,446
Total Participant Plans 98,861 5,665 101,963
Early Intervention (s25) 16,058 1,632 17,690
Permanent Disability (s24) 80,240 2,587 82,827
ECEI76 2,563 1,446 1,446
Table F.3 Exits from the Scheme since 1 July 2013 as at 31 March 2019 – NSW
Exits
Total participant exits 2,652
Early Intervention participants 332
Permanent disability participants 2,320
74 The Joint Standing Committee on the NDIS, in its final report on Hearing Services, recommended that the NDIA better understand the eligibility rate for people with a hearing impairment. Of the number of access decisions in 2018-19 Q3, 86% of people with a hearing impairment met the access criteria compared to 68% overall. 75 The number of children supported in the ECEI gateway cannot be summed across quarters as they can transition to NDIS plans, hence the ECEI figure shown is cumulative. 76 Ibid.

March 2019 | COAG Disability Reform Council Quarterly Report 101
Table F.4 Cumulative position by services previously received – NSW77
Participant cohort Bilateral estimate
% of estimate
State Commonwealth New ECEI Total
Trial 4,164 958 4,487 9,609 12,111 79%
End of 2016-17 28,860 3,501 11,566 4,330 48,257 55,333 87%
End of 2017-18 52,388 9,718 23,933 3,578 89,617 115,553 78%
End of 2018-19 Q1 53,513 10,409 27,250 1,032 92,204 122,154 75%
End of 2018-19 Q2 54,168 11,007 31,123 2,563 98,861 128,755 77%
End of 2018-19 Q3 54,567 11,553 34,397 1,446 101,963 135,356 75%
Table F.5 Cumulative position by entry into the Scheme – NSW78
Participant cohort Bilateral estimate
% of estimate
Early
Intervention Permanent Disability
ECEI Total
Trial 3,511 6,098 9,609 12,111 79%
End of 2016-17 6,787 37,140 4,330 48,257 55,333 87%
End of 2017-18 12,590 73,449 3,578 89,617 115,553 78%
End of 2018-19 Q1 14,149 77,023 1,032 92,204 122,154 75%
End of 2018-19 Q2 16,058 80,240 2,563 98,861 128,755 77%
End of 2018-19 Q3 17,690 82,827 1,446 101,963 135,356 75%
Note: in the below tables the percentage figures have been rounded. Therefore, the totals may not
always add up to one hundred per cent.
Table F.6 Participant profile per quarter by Aboriginal and Torres Strait islander status – NSW
Prior Quarters 2018-19 Q3 Total
Participant profile N % N % N %
Aboriginal and Torres Strait Islander 5,558 5.9% 368 8.7% 5,926 6.1%
Not Aboriginal and Torres Strait Islander 84,458 90.2% 3,623 85.9% 88,081 90.0%
Not Stated 3,633 3.9% 225 5.3% 3,858 3.9%
Total 93,649 100% 4,216 100% 97,865 100%
Table F.7 Participant profile per quarter by culturally and linguistically diverse (CALD) status – NSW
Prior Quarters 2018-19 Q3 Total
Participant profile N % N % N %
CALD 8,658 9.2% 534 12.7% 9,192 9.4%
Not CALD 84,722 90.5% 3,682 87.3% 88,404 90.3%
Not Stated 269 0.3% 0 0.0% 269 0.3%
Total 93,649 100% 4,216 100% 97,865 100%
Table F.8 Participant profile per quarter by Young people in Residential aged care (YPIRAC) status – NSW
Prior Quarters 2018-19 Q3 Total
Participant profile N % N % N %
YPIRAC 2,003 2.1% 75 1.8% 2,078 2.1%
Not YPIRAC 91,646 97.9% 4,141 98.2% 95,787 97.9%
Total 93,649 100% 4,216 100% 97,865 100%
77 The total number of participants in previous periods have changed slightly compared to the previous report, due to
corrections in the data. Further, updated lists of clients are provided by State/Territory and Commonwealth governments each quarter. This results in some participants being retrospectively reclassified as State, Commonwealth or New. 78 The total number of participants in previous periods have changed slightly compared to the previous report, due to corrections in the data.

March 2019 | COAG Disability Reform Council Quarterly Report 102
Table F.9 Participant profile per quarter by remoteness – NSW79,80
Prior Quarters 2018-19 Q3 Total
Participant profile N % N % N %
Major Cities 65,607 70.2% 2,819 66.9% 68,426 70.1%
Population > 50,000 2,881 3.1% 175 4.2% 3,056 3.1%
Population between 15,000 and 50,000
12,577 13.5% 569 13.5% 13,146 13.5%
Population between 5,000 and 15,000
5,673 6.1% 249 5.9% 5,922 6.1%
Population less than 5,000 6,427 6.9% 378 9.0% 6,805 7.0%
Remote 231 0.2% 17 0.4% 248 0.3%
Very Remote 60 0.1% 4 0.1% 64 0.1%
Missing 193 5 198
Total 93,649 100% 4,216 100% 97,865 100%
Table F.10 Participant profile per quarter by disability group - NSW81,82
Prior Quarters 2018-19 Q3 Total
Disability N % N % N %
Autism 28,104 30% 1,425 34% 29,529 30%
Intellectual Disability83 25,116 27% 418 10% 25,534 26%
Psychosocial disability 7,234 8% 355 8% 7,589 8%
Cerebral Palsy 4,823 5% 93 2% 4,916 5%
Other Neurological 4,482 5% 203 5% 4,685 5%
Developmental Delay 3,367 4% 567 13% 3,934 4%
Other Physical 3,746 4% 206 5% 3,952 4%
Hearing Impairment 3,872 4% 307 7% 4,179 4%
ABI 3,112 3% 101 2% 3,213 3%
Visual Impairment 2,448 3% 77 2% 2,525 3%
Multiple Sclerosis 1,900 2% 34 1% 1,934 2%
Global Developmental Delay 1,261 1% 254 6% 1,515 2%
Stroke 1,445 2% 93 2% 1,538 2%
Spinal Cord Injury 1,327 1% 32 1% 1,359 1%
Other Sensory/Speech 1,230 1% 42 1% 1,272 1%
Other 182 0% 9 0% 191 0%
Total 93,649 100% 4,216 100% 97,865 100%
79 This table is based on the Modified Monash Model measure of remoteness. 80 The distributions are calculated excluding active participants with a missing remoteness classification. 81 Table order based on national proportions (highest to lowest). 82 Note: Since 2017-18 Q1, the disability groups Developmental Delay and Global Developmental Delay have been reported separately to the Intellectual Disability group. 83 Down Syndrome is included in Intellectual Disability, representing 4% of all Scheme participants in NSW (3,553).

March 2019 | COAG Disability Reform Council Quarterly Report 103
Table F.11 Participant profile per quarter by level of function – NSW84
Prior Quarters 2018-19 Q3 Total
Level of Function N % N % N %
1 (High Function) 5,146 5% 473 11% 5,619 6%
2 (High Function) 207 0% 7 0% 214 0%
3 (High Function) 5,112 5% 261 6% 5,373 5%
4 (High Function) 8,089 9% 384 9% 8,473 9%
5 (High Function) 7,299 8% 350 8% 7,649 8%
6 (Moderate Function) 15,630 17% 838 20% 16,468 17%
7 (Moderate Function) 7,017 7% 196 5% 7,213 7%
8 (Moderate Function) 6,485 7% 167 4% 6,652 7%
9 (Moderate Function) 563 1% 12 0% 575 1%
10 (Moderate Function) 9,960 11% 304 7% 10,264 10%
11 (Low Function) 4,076 4% 69 2% 4,145 4%
12 (Low Function) 14,273 15% 365 9% 14,638 15%
13 (Low Function) 7,212 8% 773 18% 7,985 8%
14 (Low Function) 2,459 3% 17 0% 2,476 3%
15 (Low Function) 38 0% 0 0% 38 0%
Missing 83 0 83
Total 93,649 100% 4,216 100% 97,865 100%
Table F.12 Participant profile per quarter by Age group – NSW
Prior Quarters 2018-19 Q3 Total
Age Group N % N % N %
0 to 6 11,123 12% 2,016 48% 13,139 13%
7 to 14 23,366 25% 674 16% 24,040 25%
15 to 18 7,183 8% 194 5% 7,377 8%
19 to 24 9,882 11% 97 2% 9,979 10%
25 to 34 9,010 10% 163 4% 9,173 9%
35 to 44 8,358 9% 247 6% 8,605 9%
45 to 54 10,225 11% 331 8% 10,556 11%
55 to 64 11,827 13% 459 11% 12,286 13%
65+ 2,675 3% 35 1% 2,710 3%
Total 93,649 100% 4,216 100% 97,865 100%
Table F.13 Participant profile per quarter by Gender – NSW
Prior Quarters 2018-19 Q3 Total
Gender N % N % N %
Male 58,599 63% 2,717 64% 61,316 63%
Female 34,062 36% 1,417 34% 35,479 36%
Indeterminate 988 1% 82 2% 1,070 1%
Total 93,649 100% 4,216 100% 97,865 100%
84 An ICT issue has been identified and as a result, reporting by level of function is not accurate. This issue is currently
under investigation and will be reconciled for reporting as at 30 June 2019.

March 2019 | COAG Disability Reform Council Quarterly Report 104
Part Two: Participant experience and outcomes
Table F.14 Number of questionnaires completed by SFOF version - NSW 85
Version
Number of questionnaires
collected 2016-17
Number of questionnaires
collected 2017-18
Number of questionnaires collected YTD
2018-19
Number of questionnaires
Participant 0 to school
2,960 5,890 4,637 13,487
Participant school to 14
7,845 11,330 4,086 23,261
Participant 15 to 24 6,187 6,240 1,138 13,565
Participant 25 and over
15,197 17,622 4,474 37,293
Total Participant 32,189 41,082 14,335 87,606
Family 0 to 14 10,086 16,846 8,597 35,529
Family 15 to 24 1,462 4,032 849 6,343
Family 25 and over 396 4,876 1,516 6,788
Total Family 11,944 25,754 10,962 48,660
Total 44,133 66,836 25,297 136,266
Table F.15 Selected key indicators for participants – Daily Living (DL) and Choice and Control (CC) - NSW
Indicator 0 to before
school School to 14
15 to 24 25 and over
DL
% with concerns in 6 or more of the areas: gross motor skills, fine motor skills, self-care, eating, social interaction, communication, cognitive development, sensory processing
70%
CC % who say their child is able to tell them what he/she wants
70%
DL % developing functional, learning and coping skills appropriate to their ability and circumstances
28%
DL % who say their child is becoming more independent
40%
CC % of children who have a genuine say in decisions about themselves
62%
CC % who are happy with the level of independence/control they have now
37%
CC % who choose who supports them 34% 54%
CC % who choose what they do each day 44% 63%
CC % who had been given the opportunity to participate in a self-advocacy group meeting
22% 28%
CC % who want more choice and control in their life
80% 76%
85 Baseline outcomes for participants and/or their families and carers were collected for 99% of participants.

March 2019 | COAG Disability Reform Council Quarterly Report 105
Table F.16 Selected key indicators for participants – Relationships (REL) and Social/Community Participation (S/CP) – NSW
Indicator 0 to before
school School to
14 15 to 24
25 and over
REL % of children who can make friends with people outside the family
62% 62%
S/CP % of children who participate in age appropriate community, cultural or religious activities
52%
REL % of children who spend time after school and on weekends with friends and/or in mainstream programs
35%
REL Of these, % who are welcomed or actively included
61% 75%
REL % of children who spend time with friends without an adult present
10%
REL % with no friends other than family or paid staff
30% 28%
S/CP % who have been actively involved in a community, cultural or religious group in the last 12 months
31% 35%
Table F.17 Selected key indicators for participants – Lifelong Learning (LL), Work (WK), Home (HM) and Health and Wellbeing
(HW) – NSW
Indicator 0 to before
school School to
14 15 to 24
25 and over
LL % of children attending school in a mainstream class
56%
HM % who are happy with their home 81% 74%
HM % who feel safe or very safe in their home
86% 75%
HW % who rate their health as good, very good or excellent
68% 47%
HW % who did not have any difficulties accessing health services
66% 64%
LL % who currently attend or previously attended school in a mainstream class
29%
LL % who participate in education, training or skill development
12%
LL Of those who participate, % who do so in mainstream settings
56%
LL % unable to do a course or training they wanted to do in the last 12 months
35%
WK % who have a paid job 17% 27%
WK % who volunteer 12% 12%

March 2019 | COAG Disability Reform Council Quarterly Report 106
Table F.18 Selected key indicators for families/carers of participants – NSW
Indicator 0 to 14 15 to 24 25 and over
% receiving Carer Payment 24% 25% 22%
% receiving Carer Allowance 54% 48% 31%
% working in a paid job 48% 51% 36%
Of those in a paid job, % in permanent employment
75% 76% 78%
Of those in a paid job, % working 15 hours or more
78% 86% 85%
% who say they (and their partner) are able to work as much as they want
40% 48% 56%
Of those unable to work as much as they want, % who say the situation of their child/family member with disability is a barrier to working more
86% 90% 88%
Of those unable to work as much as they want, % who say insufficient flexibility of jobs is a barrier to working more
40% 33% 22%
% able to advocate for their child/family member
78% 70% 64%
% who have friends and family they see as often as they like
46% 46% 47%
% who feel very confident or somewhat confident in supporting their child's development
85%
% who know what their family can do to enable their family member with disability to become as independent as possible
39%
% who feel in control selecting services 37% 36%
% who have made plans (or begun to make plans) for when they are no longer able to care for their family member with disability
34%
% who rate their health as good, very good or excellent
73% 61% 59%
Table F.19 Results for “Has the NDIS helped?” questions answered at review, for SFOF version ‘Participant 0 to school’
(n=1,784)– NSW86
Question % Yes
DL Has the NDIS improved your child's development? 93%
DL Has the NDIS improved your child's access to specialist services? 89%
CC Has the NDIS helped increase your child's ability to communicate what they want?
85%
REL Has the NDIS improved how your child fits into family life? 75%
S/CP Has the NDIS improved how your child fits into community life? 62%
86 Results in Tables F.19 to F.22 exclude participants who had their first plan approved between 1 July 2016 and 31
March 2017, as these participants have been included in Tables F.23 to F.26.

March 2019 | COAG Disability Reform Council Quarterly Report 107
Table F.20 Results for “Has the NDIS helped?” questions answered at review, for SFOF version ‘Participant school to 14'
(n=9,636) – NSW
Question % Yes
DL Has the NDIS helped your child to become more independent? 54%
LL Has the NDIS improved your child's access to education? 34%
REL Has the NDIS improved your child's relationships with family and friends?
43%
S/CP Has the NDIS improved your child's social and recreational life? 39%
Table F.21 Results for “Has the NDIS helped?” questions answered at review, for SFOF versions ‘Participant 15 to 24' (n=5,313)
and 'Participant 25 and over' (n=13,402) – NSW
Question 15 to 24 % Yes
25+ % Yes
CC Has the NDIS helped you have more choices and more control over your life?
59% 67%
DL Has the NDIS helped you with daily living activities? 57% 69%
REL Has the NDIS helped you to meet more people? 49% 53%
HM Has your involvement with the NDIS helped you to choose a home that's right for you?
20% 28%
HW Has your involvement with the NDIS improved your health and wellbeing?
40% 49%
LL Has your involvement with the NDIS helped you to learn things you want to learn or to take courses you want to take?
35% 30%
WK Has your involvement with the NDIS helped you find a job that's right for you?
19% 22%
S/CP Has the NDIS helped you be more involved? 53% 58%
Table F.22 Results for “Has the NDIS helped?” questions answered at review, for SFOF version ‘Family 0 to 14’ (n=10,634); and
for SFOF versions ‘Family 15 to 24’ and ‘Family 25 and over’ combined (n=4,607) – NSW
Question 0 to 14 % Yes
15+ % Yes
Has the NDIS improved your capacity to advocate (stand up) for your child? / Has the NDIS helped you to know your rights and advocate effectively?
54% 46%
Has the NDIS improved the level of support for your family? 58% 59%
Has the NDIS improved your access to services, programs and activities in the community? / Has the NDIS helped you to access services, programs and activities in the community?
62% 56%
Has the NDIS improved your ability/capacity to help your child develop and learn?
67%
Has the NDIS improved your health and wellbeing? 36% 33%

March 2019 | COAG Disability Reform Council Quarterly Report 108
Table F.23 Results for “Has the NDIS helped?” questions answered at end of participant's first and second years in the
Scheme, for SFOF version ‘Participant 0 to school’ – NSW87
Question Year 1 Year 2 Change
DL Has the NDIS improved your child's development? 92% 94% +2%
DL Has the NDIS improved your child's access to specialist services? 90% 89% -1%
CC Has the NDIS helped increase your child's ability to communicate what they want?
84% 87% +3%
REL Has the NDIS improved how your child fits into family life? 73% 75% +2%
S/CP Has the NDIS improved how your child fits into community life? 59% 59% +1%
Table F.24 Results for “Has the NDIS helped?” questions answered at end of participant's first and second years in the
Scheme, for SFOF version ‘Participant school to 14' – NSW
Question Year 1 Year 2 Change
DL Has the NDIS helped your child to become more independent? 53% 61% +8%
LL Has the NDIS improved your child's access to education? 35% 37% +2%
REL Has the NDIS improved your child's relationships with family and friends?
43% 48% +5%
S/CP Has the NDIS improved your child's social and recreational life? 41% 45% +4%
Table F.25 Results for “Has the NDIS helped?” questions answered at end of participant's first and second years in the
Scheme, for SFOF versions ‘Participant 15 to 24' and 'Participant 25 and over' – NSW
15 to 24 25 and over
Question Year 1 Year 2 Change Year 1 Year 2 Change
CC Has the NDIS helped you have more choices and more control over your life?
62% 66% +4% 67% 74% +7%
DL Has the NDIS helped you with daily living activities?
59% 67% +7% 71% 79% +9%
REL Has the NDIS helped you to meet more people?
55% 58% +3% 53% 61% +7%
HM Has your involvement with the NDIS helped you to choose a home that's right for you?
26% 21% -4% 31% 32% +1%
HW Has your involvement with the NDIS improved your health and wellbeing?
44% 46% +2% 51% 57% +6%
LL Has your involvement with the NDIS helped you to learn things you want to learn or to take courses you want to take?
42% 41% -2% 32% 33% +2%
WK Has your involvement with the NDIS helped you find a job that's right for you?
21% 19% -2% 21% 20% -1%
S/CP Has the NDIS helped you be more involved? 57% 61% +4% 60% 68% +7%
87 Results in Tables F.23 to F.27 include participants who had their first plan approved between 1 July 2016 and 31
March 2017. While this is a relatively small group of participants, the number of participants included in these tables will grow over time.

March 2019 | COAG Disability Reform Council Quarterly Report 109
Table F.26 Results for “Has the NDIS helped?” questions answered at end of participant's first and second years in the
Scheme, for SFOF version ‘Family 0 to 14’; and for SFOF versions ‘Family 15 to 24’ and ‘Family 25 and over’ combined – NSW
0 to 14 15 and over
Question Year 1 Year 2 Change Year 1 Year 2 Change
Has the NDIS improved your capacity to advocate (stand up) for your child? / Has the NDIS helped you to know your rights and advocate effectively?
48% 53% +5% 45% 48% +3%
Has the NDIS improved the level of support for your family?
56% 62% +6% 56% 63% +7%
Has the NDIS improved your access to services, programs and activities in the community? / Has the NDIS helped you to access services, programs and activities in the community?
59% 65% +6% 55% 62% +7%
Has the NDIS improved your ability/capacity to help your child develop and learn?
64% 69% +6%
Has the NDIS improved your health and wellbeing?
35% 36% +1% 31% 31% 0%
Table F.27 Progress against the NDIA’s corporate plan metrics for ‘participants in work’ and ‘participants in community and
social activities’ –NSW88
Participants in work Baseline Year 2 2018–19 Target
Aged 15 to 24 years 13% 22%
26% Aged 25+ 26% 24%
Aged 15+ (average) 22% 23%
Participants in community and social activities Baseline Year 2 2018–19 Target
Aged 15 to 24 years 31% 45%
41% Aged 25+ 36% 47%
Aged 15+ (average) 34% 47%
88 Results are drawn from participants’ responses to SFOF questionnaires, and only include participants who had their
first plan approved between 1 July 2016 and 31 March 2017.

March 2019 | COAG Disability Reform Council Quarterly Report 110
Figure F.1 Proportion of participants describing satisfaction with the Agency planning process as good or very good by
quarter – Existing survey administered by NDIA regions (NSW)*
*Of the participants describing satisfaction with the Agency planning process in Q3 of 2018-19, 95% gave a rating of good or very good,
3% gave a neutral rating and 2% gave a rating of poor or very poor.
Table F.28 Proportion of Participants rating their level of agreement as strongly agree, agree, neutral, disagree or strongly
disagree in response to statements about the planning process – Existing survey administered by NDIA regions (NSW)
Agree /
strongly agree
Neutral Disagree / strongly disagree
The planner listened to me 96% 2% 1%
I had enough time to tell my story and say what support I need
94% 5% 1%
The planner knows what I can do well 88% 10% 2%
The planner had some good ideas for my plan 89% 9% 2%
I know what is in my plan 83% 12% 5%
The planner helped me think about my future 86% 10% 4%
I think my plan will make my life better 91% 7% 2%
The planning meeting went well 96% 3% 1%
Table F.29 Plan reviews conducted per quarter – excluding plans less than 30 days – NSW89
Prior Quarters
(Transition only)
2018-19 Q3 Transition
Total
Total plan reviews 111,314 22,536 133,850
Early intervention plans 15,646 3,153 18,799
Permanent disability plans 95,668 19,383 115,051
89 Plans less than 30 days in duration have been excluded from this tabulation, as these reviews are more likely to
represent corrections to the plan rather than a new plan review to address a change in circumstance.

March 2019 | COAG Disability Reform Council Quarterly Report 111
Table F.30 Scheduled plan reviews conducted by quarter – excluding plans less than 30 days – NSW
Prior Quarters
(Transition only) 2018-19 Q3 Transition Total
Total scheduled plan reviews 86,898 19,920 106,818
Trial participants 17,787 2,026 19,813
Transition participants 69,111 17,894 87,005
Table F.31 Unscheduled plan reviews conducted by quarter – excluding plans less than 30 days – NSW
Prior Quarters
(Transition only) 2018-19 Q3 Transition Total
Total unscheduled plan reviews 24,416 2,616 27,032
Trial participants 2,882 169 3,051
Transition participants 21,534 2,447 23,981
Table F.32 Estimated rate of unscheduled plan reviews – excluding plans less than 30 days – NSW90
Prior Quarters
(Transition only)
2018-19 Q3 Transition
Total
% unscheduled reviews 17.7% 10.6% 16.6%
Table F.33 AAT Cases by category – NSW
Prior Quarters 2018-19 Q3 Total
Category N % N % N %
Access 288 39% 15 15% 303 36%
Plan 334 45% 57 55% 391 47%
Plan Review 87 12% 16 16% 103 12%
Other 26 4% 15 15% 41 5%
Total 735 100% 103 100% 838 100%
% of all access decisions91
0.37% 0.33% 0.36%
Table F.34 AAT cases by open/closed and decision – NSW
N
AAT Cases 838
Open AAT Cases 275
Closed AAT Cases 563
Resolved before hearing 540
Gone to hearing and received a substantive decision
23*
*Of the 23 cases which went to hearing and received a substantive decision: 12 affirmed the Agency’s decision, 6 varied the Agency’s decision and 5 set aside the Agency’s decision.
Table F.35 Distribution of active participants by method of Financial Plan Management and quarter of plan approval – NSW
Prior Quarters
(Transition only) 2018-19 Q3 Total
Self-managed fully 14% 15% 14%
Self-managed partly 9% 11% 10%
Plan managed 23% 30% 25%
Agency managed 54% 44% 51%
Total 100% 100% 100%
90 This is calculated as the number of unscheduled reviews divided by the total number of participants. The number of participants used in the calculation considers the length of time the participants have been in the Scheme. 91 This is calculated as the number of appeals divided by the number of access decisions made. The number of access decisions used in the calculation considers the length of time since the access decisions have been made.

March 2019 | COAG Disability Reform Council Quarterly Report 112
Table F.36 Distribution of active participants by support coordination and quarter of plan approval – NSW
Prior Quarters
(Transition only) 2018-19 Q3 Total
Support coordination 34% 38% 35%
Table F.37 Duration to plan activation by quarter of initial plan approval for active participants – NSW92,93
Prior Quarters
(Transition Only) 2018-19 Q1
Plan activation N % N %
Less than 30 days 51,681 69% 3,257 64%
30 to 59 days 8,645 12% 766 15%
60 to 89 days 3,944 5% 286 6%
Activated within 90 days
64,270 86% 4,309 84%
90 to 119 days 2,263 3% 149 3%
120 days and over 5,684 8% 216 4%
Activated between 90 and 180 days
7,947 11% 365 7%
No payments 2,257 3% 430 8%
Total plans approved 74,474 100% 5,104 100%
92 Note: Plans approved after the end of 2018-19 Q1 have been excluded from the table. They are relatively new and it is too early to examine their durations to activation. 93 There has been a change in methodology used to calculate these results since the previous quarter. Duration to plan
activation is now calculated as the time from a participant’s initial plan approval to when the participant first uses plan
supports (previously only the initial plan for each participant was considered). In-kind supports are now also included
(previously excluded). As a result, a higher proportion of participants are identified as activating their plans within 90
days, and a lower proportion have no payments.

March 2019 | COAG Disability Reform Council Quarterly Report 113
Table F.38 Proportion of active participants with plan activated within 12 months – NSW
Number of participants
activated within 12 months
All participants with duration of
at least 12 months
Proportion activated
by Aboriginal and Torres Strait Islander status
Aboriginal and Torres Strait Islander 3,556 3,801 94%
Not Aboriginal and Torres Strait Islander 63,315 65,788 96%
Not Stated 2,481 2,573 96%
Total 69,352 72,162 96%
by Culturally and Linguistically Diverse status
CALD 6,026 6,249 96%
Not CALD 63,079 65,657 96%
Not Stated 247 256 96%
Total 69,352 72,162 96%
by Remoteness
Major Cities 49,897 51,893 96%
Regional 19,235 20,034 96%
Remote 97 103 94%
Missing 123 132 93%
Total 69,352 72,162 96%
by Primary Disability type
Autism 20,241 20,986 96% Intellectual Disability (including Down Syndrome) 21,194 21,934 97%
Psychosocial Disability 5,034 5,300 95% Developmental Delay (including Global Developmental Delay) 1,957 2,039 96%
Other 20,926 21,903 96%
Total 69,352 72,162 96%
Table F.39 Distribution of plans by plan utilisation and quarter of plan approval for 2016-17, 2017-18 and quarter 1 of 2018-19–
NSW94,95
Plan utilisation Prior Quarters
(Transition only) 2018-19 Q1 Total
0% to 50% 36% 66% 37% 50% to 75% 23% 20% 23% > 75% 41% 14% 40%
Total 100% 100% 100%
94 This table only considers committed supports and payments for supports provided to 31 December 2018. This gives some allowance for the timing delay between when the support is provided and when it is paid. 95 Plans less than 30 days in duration have been excluded from this tabulation, as these plans are more likely to represent corrections to the plan rather than an unscheduled plan review to address a change in circumstance.

March 2019 | COAG Disability Reform Council Quarterly Report 114
Table F.40 Proportion of active participants with approved plans accessing mainstream supports - NSW
Prior Quarters 2018-19 Q3 Total
Daily Activities 7% 9% 8%
Health & Wellbeing 52% 55% 53%
Lifelong Learning 11% 12% 11%
Other 10% 10% 10%
Non-categorised 32% 31% 31%
Any mainstream service 93% 95% 93%
Part Three: Providers and the growing market
Table F.41 Key provider indicators by quarter - NSW96,97
Prior Quarters 2018-19 Q3 Total
Provider indicators
a) Registrations by profile
Individual/ sole trader 3,962 92 3,828
Company/ organisation 4,962 101 4,888
Total 8,924 193 8,716
b) Registration revoked 401
96 The total number of providers as at 31 March 2019 (8,716) is not the sum of the number of providers as at 31
December 2018 (8,924) and the providers registered in the third quarter of 2018-19 (193). This is due to 401 providers whose registration ended during the third quarter of 2018-19. 97 The large number of revoked providers in 2018-19 Q3 reflects differences in the renewal process for providers under
the NDIS Quality and Safeguards Commission (NQSC).

March 2019 | COAG Disability Reform Council Quarterly Report 115
Table F.42 Number of approved providers by registration group - NSW98
Registration Group Prior
Quarters 2018-19
Q3 Total % Change
Assistance services
Accommodation / Tenancy Assistance 878 17 895 2%
Assistance Animals 11 3 14 27%
Assistance with daily life tasks in a group or shared living arrangement
564 25 589 4%
Assistance with travel/transport arrangements 1,710 23 1,733 1%
Daily Personal Activities 843 37 880 4%
Group and Centre Based Activities 744 27 771 4%
High Intensity Daily Personal Activities 722 21 743 3%
Household tasks 2,402 40 2,442 2%
Interpreting and translation 353 0 353 0%
Participation in community, social and civic activities 970 44 1,014 5%
Assistive Technology
Assistive equipment for recreation 785 16 801 2%
Assistive products for household tasks 970 15 985 2%
Assistance products for personal care and safety 1,351 24 1,375 2%
Communication and information equipment 665 16 681 2%
Customised Prosthetics 565 7 572 1%
Hearing Equipment 237 4 241 2%
Hearing Services 13 2 15 15%
Personal Mobility Equipment 1,139 11 1,150 1%
Specialised Hearing Services 65 3 68 5%
Vision Equipment 286 2 288 1%
Capacity Building Services
Assistance in coordinating or managing life stages, transitions and supports
823 34 857 4%
Behaviour Support 512 28 540 5%
Community nursing care for high needs 622 13 635 2%
Development of daily living and life skills 900 38 938 4%
Early Intervention supports for early childhood 1,301 43 1,344 3%
Exercise Physiology and Physical Wellbeing activities
991 5 996 1%
Innovative Community Participation 1,220 27 1,247 2%
Specialised Driving Training 277 6 283 2%
Therapeutic Supports 4,096 81 4,177 2%
Capital services
Home modification design and construction 1,032 6 1,038 1%
Specialised Disability Accommodation 336 5 341 1%
Vehicle Modifications 166 0 166 0%
Choice and control support services
Management of funding for supports in participants plan
988 16 1,004 2%
Support Coordination 749 22 771 3%
Employment and Education support services
Assistance to access and/or maintain employment and/or education
445 12 457 3%
Specialised Supported Employment 136 1 137 1%
Total approved providers 8,523 193 8,716 2%
98 The 401 providers whose registration ended during the third quarter of 2018-19 are not included in the 2018-19 Q2 and prior numbers in this table.

March 2019 | COAG Disability Reform Council Quarterly Report 116
Table F.43 Key markets indicators by quarter - NSW
Market indicators Prior Quarters 2018-19 Q3
a) Average number of providers per participant 1.66 1.62
b) Number of providers delivering new supports 1,077 911
c) Change in the number of active/inactive providers:
Active (%) 47% 47%
Not yet active (%) 42% 39%
Inactive (%) 12% 15%
d) Share of payments - top 25%
Daily Tasks/Shared Living (%) 91% 91%
Therapeutic Supports (%) 88% 89%
Participate Community (%) 85% 85%
Early Childhood Supports (%) 91% 90%
Assist Personal Activities (%) 87% 87%

March 2019 | COAG Disability Reform Council Quarterly Report 117
Table F.44 Cumulative number of providers that have been active by registration group - NSW
Registration Group Prior
Quarters 2018-19
Q3 Total % Change
Assistance services
Accommodation / Tenancy Assistance 126 16 142 13%
Assistance Animals 2 0 2 0%
Assistance with daily life tasks in a group or shared living arrangement
335 15 350 4%
Assistance with travel/transport arrangements 453 32 485 7%
Daily Personal Activities 623 30 653 5%
Group and Centre Based Activities 448 17 465 4%
High Intensity Daily Personal Activities 529 17 546 3%
Household tasks 1,219 49 1,268 4%
Interpreting and translation 56 2 58 4%
Participation in community, social and civic activities 716 25 741 3%
Assistive Technology
Assistive equipment for recreation 114 7 121 6%
Assistive products for household tasks 108 13 121 12%
Assistance products for personal care and safety 596 41 637 7%
Communication and information equipment 128 8 136 6%
Customised Prosthetics 238 11 249 5%
Hearing Equipment 54 1 55 2%
Hearing Services 1 0 1 0%
Personal Mobility Equipment 294 13 307 4%
Specialised Hearing Services 8 0 8 0%
Vision Equipment 31 4 35 13%
Capacity Building Services
Assistance in coordinating or managing life stages, transitions and supports
578 29 607 5%
Behaviour Support 278 13 291 5%
Community nursing care for high needs 167 9 176 5%
Development of daily living and life skills 549 25 574 5%
Early Intervention supports for early childhood 634 23 657 4%
Exercise Physiology and Physical Wellbeing activities
355 25 380 7%
Innovative Community Participation 168 20 188 12%
Specialised Driving Training 78 4 82 5%
Therapeutic Supports 2,667 96 2,763 4%
Capital services
Home modification design and construction 165 15 180 9%
Specialised Disability Accommodation 70 8 78 11%
Vehicle Modifications 40 3 43 8%
Choice and control support services
Management of funding for supports in participants plan
430 18 448 4%
Support Coordination 186 10 196 5%
Employment and Education support services
Assistance to access and/or maintain employment and/or education
197 5 202 3%
Specialised Supported Employment 93 0 93 0%
Total approved active providers 5,145 198 5,343 4%

March 2019 | COAG Disability Reform Council Quarterly Report 118
Table F.45 Number of approved and active providers in each registration group by legal entity type as at 31 March 2019 – NSW
Registration Group
Approved Active
Individual/ sole trader
Company/ organisation
Total Approved
Individual/ sole trader
Company/ organisation
Total Active
Assistance services
Accommodation / Tenancy Assistance
167 728 895 25 117 142
Assistance Animals 0 14 14 0 2 2
Assistance with daily life tasks in a group or shared living arrangement
44 545 589 16 334 350
Assistance with travel/transport arrangements
451 1,282 1,733 109 376 485
Daily Personal Activities 64 816 880 48 605 653
Group and Centre Based Activities
53 718 771 20 445 465
High Intensity Daily Personal Activities
53 690 743 34 512 546
Household tasks 852 1,590 2,442 461 807 1,268
Interpreting and translation 65 288 353 20 38 58
Participation in community, social and civic activities
84 930 1,014 61 680 741
Assistive Technology Assistive equipment for recreation
215 586 801 20 101 121
Assistive products for household tasks
255 730 985 18 103 121
Assistance products for personal care and safety
342 1,033 1,375 105 532 637
Communication and information equipment
232 449 681 35 101 136
Customised Prosthetics 161 411 572 63 186 249
Hearing Equipment 31 210 241 4 51 55
Hearing Services 0 15 15 0 1 1
Personal Mobility Equipment 345 805 1,150 51 256 307
Specialised Hearing Services
20 48 68 1 7 8
Vision Equipment 59 229 288 4 31 35
Capacity Building Services Assistance in coordinating or managing life stages, transitions and supports
99 758 857 61 546 607
Behaviour Support 141 399 540 70 221 291
Community nursing care for high needs
89 546 635 32 144 176
Development of daily living and life skills
92 846 938 49 525 574
Early Intervention supports for early childhood
649 695 1,344 292 365 657
Exercise Physiology and Physical Wellbeing activities
358 638 996 127 253 380
Innovative Community Participation
413 834 1,247 60 128 188
Specialised Driving Training 62 221 283 33 49 82
Therapeutic Supports 2,140 2,037 4,177 1,367 1,396 2,763
Capital services Home modification design and construction
290 748 1,038 28 152 180
Specialised Disability Accommodation
31 310 341 1 77 78
Vehicle Modifications 19 147 166 8 35 43
Choice and control support services
Management of funding for supports in participants plan
176 828 1,004 79 369 448

March 2019 | COAG Disability Reform Council Quarterly Report 119
Registration Group
Approved Active
Individual/ sole trader
Company/ organisation
Total Approved
Individual/ sole trader
Company/ organisation
Total Active
Support Coordination 84 687 771 18 178 196
Employment and Education support services
Assistance to access and/or maintain employment and/or education
45 412 457 14 188 202
Specialised Supported Employment
2 135 137 0 93 93
Total 3,828 4,888 8,716 2,228 3,115 5,343
Table F.46 Proportion of approved and active providers in each registration group by legal entity type as at 31 March 2019 –
NSW
Registration Group
Approved Active
Individual/ sole trader
Company/ organisation
Total Approved
Individual/ sole trader
Company/ organisation
Total Active
Assistance services
Accommodation / Tenancy Assistance
19% 81% 895 18% 82% 142
Assistance Animals 0% 100% 14 0% 100% 2
Assistance with daily life tasks in a group or shared living arrangement
7% 93% 589 5% 95% 350
Assistance with travel/transport arrangements
26% 74% 1,733 22% 78% 485
Daily Personal Activities 7% 93% 880 7% 93% 653
Group and Centre Based Activities
7% 93% 771 4% 96% 465
High Intensity Daily Personal Activities
7% 93% 743 6% 94% 546
Household tasks 35% 65% 2,442 36% 64% 1,268
Interpreting and translation 18% 82% 353 34% 66% 58
Participation in community, social and civic activities
8% 92% 1,014 8% 92% 741
Assistive Technology Assistive equipment for recreation
27% 73% 801 17% 83% 121
Assistive products for household tasks
26% 74% 985 15% 85% 121
Assistance products for personal care and safety
25% 75% 1,375 16% 84% 637
Communication and information equipment
34% 66% 681 26% 74% 136
Customised Prosthetics 28% 72% 572 25% 75% 249
Hearing Equipment 13% 87% 241 7% 93% 55
Hearing Services 0% 100% 15 0% 100% 1
Personal Mobility Equipment 30% 70% 1,150 17% 83% 307
Specialised Hearing Services
29% 71% 68 13% 88% 8
Vision Equipment 20% 80% 288 11% 89% 35
Capacity Building Services Assistance in coordinating or managing life stages, transitions and supports
12% 88% 857 10% 90% 607
Behaviour Support 26% 74% 540 24% 76% 291
Community nursing care for high needs
14% 86% 635 18% 82% 176
Development of daily living and life skills
10% 90% 938 9% 91% 574
Early Intervention supports for early childhood
48% 52% 1,344 44% 56% 657

March 2019 | COAG Disability Reform Council Quarterly Report 120
Registration Group
Approved Active
Individual/ sole trader
Company/ organisation
Total Approved
Individual/ sole trader
Company/ organisation
Total Active
Exercise Physiology and Physical Wellbeing activities
36% 64% 996 33% 67% 380
Innovative Community Participation
33% 67% 1,247 32% 68% 188
Specialised Driving Training 22% 78% 283 40% 60% 82
Therapeutic Supports 51% 49% 4,177 49% 51% 2,763
Capital services Home modification design and construction
28% 72% 1,038 16% 84% 180
Specialised Disability Accommodation
9% 91% 341 1% 99% 78
Vehicle Modifications 11% 89% 166 19% 81% 43
Choice and control support services
Management of funding for supports in participants plan
18% 82% 1,004 18% 82% 448
Support Coordination 11% 89% 771 9% 91% 196
Employment and Education support services
Assistance to access and/or maintain employment and/or education
10% 90% 457 7% 93% 202
Specialised Supported Employment
1% 99% 137 0% 100% 93
Total 44% 56% 8,716 42% 58% 5,343

March 2019 | COAG Disability Reform Council Quarterly Report 121
Part Five: Financial sustainability
Table F.47 Committed supports by financial year ($m) - NSW
2013-14 2014-15 2015-16 2016-17 2017-18 2018-19 Q1,
Q2,Q399 Total
Total Committed
50.6 184.5 349.4 1,786.3 4,306.6 4,421.2 11,098.7
Figure F.2 Distribution of participants by annualised committed support band (including participants with Supported
Independent Living supports) – active participants with initial plan approvals as at 2018-19 Q3 compared with active
participants with initial plan approvals as at 2018-19 Q2 (NSW)
99 Note: the $4.4 billion in respect of 2018-19 Q1, Q2 and Q3 only includes committed supports expected to be used to 31 March 2019.
0.00%
2.00%
4.00%
6.00%
8.00%
10.00%
12.00%
14.00%
16.00%
18.00%
Dis
trib
uti
on
o
f p
art
icip
an
ts
Average annualised committed supports band
As at Q2 2018-19 distribution of participants As at Q3 2018-19 distribution of participants

March 2019 | COAG Disability Reform Council Quarterly Report 122
Figure F.3 Distribution of participants by annualised committed support band (excluding participants with Supported
Independent Living supports) – active participants with initial plan approvals as at 2018-19 Q3 compared with active
participants with initial plan approvals as at 2018-19 Q2 (NSW)
0.00%
2.00%
4.00%
6.00%
8.00%
10.00%
12.00%
14.00%
16.00%
18.00%
20.00%
Dis
trib
uti
on
o
f p
art
icip
an
ts
Average annualised committed supports band
As at Q2 2018-19 distribution of participants As at Q3 2018-19 distribution of participants

March 2019 | COAG Disability Reform Council Quarterly Report 123
Figure F.4 Average committed support by age group (including participants with Supported Independent Living supports) –
active participants with initial plan approvals as at 2018-19 Q3 compared with active participants with initial plan approvals as
at 2018-19 Q2 (NSW) 100
100 The average revenue amounts have been removed from the figure in this report as the amounts refer to revenue received under the bilateral agreements, and are not linked to age group, primary disability group, and level of function. Therefore, it is not appropriate to make comparisons between revenue and plan budgets in this chart. The amount of revenue received in aggregate should be compared with the amount spent in aggregate – the NDIA has been within budget in all years of operation (including 2018-19).
$0
$20,000
$40,000
$60,000
$80,000
$100,000
$120,000
0 to 6 7 to 14 15 to 18 19 to 24 25 to 34 35 to 44 45 to 54 55 to 64 65+
Av
era
ge
an
nu
ali
se
d c
om
mit
ted
su
pp
ort
s
Age group
As at Q3 2018-19 actual average annualised committed supports
As at Q2 2018-19 actual average annualised committed supports

March 2019 | COAG Disability Reform Council Quarterly Report 124
Figure F.5 Average committed support by primary disability group (including participants with Supported Independent Living
supports) – active participants with initial plan approvals as at 2018-19 Q3 compared with active participants with initial plan
approvals as at 2018-19 Q2 (NSW) 101
101 Ibid.
$0 $20,000 $40,000 $60,000 $80,000 $100,000 $120,000 $140,000
Acquired Brain Injury
Autism
Cerebral Palsy
Developmental Delay
Global Developmental Delay
Hearing Impairment
Intellectual Disability
Multiple Sclerosis
Psychosocial disability
Spinal Cord Injury
Stroke
Visual Impairment
Other Neurological
Other Physical
Other Sensory/Speech
Other
Average annualised committed supports
Pri
ma
ry d
isa
bil
ity
As at Q2 2018-19 actual average annualised committed supports
As at Q3 2018-19 actual average annualised committed supports

March 2019 | COAG Disability Reform Council Quarterly Report 125
Figure F.6 Average committed support by level of function (including participants with Supported Independent Living
supports) – active participants with initial plan approvals as at 2018-19 Q3 compared with active participants with initial plan
approvals as at 2018-19 Q2 (NSW) 102,103
102 Ibid. 103 An ICT issue has been identified and as a result, reporting by level of function is not accurate. This issue is currently
under investigation and will be reconciled for reporting as at 30 June 2019.
$0
$50,000
$100,000
$150,000
$200,000
$250,000
$300,000
1 2 3 4 5 6 7 8 9 10 11 12 13 14 15
Av
era
ge
an
nu
ali
se
d c
os
t
Level of function
As at Q3 2018-19 actual average annualised committed supports
As at Q2 2018-19 actual average annualised committed supports

March 2019 | COAG Disability Reform Council Quarterly Report 126
Table F.48 Payments by financial year, compared to committed supports ($m) – NSW
2013-14 2014-15 2015-16 2016-17 2017-18 2018-19
Q1,Q2,Q3 Total
Total committed 50.6 184.5 349.4 1,786.3 4,306.6 4,421.2 11,098.7
Total paid 37.4 141.3 257.4 1,215.1 3,082.4 2,903.6 7,637.2
% utilised to date 74% 77% 74% 68% 72% 66% 67%104
Figure F.7 Utilisation of committed supports as at 31 December 2018 and 31 March 2019 (NSW)
104 Note: Only committed supports expected to be used to 31 March 2019 have been used to calculate the utilisation from 1 July 2013 to date, and this will increase as there is a lag between when support is provided and when it is paid.

March 2019 | COAG Disability Reform Council Quarterly Report 127
Appendix G: Appendix G:
Victoria
Part One: Participants and their plans
Table G.1 Plan approvals compared to estimates - VIC
Prior
Quarters 2018-19 Q3
Total excluding
ECEI
Total including
ECEI
Bilateral estimates
VIC 55,854 10,021 65,875 71,770 88,165
Table G.2 Quarterly intake split by plan and entry type since 1 July 2013 – VIC105
Prior Quarters 2018-19 Q3 Total
Access decisions 84,119 8,564 92,683
Access Met 73,484 6,872 80,356
State 50,986 3,951 54,937
Commonwealth 6,675 601 7,276
New 15,823 2,320 18,143
Total Participant Plans 60,722 15,916 71,770
State 38,460 6,520 44,980
Commonwealth 5,351 846 6,197
New 12,043 2,655 14,698
ECEI106 4,868 5,895 5,895
Total Participant Plans 60,722 15,916 71,770
Early Intervention (s25) 7,753 1,420 9,173
Permanent Disability (s24) 48,101 8,601 56,702
ECEI107 4,868 5,895 5,895
Table G.3 Exits from the Scheme since 1 July 2013 as at 31 March 2019 – VIC
Exits
Total participant exits 1,137
Early Intervention participants 140
Permanent disability participants 997
105 The Joint Standing Committee on the NDIS, in its final report on Hearing Services, recommended that the NDIA better understand the eligibility rate for people with a hearing impairment. Of the number of access decisions in 2018-19 Q3, 90% of people with a hearing impairment met the access criteria compared to 80% overall. 106 The number of children supported in the ECEI gateway cannot be summed across quarters as they can transition to NDIS plans, hence the ECEI figure shown is cumulative. 107 Ibid.

March 2019 | COAG Disability Reform Council Quarterly Report 128
Table G.4 Cumulative position by services previously received – VIC108
Participant cohort Bilateral estimate
% of estimate
State Commonwealth New ECEI Total
Trial 2,901 387 1,994 5,282 5,289 100%
End of 2016-17 9,831 1,241 4,357 1,050 16,479 20,205 82%
End of 2017-18 27,601 3,691 7,885 3,024 42,201 50,697 83%
End of 2018-19 Q1 32,782 4,493 9,974 3,595 50,844 58,678 87%
End of 2018-19 Q2 38,460 5,351 12,043 4,868 60,722 75,015 81%
End of 2018-19 Q3 44,980 6,197 14,698 5,895 71,770 88,165 81%
Table G.5 Cumulative position by entry into the Scheme – VIC109
Participant cohort Bilateral estimate
% of estimate
Early
Intervention Permanent Disability
ECEI Total
Trial 1,424 3,858 5,282 5,289 100%
End of 2016-17 2,700 12,729 1,050 16,479 20,205 82%
End of 2017-18 5,236 33,941 3,024 42,201 50,697 83%
End of 2018-19 Q1 6,513 40,736 3,595 50,844 58,678 87%
End of 2018-19 Q2 7,753 48,101 4,868 60,722 75,015 81%
End of 2018-19 Q3 9,173 56,702 5,895 71,770 88,165 81%
Note: in the below tables the percentage figures have been rounded. Therefore, the totals may not
always add up to one hundred per cent.
Table G.6 Participant profile per quarter by Aboriginal and Torres Strait islander status – VIC
Prior Quarters 2018-19 Q3 Total
Participant profile N % N % N %
Aboriginal and Torres Strait Islander 1,243 2.3% 238 2.4% 1,481 2.3%
Not Aboriginal and Torres Strait Islander 49,609 90.6% 8,655 86.5% 58,264 90.0%
Not Stated 3,876 7.1% 1,117 11.2% 4,993 7.7%
Total 54,728 100% 10,010 100% 64,738 100%
Table G.7 Participant profile per quarter by culturally and linguistically diverse (CALD) status – VIC
Prior Quarters 2018-19 Q3 Total
Participant profile N % N % N %
CALD 4,665 8.5% 1,367 13.7% 6,032 9.3%
Not CALD 49,764 90.9% 8,634 86.3% 58,398 90.2%
Not Stated 299 0.5% 9 0.1% 308 0.5%
Total 54,728 100% 10,010 100% 64,738 100%
Table G.8 Participant profile per quarter by Young people in Residential aged care (YPIRAC) status – VIC
Prior Quarters 2018-19 Q3 Total
Participant profile N % N % N %
YPIRAC 805 1.5% 128 1.3% 933 1.4%
Not YPIRAC 53,923 98.5% 9,882 98.7% 63,805 98.6%
Total 54,728 100% 10,010 100% 64,738 100%
108 The total number of participants in previous periods have changed slightly compared to the previous report, due to
corrections in the data. Further, updated lists of clients are provided by State/Territory and Commonwealth governments each quarter. This results in some participants being retrospectively reclassified as State, Commonwealth or New. 109 The total number of participants in previous periods have changed slightly compared to the previous report, due to corrections in the data.

March 2019 | COAG Disability Reform Council Quarterly Report 129
Table G.9 Participant profile per quarter by remoteness – VIC110,111
Prior Quarters 2018-19 Q3 Total
Participant profile N % N % N %
Major Cities 37,149 68.0% 7,848 78.5% 44,997 69.6%
Population > 50,000 6,833 12.5% 446 4.5% 7,279 11.3%
Population between 15,000 and 50,000
3,637 6.7% 665 6.6% 4,302 6.7%
Population between 5,000 and 15,000
3,324 6.1% 507 5.1% 3,831 5.9%
Population less than 5,000 3,671 6.7% 527 5.3% 4,198 6.5%
Remote 32 0.1% 8 0.1% 40 0.1%
Very Remote 2 0.0% 0 0.0% 2 0.0%
Missing 80 9 89
Total 54,728 100% 10,010 100% 64,738 100%
Table G.10 Participant profile per quarter by disability group - VIC112,113
Prior Quarters 2018-19 Q3 Total
Disability N % N % N %
Autism 14,113 26% 2,721 27% 16,834 26%
Intellectual Disability114 15,489 28% 2,139 21% 17,628 27%
Psychosocial disability 6,553 12% 1,355 14% 7,908 12%
Cerebral Palsy 2,466 5% 335 3% 2,801 4%
Other Neurological 2,543 5% 472 5% 3,015 5%
Developmental Delay 3,282 6% 822 8% 4,104 6%
Other Physical 1,703 3% 434 4% 2,137 3%
Hearing Impairment 1,495 3% 463 5% 1,958 3%
ABI 1,779 3% 297 3% 2,076 3%
Visual Impairment 1,625 3% 297 3% 1,922 3%
Multiple Sclerosis 1,474 3% 242 2% 1,716 3%
Global Developmental Delay 641 1% 140 1% 781 1%
Stroke 599 1% 132 1% 731 1%
Spinal Cord Injury 451 1% 81 1% 532 1%
Other Sensory/Speech 434 1% 71 1% 505 1%
Other 81 0% 9 0% 90 0%
Total 54,728 100% 10,010 100% 64,738 100%
110 This table is based on the Modified Monash Model measure of remoteness. 111 The distributions are calculated excluding active participants with a missing remoteness classification. 112 Table order based on national proportions (highest to lowest) 113 Note: Since 2017-18 Q1, the disability groups Developmental Delay and Global Developmental Delay have been reported separately to the Intellectual Disability group. 114 Down Syndrome is included in Intellectual Disability, representing 3% of all Scheme participants in VIC (2,189).

March 2019 | COAG Disability Reform Council Quarterly Report 130
Table G.11 Participant profile per quarter by level of function – VIC115
Prior Quarters 2018-19 Q3 Total
Level of Function N % N % N %
1 (High Function) 3,592 7% 602 6% 4,194 6%
2 (High Function) 187 0% 26 0% 213 0%
3 (High Function) 3,317 6% 560 6% 3,877 6%
4 (High Function) 2,908 5% 617 6% 3,525 5%
5 (High Function) 4,105 8% 634 6% 4,739 7%
6 (Moderate Function) 8,246 15% 1,765 18% 10,011 15%
7 (Moderate Function) 3,499 6% 502 5% 4,001 6%
8 (Moderate Function) 4,687 9% 761 8% 5,448 8%
9 (Moderate Function) 244 0% 52 1% 296 0%
10 (Moderate Function) 6,772 12% 1,153 12% 7,925 12%
11 (Low Function) 2,329 4% 357 4% 2,686 4%
12 (Low Function) 9,326 17% 1,465 15% 10,791 17%
13 (Low Function) 4,120 8% 1,372 14% 5,492 8%
14 (Low Function) 1,270 2% 144 1% 1,414 2%
15 (Low Function) 12 0% 0 0% 12 0%
Missing 114 0 114
Total 54,728 100% 10,010 100% 64,738 100%
Table G.12 Participant profile per quarter by Age group – VIC
Prior Quarters 2018-19 Q3 Total
Age Group N % N % N %
0 to 6 6,905 13% 1,924 19% 8,829 14%
7 to 14 12,244 22% 2,249 22% 14,493 22%
15 to 18 3,808 7% 644 6% 4,452 7%
19 to 24 4,602 8% 722 7% 5,324 8%
25 to 34 5,964 11% 865 9% 6,829 11%
35 to 44 5,777 11% 972 10% 6,749 10%
45 to 54 7,180 13% 1,213 12% 8,393 13%
55 to 64 6,985 13% 1,319 13% 8,304 13%
65+ 1,263 2% 102 1% 1,365 2%
Total 54,728 100% 10,010 100% 64,738 100%
Table G.13 Participant profile per quarter by Gender – VIC
Prior Quarters 2018-19 Q3 Total
Gender N % N % N %
Male 32,497 59% 5,982 60% 38,479 59%
Female 21,611 39% 3,941 39% 25,552 39%
Indeterminate 620 1% 87 1% 707 1%
Total 54,728 100% 10,010 100% 64,738 100%
115 An ICT issue has been identified and as a result, reporting by level of function is not accurate. This issue is currently
under investigation and will be reconciled for reporting as at 30 June 2019.

March 2019 | COAG Disability Reform Council Quarterly Report 131
Part Two: Participant experience and outcomes
Table G.14 Number of questionnaires completed by SFOF version – VIC116
Version
Number of questionnaires
collected 2016-17
Number of questionnaires
collected 2017-18
Number of questionnaires collected YTD
2018-19
Number of questionnaires
Participant 0 to school
1,934 3,444 3,138 8,516
Participant school to 14
1,901 5,330 7,510 14,741
Participant 15 to 24 1,226 3,334 3,594 8,154
Participant 25 and over
4,584 11,206 12,263 28,053
Total Participant 9,645 23,314 26,505 59,464
Family 0 to 14 3,688 8,538 10,248 22,474
Family 15 to 24 310 2,517 2,649 5,476
Family 25 and over 145 3,895 3,762 7,802
Total Family 4,143 14,950 16,659 35,752
Total 13,788 38,264 43,164 95,216
Table G.15 Selected key indicators for participants – Daily Living (DL) and Choice and Control (CC) – VIC
Indicator 0 to before
school School to 14
15 to 24 25 and over
DL
% with concerns in 6 or more of the areas: gross motor skills, fine motor skills, self-care, eating, social interaction, communication, cognitive development, sensory processing
66%
CC % who say their child is able to tell them what he/she wants
74%
DL % developing functional, learning and coping skills appropriate to their ability and circumstances
26%
DL % who say their child is becoming more independent
38%
CC % of children who have a genuine say in decisions about themselves
62%
CC % who are happy with the level of independence/control they have now
31%
CC % who choose who supports them 33% 55%
CC % who choose what they do each day 40% 63%
CC % who had been given the opportunity to participate in a self-advocacy group meeting
21% 30%
CC % who want more choice and control in their life
82% 80%
116 Baseline outcomes for participants and/or their families and carers were collected for 99.6% of participants.

March 2019 | COAG Disability Reform Council Quarterly Report 132
Table G.16 Selected key indicators for participants – Relationships (REL) and Social/Community Participation (S/CP) – VIC
Indicator 0 to before
school School to
14 15 to 24
25 and over
REL % of children who can make friends with people outside the family
64% 58%
S/CP % of children who participate in age appropriate community, cultural or religious activities
54%
REL % of children who spend time after school and on weekends with friends and/or in mainstream programs
35%
REL Of these, % who are welcomed or actively included
66% 73%
REL % of children who spend time with friends without an adult present
12%
REL % with no friends other than family or paid staff
34% 30%
S/CP % who have been actively involved in a community, cultural or religious group in the last 12 months
33% 36%
Table G.17 Selected key indicators for participants – Lifelong Learning (LL), Work (WK), Home (HM) and Health and Wellbeing
(HW) – VIC
Indicator 0 to before
school School to
14 15 to 24
25 and over
LL % of children attending school in a mainstream class
61%
HM % who are happy with their home 80% 72%
HM % who feel safe or very safe in their home
84% 74%
HW % who rate their health as good, very good or excellent
67% 45%
HW % who did not have any difficulties accessing health services
69% 64%
LL % who currently attend or previously attended school in a mainstream class
27%
LL % who participate in education, training or skill development
16%
LL Of those who participate, % who do so in mainstream settings
37%
LL % unable to do a course or training they wanted to do in the last 12 months
40%
WK % who have a paid job 15% 21%
WK % who volunteer 11% 12%

March 2019 | COAG Disability Reform Council Quarterly Report 133
Table G.18 Selected key indicators for families/carers of participants – VIC
Indicator 0 to 14 15 to 24 25 and over
% receiving Carer Payment 22% 29% 24%
% receiving Carer Allowance 51% 53% 39%
% working in a paid job 46% 49% 35%
Of those in a paid job, % in permanent employment
79% 75% 76%
Of those in a paid job, % working 15 hours or more
75% 81% 82%
% who say they (and their partner) are able to work as much as they want
38% 41% 55%
Of those unable to work as much as they want, % who say the situation of their child/family member with disability is a barrier to working more
88% 91% 88%
Of those unable to work as much as they want, % who say insufficient flexibility of jobs is a barrier to working more
33% 28% 19%
% able to advocate for their child/family member
74% 66% 64%
% who have friends and family they see as often as they like
40% 38% 44%
% who feel very confident or somewhat confident in supporting their child's development
84%
% who know what their family can do to enable their family member with disability to become as independent as possible
35%
% who feel in control selecting services 37% 37%
% who have made plans (or begun to make plans) for when they are no longer able to care for their family member with disability
38%
% who rate their health as good, very good or excellent
71% 60% 57%
Table G.19 Results for “Has the NDIS helped?” questions answered at review, for SFOF version ‘Participant 0 to school’
(n=1,446) – VIC117
Question % Yes
DL Has the NDIS improved your child's development? 90%
DL Has the NDIS improved your child's access to specialist services? 88%
CC Has the NDIS helped increase your child's ability to communicate what they want?
82%
REL Has the NDIS improved how your child fits into family life? 69%
S/CP Has the NDIS improved how your child fits into community life? 58%
117 Results in Tables G.19 to G.22 exclude participants who had their first plan approved between 1 July 2016 and 31
March 2017, as these participants have been included in Tables G.23 to G.26.

March 2019 | COAG Disability Reform Council Quarterly Report 134
Table G.20 Results for “Has the NDIS helped?” questions answered at review, for SFOF version ‘Participant school to 14'
(n=3,850) – VIC
Question % Yes
DL Has the NDIS helped your child to become more independent? 57%
LL Has the NDIS improved your child's access to education? 35%
REL Has the NDIS improved your child's relationships with family and friends?
45%
S/CP Has the NDIS improved your child's social and recreational life? 43%
Table G.21 Results for “Has the NDIS helped?” questions answered at review, for SFOF versions ‘Participant 15 to 24' (n=2,276)
and 'Participant 25 and over' (n=7,527) – VIC
Question 15 to 24 % Yes
25+ % Yes
CC Has the NDIS helped you have more choices and more control over your life?
55% 63%
DL Has the NDIS helped you with daily living activities? 57% 67%
REL Has the NDIS helped you to meet more people? 46% 47%
HM Has your involvement with the NDIS helped you to choose a home that's right for you?
19% 24%
HW Has your involvement with the NDIS improved your health and wellbeing?
38% 44%
LL Has your involvement with the NDIS helped you to learn things you want to learn or to take courses you want to take?
37% 29%
WK Has your involvement with the NDIS helped you find a job that's right for you?
16% 17%
S/CP Has the NDIS helped you be more involved? 51% 55%
Table G.22 Results for “Has the NDIS helped?” questions answered at review, for SFOF version ‘Family 0 to 14’ (n=4,953); and
for SFOF versions ‘Family 15 to 24’ and ‘Family 25 and over’ combined (n=2,701) – VIC
Question 0 to 14 % Yes
15+ % Yes
Has the NDIS improved your capacity to advocate (stand up) for your child? / Has the NDIS helped you to know your rights and advocate effectively?
58% 48%
Has the NDIS improved the level of support for your family? 65% 61%
Has the NDIS improved your access to services, programs and activities in the community? / Has the NDIS helped you to access services, programs and activities in the community?
66% 59%
Has the NDIS improved your ability/capacity to help your child develop and learn?
71%
Has the NDIS improved your health and wellbeing? 37% 34%

March 2019 | COAG Disability Reform Council Quarterly Report 135
Table G.23 Results for “Has the NDIS helped?” questions answered at end of participant's first and second years in the
Scheme, for SFOF version ‘Participant 0 to school’ – VIC118
Question Year 1 Year 2 Change
DL Has the NDIS improved your child's development? 91% 94% +3%
DL Has the NDIS improved your child's access to specialist services? 90% 92% +1%
CC Has the NDIS helped increase your child's ability to communicate what they want?
80% 84% +4%
REL Has the NDIS improved how your child fits into family life? 71% 76% +4%
S/CP Has the NDIS improved how your child fits into community life? 57% 63% +6%
Table G.24 Results for “Has the NDIS helped?” questions answered at end of participant's first and second years in the
Scheme, for SFOF version ‘Participant school to 14' – VIC
Question Year 1 Year 2 Change
DL Has the NDIS helped your child to become more independent? 58% 66% +8%
LL Has the NDIS improved your child's access to education? 32% 35% +2%
REL Has the NDIS improved your child's relationships with family and friends?
47% 48% +1%
S/CP Has the NDIS improved your child's social and recreational life? 46% 49% +2%
Table G.25 Results for “Has the NDIS helped?” questions answered at end of participant's first and second years in the
Scheme, for SFOF versions ‘Participant 15 to 24' and 'Participant 25 and over' – VIC
15 to 24 25 and over
Question Year 1 Year 2 Change Year 1 Year 2 Change
CC Has the NDIS helped you have more choices and more control over your life?
60% 64% +4% 65% 72% +7%
DL Has the NDIS helped you with daily living activities?
64% 68% +5% 70% 78% +8%
REL Has the NDIS helped you to meet more people?
53% 55% +2% 50% 54% +5%
HM Has your involvement with the NDIS helped you to choose a home that's right for you?
23% 17% -5% 29% 28% -2%
HW Has your involvement with the NDIS improved your health and wellbeing?
43% 46% +3% 48% 53% +5%
LL Has your involvement with the NDIS helped you to learn things you want to learn or to take courses you want to take?
44% 44% 0% 34% 35% +1%
WK Has your involvement with the NDIS helped you find a job that's right for you?
14% 11% -4% 16% 14% -2%
S/CP Has the NDIS helped you be more involved? 54% 58% +4% 58% 64% +5%
118 Results in Tables G.23 to G.27 include participants who had their first plan approved between 1 July 2016 and 31
March 2017. While this is a relatively small group of participants, the number of participants included in these tables will grow over time.

March 2019 | COAG Disability Reform Council Quarterly Report 136
Table G.26 Results for “Has the NDIS helped?” questions answered at end of participant's first and second years in the
Scheme, for SFOF version ‘Family 0 to 14’; and for SFOF versions ‘Family 15 to 24’ and ‘Family 25 and over’ combined – VIC
0 to 14 15 and over
Question Year 1 Year 2 Change Year 1 Year 2 Change
Has the NDIS improved your capacity to advocate (stand up) for your child? / Has the NDIS helped you to know your rights and advocate effectively?
64% 66% +2% 53% 55% +1%
Has the NDIS improved the level of support for your family?
71% 74% +3% 57% 70% +12%
Has the NDIS improved your access to services, programs and activities in the community? / Has the NDIS helped you to access services, programs and activities in the community?
71% 75% +5% 61% 71% +9%
Has the NDIS improved your ability/capacity to help your child develop and learn?
78% 79% +1%
Has the NDIS improved your health and wellbeing?
40% 42% +2% 30% 30% 0%
Table G.27 Progress against the NDIA’s corporate plan metrics for ‘participants in work’ and ‘participants in community and
social activities’ – VIC119
Participants in work Baseline Year 2 2018–19 Target
Aged 15 to 24 years 12% 18%
26% Aged 25+ 21% 21%
Aged 15+ (average) 19% 20%
Participants in community and social activities Baseline Year 2 2018–19 Target
Aged 15 to 24 years 34% 40%
41% Aged 25+ 36% 43%
Aged 15+ (average) 36% 43%
119 Results are drawn from participants’ responses to SFOF questionnaires, and only include participants who had their
first plan approved between 1 July 2016 and 31 March 2017.

March 2019 | COAG Disability Reform Council Quarterly Report 137
Figure G.1 Proportion of participants describing satisfaction with the Agency planning process as good or very good by
quarter – Existing survey administered by NDIA regions (VIC)*120
*Of the participants describing satisfaction with the Agency planning process in Q3 of 2018-19, 86% gave a rating of good or very good,
8% gave a neutral rating and 7% gave a rating of poor or very poor.
Table G.28 Proportion of Participants rating their level of agreement as strongly agree, agree, neutral, disagree or strongly
disagree in response to statements about the planning process – Existing survey administered by NDIA regions (VIC)
Agree /
strongly agree
Neutral Disagree / strongly disagree
The planner listened to me 94% 3% 3%
I had enough time to tell my story and say what support I need
92% 4% 4%
The planner knows what I can do well 79% 16% 5%
The planner had some good ideas for my plan 83% 11% 6%
I know what is in my plan 83% 9% 8%
The planner helped me think about my future 80% 13% 7%
I think my plan will make my life better 82% 10% 8%
The planning meeting went well 91% 6% 3%
Table G.29 Plan reviews conducted per quarter – excluding plans less than 30 days – VIC121
Prior Quarters
(Transition only) 2018-19 Q3 Transition Total
Total plan reviews 45,123 13,904 59,027
Early intervention plans 6,997 1,678 8,675
Permanent disability plans 38,126 12,226 50,352
Table G.30 Scheduled plan reviews conducted by quarter – excluding plans less than 30 days – VIC
Prior Quarters
(Transition only) 2018-19 Q3 Transition Total
Total scheduled plan reviews 34,949 11,583 46,532
Trial participants 10,702 1,132 11,834
Transition participants 24,247 10,451 34,698
120 Participant satisfaction results are not shown if there is insufficient data in the group. 121 Plans less than 30 days in duration have been excluded from this tabulation, as these reviews are more likely to
represent corrections to the plan rather than a new plan review to address a change in circumstance.

March 2019 | COAG Disability Reform Council Quarterly Report 138
Table G.31 Unscheduled plan reviews conducted by quarter – excluding plans less than 30 days – VIC
Prior Quarters
(Transition only) 2018-19 Q3 Transition Total
Total unscheduled plan reviews 10,174 2,321 12,495
Trial participants 1,902 209 2,111
Transition participants 8,272 2,112 10,384
Table G.32 Estimated rate of unscheduled plan reviews – excluding plans less than 30 days – VIC122
Prior Quarters
(Transition only)
2018-19 Q3 Transition
Total
% unscheduled reviews 17.3% 15.3% 16.9%
Table G.33 AAT cases by category – VIC
Prior Quarters 2018-19 Q3 Total
Category N % N % N %
Access 88 31% 11 19% 99 29%
Plan 150 53% 29 50% 179 52%
Plan Review 32 11% 7 12% 39 11%
Other 15 5% 11 19% 26 8%
Total 285 100% 58 100% 343 100%
% of all access decisions123
0.28% 0.26% 0.28%
Table G.34 AAT cases by open/closed and decision – VIC
N
AAT Cases 343
Open AAT Cases 131
Closed AAT Cases 212
Resolved before hearing 196
Gone to hearing and received a substantive decision
16*
*Of the 16 cases which went to hearing and received a substantive decision: 7 affirmed the Agency’s decision, 4 varied the Agency’s decision and 5 set aside the Agency’s decision.
Table G.35 Distribution of active participants by method of Financial Plan Management and quarter of plan approval – VIC
Prior Quarters
(Transition only) 2018-19 Q3 Total
Self-managed fully 16% 18% 17%
Self-managed partly 12% 13% 12%
Plan managed 30% 36% 32%
Agency managed 42% 33% 39%
Total 100% 100% 100%
Table G.36 Distribution of active participants by support coordination and quarter of plan approval – VIC
Prior Quarters
(Transition only) 2018-19 Q3 Total
Support coordination 47% 46% 47%
122 This is calculated as the number of unscheduled reviews divided by the total number of participants. The number of participants used in the calculation considers the length of time the participants have been in the Scheme. 123 This is calculated as the number of appeals divided by the number of access decisions made. The number of access decisions used in the calculation considers the length of time since the access decisions have been made.

March 2019 | COAG Disability Reform Council Quarterly Report 139
Table G.37 Duration to plan activation by quarter of initial plan approval for active participants – VIC124,125
Prior Quarters
(Transition Only) 2018-19 Q1
Plan activation N % N %
Less than 30 days 23,480 71% 5,404 67%
30 to 59 days 3,635 11% 960 12%
60 to 89 days 1,830 6% 394 5%
Activated within 90 days
28,945 87% 6,758 84%
90 to 119 days 971 3% 224 3%
120 days and over 2,125 6% 327 4%
Activated between 90 and 180 days
3,096 9% 551 7%
No payments 1,195 4% 712 9%
Total plans approved 33,236 100% 8,021 100%
124 Note: Plans approved after the end of 2018-19 Q1 have been excluded from the table. They are relatively new and it is too early to examine their durations to activation. 125 There has been a change in methodology used to calculate these results since the previous quarter. Duration to plan
activation is now calculated as the time from a participant’s initial plan approval to when the participant first uses plan
supports (previously only the initial plan for each participant was considered). In-kind supports are now also included
(previously excluded). As a result, a higher proportion of participants are identified as activating their plans within 90
days, and a lower proportion have no payments.

March 2019 | COAG Disability Reform Council Quarterly Report 140
Table G.38 Proportion of active participants with plan activated within 12 months – VIC
Number of participants
activated within 12 months
All participants with duration of
at least 12 months
Proportion activated
by Aboriginal and Torres Strait Islander status
Aboriginal and Torres Strait Islander 673 730 92%
Not Aboriginal and Torres Strait Islander 26,765 27,911 96%
Not Stated 1,819 1,897 96%
Total 29,257 30,538 96%
by Culturally and Linguistically Diverse status
CALD 1,776 1,837 97%
Not CALD 27,206 28,420 96%
Not Stated 275 281 98%
Total 29,257 30,538 96%
by Remoteness
Major Cities 17,421 18,178 96%
Regional 11,774 12,294 96%
Remote 16 19 84%
Missing 46 47 98%
Total 29,257 30,538 96%
by Primary Disability type
Autism 7,559 7,846 96% Intellectual Disability (including Down Syndrome) 8,973 9,285 97%
Psychosocial Disability 3,160 3,360 94% Developmental Delay (including Global Developmental Delay) 1,940 2,081 93%
Other 7,625 7,966 96%
Total 29,257 30,538 96%
Table G.39 Distribution of plans by plan utilisation and quarter of plan approval for 2016-17, 2017-18 and quarter 1 of 2018-19 –
VIC126,127
Plan utilisation Prior Quarters
(Transition only) 2018-19 Q1 Total
0% to 50% 42% 68% 45%
50% to 75% 24% 18% 23%
> 75% 35% 14% 33%
Total 100% 100% 100%
Table G.40 Proportion of active participants with approved plans accessing mainstream supports – VIC
Prior Quarters 2018-19 Q3 Total
Daily Activities 9% 11% 10%
Health & Wellbeing 42% 42% 42%
Lifelong Learning 9% 9% 9%
Other 11% 12% 11%
Non-categorised 34% 33% 34%
Any mainstream service 90% 91% 90%
126 Plans less than 30 days in duration have been excluded from this tabulation, as these plans are more likely to
represent corrections to the plan rather than an unscheduled plan review to address a change in circumstance. 127 This table only considers committed supports and payments for supports provided to 31 December 2018. This gives some allowance for the timing delay between when the support is provided and when it is paid.

March 2019 | COAG Disability Reform Council Quarterly Report 141
Part Three: Providers and the growing market
Table G.41 Key provider indicators by quarter - VIC128
Prior Quarters 2018-19 Q3 Total
Provider indicators
a) Registrations by profile
Individual/ sole trader 2,425 342 2,762
Company/ organisation 3,602 359 3,907
Total 6,027 701 6,669
b) Registration revoked 59
128 The total number of providers as at 31 March 2019 (6,669) is not the sum of the number of providers as at 31
December 2018 (6,027) and the providers registered in the third quarter of 2018-19 (701). This is due to 59 providers whose registration ended during the third quarter of 2018-19.

March 2019 | COAG Disability Reform Council Quarterly Report 142
Table G.42 Number of approved providers by registration group - VIC129
Registration Group Prior
Quarters 2018-19
Q3 Total % Change
Assistance services
Accommodation / Tenancy Assistance 683 115 798 17%
Assistance Animals 3 0 3 0%
Assistance with daily life tasks in a group or shared living arrangement
243 58 301 24%
Assistance with travel/transport arrangements 1,386 215 1,601 16%
Daily Personal Activities 449 68 517 15%
Group and Centre Based Activities 431 66 497 15%
High Intensity Daily Personal Activities 413 62 475 15%
Household tasks 1,764 303 2,067 17%
Interpreting and translation 509 82 591 16%
Participation in community, social and civic activities 512 75 587 15%
Assistive Technology
Assistive equipment for recreation 576 85 661 15%
Assistive products for household tasks 732 118 850 16%
Assistance products for personal care and safety 1,029 156 1,185 15%
Communication and information equipment 471 53 524 11%
Customised Prosthetics 355 57 412 16%
Hearing Equipment 196 35 231 18%
Hearing Services 14 3 17 21%
Personal Mobility Equipment 750 112 862 15%
Specialised Hearing Services 50 11 61 22%
Vision Equipment 211 44 255 21%
Capacity Building Services
Assistance in coordinating or managing life stages, transitions and supports
457 76 533 17%
Behaviour Support 351 60 411 17%
Community nursing care for high needs 790 132 922 17%
Development of daily living and life skills 471 75 546 16%
Early Intervention supports for early childhood 357 20 377 6%
Exercise Physiology and Physical Wellbeing activities
617 94 711 15%
Innovative Community Participation 972 208 1,180 21%
Specialised Driving Training 184 51 235 28%
Therapeutic Supports 2,839 348 3,187 12%
Capital services
Home modification design and construction 809 140 949 17%
Specialised Disability Accommodation 273 62 335 23%
Vehicle Modifications 181 48 229 27%
Choice and control support services
Management of funding for supports in participants plan
305 74 379 24%
Support Coordination 402 82 484 20%
Employment and Education support services
Assistance to access and/or maintain employment and/or education
124 8 132 6%
Specialised Supported Employment 80 4 84 5%
Total approved providers 5,968 701 6,669 12%
129 The 59 providers whose registration ended during the third quarter of 2018-19 are not included in the 2018-19 Q2 and prior numbers in this table.

March 2019 | COAG Disability Reform Council Quarterly Report 143
Table G.43 Key markets indicators by quarter – VIC
Market indicators Prior Quarters 2018-19 Q3
a) Average number of providers per participant 1.56 1.50
b) Number of providers delivering new supports 0.47 0.38
c) Change in the number of active/inactive providers: 706 764
Active (%) 36% 35%
Not yet active (%) 56% 56%
Inactive (%) 8% 9%
d) Share of payments - top 25%
Daily Tasks/Shared Living (%) 87% 86%
Therapeutic Supports (%) 89% 91%
Participate Community (%) 85% 85%
Early Childhood Supports (%) 90% 90%
Assist Personal Activities (%) 90% 91%

March 2019 | COAG Disability Reform Council Quarterly Report 144
Table G.44 Cumulative number of providers that have been active by registration group – VIC
Registration Group Prior
Quarters 2018-19
Q3 Total % Change
Assistance services
Accommodation / Tenancy Assistance 45 9 54 20%
Assistance Animals 2 0 2 0%
Assistance with daily life tasks in a group or shared living arrangement
120 11 131 9%
Assistance with travel/transport arrangements 292 28 320 10%
Daily Personal Activities 326 46 372 14%
Group and Centre Based Activities 259 12 271 5%
High Intensity Daily Personal Activities 269 27 296 10%
Household tasks 564 98 662 17%
Interpreting and translation 23 5 28 22%
Participation in community, social and civic activities 365 40 405 11%
Assistive Technology
Assistive equipment for recreation 37 3 40 8%
Assistive products for household tasks 36 5 41 14%
Assistance products for personal care and safety 301 46 347 15%
Communication and information equipment 41 6 47 15%
Customised Prosthetics 84 12 96 14%
Hearing Equipment 30 4 34 13%
Hearing Services 5 0 5 0%
Personal Mobility Equipment 129 19 148 15%
Specialised Hearing Services 8 0 8 0%
Vision Equipment 17 0 17 0%
Capacity Building Services
Assistance in coordinating or managing life stages, transitions and supports
318 45 363 14%
Behaviour Support 137 19 156 14%
Community nursing care for high needs 101 11 112 11%
Development of daily living and life skills 271 21 292 8%
Early Intervention supports for early childhood 258 17 275 7%
Exercise Physiology and Physical Wellbeing activities
98 17 115 17%
Innovative Community Participation 59 12 71 20%
Specialised Driving Training 25 7 32 28%
Therapeutic Supports 1,385 160 1,545 12%
Capital services
Home modification design and construction 70 10 80 14%
Specialised Disability Accommodation 32 8 40 25%
Vehicle Modifications 20 3 23 15%
Choice and control support services
Management of funding for supports in participants plan
143 39 182 27%
Support Coordination 84 22 106 26%
Employment and Education support services
Assistance to access and/or maintain employment and/or education
60 8 68 13%
Specialised Supported Employment 60 2 62 3%
Total approved active providers 2,612 319 2,931 12%

March 2019 | COAG Disability Reform Council Quarterly Report 145
Table G.45 Number of approved and active providers in each registration group by legal entity type as at 31 March 2019 – VIC
Registration Group
Approved Active
Individual/ sole trader
Company/ organisation
Total Approved
Individual/ sole trader
Company/ organisation
Total Active
Assistance services
Accommodation / Tenancy Assistance
130 668 798 10 44 54
Assistance Animals 0 3 3 0 2 2
Assistance with daily life tasks in a group or shared living arrangement
18 283 301 2 129 131
Assistance with travel/transport arrangements
357 1,244 1,601 41 279 320
Daily Personal Activities 36 481 517 23 349 372
Group and Centre Based Activities
35 462 497 9 262 271
High Intensity Daily Personal Activities
30 445 475 17 279 296
Household tasks 625 1,442 2,067 233 429 662
Interpreting and translation 74 517 591 3 25 28
Participation in community, social and civic activities
49 538 587 29 376 405
Assistive Technology Assistive equipment for recreation
153 508 661 3 37 40
Assistive products for household tasks
172 678 850 2 39 41
Assistance products for personal care and safety
219 966 1,185 39 308 347
Communication and information equipment
152 372 524 11 36 47
Customised Prosthetics 96 316 412 12 84 96
Hearing Equipment 34 197 231 2 32 34
Hearing Services 0 17 17 0 5 5
Personal Mobility Equipment 222 640 862 16 132 148
Specialised Hearing Services
17 44 61 0 8 8
Vision Equipment 52 203 255 2 15 17
Capacity Building Services Assistance in coordinating or managing life stages, transitions and supports
59 474 533 41 322 363
Behaviour Support 78 333 411 34 122 156
Community nursing care for high needs
141 781 922 11 101 112
Development of daily living and life skills
48 498 546 23 269 292
Early Intervention supports for early childhood
195 182 377 140 135 275
Exercise Physiology and Physical Wellbeing activities
190 521 711 35 80 115
Innovative Community Participation
375 805 1,180 21 50 71
Specialised Driving Training 42 193 235 11 21 32
Therapeutic Supports 1,632 1,555 3,187 800 745 1,545
Capital services Home modification design and construction
277 672 949 21 59 80
Specialised Disability Accommodation
38 297 335 1 39 40
Vehicle Modifications 26 203 229 0 23 23
Choice and control support services
Management of funding for supports in participants plan
40 339 379 18 164 182

March 2019 | COAG Disability Reform Council Quarterly Report 146
Registration Group
Approved Active
Individual/ sole trader
Company/ organisation
Total Approved
Individual/ sole trader
Company/ organisation
Total Active
Support Coordination 45 439 484 15 91 106
Employment and Education support services
Assistance to access and/or maintain employment and/or education
4 128 132 1 67 68
Specialised Supported Employment
0 84 84 0 62 62
Total 2,762 3,907 6,669 1,217 1,714 2,931
Table G.46 Proportion of approved and active providers in each registration group by legal entity type as at 31 March 2019 –
VIC
Registration Group
Approved Active
Individual/ sole trader
Company/ organisation
Total Approved
Individual/ sole trader
Company/ organisation
Total Active
Assistance services
Accommodation / Tenancy Assistance
16% 84% 798 19% 81% 54
Assistance Animals 0% 100% 3 0% 100% 2
Assistance with daily life tasks in a group or shared living arrangement
6% 94% 301 2% 98% 131
Assistance with travel/transport arrangements
22% 78% 1,601 13% 87% 320
Daily Personal Activities 7% 93% 517 6% 94% 372
Group and Centre Based Activities
7% 93% 497 3% 97% 271
High Intensity Daily Personal Activities
6% 94% 475 6% 94% 296
Household tasks 30% 70% 2,067 35% 65% 662
Interpreting and translation 13% 87% 591 11% 89% 28
Participation in community, social and civic activities
8% 92% 587 7% 93% 405
Assistive Technology Assistive equipment for recreation
23% 77% 661 8% 93% 40
Assistive products for household tasks
20% 80% 850 5% 95% 41
Assistance products for personal care and safety
18% 82% 1,185 11% 89% 347
Communication and information equipment
29% 71% 524 23% 77% 47
Customised Prosthetics 23% 77% 412 13% 88% 96
Hearing Equipment 15% 85% 231 6% 94% 34
Hearing Services 0% 100% 17 0% 100% 5
Personal Mobility Equipment 26% 74% 862 11% 89% 148
Specialised Hearing Services
28% 72% 61 0% 100% 8
Vision Equipment 20% 80% 255 12% 88% 17
Capacity Building Services Assistance in coordinating or managing life stages, transitions and supports
11% 89% 533 11% 89% 363
Behaviour Support 19% 81% 411 22% 78% 156
Community nursing care for high needs
15% 85% 922 10% 90% 112
Development of daily living and life skills
9% 91% 546 8% 92% 292
Early Intervention supports for early childhood
52% 48% 377 51% 49% 275

March 2019 | COAG Disability Reform Council Quarterly Report 147
Registration Group
Approved Active
Individual/ sole trader
Company/ organisation
Total Approved
Individual/ sole trader
Company/ organisation
Total Active
Exercise Physiology and Physical Wellbeing activities
27% 73% 711 30% 70% 115
Innovative Community Participation
32% 68% 1,180 30% 70% 71
Specialised Driving Training 18% 82% 235 34% 66% 32
Therapeutic Supports 51% 49% 3,187 52% 48% 1,545
Capital services Home modification design and construction
29% 71% 949 26% 74% 80
Specialised Disability Accommodation
11% 89% 335 3% 98% 40
Vehicle Modifications 11% 89% 229 0% 100% 23
Choice and control support services
Management of funding for supports in participants plan
11% 89% 379 10% 90% 182
Support Coordination 9% 91% 484 14% 86% 106
Employment and Education support services
Assistance to access and/or maintain employment and/or education
3% 97% 132 1% 99% 68
Specialised Supported Employment
0% 100% 84 0% 100% 62
Total 41% 59% 6,669 42% 58% 2,931

March 2019 | COAG Disability Reform Council Quarterly Report 148
Part Five: Financial sustainability
Table G.47 Committed supports by financial year ($m) - VIC
2013-14 2014-15 2015-16 2016-17 2017-18 2018-19 Q1,
Q2,Q3130 Total
Total Committed
53.1 162.7 203.0 493.1 1,431.8 2,382.6 4,726.2
Figure G.2 Distribution of participants by annualised committed support band (including participants with Supported
Independent Living supports) – active participants with initial plan approvals as at 2018-19 Q3 compared with active
participants with initial plan approvals as at 2018-19 Q2 (VIC)
130 Note: the $2.4 billion in respect of 2018-19 Q1, Q2 and Q3 only includes committed supports expected to be used to 31 March 2019.
0.00%
2.00%
4.00%
6.00%
8.00%
10.00%
12.00%
14.00%
16.00%
18.00%
Dis
trib
uti
on
o
f p
art
icip
an
ts
Average annualised committed supports band
As at Q2 2018-19 distribution of participants As at Q3 2018-19 distribution of participants

March 2019 | COAG Disability Reform Council Quarterly Report 149
Figure G.3 Distribution of participants by annualised committed support band (excluding participants with Supported
Independent Living supports) – active participants with initial plan approvals as at 2018-19 Q3 compared with active
participants with initial plan approvals as at 2018-19 Q2 (VIC)
0.00%
2.00%
4.00%
6.00%
8.00%
10.00%
12.00%
14.00%
16.00%
18.00%
Dis
trib
uti
on
o
f p
art
icip
an
ts
Average annualised committed supports band
As at Q2 2018-19 distribution of participants As at Q3 2018-19 distribution of participants

March 2019 | COAG Disability Reform Council Quarterly Report 150
Figure G.4 Average committed support by age group (including participants with Supported Independent Living supports) –
active participants with initial plan approvals as at 2018-19 Q3 compared with active participants with initial plan approvals as
at 2018-19 Q2 (VIC) 131
131 The average revenue amounts have been removed from the figure in this report as the amounts refer to revenue received under the bilateral agreements, and are not linked to age group, primary disability group, and level of function. Therefore, it is not appropriate to make comparisons between revenue and plan budgets in this chart. The amount of revenue received in aggregate should be compared with the amount spent in aggregate – the NDIA has been within budget in all years of operation (including 2018-19).
$0
$10,000
$20,000
$30,000
$40,000
$50,000
$60,000
$70,000
$80,000
$90,000
$100,000
0 to 6 7 to 14 15 to 18 19 to 24 25 to 34 35 to 44 45 to 54 55 to 64 65+
Av
era
ge
an
nu
ali
se
d c
om
mit
ted
su
pp
ort
s
Age group
As at Q3 2018-19 actual average annualised committed supports
As at Q2 2018-19 actual average annualised committed supports

March 2019 | COAG Disability Reform Council Quarterly Report 151
Figure G.5 Average committed support by primary disability group (including participants with Supported Independent Living
supports) – active participants with initial plan approvals as at 2018-19 Q3 compared with active participants with initial plan
approvals as at 2018-19 Q2 (VIC) 132
132 Ibid.
$0 $20,000 $40,000 $60,000 $80,000 $100,000 $120,000 $140,000
Acquired Brain Injury
Autism
Cerebral Palsy
Developmental Delay
Global Developmental Delay
Hearing Impairment
Intellectual Disability
Multiple Sclerosis
Psychosocial disability
Spinal Cord Injury
Stroke
Visual Impairment
Other Neurological
Other Physical
Other Sensory/Speech
Other
Average annualised committed supports
Pri
ma
ry d
isa
bil
ity
As at Q2 2018-19 actual average annualised committed supports
As at Q3 2018-19 actual average annualised committed supports

March 2019 | COAG Disability Reform Council Quarterly Report 152
Figure G.6 Average committed support by level of function (including participants with Supported Independent Living
supports) – active participants with initial plan approvals as at 2018-19 Q3 compared with active participants with initial plan
approvals as at 2018-19 Q2 (VIC) 133,134,135
Table G.48 Payments by financial year, compared to committed supports ($m) – VIC
$ Million 2013-14 2014-15 2015-16 2016-17 2017-18 2018-19
Q1,Q2,Q3 Total
Total committed 53.1 162.7 203.0 493.1 1,431.8 2,382.6 4,726.2
Total paid 32.5 128.3 160.9 332.9 942.0 1,387.2 2,983.8
% utilised to date 61% 79% 79% 68% 66% 58% 62%136
133 Ibid. 134 An ICT issue has been identified and as a result, reporting by level of function is not accurate. This issue is currently
under investigation and will be reconciled for reporting as at 30 June 2019. 135 Average annualised committed supports are not shown where there is insufficient data in the group. Level of function 15 does not have sufficient data as at 2018-19 Q2 to show an average cost. 136 Note: Only committed supports expected to be used to 31 March 2019 have been used to calculate the utilisation from 1 July 2013 to date, and this will increase as there is a lag between when support is provided and when it is paid.
$0
$50,000
$100,000
$150,000
$200,000
$250,000
$300,000
$350,000
1 2 3 4 5 6 7 8 9 10 11 12 13 14 15
Av
era
ge
an
nu
ali
se
d c
os
t
Level of function
As at Q3 2018-19 actual average annualised committed supports
As at Q2 2018-19 actual average annualised committed supports

March 2019 | COAG Disability Reform Council Quarterly Report 153
Figure G.7 Utilisation of committed supports as at 31 December 2018 and 31 March 2019 (VIC)

March 2019 | COAG Disability Reform Council Quarterly Report 154
Appendix H: Appendix H:
Queensland
Part One: Participants and their plans
Table H.1 Plan approvals compared to estimates – QLD
Prior
Quarters 2018-19 Q3
Total excluding
ECEI
Total including
ECEI
Bilateral estimates
QLD 32,886 10,201 43,087 46,036 77,967
Table H.2 Quarterly intake split by plan and entry type since 1 July 2013 – QLD137
Prior Quarters 2018-19 Q3 Total
Access decisions 52,453 7,075 59,528
Access Met 43,876 5,080 48,956
State 28,065 1,601 29,666
Commonwealth 4,317 856 5,173
New 11,494 2,623 14,117
Total Participant Plans 35,492 13,150 46,036
State 20,572 6,003 26,575
Commonwealth 3,077 1,161 4,238
New 9,237 3,037 12,274
ECEI138 2,606 2,949 2,949
Total Participant Plans 35,492 13,150 46,036
Early Intervention (s25) 5,423 1,356 6,779
Permanent Disability (s24) 27,463 8,845 36,308
ECEI139 2,606 2,949 2,949
Table H.3 Exits from the Scheme since 1 July 2013 as at 31 March 2019 – QLD
Exits
Total participant exits 689
Early Intervention participants 147
Permanent disability participants 542
137 The Joint Standing Committee on the NDIS, in its final report on Hearing Services, recommended that the NDIA better understand the eligibility rate for people with a hearing impairment. Of the number of access decisions in 2018-19 Q3, 86% of people with a hearing impairment met the access criteria compared to 72% overall. 138 The number of children supported in the ECEI gateway cannot be summed across quarters as they can transition to NDIS plans, hence the ECEI figure shown is cumulative. 139 Ibid.

March 2019 | COAG Disability Reform Council Quarterly Report 155
Table H.4 Cumulative position by services previously received – QLD140
Participant cohort Bilateral estimate
% of estimate
State Commonwealth New ECEI Total
Trial 255 40 66 361 600 60%
End of 2016-17 5,124 462 1,601 254 7,441 14,966 50%
End of 2017-18 10,075 1,458 4,991 475 16,999 31,155 55%
End of 2018-19 Q1 15,786 2,168 6,787 828 25,569 44,957 57%
End of 2018-19 Q2 20,572 3,077 9,237 2,606 35,492 58,759 60%
End of 2018-19 Q3 26,575 4,238 12,274 2,949 46,036 77,967 59%
Table H.5 Cumulative position by entry into the Scheme – QLD141
Participant cohort Bilateral estimate
% of estimate
Early
Intervention Permanent Disability
ECEI Total
Trial 165 196 361 600 60%
End of 2016-17 1,334 5,853 254 7,441 14,966 50%
End of 2017-18 3,389 13,135 475 16,999 31,155 55%
End of 2018-19 Q1 4,212 20,529 828 25,569 44,957 57%
End of 2018-19 Q2 5,423 27,463 2,606 35,492 58,759 60%
End of 2018-19 Q3 6,779 36,308 2,949 46,036 77,967 59%
Note: in the below tables the percentage figures have been rounded. Therefore, the totals may not
always add up to one hundred per cent.
Table H.6 Participant profile per quarter by Aboriginal and Torres Strait islander status – QLD
Prior Quarters 2018-19 Q3 Total
Participant profile N % N % N %
Aboriginal and Torres Strait Islander 2,646 8.2% 745 7.3% 3,391 8.0%
Not Aboriginal and Torres Strait Islander 28,180 87.5% 8,827 86.7% 37,007 87.3%
Not Stated 1,386 4.3% 614 6.0% 2,000 4.7%
Total 32,212 100% 10,186 100% 42,398 100%
Table H.7 Participant profile per quarter by culturally and linguistically diverse (CALD) status – QLD
Prior Quarters 2018-19 Q3 Total
Participant profile N % N % N %
CALD 1,494 4.6% 591 5.8% 2,085 4.9%
Not CALD 30,683 95.3% 9,589 94.1% 40,272 95.0%
Not Stated 35 0.1% 6 0.1% 41 0.1%
Total 32,212 100% 10,186 100% 42,398 100%
Table H.8 Participant profile per quarter by Young people in Residential aged care (YPIRAC) status – QLD
Prior Quarters 2018-19 Q3 Total
Participant profile N % N % N %
YPIRAC 582 1.8% 159 1.6% 741 1.7%
Not YPIRAC 31,630 98.2% 10,027 98.4% 41,657 98.3%
Total 32,212 100% 10,186 100% 42,398 100%
140 The total number of participants in previous periods have changed slightly compared to the previous report, due to
corrections in the data. Further, updated lists of clients are provided by State/Territory and Commonwealth governments each quarter. This results in some participants being retrospectively reclassified as State, Commonwealth or New. 141 The total number of participants in previous periods have changed slightly compared to the previous report, due to corrections in the data.

March 2019 | COAG Disability Reform Council Quarterly Report 156
Table H.9 Participant profile per quarter by remoteness – QLD142,143
Prior Quarters 2018-19 Q3 Total
Participant profile N % N % N %
Major Cities 14,104 43.9% 7,816 76.8% 21,920 51.8%
Population > 50,000 11,357 35.4% 1,290 12.7% 12,647 29.9%
Population between 15,000 and 50,000
1,210 3.8% 376 3.7% 1,586 3.7%
Population between 5,000 and 15,000
1,869 5.8% 202 2.0% 2,071 4.9%
Population less than 5,000 2,844 8.9% 396 3.9% 3,240 7.7%
Remote 405 1.3% 46 0.5% 451 1.1%
Very Remote 338 1.1% 45 0.4% 383 0.9%
Missing 85 15 100
Total 32,212 100% 10,186 100% 42,398 100%
Table H.10 Participant profile per quarter by disability group – QLD144,145
Prior Quarters 2018-19 Q3 Total
Disability N % N % N %
Autism 8,674 27% 2,982 29% 11,656 27%
Intellectual Disability146 8,748 27% 2,463 24% 11,211 26%
Psychosocial disability 2,445 8% 722 7% 3,167 7%
Cerebral Palsy 1,895 6% 522 5% 2,417 6%
Other Neurological 1,746 5% 595 6% 2,341 6%
Developmental Delay 1,249 4% 364 4% 1,613 4%
Other Physical 1,866 6% 648 6% 2,514 6%
Hearing Impairment 1,260 4% 507 5% 1,767 4%
ABI 1,309 4% 455 4% 1,764 4%
Visual Impairment 688 2% 256 3% 944 2%
Multiple Sclerosis 658 2% 160 2% 818 2%
Global Developmental Delay 203 1% 110 1% 313 1%
Stroke 512 2% 153 2% 665 2%
Spinal Cord Injury 718 2% 202 2% 920 2%
Other Sensory/Speech 201 1% 28 0% 229 1%
Other 40 0% 19 0% 59 0%
Total 32,212 100% 10,186 100% 42,398 100%
142 This table is based on the Modified Monash Model measure of remoteness. 143 The distributions are calculated excluding active participants with a missing remoteness classification. 144 Table order based on national proportions (highest to lowest) 145 Note: Since 2017-18 Q1, the disability groups Developmental Delay and Global Developmental Delay have been reported separately to the Intellectual Disability group. 146 Down Syndrome is included in Intellectual Disability, representing 4% of all Scheme participants in QLD (1,849).

March 2019 | COAG Disability Reform Council Quarterly Report 157
Table H.11 Participant profile per quarter by level of function – QLD147
Prior Quarters 2018-19 Q3 Total
Level of Function N % N % N %
1 (High Function) 1,658 5% 477 5% 2,135 5%
2 (High Function) 39 0% 6 0% 45 0%
3 (High Function) 1,729 5% 481 5% 2,210 5%
4 (High Function) 1,899 6% 645 6% 2,544 6%
5 (High Function) 1,750 5% 513 5% 2,263 5%
6 (Moderate Function) 5,185 16% 1,881 18% 7,066 17%
7 (Moderate Function) 1,799 6% 486 5% 2,285 5%
8 (Moderate Function) 3,242 10% 835 8% 4,077 10%
9 (Moderate Function) 177 1% 55 1% 232 1%
10 (Moderate Function) 4,748 15% 1,363 13% 6,111 14%
11 (Low Function) 1,478 5% 323 3% 1,801 4%
12 (Low Function) 5,189 16% 1,723 17% 6,912 16%
13 (Low Function) 2,181 7% 1,090 11% 3,271 8%
14 (Low Function) 1,125 3% 303 3% 1,428 3%
15 (Low Function) 13 0% 5 0% 18 0%
Missing 0 0 0
Total 32,212 100% 10,186 100% 42,398 100%
Table H.12 Participant profile per quarter by Age group – QLD
Prior Quarters 2018-19 Q3 Total
Age Group N % N % N %
0 to 6 3,180 10% 1,459 14% 4,639 11%
7 to 14 7,046 22% 2,295 23% 9,341 22%
15 to 18 2,498 8% 727 7% 3,225 8%
19 to 24 3,275 10% 775 8% 4,050 10%
25 to 34 3,509 11% 1,058 10% 4,567 11%
35 to 44 3,204 10% 1,086 11% 4,290 10%
45 to 54 4,129 13% 1,199 12% 5,328 13%
55 to 64 4,679 15% 1,467 14% 6,146 14%
65+ 692 2% 120 1% 812 2%
Total 32,212 100% 10,186 100% 42,398 100%
Table H.13 Participant profile per quarter by Gender – QLD
Prior Quarters 2018-19 Q3 Total
Gender N % N % N %
Male 19,821 62% 6,298 62% 26,119 62%
Female 12,146 38% 3,813 37% 15,959 38%
Indeterminate 245 1% 75 1% 320 1%
Total 32,212 100% 10,186 100% 42,398 100%
147 An ICT issue has been identified and as a result, reporting by level of function is not accurate. This issue is currently
under investigation and will be reconciled for reporting as at 30 June 2019.

March 2019 | COAG Disability Reform Council Quarterly Report 158
Part Two: Participant experience and outcomes
Table H.14 Number of questionnaires completed by SFOF version – QLD148
Version
Number of questionnaires
collected 2016-17
Number of questionnaires
collected 2017-18
Number of questionnaires collected YTD
2018-19
Number of questionnaires
Participant 0 to school
742 1,283 2,006 4,031
Participant school to 14
1,305 2,506 6,946 10,757
Participant 15 to 24 1,009 1,365 4,389 6,763
Participant 25 and over
3,333 3,936 13,049 20,318
Total Participant 6,389 9,090 26,390 41,869
Family 0 to 14 1,906 3,655 8,217 13,778
Family 15 to 24 245 911 2,937 4,093
Family 25 and over 174 1,202 3,885 5,261
Total Family 2,325 5,768 15,039 23,132
Total 8,714 14,858 41,429 65,001
Table H.15 Selected key indicators for participants – Daily Living (DL) and Choice and Control (CC) – QLD
Indicator 0 to before
school School to 14
15 to 24 25 and over
DL
% with concerns in 6 or more of the areas: gross motor skills, fine motor skills, self-care, eating, social interaction, communication, cognitive development, sensory processing
67%
CC % who say their child is able to tell them what he/she wants
68%
DL % developing functional, learning and coping skills appropriate to their ability and circumstances
25%
DL % who say their child is becoming more independent
38%
CC % of children who have a genuine say in decisions about themselves
63%
CC % who are happy with the level of independence/control they have now
34%
CC % who choose who supports them 32% 54%
CC % who choose what they do each day 40% 62%
CC % who had been given the opportunity to participate in a self-advocacy group meeting
20% 27%
CC % who want more choice and control in their life
86% 80%
148 Baseline outcomes for participants and/or their families and carers were collected for 99.6% of participants.

March 2019 | COAG Disability Reform Council Quarterly Report 159
Table H.16 Selected key indicators for participants – Relationships (REL) and Social/Community Participation (S/CP) – QLD
Indicator 0 to before
school School to
14 15 to 24
25 and over
REL % of children who can make friends with people outside the family
65% 59%
S/CP % of children who participate in age appropriate community, cultural or religious activities
49%
REL % of children who spend time after school and on weekends with friends and/or in mainstream programs
31%
REL Of these, % who are welcomed or actively included
59% 74%
REL % of children who spend time with friends without an adult present
10%
REL % with no friends other than family or paid staff
33% 28%
S/CP % who have been actively involved in a community, cultural or religious group in the last 12 months
37% 40%
Table H.17 Selected key indicators for participants – Lifelong Learning (LL), Work (WK), Home (HM) and Health and Wellbeing
(HW) - QLD
Indicator 0 to before
school School to
14 15 to 24
25 and over
LL % of children attending school in a mainstream class
55%
HM % who are happy with their home 79% 73%
HM % who feel safe or very safe in their home
83% 74%
HW % who rate their health as good, very good or excellent
67% 48%
HW % who did not have any difficulties accessing health services
68% 66%
LL % who currently attend or previously attended school in a mainstream class
22%
LL % who participate in education, training or skill development
10%
LL Of those who participate, % who do so in mainstream settings
54%
LL % unable to do a course or training they wanted to do in the last 12 months
37%
WK % who have a paid job 17% 20%
WK % who volunteer 14% 14%

March 2019 | COAG Disability Reform Council Quarterly Report 160
Table H.18 Selected key indicators for families/carers of participants - QLD
Indicator 0 to 14 15 to 24 25 and over
% receiving Carer Payment 28% 33% 28%
% receiving Carer Allowance 58% 59% 44%
% working in a paid job 44% 47% 33%
Of those in a paid job, % in permanent employment
73% 72% 75%
Of those in a paid job, % working 15 hours or more
78% 83% 83%
% who say they (and their partner) are able to work as much as they want
40% 45% 59%
Of those unable to work as much as they want, % who say the situation of their child/family member with disability is a barrier to working more
88% 90% 87%
Of those unable to work as much as they want, % who say insufficient flexibility of jobs is a barrier to working more
40% 28% 19%
% able to advocate for their child/family member
81% 77% 76%
% who have friends and family they see as often as they like
40% 40% 46%
% who feel very confident or somewhat confident in supporting their child's development
87%
% who know what their family can do to enable their family member with disability to become as independent as possible
46%
% who feel in control selecting services 45% 45%
% who have made plans (or begun to make plans) for when they are no longer able to care for their family member with disability
45%
% who rate their health as good, very good or excellent
68% 59% 58%
Table H.19 Results for “Has the NDIS helped?” questions answered at review, for SFOF version ‘Participant 0 to school’
(n=542) - QLD149
Question % Yes
DL Has the NDIS improved your child's development? 92%
DL Has the NDIS improved your child's access to specialist services? 91%
CC Has the NDIS helped increase your child's ability to communicate what they want?
84%
REL Has the NDIS improved how your child fits into family life? 75%
S/CP Has the NDIS improved how your child fits into community life? 60%
149 Results in Tables H.19 to H.22 exclude participants who had their first plan approved between 1 July 2016 and 31
March 2017, as these participants have been included in Tables H.23 to H.26.

March 2019 | COAG Disability Reform Council Quarterly Report 161
Table H.20 Results for “Has the NDIS helped?” questions answered at review, for SFOF version ‘Participant school to 14'
(n=2,238) - QLD
Question % Yes
DL Has the NDIS helped your child to become more independent? 61%
LL Has the NDIS improved your child's access to education? 35%
REL Has the NDIS improved your child's relationships with family and friends?
47%
S/CP Has the NDIS improved your child's social and recreational life? 43%
Table H.21 Results for “Has the NDIS helped?” questions answered at review, for SFOF versions ‘Participant 15 to 24' (n=1,241)
and 'Participant 25 and over' (n=3,431) - QLD
Question 15 to 24 % Yes
25+ % Yes
CC Has the NDIS helped you have more choices and more control over your life?
65% 71%
DL Has the NDIS helped you with daily living activities? 64% 76%
REL Has the NDIS helped you to meet more people? 53% 58%
HM Has your involvement with the NDIS helped you to choose a home that's right for you?
20% 28%
HW Has your involvement with the NDIS improved your health and wellbeing?
44% 51%
LL Has your involvement with the NDIS helped you to learn things you want to learn or to take courses you want to take?
32% 29%
WK Has your involvement with the NDIS helped you find a job that's right for you?
15% 15%
S/CP Has the NDIS helped you be more involved? 60% 63%
Table H.22 Results for “Has the NDIS helped?” questions answered at review, for SFOF version ‘Family 0 to 14’ (n=2,590); and
for SFOF versions ‘Family 15 to 24’ and ‘Family 25 and over’ combined (n=1,125) - QLD
Question 0 to 14 % Yes
15+ % Yes
Has the NDIS improved your capacity to advocate (stand up) for your child? / Has the NDIS helped you to know your rights and advocate effectively?
59% 53%
Has the NDIS improved the level of support for your family? 66% 65%
Has the NDIS improved your access to services, programs and activities in the community? / Has the NDIS helped you to access services, programs and activities in the community?
72% 62%
Has the NDIS improved your ability/capacity to help your child develop and learn?
73%
Has the NDIS improved your health and wellbeing? 39% 34%

March 2019 | COAG Disability Reform Council Quarterly Report 162
Table H.23 Results for “Has the NDIS helped?” questions answered at end of participant's first and second years in the
Scheme, for SFOF version ‘Participant 0 to school’ – QLD150
Question Year 1 Year 2 Change
DL Has the NDIS improved your child's development? 89% 92% +3%
DL Has the NDIS improved your child's access to specialist services? 87% 88% +1%
CC Has the NDIS helped increase your child's ability to communicate what they want?
77% 88% +11%
REL Has the NDIS improved how your child fits into family life? 69% 75% +6%
S/CP Has the NDIS improved how your child fits into community life? 58% 71% +12%
Table H.24 Results for “Has the NDIS helped?” questions answered at end of participant's first and second years in the
Scheme, for SFOF version ‘Participant school to 14' – QLD
Question Year 1 Year 2 Change
DL Has the NDIS helped your child to become more independent? 55% 69% +13%
LL Has the NDIS improved your child's access to education? 33% 36% +3%
REL Has the NDIS improved your child's relationships with family and friends?
43% 50% +7%
S/CP Has the NDIS improved your child's social and recreational life? 45% 48% +3%
Table H.25 Results for “Has the NDIS helped?” questions answered at end of participant's first and second years in the
Scheme, for SFOF versions ‘Participant 15 to 24' and 'Participant 25 and over' – QLD
15 to 24 25 and over
Question Year 1 Year 2 Change Year 1 Year 2 Change
CC Has the NDIS helped you have more choices and more control over your life?
68% 73% +4% 71% 78% +8%
DL Has the NDIS helped you with daily living activities?
70% 75% +4% 77% 86% +9%
REL Has the NDIS helped you to meet more people?
54% 56% +2% 56% 63% +7%
HM Has your involvement with the NDIS helped you to choose a home that's right for you?
23% 21% -3% 30% 28% -2%
HW Has your involvement with the NDIS improved your health and wellbeing?
45% 46% +2% 52% 60% +8%
LL Has your involvement with the NDIS helped you to learn things you want to learn or to take courses you want to take?
37% 34% -3% 33% 34% +1%
WK Has your involvement with the NDIS helped you find a job that's right for you?
19% 15% -4% 17% 16% -1%
S/CP Has the NDIS helped you be more involved? 68% 71% +3% 62% 71% +9%
150 Results in Tables H.23 to H.27 include participants who had their first plan approved between 1 July 2016 and 31
March 2017. While this is a relatively small group of participants, the number of participants included in these tables will grow over time.

March 2019 | COAG Disability Reform Council Quarterly Report 163
Table H.26 Results for “Has the NDIS helped?” questions answered at end of participant's first and second years in the
Scheme, for SFOF version ‘Family 0 to 14’; and for SFOF versions ‘Family 15 to 24’ and ‘Family 25 and over’ combined – QLD
0 to 14 15 and over
Question Year 1 Year 2 Change Year 1 Year 2 Change
Has the NDIS improved your capacity to advocate (stand up) for your child? / Has the NDIS helped you to know your rights and advocate effectively?
54% 55% +1% 42% 58% +16%
Has the NDIS improved the level of support for your family?
60% 68% +8% 59% 72% +13%
Has the NDIS improved your access to services, programs and activities in the community? / Has the NDIS helped you to access services, programs and activities in the community?
69% 74% +5% 59% 67% +8%
Has the NDIS improved your ability/capacity to help your child develop and learn?
70% 76% +6%
Has the NDIS improved your health and wellbeing?
38% 39% +1% 42% 42% 0%
Table H.27 Progress against the NDIA’s corporate plan metrics for ‘participants in work’ and ‘participants in community and
social activities’ –QLD151
Participants in work Baseline Year 2 2018–19 Target
Aged 15 to 24 years 18% 24%
26% Aged 25+ 19% 20%
Aged 15+ (average) 19% 21%
Participants in community and social activities Baseline Year 2 2018–19 Target
Aged 15 to 24 years 33% 45%
41% Aged 25+ 42% 52%
Aged 15+ (average) 41% 51%
151 Results are drawn from participants’ responses to SFOF questionnaires, and only include participants who had their
first plan approved between 1 July 2016 and 31 March 2017.

March 2019 | COAG Disability Reform Council Quarterly Report 164
Figure H.1 Proportion of participants describing satisfaction with the Agency planning process as good or very good by
quarter – Existing survey administered by NDIA regions (QLD)*152
*Of the participants describing satisfaction with the Agency planning process in Q3 of 2018-19, 90% gave a rating of good or very good,
6% gave a neutral rating and 4% gave a rating of poor or very poor.
Table H.28 Proportion of Participants rating their level of agreement as strongly agree, agree, neutral, disagree or strongly
disagree in response to statements about the planning process – Existing survey administered by NDIA regions (QLD)
Agree /
strongly agree
Neutral Disagree / strongly disagree
The planner listened to me 96% 2% 3%
I had enough time to tell my story and say what support I need
92% 4% 4%
The planner knows what I can do well 81% 12% 7%
The planner had some good ideas for my plan 81% 14% 5%
I know what is in my plan 80% 11% 10%
The planner helped me think about my future 73% 18% 9%
I think my plan will make my life better 83% 12% 5%
The planning meeting went well 93% 4% 3%
Table H.29 Plan reviews conducted per quarter – excluding plans less than 30 days – QLD153
Prior Quarters
(Transition only)
2018-19 Q3 Transition
Total
Total plan reviews 20,912 6,129 27,041
Early intervention plans 3,438 1,200 4,638
Permanent disability plans 17,474 4,929 22,403
152 Participant satisfaction results are not shown if there is insufficient data in the group. 153 Plans less than 30 days in duration have been excluded from this tabulation, as these reviews are more likely to represent corrections to the plan rather than a new plan review to address a change in circumstance.
91% 91% 92%
86%89%
95%
85%90%
0%
10%
20%
30%
40%
50%
60%
70%
80%
90%
100%
Q314-15
Q414-15
Q115-16
Q215-16
Q315-16
Q415-16
Q116-17
Q216-17
Q316-17
Q416-17
Q117-18
Q217-18
Q317-18
Q417-18
Q118-19
Q218-19
Q318-19
Pro
po
rtio
n o
f P
art
icip
ants
%
Quarter

March 2019 | COAG Disability Reform Council Quarterly Report 165
Table H.30 Scheduled plan reviews conducted by quarter – excluding plans less than 30 days – QLD
Prior Quarters
(Transition only) 2018-19 Q3 Transition Total
Total scheduled plan reviews 14,690 4,202 18,892
Trial participants 743 51 794
Transition participants 13,947 4,151 18,098
Table H.31 Unscheduled plan reviews conducted by quarter – excluding plans less than 30 days – QLD
Prior Quarters
(Transition only) 2018-19 Q3 Transition Total
Total unscheduled plan reviews 6,222 1,927 8,149
Trial participants 250 7 257
Transition participants 5,972 1,920 7,892
Table H.32 Estimated rate of unscheduled plan reviews – excluding plans less than 30 days – QLD154
Prior Quarters
(Transition only)
2018-19 Q3 Transition
Total
% unscheduled reviews 22.7% 20.3% 22.1%
Table H.33 AAT cases by category – QLD
Prior Quarters 2018-19 Q3 Total
Category N % N % N %
Access 80 43% 5 11% 85 37%
Plan 71 38% 33 75% 104 45%
Plan Review 29 16% 3 7% 32 14%
Other 6 3% 3 7% 9 4%
Total 186 100% 44 100% 230 100%
% of all access decisions155
0.40% 0.31% 0.38%
Table H.34 AAT cases by open/closed and decision – QLD
N
AAT Cases 183
Open AAT Cases 86
Closed AAT Cases 144
Resolved before hearing 142
Gone to hearing and received a substantive decision
2*
*Of the 2 cases which went to hearing and received a substantive decision: 1 affirmed the Agency’s decision and 1 set aside the Agency’s decision.
Table H.35 Distribution of active participants by method of Financial Plan Management and quarter of plan approval – QLD
Prior Quarters
(Transition only) 2018-19 Q3 Total
Self-managed fully 13% 15% 14%
Self-managed partly 11% 13% 12%
Plan managed 27% 34% 30%
Agency managed 49% 38% 45%
Total 100% 100% 100%
154 This is calculated as the number of unscheduled reviews divided by the total number of participants. The number of participants used in the calculation considers the length of time the participants have been in the Scheme. 155 This is calculated as the number of appeals divided by the number of access decisions made. The number of access decisions used in the calculation considers the length of time since the access decisions have been made.

March 2019 | COAG Disability Reform Council Quarterly Report 166
Table H.36 Distribution of active participants by support coordination and quarter of plan approval – QLD
Prior Quarters
(Transition only) 2018-19 Q3 Total
Support coordination 40% 38% 39%
Table H.37 Duration to plan activation by quarter of initial plan approval for active participants – QLD156,157
Prior Quarters
(Transition Only) 2018-19 Q1
Plan activation N % N %
Less than 30 days 10,215 66% 6,050 74%
30 to 59 days 1,972 13% 815 10%
60 to 89 days 948 6% 369 5%
Activated within 90 days
13,135 84% 7,234 89%
90 to 119 days 604 4% 187 2%
120 days and over 1,403 9% 270 3%
Activated between 90 and 180 days
2,007 13% 457 6%
No payments 451 3% 465 6%
Total plans approved 15,593 100% 8,156 100%
156 Note: Plans approved after the end of 2018-19 Q1 have been excluded from the table. They are relatively new and it is too early to examine their durations to activation. 157 There has been a change in methodology used to calculate these results since the previous quarter. Duration to plan
activation is now calculated as the time from a participant’s initial plan approval to when the participant first uses plan supports (previously only the initial plan for each participant was considered). In-kind supports are now also included (previously excluded). As a result, a higher proportion of participants are identified as activating their plans within 90 days, and a lower proportion have no payments.

March 2019 | COAG Disability Reform Council Quarterly Report 167
Table H.38 Proportion of active participants with plan activated within 12 months – QLD
Number of participants
activated within 12 months
All participants with duration of
at least 12 months
Proportion activated
by Aboriginal and Torres Strait Islander status
Aboriginal and Torres Strait Islander 1,278 1,363 94%
Not Aboriginal and Torres Strait Islander 11,863 12,348 96%
Not Stated 322 344 94%
Total 13,463 14,055 96%
by Culturally and Linguistically Diverse status
CALD 352 356 99%
Not CALD 13,094 13,681 96%
Not Stated 17 18 94%
Total 13,463 14,055 96%
by Remoteness
Major Cities 2,412 2,509 96%
Regional 10,537 10,976 96%
Remote 455 509 89%
Missing 59 61 97%
Total 13,463 14,055 96%
by Primary Disability type
Autism 3,623 3,853 94% Intellectual Disability (including Down Syndrome) 3,893 4,032 97%
Psychosocial Disability 1,062 1,099 97% Developmental Delay (including Global Developmental Delay) 587 610 96%
Other 4,298 4,461 96%
Total 13,463 14,055 96%
Table H.39 Distribution of plans by plan utilisation and quarter of plan approval for 2016-17, 2017-18 and quarter 1 of 2018-19–
QLD158,159
Plan utilisation Prior Quarters
(Transition only) 2018-19 Q1 Total
0% to 50% 46% 68% 51%
50% to 75% 24% 21% 23%
> 75% 30% 11% 26%
Total 100% 100% 100%
Table H.40 Proportion of active participants with approved plans accessing mainstream supports - QLD
Prior Quarters 2018-19 Q3 Total
Daily Activities 12% 14% 13%
Health & Wellbeing 41% 43% 42%
Lifelong Learning 8% 9% 9%
Other 11% 10% 11%
Non-categorised 38% 36% 37%
Any mainstream service 90% 91% 90%
158 Plans less than 30 days in duration have been excluded from this tabulation, as these plans are more likely to
represent corrections to the plan rather than an unscheduled plan review to address a change in circumstance. 159 This table only considers committed supports and payments for supports provided to 31 December 2018. This gives some allowance for the timing delay between when the support is provided and when it is paid.

March 2019 | COAG Disability Reform Council Quarterly Report 168
Part Three: Providers and the growing market
Table H.41 Key provider indicators by quarter - QLD160
Prior Quarters 2018-19 Q3 Total
Provider indicators
a) Registrations by profile
Individual/ sole trader 1,774 374 2,147
Company/ organisation 2,870 402 3,258
Total 4,644 776 5,405
b) Registration revoked 15
160 The total number of providers as at 31 March 2019 (5,405) is not the sum of the number of providers as at 31
December 2018 (4,644) and the providers registered in the third quarter of 2018-19 (776). This is due to 15 providers whose registration ended during the third quarter of 2018-19.

March 2019 | COAG Disability Reform Council Quarterly Report 169
Table H.42 Number of approved providers by registration group - QLD161
Registration Group Prior
Quarters 2018-19
Q3 Total % Change
Assistance services
Accommodation / Tenancy Assistance 483 85 568 18%
Assistance Animals 3 0 3 0%
Assistance with daily life tasks in a group or shared living arrangement
339 20 359 6%
Assistance with travel/transport arrangements 852 176 1,028 21%
Daily Personal Activities 427 45 472 11%
Group and Centre Based Activities 340 30 370 9%
High Intensity Daily Personal Activities 328 29 357 9%
Household tasks 1,164 258 1,422 22%
Interpreting and translation 125 8 133 6%
Participation in community, social and civic activities 470 43 513 9%
Assistive Technology
Assistive equipment for recreation 499 95 594 19%
Assistive products for household tasks 540 101 641 19%
Assistance products for personal care and safety 858 152 1,010 18%
Communication and information equipment 398 51 449 13%
Customised Prosthetics 255 34 289 13%
Hearing Equipment 110 19 129 17%
Hearing Services 5 0 5 0%
Personal Mobility Equipment 613 108 721 18%
Specialised Hearing Services 10 2 12 20%
Vision Equipment 153 28 181 18%
Capacity Building Services
Assistance in coordinating or managing life stages, transitions and supports
473 57 530 12%
Behaviour Support 647 85 732 13%
Community nursing care for high needs 310 48 358 15%
Development of daily living and life skills 424 38 462 9%
Early Intervention supports for early childhood 876 98 974 11%
Exercise Physiology and Physical Wellbeing activities
538 134 672 25%
Innovative Community Participation 749 172 921 23%
Specialised Driving Training 92 18 110 20%
Therapeutic Supports 1,607 228 1,835 14%
Capital services
Home modification design and construction 610 99 709 16%
Specialised Disability Accommodation 212 49 261 23%
Vehicle Modifications 95 17 112 18%
Choice and control support services
Management of funding for supports in participants plan
287 39 326 14%
Support Coordination 541 81 622 15%
Employment and Education support services
Assistance to access and/or maintain employment and/or education
67 1 68 1%
Specialised Supported Employment 24 3 27 13%
Total approved providers 4,629 776 5,405 17%
161 The 15 providers whose registration ended during the third quarter of 2018-19 are not included in the 2018-19 Q2 and prior numbers in this table.

March 2019 | COAG Disability Reform Council Quarterly Report 170
Table H.43 Key markets indicators by quarter - QLD
Market indicators Prior Quarters 2018-19 Q3
a) Average number of providers per participant 1.54 1.45
b) Number of providers delivering new supports 762 888
c) Change in the number of active/inactive providers:
Active (%) 35% 36%
Not yet active (%) 60% 58%
Inactive (%) 5% 6%
d) Share of payments - top 25%
Daily Tasks/Shared Living (%) 84% 86%
Therapeutic Supports (%) 85% 87%
Participate Community (%) 83% 83%
Early Childhood Supports (%) 90% 89%
Assist Personal Activities (%) 81% 82%

March 2019 | COAG Disability Reform Council Quarterly Report 171
Table H.44 Cumulative number of providers that have been active by registration group - QLD
Registration Group Prior
Quarters 2018-19
Q3 Total % Change
Assistance services
Accommodation / Tenancy Assistance 22 7 29 32%
Assistance Animals 2 0 2 0%
Assistance with daily life tasks in a group or shared living arrangement
172 36 208 21%
Assistance with travel/transport arrangements 208 39 247 19%
Daily Personal Activities 305 37 342 12%
Group and Centre Based Activities 186 20 206 11%
High Intensity Daily Personal Activities 198 25 223 13%
Household tasks 394 93 487 24%
Interpreting and translation 12 1 13 8%
Participation in community, social and civic activities 328 43 371 13%
Assistive Technology
Assistive equipment for recreation 40 7 47 18%
Assistive products for household tasks 25 6 31 24%
Assistance products for personal care and safety 297 76 373 26%
Communication and information equipment 39 11 50 28%
Customised Prosthetics 62 14 76 23%
Hearing Equipment 11 0 11 0%
Hearing Services 2 0 2 0%
Personal Mobility Equipment 132 23 155 17%
Specialised Hearing Services 5 0 5 0%
Vision Equipment 13 3 16 23%
Capacity Building Services
Assistance in coordinating or managing life stages, transitions and supports
291 43 334 15%
Behaviour Support 121 31 152 26%
Community nursing care for high needs 49 10 59 20%
Development of daily living and life skills 224 26 250 12%
Early Intervention supports for early childhood 239 55 294 23%
Exercise Physiology and Physical Wellbeing activities
117 41 158 35%
Innovative Community Participation 46 8 54 17%
Specialised Driving Training 18 4 22 22%
Therapeutic Supports 780 179 959 23%
Capital services
Home modification design and construction 61 13 74 21%
Specialised Disability Accommodation 8 2 10 25%
Vehicle Modifications 24 5 29 21%
Choice and control support services
Management of funding for supports in participants plan
184 33 217 18%
Support Coordination 76 20 96 26%
Employment and Education support services
Assistance to access and/or maintain employment and/or education
17 6 23 35%
Specialised Supported Employment 15 1 16 7%
Total approved active providers 1,863 410 2,273 22%

March 2019 | COAG Disability Reform Council Quarterly Report 172
Table H.45 Number of approved and active providers in each registration group by legal entity type as at 31 March 2019 – QLD
Registration Group
Approved Active
Individual/ sole trader
Company/ organisation
Total Approved
Individual/ sole trader
Company/ organisation
Total Active
Assistance services
Accommodation / Tenancy Assistance
130 438 568 12 17 29
Assistance Animals 0 3 3 0 2 2
Assistance with daily life tasks in a group or shared living arrangement
36 323 359 9 199 208
Assistance with travel/transport arrangements
263 765 1,028 30 217 247
Daily Personal Activities 57 415 472 28 314 342
Group and Centre Based Activities
33 337 370 9 197 206
High Intensity Daily Personal Activities
33 324 357 18 205 223
Household tasks 472 950 1,422 155 332 487
Interpreting and translation 32 101 133 5 8 13
Participation in community, social and civic activities
61 452 513 36 335 371
Assistive Technology Assistive equipment for recreation
165 429 594 9 38 47
Assistive products for household tasks
167 474 641 3 28 31
Assistance products for personal care and safety
215 795 1,010 48 325 373
Communication and information equipment
129 320 449 7 43 50
Customised Prosthetics 69 220 289 13 63 76
Hearing Equipment 13 116 129 1 10 11
Hearing Services 0 5 5 0 2 2
Personal Mobility Equipment 162 559 721 22 133 155
Specialised Hearing Services
1 11 12 0 5 5
Vision Equipment 41 140 181 2 14 16
Capacity Building Services Assistance in coordinating or managing life stages, transitions and supports
124 406 530 53 281 334
Behaviour Support 393 339 732 67 85 152
Community nursing care for high needs
51 307 358 8 51 59
Development of daily living and life skills
52 410 462 17 233 250
Early Intervention supports for early childhood
548 426 974 149 145 294
Exercise Physiology and Physical Wellbeing activities
215 457 672 50 108 158
Innovative Community Participation
335 586 921 23 31 54
Specialised Driving Training 22 88 110 7 15 22
Therapeutic Supports 1,014 821 1,835 456 503 959
Capital services Home modification design and construction
207 502 709 12 62 74
Specialised Disability Accommodation
27 234 261 0 10 10
Vehicle Modifications 10 102 112 2 27 29
Choice and control support services
Management of funding for supports in participants plan
44 282 326 24 193 217

March 2019 | COAG Disability Reform Council Quarterly Report 173
Registration Group
Approved Active
Individual/ sole trader
Company/ organisation
Total Approved
Individual/ sole trader
Company/ organisation
Total Active
Support Coordination 221 401 622 21 75 96
Employment and Education support services
Assistance to access and/or maintain employment and/or education
2 66 68 0 23 23
Specialised Supported Employment
2 25 27 0 16 16
Total 2,147 3,258 5,405 823 1,450 2,273
Table H.46 Proportion of approved and active providers in each registration group by legal entity type as at 31 March 2019 –
QLD
Registration Group
Approved Active
Individual/ sole trader
Company/ organisation
Total Approved
Individual/ sole trader
Company/ organisation
Total Active
Assistance services
Accommodation / Tenancy Assistance
23% 77% 568 41% 59% 29
Assistance Animals 0% 100% 3 0% 100% 2
Assistance with daily life tasks in a group or shared living arrangement
10% 90% 359 4% 96% 208
Assistance with travel/transport arrangements
26% 74% 1,028 12% 88% 247
Daily Personal Activities 12% 88% 472 8% 92% 342
Group and Centre Based Activities
9% 91% 370 4% 96% 206
High Intensity Daily Personal Activities
9% 91% 357 8% 92% 223
Household tasks 33% 67% 1,422 32% 68% 487
Interpreting and translation 24% 76% 133 38% 62% 13
Participation in community, social and civic activities
12% 88% 513 10% 90% 371
Assistive Technology Assistive equipment for recreation
28% 72% 594 19% 81% 47
Assistive products for household tasks
26% 74% 641 10% 90% 31
Assistance products for personal care and safety
21% 79% 1,010 13% 87% 373
Communication and information equipment
29% 71% 449 14% 86% 50
Customised Prosthetics 24% 76% 289 17% 83% 76
Hearing Equipment 10% 90% 129 9% 91% 11
Hearing Services 0% 100% 5 0% 100% 2
Personal Mobility Equipment 22% 78% 721 14% 86% 155
Specialised Hearing Services
8% 92% 12 0% 100% 5
Vision Equipment 23% 77% 181 13% 88% 16
Capacity Building Services Assistance in coordinating or managing life stages, transitions and supports
23% 77% 530 16% 84% 334
Behaviour Support 54% 46% 732 44% 56% 152
Community nursing care for high needs
14% 86% 358 14% 86% 59
Development of daily living and life skills
11% 89% 462 7% 93% 250
Early Intervention supports for early childhood
56% 44% 974 51% 49% 294

March 2019 | COAG Disability Reform Council Quarterly Report 174
Registration Group
Approved Active
Individual/ sole trader
Company/ organisation
Total Approved
Individual/ sole trader
Company/ organisation
Total Active
Exercise Physiology and Physical Wellbeing activities
32% 68% 672 32% 68% 158
Innovative Community Participation
36% 64% 921 43% 57% 54
Specialised Driving Training 20% 80% 110 32% 68% 22
Therapeutic Supports 55% 45% 1,835 48% 52% 959
Capital services Home modification design and construction
29% 71% 709 16% 84% 74
Specialised Disability Accommodation
10% 90% 261 0% 100% 10
Vehicle Modifications 9% 91% 112 7% 93% 29
Choice and control support services
Management of funding for supports in participants plan
13% 87% 326 11% 89% 217
Support Coordination 36% 64% 622 22% 78% 96
Employment and Education support services
Assistance to access and/or maintain employment and/or education
3% 97% 68 0% 100% 23
Specialised Supported Employment
7% 93% 27 0% 100% 16
Total 40% 60% 5,405 36% 64% 2,273

March 2019 | COAG Disability Reform Council Quarterly Report 175
Part Five: Financial sustainability
Table H.47 Committed supports by financial year ($m) - QLD
2013-14 2014-15 2015-16 2016-17 2017-18 2018-19
Q1,Q2,Q3162 Total
Total Committed
0.0 0.0 1.0 198.3 789.4 1,539.8 2,528.4
Figure H.2 Distribution of participants by annualised committed support band (including participants with Supported
Independent Living supports) – active participants with initial plan approvals as at 2018-19 Q3 compared with active
participants with initial plan approvals as at 2018-19 Q2 (QLD)
162 Note: the $1.5 billion in respect of 2018-19 Q1,Q2 and Q3 only includes committed supports expected to be used to 31 March 2019.
0.00%
2.00%
4.00%
6.00%
8.00%
10.00%
12.00%
14.00%
16.00%
18.00%
20.00%
Dis
trib
uti
on
o
f p
art
icip
an
ts
Average annualised committed supports band
As at Q2 2018-19 distribution of participants As at Q3 2018-19 distribution of participants

March 2019 | COAG Disability Reform Council Quarterly Report 176
Figure H.3 Distribution of participants by annualised committed support band (excluding participants with Supported
Independent Living supports) – active participants with initial plan approvals as at 2018-19 Q3 compared with active
participants with initial plan approvals as at 2018-19 Q2 (QLD)
0.00%
5.00%
10.00%
15.00%
20.00%
25.00%
Dis
trib
uti
on
o
f p
art
icip
an
ts
Average annualised committed supports band
As at Q2 2018-19 distribution of participants As at Q3 2018-19 distribution of participants

March 2019 | COAG Disability Reform Council Quarterly Report 177
Figure H.4 Average committed support by age group (including participants with Supported Independent Living supports) –
active participants with initial plan approvals as at 2018-19 Q3 compared with active participants with initial plan approvals as
at 2018-19 Q2 (QLD) 163
163 The average revenue amounts have been removed from the figure in this report as the amounts refer to revenue received under the bilateral agreements, and are not linked to age group, primary disability group, and level of function. Therefore, it is not appropriate to make comparisons between revenue and plan budgets in this chart. The amount of revenue received in aggregate should be compared with the amount spent in aggregate – the NDIA has been within budget in all years of operation (including 2018-19).
$0
$20,000
$40,000
$60,000
$80,000
$100,000
$120,000
0 to 6 7 to 14 15 to 18 19 to 24 25 to 34 35 to 44 45 to 54 55 to 64 65+
Av
era
ge
an
nu
ali
se
d c
om
mit
ted
su
pp
ort
s
Age group
As at Q3 2018-19 actual average annualised committed supports
As at Q2 2018-19 actual average annualised committed supports

March 2019 | COAG Disability Reform Council Quarterly Report 178
Figure H.5 Average committed support by primary disability group (including participants with Supported Independent Living
supports) – active participants with initial plan approvals as at 2018-19 Q3 compared with active participants with initial plan
approvals as at 2018-19 Q2 (QLD) 164
164 Ibid.
$0 $20,000 $40,000 $60,000 $80,000 $100,000 $120,000 $140,000
Acquired Brain Injury
Autism
Cerebral Palsy
Developmental Delay
Global Developmental Delay
Hearing Impairment
Intellectual Disability
Multiple Sclerosis
Psychosocial disability
Spinal Cord Injury
Stroke
Visual Impairment
Other Neurological
Other Physical
Other Sensory/Speech
Other
Average annualised committed supports
Pri
ma
ry d
isa
bil
ity
As at Q2 2018-19 actual average annualised committed supports
As at Q3 2018-19 actual average annualised committed supports

March 2019 | COAG Disability Reform Council Quarterly Report 179
Figure H.6 Average committed support by level of function (including participants with Supported Independent Living
supports) – active participants with initial plan approvals as at 2018-19 Q3 compared with active participants with initial plan
approvals as at 2018-19 Q2 (QLD) 165,166
Table H.48 Payments by financial year, compared to committed supports ($m) – QLD
$ Million 2013-14 2014-15 2015-16 2016-17 2017-18 2018-19
Q1,Q2,Q3 Total
Total committed 0.0 0.0 1.0 198.3 789.4 1,539.8 2,528.4
Total paid 0.0 0.0 0.3 111.2 495.7 837.7 1,444.8
% utilised to date 0.0 0.0 32% 56% 63% 54% 55%167
165 Ibid. 166 An ICT issue has been identified and as a result, reporting by level of function is not accurate. This issue is currently
under investigation and will be reconciled for reporting as at 30 June 2019. 167 Note: Only committed supports expected to be used to 31 March 2019 have been used to calculate the utilisation from 1 July 2013 to date, and this will increase as there is a lag between when support is provided and when it is paid.
$0
$50,000
$100,000
$150,000
$200,000
$250,000
$300,000
$350,000
$400,000
$450,000
1 2 3 4 5 6 7 8 9 10 11 12 13 14 15
Av
era
ge
an
nu
ali
se
d c
os
t
Level of function
As at Q3 2018-19 actual average annualised committed supports
As at Q2 2018-19 actual average annualised committed supports

March 2019 | COAG Disability Reform Council Quarterly Report 180
Figure H.7 Utilisation of committed supports as at 31 December 2018 and 31 March 2019 (QLD)

March 2019 | COAG Disability Reform Council Quarterly Report 181
Appendix I: Appendix I:
Western Australia
Part One: Participants and their plans
Table I.1 Plan approvals compared to estimates – WA168
Prior
Quarters 2018-19 Q3
Total excluding
ECEI
Total including
ECEI
Bilateral estimates
WA 9,527 4,100 13,627 13,633 10,600
Table I.2 Quarterly intake split by plan and entry type since 1 July 2013 – WA169
Prior Quarters 2018-19 Q3 Total
Access decisions 18,243 2,173 20,416
Access Met 16,664 1,761 18,425
State 11,282 793 12,075
Commonwealth 612 146 758
New 4,770 822 5,592
Total Participant Plans 9,607 4,106 13,633
State 6,011 3,002 9,013
Commonwealth 300 134 434
New 3,216 964 4,180
ECEI170 80 6 6
Total Participant Plans 9,607 4,106 13,633
Early Intervention (s25) 1,210 240 1,450
Permanent Disability (s24) 8,317 3,860 12,177
ECEI171 80 6 6
Table I.3 Exits from the Scheme since 1 July 2013 as at 31 March 2019 – WA
Exits
Total participant exits 149
Early Intervention participants 26
Permanent disability participants 123
168 In this table the 13,627 participants include the 6,206 WA participants who had transferred from the WA NDIS to the nationally delivered NDIS. However, as the WA bilateral estimates include NDIA trial sites only, the calculation of the percentage of estimate excludes these WA transfer participants in subsequent tables where the percentage of estimate is shown. 169 The Joint Standing Committee on the NDIS, in its final report on Hearing Services, recommended that the NDIA better understand the eligibility rate for people with a hearing impairment. Of the number of access decisions in 2018-19 Q3, 85% of people with a hearing impairment met the access criteria compared to 81% overall. 170 The number of children supported in the ECEI gateway cannot be summed across quarters as they can transition to
NDIS plans, hence the ECEI figure shown is cumulative. 171 Ibid.

March 2019 | COAG Disability Reform Council Quarterly Report 182
Table I.4 Cumulative position by services previously received – WA172,173
Participant cohort Bilateral estimate
% of estimate
State Commonwealth New ECEI Total
Trial 1,603 50 841 2,494 2,493 100%
End of 2016-17 2,122 85 1,575 0 3,782 3,778 100%
End of 2017-18 2,379 127 2,002 0 4,508 5,566 78%
End of 2018-19 Q1 3,118 180 2,326 2 5,626 6,080 77%
End of 2018-19 Q2 6,011 300 3,216 80 9,607 8,340 68%
End of 2018-19 Q3 9,013 434 4,180 6 13,633 10,600 70%
Table I.5 Cumulative position by entry into the Scheme – WA174
Participant cohort Bilateral estimate
% of estimate
Early
Intervention Permanent Disability
ECEI Total
Trial 363 2,131 2,494 2,493 100%
End of 2016-17 667 3,115 0 3,782 3,778 100%
End of 2017-18 854 3,654 0 4,508 5,566 78%
End of 2018-19 Q1 968 4,656 2 5,626 6,080 77%
End of 2018-19 Q2 1,210 8,317 80 9,607 8,340 68%
End of 2018-19 Q3 1,450 12,177 6 13,633 10,600 70%
Note: in the below tables the percentage figures have been rounded. Therefore, the totals may not
always add up to one hundred per cent.
Table I.6 Participant profile per quarter by Aboriginal and Torres Strait islander status – WA
Prior Quarters 2018-19 Q3 Total
Participant profile N % N % N %
Aboriginal and Torres Strait Islander 431 4.6% 219 5.3% 650 4.8%
Not Aboriginal and Torres Strait Islander 8,767 93.5% 3,808 92.9% 12,575 93.3%
Not Stated 180 1.9% 73 1.8% 253 1.9%
Total 9,378 100% 4,100 100% 13,478 100%
Table I.7 Participant profile per quarter by culturally and linguistically diverse (CALD) status – WA
Prior Quarters 2018-19 Q3 Total
Participant profile N % N % N %
CALD 542 5.8% 173 4.2% 715 5.3%
Not CALD 5,590 59.6% 2,062 50.3% 7,652 56.8%
Not Stated 3,246 34.6% 1,865 45.5% 5,111 37.9%
Total 9,378 100% 4,100 100% 13,478 100%
Table I.8 Participant profile per quarter by Young people in Residential aged care (YPIRAC) status – WA
Prior Quarters 2018-19 Q3 Total
Participant profile N % N % N %
YPIRAC 35 0.4% 3 0.1% 38 0.3%
Not YPIRAC 9,343 99.6% 4,097 99.9% 13,440 99.7%
Total 9,378 100% 4,100 100% 13,478 100%
172 Updated lists of clients are provided by State/Territory and Commonwealth governments each quarter. This results in some participants being retrospectively reclassified as State, Commonwealth or New. The NDIS has been notified of a specific issue regarding the classification of some participants in WA which is now under discussion and may lead to reclassifications in future periods. 173 In this table the participant numbers include the WA participants who had transferred from the WA NDIS to the nationally delivered NDIS. However, as the WA bilateral estimates include NDIA trial sites only, the calculation of the percentage of estimate excludes these WA transfer participants. 174 Ibid.

March 2019 | COAG Disability Reform Council Quarterly Report 183
Table I.9 Participant profile per quarter by remoteness – WA175,176
Prior Quarters 2018-19 Q3 Total
Participant profile N % N % N %
Major Cities 8,261 88.2% 2,660 64.9% 10,921 81.1%
Population > 50,000 319 3.4% 354 8.6% 673 5.0%
Population between 15,000 and 50,000
319 3.4% 319 7.8% 638 4.7%
Population between 5,000 and 15,000
96 1.0% 131 3.2% 227 1.7%
Population less than 5,000 234 2.5% 413 10.1% 647 4.8%
Remote 111 1.2% 194 4.7% 305 2.3%
Very Remote 24 0.3% 26 0.6% 50 0.4%
Missing 14 3 17
Total 9,378 100% 4,100 100% 13,478 100%
Table I.10 Participant profile per quarter by disability group - WA177,178
Prior Quarters 2018-19 Q3 Total
Disability N % N % N %
Autism 3,198 34% 1,488 36% 4,686 35%
Intellectual Disability179 2,423 26% 1,105 27% 3,528 26%
Psychosocial disability 694 7% 225 5% 919 7%
Cerebral Palsy 414 4% 167 4% 581 4%
Other Neurological 497 5% 249 6% 746 6%
Developmental Delay 220 2% 64 2% 284 2%
Other Physical 434 5% 198 5% 632 5%
Hearing Impairment 200 2% 113 3% 313 2%
ABI 279 3% 121 3% 400 3%
Visual Impairment 176 2% 80 2% 256 2%
Multiple Sclerosis 217 2% 92 2% 309 2%
Global Developmental Delay 294 3% 95 2% 389 3%
Stroke 95 1% 20 0% 115 1%
Spinal Cord Injury 148 2% 73 2% 221 2%
Other Sensory/Speech 80 1% 7 0% 87 1%
Other 9 0% 3 0% 12 0%
Total 9,378 100% 4,100 100% 13,478 100%
175 This table is based on the Modified Monash Model measure of remoteness. 176 The distributions are calculated excluding active participants with a missing remoteness classification. 177 Table order based on national proportions (highest to lowest) 178 Note: Since 2017-18 Q1, the disability groups Developmental Delay and Global Developmental Delay have been reported separately to the Intellectual Disability group. 179 Down Syndrome is included in Intellectual Disability, representing 3% of all Scheme participants in WA (440).
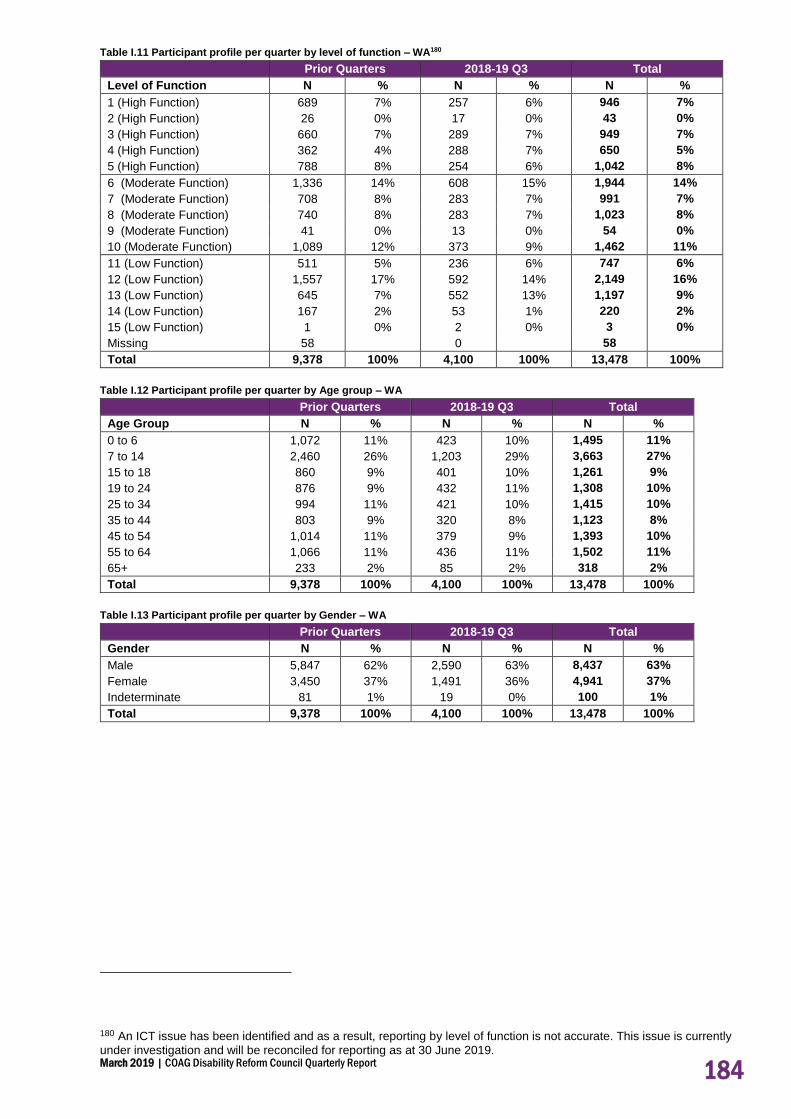
March 2019 | COAG Disability Reform Council Quarterly Report 184
Table I.11 Participant profile per quarter by level of function – WA180
Prior Quarters 2018-19 Q3 Total
Level of Function N % N % N %
1 (High Function) 689 7% 257 6% 946 7%
2 (High Function) 26 0% 17 0% 43 0%
3 (High Function) 660 7% 289 7% 949 7%
4 (High Function) 362 4% 288 7% 650 5%
5 (High Function) 788 8% 254 6% 1,042 8%
6 (Moderate Function) 1,336 14% 608 15% 1,944 14%
7 (Moderate Function) 708 8% 283 7% 991 7%
8 (Moderate Function) 740 8% 283 7% 1,023 8%
9 (Moderate Function) 41 0% 13 0% 54 0%
10 (Moderate Function) 1,089 12% 373 9% 1,462 11%
11 (Low Function) 511 5% 236 6% 747 6%
12 (Low Function) 1,557 17% 592 14% 2,149 16%
13 (Low Function) 645 7% 552 13% 1,197 9%
14 (Low Function) 167 2% 53 1% 220 2%
15 (Low Function) 1 0% 2 0% 3 0%
Missing 58 0 58
Total 9,378 100% 4,100 100% 13,478 100%
Table I.12 Participant profile per quarter by Age group – WA
Prior Quarters 2018-19 Q3 Total
Age Group N % N % N %
0 to 6 1,072 11% 423 10% 1,495 11%
7 to 14 2,460 26% 1,203 29% 3,663 27%
15 to 18 860 9% 401 10% 1,261 9%
19 to 24 876 9% 432 11% 1,308 10%
25 to 34 994 11% 421 10% 1,415 10%
35 to 44 803 9% 320 8% 1,123 8%
45 to 54 1,014 11% 379 9% 1,393 10%
55 to 64 1,066 11% 436 11% 1,502 11%
65+ 233 2% 85 2% 318 2%
Total 9,378 100% 4,100 100% 13,478 100%
Table I.13 Participant profile per quarter by Gender – WA
Prior Quarters 2018-19 Q3 Total
Gender N % N % N %
Male 5,847 62% 2,590 63% 8,437 63%
Female 3,450 37% 1,491 36% 4,941 37%
Indeterminate 81 1% 19 0% 100 1%
Total 9,378 100% 4,100 100% 13,478 100%
180 An ICT issue has been identified and as a result, reporting by level of function is not accurate. This issue is currently
under investigation and will be reconciled for reporting as at 30 June 2019.

March 2019 | COAG Disability Reform Council Quarterly Report 185
Part Two: Participant experience and outcomes
Table I.14 Number of questionnaires completed by SFOF version – WA181
Version
Number of questionnaires
collected 2016-17
Number of questionnaires
collected 2017-18
Number of questionnaires collected YTD
2018-19
Number of questionnaires
Participant 0 to school
299 134 444 877
Participant school to 14
284 225 3,199 3,708
Participant 15 to 24 145 58 1,664 1,867
Participant 25 and over
504 293 3,747 4,544
Total Participant 1,232 710 9,054 10,996
Family 0 to 14 564 350 3,225 4,139
Family 15 to 24 39 41 1,159 1,239
Family 25 and over 23 81 1,255 1,359
Total Family 626 472 5,639 6,737
Total 1,858 1,182 14,693 17,733
Table I.15 Selected key indicators for participants – Daily Living (DL) and Choice and Control (CC) – WA
Indicator 0 to before
school School to 14
15 to 24 25 and over
DL
% with concerns in 6 or more of the areas: gross motor skills, fine motor skills, self-care, eating, social interaction, communication, cognitive development, sensory processing
68%
CC % who say their child is able to tell them what he/she wants
64%
DL % developing functional, learning and coping skills appropriate to their ability and circumstances
36%
DL % who say their child is becoming more independent
49%
CC % of children who have a genuine say in decisions about themselves
71%
CC % who are happy with the level of independence/control they have now
45%
CC % who choose who supports them 38% 62%
CC % who choose what they do each day 49% 69%
CC % who had been given the opportunity to participate in a self-advocacy group meeting
17% 24%
CC % who want more choice and control in their life
70% 62%
181 Baseline outcomes for participants and/or their families and carers were collected for 99.6% of participants.

March 2019 | COAG Disability Reform Council Quarterly Report 186
Table I.16 Selected key indicators for participants – Relationships (REL) and Social/Community Participation (S/CP) – WA
Indicator 0 to before
school School to
14 15 to 24
25 and over
REL % of children who can make friends with people outside the family
54% 67%
S/CP % of children who participate in age appropriate community, cultural or religious activities
46%
REL % of children who spend time after school and on weekends with friends and/or in mainstream programs
39%
REL Of these, % who are welcomed or actively included
68% 83%
REL % of children who spend time with friends without an adult present
16%
REL % with no friends other than family or paid staff
33% 26%
S/CP % who have been actively involved in a community, cultural or religious group in the last 12 months
40% 42%
Table I.17 Selected key indicators for participants – Lifelong Learning (LL), Work (WK), Home (HM) and Health and Wellbeing
(HW) – WA
Indicator 0 to before
school School to
14 15 to 24
25 and over
LL % of children attending school in a mainstream class
65%
HM % who are happy with their home 87% 82%
HM % who feel safe or very safe in their home
87% 76%
HW % who rate their health as good, very good or excellent
74% 49%
HW % who did not have any difficulties accessing health services
85% 82%
LL % who currently attend or previously attended school in a mainstream class
40%
LL % who participate in education, training or skill development
8%
LL Of those who participate, % who do so in mainstream settings
68%
LL % unable to do a course or training they wanted to do in the last 12 months
24%
WK % who have a paid job 24% 25%
WK % who volunteer 19% 14%

March 2019 | COAG Disability Reform Council Quarterly Report 187
Table I.18 Selected key indicators for families/carers of participants – WA
Indicator 0 to 14 15 to 24 25 and over
% receiving Carer Payment 17% 21% 21%
% receiving Carer Allowance 51% 50% 36%
% working in a paid job 46% 52% 33%
Of those in a paid job, % in permanent employment
76% 76% 85%
Of those in a paid job, % working 15 hours or more
77% 85% 85%
% who say they (and their partner) are able to work as much as they want
44% 54% 71%
Of those unable to work as much as they want, % who say the situation of their child/family member with disability is a barrier to working more
88% 88% 90%
Of those unable to work as much as they want, % who say insufficient flexibility of jobs is a barrier to working more
31% 22% 16%
% able to advocate for their child/family member
77% 73% 75%
% who have friends and family they see as often as they like
43% 49% 56%
% who feel very confident or somewhat confident in supporting their child's development
90%
% who know what their family can do to enable their family member with disability to become as independent as possible
55%
% who feel in control selecting services 61% 65%
% who have made plans (or begun to make plans) for when they are no longer able to care for their family member with disability
47%
% who rate their health as good, very good or excellent
75% 68% 64%
Table I.19 Results for “Has the NDIS helped?” questions answered at review, for SFOF version ‘Participant 0 to school’ (n=44) –
WA182
Question % Yes
DL Has the NDIS improved your child's development? 84%
DL Has the NDIS improved your child's access to specialist services? 93%
CC Has the NDIS helped increase your child's ability to communicate what they want?
73%
REL Has the NDIS improved how your child fits into family life? 61%
S/CP Has the NDIS improved how your child fits into community life? 68%
182 Results in Tables I.19 to I.22 exclude participants who had their first plan approved between 1 July 2016 and 31
March 2017, as these participants have been included in Tables I.23 to I.25.

March 2019 | COAG Disability Reform Council Quarterly Report 188
Table I.20 Results for “Has the NDIS helped?” questions answered at review, for SFOF version ‘Participant school to 14'
(n=218) – WA
Question % Yes
DL Has the NDIS helped your child to become more independent? 69%
LL Has the NDIS improved your child's access to education? 46%
REL Has the NDIS improved your child's relationships with family and friends?
58%
S/CP Has the NDIS improved your child's social and recreational life? 46%
Table I.21 Results for “Has the NDIS helped?” questions answered at review, for SFOF versions ‘Participant 15 to 24' (n=73)
and 'Participant 25 and over' (n=212) – WA
Question 15 to 24 % Yes
25+ % Yes
CC Has the NDIS helped you have more choices and more control over your life?
65% 81%
DL Has the NDIS helped you with daily living activities? 71% 82%
REL Has the NDIS helped you to meet more people? 56% 59%
HM Has your involvement with the NDIS helped you to choose a home that's right for you?
23% 25%
HW Has your involvement with the NDIS improved your health and wellbeing?
58% 56%
LL Has your involvement with the NDIS helped you to learn things you want to learn or to take courses you want to take?
40% 31%
WK Has your involvement with the NDIS helped you find a job that's right for you?
34% 19%
S/CP Has the NDIS helped you be more involved? 62% 66%
Table I.22 Results for “Has the NDIS helped?” questions answered at review, for SFOF version ‘Family 0 to 14’ (n=254); and for
SFOF versions ‘Family 15 to 24’ and ‘Family 25 and over’ combined (n=58) – WA
Question 0 to 14 % Yes
15+ % Yes
Has the NDIS improved your capacity to advocate (stand up) for your child? / Has the NDIS helped you to know your rights and advocate effectively?
65% 57%
Has the NDIS improved the level of support for your family? 69% 73%
Has the NDIS improved your access to services, programs and activities in the community? / Has the NDIS helped you to access services, programs and activities in the community?
81% 63%
Has the NDIS improved your ability/capacity to help your child develop and learn?
79%
Has the NDIS improved your health and wellbeing? 46% 44%

March 2019 | COAG Disability Reform Council Quarterly Report 189
Table I.23 Results for “Has the NDIS helped?” questions answered at end of participant's first and second years in the Scheme,
for SFOF version ‘Participant school to 14' – WA183,184
Question Year 1 Year 2 Change
DL Has the NDIS helped your child to become more independent? 73% 80% +6%
LL Has the NDIS improved your child's access to education? 44% 49% +6%
REL Has the NDIS improved your child's relationships with family and friends?
54% 58% +4%
S/CP Has the NDIS improved your child's social and recreational life? 59% 62% +3%
Table I.24 Results for “Has the NDIS helped?” questions answered at end of participant's first and second years in the Scheme,
for SFOF versions ‘Participant 15 to 24' and 'Participant 25 and over' – WA
15 to 24 25 and over
Question Year 1 Year 2 Change Year 1 Year 2 Change
CC Has the NDIS helped you have more choices and more control over your life?
54% 54% 0% 73% 76% +2%
DL Has the NDIS helped you with daily living activities?
50% 60% +10% 79% 84% +5%
REL Has the NDIS helped you to meet more people?
39% 40% +1% 55% 59% +4%
HM Has your involvement with the NDIS helped you to choose a home that's right for you?
18% 21% +3% 32% 32% 0%
HW Has your involvement with the NDIS improved your health and wellbeing?
43% 48% +5% 51% 54% +3%
LL Has your involvement with the NDIS helped you to learn things you want to learn or to take courses you want to take?
39% 32% -7% 34% 31% -3%
WK Has your involvement with the NDIS helped you find a job that's right for you?
13% 24% +11% 24% 22% -2%
S/CP Has the NDIS helped you be more involved? 61% 64% +3% 67% 71% +4%
183 Results in Tables I.23 to I.26 include participants who had their first plan approved between 1 July 2016 and 31 March
2017. While this is a relatively small group of participants, the number of participants included in these tables will grow over time. 184 There is insufficient data to show results for “Has the NDIS helped?” questions answered at end of participant’s first
and second years in the Scheme, for SFOF version ‘Participant 0 to school’.

March 2019 | COAG Disability Reform Council Quarterly Report 190
Table I.25 Results for “Has the NDIS helped?” questions answered at end of participant's first and second years in the Scheme,
for SFOF version ‘Family 0 to 14’ – WA185
0 to 14
Question Year 1 Year 2 Change
Has the NDIS improved your capacity to advocate (stand up) for your child? / Has the NDIS helped you to know your rights and advocate effectively?
58% 64% +6%
Has the NDIS improved the level of support for your family?
76% 76% +1%
Has the NDIS improved your access to services, programs and activities in the community? / Has the NDIS helped you to access services, programs and activities in the community?
80% 87% +6%
Has the NDIS improved your ability/capacity to help your child develop and learn?
77% 79% +2%
Has the NDIS improved your health and wellbeing?
55% 56% +1%
Table I.26 Progress against the NDIA’s corporate plan metrics for ‘participants in work’ and ‘participants in community and
social activities’ –WA186
Participants in work Baseline Year 2 2018–19 Target
Aged 15 to 24 years 16% 18%
26% Aged 25+ 25% 26%
Aged 15+ (average) 24% 25%
Participants in community and social activities Baseline Year 2 2018–19 Target
Aged 15 to 24 years 34% 49%
41% Aged 25+ 35% 39%
Aged 15+ (average) 36% 42%
185 There is insufficient data to show results for SFOF versions ‘Family 15 to 24’ and ‘Family 25 and over’ combined. 186 Results are drawn from participants’ responses to SFOF questionnaires, and only include participants who had their
first plan approved between 1 July 2016 and 31 March 2017.

March 2019 | COAG Disability Reform Council Quarterly Report 191
Figure I.1 Proportion of participants describing satisfaction with the Agency planning process as good or very good by quarter
– Existing survey administered by NDIA regions (WA)*187
*Of the participants describing satisfaction with the Agency planning process in Q3 of 2018-19, 88% gave a rating of good or very good,
5% gave a neutral rating and 7% gave a rating of poor or very poor.
Table I.27 Proportion of Participants rating their level of agreement as strongly agree, agree, neutral, disagree or strongly
disagree in response to statements about the planning process – Existing survey administered by NDIA regions (WA)
Agree /
strongly agree
Neutral Disagree / strongly disagree
The planner listened to me 93% 2% 5%
I had enough time to tell my story and say what support I need
89% 4% 7%
The planner knows what I can do well 75% 15% 10%
The planner had some good ideas for my plan 88% 4% 8%
I know what is in my plan 78% 11% 11%
The planner helped me think about my future 52% 25% 23%
I think my plan will make my life better 87% 6% 7%
The planning meeting went well 90% 3% 7%
Table I.28 Plan reviews conducted per quarter – excluding plans less than 30 days – WA188
Prior Quarters
(Transition only)
2018-19 Q3 Transition
Total
Total plan reviews 8,353 1,295 9,648
Early intervention plans 1,371 158 1,529
Permanent disability plans 6,982 1,137 8,119
Table I.29 Scheduled plan reviews conducted by quarter – excluding plans less than 30 days – WA
Prior Quarters
(Transition only) 2018-19 Q3 Transition Total
Total scheduled plan reviews 7,119 930 8,049
Trial participants 5,178 504 5,682
Transition participants 1,941 426 2,367
187 Participant satisfaction results are not shown if there is insufficient data in the group. 188 Plans less than 30 days in duration have been excluded from this tabulation, as these reviews are more likely to
represent corrections to the plan rather than a new plan review to address a change in circumstance.
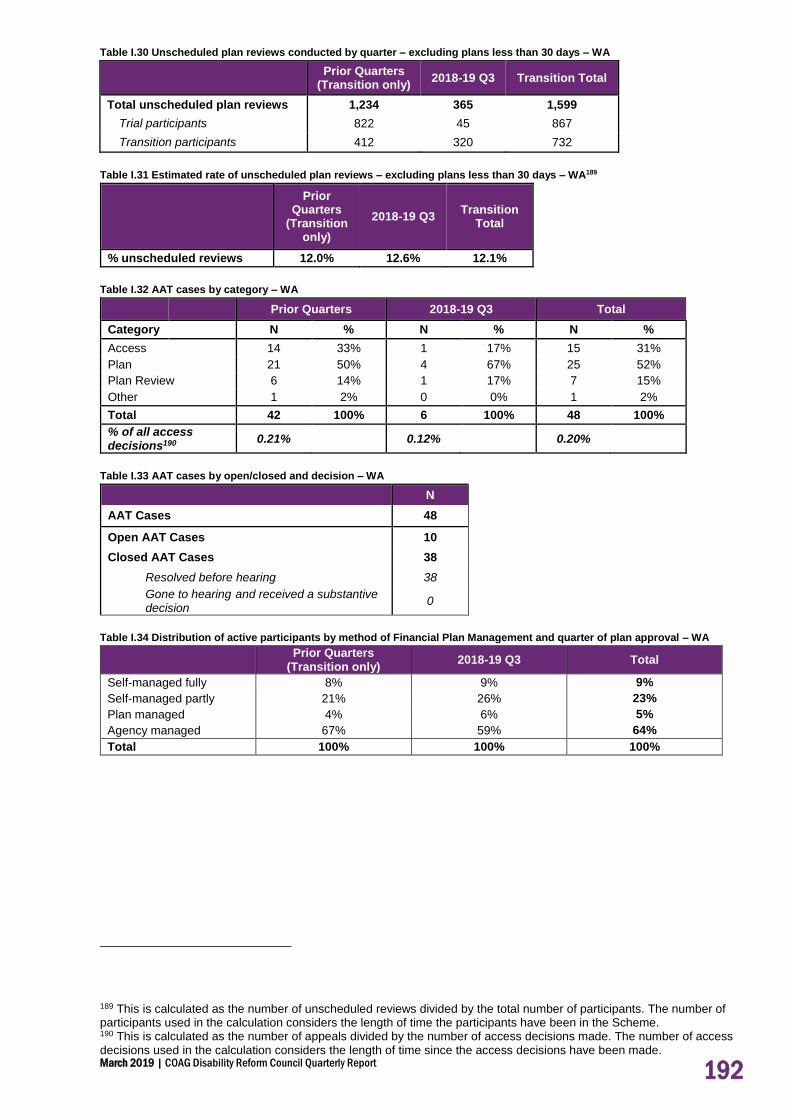
March 2019 | COAG Disability Reform Council Quarterly Report 192
Table I.30 Unscheduled plan reviews conducted by quarter – excluding plans less than 30 days – WA
Prior Quarters
(Transition only) 2018-19 Q3 Transition Total
Total unscheduled plan reviews 1,234 365 1,599
Trial participants 822 45 867
Transition participants 412 320 732
Table I.31 Estimated rate of unscheduled plan reviews – excluding plans less than 30 days – WA189
Prior Quarters
(Transition only)
2018-19 Q3 Transition
Total
% unscheduled reviews 12.0% 12.6% 12.1%
Table I.32 AAT cases by category – WA
Prior Quarters 2018-19 Q3 Total
Category N % N % N %
Access 14 33% 1 17% 15 31%
Plan 21 50% 4 67% 25 52%
Plan Review 6 14% 1 17% 7 15%
Other 1 2% 0 0% 1 2%
Total 42 100% 6 100% 48 100%
% of all access decisions190
0.21% 0.12% 0.20%
Table I.33 AAT cases by open/closed and decision – WA
N
AAT Cases 48
Open AAT Cases 10
Closed AAT Cases 38
Resolved before hearing 38
Gone to hearing and received a substantive decision
0
Table I.34 Distribution of active participants by method of Financial Plan Management and quarter of plan approval – WA
Prior Quarters
(Transition only) 2018-19 Q3 Total
Self-managed fully 8% 9% 9%
Self-managed partly 21% 26% 23%
Plan managed 4% 6% 5%
Agency managed 67% 59% 64%
Total 100% 100% 100%
189 This is calculated as the number of unscheduled reviews divided by the total number of participants. The number of participants used in the calculation considers the length of time the participants have been in the Scheme. 190 This is calculated as the number of appeals divided by the number of access decisions made. The number of access decisions used in the calculation considers the length of time since the access decisions have been made.

March 2019 | COAG Disability Reform Council Quarterly Report 193
Table I.35 Distribution of active participants by support coordination and quarter of plan approval – WA
Prior Quarters
(Transition only) 2018-19 Q3 Total
Support coordination 41% 39% 40%
Table I.36 Duration to plan activation by quarter of initial plan approval for active participants – WA191,192
Prior Quarters
(Transition Only) 2018-19 Q1
Plan activation N % N %
Less than 30 days 1,257 64% 846 76%
30 to 59 days 249 13% 99 9%
60 to 89 days 130 7% 37 3%
Activated within 90 days
1,636 83% 982 88%
90 to 119 days 86 4% 21 2%
120 days and over 159 8% 21 2%
Activated between 90 and 180 days
245 12% 42 4%
No payments 93 5% 90 8%
Total plans approved 1,974 100% 1,114 100%
191 Note: Plans approved after the end of 2018-19 Q1 have been excluded from the table. They are relatively new and it is too early to examine their durations to activation. 192 There has been a change in methodology used to calculate these results since the previous quarter. Duration to plan
activation is now calculated as the time from a participant’s initial plan approval to when the participant first uses plan supports (previously only the initial plan for each participant was considered). In-kind supports are now also included (previously excluded). As a result, a higher proportion of participants are identified as activating their plans within 90 days, and a lower proportion have no payments.

March 2019 | COAG Disability Reform Council Quarterly Report 194
Table I.37 Proportion of active participants with plan activated within 12 months – WA
Number of participants
activated within 12 months
All participants with duration of
at least 12 months
Proportion activated
by Aboriginal and Torres Strait Islander status
Aboriginal and Torres Strait Islander 159 172 92%
Not Aboriginal and Torres Strait Islander 3,503 3,718 94%
Not Stated 61 67 91%
Total 3,723 3,957 94%
by Culturally and Linguistically Diverse status
CALD 277 288 96%
Not CALD 3,377 3,596 94%
Not Stated 69 73 95%
Total 3,723 3,957 94%
by Remoteness
Major Cities 3,393 3,592 94%
Regional 310 341 91%
Remote 12 15 80%
Missing 8 9 89%
Total 3,723 3,957 94%
by Primary Disability type
Autism 1,251 1,355 92% Intellectual Disability (including Down Syndrome) 926 986 94%
Psychosocial Disability 296 307 96% Developmental Delay (including Global Developmental Delay) 202 215 94%
Other 1,048 1,094 96%
Total 3,723 3,957 94%
Table I.38 Distribution of plans by plan utilisation and quarter of plan approval for 2016-17, 2017-18 and quarter 1 of 2018-19–
WA193,194
Plan utilisation Prior Quarters
(Transition only) 2018-19 Q1 Total
0% to 50% 32% 49% 34%
50% to 75% 26% 23% 26%
> 75% 42% 28% 40%
Total 100% 100% 100%
193 Plans less than 30 days in duration have been excluded from this tabulation, as these plans are more likely to
represent corrections to the plan rather than an unscheduled plan review to address a change in circumstance. 194 This table only considers committed supports and payments for supports provided to 31 December 2018. This gives some allowance for the timing delay between when the support is provided and when it is paid.

March 2019 | COAG Disability Reform Council Quarterly Report 195
Table I.39 Proportion of active participants with approved plans accessing mainstream supports – WA
Prior
Quarters 2018-19 Q3 Total
Daily Activities 5% 5% 5%
Health & Wellbeing 49% 46% 48%
Lifelong Learning 21% 21% 21%
Other 15% 14% 15%
Non-categorised 28% 28% 28%
Any mainstream service 90% 89% 90%
Part Three: Providers and the growing market
Table I.40 Key provider indicators by quarter - WA195
Prior Quarters 2018-19 Q3 Total
Provider indicators
a) Registrations by profile
Individual/ sole trader 211 15 226
Company/ organisation 853 41 889
Total 1,064 56 1,115
b) Registration revoked 5
195 The total number of providers as at 31 March 2019 (1,115) is not the sum of the number of providers as at 31
December 2018 (1,064) and the providers registered in the third quarter of 2018-19 (56). This is due to 5 providers whose registration ended during the third quarter of 2018-19.

March 2019 | COAG Disability Reform Council Quarterly Report 196
Table I.41 Number of approved providers by registration group - WA196
Registration Group Prior
Quarters 2018-19
Q3 Total % Change
Assistance services
Accommodation / Tenancy Assistance 105 6 111 6%
Assistance Animals 2 0 2 0%
Assistance with daily life tasks in a group or shared living arrangement
104 10 114 10%
Assistance with travel/transport arrangements 183 12 195 7%
Daily Personal Activities 125 11 136 9%
Group and Centre Based Activities 101 12 113 12%
High Intensity Daily Personal Activities 113 11 124 10%
Household tasks 187 16 203 9%
Interpreting and translation 53 0 53 0%
Participation in community, social and civic activities 145 14 159 10%
Assistive Technology
Assistive equipment for recreation 166 1 167 1%
Assistive products for household tasks 131 3 134 2%
Assistance products for personal care and safety 309 7 316 2%
Communication and information equipment 122 1 123 1%
Customised Prosthetics 85 2 87 2%
Hearing Equipment 48 0 48 0%
Hearing Services 7 2 9 29%
Personal Mobility Equipment 235 8 243 3%
Specialised Hearing Services 14 2 16 14%
Vision Equipment 49 4 53 8%
Capacity Building Services
Assistance in coordinating or managing life stages, transitions and supports
123 9 132 7%
Behaviour Support 109 8 117 7%
Community nursing care for high needs 69 4 73 6%
Development of daily living and life skills 128 10 138 8%
Early Intervention supports for early childhood 119 5 124 4%
Exercise Physiology and Physical Wellbeing activities
88 4 92 5%
Innovative Community Participation 123 10 133 8%
Specialised Driving Training 52 7 59 13%
Therapeutic Supports 255 18 273 7%
Capital services
Home modification design and construction 126 5 131 4%
Specialised Disability Accommodation 26 1 27 4%
Vehicle Modifications 32 0 32 0%
Choice and control support services
Management of funding for supports in participants plan
59 10 69 17%
Support Coordination 91 16 107 18%
Employment and Education support services
Assistance to access and/or maintain employment and/or education
64 2 66 3%
Specialised Supported Employment 23 0 23 0%
Total approved providers 1,059 56 1,115 5%
196 The 5 providers whose registration ended during the third quarter of 2018-19 are not included in the 2018-19 Q2 and prior numbers in this table.

March 2019 | COAG Disability Reform Council Quarterly Report 197
Table I.42 Key markets indicators by quarter – WA
Market indicators Prior Quarters 2018-19 Q3
a) Average number of providers per participant 1.57 1.41
b) Number of providers delivering new supports 147 172
c) Change in the number of active/inactive providers:
Active (%) 30% 33%
Not yet active (%) 63% 59%
Inactive (%) 7% 7%
d) Share of payments - top 25%
Daily Tasks/Shared Living (%) 79% 81%
Therapeutic Supports (%) 93% 95%
Participate Community (%) 76% 76%
Early Childhood Supports (%) 80% 84%
Assist Personal Activities (%) 84% 83%

March 2019 | COAG Disability Reform Council Quarterly Report 198
Table I.43 Cumulative number of providers that have been active by registration group – WA
Registration Group Prior
Quarters 2018-19
Q3 Total % Change
Assistance services
Accommodation / Tenancy Assistance 11 0 11 0%
Assistance Animals 1 0 1 0%
Assistance with daily life tasks in a group or shared living arrangement
50 7 57 14%
Assistance with travel/transport arrangements 60 7 67 12%
Daily Personal Activities 82 11 93 13%
Group and Centre Based Activities 39 9 48 23%
High Intensity Daily Personal Activities 67 11 78 16%
Household tasks 58 17 75 29%
Interpreting and translation 6 1 7 17%
Participation in community, social and civic activities 95 13 108 14%
Assistive Technology
Assistive equipment for recreation 13 1 14 8%
Assistive products for household tasks 10 2 12 20%
Assistance products for personal care and safety 98 14 112 14%
Communication and information equipment 17 2 19 12%
Customised Prosthetics 31 2 33 6%
Hearing Equipment 3 0 3 0%
Hearing Services 2 0 2 0%
Personal Mobility Equipment 51 6 57 12%
Specialised Hearing Services 3 0 3 0%
Vision Equipment 8 0 8 0%
Capacity Building Services
Assistance in coordinating or managing life stages, transitions and supports
72 7 79 10%
Behaviour Support 42 3 45 7%
Community nursing care for high needs 10 2 12 20%
Development of daily living and life skills 65 13 78 20%
Early Intervention supports for early childhood 57 3 60 5%
Exercise Physiology and Physical Wellbeing activities
10 1 11 10%
Innovative Community Participation 2 1 3 50%
Specialised Driving Training 8 2 10 25%
Therapeutic Supports 145 26 171 18%
Capital services
Home modification design and construction 22 1 23 5%
Specialised Disability Accommodation 0 0 0 -
Vehicle Modifications 3 1 4 33%
Choice and control support services
Management of funding for supports in participants plan
21 6 27 29%
Support Coordination 25 6 31 24%
Employment and Education support services
Assistance to access and/or maintain employment and/or education
28 3 31 11%
Specialised Supported Employment 9 1 10 11%
Total approved active providers 387 65 452 17%

March 2019 | COAG Disability Reform Council Quarterly Report 199
Table I.44 Number of approved and active providers in each registration group by legal entity type as at 31 March 2019 – WA
Registration Group
Approved Active
Individual/ sole trader
Company/ organisation
Total Approved
Individual/ sole trader
Company/ organisation
Total Active
Assistance services
Accommodation / Tenancy Assistance
9 102 111 0 11 11
Assistance Animals 0 2 2 0 1 1
Assistance with daily life tasks in a group or shared living arrangement
3 111 114 1 56 57
Assistance with travel/transport arrangements
16 179 195 3 64 67
Daily Personal Activities 4 132 136 2 91 93
Group and Centre Based Activities
5 108 113 1 47 48
High Intensity Daily Personal Activities
4 120 124 2 76 78
Household tasks 23 180 203 7 68 75
Interpreting and translation 7 46 53 1 6 7
Participation in community, social and civic activities
6 153 159 4 104 108
Assistive Technology Assistive equipment for recreation
24 143 167 1 13 14
Assistive products for household tasks
13 121 134 0 12 12
Assistance products for personal care and safety
39 277 316 8 104 112
Communication and information equipment
22 101 123 2 17 19
Customised Prosthetics 10 77 87 3 30 33
Hearing Equipment 5 43 48 0 3 3
Hearing Services 1 8 9 0 2 2
Personal Mobility Equipment 30 213 243 7 50 57
Specialised Hearing Services
1 15 16 0 3 3
Vision Equipment 7 46 53 0 8 8
Capacity Building Services Assistance in coordinating or managing life stages, transitions and supports
8 124 132 2 77 79
Behaviour Support 27 90 117 11 34 45
Community nursing care for high needs
2 71 73 1 11 12
Development of daily living and life skills
7 131 138 3 75 78
Early Intervention supports for early childhood
49 75 124 18 42 60
Exercise Physiology and Physical Wellbeing activities
16 76 92 1 10 11
Innovative Community Participation
22 111 133 3 0 3
Specialised Driving Training 9 50 59 2 8 10
Therapeutic Supports 99 174 273 56 115 171
Capital services Home modification design and construction
14 117 131 0 23 23
Specialised Disability Accommodation
0 27 27 0 0 0
Vehicle Modifications 1 31 32 0 4 4
Choice and control support services
Management of funding for supports in participants plan
2 67 69 0 27 27
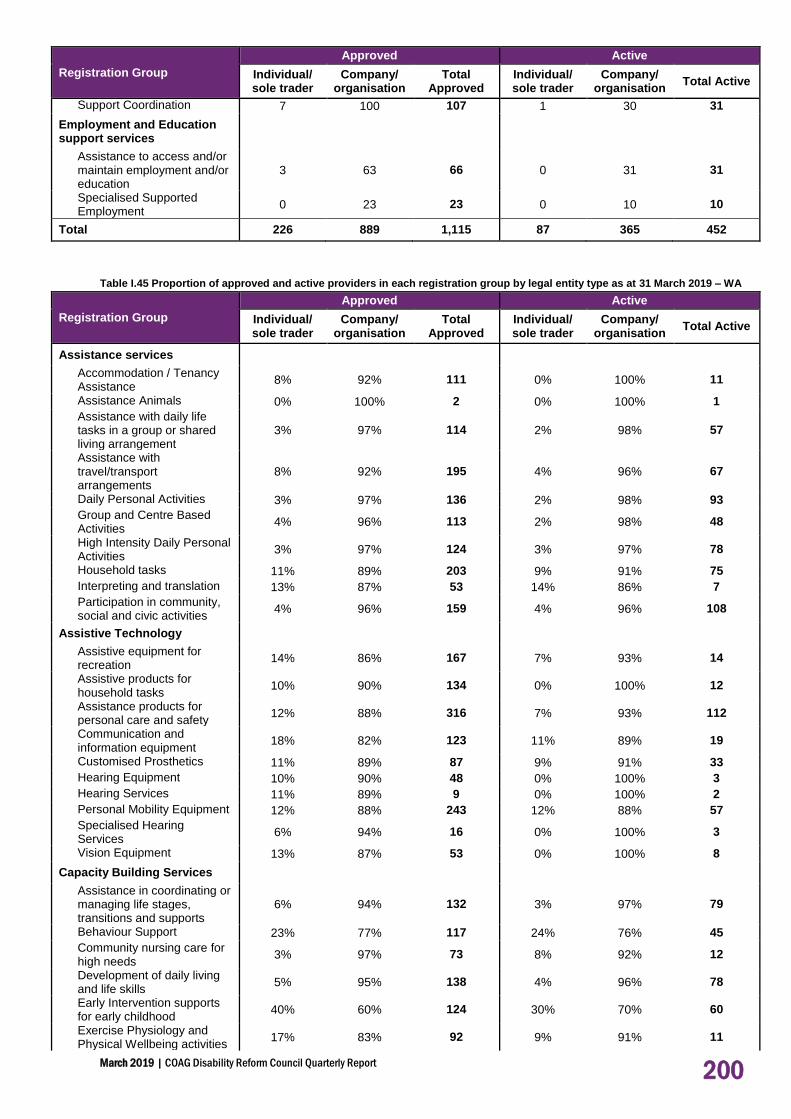
March 2019 | COAG Disability Reform Council Quarterly Report 200
Registration Group
Approved Active
Individual/ sole trader
Company/ organisation
Total Approved
Individual/ sole trader
Company/ organisation
Total Active
Support Coordination 7 100 107 1 30 31
Employment and Education support services
Assistance to access and/or maintain employment and/or education
3 63 66 0 31 31
Specialised Supported Employment
0 23 23 0 10 10
Total 226 889 1,115 87 365 452
Table I.45 Proportion of approved and active providers in each registration group by legal entity type as at 31 March 2019 – WA
Registration Group
Approved Active
Individual/ sole trader
Company/ organisation
Total Approved
Individual/ sole trader
Company/ organisation
Total Active
Assistance services
Accommodation / Tenancy Assistance
8% 92% 111 0% 100% 11
Assistance Animals 0% 100% 2 0% 100% 1
Assistance with daily life tasks in a group or shared living arrangement
3% 97% 114 2% 98% 57
Assistance with travel/transport arrangements
8% 92% 195 4% 96% 67
Daily Personal Activities 3% 97% 136 2% 98% 93
Group and Centre Based Activities
4% 96% 113 2% 98% 48
High Intensity Daily Personal Activities
3% 97% 124 3% 97% 78
Household tasks 11% 89% 203 9% 91% 75
Interpreting and translation 13% 87% 53 14% 86% 7
Participation in community, social and civic activities
4% 96% 159 4% 96% 108
Assistive Technology Assistive equipment for recreation
14% 86% 167 7% 93% 14
Assistive products for household tasks
10% 90% 134 0% 100% 12
Assistance products for personal care and safety
12% 88% 316 7% 93% 112
Communication and information equipment
18% 82% 123 11% 89% 19
Customised Prosthetics 11% 89% 87 9% 91% 33
Hearing Equipment 10% 90% 48 0% 100% 3
Hearing Services 11% 89% 9 0% 100% 2
Personal Mobility Equipment 12% 88% 243 12% 88% 57
Specialised Hearing Services
6% 94% 16 0% 100% 3
Vision Equipment 13% 87% 53 0% 100% 8
Capacity Building Services Assistance in coordinating or managing life stages, transitions and supports
6% 94% 132 3% 97% 79
Behaviour Support 23% 77% 117 24% 76% 45
Community nursing care for high needs
3% 97% 73 8% 92% 12
Development of daily living and life skills
5% 95% 138 4% 96% 78
Early Intervention supports for early childhood
40% 60% 124 30% 70% 60
Exercise Physiology and Physical Wellbeing activities
17% 83% 92 9% 91% 11

March 2019 | COAG Disability Reform Council Quarterly Report 201
Registration Group
Approved Active
Individual/ sole trader
Company/ organisation
Total Approved
Individual/ sole trader
Company/ organisation
Total Active
Innovative Community Participation
17% 83% 133 100% 0% 3
Specialised Driving Training 15% 85% 59 20% 80% 10
Therapeutic Supports 36% 64% 273 33% 67% 171
Capital services Home modification design and construction
11% 89% 131 0% 100% 23
Specialised Disability Accommodation
0% 100% 27 - - 0
Vehicle Modifications 3% 97% 32 0% 100% 4
Choice and control support services
Management of funding for supports in participants plan
3% 97% 69 0% 100% 27
Support Coordination 7% 93% 107 3% 97% 31
Employment and Education support services
Assistance to access and/or maintain employment and/or education
5% 95% 66 0% 100% 31
Specialised Supported Employment
0% 100% 23 0% 100% 10
Total 20% 80% 1,115 19% 81% 452
Part Five: Financial sustainability
Table I.46 Committed supports by financial year ($m) - WA
2013-14 2014-15 2015-16 2016-17 2017-18 2018-19 Q1,
Q2,Q3197 Total
Total Committed
0.0 18.9 69.6 166.3 215.2 325.9 795.9
197 Note: the $326 million in respect of 2018-19 Q1, Q2 and Q3 only includes committed supports expected to be used to 31 March 2019.

March 2019 | COAG Disability Reform Council Quarterly Report 202
Figure I.2 Distribution of participants by annualised committed support band (including participants with Supported
Independent Living supports) – active participants with initial plan approvals as at 2018-19 Q3 compared with active
participants with initial plan approvals as at 2018-19 Q2 (WA)
Figure I.3 Distribution of participants by annualised committed support band (excluding participants with Supported
Independent Living supports) – active participants with initial plan approvals as at 2018-19 Q3 compared with active
participants with initial plan approvals as at 2018-19 Q2 (WA)
0.00%
2.00%
4.00%
6.00%
8.00%
10.00%
12.00%
14.00%
16.00%
18.00%D
istr
ibu
tio
n o
f p
art
icip
an
ts
Average annualised committed supports band
As at Q2 2018-19 distribution of participants As at Q3 2018-19 distribution of participants
0.00%
2.00%
4.00%
6.00%
8.00%
10.00%
12.00%
14.00%
16.00%
18.00%
20.00%
Dis
trib
uti
on
o
f p
art
icip
an
ts
Average annualised committed supports band
As at Q2 2018-19 distribution of participants As at Q3 2018-19 distribution of participants

March 2019 | COAG Disability Reform Council Quarterly Report 203
Figure I.4 Average committed support by age group (including participants with Supported Independent Living supports) –
active participants with initial plan approvals as at 2018-19 Q3 compared with active participants with initial plan approvals as
at 2018-19 Q2 (WA) 198
198 The average revenue amounts have been removed from the figure in this report as the amounts refer to revenue received under the bilateral agreements, and are not linked to age group, primary disability group, and level of function. Therefore, it is not appropriate to make comparisons between revenue and plan budgets in this chart. The amount of revenue received in aggregate should be compared with the amount spent in aggregate – the NDIA has been within budget in all years of operation (including 2018-19).
$0
$10,000
$20,000
$30,000
$40,000
$50,000
$60,000
$70,000
$80,000
$90,000
$100,000
0 to 6 7 to 14 15 to 18 19 to 24 25 to 34 35 to 44 45 to 54 55 to 64 65+
Av
era
ge
an
nu
ali
se
d c
om
mit
ted
su
pp
ort
s
Age group
As at Q3 2018-19 actual average annualised committed supports
As at Q2 2018-19 actual average annualised committed supports

March 2019 | COAG Disability Reform Council Quarterly Report 204
Figure I.5 Average committed support by primary disability group (including participants with Supported Independent Living
supports) – active participants with initial plan approvals as at 2018-19 Q3 compared with active participants with initial plan
approvals as at 2018-19 Q2 (WA) 199,200
199 Ibid. 200 Average annualised committed supports are not shown where there is insufficient data in the group. There is
insufficient data to show an average cost for Other as at Q2 2018-19.
$0 $20,000 $40,000 $60,000 $80,000 $100,000 $120,000
Acquired Brain Injury
Autism
Cerebral Palsy
Developmental Delay
Global Developmental Delay
Hearing Impairment
Intellectual Disability
Multiple Sclerosis
Psychosocial disability
Spinal Cord Injury
Stroke
Visual Impairment
Other Neurological
Other Physical
Other Sensory/Speech
Other
Average annualised committed supports
Pri
ma
ry d
isa
bil
ity
As at Q2 2018-19 actual average annualised committed supports
As at Q3 2018-19 actual average annualised committed supports

March 2019 | COAG Disability Reform Council Quarterly Report 205
Figure I.6 Average committed support by level of function (including participants with Supported Independent Living supports)
– active participants with initial plan approvals as at 2018-19 Q3 compared with active participants with initial plan approvals
as at 2018-19 Q2 (WA) 201,202,203
Table I.47 Payments by financial year, compared to committed supports ($m) – WA
$ Million 2013-14 2014-15 2015-16 2016-17 2017-18 2018-19
Q1, Q2, Q3 Total
Total committed 0.0 18.9 69.6 166.3 215.2 325.9 795.9
Total paid 0.0 10.9 51.1 131.9 161.6 197.8 553.2
% utilised to date 0.0 58% 73% 79% 75% 61% 67%204
201 The average revenue amounts have been removed from the figure in this report as the amounts refer to revenue received under the bilateral agreements, and are not linked to age group, primary disability group, and level of function. Therefore, it is not appropriate to make comparisons between revenue and plan budgets in this chart. The amount of revenue received in aggregate should be compared with the amount spent in aggregate – the NDIA has been within budget in all years of operation (including 2018-19). 202 An ICT issue has been identified and as a result, reporting by level of function is not accurate. This issue is currently
under investigation and will be reconciled for reporting as at 30 June 2019. 203 Average annualised committed supports are not shown where there is insufficient data in the group. Level of function 15 does not have sufficient data to show an average cost. 204 Note: Only committed supports expected to be used to 31 March 2019 have been used to calculate the utilisation from 1 July 2013 to date, and this will increase as there is a lag between when support is provided and when it is paid.
$0
$20,000
$40,000
$60,000
$80,000
$100,000
$120,000
$140,000
$160,000
1 2 3 4 5 6 7 8 9 10 11 12 13 14 15
Av
era
ge
an
nu
ali
se
d c
os
t
Level of function
As at Q3 2018-19 actual average annualised committed supports
As at Q2 2018-19 actual average annualised committed supports

March 2019 | COAG Disability Reform Council Quarterly Report 206
Figure I.7 Utilisation of committed supports as at 31 December 2018 and 31 March 2019 (WA)

March 2019 | COAG Disability Reform Council Quarterly Report 207
Appendix J: Appendix J:
South Australia
Part One: Participants and their plans
Table J.1 Plan approvals compared to estimates – SA
Prior
Quarters 2018-19 Q3
Total excluding
ECEI
Total including
ECEI
Bilateral estimates
SA 24,626 2,663 27,289 27,487 30,702
Table J.2 Quarterly intake split by plan and entry type since 1 July 2013 – SA205
Prior Quarters 2018-19 Q3 Total
Access decisions 33,855 1,581 35,436
Access Met 29,260 1,174 30,434
State 13,144 232 13,376
Commonwealth 2,250 82 2,332
New 13,866 860 14,726
Total Participant Plans 24,826 2,861 27,487
State 11,253 1,206 12,459
Commonwealth 1,893 184 2,077
New 11,480 1,273 12,753
ECEI206 200 198 198
Total Participant Plans 24,826 2,861 27,487
Early Intervention (s25) 9,369 354 9,723
Permanent Disability (s24) 15,257 2,309 17,566
ECEI207 200 198 198
Table J.3 Exits from the Scheme since 1 July 2013 as at 31 March 2019 – SA
Exits
Total participant exits 1,054
Early Intervention participants 831
Permanent disability participants 223
205 The Joint Standing Committee on the NDIS, in its final report on Hearing Services, recommended that the NDIA better understand the eligibility rate for people with a hearing impairment. Of the number of access decisions in 2018-19 Q3, 73% of people with a hearing impairment met the access criteria compared to 74% overall. 206 The number of children supported in the ECEI gateway cannot be summed across quarters as they can transition to NDIS plans, hence the ECEI figure shown is cumulative. 207 Ibid.

March 2019 | COAG Disability Reform Council Quarterly Report 208
Table J.4 Cumulative position by services previously received – SA208
Participant cohort Bilateral estimate
% of estimate
State Commonwealth New ECEI Total
Trial 2,472 515 4,130 7,117 8,500 84%
End of 2016-17 3,829 541 7,261 482 12,113 12,887 94%
End of 2017-18 7,752 1,301 9,407 105 18,565 25,957 72%
End of 2018-19 Q1 9,053 1,511 10,164 132 20,860 27,539 76%
End of 2018-19 Q2 11,253 1,893 11,480 200 24,826 29,120 85%
End of 2018-19 Q3 12,459 2,077 12,753 198 27,487 30,702 90%
Table J.5 Cumulative position by entry into the Scheme – SA
Participant cohort Bilateral estimate
% of estimate
Early
Intervention Permanent Disability
ECEI Total
Trial 5,109 2,008 7,117 8,500 84%
End of 2016-17 7,556 4,075 482 12,113 12,887 94%
End of 2017-18 8,756 9,704 105 18,565 25,957 72%
End of 2018-19 Q1 9,025 11,703 132 20,860 27,539 76%
End of 2018-19 Q2 9,369 15,257 200 24,826 29,120 85%
End of 2018-19 Q3 9,723 17,566 198 27,487 30,702 90%
Note: in the below tables the percentage figures have been rounded. Therefore, the totals may not
always add up to one hundred per cent.
Table J.6 Participant profile per quarter by Aboriginal and Torres Strait islander status – SA
Prior Quarters 2018-19 Q3 Total
Participant profile N % N % N %
Aboriginal and Torres Strait Islander 1,037 4.4% 137 5.2% 1,174 4.5%
Not Aboriginal and Torres Strait Islander 21,273 90.2% 2,382 89.6% 23,655 90.2%
Not Stated 1,266 5.4% 140 5.3% 1,406 5.4%
Total 23,576 100% 2,659 100% 26,235 100%
Table J.7 Participant profile per quarter by culturally and linguistically diverse (CALD) status – SA
Prior Quarters 2018-19 Q3 Total
Participant profile N % N % N %
CALD 1,561 6.6% 220 8.3% 1,781 6.8%
Not CALD 21,813 92.5% 2,438 91.7% 24,251 92.4%
Not Stated 202 0.9% 1 0.0% 203 0.8%
Total 23,576 100% 2,659 100% 26,235 100%
Table J.8 Participant profile per quarter by Young people in Residential aged care (YPIRAC) status – SA
Prior Quarters 2018-19 Q3 Total
Participant profile N % N % N %
YPIRAC 143 0.6% 54 2.0% 197 0.8%
Not YPIRAC 23,433 99.4% 2,605 98.0% 26,038 99.2%
Total 23,576 100% 2,659 100% 26,235 100%
208 Updated lists of clients are provided by State/Territory and Commonwealth governments each quarter. This results in
some participants being retrospectively reclassified as State, Commonwealth or New.

March 2019 | COAG Disability Reform Council Quarterly Report 209
Table J.9 Participant profile per quarter by remoteness – SA209,210
Prior Quarters 2018-19 Q3 Total
Participant profile N % N % N %
Major Cities 17,505 74.5% 2,080 78.3% 19,585 74.9%
Population > 50,000 614 2.6% 34 1.3% 648 2.5%
Population between 15,000 and 50,000
1,964 8.4% 214 8.1% 2,178 8.3%
Population between 5,000 and 15,000
461 2.0% 48 1.8% 509 1.9%
Population less than 5,000 2,355 10.0% 221 8.3% 2,576 9.9%
Remote 444 1.9% 44 1.7% 488 1.9%
Very Remote 154 0.7% 14 0.5% 168 0.6%
Missing 79 4 83
Total 23,576 100% 2,659 100% 26,235 100%
Table J.10 Participant profile per quarter by disability group - SA211,212
Prior Quarters 2018-19 Q3 Total
Disability N % N % N %
Autism 9,075 38% 597 22% 9,672 37%
Intellectual Disability213 5,821 25% 700 26% 6,521 25%
Psychosocial disability 667 3% 282 11% 949 4%
Cerebral Palsy 923 4% 99 4% 1,022 4%
Other Neurological 892 4% 139 5% 1,031 4%
Developmental Delay 980 4% 74 3% 1,054 4%
Other Physical 1,039 4% 163 6% 1,202 5%
Hearing Impairment 712 3% 125 5% 837 3%
ABI 889 4% 195 7% 1,084 4%
Visual Impairment 457 2% 85 3% 542 2%
Multiple Sclerosis 430 2% 64 2% 494 2%
Global Developmental Delay 513 2% 46 2% 559 2%
Stroke 201 1% 36 1% 237 1%
Spinal Cord Injury 212 1% 33 1% 245 1%
Other Sensory/Speech 723 3% 18 1% 741 3%
Other 42 0% 3 0% 45 0%
Total 23,576 100% 2,659 100% 26,235 100%
209 This table is based on the Modified Monash Model measure of remoteness. 210 The distributions are calculated excluding active participants with a missing remoteness classification. 211 Table order based on national proportions (highest to lowest) 212 Note: Since 2017-18 Q1, the disability groups Developmental Delay and Global Developmental Delay have been reported separately to the Intellectual Disability group. 213 Down Syndrome is included in Intellectual Disability, representing 3% of all Scheme participants in SA (744).

March 2019 | COAG Disability Reform Council Quarterly Report 210
Table J.11 Participant profile per quarter by level of function – SA214
Prior Quarters 2018-19 Q3 Total
Level of Function N % N % N %
1 (High Function) 1,438 6% 103 4% 1,541 6%
2 (High Function) 15 0% 5 0% 20 0%
3 (High Function) 1,540 7% 117 4% 1,657 6%
4 (High Function) 1,420 6% 145 5% 1,565 6%
5 (High Function) 2,068 9% 92 3% 2,160 8%
6 (Moderate Function) 5,260 22% 623 23% 5,883 23%
7 (Moderate Function) 1,732 7% 53 2% 1,785 7%
8 (Moderate Function) 1,646 7% 282 11% 1,928 7%
9 (Moderate Function) 85 0% 17 1% 102 0%
10 (Moderate Function) 2,137 9% 399 15% 2,536 10%
11 (Low Function) 1,169 5% 29 1% 1,198 5%
12 (Low Function) 2,502 11% 552 21% 3,054 12%
13 (Low Function) 2,073 9% 186 7% 2,259 9%
14 (Low Function) 348 1% 56 2% 404 2%
15 (Low Function) 2 0% 0 0% 2 0%
Missing 141 0 141
Total 23,576 100% 2,659 100% 26,235 100%
214 An ICT issue has been identified and as a result, reporting by level of function is not accurate. This issue is currently
under investigation and will be reconciled for reporting as at 30 June 2019.

March 2019 | COAG Disability Reform Council Quarterly Report 211
Table J.12 Participant profile per quarter by Age group – SA
Prior Quarters 2018-19 Q3 Total
Age Group N % N % N %
0 to 6 2,827 12% 289 11% 3,116 12%
7 to 14 8,617 37% 343 13% 8,960 34%
15 to 18 2,279 10% 91 3% 2,370 9%
19 to 24 1,657 7% 179 7% 1,836 7%
25 to 34 1,677 7% 305 11% 1,982 8%
35 to 44 1,518 6% 351 13% 1,869 7%
45 to 54 2,170 9% 467 18% 2,637 10%
55 to 64 2,456 10% 565 21% 3,021 12%
65+ 375 2% 69 3% 444 2%
Total 23,576 100% 2,659 100% 26,235 100%
Table J.13 Participant profile per quarter by Gender – SA
Prior Quarters 2018-19 Q3 Total
Gender N % N % N %
Male 15,029 64% 1,571 59% 16,600 63%
Female 7,883 33% 972 37% 8,855 34%
Indeterminate 664 3% 116 4% 780 3%
Total 23,576 100% 2,659 100% 26,235 100%
Part Two: Participant experience and outcomes
Table J.14 Number of questionnaires completed by SFOF version – SA215
Version
Number of questionnaires
collected 2016-17
Number of questionnaires
collected 2017-18
Number of questionnaires collected YTD
2018-19
Number of questionnaires
Participant 0 to school
1,463 854 525 2,842
Participant school to 14
2,085 1,082 1,256 4,423
Participant 15 to 24 526 1,111 1,030 2,667
Participant 25 and over
29 3,643 5,966 9,638
Total Participant 4,103 6,690 8,777 19,570
Family 0 to 14 3,401 1,844 1,730 6,975
Family 15 to 24 477 774 620 1,871
Family 25 and over 1 1,264 1,774 3,039
Total Family 3,879 3,882 4,124 11,885
Total 7,982 10,572 12,901 31,455
215 Baseline outcomes for participants and/or their families and carers were collected for 99% of participants.

March 2019 | COAG Disability Reform Council Quarterly Report 212
Table J.15 Selected key indicators for participants – Daily Living (DL) and Choice and Control (CC) – SA
Indicator 0 to before
school School to
14 15 to 24
25 and over
DL
% with concerns in 6 or more of the areas: gross motor skills, fine motor skills, self-care, eating, social interaction, communication, cognitive development, sensory processing
58%
CC % who say their child is able to tell them what he/she wants
76%
DL % developing functional, learning and coping skills appropriate to their ability and circumstances
31%
DL % who say their child is becoming more independent
50%
CC % of children who have a genuine say in decisions about themselves
79%
CC % who are happy with the level of independence/control they have now
44%
CC % who choose who supports them 40% 57%
CC % who choose what they do each day 51% 67%
CC % who had been given the opportunity to participate in a self-advocacy group meeting
20% 25%
CC % who want more choice and control in their life
80% 77%
Table J.16 Selected key indicators for participants – Relationships (REL) and Social/Community Participation (S/CP) – SA
Indicator 0 to before
school School to
14 15 to 24
25 and over
REL % of children who can make friends with people outside the family
61% 68%
S/CP % of children who participate in age appropriate community, cultural or religious activities
58%
REL % of children who spend time after school and on weekends with friends and/or in mainstream programs
45%
REL Of these, % who are welcomed or actively included
64% 76%
REL % of children who spend time with friends without an adult present
18%
REL % with no friends other than family or paid staff
29% 26%
S/CP % who have been actively involved in a community, cultural or religious group in the last 12 months
36% 41%

March 2019 | COAG Disability Reform Council Quarterly Report 213
Table J.17 Selected key indicators for participants – Lifelong Learning (LL), Work (WK), Home (HM) and Health and Wellbeing
(HW) – SA
Indicator 0 to before
school School to
14 15 to 24
25 and over
LL % of children attending school in a mainstream class
76%
HM % who are happy with their home 84% 81%
HM % who feel safe or very safe in their home
88% 79%
HW % who rate their health as good, very good or excellent
72% 52%
HW % who did not have any difficulties accessing health services
77% 75%
LL % who currently attend or previously attended school in a mainstream class
34%
LL % who participate in education, training or skill development
8%
LL Of those who participate, % who do so in mainstream settings
62%
LL % unable to do a course or training they wanted to do in the last 12 months
28%
WK % who have a paid job 23% 29%
WK % who volunteer 12% 11%

March 2019 | COAG Disability Reform Council Quarterly Report 214
Table J.18 Selected key indicators for families/carers of participants – SA
Indicator 0 to 14 15 to 24 25 and over
% receiving Carer Payment 18% 29% 24%
% receiving Carer Allowance 48% 52% 39%
% working in a paid job 47% 47% 34%
Of those in a paid job, % in permanent employment
75% 73% 73%
Of those in a paid job, % working 15 hours or more
79% 86% 84%
% who say they (and their partner) are able to work as much as they want
46% 55% 67%
Of those unable to work as much as they want, % who say the situation of their child/family member with disability is a barrier to working more
83% 87% 84%
Of those unable to work as much as they want, % who say insufficient flexibility of jobs is a barrier to working more
34% 26% 21%
% able to advocate for their child/family member
78% 79% 76%
% who have friends and family they see as often as they like
51% 51% 57%
% who feel very confident or somewhat confident in supporting their child's development
86%
% who know what their family can do to enable their family member with disability to become as independent as possible
49%
% who feel in control selecting services 46% 50%
% who have made plans (or begun to make plans) for when they are no longer able to care for their family member with disability
40%
% who rate their health as good, very good or excellent
73% 63% 63%
Table J.19 Results for “Has the NDIS helped?” questions answered at review, for SFOF version ‘Participant 0 to school’
(n=334)– SA216
Question % Yes
DL Has the NDIS improved your child's development? 93%
DL Has the NDIS improved your child's access to specialist services? 90%
CC Has the NDIS helped increase your child's ability to communicate what they want?
82%
REL Has the NDIS improved how your child fits into family life? 74%
S/CP Has the NDIS improved how your child fits into community life? 58%
216 Results in Tables J.19 to J.22 exclude participants who had their first plan approved between 1 July 2016 and 31
March 2017, as these participants have been included in Tables J.23 to J.26.

March 2019 | COAG Disability Reform Council Quarterly Report 215
Table J.20 Results for “Has the NDIS helped?” questions answered at review, for SFOF version ‘Participant school to 14'
(n=881) – SA
Question % Yes
DL Has the NDIS helped your child to become more independent? 62%
LL Has the NDIS improved your child's access to education? 44%
REL Has the NDIS improved your child's relationships with family and friends?
52%
S/CP Has the NDIS improved your child's social and recreational life? 42%
Table J.21 Results for “Has the NDIS helped?” questions answered at review, for SFOF versions ‘Participant 15 to 24' (n=746)
and 'Participant 25 and over' (n=1,773) – SA
Question 15 to 24 % Yes
25+ % Yes
CC Has the NDIS helped you have more choices and more control over your life?
51% 64%
DL Has the NDIS helped you with daily living activities? 53% 68%
REL Has the NDIS helped you to meet more people? 44% 44%
HM Has your involvement with the NDIS helped you to choose a home that's right for you?
17% 22%
HW Has your involvement with the NDIS improved your health and wellbeing?
34% 42%
LL Has your involvement with the NDIS helped you to learn things you want to learn or to take courses you want to take?
27% 25%
WK Has your involvement with the NDIS helped you find a job that's right for you?
19% 19%
S/CP Has the NDIS helped you be more involved? 46% 50%
Table J.22 Results for “Has the NDIS helped?” questions answered at review, for SFOF version ‘Family 0 to 14’ (n=1,087); and
for SFOF versions ‘Family 15 to 24’ and ‘Family 25 and over’ combined (n=808) – SA
Question 0 to 14 % Yes
15+ % Yes
Has the NDIS improved your capacity to advocate (stand up) for your child? / Has the NDIS helped you to know your rights and advocate effectively?
61% 44%
Has the NDIS improved the level of support for your family? 67% 58%
Has the NDIS improved your access to services, programs and activities in the community? / Has the NDIS helped you to access services, programs and activities in the community?
68% 54%
Has the NDIS improved your ability/capacity to help your child develop and learn?
74%
Has the NDIS improved your health and wellbeing? 42% 33%

March 2019 | COAG Disability Reform Council Quarterly Report 216
Table J.23 Results for “Has the NDIS helped?” questions answered at end of participant's first and second years in the
Scheme, for SFOF version ‘Participant 0 to school’ – SA217
Question Year 1 Year 2 Change
DL Has the NDIS improved your child's development? 91% 92% +1%
DL Has the NDIS improved your child's access to specialist services? 92% 93% +1%
CC Has the NDIS helped increase your child's ability to communicate what they want?
86% 83% -3%
REL Has the NDIS improved how your child fits into family life? 81% 75% -6%
S/CP Has the NDIS improved how your child fits into community life? 67% 62% -4%
Table J.24 Results for “Has the NDIS helped?” questions answered at end of participant's first and second years in the
Scheme, for SFOF version ‘Participant school to 14' – SA
Question Year 1 Year 2 Change
DL Has the NDIS helped your child to become more independent? 66% 75% +8%
LL Has the NDIS improved your child's access to education? 48% 49% +1%
REL Has the NDIS improved your child's relationships with family and friends?
56% 61% +4%
S/CP Has the NDIS improved your child's social and recreational life? 49% 53% +4%
217 Results in Tables J.23 to J.27 include participants who had their first plan approved between 1 July 2016 and 31
March 2017. While this is a relatively small group of participants, the number of participants included in these tables will grow over time.

March 2019 | COAG Disability Reform Council Quarterly Report 217
Table J.25 Results for “Has the NDIS helped?” questions answered at end of participant's first and second years in the
Scheme, for SFOF version ‘Participant 15 to 24’ – SA218
15 to 24
Question Year 1 Year 2 Change
CC Has the NDIS helped you have more choices and more control over your life?
51% 59% +9%
DL Has the NDIS helped you with daily living activities?
51% 58% +7%
REL Has the NDIS helped you to meet more people?
36% 38% +2%
HM Has your involvement with the NDIS helped you to choose a home that's right for you?
21% 17% -5%
HW Has your involvement with the NDIS improved your health and wellbeing?
42% 39% -3%
LL Has your involvement with the NDIS helped you to learn things you want to learn or to take courses you want to take?
32% 28% -4%
WK Has your involvement with the NDIS helped you find a job that's right for you?
8% 7% -1%
S/CP Has the NDIS helped you be more involved? 44% 47% +3%
Table J.26 Results for “Has the NDIS helped?” questions answered at end of participant's first and second years in the
Scheme, for SFOF version ‘Family 0 to 14’; and for SFOF versions ‘Family 15 to 24’ and ‘Family 25 and over’ combined – SA
0 to 14 15 and over
Question Year 1 Year 2 Change Year 1 Year 2 Change
Has the NDIS improved your capacity to advocate (stand up) for your child? / Has the NDIS helped you to know your rights and advocate effectively?
63% 66% +3% 45% 48% +3%
Has the NDIS improved the level of support for your family?
74% 77% +3% 58% 61% +3%
Has the NDIS improved your access to services, programs and activities in the community? / Has the NDIS helped you to access services, programs and activities in the community?
75% 75% +1% 59% 60% +2%
Has the NDIS improved your ability/capacity to help your child develop and learn?
79% 83% +4%
Has the NDIS improved your health and wellbeing?
52% 46% -6% 40% 36% -4%
218 There is insufficient data to show results for SFOF version ‘Participants 25 and over’.

March 2019 | COAG Disability Reform Council Quarterly Report 218
Table J.27 Progress against the NDIA’s corporate plan metrics for ‘participants in work’ and ‘participants in community and
social activities’ –SA219
Participants in work Baseline Year 2 2018–19 Target
Aged 15 to 24 years 7% 20%
26% Aged 25+ Numbers are
too small
Numbers are
too small
Aged 15+ (average) 6% 19%
Participants in community and social activities Baseline Year 2 2018–19 Target
Aged 15 to 24 years 32% 44%
41% Aged 25+ Numbers are
too small
Numbers are
too small
Aged 15+ (average) 32% 44%
Figure J.1 Proportion of participants describing satisfaction with the Agency planning process as good or very good – Existing
survey administered by NDIA regions (SA)*220
*Of the participants describing satisfaction with the Agency planning process in Q3 of 2018-19, 82% gave a rating of good or very good,
15% gave a neutral rating and 3% gave a rating of poor or very poor.
219 Results are drawn from participants’ responses to SFOF questionnaires, and only include participants who had their
first plan approved between 1 July 2016 and 31 March 2017. 220 Participant satisfaction results are not shown if there is insufficient data in the group.
91%
98% 98% 100% 100% 96%
73%
84%86%
83%
75%
82%84%
80%
75%
82%
0%
10%
20%
30%
40%
50%
60%
70%
80%
90%
100%
Q3 14-15
Q4 14-15
Q1 15-16
Q2 15-16
Q3 15-16
Q4 15-16
Q1 16-17
Q2 16-17
Q3 16-17
Q4 16-17
Q1 17-18
Q2 17-18
Q3 17-18
Q4 17-18
Q1 18-19
Q2 18-19
Q3 18-19
Pro
po
rtio
n o
f P
art
icip
ants
%
Quarter
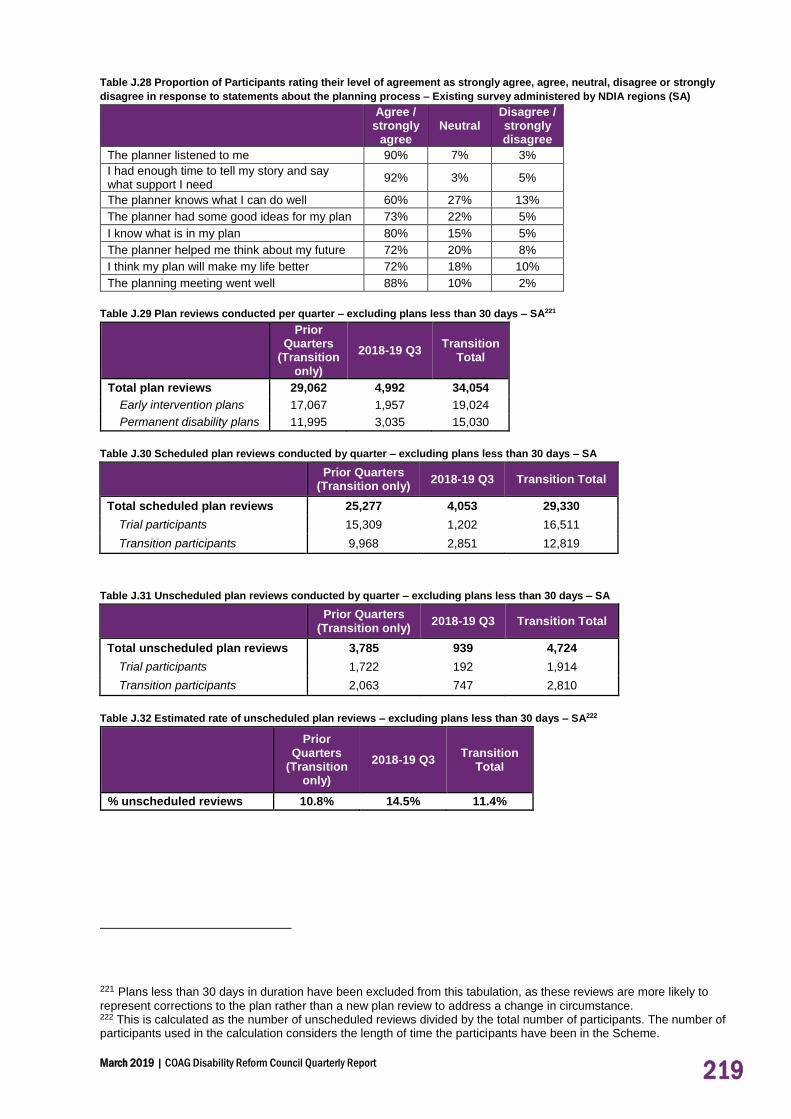
March 2019 | COAG Disability Reform Council Quarterly Report 219
Table J.28 Proportion of Participants rating their level of agreement as strongly agree, agree, neutral, disagree or strongly
disagree in response to statements about the planning process – Existing survey administered by NDIA regions (SA)
Agree /
strongly agree
Neutral Disagree / strongly disagree
The planner listened to me 90% 7% 3%
I had enough time to tell my story and say what support I need
92% 3% 5%
The planner knows what I can do well 60% 27% 13%
The planner had some good ideas for my plan 73% 22% 5%
I know what is in my plan 80% 15% 5%
The planner helped me think about my future 72% 20% 8%
I think my plan will make my life better 72% 18% 10%
The planning meeting went well 88% 10% 2%
Table J.29 Plan reviews conducted per quarter – excluding plans less than 30 days – SA221
Prior Quarters
(Transition only)
2018-19 Q3 Transition
Total
Total plan reviews 29,062 4,992 34,054
Early intervention plans 17,067 1,957 19,024
Permanent disability plans 11,995 3,035 15,030
Table J.30 Scheduled plan reviews conducted by quarter – excluding plans less than 30 days – SA
Prior Quarters
(Transition only) 2018-19 Q3 Transition Total
Total scheduled plan reviews 25,277 4,053 29,330
Trial participants 15,309 1,202 16,511
Transition participants 9,968 2,851 12,819
Table J.31 Unscheduled plan reviews conducted by quarter – excluding plans less than 30 days – SA
Prior Quarters
(Transition only) 2018-19 Q3 Transition Total
Total unscheduled plan reviews 3,785 939 4,724
Trial participants 1,722 192 1,914
Transition participants 2,063 747 2,810
Table J.32 Estimated rate of unscheduled plan reviews – excluding plans less than 30 days – SA222
Prior Quarters
(Transition only)
2018-19 Q3 Transition
Total
% unscheduled reviews 10.8% 14.5% 11.4%
221 Plans less than 30 days in duration have been excluded from this tabulation, as these reviews are more likely to
represent corrections to the plan rather than a new plan review to address a change in circumstance. 222 This is calculated as the number of unscheduled reviews divided by the total number of participants. The number of participants used in the calculation considers the length of time the participants have been in the Scheme.

March 2019 | COAG Disability Reform Council Quarterly Report 220
Table J.33 AAT cases by category – SA
Prior Quarters 2018-19 Q3 Total
Category N % N % N %
Access 41 25% 10 17% 51 23%
Plan 104 62% 46 78% 150 66%
Plan Review 16 10% 2 3% 18 8%
Other 6 4% 1 2% 7 3%
Total 167 100% 59 100% 226 100%
% of all access decisions223
0.27% 0.68% 0.32%
Table J.34 AAT cases by open/closed and decision – SA
N
AAT Cases 226
Open AAT Cases 90
Closed AAT Cases 136
Resolved before hearing 134
Gone to hearing and received a substantive decision
2*
*Of the 2 cases which went to hearing and received a substantive decision: 1 affirmed the Agency’s decision and 1 varied the Agency’s decision.
Table J.35 Distribution of active participants by method of Financial Plan Management and quarter of plan approval – SA
Prior Quarters
(Transition only) 2018-19 Q3 Total
Self-managed fully 12% 13% 13%
Self-managed partly 8% 7% 7%
Plan managed 27% 38% 31%
Agency managed 53% 41% 49%
Total 100% 100% 100%
223 This is calculated as the number of appeals divided by the number of access decisions made. The number of access decisions used in the calculation considers the length of time since the access decisions have been made.

March 2019 | COAG Disability Reform Council Quarterly Report 221
Table J.36 Distribution of active participants by support coordination and quarter of plan approval – SA
Prior Quarters
(Transition only) 2018-19 Q3 Total
Support coordination 37% 41% 38%
Table J.37 Duration to plan activation by quarter of initial plan approval for active participants – SA224,225
Prior Quarters
(Transition Only) 2018-19 Q1
Plan activation N % N %
Less than 30 days 7,305 67% 1,709 76%
30 to 59 days 1,115 10% 188 8%
60 to 89 days 635 6% 95 4%
Activated within 90 days
9,055 83% 1,992 89%
90 to 119 days 354 3% 49 2%
120 days and over 1,024 9% 72 3%
Activated between 90 and 180 days
1,378 13% 121 5%
No payments 481 4% 136 6%
Total plans approved 10,914 100% 2,249 100%
224 Note: Plans approved after the end of 2018-19 Q1 have been excluded from the table. They are relatively new and it is too early to examine their durations to activation. 225 There has been a change in methodology used to calculate these results since the previous quarter. Duration to plan
activation is now calculated as the time from a participant’s initial plan approval to when the participant first uses plan supports (previously only the initial plan for each participant was considered). In-kind supports are now also included (previously excluded). As a result, a higher proportion of participants are identified as activating their plans within 90 days, and a lower proportion have no payments.

March 2019 | COAG Disability Reform Council Quarterly Report 222
Table J.38 Proportion of active participants with plan activated within 12 months – SA
Number of participants
activated within 12 months
All participants with duration of
at least 12 months
Proportion activated
by Aboriginal and Torres Strait Islander status
Aboriginal and Torres Strait Islander 606 693 87%
Not Aboriginal and Torres Strait Islander 13,076 13,726 95%
Not Stated 800 832 96%
Total 14,482 15,251 95%
by Culturally and Linguistically Diverse status
CALD 900 947 95%
Not CALD 13,389 14,105 95%
Not Stated 193 199 97%
Total 14,482 15,251 95%
by Remoteness
Major Cities 10,880 11,410 95%
Regional 3,258 3,461 94%
Remote 289 317 91%
Missing 55 63 87%
Total 14,482 15,251 95%
by Primary Disability type
Autism 6,987 7,349 95% Intellectual Disability (including Down Syndrome) 3,034 3,203 95%
Psychosocial Disability 122 124 98% Developmental Delay (including Global Developmental Delay) 1,031 1,104 93%
Other 3,308 3,471 95%
Total 14,482 15,251 95%
Table J.39 Distribution of plans by plan utilisation and quarter of plan approval for 2016-17, 2017-18 and quarter 1 of 2018-19 –
SA226,227
Plan utilisation Prior Quarters
(Transition only) 2018-19 Q1 Total
0% to 50% 41% 63% 42%
50% to 75% 26% 21% 26%
> 75% 33% 16% 32%
Total 100% 100% 100%
226 Plans less than 30 days in duration have been excluded from this tabulation, as these plans are more likely to represent corrections to the plan rather than an unscheduled plan review to address a change in circumstance. 227 This table only considers committed supports and payments for supports provided to 31 December 2018. This gives some allowance for the timing delay between when the support is provided and when it is paid.

March 2019 | COAG Disability Reform Council Quarterly Report 223
Table J.40 Proportion of active participants with approved plans accessing mainstream supports – SA
Prior Quarters 2018-19 Q3 Total
Daily Activities 8% 8% 8%
Health & Wellbeing 39% 41% 39%
Lifelong Learning 19% 18% 18%
Other 10% 12% 11%
Non-categorised 33% 35% 34%
Any mainstream service 90% 92% 91%
Part Three: Providers and the growing market
Table J.41 Key provider indicators by quarter - SA228,229
Prior Quarters 2018-19 Q3 Total
Provider indicators
a) Registrations by profile
Individual/ sole trader 1,288 507 1,719
Company/ organisation 2,372 474 2,746
Total 3,660 981 4,465
b) Registration revoked 176
228 The total number of providers as at 31 March 2019 (4,465) is not the sum of the number of providers as at 31
December 2018 (3,660) and the providers registered in the third quarter of 2018-19 (981). This is due to 176 providers whose registration ended during the third quarter of 2018-19. 229 The large number of revoked providers in 2018-19 Q3 reflects differences in the renewal process for providers under
the NDIS Quality and Safeguards Commission (NQSC).

March 2019 | COAG Disability Reform Council Quarterly Report 224
Table J.42 Number of approved providers by registration group - SA230
Registration Group Prior
Quarters 2018-19
Q3 Total % Change
Assistance services
Accommodation / Tenancy Assistance 405 79 484 20%
Assistance Animals 7 2 9 29%
Assistance with daily life tasks in a group or shared living arrangement
400 48 448 12%
Assistance with travel/transport arrangements 745 121 866 16%
Daily Personal Activities 535 95 630 18%
Group and Centre Based Activities 470 73 543 16%
High Intensity Daily Personal Activities 444 63 507 14%
Household tasks 954 154 1,108 16%
Interpreting and translation 186 14 200 8%
Participation in community, social and civic activities 625 110 735 18%
Assistive Technology
Assistive equipment for recreation 438 71 509 16%
Assistive products for household tasks 475 64 539 13%
Assistance products for personal care and safety 751 91 842 12%
Communication and information equipment 357 73 430 20%
Customised Prosthetics 245 87 332 36%
Hearing Equipment 140 19 159 14%
Hearing Services 9 1 10 11%
Personal Mobility Equipment 566 105 671 19%
Specialised Hearing Services 24 6 30 25%
Vision Equipment 153 22 175 14%
Capacity Building Services
Assistance in coordinating or managing life stages, transitions and supports
549 84 633 15%
Behaviour Support 436 36 472 8%
Community nursing care for high needs 322 49 371 15%
Development of daily living and life skills 587 90 677 15%
Early Intervention supports for early childhood 760 172 932 23%
Exercise Physiology and Physical Wellbeing activities
355 101 456 28%
Innovative Community Participation 628 100 728 16%
Specialised Driving Training 103 27 130 26%
Therapeutic Supports 1,555 618 2,173 40%
Capital services
Home modification design and construction 443 100 543 23%
Specialised Disability Accommodation 209 19 228 9%
Vehicle Modifications 88 5 93 6%
Choice and control support services
Management of funding for supports in participants plan
442 98 540 22%
Support Coordination 510 63 573 12%
Employment and Education support services
Assistance to access and/or maintain employment and/or education
279 42 321 15%
Specialised Supported Employment 81 10 91 12%
Total approved providers 3,484 981 4,465 28%
230 The 176 providers whose registration ended during the third quarter of 2018-19 are not included in the 2018-19 Q2 and prior numbers in this table.

March 2019 | COAG Disability Reform Council Quarterly Report 225
Table J.43 Key markets indicators by quarter – SA
Market indicators Prior Quarters 2018-19 Q3
a) Average number of providers per participant 1.24 1.17
b) Number of providers delivering new supports 277 292
c) Change in the number of active/inactive providers:
Active (%) 22% 18%
Not yet active (%) 73% 76%
Inactive (%) 5% 6%
d) Share of payments - top 25%
Daily Tasks/Shared Living (%) 89% 88%
Therapeutic Supports (%) 93% 93%
Participate Community (%) 81% 82%
Early Childhood Supports (%) 85% 84%
Assist Personal Activities (%) 89% 88%

March 2019 | COAG Disability Reform Council Quarterly Report 226
Table J.44 Cumulative number of providers that have been active by registration group – SA
Registration Group Prior
Quarters 2018-19
Q3 Total % Change
Assistance services
Accommodation / Tenancy Assistance 14 2 16 14%
Assistance Animals 3 0 3 0%
Assistance with daily life tasks in a group or shared living arrangement
53 11 64 21%
Assistance with travel/transport arrangements 91 4 95 4%
Daily Personal Activities 122 12 134 10%
Group and Centre Based Activities 78 10 88 13%
High Intensity Daily Personal Activities 104 2 106 2%
Household tasks 131 10 141 8%
Interpreting and translation 9 2 11 22%
Participation in community, social and civic activities 135 9 144 7%
Assistive Technology
Assistive equipment for recreation 23 1 24 4%
Assistive products for household tasks 12 1 13 8%
Assistance products for personal care and safety 146 24 170 16%
Communication and information equipment 32 1 33 3%
Customised Prosthetics 46 10 56 22%
Hearing Equipment 20 3 23 15%
Hearing Services 2 0 2 0%
Personal Mobility Equipment 64 14 78 22%
Specialised Hearing Services 5 0 5 0%
Vision Equipment 7 1 8 14%
Capacity Building Services
Assistance in coordinating or managing life stages, transitions and supports
138 8 146 6%
Behaviour Support 81 3 84 4%
Community nursing care for high needs 17 2 19 12%
Development of daily living and life skills 95 8 103 8%
Early Intervention supports for early childhood 336 10 346 3%
Exercise Physiology and Physical Wellbeing activities
18 3 21 17%
Innovative Community Participation 11 3 14 27%
Specialised Driving Training 3 0 3 0%
Therapeutic Supports 489 35 524 7%
Capital services
Home modification design and construction 6 2 8 33%
Specialised Disability Accommodation 3 2 5 67%
Vehicle Modifications 15 0 15 0%
Choice and control support services
Management of funding for supports in participants plan
64 9 73 14%
Support Coordination 70 8 78 11%
Employment and Education support services
Assistance to access and/or maintain employment and/or education
16 3 19 19%
Specialised Supported Employment 11 1 12 9%
Total approved active providers 971 96 1,067 10%

March 2019 | COAG Disability Reform Council Quarterly Report 227
Table J.45 Number of approved and active providers in each registration group by legal entity type as at 31 March 2019 – SA
Registration Group
Approved Active
Individual/ sole trader
Company/ organisation
Total Approved
Individual/ sole trader
Company/ organisation
Total Active
Assistance services
Accommodation / Tenancy Assistance
59 425 484 2 14 16
Assistance Animals 0 9 9 0 3 3
Assistance with daily life tasks in a group or shared living arrangement
27 421 448 4 60 64
Assistance with travel/transport arrangements
165 701 866 17 78 95
Daily Personal Activities 37 593 630 11 123 134
Group and Centre Based Activities
33 510 543 7 81 88
High Intensity Daily Personal Activities
29 478 507 12 94 106
Household tasks 269 839 1,108 38 103 141
Interpreting and translation 33 167 200 2 9 11
Participation in community, social and civic activities
55 680 735 16 128 144
Assistive Technology Assistive equipment for recreation
130 379 509 0 24 24
Assistive products for household tasks
125 414 539 1 12 13
Assistance products for personal care and safety
181 661 842 24 146 170
Communication and information equipment
125 305 430 7 26 33
Customised Prosthetics 88 244 332 13 43 56
Hearing Equipment 18 141 159 3 20 23
Hearing Services 0 10 10 0 2 2
Personal Mobility Equipment 182 489 671 16 62 78
Specialised Hearing Services
8 22 30 0 5 5
Vision Equipment 31 144 175 0 8 8
Capacity Building Services Assistance in coordinating or managing life stages, transitions and supports
78 555 633 28 118 146
Behaviour Support 163 309 472 31 53 84
Community nursing care for high needs
37 334 371 1 18 19
Development of daily living and life skills
69 608 677 15 88 103
Early Intervention supports for early childhood
454 478 932 187 159 346
Exercise Physiology and Physical Wellbeing activities
135 321 456 6 15 21
Innovative Community Participation
207 521 728 7 7 14
Specialised Driving Training 22 108 130 0 3 3
Therapeutic Supports 1,052 1,121 2,173 259 265 524
Capital services Home modification design and construction
145 398 543 0 8 8
Specialised Disability Accommodation
13 215 228 1 4 5
Vehicle Modifications 7 86 93 0 15 15
Choice and control support services
Management of funding for supports in participants plan
77 463 540 13 60 73

March 2019 | COAG Disability Reform Council Quarterly Report 228
Registration Group
Approved Active
Individual/ sole trader
Company/ organisation
Total Approved
Individual/ sole trader
Company/ organisation
Total Active
Support Coordination 95 478 573 25 53 78
Employment and Education support services
Assistance to access and/or maintain employment and/or education
29 292 321 0 19 19
Specialised Supported Employment
0 91 91 0 12 12
Total 1,719 2,746 4,465 395 672 1,067
Table J.46 Proportion of approved and active providers in each registration group by legal entity type as at 31 March 2019 – SA
Registration Group
Approved Active
Individual/ sole trader
Company/ organisation
Total Approved
Individual/ sole trader
Company/ organisation
Total Active
Assistance services
Accommodation / Tenancy Assistance
12% 88% 484 13% 88% 16
Assistance Animals 0% 100% 9 0% 100% 3
Assistance with daily life tasks in a group or shared living arrangement
6% 94% 448 6% 94% 64
Assistance with travel/transport arrangements
19% 81% 866 18% 82% 95
Daily Personal Activities 6% 94% 630 8% 92% 134
Group and Centre Based Activities
6% 94% 543 8% 92% 88
High Intensity Daily Personal Activities
6% 94% 507 11% 89% 106
Household tasks 24% 76% 1,108 27% 73% 141
Interpreting and translation 17% 84% 200 18% 82% 11
Participation in community, social and civic activities
7% 93% 735 11% 89% 144
Assistive Technology Assistive equipment for recreation
26% 74% 509 0% 100% 24
Assistive products for household tasks
23% 77% 539 8% 92% 13
Assistance products for personal care and safety
21% 79% 842 14% 86% 170
Communication and information equipment
29% 71% 430 21% 79% 33
Customised Prosthetics 27% 73% 332 23% 77% 56
Hearing Equipment 11% 89% 159 13% 87% 23
Hearing Services 0% 100% 10 0% 100% 2
Personal Mobility Equipment 27% 73% 671 21% 79% 78
Specialised Hearing Services
27% 73% 30 0% 100% 5
Vision Equipment 18% 82% 175 0% 100% 8
Capacity Building Services Assistance in coordinating or managing life stages, transitions and supports
12% 88% 633 19% 81% 146
Behaviour Support 35% 65% 472 37% 63% 84
Community nursing care for high needs
10% 90% 371 5% 95% 19
Development of daily living and life skills
10% 90% 677 15% 85% 103
Early Intervention supports for early childhood
49% 51% 932 54% 46% 346
Exercise Physiology and Physical Wellbeing activities
30% 70% 456 29% 71% 21

March 2019 | COAG Disability Reform Council Quarterly Report 229
Registration Group
Approved Active
Individual/ sole trader
Company/ organisation
Total Approved
Individual/ sole trader
Company/ organisation
Total Active
Innovative Community Participation
28% 72% 728 50% 50% 14
Specialised Driving Training 17% 83% 130 0% 100% 3
Therapeutic Supports 48% 52% 2,173 49% 51% 524
Capital services Home modification design and construction
27% 73% 543 0% 100% 8
Specialised Disability Accommodation
6% 94% 228 20% 80% 5
Vehicle Modifications 8% 92% 93 0% 100% 15
Choice and control support services
Management of funding for supports in participants plan
14% 86% 540 18% 82% 73
Support Coordination 17% 83% 573 32% 68% 78
Employment and Education support services
Assistance to access and/or maintain employment and/or education
9% 91% 321 0% 100% 19
Specialised Supported Employment
0% 100% 91 0% 100% 12
Total 38% 62% 4,465 37% 63% 1,067

March 2019 | COAG Disability Reform Council Quarterly Report 230
Part Five: Financial sustainability
Table J.47 Committed supports by financial year ($m) - SA
2013-14 2014-15 2015-16 2016-17 2017-18 2018-19 Q1,
Q2,Q3231 Total
Total Committed
11.0 50.7 106.2 190.5 368.1 744.7 1,471.4
Figure J.2 Distribution of participants by annualised committed support band (including participants with Supported
Independent Living supports) – active participants with initial plan approvals as at 2018-19 Q3 compared with active
participants with initial plan approvals as at 2018-19 Q2 (SA)
231 Note: the $745 million in respect of 2018-19 Q1, Q2 and Q3 only includes committed supports expected to be used to 31 March 2019.
0.00%
5.00%
10.00%
15.00%
20.00%
25.00%
Dis
trib
uti
on
o
f p
art
icip
an
ts
Average annualised committed supports band
As at Q2 2018-19 distribution of participants As at Q3 2018-19 distribution of participants

March 2019 | COAG Disability Reform Council Quarterly Report 231
Figure J.3 Distribution of participants by annualised committed support band (excluding participants with Supported
Independent Living supports) – active participants with initial plan approvals as at 2018-19 Q3 compared with active
participants with initial plan approvals as at 2018-19 Q2 (SA)
0.00%
5.00%
10.00%
15.00%
20.00%
25.00%
Dis
trib
uti
on
o
f p
art
icip
an
ts
Average annualised committed supports band
As at Q2 2018-19 distribution of participants As at Q3 2018-19 distribution of participants

March 2019 | COAG Disability Reform Council Quarterly Report 232
Figure J.4 Average committed support by age group (including participants with Supported Independent Living supports) –
active participants with initial plan approvals as at 2018-19 Q3 compared with active participants with initial plan approvals as
at 2018-19 Q2 (SA) 232
232 The average revenue amounts have been removed from the figure in this report as the amounts refer to revenue received under the bilateral agreements, and are not linked to age group, primary disability group, and level of function. Therefore, it is not appropriate to make comparisons between revenue and plan budgets in this chart. The amount of revenue received in aggregate should be compared with the amount spent in aggregate – the NDIA has been within budget in all years of operation (including 2018-19).
$0
$20,000
$40,000
$60,000
$80,000
$100,000
$120,000
0 to 6 7 to 14 15 to 18 19 to 24 25 to 34 35 to 44 45 to 54 55 to 64 65+
Av
era
ge
an
nu
ali
se
d c
om
mit
ted
su
pp
ort
s
Age group
As at Q3 2018-19 actual average annualised committed supports
As at Q2 2018-19 actual average annualised committed supports

March 2019 | COAG Disability Reform Council Quarterly Report 233
Figure J.5 Average committed support by primary disability group (including participants with Supported Independent Living
supports) – active participants with initial plan approvals as at 2018-19 Q3 compared with active participants with initial plan
approvals as at 2018-19 Q2 (SA) 233
233 Ibid.
$0 $20,000 $40,000 $60,000 $80,000 $100,000 $120,000
Acquired Brain Injury
Autism
Cerebral Palsy
Developmental Delay
Global Developmental Delay
Hearing Impairment
Intellectual Disability
Multiple Sclerosis
Psychosocial disability
Spinal Cord Injury
Stroke
Visual Impairment
Other Neurological
Other Physical
Other Sensory/Speech
Other
Average annualised committed supports
Pri
ma
ry d
isa
bil
ity
As at Q2 2018-19 actual average annualised committed supports
As at Q3 2018-19 actual average annualised committed supports

March 2019 | COAG Disability Reform Council Quarterly Report 234
Figure J.6 Average committed support by level of function (including participants with Supported Independent Living
supports) – active participants with initial plan approvals as at 2018-19 Q3 compared with active participants with initial plan
approvals as at 2018-19 Q2 (SA) 234,235,236
Table J.48 Payments by financial year, compared to committed supports ($m) – SA
$ Million 2013-14 2014-15 2015-16 2016-17 2017-18 2018-19
Q1, Q2, Q3 Total
Total committed 11.0 50.7 106.2 190.5 368.1 744.7 1,471.4
Total paid 5.9 30.9 65.2 106.4 217.2 425.1 850.7
% utilised to date 54% 61% 61% 56% 59% 57% 57%237
234 Ibid. 235 An ICT issue has been identified and as a result, reporting by level of function is not accurate. This issue is currently
under investigation and will be reconciled for reporting as at 30 June 2019. 236 Average annualised committed supports are not shown where there is insufficient data in the group. Level of function
15 does not have sufficient data to show an average cost. 237 Note: Only committed supports expected to be used to 31 March 2019 have been used to calculate the utilisation from 1 July 2013 to date, and this will increase as there is a lag between when support is provided and when it is paid.
$0
$20,000
$40,000
$60,000
$80,000
$100,000
$120,000
$140,000
$160,000
$180,000
$200,000
1 2 3 4 5 6 7 8 9 10 11 12 13 14 15
Av
era
ge
an
nu
ali
se
d c
os
t
Level of function
As at Q3 2018-19 actual average annualised committed supports
As at Q2 2018-19 actual average annualised committed supports

March 2019 | COAG Disability Reform Council Quarterly Report 235
Figure J.7 Utilisation of committed supports as at 31 December 2018 and 31 March 2019 (SA)

March 2019 | COAG Disability Reform Council Quarterly Report 236
Appendix K: Appendix K:
Tasmania
Part One: Participants and their plans
Table K.1 Plan approvals compared to estimates – TAS
Prior
Quarters 2018-19 Q3
Total excluding
ECEI
Total including
ECEI
Bilateral estimates
TAS 4,984 740 5,724 6,314 8,929
Table K.2 Quarterly intake split by plan and entry type since 1 July 2013 – TAS238
Prior Quarters 2018-19 Q3 Total
Access decisions 6,477 658 7,135
Access Met 5,779 529 6,308
State 2,757 156 2,913
Commonwealth 809 100 909
New 2,213 273 2,486
Total Participant Plans 5,528 1,330 6,314
State 2,418 292 2,710
Commonwealth 632 156 788
New 1,934 292 2,226
ECEI239 544 590 590
Total Participant Plans 5,528 1,330 6,314
Early Intervention (s25) 696 106 802
Permanent Disability (s24) 4,288 634 4,922
ECEI240 544 590 590
Table K.3 Exits from the Scheme since 1 July 2013 as at 31 March 2019 – TAS
Exits
Total participant exits 75
Early Intervention participants 8
Permanent disability participants 67
238 The Joint Standing Committee on the NDIS, in its final report on Hearing Services, recommended that the NDIA better understand the eligibility rate for people with a hearing impairment. Of the number of access decisions in 2018-19 Q3, 86% of people with a hearing impairment met the access criteria compared to 80% overall. 239 The number of children supported in the ECEI gateway cannot be summed across quarters as they can transition to NDIS plans, hence the ECEI figure shown is cumulative. 240 Ibid.

March 2019 | COAG Disability Reform Council Quarterly Report 237
Table K.4 Cumulative position by services previously received – TAS241
Participant cohort Bilateral estimate
% of estimate
State Commonwealth New ECEI Total
Trial 701 33 428 1,162 1,125 103%
End of 2016-17 1,230 63 935 18 2,246 2,242 100%
End of 2017-18 2,027 375 1,476 537 4,415 4,874 91%
End of 2018-19 Q1 2,252 534 1,701 535 5,022 6,072 83%
End of 2018-19 Q2 2,418 632 1,934 544 5,528 7,270 76%
End of 2018-19 Q3 2,710 788 2,226 590 6,314 8,929 71%
Table K.5 Cumulative position by entry into the Scheme – TAS
Participant cohort Bilateral estimate
% of estimate
Early
Intervention Permanent Disability
ECEI Total
Trial 25 1,137 1,162 1,125 103%
End of 2016-17 190 2,038 18 2,246 2,242 100%
End of 2017-18 515 3,363 537 4,415 4,874 91%
End of 2018-19 Q1 603 3,884 535 5,022 6,072 83%
End of 2018-19 Q2 696 4,288 544 5,528 7,270 76%
End of 2018-19 Q3 802 4,922 590 6,314 8,929 71%
Note: in the below tables the percentage figures have been rounded. Therefore, the totals may not
always add up to one hundred per cent.
Table K.6 Participant profile per quarter by Aboriginal and Torres Strait islander status – TAS
Prior Quarters 2018-19 Q3 Total
Participant profile N % N % N %
Aboriginal and Torres Strait Islander 374 7.6% 35 4.7% 409 7.2%
Not Aboriginal and Torres Strait Islander 4,239 86.4% 592 80.0% 4,831 85.5%
Not Stated 296 6.0% 113 15.3% 409 7.2%
Total 4,909 100% 740 100% 5,649 100%
Table K.7 Participant profile per quarter by culturally and linguistically diverse (CALD) status – TAS
Prior Quarters 2018-19 Q3 Total
Participant profile N % N % N %
CALD 129 2.6% 28 3.8% 157 2.8%
Not CALD 4,766 97.1% 712 96.2% 5,478 97.0%
Not Stated 14 0.3% 0 0.0% 14 0.2%
Total 4,909 100% 740 100% 5,649 100%
Table K.8 Participant profile per quarter by Young people in Residential aged care (YPIRAC) status – TAS
Prior Quarters 2018-19 Q3 Total
Participant profile N % N % N %
YPIRAC 17 0.3% 10 1.4% 27 0.5%
Not YPIRAC 4,892 99.7% 730 98.6% 5,622 99.5%
Total 4,909 100% 740 100% 5,649 100%
241 Updated lists of clients are provided by State/Territory and Commonwealth governments each quarter. This results in
some participants being retrospectively reclassified as State, Commonwealth or New.

March 2019 | COAG Disability Reform Council Quarterly Report 238
Table K.9 Participant profile per quarter by remoteness – TAS242,243
Prior Quarters 2018-19 Q3 Total
Participant profile N % N % N %
Major Cities 60 1.2% 0 0.0% 60 1.1%
Population > 50,000 3,070 62.7% 522 70.5% 3,592 63.7%
Population between 15,000 and 50,000
1,068 21.8% 121 16.4% 1,189 21.1%
Population between 5,000 and 15,000
14 0.3% 2 0.3% 16 0.3%
Population less than 5,000 641 13.1% 84 11.4% 725 12.9%
Remote 38 0.8% 8 1.1% 46 0.8%
Very Remote 7 0.1% 3 0.4% 10 0.2%
Missing 11 0 11
Total 4,909 100% 740 100% 5,649 100%
Table K.10 Participant profile per quarter by disability group – TAS244,245
Prior Quarters 2018-19 Q3 Total
Disability N % N % N %
Autism 1,751 36% 115 16% 1,866 33%
Intellectual Disability246 1,874 38% 196 26% 2,070 37%
Psychosocial disability 184 4% 52 7% 236 4%
Cerebral Palsy 278 6% 27 4% 305 5%
Other Neurological 148 3% 49 7% 197 3%
Developmental Delay 56 1% 24 3% 80 1%
Other Physical 112 2% 58 8% 170 3%
Hearing Impairment 107 2% 26 4% 133 2%
ABI 132 3% 81 11% 213 4%
Visual Impairment 77 2% 24 3% 101 2%
Multiple Sclerosis 48 1% 41 6% 89 2%
Global Developmental Delay 53 1% 15 2% 68 1%
Stroke 19 0% 10 1% 29 1%
Spinal Cord Injury 42 1% 16 2% 58 1%
Other Sensory/Speech 19 0% 4 1% 23 0%
Other 9 0% 2 0% 11 0%
Total 4,909 100% 740 100% 5,649 100%
242 This table is based on the Modified Monash Model measure of remoteness. 243 The distributions are calculated excluding active participants with a missing remoteness classification. 244 Table order based on national proportions (highest to lowest) 245 Note: Since 2017-18 Q1, the disability groups Developmental Delay and Global Developmental Delay have been reported separately to the Intellectual Disability group. 246 Down Syndrome is included in Intellectual Disability, representing 4% of all Scheme participants in TAS (244).

March 2019 | COAG Disability Reform Council Quarterly Report 239
Table K.11 Participant profile per quarter by level of function – TAS247
Prior Quarters 2018-19 Q3 Total
Level of Function N % N % N %
1 (High Function) 125 3% 32 4% 157 3%
2 (High Function) 6 0% 2 0% 8 0%
3 (High Function) 284 6% 32 4% 316 6%
4 (High Function) 289 6% 30 4% 319 6%
5 (High Function) 352 7% 41 6% 393 7%
6 (Moderate Function) 1,018 21% 88 12% 1,106 20%
7 (Moderate Function) 552 11% 30 4% 582 10%
8 (Moderate Function) 363 7% 47 6% 410 7%
9 (Moderate Function) 8 0% 8 1% 16 0%
10 (Moderate Function) 418 9% 103 14% 521 9%
11 (Low Function) 288 6% 9 1% 297 5%
12 (Low Function) 561 11% 219 30% 780 14%
13 (Low Function) 485 10% 91 12% 576 10%
14 (Low Function) 141 3% 8 1% 149 3%
15 (Low Function) 1 0% 0 0% 1 0%
Missing 18 0 18
Total 4,909 100% 740 100% 5,649 100%
Table K.12 Participant profile per quarter by Age group – TAS
Prior Quarters 2018-19 Q3 Total
Age Group N % N % N %
0 to 6 284 6% 116 16% 400 7%
7 to 14 1,258 26% 76 10% 1,334 24%
15 to 18 618 13% 17 2% 635 11%
19 to 24 992 20% 5 1% 997 18%
25 to 34 727 15% 23 3% 750 13%
35 to 44 398 8% 63 9% 461 8%
45 to 54 381 8% 188 25% 569 10%
55 to 64 237 5% 239 32% 476 8%
65+ 14 0% 13 2% 27 0%
Total 4,909 100% 740 100% 5,649 100%
Table K.13 Participant profile per quarter by Gender – TAS
Prior Quarters 2018-19 Q3 Total
Gender N % N % N %
Male 2,994 61% 426 58% 3,420 61%
Female 1,734 35% 299 40% 2,033 36%
Indeterminate 181 4% 15 2% 196 3%
Total 4,909 100% 740 100% 5,649 100%
247 An ICT issue has been identified and as a result, reporting by level of function is not accurate. This issue is currently
under investigation and will be reconciled for reporting as at 30 June 2019.

March 2019 | COAG Disability Reform Council Quarterly Report 240
Part Two: Participant experience and outcomes
Table K.14 Number of questionnaires completed by SFOF version – TAS248
Version
Number of questionnaires
collected 2016-17
Number of questionnaires
collected 2017-18
Number of questionnaires collected YTD
2018-19
Number of questionnaires
Participant 0 to school 6 81 212 299
Participant school to 14 564 894 364 1,822
Participant 15 to 24 308 158 66 532
Participant 25 and over 155 499 1,193 1,847
Total Participant 1,033 1,632 1,835 4,500
Family 0 to 14 519 966 561 2,046
Family 15 to 24 162 133 47 342
Family 25 and over 5 195 458 658
Total Family 686 1,294 1,066 3,046
Total 1,719 2,926 2,901 7,546
Table K.15 Selected key indicators for participants – Daily Living (DL) and Choice and Control (CC) – TAS
Indicator 0 to before
school School to 14
15 to 24 25 and over
DL
% with concerns in 6 or more of the areas: gross motor skills, fine motor skills, self-care, eating, social interaction, communication, cognitive development, sensory processing
70%
CC % who say their child is able to tell them what he/she wants
70%
DL % developing functional, learning and coping skills appropriate to their ability and circumstances
35%
DL % who say their child is becoming more independent
44%
CC % of children who have a genuine say in decisions about themselves
72%
CC % who are happy with the level of independence/control they have now
44%
CC % who choose who supports them 46% 50%
CC % who choose what they do each day 55% 61%
CC % who had been given the opportunity to participate in a self-advocacy group meeting
19% 41%
CC % who want more choice and control in their life
80% 78%
248 Baseline outcomes for participants and/or their families and carers were collected for 99.8% of participants.

March 2019 | COAG Disability Reform Council Quarterly Report 241
Table K.16 Selected key indicators for participants – Relationships (REL) and Social/Community Participation (S/CP) – TAS
Indicator 0 to before
school School to
14 15 to 24
25 and over
REL % of children who can make friends with people outside the family
61% 67%
S/CP % of children who participate in age appropriate community, cultural or religious activities
48%
REL % of children who spend time after school and on weekends with friends and/or in mainstream programs
29%
REL Of these, % who are welcomed or actively included
64% 81%
REL % of children who spend time with friends without an adult present
12%
REL % with no friends other than family or paid staff
32% 26%
S/CP % who have been actively involved in a community, cultural or religious group in the last 12 months
21% 33%
Table K.17 Selected key indicators for participants – Lifelong Learning (LL), Work (WK), Home (HM) and Health and Wellbeing
(HW) – TAS
Indicator 0 to before
school School to
14 15 to 24
25 and over
LL % of children attending school in a mainstream class
80%
HM % who are happy with their home 77% 79%
HM % who feel safe or very safe in their home
84% 82%
HW % who rate their health as good, very good or excellent
72% 52%
HW % who did not have any difficulties accessing health services
75% 73%
LL % who currently attend or previously attended school in a mainstream class
67%
LL % who participate in education, training or skill development
9%
LL Of those who participate, % who do so in mainstream settings
57%
LL % unable to do a course or training they wanted to do in the last 12 months
24%
WK % who have a paid job 8% 22%
WK % who volunteer 10% 11%

March 2019 | COAG Disability Reform Council Quarterly Report 242
Table K.18 Selected key indicators for families/carers of participants – TAS
Indicator 0 to 14 15 to 24 25 and over
% receiving Carer Payment 41% 32% 29%
% receiving Carer Allowance 65% 42% 41%
% working in a paid job 41% 41% 29%
Of those in a paid job, % in permanent employment
73% 71% 81%
Of those in a paid job, % working 15 hours or more
73% 80% 85%
% who say they (and their partner) are able to work as much as they want
42% 43% 66%
Of those unable to work as much as they want, % who say the situation of their child/family member with disability is a barrier to working more
91% 81% 85%
Of those unable to work as much as they want, % who say insufficient flexibility of jobs is a barrier to working more
39% 30% 21%
% able to advocate for their child/family member
78% 75% 67%
% who have friends and family they see as often as they like
41% 48% 52%
% who feel very confident or somewhat confident in supporting their child's development
88%
% who know what their family can do to enable their family member with disability to become as independent as possible
43%
% who feel in control selecting services 38% 42%
% who have made plans (or begun to make plans) for when they are no longer able to care for their family member with disability
53%
% who rate their health as good, very good or excellent
69% 63% 64%
Table K.19 Results for “Has the NDIS helped?” questions answered at review, for SFOF version ‘Participant 0 to school’ (n=2) –
TAS249
Question % Yes
DL Has the NDIS improved your child's development? Numbers are
too small
DL Has the NDIS improved your child's access to specialist services? Numbers are
too small
CC Has the NDIS helped increase your child's ability to communicate what they want?
Numbers are too small
REL Has the NDIS improved how your child fits into family life? Numbers are
too small
S/CP Has the NDIS improved how your child fits into community life? Numbers are
too small
249 Results in Tables K.19 to K.22 exclude participants who had their first plan approved between 1 July 2016 and 31
March 2017, as these participants have been included in Tables K.23 to K.25.

March 2019 | COAG Disability Reform Council Quarterly Report 243
Table K.20 Results for “Has the NDIS helped?” questions answered at review, for SFOF version ‘Participant school to 14'
(n=750) – TAS
Question % Yes
DL Has the NDIS helped your child to become more independent? 44%
LL Has the NDIS improved your child's access to education? 18%
REL Has the NDIS improved your child's relationships with family and friends?
33%
S/CP Has the NDIS improved your child's social and recreational life? 35%
Table K.21 Results for “Has the NDIS helped?” questions answered at review, for SFOF versions ‘Participant 15 to 24' (n=205)
and 'Participant 25 and over' (n=309) – TAS
Question 15 to 24 % Yes
25+ % Yes
CC Has the NDIS helped you have more choices and more control over your life?
45% 80%
DL Has the NDIS helped you with daily living activities? 47% 80%
REL Has the NDIS helped you to meet more people? 38% 65%
HM Has your involvement with the NDIS helped you to choose a home that's right for you?
10% 39%
HW Has your involvement with the NDIS improved your health and wellbeing?
26% 56%
LL Has your involvement with the NDIS helped you to learn things you want to learn or to take courses you want to take?
17% 29%
WK Has your involvement with the NDIS helped you find a job that's right for you?
7% 16%
S/CP Has the NDIS helped you be more involved? 36% 71%
Table K.22 Results for “Has the NDIS helped?” questions answered at review, for SFOF version ‘Family 0 to 14’ (n=732); and
for SFOF versions ‘Family 15 to 24’ and ‘Family 25 and over’ combined (n=192) – TAS
Question 0 to 14 % Yes
15+ % Yes
Has the NDIS improved your capacity to advocate (stand up) for your child? / Has the NDIS helped you to know your rights and advocate effectively?
38% 50%
Has the NDIS improved the level of support for your family? 48% 58%
Has the NDIS improved your access to services, programs and activities in the community? / Has the NDIS helped you to access services, programs and activities in the community?
52% 55%
Has the NDIS improved your ability/capacity to help your child develop and learn?
48%
Has the NDIS improved your health and wellbeing? 27% 29%

March 2019 | COAG Disability Reform Council Quarterly Report 244
Table K.23 Results for “Has the NDIS helped?” questions answered at end of participant's first and second years in the
Scheme, for SFOF version ‘Participant school to 14' – TAS250,251
Question Year 1 Year 2 Change
DL Has the NDIS helped your child to become more independent? 44% 41% -3%
LL Has the NDIS improved your child's access to education? 20% 9% -11%
REL Has the NDIS improved your child's relationships with family and friends?
26% 21% -5%
S/CP Has the NDIS improved your child's social and recreational life? 39% 38% -2%
Table K.24 Results for “Has the NDIS helped?” questions answered at end of participant's first and second years in the
Scheme, for SFOF versions ‘Participant 15 to 24' and 'Participant 25 and over' – TAS
15 to 24 25 and over
Question Year 1 Year 2 Change Year 1 Year 2 Change
CC Has the NDIS helped you have more choices and more control over your life?
53% 61% +8% 69% 64% -5%
DL Has the NDIS helped you with daily living activities?
47% 57% +10% 65% 66% +1%
REL Has the NDIS helped you to meet more people?
46% 50% +4% 50% 37% -13%
HM Has your involvement with the NDIS helped you to choose a home that's right for you?
11% 11% 0% 22% 13% -8%
HW Has your involvement with the NDIS improved your health and wellbeing?
32% 35% +3% 44% 32% -12%
LL Has your involvement with the NDIS helped you to learn things you want to learn or to take courses you want to take?
27% 28% +1% 29% 32% +3%
WK Has your involvement with the NDIS helped you find a job that's right for you?
7% 7% 0% 19% 17% -2%
S/CP Has the NDIS helped you be more involved? 45% 52% +7% 56% 57% 0%
250 Results in Tables K.23 to K.26 include participants who had their first plan approved between 1 July 2016 and 31
March 2017. While this is a relatively small group of participants, the number of participants included in these tables will
grow over time. 251 There is insufficient data to show results for SFOF version ‘Participant 0 to school’.

March 2019 | COAG Disability Reform Council Quarterly Report 245
Table K.25 Results for “Has the NDIS helped?” questions answered at end of participant's first and second years in the
Scheme, for SFOF version ‘Family 0 to 14’; and for SFOF versions ‘Family 15 to 24’ and ‘Family 25 and over’ combined – TAS
0 to 14 15 and over
Question Year 1 Year 2 Change Year 1 Year 2 Change
Has the NDIS improved your capacity to advocate (stand up) for your child? / Has the NDIS helped you to know your rights and advocate effectively?
25% 26% 0% 56% 53% -2%
Has the NDIS improved the level of support for your family?
51% 46% -5% 49% 61% +11%
Has the NDIS improved your access to services, programs and activities in the community? / Has the NDIS helped you to access services, programs and activities in the community?
54% 56% +2% 50% 66% +16%
Has the NDIS improved your ability/capacity to help your child develop and learn?
42% 42% 0%
Has the NDIS improved your health and wellbeing?
21% 24% +3% 32% 26% -6%
Table K.26 Progress against the NDIA’s corporate plan metrics for ‘participants in work’ and ‘participants in community and
social activities’ – TAS252
Participants in work Baseline Year 2 2018–19 Target
Aged 15 to 24 years 8% 14%
26% Aged 25+ 27% 24%
Aged 15+ (average) 12% 17%
Participants in community and social activities Baseline Year 2 2018–19 Target
Aged 15 to 24 years 24% 27%
41% Aged 25+ 29% 32%
Aged 15+ (average) 25% 27%
252 Results are drawn from participants’ responses to SFOF questionnaires, and only include participants who had their
first plan approved between 1 July 2016 and 31 March 2017.

March 2019 | COAG Disability Reform Council Quarterly Report 246
Figure K.1 Proportion of participants describing satisfaction with the Agency planning process as good or very good by
quarter – Existing survey administered by NDIA regions (TAS)*253
*Of the participants describing satisfaction with the Agency planning process in Q3 of 2018-19, 63% gave a rating of good or very good,
23% gave a neutral rating and 13% gave a rating of poor or very poor.
Table K.27 Proportion of Participants rating their level of agreement as strongly agree, agree, neutral, disagree or strongly
disagree in response to statements about the planning process – Existing survey administered by NDIA regions (TAS)
Agree /
strongly agree
Neutral Disagree / strongly disagree
The planner listened to me 83% 3% 13%
I had enough time to tell my story and say what support I need
73% 10% 17%
The planner knows what I can do well 77% 10% 13%
The planner had some good ideas for my plan 73% 10% 17%
I know what is in my plan 73% 7% 20%
The planner helped me think about my future 67% 13% 20%
I think my plan will make my life better 57% 23% 20%
The planning meeting went well 83% 7% 10%
Table K.28 Plan reviews conducted per quarter – excluding plans less than 30 days – TAS254
Prior Quarters
(Transition only)
2018-19 Q3 Transition
Total
Total plan reviews 6,372 1,266 7,638
Early intervention plans 558 172 730
Permanent disability plans 5,814 1,094 6,908
253 Participant satisfaction results are not shown if there is insufficient data in the group. 254 Plans less than 30 days in duration have been excluded from this tabulation, as these reviews are more likely to represent corrections to the plan rather than a new plan review to address a change in circumstance.
100%
88% 89%
97%93%
79%
63%
0%
10%
20%
30%
40%
50%
60%
70%
80%
90%
100%
Q314-15
Q414-15
Q115-16
Q215-16
Q315-16
Q415-16
Q116-17
Q216-17
Q316-17
Q416-17
Q117-18
Q217-18
Q317-18
Q417-18
Q118-19
Q218-19
Q318-19
Pro
po
rtio
n o
f P
art
icip
ants
%
Quarter

March 2019 | COAG Disability Reform Council Quarterly Report 247
Table K.29 Scheduled plan reviews conducted by quarter – excluding plans less than 30 days – TAS
Prior Quarters
(Transition only) 2018-19 Q3 Transition Total
Total scheduled plan reviews 4,801 1,063 5,864
Trial participants 2,575 303 2,878
Transition participants 2,226 760 2,986
Table K.30 Unscheduled plan reviews conducted by quarter – excluding plans less than 30 days – TAS
Prior Quarters
(Transition only) 2018-19 Q3 Transition Total
Total unscheduled plan reviews 1,571 203 1,774
Trial participants 652 42 694
Transition participants 919 161 1,080
Table K.31 Estimated rate of unscheduled plan reviews – excluding plans less than 30 days – TAS255
Prior Quarters
(Transition only)
2018-19 Q3 Transition
Total
% unscheduled reviews 22.8% 15.2% 21.6%
Table K.32 AAT cases by category – TAS
Prior Quarters 2018-19 Q3 Total
Category N % N % N %
Access 3 13% 1 50% 4 15%
Plan 15 63% 0 0% 15 58%
Plan Review 6 25% 0 0% 6 23%
Other 0 0% 1 50% 1 4%
Total 24 100% 2 100% 26 100%
% of all access decisions256
0.21% 0.12% 0.20%
Table K.33 AAT cases by open/closed and decision – TAS
N
AAT Cases 26
Open AAT Cases 4
Closed AAT Cases 22
Resolved before hearing 22
Gone to hearing and received a substantive decision
0
Table K.34 Distribution of active participants by method of Financial Plan Management and quarter of plan approval – TAS
Prior Quarters
(Transition only) 2018-19 Q3 Total
Self-managed fully 10% 10% 10%
Self-managed partly 11% 12% 11%
Plan managed 5% 8% 6%
Agency managed 74% 70% 72%
Total 100% 100% 100%
255 This is calculated as the number of unscheduled reviews divided by the total number of participants. The number of participants used in the calculation considers the length of time the participants have been in the Scheme. 256 This is calculated as the number of appeals divided by the number of access decisions made. The number of access decisions used in the calculation considers the length of time since the access decisions have been made.

March 2019 | COAG Disability Reform Council Quarterly Report 248
Table K.35 Distribution of active participants by support coordination and quarter of plan approval – TAS
Prior Quarters
(Transition only) 2018-19 Q3 Total
Support coordination 40% 42% 41%
Table K.36 Duration to plan activation by quarter of initial plan approval for active participants – TAS257,258
Prior Quarters
(Transition Only) 2018-19 Q1
Plan activation N % N %
Less than 30 days 1,801 67% 448 74%
30 to 59 days 233 9% 61 10%
60 to 89 days 146 5% 25 4%
Activated within 90 days
2,180 81% 534 88%
90 to 119 days 100 4% 18 3%
120 days and over 268 10% 13 2%
Activated between 90 and 180 days
368 14% 31 5%
No payments 131 5% 42 7%
Total plans approved 2,679 100% 607 100%
257 Note: Plans approved after the end of 2018-19 Q1 have been excluded from the table. They are relatively new and it is too early to examine their durations to activation. 258 There has been a change in methodology used to calculate these results since the previous quarter. Duration to plan
activation is now calculated as the time from a participant’s initial plan approval to when the participant first uses plan supports (previously only the initial plan for each participant was considered). In-kind supports are now also included (previously excluded). As a result, a higher proportion of participants are identified as activating their plans within 90 days, and a lower proportion have no payments.

March 2019 | COAG Disability Reform Council Quarterly Report 249
Table K.37 Proportion of active participants with plan activated within 12 months – TAS
Number of participants
activated within 12 months
All participants with duration of
at least 12 months
Proportion activated
by Aboriginal and Torres Strait Islander status
Aboriginal and Torres Strait Islander 237 276 86%
Not Aboriginal and Torres Strait Islander 2,805 3,054 92%
Not Stated 126 136 93%
Total 3,168 3,466 91%
by Culturally and Linguistically Diverse status
CALD 63 69 91%
Not CALD 3,094 3,384 91%
Not Stated 11 13 85%
Total 3,168 3,466 91%
by Remoteness
Major Cities 49 56 88%
Regional 3,084 3,366 92%
Remote 25 33 76%
Missing 10 11 91%
Total 3,168 3,466 91%
by Primary Disability type
Autism 1,201 1,320 91% Intellectual Disability (including Down Syndrome) 1,304 1,441 90%
Psychosocial Disability 81 90 90% Developmental Delay (including Global Developmental Delay) 27 30 90%
Other 555 585 95%
Total 3,168 3,466 91%
Table K.38 Distribution of plans by plan utilisation and quarter of plan approval for 2016-17, 2017-18 and quarter 1 of 2018-19–
TAS259,260
Plan utilisation Prior Quarters
(Transition only) 2018-19 Q1 Total
0% to 50% 35% 65% 37%
50% to 75% 16% 19% 16%
> 75% 49% 16% 47%
Total 100% 100% 100%
Table K.39 Proportion of active participants with approved plans accessing mainstream supports - TAS
Prior
Quarters 2018-19 Q3 Total
Daily Activities 8% 8% 8%
Health & Wellbeing 58% 57% 58%
Lifelong Learning 24% 19% 22%
Other 16% 15% 16%
Non-categorised 27% 25% 27%
Any mainstream service 94% 92% 94%
259 Plans less than 30 days in duration have been excluded from this tabulation, as these plans are more likely to represent corrections to the plan rather than an unscheduled plan review to address a change in circumstance. 260 This table only considers committed supports and payments for supports provided to 31 December 2018. This gives some allowance for the timing delay between when the support is provided and when it is paid.

March 2019 | COAG Disability Reform Council Quarterly Report 250
Part Three: Providers and the growing market
Table K.40 Key provider indicators by quarter - TAS261
Prior Quarters 2018-19 Q3 Total
Provider indicators
a) Registrations by profile
Individual/ sole trader 345 47 391
Company/ organisation 989 80 1,068
Total 1,334 127 1,459
b) Registration revoked 2
261 The total number of providers as at 31 March 2019 (1,459) is not the sum of the number of providers as at 31
December 2018 (1,334) and the providers registered in the third quarter of 2018-19 (127). This is due to 2 providers whose registration ended during the third quarter of 2018-19.

March 2019 | COAG Disability Reform Council Quarterly Report 251
Table K.41 Number of approved providers by registration group - TAS262
Registration Group Prior
Quarters 2018-19
Q3 Total % Change
Assistance services
Accommodation / Tenancy Assistance 105 28 133 27%
Assistance Animals 3 0 3 0%
Assistance with daily life tasks in a group or shared living arrangement
76 5 81 7%
Assistance with travel/transport arrangements 184 22 206 12%
Daily Personal Activities 100 2 102 2%
Group and Centre Based Activities 88 2 90 2%
High Intensity Daily Personal Activities 97 3 100 3%
Household tasks 191 36 227 19%
Interpreting and translation 53 9 62 17%
Participation in community, social and civic activities 131 6 137 5%
Assistive Technology
Assistive equipment for recreation 223 30 253 13%
Assistive products for household tasks 180 19 199 11%
Assistance products for personal care and safety 407 44 451 11%
Communication and information equipment 166 16 182 10%
Customised Prosthetics 77 13 90 17%
Hearing Equipment 68 12 80 18%
Hearing Services 3 1 4 33%
Personal Mobility Equipment 275 28 303 10%
Specialised Hearing Services 7 2 9 29%
Vision Equipment 65 11 76 17%
Capacity Building Services
Assistance in coordinating or managing life stages, transitions and supports
130 8 138 6%
Behaviour Support 79 10 89 13%
Community nursing care for high needs 64 16 80 25%
Development of daily living and life skills 118 6 124 5%
Early Intervention supports for early childhood 72 14 86 19%
Exercise Physiology and Physical Wellbeing activities
108 19 127 18%
Innovative Community Participation 156 33 189 21%
Specialised Driving Training 46 9 55 20%
Therapeutic Supports 302 26 328 9%
Capital services
Home modification design and construction 133 25 158 19%
Specialised Disability Accommodation 77 17 94 22%
Vehicle Modifications 49 9 58 18%
Choice and control support services
Management of funding for supports in participants plan
43 6 49 14%
Support Coordination 71 11 82 15%
Employment and Education support services
Assistance to access and/or maintain employment and/or education
48 3 51 6%
Specialised Supported Employment 27 2 29 7%
Total approved providers 1,332 127 1,459 10%
262 The 2 providers whose registration ended during the third quarter of 2018-19 are not included in the 2018-19 Q2 and prior numbers in this table.

March 2019 | COAG Disability Reform Council Quarterly Report 252
Table K.42 Key markets indicators by quarter - TAS
Market indicators Prior Quarters 2018-19 Q3
a) Average number of providers per participant 1.74 1.73
b) Number of providers delivering new supports 110 127
c) Change in the number of active/inactive providers:
Active (%) 22% 22%
Not yet active (%) 71% 70%
Inactive (%) 7% 8%
d) Share of payments - top 25%
Daily Tasks/Shared Living (%) 80% 83%
Therapeutic Supports (%) 83% 84%
Participate Community (%) 84% 84%
Early Childhood Supports (%) 77% 80%
Assist Personal Activities (%) 83% 79%

March 2019 | COAG Disability Reform Council Quarterly Report 253
Table K.43 Cumulative number of providers that have been active by registration group - TAS
Registration Group Prior
Quarters 2018-19
Q3 Total % Change
Assistance services
Accommodation / Tenancy Assistance 9 1 10 11%
Assistance Animals 2 0 2 0%
Assistance with daily life tasks in a group or shared living arrangement
43 7 50 16%
Assistance with travel/transport arrangements 51 4 55 8%
Daily Personal Activities 68 3 71 4%
Group and Centre Based Activities 47 2 49 4%
High Intensity Daily Personal Activities 64 0 64 0%
Household tasks 36 9 45 25%
Interpreting and translation 4 0 4 0%
Participation in community, social and civic activities 82 3 85 4%
Assistive Technology
Assistive equipment for recreation 6 3 9 50%
Assistive products for household tasks 4 0 4 0%
Assistance products for personal care and safety 73 11 84 15%
Communication and information equipment 17 1 18 6%
Customised Prosthetics 15 2 17 13%
Hearing Equipment 9 2 11 22%
Hearing Services 0 0 0 -
Personal Mobility Equipment 25 5 30 20%
Specialised Hearing Services 1 0 1 0%
Vision Equipment 9 1 10 11%
Capacity Building Services
Assistance in coordinating or managing life stages, transitions and supports
86 7 93 8%
Behaviour Support 32 5 37 16%
Community nursing care for high needs 4 1 5 25%
Development of daily living and life skills 65 6 71 9%
Early Intervention supports for early childhood 27 6 33 22%
Exercise Physiology and Physical Wellbeing activities
19 3 22 16%
Innovative Community Participation 10 1 11 10%
Specialised Driving Training 3 0 3 0%
Therapeutic Supports 159 15 174 9%
Capital services
Home modification design and construction 11 1 12 9%
Specialised Disability Accommodation 7 1 8 14%
Vehicle Modifications 8 0 8 0%
Choice and control support services
Management of funding for supports in participants plan
18 2 20 11%
Support Coordination 20 2 22 10%
Employment and Education support services
Assistance to access and/or maintain employment and/or education
27 2 29 7%
Specialised Supported Employment 17 1 18 6%
Total approved active providers 392 41 433 10%

March 2019 | COAG Disability Reform Council Quarterly Report 254
Table K.44 Number of approved and active providers in each registration group by legal entity type as at 31 March 2019 – TAS
Registration Group
Approved Active
Individual/ sole trader
Company/ organisation
Total Approved
Individual/ sole trader
Company/ organisation
Total Active
Assistance services
Accommodation / Tenancy Assistance
18 115 133 3 7 10
Assistance Animals 0 3 3 0 2 2
Assistance with daily life tasks in a group or shared living arrangement
14 67 81 7 43 50
Assistance with travel/transport arrangements
30 176 206 3 52 55
Daily Personal Activities 12 90 102 6 65 71
Group and Centre Based Activities
12 78 90 4 45 49
High Intensity Daily Personal Activities
13 87 100 6 58 64
Household tasks 42 185 227 6 39 45
Interpreting and translation 10 52 62 0 4 4
Participation in community, social and civic activities
21 116 137 13 72 85
Assistive Technology
Assistive equipment for recreation
45 208 253 0 9 9
Assistive products for household tasks
36 163 199 0 4 4
Assistance products for personal care and safety
59 392 451 8 76 84
Communication and information equipment
43 139 182 1 17 18
Customised Prosthetics 16 74 90 2 15 17
Hearing Equipment 12 68 80 2 9 11
Hearing Services 1 3 4 0 0 0
Personal Mobility Equipment 45 258 303 4 26 30
Specialised Hearing Services
2 7 9 0 1 1
Vision Equipment 14 62 76 0 10 10
Capacity Building Services
Assistance in coordinating or managing life stages, transitions and supports
28 110 138 23 70 93
Behaviour Support 37 52 89 16 21 37
Community nursing care for high needs
6 74 80 0 5 5
Development of daily living and life skills
19 105 124 7 64 71
Early Intervention supports for early childhood
44 42 86 18 15 33
Exercise Physiology and Physical Wellbeing activities
32 95 127 5 17 22
Innovative Community Participation
55 134 189 6 5 11
Specialised Driving Training 10 45 55 2 1 3
Therapeutic Supports 177 151 328 86 88 174
Capital services 18 115 133 3 7 10
Home modification design and construction
34 124 158 2 10 12
Specialised Disability Accommodation
5 89 94 1 7 8
Vehicle Modifications 6 52 58 1 7 8
Choice and control support services
Management of funding for supports in participants plan
5 44 49 3 17 20

March 2019 | COAG Disability Reform Council Quarterly Report 255
Registration Group
Approved Active
Individual/ sole trader
Company/ organisation
Total Approved
Individual/ sole trader
Company/ organisation
Total Active
Support Coordination 23 59 82 4 18 22
Employment and Education support services
Assistance to access and/or maintain employment and/or education
6 45 51 2 27 29
Specialised Supported Employment
2 27 29 2 16 18
Total 391 1,068 1,459 125 308 433
Table K.45 Proportion of approved and active providers in each registration group by legal entity type as at 31 March 2019 –
TAS
Registration Group
Approved Active
Individual/ sole trader
Company/ organisation
Total Approved
Individual/ sole trader
Company/ organisation
Total Active
Assistance services
Accommodation / Tenancy Assistance
14% 86% 133 30% 70% 10
Assistance Animals 0% 100% 3 0% 100% 2
Assistance with daily life tasks in a group or shared living arrangement
17% 83% 81 14% 86% 50
Assistance with travel/transport arrangements
15% 85% 206 5% 95% 55
Daily Personal Activities 12% 88% 102 8% 92% 71
Group and Centre Based Activities
13% 87% 90 8% 92% 49
High Intensity Daily Personal Activities
13% 87% 100 9% 91% 64
Household tasks 19% 81% 227 13% 87% 45
Interpreting and translation 16% 84% 62 0% 100% 4
Participation in community, social and civic activities
15% 85% 137 15% 85% 85
Assistive Technology Assistive equipment for recreation
18% 82% 253 0% 100% 9
Assistive products for household tasks
18% 82% 199 0% 100% 4
Assistance products for personal care and safety
13% 87% 451 10% 90% 84
Communication and information equipment
24% 76% 182 6% 94% 18
Customised Prosthetics 18% 82% 90 12% 88% 17
Hearing Equipment 15% 85% 80 18% 82% 11
Hearing Services 25% 75% 4 - - 0
Personal Mobility Equipment 15% 85% 303 13% 87% 30
Specialised Hearing Services
22% 78% 9 0% 100% 1
Vision Equipment 18% 82% 76 0% 100% 10
Capacity Building Services Assistance in coordinating or managing life stages, transitions and supports
20% 80% 138 25% 75% 93
Behaviour Support 42% 58% 89 43% 57% 37
Community nursing care for high needs
8% 93% 80 0% 100% 5
Development of daily living and life skills
15% 85% 124 10% 90% 71
Early Intervention supports for early childhood
51% 49% 86 55% 45% 33

March 2019 | COAG Disability Reform Council Quarterly Report 256
Registration Group
Approved Active
Individual/ sole trader
Company/ organisation
Total Approved
Individual/ sole trader
Company/ organisation
Total Active
Exercise Physiology and Physical Wellbeing activities
25% 75% 127 23% 77% 22
Innovative Community Participation
29% 71% 189 55% 45% 11
Specialised Driving Training 18% 82% 55 67% 33% 3
Therapeutic Supports 54% 46% 328 49% 51% 174
Capital services Home modification design and construction
22% 78% 158 17% 83% 12
Specialised Disability Accommodation
5% 95% 94 13% 88% 8
Vehicle Modifications 10% 90% 58 13% 88% 8
Choice and control support services
Management of funding for supports in participants plan
10% 90% 49 15% 85% 20
Support Coordination 28% 72% 82 18% 82% 22
Employment and Education support services
Assistance to access and/or maintain employment and/or education
12% 88% 51 7% 93% 29
Specialised Supported Employment
7% 93% 29 11% 89% 18
Total 27% 73% 1,459 29% 71% 433

March 2019 | COAG Disability Reform Council Quarterly Report 257
Part Five: Financial sustainability
Table K.46 Committed supports by financial year ($m) - TAS
2013-14 2014-15 2015-16 2016-17 2017-18 2018-19 Q1,
Q2, Q3263 Total
Total Committed
18.0 51.6 65.9 99.6 188.1 270.4 693.7
Figure K.2 Distribution of participants by annualised committed support band (including participants with Supported
Independent Living supports) – active participants with initial plan approvals as at 2018-19 Q3 compared with active
participants with initial plan approvals as at 2018-19 Q2 (TAS)
263 Note: the $270 million in respect of 2018-19 Q1, Q2 and Q3 only includes committed supports expected to be used to 31 March 2019.
0.00%
2.00%
4.00%
6.00%
8.00%
10.00%
12.00%
14.00%
16.00%
18.00%
Dis
trib
uti
on
o
f p
art
icip
an
ts
Average annualised committed supports band
As at Q2 2018-19 distribution of participants As at Q3 2018-19 distribution of participants

March 2019 | COAG Disability Reform Council Quarterly Report 258
Figure K.3 Distribution of participants by annualised committed support band (excluding participants with Supported
Independent Living supports) – active participants with initial plan approvals as at 2018-19 Q3 compared with active
participants with initial plan approvals as at 2018-19 Q2 (TAS)
0.00%
2.00%
4.00%
6.00%
8.00%
10.00%
12.00%
14.00%
16.00%
18.00%
20.00%
Dis
trib
uti
on
o
f p
art
icip
an
ts
Average annualised committed supports band
As at Q2 2018-19 distribution of participants As at Q3 2018-19 distribution of participants

March 2019 | COAG Disability Reform Council Quarterly Report 259
Figure K.4 Average committed support by age group (including participants with Supported Independent Living supports) –
active participants with initial plan approvals as at 2018-19 Q3 compared with active participants with initial plan approvals as
at 2018-19 Q2 (TAS) 264
264 The average revenue amounts have been removed from the figure in this report as the amounts refer to revenue received under the bilateral agreements, and are not linked to age group, primary disability group, and level of function. Therefore, it is not appropriate to make comparisons between revenue and plan budgets in this chart. The amount of revenue received in aggregate should be compared with the amount spent in aggregate – the NDIA has been within budget in all years of operation (including 2018-19).
$0
$50,000
$100,000
$150,000
$200,000
$250,000
$300,000
0 to 6 7 to 14 15 to 18 19 to 24 25 to 34 35 to 44 45 to 54 55 to 64 65+
Av
era
ge
an
nu
ali
se
d c
om
mit
ted
su
pp
ort
s
Age groupAs at Q3 2018-19 actual average annualised committed supports
As at Q2 2018-19 actual average annualised committed supports

March 2019 | COAG Disability Reform Council Quarterly Report 260
Figure K.5 Average committed support by primary disability group (including participants with Supported Independent Living
supports) – active participants with initial plan approvals as at 2018-19 Q3 compared with active participants with initial plan
approvals as at 2018-19 Q2 (TAS) 265,266
265 Ibid. 266 Average annualised committed supports are not shown where there is insufficient data in the group. There is insufficient data to show an average cost for Other as at Q2 2018-19.
$0 $20,000 $40,000 $60,000 $80,000 $100,000 $120,000 $140,000 $160,000
Acquired Brain Injury
Autism
Cerebral Palsy
Developmental Delay
Global Developmental Delay
Hearing Impairment
Intellectual Disability
Multiple Sclerosis
Psychosocial disability
Spinal Cord Injury
Stroke
Visual Impairment
Other Neurological
Other Physical
Other Sensory/Speech
Other
Average annualised committed supports
Pri
ma
ry d
isa
bil
ity
As at Q2 2018-19 actual average annualised committed supports
As at Q3 2018-19 actual average annualised committed supports

March 2019 | COAG Disability Reform Council Quarterly Report 261
Figure K.6 Average committed support by level of function (including participants with Supported Independent Living
supports) – active participants with initial plan approvals as at 2018-19 Q3 compared with active participants with initial plan
approvals as at 2018-19 Q2 (TAS) 267,268,269
Table K.47 Payments by financial year, compared to committed supports ($m) – TAS
2013-14 2014-15 2015-16 2016-17 2017-18 2018-19
Q1, Q2, Q3 Total
Total Committed 18.0 51.6 65.9 99.6 188.1 270.4 693.7
Total Paid 10.0 36.6 48.6 78.2 152.0 179.6 505.0
% utilised to date 55% 71% 74% 78% 81% 66% 70%270
267 The average revenue amounts have been removed from the figure in this report as the amounts refer to revenue received under the bilateral agreements, and are not linked to age group, primary disability group, and level of function. Therefore, it is not appropriate to make comparisons between revenue and plan budgets in this chart. The amount of revenue received in aggregate should be compared with the amount spent in aggregate – the NDIA has been within budget in all years of operation (including 2018-19). 268 An ICT issue has been identified and as a result, reporting by level of function is not accurate. This issue is currently under investigation and will be reconciled for reporting as at 30 June 2019. 269 Average annualised committed supports are not shown where there is insufficient data in the group. Levels of function 2 and 15 have insufficient data to show an average cost for Q2 and Q3 2018-19, and level of function 9 has insufficient data to show an average cost for Q2 2018-19. 270 Note: Only committed supports expected to be used to 31 March 2019 have been used to calculate the utilisation from 1 July 2013 to date, and this will increase as there is a lag between when support is provided and when it is paid.
$0
$50,000
$100,000
$150,000
$200,000
$250,000
1 2 3 4 5 6 7 8 9 10 11 12 13 14 15
Av
era
ge
an
nu
ali
se
d c
os
t
Level of function
As at Q3 2018-19 actual average annualised committed supports
As at Q2 2018-19 actual average annualised committed supports

March 2019 | COAG Disability Reform Council Quarterly Report 262
Figure K.7 Utilisation of committed supports as at 31 December 2018 and 31 March 2019 (TAS)

March 2019 | COAG Disability Reform Council Quarterly Report 263
Appendix L: Appendix L:
Australian Capital Territory
Part One: Participants and their plans
Table L.1 Plan approvals compared to estimates – ACT
Prior
Quarters 2018-19 Q3
Total excluding
ECEI
Total including
ECEI
Bilateral estimates
ACT 7,415 205 7,620 7,661 5,075
Table L.2 Quarterly intake split by plan and entry type since 1 July 2013 – ACT271
Prior Quarters 2018-19 Q3 Total
Access decisions 9,313 243 9,556
Access Met 7,701 174 7,875
State 2,912 0 2,912
Commonwealth 282 9 291
New 4,507 165 4,672
Total Participant Plans 7,451 246 7,661
State 2,883 2 2,885
Commonwealth 271 12 283
New 4,261 191 4,452
ECEI272 36 41 41
Total Participant Plans 7,451 246 7,661
Early Intervention (s25) 2,794 114 2,908
Permanent Disability (s24) 4,621 91 4,712
ECEI273 36 41 41
Table L.3 Exits from the Scheme since 1 July 2013 as at 31 March 2019 – ACT
Exits
Total participant exits 776
Early Intervention participants 502
Permanent disability participants 274
271 The Joint Standing Committee on the NDIS, in its final report on Hearing Services, recommended that the NDIA better understand the eligibility rate for people with a hearing impairment. Of the number of access decisions in 2018-19 Q3, 82% of people with a hearing impairment met the access criteria compared to 72% overall. 272 The number of children supported in the ECEI gateway cannot be summed across quarters as they can transition to NDIS plans, hence the ECEI figure shown is cumulative. 273 Ibid.

March 2019 | COAG Disability Reform Council Quarterly Report 264
Table L.4 Cumulative position by services previously received – ACT274
Participant cohort Bilateral estimate
% of estimate
State Commonwealth New ECEI Total
Trial 2,712 52 1,334 4,098 4,278 96%
End of 2016-17 2,857 183 3,008 0 6,048 5,075 119%
End of 2017-18 2,874 249 3,636 49 6,808 5,075 134%
End of 2018-19 Q1 2,877 259 3,941 30 7,107 5,075 140%
End of 2018-19 Q2 2,883 271 4,261 36 7,451 5,075 147%
End of 2018-19 Q3 2,885 283 4,452 41 7,661 5,075 151%
Table L.5 Cumulative position by entry into the Scheme – ACT
Participant cohort Bilateral estimate
% of estimate
Early
Intervention Permanent Disability
ECEI Total
Trial 1,559 2,539 4,098 4,278 96%
End of 2016-17 2,119 3,929 0 6,048 5,075 119%
End of 2017-18 2,445 4,314 49 6,808 5,075 134%
End of 2018-19 Q1 2,607 4,470 30 7,107 5,075 140%
End of 2018-19 Q2 2,794 4,621 36 7,451 5,075 147%
End of 2018-19 Q3 2,908 4,712 41 7,661 5,075 151%
Note: in the below tables the percentage figures have been rounded. Therefore, the totals may not
always add up to one hundred per cent.
Table L.6 Participant profile per quarter by Aboriginal and Torres Strait islander status – ACT
Prior Quarters 2018-19 Q3 Total
Participant profile N % N % N %
Aboriginal and Torres Strait Islander 281 4.2% 2 1.0% 283 4.1%
Not Aboriginal and Torres Strait Islander 6,116 92.1% 195 95.1% 6,311 92.2%
Not Stated 242 3.6% 8 3.9% 250 3.7%
Total 6,639 100% 205 100% 6,844 100%
Table L.7 Participant profile per quarter by culturally and linguistically diverse (CALD) status – ACT
Prior Quarters 2018-19 Q3 Total
Participant profile N % N % N %
CALD 694 10.5% 23 11.2% 717 10.5%
Not CALD 5,821 87.7% 182 88.8% 6,003 87.7%
Not Stated 124 1.9% 0 0.0% 124 1.8%
Total 6,639 100% 205 100% 6,844 100%
Table L.8 Participant profile per quarter by Young people in Residential aged care (YPIRAC) status – ACT
Prior Quarters 2018-19 Q3 Total
Participant profile N % N % N %
YPIRAC 46 0.7% 2 1.0% 48 0.7%
Not YPIRAC 6,593 99.3% 203 99.0% 6,796 99.3%
Total 6,639 100% 205 100% 6,844 100%
274 Updated lists of clients are provided by State/Territory and Commonwealth governments each quarter. This results in
some participants being retrospectively reclassified as State, Commonwealth or New.

March 2019 | COAG Disability Reform Council Quarterly Report 265
Table L.9 Participant profile per quarter by remoteness – ACT275,276
Prior Quarters 2018-19 Q3 Total
Participant profile N % N % N %
Major Cities 6,380 96.3% 202 98.5% 6,582 96.3%
Population > 50,000 132 2.0% 3 1.5% 135 2.0%
Population between 15,000 and 50,000
21 0.3% 0 0.0% 21 0.3%
Population between 5,000 and 15,000
24 0.4% 0 0.0% 24 0.4%
Population less than 5,000 69 1.0% 0 0.0% 69 1.0%
Remote 1 0.0% 0 0.0% 1 0.0%
Very Remote 0 0.0% 0 0.0% 0 0.0%
Missing 12 0 12
Total 6,639 100% 205 100% 6,844 100%
Table L.10 Participant profile per quarter by disability group – ACT277,278
Prior Quarters 2018-19 Q3 Total
Disability N % N % N %
Autism 1,753 26% 60 29% 1,813 26%
Intellectual Disability279 1,343 20% 11 5% 1,354 20%
Psychosocial disability 843 13% 19 9% 862 13%
Cerebral Palsy 270 4% 1 0% 271 4%
Other Neurological 284 4% 8 4% 292 4%
Developmental Delay 467 7% 45 22% 512 7%
Other Physical 439 7% 10 5% 449 7%
Hearing Impairments 292 4% 19 9% 311 5%
ABI 173 3% 3 1% 176 3%
Visual Impairment 159 2% 5 2% 164 2%
Multiple Sclerosis 173 3% 2 1% 175 3%
Global Developmental Delay 117 2% 19 9% 136 2%
Stroke 97 1% 1 0% 98 1%
Spinal Cord Injury 61 1% 1 0% 62 1%
Other Sensory/Speech 150 2% 1 0% 151 2%
Other 18 0% 0 0% 18 0%
Total 6,639 100% 205 100% 6,844 100%
275 This table is based on the Modified Monash Model measure of remoteness. 276 The distributions are calculated excluding active participants with a missing remoteness classification. 277 Table order based on national proportions (highest to lowest) 278 Note: Since 2017-18 Q1, the disability groups Developmental Delay and Global Developmental Delay have been reported separately to the Intellectual Disability group. 279 Down Syndrome is included in Intellectual Disability, representing 3% of all Scheme participants in ACT (228).

March 2019 | COAG Disability Reform Council Quarterly Report 266
Table L.11 Participant profile per quarter by level of function – ACT280
Prior Quarters 2018-19 Q3 Total
Level of Function N % N % N %
1 (High Function) 549 8% 30 15% 579 9%
2 (High Function) 11 0% 0 0% 11 0%
3 (High Function) 415 6% 12 6% 427 6%
4 (High Function) 692 10% 23 11% 715 10%
5 (High Function) 504 8% 16 8% 520 8%
6 (Moderate Function) 990 15% 38 19% 1,028 15%
7 (Moderate Function) 434 7% 9 4% 443 7%
8 (Moderate Function) 511 8% 9 4% 520 8%
9 (Moderate Function) 49 1% 0 0% 49 1%
10 (Moderate Function) 738 11% 15 7% 753 11%
11 (Low Function) 335 5% 3 1% 338 5%
12 (Low Function) 755 11% 8 4% 763 11%
13 (Low Function) 474 7% 42 20% 516 8%
14 (Low Function) 149 2% 0 0% 149 2%
15 (Low Function) 0 0% 0 0% 0 0%
Missing 33 0 33
Total 6,639 100% 205 100% 6,844 100%
Table L.12 Participant profile per quarter by Age group – ACT
Prior Quarters 2018-19 Q3 Total
Age Group N % N % N %
0 to 6 901 14% 87 42% 988 14%
7 to 14 1,668 25% 46 22% 1,714 25%
15 to 18 555 8% 11 5% 566 8%
19 to 24 591 9% 3 1% 594 9%
25 to 34 518 8% 12 6% 530 8%
35 to 44 626 9% 12 6% 638 9%
45 to 54 707 11% 14 7% 721 11%
55 to 64 778 12% 16 8% 794 12%
65+ 295 4% 4 2% 299 4%
Total 6,639 100% 205 100% 6,844 100%
Table L.13 Participant profile per quarter by Gender – ACT
Prior Quarters 2018-19 Q3 Total
Gender N % N % N %
Male 4,007 60% 126 61% 4,133 60%
Female 2,598 39% 73 36% 2,671 39%
Indeterminate 34 1% 6 3% 40 1%
Total 6,639 100% 205 100% 6,844 100%
280 An ICT issue has been identified and as a result, reporting by level of function is not accurate. This issue is currently
under investigation and will be reconciled for reporting as at 30 June 2019.
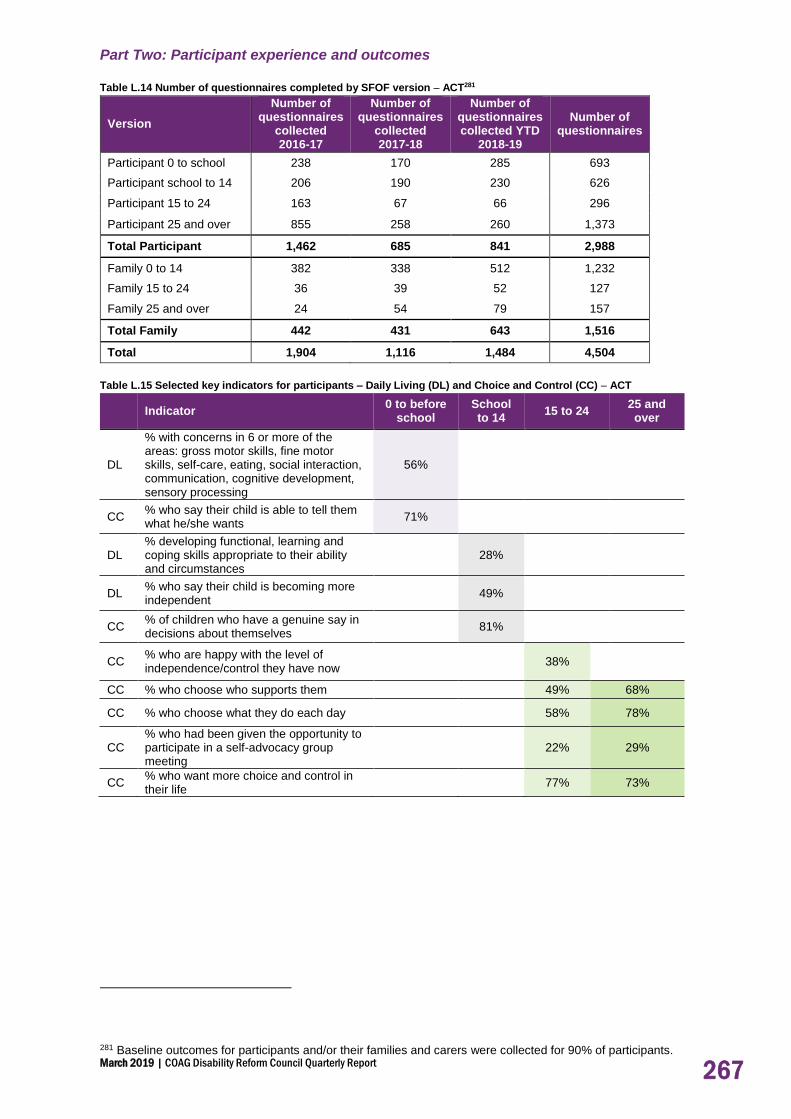
March 2019 | COAG Disability Reform Council Quarterly Report 267
Part Two: Participant experience and outcomes
Table L.14 Number of questionnaires completed by SFOF version – ACT281
Version
Number of questionnaires
collected 2016-17
Number of questionnaires
collected 2017-18
Number of questionnaires collected YTD
2018-19
Number of questionnaires
Participant 0 to school 238 170 285 693
Participant school to 14 206 190 230 626
Participant 15 to 24 163 67 66 296
Participant 25 and over 855 258 260 1,373
Total Participant 1,462 685 841 2,988
Family 0 to 14 382 338 512 1,232
Family 15 to 24 36 39 52 127
Family 25 and over 24 54 79 157
Total Family 442 431 643 1,516
Total 1,904 1,116 1,484 4,504
Table L.15 Selected key indicators for participants – Daily Living (DL) and Choice and Control (CC) – ACT
Indicator 0 to before
school School to 14
15 to 24 25 and over
DL
% with concerns in 6 or more of the areas: gross motor skills, fine motor skills, self-care, eating, social interaction, communication, cognitive development, sensory processing
56%
CC % who say their child is able to tell them what he/she wants
71%
DL % developing functional, learning and coping skills appropriate to their ability and circumstances
28%
DL % who say their child is becoming more independent
49%
CC % of children who have a genuine say in decisions about themselves
81%
CC % who are happy with the level of independence/control they have now
38%
CC % who choose who supports them 49% 68%
CC % who choose what they do each day 58% 78%
CC % who had been given the opportunity to participate in a self-advocacy group meeting
22% 29%
CC % who want more choice and control in their life
77% 73%
281 Baseline outcomes for participants and/or their families and carers were collected for 90% of participants.

March 2019 | COAG Disability Reform Council Quarterly Report 268
Table L.16 Selected key indicators for participants – Relationships (REL) and Social/Community Participation (S/CP) – ACT
Indicator 0 to before
school School to
14 15 to 24
25 and over
REL % of children who can make friends with people outside the family
61% 68%
S/CP % of children who participate in age appropriate community, cultural or religious activities
60%
REL % of children who spend time after school and on weekends with friends and/or in mainstream programs
46%
REL Of these, % who are welcomed or actively included
64% 73%
REL % of children who spend time with friends without an adult present
18%
REL % with no friends other than family or paid staff
26% 27%
S/CP % who have been actively involved in a community, cultural or religious group in the last 12 months
36% 38%
Table L.17 Selected key indicators for participants – Lifelong Learning (LL), Work (WK), Home (HM) and Health and Wellbeing
(HW) – ACT
Indicator 0 to before
school School to
14 15 to 24
25 and over
LL % of children attending school in a mainstream class
80%
HM % who are happy with their home 77% 70%
HM % who feel safe or very safe in their home
84% 67%
HW % who rate their health as good, very good or excellent
61% 43%
HW % who did not have any difficulties accessing health services
75% 63%
LL % who currently attend or previously attended school in a mainstream class
62%
LL % who participate in education, training or skill development
15%
LL Of those who participate, % who do so in mainstream settings
80%
LL % unable to do a course or training they wanted to do in the last 12 months
43%
WK % who have a paid job 26% 31%
WK % who volunteer 13% 16%

March 2019 | COAG Disability Reform Council Quarterly Report 269
Table L.18 Selected key indicators for families/carers of participants – ACT
Indicator 0 to 14 15 to 24 25 and over
% receiving Carer Payment 10% 14% 14%
% receiving Carer Allowance 22% 28% 24%
% working in a paid job 58% 69% 48%
Of those in a paid job, % in permanent employment
88% 86% 86%
Of those in a paid job, % working 15 hours or more
87% 90% 91%
% who say they (and their partner) are able to work as much as they want
53% 60% 55%
Of those unable to work as much as they want, % who say the situation of their child/family member with disability is a barrier to working more
82% 98% 95%
Of those unable to work as much as they want, % who say insufficient flexibility of jobs is a barrier to working more
29% 26% 9%
% able to advocate for their child/family member
85% 75% 70%
% who have friends and family they see as often as they like
52% 50% 48%
% who feel very confident or somewhat confident in supporting their child's development
89%
% who know what their family can do to enable their family member with disability to become as independent as possible
44%
% who feel in control selecting services 45% 33%
% who have made plans (or begun to make plans) for when they are no longer able to care for their family member with disability
30%
% who rate their health as good, very good or excellent
79% 67% 64%
Table L.19 Results for “Has the NDIS helped?” questions answered at review, for SFOF version ‘Participant 0 to school’ (n=85)
– ACT282
Question % Yes
DL Has the NDIS improved your child's development? 86%
DL Has the NDIS improved your child's access to specialist services? 91%
CC Has the NDIS helped increase your child's ability to communicate what they want?
78%
REL Has the NDIS improved how your child fits into family life? 70%
S/CP Has the NDIS improved how your child fits into community life? 67%
282 Results in Tables L.19 to L.22 exclude participants who had their first plan approved between 1 July 2016 and 31
March 2017, as these participants have been included in Tables L.23 to L.26.

March 2019 | COAG Disability Reform Council Quarterly Report 270
Table L.20 Results for “Has the NDIS helped?” questions answered at review, for SFOF version ‘Participant school to 14'
(n=140) – ACT
Question % Yes
DL Has the NDIS helped your child to become more independent? 68%
LL Has the NDIS improved your child's access to education? 47%
REL Has the NDIS improved your child's relationships with family and friends?
54%
S/CP Has the NDIS improved your child's social and recreational life? 51%
Table L.21 Results for “Has the NDIS helped?” questions answered at review, for SFOF versions ‘Participant 15 to 24' (n=44)
and 'Participant 25 and over' (n=168) – ACT
Question 15 to 24 % Yes
25+ % Yes
CC Has the NDIS helped you have more choices and more control over your life?
72% 63%
DL Has the NDIS helped you with daily living activities? 73% 72%
REL Has the NDIS helped you to meet more people? 51% 44%
HM Has your involvement with the NDIS helped you to choose a home that's right for you?
13% 22%
HW Has your involvement with the NDIS improved your health and wellbeing?
59% 51%
LL Has your involvement with the NDIS helped you to learn things you want to learn or to take courses you want to take?
35% 27%
WK Has your involvement with the NDIS helped you find a job that's right for you?
13% 20%
S/CP Has the NDIS helped you be more involved? 64% 51%
Table L.22 Results for “Has the NDIS helped?” questions answered at review, for SFOF version ‘Family 0 to 14’ (n=207); and for
SFOF versions ‘Family 15 to 24’ and ‘Family 25 and over’ combined (n=39) – ACT
Question 0 to 14 % Yes
15+ % Yes
Has the NDIS improved your capacity to advocate (stand up) for your child? / Has the NDIS helped you to know your rights and advocate effectively?
72% 51%
Has the NDIS improved the level of support for your family? 75% 62%
Has the NDIS improved your access to services, programs and activities in the community? / Has the NDIS helped you to access services, programs and activities in the community?
76% 51%
Has the NDIS improved your ability/capacity to help your child develop and learn?
82%
Has the NDIS improved your health and wellbeing? 44% 33%

March 2019 | COAG Disability Reform Council Quarterly Report 271
Table L.23 Results for “Has the NDIS helped?” questions answered at end of participant's first and second years in the
Scheme, for SFOF version ‘Participant 0 to school’ – ACT283
Question Year 1 Year 2 Change
DL Has the NDIS improved your child's development? 96% 100% +4%
DL Has the NDIS improved your child's access to specialist services? 92% 97% +4%
CC Has the NDIS helped increase your child's ability to communicate what they want?
84% 93% +10%
REL Has the NDIS improved how your child fits into family life? 71% 75% +4%
S/CP Has the NDIS improved how your child fits into community life? 65% 69% +4%
Table L.24 Results for “Has the NDIS helped?” questions answered at end of participant's first and second years in the
Scheme, for SFOF version ‘Participant school to 14' – ACT
Question Year 1 Year 2 Change
DL Has the NDIS helped your child to become more independent? 60% 70% +10%
LL Has the NDIS improved your child's access to education? 40% 41% +1%
REL Has the NDIS improved your child's relationships with family and friends?
49% 54% +6%
S/CP Has the NDIS improved your child's social and recreational life? 44% 54% +10%
Table L.25 Results for “Has the NDIS helped?” questions answered at end of participant's first and second years in the
Scheme, for SFOF versions ‘Participant 15 to 24' and 'Participant 25 and over' – ACT
15 to 24 25 and over
Question Year 1 Year 2 Change Year 1 Year 2 Change
CC Has the NDIS helped you have more choices and more control over your life?
60% 67% +7% 75% 79% +4%
DL Has the NDIS helped you with daily living activities?
54% 62% +8% 77% 82% +5%
REL Has the NDIS helped you to meet more people?
45% 55% +10% 48% 52% +4%
HM Has your involvement with the NDIS helped you to choose a home that's right for you?
12% 16% +4% 22% 20% -2%
HW Has your involvement with the NDIS improved your health and wellbeing?
48% 50% +2% 59% 66% +7%
LL Has your involvement with the NDIS helped you to learn things you want to learn or to take courses you want to take?
25% 27% +2% 27% 27% 0%
WK Has your involvement with the NDIS helped you find a job that's right for you?
19% 20% +1% 15% 16% +1%
S/CP Has the NDIS helped you be more involved? 44% 51% +7% 58% 62% +5%
283 Results in Tables L.23 to L.27 include participants who had their first plan approved between 1 July 2016 and 31
March 2017. While this is a relatively small group of participants, the number of participants included in these tables will grow over time.

March 2019 | COAG Disability Reform Council Quarterly Report 272
Table L.26 Results for “Has the NDIS helped?” questions answered at end of participant's first and second years in the
Scheme, for SFOF version ‘Family 0 to 14’ and for SFOF versions ‘Family 15 to 24’ and ‘Family 25 and over’ combined – ACT
0 to 14 15 and over
Question Year 1 Year 2 Change Year 1 Year 2 Change
Has the NDIS improved your capacity to advocate (stand up) for your child? / Has the NDIS helped you to know your rights and advocate effectively?
59% 62% +3% 36% 47% +11%
Has the NDIS improved the level of support for your family?
70% 78% +8% 46% 55% +9%
Has the NDIS improved your access to services, programs and activities in the community? / Has the NDIS helped you to access services, programs and activities in the community?
74% 80% +6% 52% 55% +3%
Has the NDIS improved your ability/capacity to help your child develop and learn?
77% 80% +2%
Has the NDIS improved your health and wellbeing?
44% 46% +3% 46% 33% -13%

March 2019 | COAG Disability Reform Council Quarterly Report 273
Table L.27 Progress against the NDIA’s corporate plan metrics for ‘participants in work’ and ‘participants in community and
social activities’ – ACT284
Participants in work Baseline Year 2 2018–19 Target
Aged 15 to 24 years 24% 35%
26% Aged 25+ 30% 30%
Aged 15+ (average) 30% 31%
Participants in community and social activities Baseline Year 2 2018–19 Target
Aged 15 to 24 years 28% 37%
41% Aged 25+ 36% 45%
Aged 15+ (average) 35% 44%
Figure L.1 Proportion of participants describing satisfaction with the Agency planning process as good or very good by
quarter – Existing survey administered by NDIA regions (ACT)*285
*There is insufficient data to report on satisfaction in ACT for 2018-19 Q3.
Table L.28 Plan reviews conducted per quarter – excluding plans less than 30 days – ACT286
Prior Quarters
(Transition only)
2018-19 Q3 Transition
Total
Total plan reviews 13,544 1,437 14,981
Early intervention plans 4,239 438 4,677
Permanent disability plans 9,305 999 10,304
284 Results are drawn from participants’ responses to SFOF questionnaires, and only include participants who had their first plan approved between 1 July 2016 and 31 March 2017. 285 Participant satisfaction results are not shown if there is insufficient data in the group. 286 Plans less than 30 days in duration have been excluded from this tabulation, as these reviews are more likely to represent corrections to the plan rather than a new plan review to address a change in circumstance.
100%94%
100%94%
100%93% 92%
79% 81%
98%
83%
0%
10%
20%
30%
40%
50%
60%
70%
80%
90%
100%
Q3 14-15
Q4 14-15
Q1 15-16
Q2 15-16
Q3 15-16
Q4 15-16
Q1 16-17
Q2 16-17
Q3 16-17
Q4 16-17
Q1 17-18
Q2 17-18
Q3 17-18
Q4 17-18
Q1 18-19
Q2 18-19
Q3 18-19
Pro
po
rtio
n o
f P
art
icip
ants
%
Quarter

March 2019 | COAG Disability Reform Council Quarterly Report 274
Table L.29 Scheduled plan reviews conducted by quarter – excluding plans less than 30 days – ACT
Prior Quarters
(Transition only) 2018-19 Q3 Transition Total
Total scheduled plan reviews 11,369 1,260 12,629
Trial participants 8,042 799 8,841
Transition participants 3,327 461 3,788
Table L.30 Unscheduled plan reviews conducted by quarter – excluding plans less than 30 days – ACT
Prior Quarters
(Transition only) 2018-19 Q3 Transition Total
Total unscheduled plan reviews 2,175 177 2,352
Trial participants 1,526 100 1,626
Transition participants 649 77 726
Table L.31 Estimated rate of unscheduled plan reviews – excluding plans less than 30 days – ACT287
Prior Quarters
(Transition only)
2018-19 Q3 Transition
Total
% unscheduled reviews 14.1% 9.4% 13.6%
Table L.32 AAT cases by category – ACT
Prior Quarters 2018-19 Q3 Total
Category N % N % N %
Access 84 50% 11 50% 95 50%
Plan 67 40% 9 41% 76 40%
Plan Review 15 9% 1 5% 16 8%
Other 3 2% 1 5% 4 2%
Total 169 100% 22 100% 191 100%
% of all access decisions288
0.71% 0.93% 0.73%
287 This is calculated as the number of unscheduled reviews divided by the total number of participants. The number of participants used in the calculation considers the length of time the participants have been in the Scheme. 288 This is calculated as the number of appeals divided by the number of access decisions made. The number of access decisions used in the calculation considers the length of time since the access decisions have been made.

March 2019 | COAG Disability Reform Council Quarterly Report 275
Table L.33 AAT cases by open/closed and decision – ACT
N
AAT Cases 191
Open AAT Cases 44
Closed AAT Cases 147
Resolved before hearing 144
Gone to hearing and received a substantive decision
3*
*Of the 3 cases which went to hearing and received a substantive decision: 3 affirmed the Agency’s decision.
Table L.34 Distribution of active participants by method of Financial Plan Management and quarter of plan approval – ACT
Prior Quarters
(Transition only) 2018-19 Q3 Total
Self-managed fully 31% 32% 31%
Self-managed partly 9% 11% 10%
Plan managed 31% 35% 32%
Agency managed 28% 23% 27%
Total 100% 100% 100%
Table L.35 Distribution of active participants by support coordination and quarter of plan approval – ACT
Prior Quarters
(Transition only) 2018-19 Q3 Total
Support coordination 32% 36% 33%
Table L.36 Duration to plan activation by quarter of initial plan approval for active participants – ACT289,290
Prior Quarters
(Transition Only) 2018-19 Q1
Plan activation N % N %
Less than 30 days 1,433 58% 181 57%
30 to 59 days 340 14% 50 16%
60 to 89 days 150 6% 18 6%
Activated within 90 days
1,923 78% 249 79%
90 to 119 days 91 4% 12 4%
120 days and over 339 14% 18 6%
Activated between 90 and 180 days
430 17% 30 9%
No payments 127 5% 38 12%
Total plans approved 2,480 100% 317 100%
289 Note: Plans approved after the end of 2018-19 Q1 have been excluded from the table. They are relatively new and it is too early to examine their durations to activation. 290 There has been a change in methodology used to calculate these results since the previous quarter. Duration to plan
activation is now calculated as the time from a participant’s initial plan approval to when the participant first uses plan supports (previously only the initial plan for each participant was considered). In-kind supports are now also included (previously excluded). As a result, a higher proportion of participants are identified as activating their plans within 90 days, and a lower proportion have no payments.

March 2019 | COAG Disability Reform Council Quarterly Report 276
Table L.37 Proportion of active participants with plan activated within 12 months – ACT
Number of participants
activated within 12 months
All participants with duration of
at least 12 months
Proportion activated
by Aboriginal and Torres Strait Islander status
Aboriginal and Torres Strait Islander 217 244 89%
Not Aboriginal and Torres Strait Islander 4,980 5,328 93%
Not Stated 187 207 90%
Total 5,384 5,779 93%
by Culturally and Linguistically Diverse status
CALD 546 576 95%
Not CALD 4,719 5,080 93%
Not Stated 119 123 97%
Total 5,384 5,779 93%
by Remoteness
Major Cities 5,176 5,551 93%
Regional 197 217 91%
Remote 1 1 100%
Missing 10 10 100%
Total 5,384 5,779 93%
by Primary Disability type
Autism 1,394 1,517 92% Intellectual Disability (including Down Syndrome) 1,213 1,290 94%
Psychosocial Disability 720 765 94% Developmental Delay (including Global Developmental Delay) 323 340 95%
Other 1,734 1,867 93%
Total 5,384 5,779 93%
Table L.38 Distribution of plans by plan utilisation and quarter of plan approval for 2016-17, 2017-18 and quarter 1 of 2018-19–
ACT291,292
Plan utilisation Prior Quarters
(Transition only) 2018-19 Q1 Total
0% to 50% 41% 66% 42%
50% to 75% 21% 18% 21%
> 75% 38% 16% 38%
Total 100% 100% 100%
Table L.39 Proportion of active participants with approved plans accessing mainstream supports – ACT
Prior Quarters 2018-19 Q3 Total
Daily Activities 6% 8% 7%
Health & Wellbeing 46% 49% 47%
Lifelong Learning 19% 18% 19%
Other 15% 15% 15%
Non-categorised 25% 26% 25%
Any mainstream service 88% 90% 89%
291 Plans less than 30 days in duration have been excluded from this tabulation, as these plans are more likely to represent corrections to the plan rather than an unscheduled plan review to address a change in circumstance. 292 This table only considers committed supports and payments for supports provided to 31 December 2018. This gives some allowance for the timing delay between when the support is provided and when it is paid.

March 2019 | COAG Disability Reform Council Quarterly Report 277
Part Three: Providers and the growing market
Table L.40 Key provider indicators by quarter – ACT293
Prior Quarters 2018-19 Q3 Total
Provider indicators
a) Registrations by profile
Individual/ sole trader 367 20 387
Company/ organisation 1,133 72 1,202
Total 1,500 92 1,589
b) Registration revoked 3
293 The total number of providers as at 31 March 2019 (1,589) is not the sum of the number of providers as at 31
December 2018 (1,500) and the providers registered in the third quarter of 2018-19 (92). This is due to 3 providers whose registration ended during the third quarter of 2018-19.

March 2019 | COAG Disability Reform Council Quarterly Report 278
Table L.41 Number of approved providers by registration group - ACT294
Registration Group Prior
Quarters 2018-19
Q3 Total % Change
Assistance services
Accommodation / Tenancy Assistance 52 7 59 13%
Assistance Animals 4 0 4 0%
Assistance with daily life tasks in a group or shared living arrangement
74 9 83 12%
Assistance with travel/transport arrangements 232 21 253 9%
Daily Personal Activities 95 9 104 9%
Group and Centre Based Activities 75 5 80 7%
High Intensity Daily Personal Activities 80 7 87 9%
Household tasks 307 26 333 8%
Interpreting and translation 72 5 77 7%
Participation in community, social and civic activities 111 10 121 9%
Assistive Technology
Assistive equipment for recreation 250 24 274 10%
Assistive products for household tasks 220 18 238 8%
Assistance products for personal care and safety 457 41 498 9%
Communication and information equipment 183 14 197 8%
Customised Prosthetics 105 12 117 11%
Hearing Equipment 69 2 71 3%
Hearing Services 9 0 9 0%
Personal Mobility Equipment 328 28 356 9%
Specialised Hearing Services 15 -1 14 -7%
Vision Equipment 71 9 80 13%
Capacity Building Services
Assistance in coordinating or managing life stages, transitions and supports
111 11 122 10%
Behaviour Support 84 4 88 5%
Community nursing care for high needs 118 12 130 10%
Development of daily living and life skills 108 9 117 8%
Early Intervention supports for early childhood 132 9 141 7%
Exercise Physiology and Physical Wellbeing activities
151 13 164 9%
Innovative Community Participation 187 28 215 15%
Specialised Driving Training 57 8 65 14%
Therapeutic Supports 297 13 310 4%
Capital services
Home modification design and construction 181 16 197 9%
Specialised Disability Accommodation 77 13 90 17%
Vehicle Modifications 51 9 60 18%
Choice and control support services
Management of funding for supports in participants plan
48 6 54 13%
Support Coordination 72 8 80 11%
Employment and Education support services
Assistance to access and/or maintain employment and/or education
57 5 62 9%
Specialised Supported Employment 19 1 20 5%
Total approved providers 1,497 92 1,589 6%
294 The 3 providers whose registration ended during the third quarter of 2018-19 are not included in the 2018-19 Q2 and prior numbers in this table.

March 2019 | COAG Disability Reform Council Quarterly Report 279
Table L.42 Key markets indicators by quarter – ACT
Market indicators Prior Quarters 2018-19 Q3
a) Average number of providers per participant 1.08 1.05
b) Number of providers delivering new supports 122 122
c) Change in the number of active/inactive providers:
Active (%) 23% 23%
Not yet active (%) 66% 67%
Inactive (%) 11% 11%
d) Share of payments - top 25%
Daily Tasks/Shared Living (%) 81% 81%
Therapeutic Supports (%) 91% 92%
Participate Community (%) 88% 90%
Early Childhood Supports (%) 85% 80%
Assist Personal Activities (%) 86% 92%

March 2019 | COAG Disability Reform Council Quarterly Report 280
Table L.43 Cumulative number of providers that have been active by registration group – ACT
Registration Group Prior
Quarters 2018-19
Q3 Total % Change
Assistance services
Accommodation / Tenancy Assistance 7 0 7 0%
Assistance Animals 1 0 1 0%
Assistance with daily life tasks in a group or shared living arrangement
42 1 43 2%
Assistance with travel/transport arrangements 43 2 45 5%
Daily Personal Activities 70 3 73 4%
Group and Centre Based Activities 39 0 39 0%
High Intensity Daily Personal Activities 50 0 50 0%
Household tasks 109 6 115 6%
Interpreting and translation 7 0 7 0%
Participation in community, social and civic activities 76 2 78 3%
Assistive Technology
Assistive equipment for recreation 13 1 14 8%
Assistive products for household tasks 9 1 10 11%
Assistance products for personal care and safety 93 7 100 8%
Communication and information equipment 19 0 19 0%
Customised Prosthetics 32 2 34 6%
Hearing Equipment 16 0 16 0%
Hearing Services 5 0 5 0%
Personal Mobility Equipment 49 3 52 6%
Specialised Hearing Services 5 0 5 0%
Vision Equipment 9 0 9 0%
Capacity Building Services
Assistance in coordinating or managing life stages, transitions and supports
81 2 83 2%
Behaviour Support 39 1 40 3%
Community nursing care for high needs 7 0 7 0%
Development of daily living and life skills 62 6 68 10%
Early Intervention supports for early childhood 65 6 71 9%
Exercise Physiology and Physical Wellbeing activities
40 1 41 3%
Innovative Community Participation 14 1 15 7%
Specialised Driving Training 3 1 4 33%
Therapeutic Supports 199 11 210 6%
Capital services
Home modification design and construction 16 2 18 13%
Specialised Disability Accommodation 0 1 1 -
Vehicle Modifications 6 0 6 0%
Choice and control support services
Management of funding for supports in participants plan
33 0 33 0%
Support Coordination 22 2 24 9%
Employment and Education support services
Assistance to access and/or maintain employment and/or education
23 2 25 9%
Specialised Supported Employment 7 0 7 0%
Total approved active providers 503 29 532 6%

March 2019 | COAG Disability Reform Council Quarterly Report 281
Table L.44 Number of approved and active providers in each registration group by legal entity type as at 31 March 2019 – ACT
Registration Group
Approved Active
Individual/ sole trader
Company/ organisation
Total Approved
Individual/ sole trader
Company/ organisation
Total Active
Assistance services
Accommodation / Tenancy Assistance
3 56 59 1 6 7
Assistance Animals 0 4 4 0 1 1
Assistance with daily life tasks in a group or shared living arrangement
5 78 83 3 40 43
Assistance with travel/transport arrangements
42 211 253 2 43 45
Daily Personal Activities 9 95 104 6 67 73
Group and Centre Based Activities
6 74 80 2 37 39
High Intensity Daily Personal Activities
4 83 87 3 47 50
Household tasks 72 261 333 24 91 115
Interpreting and translation 15 62 77 0 7 7
Participation in community, social and civic activities
12 109 121 11 67 78
Assistive Technology Assistive equipment for recreation
49 225 274 3 11 14
Assistive products for household tasks
35 203 238 1 9 10
Assistance products for personal care and safety
55 443 498 7 93 100
Communication and information equipment
37 160 197 1 18 19
Customised Prosthetics 18 99 117 4 30 34
Hearing Equipment 10 61 71 1 15 16
Hearing Services 0 9 9 0 5 5
Personal Mobility Equipment 51 305 356 10 42 52
Specialised Hearing Services
2 12 14 0 5 5
Vision Equipment 13 67 80 1 8 9
Capacity Building Services Assistance in coordinating or managing life stages, transitions and supports
17 105 122 15 68 83
Behaviour Support 29 59 88 12 28 40
Community nursing care for high needs
16 114 130 0 7 7
Development of daily living and life skills
9 108 117 5 63 68
Early Intervention supports for early childhood
69 72 141 31 40 71
Exercise Physiology and Physical Wellbeing activities
40 124 164 11 30 41
Innovative Community Participation
60 155 215 7 8 15
Specialised Driving Training 3 62 65 0 4 4
Therapeutic Supports 135 175 310 87 123 210
Capital services Home modification design and construction
35 162 197 3 15 18
Specialised Disability Accommodation
7 83 90 0 1 1
Vehicle Modifications 6 54 60 0 6 6
Choice and control support services
Management of funding for supports in participants plan
4 50 54 3 30 33
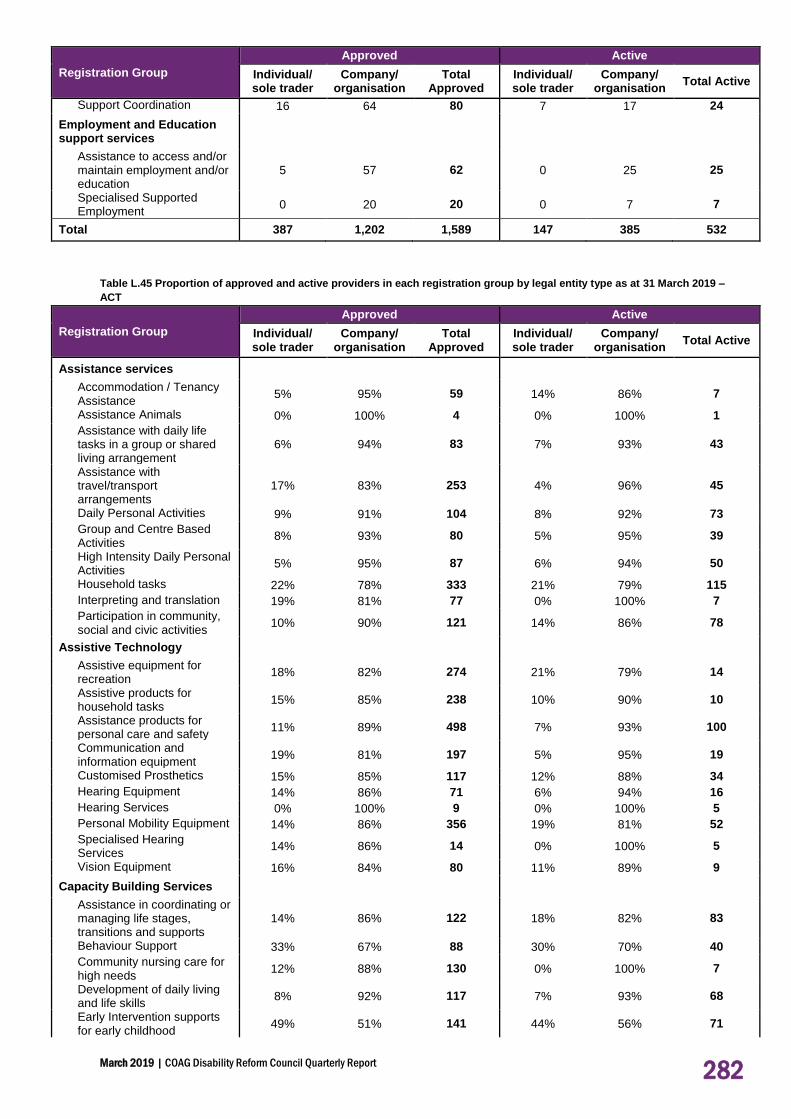
March 2019 | COAG Disability Reform Council Quarterly Report 282
Registration Group
Approved Active
Individual/ sole trader
Company/ organisation
Total Approved
Individual/ sole trader
Company/ organisation
Total Active
Support Coordination 16 64 80 7 17 24
Employment and Education support services
Assistance to access and/or maintain employment and/or education
5 57 62 0 25 25
Specialised Supported Employment
0 20 20 0 7 7
Total 387 1,202 1,589 147 385 532
Table L.45 Proportion of approved and active providers in each registration group by legal entity type as at 31 March 2019 –
ACT
Registration Group
Approved Active
Individual/ sole trader
Company/ organisation
Total Approved
Individual/ sole trader
Company/ organisation
Total Active
Assistance services
Accommodation / Tenancy Assistance
5% 95% 59 14% 86% 7
Assistance Animals 0% 100% 4 0% 100% 1
Assistance with daily life tasks in a group or shared living arrangement
6% 94% 83 7% 93% 43
Assistance with travel/transport arrangements
17% 83% 253 4% 96% 45
Daily Personal Activities 9% 91% 104 8% 92% 73
Group and Centre Based Activities
8% 93% 80 5% 95% 39
High Intensity Daily Personal Activities
5% 95% 87 6% 94% 50
Household tasks 22% 78% 333 21% 79% 115
Interpreting and translation 19% 81% 77 0% 100% 7
Participation in community, social and civic activities
10% 90% 121 14% 86% 78
Assistive Technology Assistive equipment for recreation
18% 82% 274 21% 79% 14
Assistive products for household tasks
15% 85% 238 10% 90% 10
Assistance products for personal care and safety
11% 89% 498 7% 93% 100
Communication and information equipment
19% 81% 197 5% 95% 19
Customised Prosthetics 15% 85% 117 12% 88% 34
Hearing Equipment 14% 86% 71 6% 94% 16
Hearing Services 0% 100% 9 0% 100% 5
Personal Mobility Equipment 14% 86% 356 19% 81% 52
Specialised Hearing Services
14% 86% 14 0% 100% 5
Vision Equipment 16% 84% 80 11% 89% 9
Capacity Building Services Assistance in coordinating or managing life stages, transitions and supports
14% 86% 122 18% 82% 83
Behaviour Support 33% 67% 88 30% 70% 40
Community nursing care for high needs
12% 88% 130 0% 100% 7
Development of daily living and life skills
8% 92% 117 7% 93% 68
Early Intervention supports for early childhood
49% 51% 141 44% 56% 71

March 2019 | COAG Disability Reform Council Quarterly Report 283
Registration Group
Approved Active
Individual/ sole trader
Company/ organisation
Total Approved
Individual/ sole trader
Company/ organisation
Total Active
Exercise Physiology and Physical Wellbeing activities
24% 76% 164 27% 73% 41
Innovative Community Participation
28% 72% 215 47% 53% 15
Specialised Driving Training 5% 95% 65 0% 100% 4
Therapeutic Supports 44% 56% 310 41% 59% 210
Capital services Home modification design and construction
18% 82% 197 17% 83% 18
Specialised Disability Accommodation
8% 92% 90 0% 100% 1
Vehicle Modifications 10% 90% 60 0% 100% 6
Choice and control support services
Management of funding for supports in participants plan
7% 93% 54 9% 91% 33
Support Coordination 20% 80% 80 29% 71% 24
Employment and Education support services
Assistance to access and/or maintain employment and/or education
8% 92% 62 0% 100% 25
Specialised Supported Employment
0% 100% 20 0% 100% 7
Total 24% 76% 1,589 28% 72% 532
Part Five: Financial sustainability
Table L.46 Committed supports by financial year ($m) – ACT
2013-14 2014-15 2015-16 2016-17 2017-18 2018-19 Q1,
Q2, Q3295 Total
Total Committed
26.6 138.6 282.2 320.5 280.1 1,048.0
295 Note: the $280 million in respect of 2018-19 Q1, Q2 and Q3 only includes committed supports expected to be used to 31 March 2019.

March 2019 | COAG Disability Reform Council Quarterly Report 284
Figure L.2 Distribution of participants by annualised committed support band (including participants with Supported
Independent Living supports) – active participants with initial plan approvals as at 2018-19 Q3 compared with active
participants with initial plan approvals as at 2018-19 Q2 (ACT)
Figure L.3 Distribution of participants by annualised committed support band (excluding participants with Supported
Independent Living supports) – active participants with initial plan approvals as at 2018-19 Q3 compared with active
participants with initial plan approvals as at 2018-19 Q2 (ACT)
0.00%
2.00%
4.00%
6.00%
8.00%
10.00%
12.00%
14.00%
16.00%
18.00%
Dis
trib
uti
on
o
f p
art
icip
an
ts
Average annualised committed supports band
As at Q2 2018-19 distribution of participants As at Q3 2018-19 distribution of participants
0.00%
2.00%
4.00%
6.00%
8.00%
10.00%
12.00%
14.00%
16.00%
18.00%
Dis
trib
uti
on
o
f p
art
icip
an
ts
Average annualised committed supports band
As at Q2 2018-19 distribution of participants As at Q3 2018-19 distribution of participants

March 2019 | COAG Disability Reform Council Quarterly Report 285
Figure L.4 Average committed support by age group (including participants with Supported Independent Living supports) –
active participants with initial plan approvals as at 2018-19 Q3 compared with active participants with initial plan approvals as
at 2018-19 Q2 (ACT) 296
296 The average revenue amounts have been removed from the figure in this report as the amounts refer to revenue received under the bilateral agreements, and are not linked to age group, primary disability group, and level of function. Therefore, it is not appropriate to make comparisons between revenue and plan budgets in this chart. The amount of revenue received in aggregate should be compared with the amount spent in aggregate – the NDIA has been within budget in all years of operation (including 2018-19).
$0
$20,000
$40,000
$60,000
$80,000
$100,000
$120,000
0 to 6 7 to 14 15 to 18 19 to 24 25 to 34 35 to 44 45 to 54 55 to 64 65+
Av
era
ge
an
nu
ali
se
d c
om
mit
ted
su
pp
ort
s
Age group
As at Q3 2018-19 actual average annualised committed supports
As at Q2 2018-19 actual average annualised committed supports

March 2019 | COAG Disability Reform Council Quarterly Report 286
Figure L.5 Average committed support by primary disability group (including participants with Supported Independent Living
supports) – active participants with initial plan approvals as at 2018-19 Q3 compared with active participants with initial plan
approvals as at 2018-19 Q2 (ACT) 297
297 Ibid.
$0 $20,000 $40,000 $60,000 $80,000 $100,000 $120,000 $140,000
Acquired Brain Injury
Autism
Cerebral Palsy
Developmental Delay
Global Developmental Delay
Hearing Impairment
Intellectual Disability
Multiple Sclerosis
Psychosocial disability
Spinal Cord Injury
Stroke
Visual Impairment
Other Neurological
Other Physical
Other Sensory/Speech
Other
Average annualised committed supports
Pri
ma
ry d
isa
bil
ity
As at Q2 2018-19 actual average annualised committed supports
As at Q3 2018-19 actual average annualised committed supports

March 2019 | COAG Disability Reform Council Quarterly Report 287
Figure L.6 Average committed support by level of function (including participants with Supported Independent Living
supports) – active participants with initial plan approvals as at 2018-19 Q3 compared with active participants with initial plan
approvals as at 2018-19 Q2 (ACT) 298,299,300
Table L.47 Payments by financial year, compared to committed supports ($m) – ACT
2013-14 2014-15 2015-16 2016-17 2017-18 2018-19
Q1, Q2, Q3 Total
Total Committed - 26.6 138.6 282.2 320.5 280.1 1,048.0
Total Paid - 21.3 116.3 192.4 230.6 188.9 749.6
% utilised to date - 80% 84% 68% 72% 67% 71%301
298 Ibid. 299 An ICT issue has been identified and as a result, reporting by level of function is not accurate. This issue is currently
under investigation and will be reconciled for reporting as at 30 June 2019. 300 Average annualised committed supports are not shown where there is insufficient data in the group. Level of function
15 does not have sufficient data to show an average cost. 301 Note: Only committed supports expected to be used to 31 March 2019 have been used to calculate the utilisation from 1 July 2013 to date, and this will increase as there is a lag between when support is provided and when it is paid.
$0
$50,000
$100,000
$150,000
$200,000
$250,000
1 2 3 4 5 6 7 8 9 10 11 12 13 14 15
Av
era
ge
an
nu
ali
se
d c
os
t
Level of function
As at Q3 2018-19 actual average annualised committed supports
As at Q2 2018-19 actual average annualised committed supports

March 2019 | COAG Disability Reform Council Quarterly Report 288
Figure L.7 Utilisation of committed supports as at 30 December 2018 and 31 March 2019 (ACT)
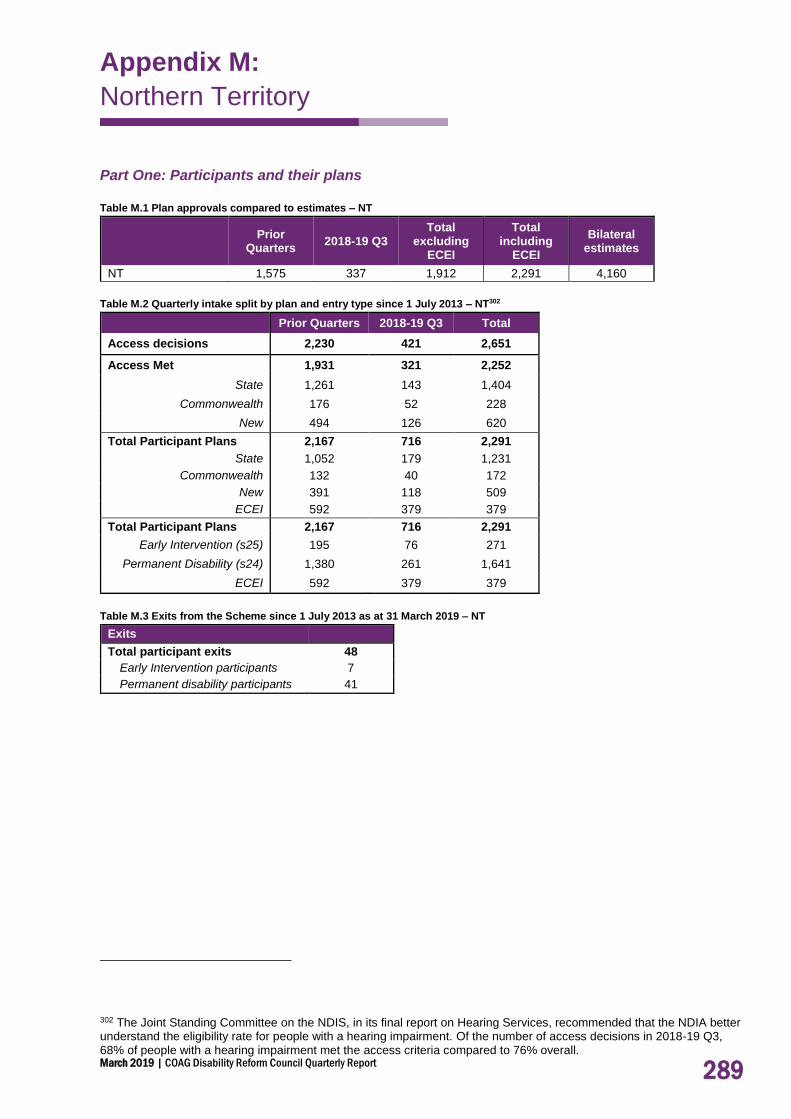
March 2019 | COAG Disability Reform Council Quarterly Report 289
Appendix M: Appendix M:
Northern Territory
Part One: Participants and their plans
Table M.1 Plan approvals compared to estimates – NT
Prior
Quarters 2018-19 Q3
Total excluding
ECEI
Total including
ECEI
Bilateral estimates
NT 1,575 337 1,912 2,291 4,160
Table M.2 Quarterly intake split by plan and entry type since 1 July 2013 – NT302
Prior Quarters 2018-19 Q3 Total
Access decisions 2,230 421 2,651
Access Met 1,931 321 2,252
State 1,261 143 1,404
Commonwealth 176 52 228
New 494 126 620
Total Participant Plans 2,167 716 2,291
State 1,052 179 1,231
Commonwealth 132 40 172
New 391 118 509
ECEI 592 379 379
Total Participant Plans 2,167 716 2,291
Early Intervention (s25) 195 76 271
Permanent Disability (s24) 1,380 261 1,641
ECEI 592 379 379
Table M.3 Exits from the Scheme since 1 July 2013 as at 31 March 2019 – NT
Exits
Total participant exits 48
Early Intervention participants 7
Permanent disability participants 41
302 The Joint Standing Committee on the NDIS, in its final report on Hearing Services, recommended that the NDIA better understand the eligibility rate for people with a hearing impairment. Of the number of access decisions in 2018-19 Q3, 68% of people with a hearing impairment met the access criteria compared to 76% overall.

March 2019 | COAG Disability Reform Council Quarterly Report 290
Table M.4 Cumulative position by services previously received – NT303
Participant cohort Bilateral estimate
% of estimate
State Commonwealth New ECEI Total
Trial 78 3 74 155 149 104%
End of 2016-17 265 6 117 0 388 546 71%
End of 2017-18 563 42 238 0 843 1,623 52%
End of 2018-19 Q1 726 62 272 506 1,566 2,504 63%
End of 2018-19 Q2 1,052 132 391 592 2,167 3,386 64%
End of 2018-19 Q3 1,231 172 509 379 2,291 4,160 55%
Table M.5 Cumulative position by entry into the Scheme – NT
Participant cohort Bilateral estimate
% of estimate
Early
Intervention Permanent Disability
ECEI Total
Trial 37 118 155 149 104%
End of 2016-17 68 320 0 388 546 71%
End of 2017-18 120 723 0 843 1,623 52%
End of 2018-19 Q1 129 931 506 1,566 2,504 63%
End of 2018-19 Q2 195 1,380 592 2,167 3,386 64%
End of 2018-19 Q3 271 1,641 379 2,291 4,160 55%
Note: in the below tables the percentage figures have been rounded. Therefore, the totals may not
always add up to one hundred per cent.
Table M.6 Participant profile per quarter by Aboriginal and Torres Strait islander status – NT
Prior Quarters 2018-19 Q3 Total
Participant profile N % N % N %
Aboriginal and Torres Strait Islander 841 55.1% 148 43.9% 989 53.1%
Not Aboriginal and Torres Strait Islander 652 42.7% 179 53.1% 831 44.6%
Not Stated 34 2.2% 10 3.0% 44 2.4%
Total 1,527 100% 337 100% 1,864 100%
Table M.7 Participant profile per quarter by culturally and linguistically diverse (CALD) status – NT
Prior Quarters 2018-19 Q3 Total
Participant profile N % N % N %
CALD 447 29.3% 75 22.3% 522 28.0%
Not CALD 1,079 70.7% 262 77.7% 1,341 71.9%
Not Stated 1 0.1% 0 0.0% 1 0.1%
Total 1,527 100% 337 100% 1,864 100%
Table M.8 Participant profile per quarter by Young people in Residential aged care (YPIRAC) status – NT
Prior Quarters 2018-19 Q3 Total
Participant profile N % N % N %
YPIRAC 23 1.5% 8 2.4% 31 1.7%
Not YPIRAC 1,504 98.5% 329 97.6% 1,833 98.3%
Total 1,527 100% 337 100% 1,864 100%
303 Updated lists of clients are provided by State/Territory and Commonwealth governments each quarter. This results in some participants being retrospectively reclassified as State, Commonwealth or New.

March 2019 | COAG Disability Reform Council Quarterly Report 291
Table M.9 Participant profile per quarter by remoteness – NT304,305
Table M.10 Participant profile per quarter by disability group - NT306,307
Prior Quarters 2018-19 Q3 Total
Disability N % N % N %
Autism 276 18% 92 27% 368 20%
Intellectual Disability308 417 27% 71 21% 488 26%
Psychosocial disability 93 6% 23 7% 116 6%
Cerebral Palsy 142 9% 19 6% 161 9%
Other Neurological 104 7% 13 4% 117 6%
Developmental Delay 28 2% 40 12% 68 4%
Other Physical 93 6% 9 3% 102 5%
Hearing Impairment 66 4% 15 4% 81 4%
ABI 138 9% 12 4% 150 8%
Visual Impairment 28 2% 9 3% 37 2%
Multiple Sclerosis 12 1% 0 0% 12 1%
Global Developmental Delay 18 1% 13 4% 31 2%
Stroke 48 3% 11 3% 59 3%
Spinal Cord Injury 47 3% 6 2% 53 3%
Other Sensory/Speech 13 1% 4 1% 17 1%
Other 4 0% 0 0% 4 0%
Total 1,527 100% 337 100% 1,864 100%
304 This table is based on the Modified Monash Model measure of remoteness. 305 The distributions are calculated excluding active participants with a missing remoteness classification. 306 Table order based on national proportions (highest to lowest) 307 Note: Since 2017-18 Q1, the disability groups Developmental Delay and Global Developmental Delay have been reported separately to the Intellectual Disability group. 308 Down Syndrome is included in Intellectual Disability, representing 5% of all Scheme participants in NT (86).
Prior Quarters 2018-19 Q3 Total
Participant profile N % N % N %
Major Cities 19 1.3% 2 0.6% 21 1.1%
Population > 50,000 687 45.2% 224 66.9% 911 49.1%
Population between 15,000 and 50,000
4 0.3% 0 0.0% 4 0.2%
Population between 5,000 and 15,000
1 0.1% 0 0.0% 1 0.1%
Population less than 5,000 16 1.1% 10 3.0% 26 1.4%
Remote 317 20.9% 54 16.1% 371 20.0%
Very Remote 476 31.3% 45 13.4% 521 28.1%
Missing 7 2 9
Total 1,527 100% 337 100% 1,864 100%

March 2019 | COAG Disability Reform Council Quarterly Report 292
Table M.11 Participant profile per quarter by level of function – NT309
Prior Quarters 2018-19 Q3 Total
Level of Function N % N % N %
1 (High Function) 91 6% 23 7% 114 6%
2 (High Function) 0 0% 0 0% 0 0%
3 (High Function) 83 5% 22 7% 105 6%
4 (High Function) 62 4% 19 6% 81 4%
5 (High Function) 107 7% 20 6% 127 7%
6 (Moderate Function) 201 13% 58 17% 259 14%
7 (Moderate Function) 89 6% 23 7% 112 6%
8 (Moderate Function) 109 7% 14 4% 123 7%
9 (Moderate Function) 8 1% 0 0% 8 0%
10 (Moderate Function) 220 14% 31 9% 251 13%
11 (Low Function) 55 4% 11 3% 66 4%
12 (Low Function) 297 19% 24 7% 321 17%
13 (Low Function) 107 7% 80 24% 187 10%
14 (Low Function) 95 6% 12 4% 107 6%
15 (Low Function) 2 0% 0 0% 2 0%
Missing 1 0 1
Total 1,527 100% 337 100% 1,864 100%
Table M.12 Participant profile per quarter by Age group – NT
Prior Quarters 2018-19 Q3 Total
Age Group N % N % N %
0 to 6 135 9% 123 36% 258 14%
7 to 14 317 21% 81 24% 398 21%
15 to 18 116 8% 21 6% 137 7%
19 to 24 136 9% 15 4% 151 8%
25 to 34 202 13% 19 6% 221 12%
35 to 44 194 13% 30 9% 224 12%
45 to 54 231 15% 17 5% 248 13%
55 to 64 176 12% 28 8% 204 11%
65+ 20 1% 3 1% 23 1%
Total 1,527 100% 337 100% 1,864 100%
Table M.13 Participant profile per quarter by Gender – NT
Prior Quarters 2018-19 Q3 Total
Gender N % N % N %
Male 956 63% 231 69% 1,187 64%
Female 564 37% 103 31% 667 36%
Indeterminate 7 0% 3 1% 10 1%
Total 1,527 100% 337 100% 1,864 100%
309 An ICT issue has been identified and as a result, reporting by level of function is not accurate. This issue is currently under investigation and will be reconciled for reporting as at 30 June 2019.

March 2019 | COAG Disability Reform Council Quarterly Report 293
Part Two: Participant experience and outcomes
Table M.14 Number of questionnaires completed by SFOF version – NT310
Version
Number of questionnaires
collected 2016-17
Number of questionnaires
collected 2017-18
Number of questionnaires collected YTD
2018-19
Number of questionnaires
Participant 0 to school 17 38 119 174
Participant school to 14 27 75 373 475
Participant 15 to 24 24 68 162 254
Participant 25 and over 154 251 410 815
Total Participant 222 432 1,064 1,718
Family 0 to 14 41 100 474 615
Family 15 to 24 3 35 117 155
Family 25 and over 16 55 204 275
Total Family 60 190 795 1,045
Total 282 622 1,859 2,763
Table M.15 Selected key indicators for participants – Daily Living (DL) and Choice and Control (CC) – NT
Indicator 0 to before
school School to 14
15 to 24 25 and over
DL
% with concerns in 6 or more of the areas: gross motor skills, fine motor skills, self-care, eating, social interaction, communication, cognitive development, sensory processing
67%
CC % who say their child is able to tell them what he/she wants
60%
DL % developing functional, learning and coping skills appropriate to their ability and circumstances
26%
DL % who say their child is becoming more independent
31%
CC % of children who have a genuine say in decisions about themselves
66%
CC % who are happy with the level of independence/control they have now
26%
CC % who choose who supports them 25% 38%
CC % who choose what they do each day 32% 48%
CC % who had been given the opportunity to participate in a self-advocacy group meeting
18% 18%
CC % who want more choice and control in their life
86% 83%
310 Baseline outcomes for participants and/or their families and carers were collected for 99% of participants.

March 2019 | COAG Disability Reform Council Quarterly Report 294
Table M.16 Selected key indicators for participants – Relationships (REL) and Social/Community Participation (S/CP) – NT
Indicator 0 to before
school School to
14 15 to 24
25 and over
REL % of children who can make friends with people outside the family
53% 63%
S/CP % of children who participate in age appropriate community, cultural or religious activities
66%
REL % of children who spend time after school and on weekends with friends and/or in mainstream programs
33%
REL Of these, % who are welcomed or actively included
60% 76%
REL % of children who spend time with friends without an adult present
17%
REL % with no friends other than family or paid staff
28% 30%
S/CP % who have been actively involved in a community, cultural or religious group in the last 12 months
45% 43%
Table M.17 Selected key indicators for participants – Lifelong Learning (LL), Work (WK), Home (HM) and Health and Wellbeing
(HW) – NT
Indicator 0 to before
school School to
14 15 to 24
25 and over
LL % of children attending school in a mainstream class
45%
HM % who are happy with their home 77% 61%
HM % who feel safe or very safe in their home
82% 65%
HW % who rate their health as good, very good or excellent
71% 42%
HW % who did not have any difficulties accessing health services
65% 49%
LL % who currently attend or previously attended school in a mainstream class
20%
LL % who participate in education, training or skill development
5%
LL Of those who participate, % who do so in mainstream settings
65%
LL % unable to do a course or training they wanted to do in the last 12 months
29%
WK % who have a paid job 13% 17%
WK % who volunteer 12% 9%

March 2019 | COAG Disability Reform Council Quarterly Report 295
Table M.18 Selected key indicators for families/carers of participants – NT
Indicator 0 to 14 15 to 24 25 and over
% receiving Carer Payment 13% 18% 16%
% receiving Carer Allowance 35% 23% 20%
% working in a paid job 46% 58% 41%
Of those in a paid job, % in permanent employment
82% 82% 82%
Of those in a paid job, % working 15 hours or more
89% 96% 85%
% who say they (and their partner) are able to work as much as they want
51% 58% 50%
Of those unable to work as much as they want, % who say the situation of their child/family member with disability is a barrier to working more
86% 93% 77%
Of those unable to work as much as they want, % who say insufficient flexibility of jobs is a barrier to working more
34% 42% 35%
% able to advocate for their child/family member
63% 64% 47%
% who have friends and family they see as often as they like
48% 47% 50%
% who feel very confident or somewhat confident in supporting their child's development
81%
% who know what their family can do to enable their family member with disability to become as independent as possible
36%
% who feel in control selecting services 38% 26%
% who have made plans (or begun to make plans) for when they are no longer able to care for their family member with disability
27%
% who rate their health as good, very good or excellent
89% 81% 66%
Table M.19 Results for “Has the NDIS helped?” questions answered at review, for SFOF version ‘Participant 0 to school’ (n=17)
– NT311
Question % Yes
DL Has the NDIS improved your child's development? Numbers are
too small
DL Has the NDIS improved your child's access to specialist services? Numbers are
too small
CC Has the NDIS helped increase your child's ability to communicate what they want?
Numbers are too small
REL Has the NDIS improved how your child fits into family life? Numbers are
too small
S/CP Has the NDIS improved how your child fits into community life? Numbers are
too small
311 Results in Tables M.19 to M.22 exclude participants who had their first plan approved between 1 July 2016 and 31
March 2017.

March 2019 | COAG Disability Reform Council Quarterly Report 296
Table M.20 Results for “Has the NDIS helped?” questions answered at review, for SFOF version ‘Participant school to 14'
(n=53) – NT
Question % Yes
DL Has the NDIS helped your child to become more independent? 32%
LL Has the NDIS improved your child's access to education? 20%
REL Has the NDIS improved your child's relationships with family and friends?
27%
S/CP Has the NDIS improved your child's social and recreational life? 20%
Table M.21 Results for “Has the NDIS helped?” questions answered at review, for SFOF versions ‘Participant 15 to 24' (n=45)
and 'Participant 25 and over' (n=189) – NT
Question 15 to 24 % Yes
25+ % Yes
CC Has the NDIS helped you have more choices and more control over your life?
45% 46%
DL Has the NDIS helped you with daily living activities? 48% 55%
REL Has the NDIS helped you to meet more people? 38% 37%
HM Has your involvement with the NDIS helped you to choose a home that's right for you?
32% 30%
HW Has your involvement with the NDIS improved your health and wellbeing?
37% 42%
LL Has your involvement with the NDIS helped you to learn things you want to learn or to take courses you want to take?
18% 18%
WK Has your involvement with the NDIS helped you find a job that's right for you?
16% 6%
S/CP Has the NDIS helped you be more involved? 36% 41%
Table M.22 Results for “Has the NDIS helped?” questions answered at review, for SFOF version ‘Family 0 to 14’ (n=60); and for
SFOF versions ‘Family 15 to 24’ and ‘Family 25 and over’ combined (n=36) – NT
Question 0 to 14 % Yes
15+ % Yes
Has the NDIS improved your capacity to advocate (stand up) for your child? / Has the NDIS helped you to know your rights and advocate effectively?
43% 33%
Has the NDIS improved the level of support for your family? 41% 36%
Has the NDIS improved your access to services, programs and activities in the community? / Has the NDIS helped you to access services, programs and activities in the community?
44% 35%
Has the NDIS improved your ability/capacity to help your child develop and learn?
48%
Has the NDIS improved your health and wellbeing? 33% 27%
There is insufficient data to show results for “Has the NDIS helped?” questions answered at end of
participant’s first and year years in the Scheme, or progress against the NDIA’s corporate plan
metrics for ‘participants in work’ and ‘participants in community and social activities’.

March 2019 | COAG Disability Reform Council Quarterly Report 297
There is insufficient data to present information on participant satisfaction in NT.
Table M.23 Plan reviews conducted per quarter – excluding plans less than 30 days – NT312
Prior Quarters
(Transition only)
2018-19 Q3 Transition
Total
Total plan reviews 1,678 365 2,043
Early intervention plans 190 42 232
Permanent disability plans 1,488 323 1,811
Table M.24 Scheduled plan reviews conducted by quarter – excluding plans less than 30 days – NT
Prior Quarters
(Transition only) 2018-19 Q3 Transition Total
Total scheduled plan reviews 881 178 1,059
Trial participants 342 27 369
Transition participants 539 151 690
Table M.25 Unscheduled plan reviews conducted by quarter – excluding plans less than 30 days – NT
Prior Quarters
(Transition only) 2018-19 Q3 Transition Total
Total unscheduled plan reviews 797 187 984
Trial participants 95 4 99
Transition participants 702 183 885
Table M.26 Estimated rate of unscheduled plan reviews – excluding plans less than 30 days – NT313
Prior Quarters
(Transition only)
2018-19 Q3 Transition
Total
% unscheduled reviews 55.9% 42.9% 52.8%
Table M.27 AAT cases by category – NT
Prior Quarters 2018-19 Q3 Total
Category N % N % N %
Access 1 25% 0 0% 1 20%
Plan 3 75% 0 0% 3 60%
Plan Review 0 0% 1 100% 1 20%
Other 0 0% 0 0% 0 0%
Total 4 100% 1 100% 5 100%
% of all access decisions314
0.17% 0.16% 0.17%
312 Plans less than 30 days in duration have been excluded from this tabulation, as these reviews are more likely to represent corrections to the plan rather than a new plan review to address a change in circumstance. 313 This is calculated as the number of unscheduled reviews divided by the total number of participants. The number of participants used in the calculation considers the length of time the participants have been in the Scheme. 314 This is calculated as the number of appeals divided by the number of access decisions made. The number of access decisions used in the calculation considers the length of time since the access decisions have been made.

March 2019 | COAG Disability Reform Council Quarterly Report 298
Table M.28 AAT cases by open/closed and decision – NT
N
AAT Cases 5
Open AAT Cases 2
Closed AAT Cases 3
Resolved before hearing 1
Gone to hearing and received a substantive decision
2*
*Of the 2 cases which went to hearing and received a substantive decision: 1 varied the Agency’s decision and 1 affirmed the Agency’s decision.
Table M.29 Distribution of active participants by method of Financial Plan Management and quarter of plan approval – NT
Prior Quarters
(Transition only) 2018-19 Q3 Total
Self-managed fully 10% 13% 11%
Self-managed partly 5% 6% 5%
Plan managed 21% 24% 22%
Agency managed 64% 57% 61%
Total 100% 100% 100%
Table M.30 Distribution of active participants by support coordination and quarter of plan approval – NT
Prior Quarters
(Transition only) 2018-19 Q3 Total
Support coordination 76% 71% 74%
Table M.31 Duration to plan activation by quarter of initial plan approval for active participants – NT315,316
Prior Quarters
(Transition Only) 2018-19 Q1
Plan activation N % N %
Less than 30 days 408 61% 150 69%
30 to 59 days 84 13% 25 12%
60 to 89 days 45 7% 12 6%
Activated within 90 days 537 81% 187 86%
90 to 119 days 52 8% 5 2%
120 days and over 57 9% 12 6%
Activated between 90 and 180 days
109 16% 17 8%
No payments 18 3% 13 6%
Total plans approved 664 100% 217 100%
315 Note: Plans approved after the end of 2018-19 Q1 have been excluded from the table. They are relatively new and it is too early to examine their durations to activation. 316 There has been a change in methodology used to calculate these results since the previous quarter. Duration to plan
activation is now calculated as the time from a participant’s initial plan approval to when the participant first uses plan supports (previously only the initial plan for each participant was considered). In-kind supports are now also included (previously excluded). As a result, a higher proportion of participants are identified as activating their plans within 90 days, and a lower proportion have no payments.

March 2019 | COAG Disability Reform Council Quarterly Report 299
Table M.32 Proportion of active participants with plan activated within 12 months – NT
Number of participants
activated within 12 months
All participants with duration of
at least 12 months
Proportion activated
by Aboriginal and Torres Strait Islander status
Aboriginal and Torres Strait Islander 478 536 89%
Not Aboriginal and Torres Strait Islander 136 140 97%
Not Stated 11 11 100%
Total 625 687 91%
by Culturally and Linguistically Diverse status
CALD 223 261 85%
Not CALD 402 426 94%
Not Stated 0 0
Total 625 687 91%
by Remoteness
Major Cities 8 9 89%
Regional 136 140 97%
Remote 477 532 90%
Missing 4 6 67%
Total 625 687 91%
by Primary Disability type
Autism 69 73 95% Intellectual Disability (including Down Syndrome) 182 205 89%
Psychosocial Disability 33 39 85% Developmental Delay (including Global Developmental Delay) 16 19 84%
Other 325 351 93%
Total 625 687 91%
Table M.33 Distribution of plans by plan utilisation and quarter of plan approval for 2016-17, 2017-18 and quarter 1 of 2018-19–
NT317,318
Plan utilisation Prior Quarters
(Transition only) 2018-19 Q1 Total
0% to 50% 54% 75% 57%
50% to 75% 20% 14% 20%
> 75% 25% 11% 24%
Total 100% 100% 100%
Table M.34 Proportion of active participants with approved plans accessing mainstream supports – NT
Prior Quarters 2018-19 Q3 Total
Daily Activities 12% 15% 13%
Health & Wellbeing 48% 39% 44%
Lifelong Learning 8% 7% 8%
Other 17% 15% 16%
Non-categorised 22% 33% 26%
Any mainstream service 94% 96% 95%
317 Plans less than 30 days in duration have been excluded from this tabulation, as these plans are more likely to represent corrections to the plan rather than an unscheduled plan review to address a change in circumstance. 318 This table only considers committed supports and payments for supports provided to 31 December 2018. This gives some allowance for the timing delay between when the support is provided and when it is paid.

March 2019 | COAG Disability Reform Council Quarterly Report 300
Part Three: Providers and the growing market
Table M.35 Key provider indicators by quarter – NT319
Prior Quarters 2018-19 Q3 Total
Provider indicators
a) Registrations by profile
Individual/ sole trader 136 23 159
Company/ organisation 571 57 624
Total 707 80 783
b) Registration revoked 4
319 The total number of providers as at 31 March 2019 (783) is not the sum of the number of providers as at 31 December
2018 (707) and the providers registered in the third quarter of 2018-19 (80). This is due to 4 providers whose registration ended during the third quarter of 2018-19.

March 2019 | COAG Disability Reform Council Quarterly Report 301
Table M.36 Number of approved providers by registration group – NT320
Registration Group Prior
Quarters 2018-19
Q3 Total % Change
Assistance services
Accommodation / Tenancy Assistance 111 23 134 21%
Assistance Animals 2 0 2 0%
Assistance with daily life tasks in a group or shared living arrangement
41 3 44 7%
Assistance with travel/transport arrangements 80 7 87 9%
Daily Personal Activities 51 6 57 12%
Group and Centre Based Activities 44 8 52 18%
High Intensity Daily Personal Activities 38 5 43 13%
Household tasks 63 12 75 19%
Interpreting and translation 73 3 76 4%
Participation in community, social and civic activities 61 10 71 16%
Assistive Technology
Assistive equipment for recreation 63 5 68 8%
Assistive products for household tasks 60 2 62 3%
Assistance products for personal care and safety 109 5 114 5%
Communication and information equipment 155 16 171 10%
Customised Prosthetics 29 3 32 10%
Hearing Equipment 51 5 56 10%
Hearing Services 3 1 4 33%
Personal Mobility Equipment 82 5 87 6%
Specialised Hearing Services 5 0 5 0%
Vision Equipment 62 8 70 13%
Capacity Building Services
Assistance in coordinating or managing life stages, transitions and supports
71 11 82 15%
Behaviour Support 31 6 37 19%
Community nursing care for high needs 25 4 29 16%
Development of daily living and life skills 51 7 58 14%
Early Intervention supports for early childhood 41 9 50 22%
Exercise Physiology and Physical Wellbeing activities
36 2 38 6%
Innovative Community Participation 186 33 219 18%
Specialised Driving Training 24 6 30 25%
Therapeutic Supports 79 15 94 19%
Capital services
Home modification design and construction 54 7 61 13%
Specialised Disability Accommodation 70 18 88 26%
Vehicle Modifications 57 9 66 16%
Choice and control support services
Management of funding for supports in participants plan
32 6 38 19%
Support Coordination 54 11 65 20%
Employment and Education support services
Assistance to access and/or maintain employment and/or education
20 1 21 5%
Specialised Supported Employment 7 1 8 14%
Total approved providers 703 80 783 11%
320 The 4 providers whose registration ended during the third quarter of 2018-19 are not included in the 2018-19 Q2 and prior numbers in this table.

March 2019 | COAG Disability Reform Council Quarterly Report 302
Table M.37 Key markets indicators by quarter – NT
Market indicators Prior Quarters 2018-19 Q3
a) Average number of providers per participant 2.09 1.82
b) Number of providers delivering new supports 76 77
c) Change in the number of active/inactive providers:
Active (%) 15% 15%
Not yet active (%) 82% 82%
Inactive (%) 3% 3%
e) Share of payments - top 25%
Daily Tasks/Shared Living (%) 90% 88%
Therapeutic Supports (%) 77% 71%
Participate Community (%) 78% 78%
Early Childhood Supports (%) 77% 67%
Assist Personal Activities (%) 69% 78%

March 2019 | COAG Disability Reform Council Quarterly Report 303
Table M.38 Cumulative number of providers that have been active by registration group – NT
Registration Group Prior
Quarters 2018-19
Q3 Total % Change
Assistance services
Accommodation / Tenancy Assistance 3 1 4 33%
Assistance Animals 0 0 0 -
Assistance with daily life tasks in a group or shared living arrangement
24 3 27 13%
Assistance with travel/transport arrangements 20 5 25 25%
Daily Personal Activities 31 3 34 10%
Group and Centre Based Activities 20 2 22 10%
High Intensity Daily Personal Activities 19 3 22 16%
Household tasks 20 5 25 25%
Interpreting and translation 2 0 2 0%
Participation in community, social and civic activities 33 7 40 21%
Assistive Technology
Assistive equipment for recreation 2 0 2 0%
Assistive products for household tasks 3 0 3 0%
Assistance products for personal care and safety 19 5 24 26%
Communication and information equipment 2 1 3 50%
Customised Prosthetics 5 0 5 0%
Hearing Equipment 0 0 0 -
Hearing Services 0 0 0 -
Personal Mobility Equipment 9 1 10 11%
Specialised Hearing Services 1 0 1 0%
Vision Equipment 2 0 2 0%
Capacity Building Services
Assistance in coordinating or managing life stages, transitions and supports
40 3 43 8%
Behaviour Support 12 3 15 25%
Community nursing care for high needs 4 0 4 0%
Development of daily living and life skills 17 4 21 24%
Early Intervention supports for early childhood 13 3 16 23%
Exercise Physiology and Physical Wellbeing activities
3 0 3 0%
Innovative Community Participation 1 1 2 100%
Specialised Driving Training 0 0 0 -
Therapeutic Supports 46 6 52 13%
Capital services
Home modification design and construction 2 1 3 50%
Specialised Disability Accommodation 1 1 2 100%
Vehicle Modifications 2 0 2 0%
Choice and control support services
Management of funding for supports in participants plan
13 2 15 15%
Support Coordination 8 1 9 13%
Employment and Education support services
Assistance to access and/or maintain employment and/or education
3 1 4 33%
Specialised Supported Employment 2 0 2 0%
Total approved active providers 129 15 144 12%

March 2019 | COAG Disability Reform Council Quarterly Report 304
Table M.39 Number of approved and active providers in each registration group by legal entity type as at 31 March 2019 – NT
Registration Group
Approved Active
Individual/ sole trader
Company/ organisation
Total Approved
Individual/ sole trader
Company/ organisation
Total Active
Assistance services
Accommodation / Tenancy Assistance
21 113 134 1 3 4
Assistance Animals 0 2 2 0 0 0
Assistance with daily life tasks in a group or shared living arrangement
3 41 44 2 25 27
Assistance with travel/transport arrangements
7 80 87 2 23 25
Daily Personal Activities 4 53 57 2 32 34
Group and Centre Based Activities
2 50 52 1 21 22
High Intensity Daily Personal Activities
2 41 43 1 21 22
Household tasks 10 65 75 6 19 25
Interpreting and translation 10 66 76 0 2 2
Participation in community, social and civic activities
4 67 71 3 37 40
Assistive Technology Assistive equipment for recreation
13 55 68 0 2 2
Assistive products for household tasks
13 49 62 0 3 3
Assistance products for personal care and safety
16 98 114 4 20 24
Communication and information equipment
36 135 171 1 2 3
Customised Prosthetics 6 26 32 0 5 5
Hearing Equipment 6 50 56 0 0 0
Hearing Services 0 4 4 0 0 0
Personal Mobility Equipment 14 73 87 2 8 10
Specialised Hearing Services
1 4 5 0 1 1
Vision Equipment 12 58 70 0 2 2
Capacity Building Services Assistance in coordinating or managing life stages, transitions and supports
11 71 82 6 37 43
Behaviour Support 9 28 37 3 12 15
Community nursing care for high needs
2 27 29 0 4 4
Development of daily living and life skills
4 54 58 0 21 21
Early Intervention supports for early childhood
20 30 50 5 11 16
Exercise Physiology and Physical Wellbeing activities
7 31 38 0 3 3
Innovative Community Participation
50 169 219 0 2 2
Specialised Driving Training 5 25 30 0 0 0
Therapeutic Supports 32 62 94 18 34 52
Capital services Home modification design and construction
9 52 61 0 3 3
Specialised Disability Accommodation
9 79 88 0 2 2
Vehicle Modifications 6 60 66 0 2 2
Choice and control support services
Management of funding for supports in participants plan
1 37 38 0 15 15

March 2019 | COAG Disability Reform Council Quarterly Report 305
Registration Group
Approved Active
Individual/ sole trader
Company/ organisation
Total Approved
Individual/ sole trader
Company/ organisation
Total Active
Support Coordination 10 55 65 1 8 9
Employment and Education support services
Assistance to access and/or maintain employment and/or education
1 20 21 0 4 4
Specialised Supported Employment
1 7 8 0 2 2
Total 159 624 783 28 116 144
Table M.40 Proportion of approved and active providers in each registration group by legal entity type as at 31 March 2019 – NT
Registration Group
Approved Active
Individual/ sole trader
Company/ organisation
Total Approved
Individual/ sole trader
Company/ organisation
Total Active
Assistance services
Accommodation / Tenancy Assistance
16% 84% 134 25% 75% 4
Assistance Animals 0% 100% 2 - - 0
Assistance with daily life tasks in a group or shared living arrangement
7% 93% 44 7% 93% 27
Assistance with travel/transport arrangements
8% 92% 87 8% 92% 25
Daily Personal Activities 7% 93% 57 6% 94% 34
Group and Centre Based Activities
4% 96% 52 5% 95% 22
High Intensity Daily Personal Activities
5% 95% 43 5% 95% 22
Household tasks 13% 87% 75 24% 76% 25
Interpreting and translation 13% 87% 76 0% 100% 2
Participation in community, social and civic activities
6% 94% 71 8% 93% 40
Assistive Technology Assistive equipment for recreation
19% 81% 68 0% 100% 2
Assistive products for household tasks
21% 79% 62 0% 100% 3
Assistance products for personal care and safety
14% 86% 114 17% 83% 24
Communication and information equipment
21% 79% 171 33% 67% 3
Customised Prosthetics 19% 81% 32 0% 100% 5
Hearing Equipment 11% 89% 56 - - 0
Hearing Services 0% 100% 4 - - 0
Personal Mobility Equipment 16% 84% 87 20% 80% 10
Specialised Hearing Services
20% 80% 5 0% 100% 1
Vision Equipment 17% 83% 70 0% 100% 2
Capacity Building Services Assistance in coordinating or managing life stages, transitions and supports
13% 87% 82 14% 86% 43
Behaviour Support 24% 76% 37 20% 80% 15
Community nursing care for high needs
7% 93% 29 0% 100% 4
Development of daily living and life skills
7% 93% 58 0% 100% 21
Early Intervention supports for early childhood
40% 60% 50 31% 69% 16
Exercise Physiology and Physical Wellbeing activities
18% 82% 38 0% 100% 3

March 2019 | COAG Disability Reform Council Quarterly Report 306
Registration Group
Approved Active
Individual/ sole trader
Company/ organisation
Total Approved
Individual/ sole trader
Company/ organisation
Total Active
Innovative Community Participation
23% 77% 219 0% 100% 2
Specialised Driving Training 17% 83% 30 - - 0
Therapeutic Supports 34% 66% 94 35% 65% 52
Capital services Home modification design and construction
15% 85% 61 0% 100% 3
Specialised Disability Accommodation
10% 90% 88 0% 100% 2
Vehicle Modifications 9% 91% 66 0% 100% 2
Choice and control support services
Management of funding for supports in participants plan
3% 97% 38 0% 100% 15
Support Coordination 15% 85% 65 11% 89% 9
Employment and Education support services
Assistance to access and/or maintain employment and/or education
5% 95% 21 0% 100% 4
Specialised Supported Employment
13% 88% 8 0% 100% 2
Total 20% 80% 783 19% 81% 144

March 2019 | COAG Disability Reform Council Quarterly Report 307
Part Five: Financial sustainability
Table M.41 Committed supports by financial year ($m) – NT
2013-14 2014-15 2015-16 2016-17 2017-18 2018-19 Q1,
Q2, Q3321 Total
Total Committed
- 1.9 5.6 19.8 100.0 136.5 263.8
Figure M.1 Distribution of participants by annualised committed support band (including participants with Supported
Independent Living supports) – active participants with initial plan approvals as at 2018-19 Q3 compared with active
participants with initial plan approvals as at 2018-19 Q2 (NT)
321 Note: the $137 million in respect of 2018-19 Q1, Q2 and Q3 only includes committed supports expected to be used to 31 March 2019.
0.00%
2.00%
4.00%
6.00%
8.00%
10.00%
12.00%
14.00%
16.00%
18.00%
20.00%
Dis
trib
uti
on
o
f p
art
icip
an
ts
Average annualised committed supports band
As at Q2 2018-19 distribution of participants As at Q3 2018-19 distribution of participants

March 2019 | COAG Disability Reform Council Quarterly Report 308
Figure M.2 Distribution of participants by annualised committed support band (excluding participants with Supported
Independent Living supports) – active participants with initial plan approvals as at 2018-19 Q3 compared with active
participants with initial plan approvals as at 2018-19 Q2 (NT)
0.00%
5.00%
10.00%
15.00%
20.00%
25.00%
Dis
trib
uti
on
o
f p
art
icip
an
ts
Average annualised committed supports band
As at Q2 2018-19 distribution of participants As at Q3 2018-19 distribution of participants
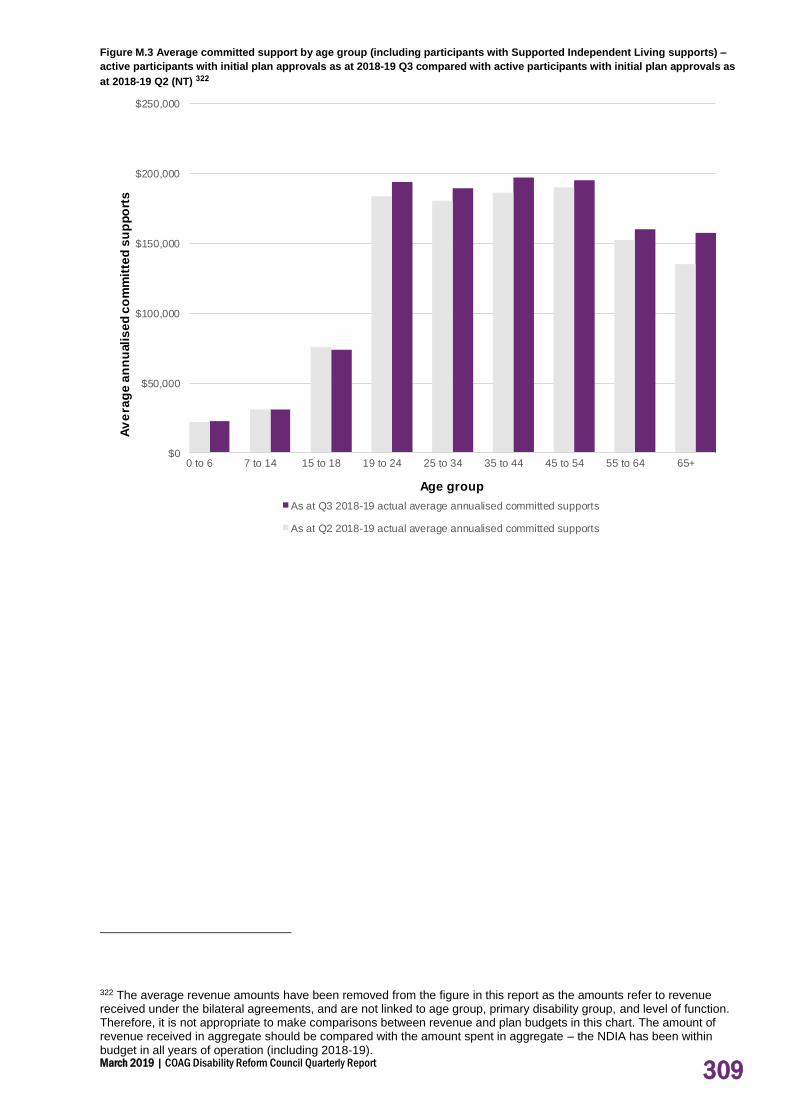
March 2019 | COAG Disability Reform Council Quarterly Report 309
Figure M.3 Average committed support by age group (including participants with Supported Independent Living supports) –
active participants with initial plan approvals as at 2018-19 Q3 compared with active participants with initial plan approvals as
at 2018-19 Q2 (NT) 322
322 The average revenue amounts have been removed from the figure in this report as the amounts refer to revenue received under the bilateral agreements, and are not linked to age group, primary disability group, and level of function. Therefore, it is not appropriate to make comparisons between revenue and plan budgets in this chart. The amount of revenue received in aggregate should be compared with the amount spent in aggregate – the NDIA has been within budget in all years of operation (including 2018-19).
$0
$50,000
$100,000
$150,000
$200,000
$250,000
0 to 6 7 to 14 15 to 18 19 to 24 25 to 34 35 to 44 45 to 54 55 to 64 65+
Av
era
ge
an
nu
ali
se
d c
om
mit
ted
su
pp
ort
s
Age group
As at Q3 2018-19 actual average annualised committed supports
As at Q2 2018-19 actual average annualised committed supports

March 2019 | COAG Disability Reform Council Quarterly Report 310
Figure M.4 Average committed support by primary disability group (including participants with Supported Independent Living
supports) – active participants with initial plan approvals as at 2018-19 Q3 compared with active participants with initial plan
approvals as at 2018-19 Q2 (NT) 323,324
323 Ibid. 324 Average annualised committed supports are not shown where there is insufficient data in the group. There is
insufficient data to show an average cost for Other.
$0 $50,000 $100,000 $150,000 $200,000 $250,000
Acquired Brain Injury
Autism
Cerebral Palsy
Developmental Delay
Global Developmental Delay
Hearing Impairment
Intellectual Disability
Multiple Sclerosis
Psychosocial disability
Spinal Cord Injury
Stroke
Visual Impairment
Other Neurological
Other Physical
Other Sensory/Speech
Other
Average annualised committed supports
Pri
ma
ry d
isa
bil
ity
As at Q2 2018-19 actual average annualised committed supports
As at Q3 2018-19 actual average annualised committed supports

March 2019 | COAG Disability Reform Council Quarterly Report 311
Figure M.5 Average committed support by level of function (including participants with Supported Independent Living
supports) – active participants with initial plan approvals as at 2018-19 Q3 compared with active participants with initial plan
approvals as at 2018-19 Q2 (NT) 325,326,327
Table M.42 Payments by financial year, compared to committed supports ($m) – NT
2013-14 2014-15 2015-16 2016-17 2017-18 2018-19
Q1, Q2, Q3 Total
Total Committed - 1.9 5.6 19.8 100.0 136.5 263.8
Total Paid - 1.6 4.1 11.1 64.0 75.5 156.2
% utilised to date - 84% 73% 56% 64% 55% 56%328
325 The average revenue amounts have been removed from the figure in this report as the amounts refer to revenue received under the bilateral agreements, and are not linked to age group, primary disability group, and level of function. Therefore, it is not appropriate to make comparisons between revenue and plan budgets in this chart. The amount of revenue received in aggregate should be compared with the amount spent in aggregate – the NDIA has been within budget in all years of operation (including 2018-19). 326 An ICT issue has been identified and as a result, reporting by level of function is not accurate. This issue is currently under investigation and will be reconciled for reporting as at 30 June 2019. 327 Average annualised committed supports are not shown where there is insufficient data in the group. Levels of function
2 and 15 do not have sufficient data to show an average cost. 328 Note: Only committed supports expected to be used to 31 March 2019 have been used to calculate the utilisation from 1 July 2013 to date, and this will increase as there is a lag between when support is provided and when it is paid.
$0
$50,000
$100,000
$150,000
$200,000
$250,000
$300,000
1 2 3 4 5 6 7 8 9 10 11 12 13 14 15
Av
era
ge
an
nu
ali
se
d c
os
t
Level of function
As at Q3 2018-19 actual average annualised committed supports
As at Q2 2018-19 actual average annualised committed supports

March 2019 | COAG Disability Reform Council Quarterly Report 312
Figure M.6 Utilisation of committed supports as at 31 December 2018 and 31 March 2019 (NT)

March 2019 | COAG Disability Reform Council Quarterly Report 313
Appendix A: Appendix N:
Participants by region and support type
Table N.1 Active participants by region and support type included in plan as at 31 March 2019329
Bilateral region Date phasing began
Core supports330 Capacity Building supports331
Capital supports332
Total active participants
# % # % # %
NSW 76,791 78% 96,090 98% 28,253 29% 97,865
Hunter Trial Site Jul-13 7,647 73% 10,037 96% 2,737 26% 10,493
Hunter New England (excl. Trial Site)
Jul-16 5,754 74% 7,451 96% 1,931 25% 7,729
Central Coast Jul-16 4,274 77% 5,458 98% 1,413 25% 5,583
Far West Jul-17 333 86% 380 99% 133 35% 385
Illawarra Shoalhaven Jul-17 4,957 88% 5,569 99% 1,808 32% 5,642
Mid North Coast Jul-17 2,785 78% 3,567 99% 883 25% 3,592
Murrumbidgee Jul-17 3,481 86% 4,011 99% 1,202 30% 4,033
Nepean Blue Mountains Jul-15 4,029 68% 5,828 99% 1,391 24% 5,892
North Sydney Jul-16 5,750 81% 7,000 99% 2,645 37% 7,088
Northern NSW Jul-17 3,690 82% 4,440 99% 1,187 27% 4,473
South Eastern Sydney Jul-17 5,298 83% 6,263 99% 2,142 34% 6,347
South Western Sydney Jul-16 9,362 75% 12,246 98% 3,154 25% 12,457
Southern NSW Jul-16 2,459 87% 2,797 99% 982 35% 2,836
Sydney Jul-17 4,459 84% 5,224 99% 1,828 35% 5,279
Western NSW Jul-17 3,039 78% 3,841 99% 1,129 29% 3,895
Western Sydney Jul-16 8,478 78% 10,762 99% 3,367 31% 10,874
NSW - Other 996 79% 1,216 96% 321 25% 1,267
VIC 55,441 86% 63,560 98% 16,558 26% 64,738
Barwon Jul-13 5,856 84% 6,797 98% 1,521 22% 6,952
Central Highlands Jan-17 2,990 85% 3,435 98% 818 23% 3,508
329 Participants who have moved to a different State/Territory since entering the Scheme are included in ‘Other’, which
also includes those with regional information missing. Only regions that have phased in as at 31 March 2019 are shown in this table. 330 Core supports enable participants to complete activities of daily living. Participant budgets often have a lot of flexibility
to choose specific supports with their core support budgets, but cannot reallocate this funding for other support purposes (i.e. capital or capacity building supports). 331 Capacity building supports enable participants to build their independence and skills. Participant budgets are allocated
at a support category level and must be used to achieve the goals set out in the participant’s plan. 332 Capital supports are investments, such as assistive technologies – equipment, home or vehicle modifications, or for
Specialist Disability Accommodation (SDA). Participant budgets for this support purpose are restricted to specific items identified in the participant’s plan.

March 2019 | COAG Disability Reform Council Quarterly Report 314
Bilateral region Date phasing began
Core supports330 Capacity Building supports331
Capital supports332
Total active participants
# % # % # %
Loddon May-17 3,238 83% 3,847 98% 817 21% 3,921
North East Melbourne Jul-16 5,910 74% 7,823 98% 1,919 24% 8,016
Inner Gippsland Oct-17 2,611 87% 2,901 97% 828 28% 2,990
Ovens Murray Oct-17 1,680 84% 1,962 99% 400 20% 1,989
Western District Oct-17 2,298 88% 2,566 99% 538 21% 2,599
Inner East Melbourne Nov-17 5,340 88% 5,961 99% 2,168 36% 6,042
Outer East Melbourne Nov-17 4,934 86% 5,670 99% 1,784 31% 5,735
Hume Moreland Mar-18 3,241 84% 3,794 98% 875 23% 3,862
Bayside Peninsula Apr-18 6,418 94% 6,693 98% 2,239 33% 6,824
Southern Melbourne Sep-18 3,655 89% 4,047 99% 1,034 25% 4,088
Brimbank Melton Oct-18 2,248 88% 2,524 99% 426 17% 2,548
Western Melbourne Oct-18 3,079 91% 3,355 99% 725 21% 3,391
Goulburn Jan-19 683 87% 775 99% 133 17% 781
Mallee Jan-19 408 87% 466 99% 80 17% 470
Outer Gippsland Jan-19 524 96% 538 98% 147 27% 548
VIC - other 328 69% 406 86% 106 22% 474
QLD 38,133 90% 42,110 99% 14,582 34% 42,398
Bundaberg Oct-17 1,398 81% 1,724 100% 551 32% 1,725
Ipswich Jul-17 3,661 84% 4,316 100% 1,402 32% 4,333
Mackay Nov-16 1,443 74% 1,933 99% 541 28% 1,951
Toowoomba Jan-17 3,500 88% 3,953 99% 1,518 38% 3,973
Townsville Apr-16 3,126 79% 3,905 99% 1,117 28% 3,953
Rockhampton Jan-18 2,383 88% 2,696 99% 879 32% 2,712
Beenleigh Jul-18 3,600 96% 3,758 100% 1,187 32% 3,761
Brisbane Jul-18 7,800 96% 8,039 99% 2,985 37% 8,099
Cairns Jul-18 1,819 95% 1,909 99% 600 31% 1,923
Maryborough Jul-18 1,668 96% 1,729 100% 733 42% 1,733
Robina Jul-18 3,304 94% 3,503 100% 1,193 34% 3,519
Caboolture/Strathpine Jan-19 2,176 95% 2,290 100% 925 40% 2,298
Maroochydore Jan-19 2,069 97% 2,120 100% 882 42% 2,124
QLD - Other 186 63% 235 80% 69 23% 294

March 2019 | COAG Disability Reform Council Quarterly Report 315
Bilateral region Date phasing began
Core supports330 Capacity Building supports331
Capital supports332
Total active participants
# % # % # %
WA 10,321 77% 12,871 95% 4,677 35% 13,478
North East Metro Jul-14 3,376 76% 4,378 99% 1,711 39% 4,439
Wheat Belt Jan-17 273 79% 338 98% 119 34% 345
South Metro Jul-18 2,435 74% 3,136 95% 1,083 33% 3,303
Central South Metro Jul-18 1,597 79% 1,871 93% 703 35% 2,020
South West Sep-18 1,058 80% 1,171 89% 355 27% 1,316
Goldfields-Esperance Oct-18 146 83% 169 97% 44 25% 175
North Metro Oct-18 1,002 78% 1,281 100% 452 35% 1,286
Kimberley-Pilbara Oct-18 209 80% 252 97% 91 35% 261
WA - Other 225 68% 275 83% 119 36% 333
SA333
22,433 86% 26,010 99% 7,479 29% 26,235
Adelaide Hills Jul-13 806 85% 942 100% 233 25% 943
Barossa, Light and Lower North
Jul-13 1,137 87% 1,299 99% 311 24% 1,306
Eastern Adelaide Jul-13 1,748 85% 2,048 100% 622 30% 2,056
Eyre and Western Jul-13 688 85% 809 100% 211 26% 812
Far North (SA) Jul-13 239 86% 278 100% 86 31% 279
Fleurieu and Kangaroo Island
Jul-13 667 90% 736 100% 223 30% 738
Limestone Coast Jul-13 792 90% 879 100% 233 26% 881
Murray and Mallee Jul-13 941 87% 1,081 100% 307 28% 1,086
Northern Adelaide Jul-13 7,313 84% 8,615 99% 2,401 28% 8,667
Southern Adelaide Jul-13 5,041 88% 5,719 99% 1,886 33% 5,750
Western Adelaide Jul-13 1,891 85% 2,208 99% 628 28% 2,221
Yorke and Mid North Jul-13 935 86% 1,076 99% 270 25% 1,082
SA - Other 235 57% 320 77% 68 16% 414
TAS334
5,017 89% 5,305 94% 1,450 26% 5,649
TAS North Jul-13 1,384 92% 1,458 97% 432 29% 1,502
TAS North West Jul-13 1,273 91% 1,324 94% 303 22% 1,405
TAS South East Jul-13 924 85% 1,012 93% 257 24% 1,088
333 Since the phasing schedule for South Australia is by age, each region has the phasing date Jul-13. 334 Since the phasing schedule for Tasmania is by age, each region has the phasing date Jul-13.

March 2019 | COAG Disability Reform Council Quarterly Report 316
Bilateral region Date phasing began
Core supports330 Capacity Building supports331
Capital supports332
Total active participants
# % # % # %
TAS South West Jul-13 1,407 90% 1,483 95% 442 28% 1,559
TAS - Other 29 31% 28 29% 16 17% 95
ACT 5,138 75% 6,681 98% 1,627 24% 6,844
ACT Jul-14 4,902 76% 6,365 98% 1,536 24% 6,470
ACT - Other 236 63% 316 84% 91 24% 374
NT 1,692 91% 1,839 99% 729 39% 1,864
Barkly Jul-14 123 92% 133 99% 60 45% 134
Central Australia335
Jul-17 246 97% 253 100% 154 61% 253
Darwin Remote Jul-17 119 87% 137 100% 50 36% 137
Darwin Urban336
Jan-17 858 91% 942 100% 333 35% 946
East Arnhem Jan-17 176 95% 184 99% 52 28% 185
Katherine Jul-17 150 91% 164 100% 67 41% 164
NT - Other 20 44% 26 58% 13 29% 45
Total 214,966 83% 254,466 98% 75,355 29% 259,071
335 Clients of Supported Accomodation services in Alice Springs began phasing in July 2017, while all remaining
participants in Central Australia began phasing in July 2018. 336 Clients of Supported Accomodation services in Darwin Urban began phasing in January 2017, while all remaining
participants in Darwin Urban began phasing in July 2018.

March 2019 | COAG Disability Reform Council Quarterly Report 317
Appendix B: Appendix O:
Specialist Disability Accommodation
Figure O.1 Changes in Specialist Disabiliity Accommodation by quarter (NATIONAL)
4,191
6,068
6,9307,624
8,8589,536
10,975
12,356
0
2,000
4,000
6,000
8,000
10,000
12,000
14,000
30-Jun-17 30-Sep-17 31-Dec-17 31-Mar-18 30-Jun-18 30-Sep-18 31-Dec-18 31-Mar-19
Active Participants with SDA supports
6,796
9,19210,372
11,283
12,663
14,025
16,880
19,329
0
5,000
10,000
15,000
20,000
25,000
30-Jun-17 30-Sep-17 31-Dec-17 31-Mar-18 30-Jun-18 30-Sep-18 31-Dec-18 31-Mar-19
Active participants with SIL supports
34
61
7378
86
94
112
127
0
20
40
60
80
100
120
140
30-Jun-17 30-Sep-17 31-Dec-17 31-Mar-18 30-Jun-18 30-Sep-18 31-Dec-18 31-Mar-19
Annualised SDA supports in active plans ($m)
1,470
2,125
2,5192,702
3,219
3,650
4,447
5,254
0
1,000
2,000
3,000
4,000
5,000
6,000
30-Jun-17 30-Sep-17 31-Dec-17 31-Mar-18 30-Jun-18 30-Sep-18 31-Dec-18 31-Mar-19
Annualised committed support for participants with SIL ($m)
497
764
1,135
1,311
1,679
2,243
2,593
2,896
0
500
1,000
1,500
2,000
2,500
3,000
3,500
30-Jun-17 30-Sep-17 31-Dec-17 31-Mar-18 30-Jun-18 30-Sep-18 31-Dec-18 31-Mar-19
Enrolled dwellings (excluding in-kind)
258
372
450
535
692
754802
892
0
100
200
300
400
500
600
700
800
900
1,000
30-Jun-17 30-Sep-17 31-Dec-17 31-Mar-18 30-Jun-18 30-Sep-18 31-Dec-18 31-Mar-19
SDA registered providers

March 2019 | COAG Disability Reform Council Quarterly Report 318
Table O.1 Active participants with SDA and SIL funding in current NDIS plan as at 31 March 2019337
Bilateral region
Active participants
with SDA supports
Percentage of SDA
participants
Active participants
with SIL supports
Percentage of SIL
participants
Number of active
participants
NSW 4,614 4.7% 7,504 7.7% 97,865
Hunter Trial Site 441 4.2% 0 0.0% 10,493
Hunter New England (excl. Trial Site)
256 3.3% 1,561 20.2% 7,729
Central Coast 144 2.6% 375 6.7% 5,583
Far West 15 3.9% 19 4.9% 385
Illawarra Shoalhaven 297 5.3% 405 7.2% 5,642
Mid North Coast 137 3.8% 185 5.2% 3,592
Murrumbidgee 234 5.8% 285 7.1% 4,033
Nepean Blue Mountains 309 5.2% 470 8.0% 5,892
North Sydney 614 8.7% 832 11.7% 7,088
Northern NSW 150 3.4% 247 5.5% 4,473
South Eastern Sydney 350 5.5% 487 7.7% 6,347
South Western Sydney 364 2.9% 739 5.9% 12,457
Southern NSW 132 4.7% 181 6.4% 2,836
Sydney 286 5.4% 385 7.3% 5,279
Western NSW 287 7.4% 428 11.0% 3,895
Western Sydney 587 5.4% 871 8.0% 10,874
NSW - Other 11 0.9% 34 2.7% 1,267
VIC 3,701 5.7% 4,327 6.7% 64,738
Barwon 172 2.5% 339 4.9% 6,952
Central Highlands 195 5.6% 229 6.5% 3,508
Loddon 210 5.4% 218 5.6% 3,921
North East Melbourne 559 7.0% 648 8.1% 8,016
Inner Gippsland 125 4.2% 128 4.3% 2,990
Ovens Murray 117 5.9% 137 6.9% 1,989
Western District 243 9.3% 243 9.3% 2,599
Inner East Melbourne 630 10.4% 686 11.4% 6,042
Outer East Melbourne 362 6.3% 412 7.2% 5,735
Hume Moreland 137 3.5% 173 4.5% 3,862
Bayside Peninsula 558 8.2% 649 9.5% 6,824
Southern Melbourne 157 3.8% 181 4.4% 4,088
Brimbank Melton 82 3.2% 94 3.7% 2,548
Western Melbourne 89 2.6% 106 3.1% 3,391
Goulburn 2 0.3% 4 0.5% 781
Mallee 15 3.2% 18 3.8% 470
Outer Gippsland 43 7.8% 50 9.1% 548
VIC - Other 5 1.1% 12 2.5% 474
QLD 1,182 2.8% 3,220 7.6% 42,398
Bundaberg 47 2.7% 139 8.1% 1,725
Ipswich 211 4.9% 287 6.6% 4,333
Mackay 20 1.0% 99 5.1% 1,951
Toowoomba 222 5.6% 365 9.2% 3,973
Townsville 64 1.6% 239 6.0% 3,953
337 Participants who have moved to a different State/Territory since entering the Scheme are included in ‘Other’, which
also includes those with regional information missing. Only regions that have phased in as at 31 March 2019 are shown in this table.

March 2019 | COAG Disability Reform Council Quarterly Report 319
Bilateral region
Active participants
with SDA supports
Percentage of SDA
participants
Active participants
with SIL supports
Percentage of SIL
participants
Number of active
participants
Rockhampton 69 2.5% 206 7.6% 2,712
Beenleigh 276 7.3% 322 8.6% 3,761
Brisbane 162 2.0% 746 9.2% 8,099
Cairns 29 1.5% 215 11.2% 1,923
Maryborough 52 3.0% 169 9.8% 1,733
Robina 20 0.6% 313 8.9% 3,519
Caboolture/Strathpine 7 0.3% 76 3.3% 2,298
Maroochydore 0 0.0% 37 1.7% 2,124
QLD – Other 3 1.0% 7 2.4% 294
WA 454 3.4% 915 6.8% 13,478
North East Metro 329 7.4% 448 10.1% 4,439
Wheat Belt 0 0.0% 4 1.2% 345
South Metro 51 1.5% 228 6.9% 3,303
Central South Metro 31 1.5% 116 5.7% 2,020
South West 5 0.4% 31 2.4% 1,316
Goldfields-Esperance 2 1.1% 3 1.7% 175
North Metro 14 1.1% 28 2.2% 1,286
Kimberley-Pilbara 1 0.4% 10 3.8% 261
WA - Other 21 6.3% 47 14.1% 333
SA 1,695 6.5% 1,944 7.4% 26,235
Adelaide Hills 35 3.7% 50 5.3% 943
Barossa, Light and Lower North 26 2.0% 35 2.7% 1,306
Eastern Adelaide 130 6.3% 172 8.4% 2,056
Eyre and Western 28 3.4% 33 4.1% 812
Far North (SA) 19 6.8% 21 7.5% 279
Fleurieu and Kangaroo Island 36 4.9% 39 5.3% 738
Limestone Coast 47 5.3% 66 7.5% 881
Murray and Mallee 80 7.4% 90 8.3% 1,086
Northern Adelaide 544 6.3% 601 6.9% 8,667
Southern Adelaide 591 10.3% 628 10.9% 5,750
Western Adelaide 119 5.4% 152 6.8% 2,221
Yorke and Mid North 37 3.4% 52 4.8% 1,082
SA - Other 3 0.7% 5 1.2% 414
TAS 523 9.3% 749 13.3% 5,649
TAS North 138 9.2% 185 12.3% 1,502
TAS North West 139 9.9% 176 12.5% 1,405
TAS South East 77 7.1% 125 11.5% 1,088
TAS South West 169 10.8% 261 16.7% 1,559
TAS - Other 0 0.0% 2 2.1% 95
ACT 14 0.2% 403 5.9% 6,844
ACT 12 0.2% 397 6.1% 6,470
ACT - Other 2 0.5% 6 1.6% 374
NT 173 9.3% 267 14.3% 1,864
Barkly 6 4.5% 14 10.4% 134
Central Australia 62 24.5% 84 33.2% 253
Darwin Remote 0 0.0% 0 0.0% 137
Darwin Urban 87 9.2% 146 15.4% 946
East Arnhem 0 0.0% 0 0.0% 185
Katherine 16 9.8% 20 12.2% 164
NT – Other 2 4.4% 3 6.7% 45

March 2019 | COAG Disability Reform Council Quarterly Report 320
Bilateral region
Active participants
with SDA supports
Percentage of SDA
participants
Active participants
with SIL supports
Percentage of SIL
participants
Number of active
participants
Total 12,356 4.8% 19,329 7.5% 259,071
Table O.2 Annualised committed supports in current NDIS plans as at 31 March 2019
State/Territory Committed in
current plans to SDA ($)
% of committed for SDA
supports
Committed in current plans to
SIL ($)
% of committed supports for
SIL participantss
Total committed in current plans
($)
NSW 42,267,480 0.73% 2,046,890,719 35% 5,795,181,008
VIC 39,206,081 1.04% 1,073,742,061 29% 3,758,453,624
QLD 12,525,349 0.40% 945,437,717 30% 3,130,293,133
WA 4,887,033 0.69% 221,469,700 31% 705,862,987
SA 18,801,478 1.34% 495,650,081 35% 1,398,591,490
TAS 6,635,202 1.50% 232,046,054 52% 443,125,348
ACT 311,357 0.09% 117,401,071 32% 366,208,032
NT 2,296,878 1.00% 120,983,422 53% 228,674,241
Total 126,930,859 0.80% 5,253,620,826 33% 15,826,389,863
SDA Building Types:
Existing: Dwellings built before 1 April 2016 that were used as disability related supported accommodation under a previous
State, Territory or Commonwealth scheme. Existing dwellings must substantially comply with the requirements of a new build,
and must meet the maximum resident requirement (5 residents or less).
Legacy: Existing dwellings that do meet the maximum resident requirement of 5 residents or less. Over time, the NDIA will stop
making SDA payments towards Legacy dwellings.
New build: An SDA dwelling that was built (has a certificate of occupancy dated) after 1 April 2016 and meets all of the
requirements under the SDA Rules and NDIS Price Guide.
New build (refurbished): A dwelling that was built before 1 April 2016 but has been significantly refurbished since and now
meets all of the requirements for a new build in the SDA Rules and NDIS Price Guide. In order to qualify for as a New Build
(refurbished) providers must spend a minimum amount. These minimum amounts are specified per dwelling type in the SDA
Price Guide.

March 2019 | COAG Disability Reform Council Quarterly Report 321
Table O.3 Number of Enrolled SDA Dwellings by Location and Type as at 31 March 2019 (excluding in-kind arrangements)338
SDA Building Type
Location Existing Legacy New Build New Build
(refurbished) Total
ACT 5 - - - 5
ACT - Australian Capital Territory 5 - - - 5
NSW 1,000 56 196 4 1,256
NSW - Capital Region 42 1 2 - 45
NSW - Central Coast 36 3 - 1 40
NSW - Central West 47 3 8 - 58
NSW - Coffs Harbour - Grafton 17 5 1 - 23
NSW - Far West and Orana 55 4 - - 59
NSW - Hunter Valley exc Newcastle 43 2 6 - 51
NSW - Illawarra 33 1 7 - 41
NSW - Mid North Coast 29 1 10 - 40
NSW - Murray 33 1 3 - 37
NSW - New England and North West 27 2 6 - 35
NSW - Newcastle and Lake Macquarie 42 1 14 - 57
NSW - Richmond - Tweed 25 1 13 - 39
NSW - Riverina 20 1 5 - 26
NSW - Southern Highlands and Shoalhaven 10 1 4 - 15
NSW - Sydney - Baulkham Hills and Hawkesbury
38 - 11 - 49
NSW - Sydney - Blacktown 56 4 9 - 69
NSW - Sydney - City and Inner South 15 3 - - 18
NSW - Sydney - Eastern Suburbs 14 3 1 - 18
NSW - Sydney - Inner South West 52 1 1 2 56
NSW - Sydney - Inner West 15 3 - - 18
NSW - Sydney - North Sydney and Hornsby 64 7 - - 71
NSW - Sydney - Northern Beaches 27 2 4 - 33
NSW - Sydney - Outer South West 24 - 3 - 27
NSW - Sydney - Outer West and Blue Mountains
62 3 13 - 78
NSW - Sydney - Parramatta 72 - 28 - 100
NSW - Sydney - Ryde 33 1 31 - 65
NSW - Sydney - South West 21 - 2 1 24
NSW - Sydney - Sutherland 48 2 14 - 64
NT 17 3 8 - 28
NT - Darwin 9 2 8 - 19
NT - Northern Territory - Outback 8 1 - - 9
QLD 293 39 82 3 417
QLD - Brisbane - East 16 - - - 16
QLD - Brisbane - North 17 2 6 1 26
QLD - Brisbane - South 36 4 - - 40
QLD - Brisbane - West 16 2 2 - 20
QLD - Brisbane Inner City 6 - - - 6
338 This data does not include accommodation that is being provided under in-kind arrangements or dwellings that are yet to be enrolled.

March 2019 | COAG Disability Reform Council Quarterly Report 322
SDA Building Type
Location Existing Legacy New Build New Build
(refurbished) Total
QLD - Cairns 12 1 2 - 15
QLD - Darling Downs - Maranoa 2 2 - - 4
QLD - Fitzroy 22 2 4 - 28
QLD - Gold Coast 28 2 7 - 37
QLD - Ipswich 11 1 16 - 28
QLD - Logan - Beaudesert 3 1 3 - 7
QLD - Mackay 8 1 - - 9
QLD - Moreton Bay - North 20 2 11 - 33
QLD - Moreton Bay - South 3 2 - - 5
QLD - Queensland - Outback - - - - -
QLD - Sunshine Coast 14 4 - - 18
QLD - Toowoomba 13 7 6 2 28
QLD - Townsville 13 2 5 - 20
QLD - Wide Bay 53 4 20 - 77
SA 642 9 11 - 662
SA - Adelaide - Central and Hills 53 2 1 - 56
SA - Adelaide - North 132 1 3 - 136
SA - Adelaide - South 211 3 5 - 219
SA - Adelaide - West 160 - 2 - 162
SA - Barossa - Yorke - Mid North 18 2 - - 20
SA - South Australia - Outback 16 - - - 16
SA - South Australia - South East 52 1 - - 53
TAS 24 3 8 - 35
TAS - Hobart 12 - - - 12
TAS - Launceston and North East 5 2 4 - 11
TAS - South East 1 - - - 1
TAS - West and North West 6 1 4 - 11
VIC 337 82 58 11 488
VIC - Ballarat 24 5 1 - 30
VIC - Bendigo 7 - 8 - 15
VIC - Geelong 24 4 5 5 38
VIC - Hume 32 5 - - 37
VIC - Latrobe - Gippsland 11 6 - - 17
VIC - Melbourne - Inner 3 2 6 - 11
VIC - Melbourne - Inner East 29 10 1 - 40
VIC - Melbourne - Inner South 35 10 1 - 46
VIC - Melbourne - North East 30 10 10 - 50
VIC - Melbourne - North West 13 1 - - 14
VIC - Melbourne - Outer East 22 - 4 - 26
VIC - Melbourne - South East 28 4 3 1 36
VIC - Melbourne - West 8 9 8 - 25
VIC - Mornington Peninsula 14 5 2 - 21
VIC - North West 26 4 5 5 40
VIC - Shepparton 12 3 3 - 18
VIC - Warrnambool and South West 19 4 1 - 24
WA 5 - - - 5

March 2019 | COAG Disability Reform Council Quarterly Report 323
SDA Building Type
Location Existing Legacy New Build New Build
(refurbished) Total
WA - Bunbury - - - - -
WA - Mandurah - - - - -
WA - Perth - Inner 5 - - - 5
WA - Perth - North East - - - - -
WA - Perth - North West - - - - -
WA - Perth - South East - - - - -
WA - Perth - South West - - - - -
WA - Western Australia - Outback - - - - -
WA - Western Australia - Wheat Belt - - - - -
Total 2,323 192 363 18 2,896
Table O.4 Number of Enrolled SDA Dwellings by Location and Design as at 31 March 2019 (excluding in-kind arrangements)339
SDA Design Category
Location Basic Improved Liveability
High Physical Support
Robust Fully
Accessible Total
ACT - - 5 - - 5
ACT - Australian Capital Territory - - 5 - - 5
NSW 807 209 63 45 132 1,256
NSW - Capital Region 36 3 1 1 4 45
NSW - Central Coast 33 2 - 4 1 40
NSW - Central West 35 4 6 4 9 58
NSW - Coffs Harbour - Grafton 11 3 4 2 3 23
NSW - Far West and Orana 52 2 - 3 2 59
NSW - Hunter Valley exc Newcastle 30 13 - 3 5 51
NSW - Illawarra 33 8 - - - 41
NSW - Mid North Coast 24 10 - 6 - 40
NSW - Murray 16 15 1 3 2 37
NSW - New England and North West 15 11 1 - 8 35
NSW - Newcastle and Lake Macquarie 30 7 16 1 3 57
NSW - Richmond - Tweed 15 13 10 - 1 39
NSW - Riverina 18 6 1 - 1 26
NSW - Southern Highlands and Shoalhaven 9 3 1 2 - 15
NSW - Sydney - Baulkham Hills and Hawkesbury 24 11 - - 14 49
NSW - Sydney - Blacktown 49 2 2 1 15 69
NSW - Sydney - City and Inner South 15 1 - 2 - 18
NSW - Sydney - Eastern Suburbs 16 - 1 1 - 18
NSW - Sydney - Inner South West 50 3 1 - 2 56
NSW - Sydney - Inner West 16 - 1 1 - 18
NSW - Sydney - North Sydney and Hornsby 53 12 6 - - 71
NSW - Sydney - Northern Beaches 27 1 - - 5 33
339 This data does not include accommodation that is being provided under in-kind arrangements or dwellings that are yet to be enrolled.

March 2019 | COAG Disability Reform Council Quarterly Report 324
SDA Design Category
Location Basic Improved Liveability
High Physical Support
Robust Fully
Accessible Total
NSW - Sydney - Outer South West 16 4 4 1 2 27
NSW - Sydney - Outer West and Blue Mountains 49 14 - 7 8 78
NSW - Sydney - Parramatta 49 29 6 1 15 100
NSW - Sydney - Ryde 28 4 - 2 31 65
NSW - Sydney - South West 14 8 1 - 1 24
NSW - Sydney - Sutherland 44 20 - - - 64
NT 8 4 1 - 15 28
NT - Darwin 4 1 1 - 13 19
NT - Northern Territory - Outback 4 3 - - 2 9
QLD 91 122 79 31 94 417
QLD - Brisbane - East 9 4 - 2 1 16
QLD - Brisbane - North 10 6 3 - 7 26
QLD - Brisbane - South 6 13 11 9 1 40
QLD - Brisbane - West 1 5 12 - 2 20
QLD - Brisbane Inner City - 2 4 - - 6
QLD - Cairns 3 2 2 - 8 15
QLD - Darling Downs - Maranoa 1 3 - - - 4
QLD - Fitzroy 4 8 - 1 15 28
QLD - Gold Coast 9 5 18 - 5 37
QLD - Ipswich 3 7 15 1 2 28
QLD - Logan - Beaudesert 2 2 - 2 1 7
QLD - Mackay 2 4 - - 3 9
QLD - Moreton Bay - North - 13 10 5 5 33
QLD - Moreton Bay - South - 4 - - 1 5
QLD - Queensland - Outback - - - - - -
QLD - Sunshine Coast 4 6 - 5 3 18
QLD - Toowoomba 11 10 1 - 6 28
QLD - Townsville 6 3 2 - 9 20
QLD - Wide Bay 20 25 1 6 25 77
SA 354 161 54 2 91 662
SA - Adelaide - Central and Hills 31 7 3 - 15 56
SA - Adelaide - North 56 57 5 1 17 136
SA - Adelaide - South 128 44 14 - 33 219
SA - Adelaide - West 88 24 30 - 20 162
SA - Barossa - Yorke - Mid North 13 6 - 1 - 20
SA - South Australia - Outback 12 4 - - - 16
SA - South Australia - South East 26 19 2 - 6 53
TAS 6 14 1 3 11 35
TAS - Hobart 4 6 - 1 1 12
TAS - Launceston and North East 1 5 1 2 2 11
TAS - South East - 1 - - - 1
TAS - West and North West 1 2 - - 8 11
VIC 233 120 39 38 58 488
VIC - Ballarat 5 12 1 11 1 30
VIC - Bendigo 2 5 4 4 - 15
VIC - Geelong 12 11 5 5 5 38

March 2019 | COAG Disability Reform Council Quarterly Report 325
SDA Design Category
Location Basic Improved Liveability
High Physical Support
Robust Fully
Accessible Total
VIC - Hume 22 9 - 1 5 37
VIC - Latrobe - Gippsland 12 4 - - 1 17
VIC - Melbourne - Inner 3 2 6 - - 11
VIC - Melbourne - Inner East 26 12 - 1 1 40
VIC - Melbourne - Inner South 35 6 - 1 4 46
VIC - Melbourne - North East 20 10 11 4 5 50
VIC - Melbourne - North West 11 3 - - - 14
VIC - Melbourne - Outer East 15 3 - 4 4 26
VIC - Melbourne - South East 17 8 2 4 5 36
VIC - Melbourne - West 8 8 5 - 4 25
VIC - Mornington Peninsula 3 10 1 3 4 21
VIC - North West 17 9 - - 14 40
VIC - Shepparton 6 6 4 - 2 18
VIC - Warrnambool and South West 19 2 - - 3 24
WA - - 5 - - 5
WA - Bunbury - - - - - -
WA - Mandurah - - - - - -
WA - Perth - Inner - - 5 - - 5
WA - Perth - North East - - - - - -
WA - Perth - North West - - - - - -
WA - Perth - South East - - - - - -
WA - Perth - South West - - - - - -
WA - Western Australia - Outback - - - - - -
WA - Western Australia - Wheat Belt - - - - - -
Total 1,499 630 247 119 401 2,896
Table O.5 Number of Enrolled SDA Dwellings by Location and Maximum number of residents as at 31 March 2019 (excluding
in-kind arrangements)340
Maximum Number of Residents
Location 1 2 3 4 5 6+ Total
ACT 0 1 0 2 2 0 5
ACT - Australian Capital Territory 0 1 0 2 2 0 5
NSW 220 176 88 232 484 56 1,256
NSW - Capital Region 20 5 1 5 13 1 45
NSW - Central Coast 8 6 4 9 10 3 40
NSW - Central West 5 5 4 11 30 3 58
NSW - Coffs Harbour - Grafton 5 4 3 2 4 5 23
NSW - Far West and Orana 16 10 2 11 16 4 59
NSW - Hunter Valley exc Newcastle 7 11 5 10 16 2 51
NSW - Illawarra 3 1 3 8 25 1 41
NSW - Mid North Coast 18 6 0 1 14 1 40
340 This data does not include accommodation that is being provided under in-kind arrangements or dwellings that are yet to be enrolled.

March 2019 | COAG Disability Reform Council Quarterly Report 326
Maximum Number of Residents
Location 1 2 3 4 5 6+ Total
NSW - Murray 13 3 1 5 14 1 37
NSW - New England and North West 1 11 1 3 17 2 35
NSW - Newcastle and Lake Macquarie 14 7 6 7 22 1 57
NSW - Richmond - Tweed 16 3 3 5 11 1 39
NSW - Riverina 3 2 4 7 9 1 26
NSW - Southern Highlands and Shoalhaven 1 0 0 2 11 1 15
NSW - Sydney - Baulkham Hills and Hawkesbury 2 9 6 16 16 0 49
NSW - Sydney - Blacktown 0 5 8 11 41 4 69
NSW - Sydney - City and Inner South 1 2 1 3 8 3 18
NSW - Sydney - Eastern Suburbs 1 0 1 5 8 3 18
NSW - Sydney - Inner South West 10 0 1 13 31 1 56
NSW - Sydney - Inner West 0 0 2 4 9 3 18
NSW - Sydney - North Sydney and Hornsby 6 9 4 15 30 7 71
NSW - Sydney - Northern Beaches 2 0 1 10 18 2 33
NSW - Sydney - Outer South West 2 1 2 10 12 0 27
NSW - Sydney - Outer West and Blue Mountains 17 10 5 21 22 3 78
NSW - Sydney - Parramatta 15 27 10 10 38 0 100
NSW - Sydney - Ryde 10 22 5 17 10 1 65
NSW - Sydney - South West 0 8 2 4 10 0 24
NSW - Sydney - Sutherland 24 9 3 7 19 2 64
NT 1 14 1 3 6 3 28
NT - Darwin 0 10 0 1 6 2 19
NT - Northern Territory - Outback 1 4 1 2 0 1 9
QLD 121 86 71 68 32 39 417
QLD - Brisbane - East 3 2 7 2 2 0 16
QLD - Brisbane - North 6 4 9 2 3 2 26
QLD - Brisbane - South 2 18 3 10 3 4 40
QLD - Brisbane - West 2 12 2 2 0 2 20
QLD - Brisbane Inner City 2 0 0 4 0 0 6
QLD - Cairns 2 2 2 7 1 1 15
QLD - Darling Downs - Maranoa 0 0 0 0 2 2 4
QLD - Fitzroy 8 9 2 6 1 2 28
QLD - Gold Coast 28 2 1 2 2 2 37
QLD - Ipswich 16 1 7 3 0 1 28
QLD - Logan - Beaudesert 1 1 1 1 2 1 7
QLD - Mackay 2 0 0 2 4 1 9
QLD - Moreton Bay - North 12 3 10 3 3 2 33
QLD - Moreton Bay - South 0 2 0 0 1 2 5
QLD - Queensland - Outback 0 0 0 0 0 0 0
QLD - Sunshine Coast 7 0 4 3 0 4 18
QLD - Toowoomba 9 4 3 3 2 7 28
QLD - Townsville 0 9 0 6 3 2 20
QLD - Wide Bay 21 17 20 12 3 4 77
SA 125 260 107 88 73 9 662
SA - Adelaide - Central and Hills 11 11 15 12 5 2 56
SA - Adelaide - North 12 66 24 23 10 1 136
SA - Adelaide - South 48 88 31 18 31 3 219
SA - Adelaide - West 44 47 25 22 24 0 162

March 2019 | COAG Disability Reform Council Quarterly Report 327
Maximum Number of Residents
Location 1 2 3 4 5 6+ Total
SA - Barossa - Yorke - Mid North 3 10 3 2 0 2 20
SA - South Australia - Outback 2 10 0 4 0 0 16
SA - South Australia - South East 5 28 9 7 3 1 53
TAS 6 10 4 12 0 3 35
TAS - Hobart 4 3 1 4 0 0 12
TAS - Launceston and North East 2 2 0 5 0 2 11
TAS - South East 0 0 1 0 0 0 1
TAS - West and North West 0 5 2 3 0 1 11
VIC 113 78 42 36 137 82 488
VIC - Ballarat 3 12 3 0 7 5 30
VIC - Bendigo 10 2 2 0 1 0 15
VIC - Geelong 18 8 2 3 3 4 38
VIC - Hume 5 16 1 3 7 5 37
VIC - Latrobe - Gippsland 4 3 1 0 3 6 17
VIC - Melbourne - Inner 8 0 0 0 1 2 11
VIC - Melbourne - Inner East 3 1 2 5 19 10 40
VIC - Melbourne - Inner South 8 6 4 0 18 10 46
VIC - Melbourne - North East 14 5 5 5 11 10 50
VIC - Melbourne - North West 0 6 0 0 7 1 14
VIC - Melbourne - Outer East 1 0 5 7 13 0 26
VIC - Melbourne - South East 6 2 6 6 12 4 36
VIC - Melbourne - West 6 2 2 3 3 9 25
VIC - Mornington Peninsula 4 0 1 1 10 5 21
VIC - North West 16 8 4 1 7 4 40
VIC - Sheppartons 4 2 3 2 4 3 18
VIC - Warrnambool and South West 3 5 1 0 11 4 24
WA 0 5 0 0 0 0 5
WA - Bunbury 0 0 0 0 0 0 0
WA - Mandurah 0 0 0 0 0 0 0
WA - Perth - Inner 0 5 0 0 0 0 5
WA - Perth - North East 0 0 0 0 0 0 0
WA - Perth - North West 0 0 0 0 0 0 0
WA - Perth - South East 0 0 0 0 0 0 0
WA - Perth - South West 0 0 0 0 0 0 0
WA - Western Australia - Outback 0 0 0 0 0 0 0
WA - Western Australia - Wheat Belt 0 0 0 0 0 0 0
Total 586 630 313 441 734 192 2,896

March 2019 | COAG Disability Reform Council Quarterly Report 328
Table O.6 New Build/New Build (Refurbished) Dwelling by Design Category by SA4 Region (excluding in-kind arrangements)341
SDA Design Category
Location Improved Liveability
High Physical Support
Robust Fully
Accessible Total
ACT - - - - -
ACT - Australian Capital Territory - - - - -
NSW 90 26 15 69 200
NSW - Capital Region - 1 1 - 2
NSW - Central Coast - - - 1 1
NSW - Central West 1 5 2 - 8
NSW - Coffs Harbour - Grafton 1 - - - 1
NSW - Far West and Orana - - - - -
NSW - Hunter Valley exc Newcastle 4 - 2 - 6
NSW - Illawarra 7 - - - 7
NSW - Mid North Coast 4 - 6 - 10
NSW - Murray 3 - - - 3
NSW - New England and North West - - - 6 6
NSW - Newcastle and Lake Macquarie 5 9 - - 14
NSW - Richmond - Tweed 8 5 - - 13
NSW - Riverina 4 1 - - 5
NSW - Southern Highlands and Shoalhaven 1 1 2 - 4
NSW - Sydney - Baulkham Hills and Hawkesbury 5 - - 6 11
NSW - Sydney - Blacktown - - - 9 9
NSW - Sydney - City and Inner South - - - - -
NSW - Sydney - Eastern Suburbs - 1 - - 1
NSW - Sydney - Inner South West 2 1 - - 3
NSW - Sydney - Inner West - - - - -
NSW - Sydney - North Sydney and Hornsby - - - - -
NSW - Sydney - Northern Beaches - - - 4 4
NSW - Sydney - Outer South West 2 - 1 - 3
NSW - Sydney - Outer West and Blue Mountains 9 - - 4 13
NSW - Sydney - Parramatta 17 1 - 10 28
NSW - Sydney - Ryde 1 - 1 29 31
NSW - Sydney - South West 2 1 - - 3
NSW - Sydney - Sutherland 14 - - - 14
NT - - - 8 8
NT - Darwin - - - 8 8
NT - Northern Territory - Outback - - - - -
QLD 19 36 - 30 85
QLD - Brisbane - East - - - - -
QLD - Brisbane - North 1 - - 6 7
QLD - Brisbane - South - - - - -
QLD - Brisbane - West 2 - - - 2
QLD - Brisbane Inner City - - - - -
341 This data does not include accommodation that is being provided under in-kind arrangements or dwellings that are yet to be enrolled.

March 2019 | COAG Disability Reform Council Quarterly Report 329
SDA Design Category
Location Improved Liveability
High Physical Support
Robust Fully
Accessible Total
QLD - Cairns - 2 - - 2
QLD - Darling Downs - Maranoa - - - - -
QLD - Fitzroy - - - 4 4
QLD - Gold Coast - 7 - - 7
QLD - Ipswich 1 15 - - 16
QLD - Logan - Beaudesert 2 - - 1 3
QLD - Mackay - - - - -
QLD - Moreton Bay - North 3 8 - - 11
QLD - Moreton Bay - South - - - - -
QLD - Queensland - Outback - - - - -
QLD - Sunshine Coast - - - - -
QLD - Toowoomba 2 1 - 5 8
QLD - Townsville - 2 - 3 5
QLD - Wide Bay 8 1 - 11 20
SA 4 5 1 1 11
SA - Adelaide - Central and Hills - 1 - - 1
SA - Adelaide - North - 1 1 1 3
SA - Adelaide - South 2 3 - - 5
SA - Adelaide - West 2 - - - 2
SA - Barossa - Yorke - Mid North - - - - -
SA - South Australia - Outback - - - - -
SA - South Australia - South East - - - - -
TAS 2 - 1 5 8
TAS - Hobart - - - - -
TAS - Launceston and North East 2 - 1 1 4
TAS - South East - - - - -
TAS - West and North West - - - 4 4
VIC 13 26 8 22 69
VIC - Ballarat - 1 - - 1
VIC - Bendigo 4 - 4 - 8
VIC - Geelong 2 3 - 5 10
VIC - Hume - - - - -
VIC - Latrobe - Gippsland - - - - -
VIC - Melbourne - Inner - 6 - - 6
VIC - Melbourne - Inner East - - 1 - 1
VIC - Melbourne - Inner South - - 1 - 1
VIC - Melbourne - North East - 10 - - 10
VIC - Melbourne - North West - - - - -
VIC - Melbourne - Outer East - - - 4 4
VIC - Melbourne - South East 1 2 - 1 4
VIC - Melbourne - West 3 1 - 4 8
VIC - Mornington Peninsula - - 2 - 2
VIC - North West 3 - - 7 10
VIC - Shepparton - 3 - - 3
VIC - Warrnambool and South West - - - 1 1
WA - - - - -

March 2019 | COAG Disability Reform Council Quarterly Report 330
SDA Design Category
Location Improved Liveability
High Physical Support
Robust Fully
Accessible Total
WA - Bunbury - - - - -
WA - Mandurah - - - - -
WA - Perth - Inner - - - - -
WA - Perth - North East - - - - -
WA - Perth - North West - - - - -
WA - Perth - South East - - - - -
WA - Perth - South West - - - - -
WA - Western Australia - Outback - - - - -
WA - Western Australia - Wheat Belt - - - - -
Total 82 77 16 100 381
Table O.7 New Build/New Build (Refurbished) Maximum Residents by Design Category by SA4 Region (excluding in-kind
arrangements)342
New Build Maximum Number of Residents
Location Improved Liveability
High Physical Support
Robust Fully
Accessible Total
ACT - - - - -
ACT - Australian Capital Territory - - - - -
NSW 247 41 48 162 498
NSW - Capital Region - 5 5 - 10
NSW - Central Coast - - - 2 2
NSW - Central West 5 6 8 - 19
NSW - Coffs Harbour - Grafton 5 - - - 5
NSW - Far West and Orana - - - - -
NSW - Hunter Valley exc Newcastle 13 - 10 - 23
NSW - Illawarra 22 - - - 22
NSW - Mid North Coast 11 - 7 - 18
NSW - Murray 7 - - - 7
NSW - New England and North West - - - 15 15
NSW - Newcastle and Lake Macquarie 25 9 - - 34
NSW - Richmond - Tweed 10 7 - - 17
NSW - Riverina 5 3 - - 8
NSW - Southern Highlands and Shoalhaven 4 1 10 - 15
NSW - Sydney - Baulkham Hills and Hawkesbury 25 - - 17 42
NSW - Sydney - Blacktown - - - 42 42
NSW - Sydney - City and Inner South - - - - -
NSW - Sydney - Eastern Suburbs - 1 - - 1
NSW - Sydney - Inner South West 10 5 - - 15
NSW - Sydney - Inner West - - - - -
NSW - Sydney - North Sydney and Hornsby - - - - -
342 This data does not include accommodation that is being provided under in-kind arrangements or dwellings that are yet to be enrolled.

March 2019 | COAG Disability Reform Council Quarterly Report 331
New Build Maximum Number of Residents
Location Improved Liveability
High Physical Support
Robust Fully
Accessible Total
NSW - Sydney - Northern Beaches - - - 10 10
NSW - Sydney - Outer South West 8 - 5 - 13
NSW - Sydney - Outer West and Blue Mountains 9 - - 8 17
NSW - Sydney - Parramatta 52 2 - 20 74
NSW - Sydney - Ryde 5 - 3 48 56
NSW - Sydney - South West 9 2 - - 11
NSW - Sydney - Sutherland 22 - - - 22
NT - - - 16 16
NT - Darwin - - - 16 16
NT - Northern Territory - Outback - - - - -
QLD 31 44 - 47 122
QLD - Brisbane - East - - - - -
QLD - Brisbane - North 3 - - 12 15
QLD - Brisbane - South - - - - -
QLD - Brisbane - West 2 - - - 2
QLD - Brisbane Inner City - - - - -
QLD - Cairns - 4 - - 4
QLD - Darling Downs - Maranoa - - - - -
QLD - Fitzroy - - - 4 4
QLD - Gold Coast - 7 - - 7
QLD - Ipswich 1 15 - - 16
QLD - Logan - Beaudesert 3 - - 5 8
QLD - Mackay - - - - -
QLD - Moreton Bay - North 3 8 - - 11
QLD - Moreton Bay - South - - - - -
QLD - Queensland - Outback - - - - -
QLD - Sunshine Coast - - - - -
QLD - Toowoomba 4 3 - 6 13
QLD - Townsville - 4 - 8 12
QLD - Wide Bay 15 3 - 12 30
SA 10 11 2 2 25
SA - Adelaide - Central and Hills - 4 - - 4
SA - Adelaide - North - 4 2 2 8
SA - Adelaide - South 4 3 - - 7
SA - Adelaide - West 6 - - - 6
SA - Barossa - Yorke - Mid North - - - - -
SA - South Australia - Outback - - - - -
SA - South Australia - South East - - - - -
TAS 4 - 1 14 19
TAS - Hobart - - - - -
TAS - Launceston and North East 4 - 1 4 9
TAS - South East - - - - -
TAS - West and North West - - - 10 10
VIC 28 39 20 50 137
VIC - Ballarat - 3 - - 3
VIC - Bendigo 4 - 4 - 8

March 2019 | COAG Disability Reform Council Quarterly Report 332
New Build Maximum Number of Residents
Location Improved Liveability
High Physical Support
Robust Fully
Accessible Total
VIC - Geelong 5 7 - 5 17
VIC - Hume - - - - -
VIC - Latrobe - Gippsland - - - - -
VIC - Melbourne - Inner - 6 - - 6
VIC - Melbourne - Inner East - - 5 - 5
VIC - Melbourne - Inner South - - 5 - 5
VIC - Melbourne - North East - 10 - - 10
VIC - Melbourne - North West - - - - -
VIC - Melbourne - Outer East - - - 12 12
VIC - Melbourne - South East 2 4 - 4 10
VIC - Melbourne - West 11 3 - 4 18
VIC - Mornington Peninsula - - 6 - 6
VIC - North West 6 - - 20 26
VIC - Shepparton - 6 - - 6
VIC - Warrnambool and South West - - - 5 5
WA - - - - -
WA - Bunbury - - - - -
WA - Mandurah - - - - -
WA - Perth - Inner - - - - -
WA - Perth - North East - - - - -
WA - Perth - North West - - - - -
WA - Perth - South East - - - - -
WA - Perth - South West - - - - -
WA - Western Australia - Outback - - - - -
WA - Western Australia - Wheat Belt - - - - -
Total 320 135 71 291 817

The material in this document, with the exception of logos, trademarks, third party materials and other content as specified is licensed under Creative Commons CC-BY-NC-ND licence, version 4.0 International. You may share, copy and redistribute the document in any format. You must acknowledge the National Disability Insurance Agency as the owner of all intellectual property rights in the reproduced material by using ‘© National Disability Insurance Scheme Launch Transition Agency 2017’ and you must not use the material for commercial purposes.
If you remix, transform or build upon the material contained in this document, you must not distribute the modified material.
The National Disability Insurance Agency expects that you will only use the information in this document to benefit people with disability.