
Quarterly Report Form
26
Corpus Christi Air Monitoring and Surveillance Camera Installation and Operation Project Quarterly Report for the Period October 1, 2006 through December 31, 2006 Submitted to Judge Janis Graham Jack US District Court for the Southern District of Texas Corpus Christi, Texas Ms. Kathleen Aisling US Environmental Protection Agency, Region 6 Dallas, Texas Ms. Susan Clewis Texas Commission on Environmental Quality, Region 14 Corpus Christi, Texas Submitted by David Allen, Ph.D. Principal Investigator Center for Energy and Environmental Resources The University of Texas at Austin 10100 Burnet Road, Bldg 133 (R7100) Austin, TX 78758 512/475-7842 [email protected] February 26, 2007 1
Transcript of Quarterly Report Form

Corpus Christi Air Monitoring and Surveillance Camera Installation and Operation Project
Quarterly Report for the Period
October 1, 2006 through December 31, 2006
Submitted to
Judge Janis Graham Jack US District Court for the Southern District of Texas
Corpus Christi, Texas
Ms. Kathleen Aisling US Environmental Protection Agency, Region 6
Dallas, Texas
Ms. Susan Clewis Texas Commission on Environmental Quality, Region 14
Corpus Christi, Texas
Submitted by
David Allen, Ph.D. Principal Investigator
Center for Energy and Environmental Resources The University of Texas at Austin
10100 Burnet Road, Bldg 133 (R7100) Austin, TX 78758
512/475-7842 [email protected]
February 26, 2007
1

I. Introduction
On October 1, 2003, the US District Court for the Southern District of Texas issued an order to the Clerk of the Court to distribute funds in the amount of $6,700,000, plus interest accrued, to The University of Texas at Austin (UT Austin) to implement the court ordered condition of probation (COCP) project Corpus Christi Air Monitoring and Surveillance Camera Installation and Operation (Project). This quarterly report has been prepared pursuant to the requirements of the project and is being submitted to the US District Court, the US Environmental Protection Agency (EPA), and the Texas Commission on Environmental Quality (TCEQ). II. Project Progress Report
The focus of work during the quarter ending December 31, 2006 has been directed to the following activities. A. Operations and Maintenance Phase of the Project A detailed description of some data analyses appear in Appendix A, page 7, and a summary of these analyses appears in this section. The COCP consists of a network of seven (7) air monitoring stations with air monitoring instruments and surveillance camera equipment as shown in Table 1, page 2. A map showing locations of COCP monitoring sites along with TCEQ sites and a site operated by Texas A&M at Kingsville (TAMUK) appears in Figure 1, page 3. TCEQ and TAMUK sites provide meteorological data.
Table 1. Schedule of COCP Air Monitoring Sites, Locations and Major Instrumentation
Auto GCTNMHC & Canister H2S & SO2 Met Station Camera
63427.798889º
North97.433889º
West Yes T Yes
62927.817500º
North97.419722º
West T&C Yes Yes
63027.824444º
North97.432500º
West T&C Yes Yes
63527.811389º
North97.465556º
West T&C Yes Yes Yes
63127.845278º
North97.525556º
West T&C Yes Yes
63227.827222º
North97.528889º
West T&C Yes Yes
63327.908333º
North97.542222º
West Yes T Yes Yes Yes
Latitude LongitudeTCEQ CAMS Nos.
Monitoring EquipmentDescription of Site Location
Off Up River Road on Flint Hills Resources EasementSolar Estates Park at end of Sunshine Road
Oak Park Recreation Center
Grain Elevator @ Port of Corpus ChristiJ. I. Hailey Site @ Port of Corpus Christi
Port of Corpus Christi on West End of CC Inner Harbor
TCEQ Monitoring Site C199 @ Dona Park
Legend Auto GC automated gas chromatograph TNMHC total non-methane hydrocarbon analyzer (all except 634 & 633 also have
canister hydrocarbon samplers) H2S hydrogen sulfide analyzer SO2 sulfur dioxide analyzer Met Station meteorology station consisting of measurement instruments for wind speed,
wind direction, ambient air temperature and relative humidity Camera surveillance camera
2

Figure 1 Corpus Christi Monitoring Sites: UT red, TCEQ yellow, TAMUK blue
Canister Sampling and Analysis – Anytime the total non-methane hydrocarbon concentration in the ambient air exceeds 2000 ppbC for a continuous period of 15 minutes or more, the air monitoring system will be “triggered” to automatically collect a sample of the ambient air in a stainless steel canister. The canisters are then sent to UT Austin for analysis of the air sample collected. During the fourth quarter of 2006, 22 canister samples were triggered. Elevated1 total nonmethane hydrocarbon (TNMHC) concentrations at four sites on November 18 caused triggering, and comparable summed speciated concentrations were measured at the Oak Park auto-GC. These may have been associated with refinery start-up and shutdown activities reported in the eastern part of the Ship Channel around that date. More details are provided in Appendix A, page 11. Auto-GC Effects Screening Level Summary – A gas chromatograph (GC) is an instrument used to analyze air samples and determine the specific chemical species (speciation) and their concentration in the air. The two auto GC’s in this network are GCs designed to automatically collect an air sample and perform the speciation for about 55 hydrocarbon chemical species once every hour. When identified in the air, the concentration of chemicals on the TCEQ Effects Screening Level (ESL) are compared to the one-hour ESL value. Two values above the TCEQ’s effects screening level (ESL) for benzene were measured at Oak Park during the 4th quarter (November 3 and December 20), 1 Concentration greater then 2000 parts per billion-carbon (ppbC) for 900 seconds or more.
3

and one was measured at Solar Estates (December 26). No other auto-GC measurement was greater than its respective ESL. Appendix A, pages 15, 16, and 17, contains a statistical summary of several auto-GC hydrocarbon species, as well as a more detailed discussion of ESLs and data interpretation. See also http://www.tceq.state.tx.us/implementation/tox/esl/list_main.html. Comparison of Auto-GC Benzene Concentrations One Year Apart – A comparison of benzene concentrations from the 4th quarter of 2005 and the same quarter in 2006 shows no significant changes in averages. The highest values in 2006 were lower than the highest values in 2005 at Oak Park, however. More details about this comparison appear in Appendix A, page 17. Sulfur Dioxide and Hydrogen Sulfide Concentrations – No measurements above the TCEQ’s 30 minute investigation thresholds were measured during the 4th quarter of 2006 at any site. Quality Assurance Activities – Three recent quality assurance activities are notable.
• First, the instrument maintenance performed at the Solar Estates Auto-GC in July 2006 appears to have paid off in terms of higher data return in the subsequent months.
• Second, the TCEQ sponsored an inter-lab comparison experiment by sending around to various laboratories and auto-GC sites a calibrated pressurized gas bottle containing a “secret” mix of hydrocarbons. All the labs and auto-GCs measured the sample and reported their results. A qualitative assessment concludes that all labs and auto-GCs performed comparably, the exception being one TCEQ auto-GC in Dallas. The UT lab had greater than 30 percent higher readings compared to the theoretical sample concentrations for 3 species on two sample runs (m&p-xylene, o-xylene, and ethane), and greater than 20 percent higher readings for two species on two sample runs (n-butane, benzene), out of 22 species. The Solar Estates and Oak Park auto-GCs also tended to overestimate m&p-xylene and o-xylene, and underestimated acetylene, ethylene, and styrene. These results were not significantly different from those from other labs and from the TCEQ’s auto-GC network.
• Third, the annual audit of all seven sites was conducted in January 2007, and results are being compiled. No obvious problems affecting data quality were found. There may be issues regarding activities near the sites that should be considered when interpreting data. These include:
o infrequent pipeline maintenance activities near J. I. Hailey C630,
o frequent queuing of heavy-duty trucks in the parking lot around Port Grain C629,
o on-going earth-moving and road construction adjacent to Inner Harbor C631,
o continuous operation of a rotary rig well some 100 meters south of FHR C632.
4

B. Scheduled Meetings of the Volunteer Advisory Board
During this quarter the Advisory Board met on October 5, 2006 on the campus of Texas A&M University in Corpus Christi. The three newly appointed Advisory Board Members attended that meeting. Notes from the October 5th meeting are included as Appendix B, page 20. On December 12, 2006, Vincent Torres conducted a tour of the Solar Estates monitoring site and the site located off Up River Road at the Flint Hills facility. Two of the new Advisory Board Members and Ms. Susan Clewis, TCEQ Region 14, participated in that tour. At each of the monitoring sites Mr. Torres and a site operator were available to explain the instrumentation at the sites and to address questions from the group.
C. Project Management and Planning
Project Management and Planning during this period has focused on four (4) major activities.
1. Project Schedule
Operations and maintenance of the seven monitoring sites reporting data via the TCEQ LEADS System is on-going. The data can be accessed and reviewed at the project website (http://www.utexas.edu/research/ceer/ccaqp/).
2. Communication and Reporting
The status of the Project has been communicated through the website, which is operational with portions under continual development, quarterly and annual reports, and at meetings of the Advisory Board. On December 13, 2006, representatives from The University of Texas at Austin presented the Annual Technical and Financial Project Report for the period from October 1, 2005 through September 30, 2006 before Judge Janis Graham Jack, in the U.S. District Court in Corpus Christi, Texas.
3. Budget Monitoring
Budget monitoring during the period has focused on project costs for Phase II - Sites Operation and Maintenance costs. Financial reports for the quarter are included at Appendix C, page 25.
4. Other Contributions
There were no other contributions awarded during this reporting period. III. Financial Report As required, the following financial summary information is provided. Details supporting this financial summary are included in Appendix C, page26.
5
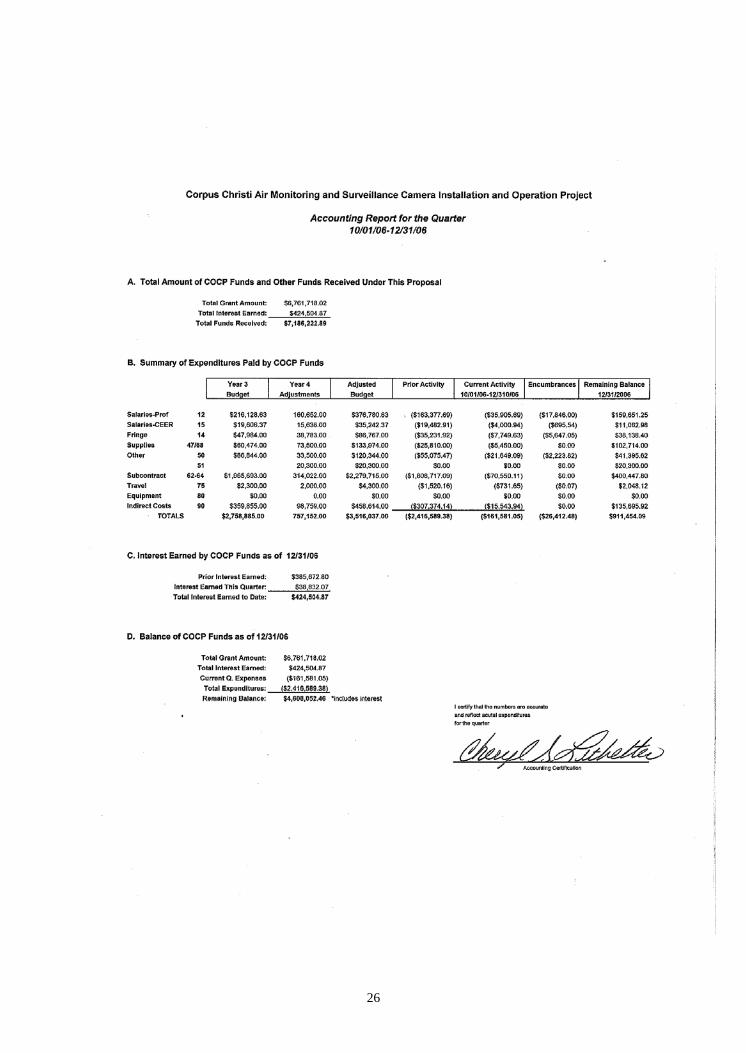
A.Total Amount of COCP Funds and Other Funds Received Under the Project The COCP funds received through December 31, 2006 totals $7,186,222.89. This total includes interest earned through December 31, 2006. B. Detailed List of the Actual Expenditures Paid from COCP Funds Expenditures of COCP funds during this quarter totaled $161,581.05. The detailed breakdown of the actual expenditures is included in Appendix C, page 26. The expenditures being reported for this quarter include adjustments to the University’s general ledger for the 2005/2006 fiscal year close. The activities for which these expenditures were used are detailed in Section II of this report. C. Total Interest Earned on COCP Funds During the Quarter The interest earned during this quarter totaled $38,832.07. A report providing detailed calculations of the interest earned on the COCP funds during each month of the quarter is included in Appendix C, page 26. D. Balance as of December 31, 2006, in the COCP Account The balance in the COCP account, including interest earned totals $4,608,052.46 E. Expected Expenditures for the Funds Remaining in the COCP Account The expected expenditures for the funds remaining totals $4,608,052.46 Quarterly Report Distribution List: U.S. District Court Ms. Shirley Johnson, Assistant Deputy Chief USPO Mr. James Martinez, Supervising USPO Texas Commission on Environmental Quality Ms. Sharon Blue, Litigation Division – Headquarters
Mr. David Brymer, Laboratory and Mobile Monitoring – Headquarters Ms. Susan Clewis, Director – Region 14 Mr. David Turner, Air Monitoring Section – Region 14 Mr. David Kennebeck, Field Operations – Region 14 Environmental Protection Agency
Ms. Kathleen Aisling, Environmental Engineer, Air Enforcement Section, Dallas Regional Office
Members of the Advisory Board
6

APPENDIX A
Data Analysis for Corpus Christi Quarterly Report October 2006 - December 2006
The University of Texas at Austin Center for Energy & Environmental Resources Contact: Dave Sullivan, Ph.D. [email protected](512) 471-7805 office (512) 914-4710 cell
7

This technical report describes results of monitoring and analysis of data under the Corpus Christi Air Quality Project over the period from October 1 through December 31, 2006. The monitoring network is shown in Figure 1 on the following page and described in Table 1 below. This report contains the following analyses:
• an update on canister sampling and assessment; • a summary of hourly speciated hydrocarbon concentrations measured
by automated gas chromatographs (auto-GCs) compared with health effects screening levels;
• a comparison of auto-GC data from the fourth quarter of 2006 to data from the fourth quarter of 2005 as a step in assessing long-term trends.
Table 1 Schedule of Air Monitoring Sites, Locations and Major Instrumentation
Monitoring Equipment TCEQ CAMS#
Description of Site Location
Auto GC TNMHC & Canister H2S&SO2 Met Station Camera
634 Oak Park Recreation Center Yes T Yes
629 Grain Elevator @ Port of Corpus Christi
T&C Yes Yes
630 J. I. Hailey Site @ Port of Corpus Christi
T&C Yes Yes
635 TCEQ Monitoring Site C199 @ Dona Park
T&C Yes Yes Yes
631 Port of Corpus Christi on West End of CC Inner Harbor
T&C Yes Yes
632
Off Up River Road on Flint Hills Resources Easement
T&C Yes Yes
633 Solar Estates Park at end of Sunshine Road
Yes T Yes Yes Yes
Legend
Auto GC automated gas chromatograph TNMHC total non-methane hydrocarbon analyzer (all except 634 & 633 also have
canister hydrocarbon samplers) H2S hydrogen sulfide analyzer SO2 sulfur dioxide analyzer Met Station meteorology station consisting of measurement instruments for wind speed,
wind direction, ambient air temperature and relative humidity Camera surveillance camera
8

Figure 1 Corpus Christi Monitoring Sites – UT red, TCEQ yellow, TAMUK blue
Glossary Glossary of terms
• Pollutant concentrations – Concentrations of most gaseous pollutants are expressed in units denoting their “mixing ratio” in air; i.e., the ratio of the number molecules of the pollutant to the total number of molecules per unit volume of air. Because concentrations for all gases other than molecular oxygen, molecular nitrogen, and argon are very low, the mixing ratios are usually scaled to express a concentration in terms of “parts per million” (ppm) or “parts per billion” (ppb). Sometimes the units are explicitly expressed as ppm-volume (ppmV) or ppb-volume (ppbV). In general, air pollution standards and health effects screening levels are expressed in ppmV or ppbV units. Because hydrocarbon species may have a chemical reactivity related to the number of carbon atoms in the molecule, mixing ratios for these species are often expressed in ppb-carbon (ppbC), to reflect the ratio of carbon atoms in that species to the total number of molecules in the volume. This is relevant to our measurement of auto-GC species and TNMHC, which are reported in ppbC units. For the purpose of relating hydrocarbons to health effects, this report notes hydrocarbon concentrations in converted ppbV units. However, because TNMHC is a composite of all species with different numbers of carbons, it cannot be converted to ppbV. Pollutant concentration measurements are time-stamped based on the start time of the sample, in Central Standard Time (CST), with sample duration noted.
9

• Auto-GC - The automated gas chromatograph collects a sample for 40 minutes, and then automatically analyzes it for some 47 hydrocarbon species. These include benzene and 1,3-butadiene, which are air toxics, various butene species that have relatively low odor thresholds, and a range of gasoline and vehicle exhaust components. Auto-GCs operate at Solar Estates CAMS 633 and Oak Park CAMS 634.
• Total non-methane hydrocarbons (TNMHC) – TNMHC - also often referred to as total non-methane organic compounds (TNMOC) - represent a large fraction of the total volatile organic compounds released into the air by human and natural processes. TNMHC is an unspeciated total of all hydrocarbons, and individual species must be resolved by other means, such as with canisters or auto-GCs. However, the time resolution of the TNMHC instrument is much shorter than the auto-GC, and results are available much faster than with canisters. TNMHC analyzers operate at all seven UT Austin sites. In general, a sustained monitored level of 2000 ppbC has been used to trigger canister samples.
• Canister – Stainless steel canisters are filled with air samples when an independent sensor detects that elevated levels of hydrocarbons (TNMHC) are present. Samples are taken for various lengths of time (generally 20 minutes) to try to capture the chemical make-up of the air. Samples are analyzed in a lab to resolve some 50 – 55 hydrocarbon species. Canister samplers have operated at all seven UT Austin sites, but this quarter only at five.
• Effects Screening Levels (ESLs) – From the TCEQ Web site: “Effects Screening Levels are used to evaluate the potential for effects to occur as a result of exposure to concentrations of constituents in the air. ESLs are based on data concerning health effects, the potential for odors to be a nuisance, effects on vegetation, and corrosive effects. They are not ambient air standards. If predicted or measured airborne levels of a constituent do not exceed the screening level, adverse health or welfare effects are not expected. If ambient levels of constituents in air exceed the screening levels, it does not necessarily indicate a problem but rather triggers a review in more depth.” (Emphasis added.) (Accessed on January 22, 2007: http://www.tceq.state.tx.us/implementation/tox/esl/ESLMain.html .)
10

Canister Sampling and Analysis During the fourth quarter of 2006, 18 canister samples were triggered at the locations, dates, and times shown in Table 2 below. Four additional canisters were triggered later in December but have not been analyzed. The time shown is Central Standard Time (CST), 0:00=midnight, 23:00=11 p.m. Table 2 Valid Canister Samples, sorted by site, 4Q2006 Site CAMS Date Time WindsCCG 629 10/17/06 5:14 NW, 4mphCCG 629 11/18/06 1:15 NE, 4mphCCG 629 12/12/06 18:23 WNW, 4mphCCG 629 12/11/07 23:19 ENE, 3mphDPK 635 11/18/06 2:21 NNE, 3mphFHR 632 11/12/06 23:39 SE, 2mphFHR 632 11/17/06 1:11 SSW, 6mphFHR 632 11/18/06 23:46 ESE, 7mphFHR 632 11/21/06 8:35 E, 9mphFHR 632 12/13/06 9:29 NNW, 4mphJIH 630 10/16/06 13:29 W, 18mphJIH 630 10/19/06 3:10 WSW, 10mphJIH 630 10/29/06 1:02 WSW, 6mphJIH 630 11/06/06 3:25 NE, 3mphJIH 630 11/18/06 0:49 NE, 3mphJIH 630 11/27/06 7:27 NE, 4mphJIH 630 12/12/06 18:16 WNW, 6mphWEH 631 11/16/06 21:40 light&var
The canister analysis procedure is as follows. After a canister is filled at the monitoring site, it is sent to the UT Austin laboratory. The chemist alerts the data analyst, who reviews the wind speed, wind direction, and continuous pollution data from the site around the time the canister sample was taken. If the continuous data suggest the canister may contain data that may help characterize an emission source, then the analyst asks the chemist to chemically analyze the canister. After the lab work is complete, the resulting data are placed in a database from which the analyst may harvest the data. Using the data from one or more canisters, the on-line trajectory tool, the TNMHC data, and in some cases the SO2 or H2S data, and the TCEQ’s emission event on-line data query tool, the analyst tries to assess the source and cause of the pollution. A collection of bar graphs of the samples from November 18, 2006 appears in Figures 2-5 on the following pages. On this date, Port Grain C629 (CCG), Dona Park C635 (DPK), Flint Hills Resources C632 (FHR), and J. I. Hailey C630 (JIH) all were triggered. Species names in these graphs are printed in very small font and may be hard to read – the intent of these graphs is simply to demonstrate how closely the concentration patterns match.
11

Figure 2
Nov. 18, 2:21 CST Dona Park
0
20
40
60
80
100
120
ethyle
ne
acetyle
ne
ethane
propyle
ne
propane
isobutane
1-bute
ne
1,3-b
utadie
ne
butane
trans-2
-bute
ne
cis-2-b
utene
3-meth
yl-1-b
utene
isopentane
1-pente
ne
pentane
isoprene
trans-2
-pente
ne
cis-2-p
entene
2-meth
yl-2-b
utene
2,2-d
imeth
ylbuta
ne
cyclopente
ne
4-meth
yl-1-p
entene
cyclopenta
ne
2,3-d
imeth
ylbuta
ne
2-meth
ylpenta
ne
3-meth
ylpenta
ne
2-meth
yl-1-p
entene
hexane
trans-2
-hexene
cis-2-h
exene
meth
ylcyclo
pentane
2,4-d
imeth
ylpenta
ne
benzene
cyclohexane
2-meth
ylhexane
2,3-d
imeth
ylpenta
ne
3-meth
ylhexane
2,2,4
-trim
ethylp
entane
heptane
meth
ylcyclo
hexane
2,3,4
-trim
ethylp
entane
tolu
ene
2-meth
ylhepta
ne
3-meth
ylhepta
ne
octane
ethylb
enzene
m/p-x
ylene
styre
ne
o-xyle
ne
nonane
isopropylb
enzene
a-pin
ene
n-pro
pylbenze
ne
1,3,5
-trim
ethybenze
ne
1,2,4
-trim
ethylb
enzene
Chemical Species
Con
cent
ratio
n (p
pbC
)
Figure 3
Nov. 18, 1:15 CST Port Grain
0
100
200
300
400
500
600
700
800
900
ethyle
ne
acetyle
ne
ethane
propyle
ne
propane
isobutane
1-bute
ne
1,3-b
utadie
ne
butane
trans-2
-bute
ne
cis-2-b
utene
3-meth
yl-1-b
utene
isopentane
1-pente
ne
pentane
isoprene
trans-2
-pente
ne
cis-2-p
entene
2-meth
yl-2-b
utene
2,2-d
imeth
ylbuta
ne
cyclopente
ne
4-meth
yl-1-p
entene
cyclopenta
ne
2,3-d
imeth
ylbuta
ne
2-meth
ylpenta
ne
3-meth
ylpenta
ne
2-meth
yl-1-p
entene
hexane
trans-2
-hexene
cis-2-h
exene
meth
ylcyclo
pentane
2,4-d
imeth
ylpenta
ne
benzene
cyclohexane
2-meth
ylhexane
2,3-d
imeth
ylpenta
ne
3-meth
ylhexane
2,2,4
-trim
ethylp
entane
heptane
meth
ylcyclo
hexane
2,3,4
-trim
ethylp
entane
tolu
ene
2-meth
ylhepta
ne
3-meth
ylhepta
ne
octane
ethylb
enzene
m/p-x
ylene
styre
ne
o-xyle
ne
nonane
isopropylb
enzene
a-pin
ene
n-pro
pylbenze
ne
1,3,5
-trim
ethybenze
ne
1,2,4
-trim
ethylb
enzene
Chemical Species
Con
cent
ratio
n (p
pbC
)
12

Figure 4
Nov. 18, 00:49 CST J.I. Hailey
0
200
400
600
800
1000
1200
1400
ethyle
ne
acetyle
ne
ethane
propyle
ne
propane
isobutane
1-bute
ne
1,3-b
utadie
ne
butane
trans-2
-bute
ne
cis-2-b
utene
3-meth
yl-1-b
utene
isopentane
1-pente
ne
pentane
isoprene
trans-2
-pente
ne
cis-2-p
entene
2-meth
yl-2-b
utene
2,2-d
imeth
ylbuta
ne
cyclopente
ne
4-meth
yl-1-p
entene
cyclopenta
ne
2,3-d
imeth
ylbuta
ne
2-meth
ylpenta
ne
3-meth
ylpenta
ne
2-meth
yl-1-p
entene
hexane
trans-2
-hexene
cis-2-h
exene
meth
ylcyclo
pentane
2,4-d
imeth
ylpenta
ne
benzene
cyclohexane
2-meth
ylhexane
2,3-d
imeth
ylpenta
ne
3-meth
ylhexane
2,2,4
-trim
ethylp
entane
heptane
meth
ylcyclo
hexane
2,3,4
-trim
ethylp
entane
tolu
ene
2-meth
ylhepta
ne
3-meth
ylhepta
ne
octane
ethylb
enzene
m/p-x
ylene
styre
ne
o-xyle
ne
nonane
isopropylb
enzene
a-pin
ene
n-pro
pylbenze
ne
1,3,5
-trim
ethybenze
ne
1,2,4
-trim
ethylb
enzene
Chemical Species
Con
cent
ratio
n (p
pbC
)
Figure 5
Nov. 18, 23:46 CST FHR Easement
0
20
40
60
80
100
120
140
160
180
ethyle
ne
acetyle
ne
ethane
propyle
ne
propane
isobutane
1-bute
ne
1,3-b
utadie
ne
butane
trans-2
-bute
ne
cis-2-b
utene
3-meth
yl-1-b
utene
isopentane
1-pente
ne
pentane
isoprene
trans-2
-pente
ne
cis-2-p
entene
2-meth
yl-2-b
utene
2,2-d
imeth
ylbuta
ne
cyclopente
ne
4-meth
yl-1-p
entene
cyclopenta
ne
2,3-d
imeth
ylbuta
ne
2-meth
ylpenta
ne
3-meth
ylpenta
ne
2-meth
yl-1-p
entene
hexane
trans-2
-hexene
cis-2-h
exene
meth
ylcyclo
pentane
2,4-d
imeth
ylpenta
ne
benzene
cyclohexane
2-meth
ylhexane
2,3-d
imeth
ylpenta
ne
3-meth
ylhexane
2,2,4
-trim
ethylp
entane
heptane
meth
ylcyclo
hexane
2,3,4
-trim
ethylp
entane
tolu
ene
2-meth
ylhepta
ne
3-meth
ylhepta
ne
octane
ethylb
enzene
m/p-x
ylene
styre
ne
o-xyle
ne
nonane
isopropylb
enzene
a-pin
ene
n-pro
pylbenze
ne
1,3,5
-trim
ethybenze
ne
1,2,4
-trim
ethylb
enzene
Chemical Species
Con
cent
ratio
n (p
pbC
)
An examination of the data from November 18, 2006 suggests that the same emission source was likely to have affected Port Grain C629, J. I. Hailey C630, and Dona Park C635. It is also very possible the same source affected Flint Hills Resources C632 much later in the day. An examination of the auto-GC data at Oak Park C633 suggests that site was affected at 3:00-4:00 CST. Ethane, propane, isobutane, n-butane, isopentane, and n-pentane comprise between 67 and 90 percent of the mass of the four canister samples for those
13

species that canisters have in common with the auto-GC. Figure 6 below shows the relative composition2 of the four canister samples plus the 3 a.m. auto-GC measurement in this normalized manner for the lighter species (2 – 6 carbons). Ethane and propane are very common species in ambient urban air emitted from natural gas leaks and numerous other sources. The other species, however, are related to gasoline vapor and other fuels. Trajectory analyses are inconclusive because of a wind shift that occurred near midnight on November 18. However, a general conclusion based on the location of canister triggers and the ambient data measurement would be that a source in the eastern part of the industrial area may have had unusually high emissions. According to the TCEQ emission event database, a refinery in the area reported a shutdown beginning on November 17 and a start-up beginning November 20. Figure 6 Relative mass of species in common between canisters and auto-GCs
Comparison of Species 11/18/06: 4 Cans & Oak Park Auto-GC
0.00
0.05
0.10
0.15
0.20
0.25
0.30
0.35
ethyle
ne
acety
lene
ethan
e
propy
lene
propa
ne
isobu
tane
1-bute
ne
1,3-bu
tadien
e
butan
e
trans
-2-bu
tene
cis-2-
buten
e
isope
ntane
1-pen
tene
penta
ne
isopre
ne
trans
-2-pe
ntene
cis-2-
pente
ne
2,2-di
methylb
utane
cyclo
penta
ne
hexa
ne
methylc
yclop
entan
e
2,4-di
methylp
entan
e
benz
ene
cyclo
hexa
ne
Lighter Chemical Species
Frac
tion
of m
ass
JIH
CCG
DPK
FHR
Oak(agc)
2 Relative composition based on taking the species in common between cans and auto-GC, summing the species in each sample, and then dividing each species concentration by the sum. All calculation are in ppbC units.
14

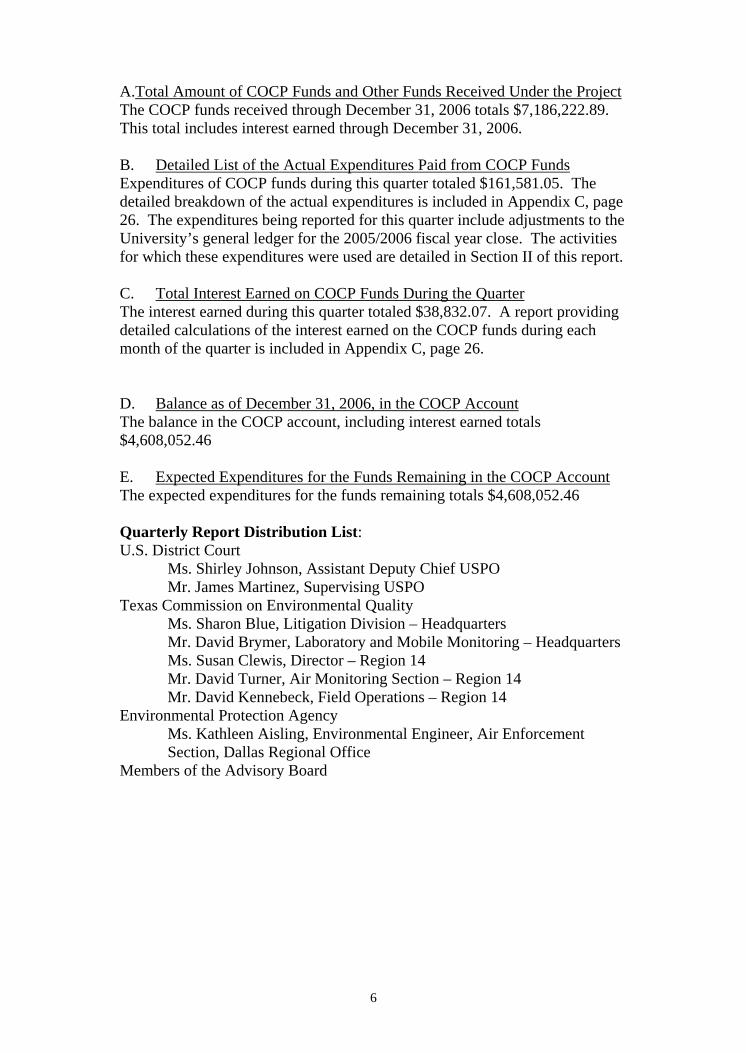
Auto-GC Effects Screening Level Summary The contents of this paragraph are a summary of a TCEQ Web page on Effects Screening Levels (ESLs) accessed at http://www.tceq.state.tx.us/implementation/tox/esl/list_main.html on January 23, 2007. The TCEQ establishes ESLs to evaluate potential for effects to occur as a result of exposure to concentrations of constituents in the air. The ESLs are based on data concerning health effects, potential for odors to be a nuisance, effects on vegetation, and corrosive effects, but ESLs are not ambient air standards. If predicted or measured airborne levels of a constituent do not exceed ESL, adverse health or welfare effects are not expected. If ambient levels of constituents in air exceed ESL, it does not necessarily indicate a problem but rather triggers a review in more depth. Tables 3 – 6, pages 15, 16 and 17, summarize both the 4th quarter of 2006 and the most recent rolling four-quarter (annual) period, which is calendar year 2006. Each table shows the straight arithmetic mean of all observations (approx. 2000 quarterly, 8000 annual), the annual ESL, the 90th and 99th percentiles for observed values, the maximum measured value, and the one-hour ESL. Note that not all data have been validated and are thus subject to change. All values in the following tables are in ppbV units. Several ESLs are odor related. Benzene was the only species measured above an ESL. Table 3 Oak Park 4Q06 Auto-GC Summary ppbV units Oak Park 4th Quarter 2006 Mean Annual ESL p90 p95 Max 1-hour ESL124trimethyl benzene 0.11 25 0.22 0.34 8.20 25013Butadiene 0.08 5 0.15 0.22 8.66 501Butene 0.25 7 0.62 1.28 5.31 701Pentene 0.11 3 0.27 0.41 2.34 30Benzene 1.14 1 2.38 5.49 26.32 25Cumene 0.05 10 0.17 0.35 2.13 100Cyclohexane 0.34 42 1.01 1.47 7.72 420Ethane 11.72 1000 26.60 39.45 185.78 10000EthylBenzene 0.10 46 0.21 0.31 2.15 460Ethylene 1.48 102 3.63 5.67 61.38 1022Isobutane 4.01 800 11.41 15.51 75.91 8000Isopentane 4.08 120 11.14 15.38 65.42 1200Propane 9.63 1000 27.14 36.27 181.65 10000Propylene 1.47 --- 4.36 8.28 30.44 68100Toluene 0.98 50 2.07 2.90 23.24 500c2Butene 0.21 60 0.51 1.09 4.84 600c2Pentene 0.08 3 0.23 0.35 1.42 30mpXylene 0.34 48 0.75 1.04 8.57 480nButane 5.87 800 14.57 21.01 353.35 8000nHexane 0.92 50 2.53 3.62 47.26 500nPentane 2.87 120 7.78 11.97 57.35 1200oXylene 0.11 85 0.23 0.33 2.25 850t2Butene 0.36 60 0.77 1.61 6.60 600t2Pentene 0.16 3 0.44 0.67 1.96 30
15
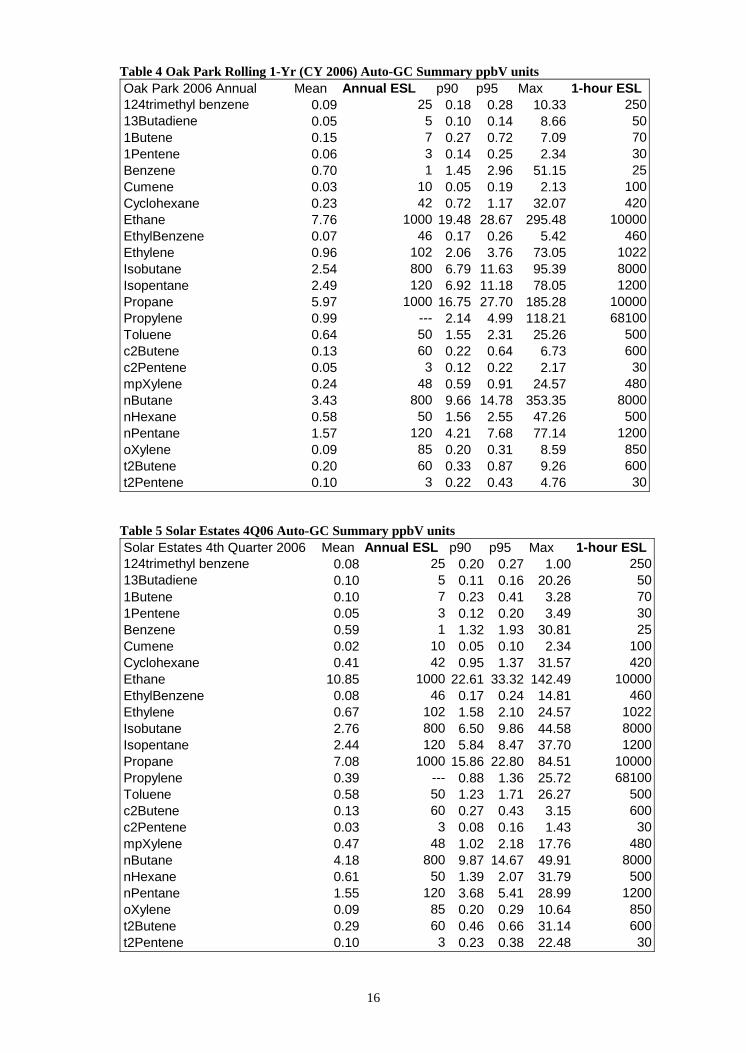
Table 4 Oak Park Rolling 1-Yr (CY 2006) Auto-GC Summary ppbV units Oak Park 2006 Annual Mean Annual ESL p90 p95 Max 1-hour ESL124trimethyl benzene 0.09 25 0.18 0.28 10.33 25013Butadiene 0.05 5 0.10 0.14 8.66 501Butene 0.15 7 0.27 0.72 7.09 701Pentene 0.06 3 0.14 0.25 2.34 30Benzene 0.70 1 1.45 2.96 51.15 25Cumene 0.03 10 0.05 0.19 2.13 100Cyclohexane 0.23 42 0.72 1.17 32.07 420Ethane 7.76 1000 19.48 28.67 295.48 10000EthylBenzene 0.07 46 0.17 0.26 5.42 460Ethylene 0.96 102 2.06 3.76 73.05 1022Isobutane 2.54 800 6.79 11.63 95.39 8000Isopentane 2.49 120 6.92 11.18 78.05 1200Propane 5.97 1000 16.75 27.70 185.28 10000Propylene 0.99 --- 2.14 4.99 118.21 68100Toluene 0.64 50 1.55 2.31 25.26 500c2Butene 0.13 60 0.22 0.64 6.73 600c2Pentene 0.05 3 0.12 0.22 2.17 30mpXylene 0.24 48 0.59 0.91 24.57 480nButane 3.43 800 9.66 14.78 353.35 8000nHexane 0.58 50 1.56 2.55 47.26 500nPentane 1.57 120 4.21 7.68 77.14 1200oXylene 0.09 85 0.20 0.31 8.59 850t2Butene 0.20 60 0.33 0.87 9.26 600t2Pentene 0.10 3 0.22 0.43 4.76 30
Table 5 Solar Estates 4Q06 Auto-GC Summary ppbV units Solar Estates 4th Quarter 2006 Mean Annual ESL p90 p95 Max 1-hour ESL124trimethyl benzene 0.08 25 0.20 0.27 1.00 25013Butadiene 0.10 5 0.11 0.16 20.26 501Butene 0.10 7 0.23 0.41 3.28 701Pentene 0.05 3 0.12 0.20 3.49 30Benzene 0.59 1 1.32 1.93 30.81 25Cumene 0.02 10 0.05 0.10 2.34 100Cyclohexane 0.41 42 0.95 1.37 31.57 420Ethane 10.85 1000 22.61 33.32 142.49 10000EthylBenzene 0.08 46 0.17 0.24 14.81 460Ethylene 0.67 102 1.58 2.10 24.57 1022Isobutane 2.76 800 6.50 9.86 44.58 8000Isopentane 2.44 120 5.84 8.47 37.70 1200Propane 7.08 1000 15.86 22.80 84.51 10000Propylene 0.39 --- 0.88 1.36 25.72 68100Toluene 0.58 50 1.23 1.71 26.27 500c2Butene 0.13 60 0.27 0.43 3.15 600c2Pentene 0.03 3 0.08 0.16 1.43 30mpXylene 0.47 48 1.02 2.18 17.76 480nButane 4.18 800 9.87 14.67 49.91 8000nHexane 0.61 50 1.39 2.07 31.79 500nPentane 1.55 120 3.68 5.41 28.99 1200oXylene 0.09 85 0.20 0.29 10.64 850t2Butene 0.29 60 0.46 0.66 31.14 600t2Pentene 0.10 3 0.23 0.38 22.48 30
16

Table 6 Solar Estates Rolling 1-Yr (CY 2006) Auto-GC Summary ppbV units Solar Estates 2006 Annual Mean Annual ESL p90 p95 Max 1-hour ESL124trimethyl benzene 0.06 25 0.13 0.20 2.68 25013Butadiene 0.09 5 0.08 0.12 24.77 501Butene 0.06 7 0.12 0.21 3.28 701Pentene 0.03 3 0.06 0.11 3.49 30Benzene 0.37 1 0.83 1.27 30.81 25Cumene 0.01 10 0.03 0.06 2.34 100Cyclohexane 0.28 42 0.68 1.05 31.57 420Ethane 8.24 1000 18.15 25.61 142.49 10000EthylBenzene 0.05 46 0.13 0.18 14.81 460Ethylene 0.44 102 1.06 1.53 24.57 1022Isobutane 2.20 800 4.81 7.39 54.36 8000Isopentane 1.79 120 4.34 6.32 39.94 1200Propane 5.26 1000 11.94 17.90 117.02 10000Propylene 0.46 --- 0.90 2.09 51.13 68100Toluene 0.40 50 0.92 1.29 26.27 500c2Butene 0.09 60 0.15 0.26 12.47 600c2Pentene 0.02 3 0.05 0.10 1.43 30mpXylene 0.31 48 0.57 1.11 32.69 480nButane 2.80 800 6.73 10.19 60.85 8000nHexane 0.43 50 1.02 1.48 31.79 500nPentane 1.10 120 2.69 3.85 28.99 1200oXylene 0.06 85 0.15 0.22 10.64 850t2Butene 0.20 60 0.31 0.42 31.14 600t2Pentene 0.05 3 0.12 0.22 22.48 30
Comparison of Auto-GC Benzene Concentrations One Year Apart In this section appears a comparison between quarterly benzene concentrations at the two auto-GCs from late 2005 and late 2006. The quarterly mean benzene concentration was slightly higher at Solar Estates in 2006, and the quarterly mean benzene concentration was slightly lower at Oak Park in 2006. This year to year variation in quarterly means was not statistically significant. However, in looking at the highest values, one observes in Figures 7 and 8 below that at Oak Park there were only two values above the ESL in 2006 compared with seven in 2005. There were slightly fewer hours with northerly winds in 2006, but wind speeds and the distribution of wind directions were not practically or significantly different from year to year. Table 7 Comparison of Quarterly Mean Benzene and Northerly Winds, 4Q 2005 vs 4Q 2006 Results Oak 4Q 2005 Oak 4Q 2006 Solar 4Q 2005 Solar 4Q 2006 Benzene ppbV 1.30 1.14 0.45 0.59 WDR % northerly 50.3% 46.5% 48.7% 45.9% Overall, there is no evidence without doing more rigorous analysis that benzene emissions have changed from the 4th quarter of 2005 versus 2006. However, the drop in number of values over the ESL at Oak Park is a positive outcome.
17

The mean values for benzene and for nearly all hydrocarbon species at the two Corpus Christi auto-GCs are higher in the first quarter and last quarter of the year compared to the annual means because of a higher incidence of winds from the north during the winter months. Thus, the annual mean at Oak Park for benzene is 0.7 ppbV despite averaging above 1.0 ppbV during the 4th quarter of 2006. The time series graphs for benzene appear in Figures 7 and 8, page 19. A red line is drawn to show the 25 ppbV short-term ESL. Values over the ESL were measured at Oak Park in the 4th quarter of 2006: on November 3 under NNE winds, and on December 20 under NNE winds. One value over the ESL was measured at Solar Estates on December 26 with SSE winds.
18

19

APPENDIX B
Voluntary Advisory Board Meeting October 5, 2006
Meeting Notes
20

ADVISORY BOARD MEETING Corpus Christi Air Monitoring and Surveillance Camera Installation
and Operation Project Texas A&M University - Corpus Christi
Room 1003, NRC Building 1:30 pm – 3:30 pm
October 5, 2006 Advisory Board Members Present: Ms. Gretchen Arnold Corpus Christi Pollution Prevention Partnership – TAMUCC Mr. Ron Barnard City of Corpus Christi Dr. William Burgin Corpus Christi-Nueces County Public Health District Ms. Charlotte Knesek Corpus Christi Community Advisory Committee Ms. Joyce Jarmon Corpus Christi Community Council Dr. Glen Kost Public Health Awareness Ms. Pat Suter Coastal Bend Sierra Club Project Personnel Present: Ms. Kathleen Aisling EPA – Region 6 Ms. Sheila Johnson Probation Office - US District Court Mr. James Martinez Probation Office - US District Court Dr. David Allen Principal Investigator, The University of Texas at Austin Mr. Vince Torres The University of Texas at Austin Dr. David Sullivan The University of Texas at Austin Mr. David Brymer TCEQ Headquarters – Austin Ms. Susan Clewis TCEQ – Region 14 Mr. David Kennebeck TCEQ – Region 14 Mr. David Turner TCEQ – Region 14 Mr. Ken Rozacky TCEQ Headquarters – Austin
Mr. Roger Ramon AQSI/Air Quality Solutions, Inc. Mr. Mitchell Hines AQSI/Air Quality Solutions, Inc. I. Call to Order and Welcome
Vince Torres called the meeting to order at 1:35 pm. He welcomed Ms. Kathleen Aisling from EPA, Region 6 office and the three new Advisory Board Members. Self introductions were given by the attendees. During the meeting the three new board members introduced themselves and told the meeting attendees of their background and involvement with the Corpus Christi community. At the convenience of the new board members Mr. Torres will arrange a time for an orientation and visit to one or more of the air monitoring stations. The orientation and site visit will be offered to any members of the board who would like to participate. Ms. Susan Clewis, TCEQ Region 14, will participate in the orientation and site visit.
II.A. Project Overview and Status - Presented by Dr. David Allen
Dr. Allen presented a history of the funding for the project and an overview of the selection of the locations of the sites and the installation of the seven air monitoring
21

stations along the Corpus Christi ship channel. Discussions about the current operations of the air monitoring stations and the additional funding from TCEQ’s Supplemental Environmental Projects that has allowed the Corpus Christi Air Monitoring Stations to operate for an additional year followed. Dr. Kost mentioned the need to pursue additional sources of funding to support continuation of the monitoring effort and/or enhancement of the capabilities at the monitoring stations. Through the US Department of Homeland Security $8.8 million in funding is available to address security issues in the Port of Corpus Christi. Dr Kost suggested we possibly explore with other agencies to cooperate and work together on this new grant. Ron Barnard invited Vince to Corpus Christi to visit with John LaRue who oversees the funding under the Port Security Grant Program.
II.B. Project Overview and Status - Presented by Dr. David Sullivan Dr. Sullivan presented an update and analysis of the data collected at the seven monitoring stations. Discussions about better source mapping for larger and smaller sources of possible contaminants followed. Ron Barnard mentioned that Texas A&M Kingsville has done some work in this area. A&M Kingsville may have some additional information for locating different types of pollutants and locations of possible sources, such as gas stations, etc. Dr. Sullivan will be in touch with Ron Barnard and David Turner about the possibilities for more updated and detailed source mapping for the Corpus Christi area. Dr. Kost suggested that with the four incidents with ship barge loading and unloading at the harbor, a camera at one of the harbor sites would be beneficial. He would like to know if TCEQ can do collaborative work with the ship barge companies, if possible. He would rather see TCEQ be pro-active in this area rather than reactive. David Turner mentioned that the best site for a camera would be the site at the West End of the Inner Harbor. He saw this as a beneficial tool for determining what was occurring and where in an effort to determine that operations are occurring in compliance with regulations. Dave Turner doesn’t even know if the ships are in violation. There is possible concern. TCEQ doesn’t know what is being loaded and/or unloaded from the ship barges we believe these activities are regulated by the Corpus Christ Port Authority. With the tools they have, TCEQ can check against the records (on what was allowed and/or how much was allowed) to see if the ships exceeded this limit or if it was within the recommend levels. He suggested that TCEQ doesn’t make the rules on possible ship emissions. Discussions about the reported findings at the JI Hailey site followed. Pat Suter asked about the length of time of one incident at the JI Hailey Site. She was interested in knowing was this an unusual incident or something that happened regularly? David Turner indicated the incident lasted between 24 and 36 hours. In discussions, interest was expressed in whether more instrumentation or a better site would be more beneficial. It was determined that every site has some type of problem related to its location – i.e., there is no such thing as a “perfect site”. In response to Board interest, during discussions about ambient methane analysis Dr. Kost mentioned that construction for a new pipeline was underway at the location near Equistar and the Celanese facility. He mentioned the placement of the new pipeline is near an elementary school and new residential housing development and is a matter of great concern. Vince requested Dave Sullivan to pursue obtaining additional information on local sources of possible concern, especially where the new school is located and children may be affected. Pat Suter mentioned that there are old landfills close to the area that may be the cause for some higher levels in the data.
22

David Turner mentioned that in evaluating the ambient air quality standard the TCEQ has not found anything that is of regulatory concern. Vince Torres mentioned that UT will work with TCEQ to develop an emissions inventory of small sources such as gasoline stations, rotary rigs, incinerators, etc. that may be sources of pollution detected by monitors.
III. Related Matters III.A. Presentation of Data to the Long Term Health Group Vince Torres reported that David Sullivan made a presentation today to the Long Term
Health Group. The information presented to the Group is available on the web and will be part of the data analysis information in each quarterly report for the Air Monitoring and Surveillance Camera Project.
III-B Update on the Industry Notification Process and related SEP Project Activities
In the June 2006 Advisory Board Meeting it was announced that the TCEQ has awarded a new Supplemental Environmental Project (SEP) to the University. This new SEP project will assist with the completion of the following tasks: 1) Enhance the automated trajectory tool 2) Power loss software applications 3) Canister analysis 4) Source directionality filter at Flint Hills Up River Rd. Site
With the enhancement of the Trajectory Tool an automated alert messaging system will be
developed. When TNMHC levels are equal to or greater than 2000 ppbC, the messaging system will send data and a wind back trajectory map in a message to the TCEQ to notify them of the chemicals of concern and the level that triggered the alert.
Dr. Kost mentioned his strong support of the efforts of the Corpus Christi Air Monitoring Project but wanted to emphasis the overwhelming need to provide information and data to support the health needs and health issues that are so important to the Corpus Christi residential community. Dr. Kost felt the messaging system has the potential to convey information that could be very beneficial in addressing matters of concern with regard to health issues. The process for obtaining additional SEP funds was described by David Turner. Vince Torres mentioned that the Advisory Group has indicated their desire to be proactive about an industry notification tool and Judge Jack has indicated her approval of industry involvement in development of the notification process. Vince Torres has met with prospective industry participants who have expressed an interest in participating in the notification messaging system. Once the enhancements to the Trajectory Tool are available, the University with input from the Board and the TCEQ, will prepare a proposal for the notification process and the role of the industry partners. That proposal will be sent to Judge Jack for review and approval, as appropriate. David Brymer mentioned that the industry notification tool design should be a two-way communication model much like the tool in use in the Houston area. Once an alert is triggered using the notification/trajectory tool the message is sent to industry and industry must respond to that message. Vince said that this would also be a feature of the notification system.
III.C. Third Annual Report to the Court
23

The next presentation of an annual report before the US District Court will be in November or December, 2006. (The presentation of the annual report has now been set for Wednesday, December 13, 2006.) Vince Torres mentioned that Gretchen Arnold and Ron Barnard as spokespersons for the Board will be presenting a statement at the presentation of the Annual Report, on behalf of the Board. Should any of the Board or project personnel wish to attend the presentation of the Annual Report, the location, time and date of that meeting will be announced once it has been set. Dr. Allen mentioned that in the first report to Judge Jack, we reported on the establishment of the sites and the Judge visited a couple of the monitoring sites. In the second report we reported on the findings with six months of data capture to analyze. This third report should show that we are routinely getting good data capture and our plans for the final phase, which is how we manage and analyze the information generated by the Project.
Vince inquired to see if anyone on the board, including the new board members, would be interested in acting as Secretary for the Board. As Secretary they would take notes for the Board and compare those notes with the notes taken by MaryAnn Foran to work together to develop the official notes of all Board meetings. Vince asked that nominations, including self nominations, be sent to him or to MaryAnn. Vince asked for any additional discussion from the audience. The meeting adjourned at 3:45 pm. Action Items:
·Orientation and site visit in Corpus Christi for new Advisory Board Members
·Vince Torres will meet with Ron Barnard and John LaRue regarding the Port Security Grant Program
·Dave Sullivan will be in touch with Ron Barnard and Dave Turner about updated and more detailed source mapping for the Corpus Christi area
·Dave Sullivan is to pursue obtaining information on the local sources of concern about the installation of new pipeline in close proximity to existing and new schools
·Once the enhancements to the Trajectory Tool are available, with input from the Board and the TCEQ, a proposal for the notification process and the role of the industry partners will be sent to Judge Jack
·Vince Torres will work with TCEQ to develop a small source emissions inventory that may be a source of pollutants being detected by the monitors
24

APPENDIX C
Financial Report of Expenditures Financial Report of Interest Earned
25
26


![FORM 10-Q [ X ] QUARTERLY REPORT PURSUANT TO SECTION 13 … · united states securities and exchange commission washington, d.c. 20549 form 10-q (mark one) [ x ] quarterly report](https://static.fdocuments.us/doc/165x107/5b18380d7f8b9a28258b91ff/form-10-q-x-quarterly-report-pursuant-to-section-13-united-states-securities.jpg)


