Quarterly Report Fiscal Year 2012-2013 2nd Quarter 2nd... · Quarterly Report Fiscal Year 2012-2013...
18
City of Chandler Economic Development Division Quarterly Report Fiscal Year 2012-2013 2nd Quarter
Transcript of Quarterly Report Fiscal Year 2012-2013 2nd Quarter 2nd... · Quarterly Report Fiscal Year 2012-2013...

City of Chandler
Economic Development Division
Quarterly Report Fiscal Year 2012-2013 2nd Quarter

INDEX
Table of Contents INTRODUCTION .............................................................................................. 3
ECONOMIC DEVELOPMENT OUTLOOK .................................................... 5
ECONOMIC TRENDS ..................................................................................... 7
RETAIL ............................................................................................................. 9
INDUSTRIAL/OFFICE DEVELOPMENT ....................................................... 12
TOURISM ........................................................................................................ 16
2 Economic Development Division June 2, 2014

INTRODUCTION
Economic development activity continued on a positive trend during the second quarter. For the quarter ending December 31, 2012, Economic Development staff combined efforts identified 3,835 leads, and 21 prospects, representing an estimated 878 jobs, occupying approximately 521,788 square feet of space and $35.3 million in capital investments.
2nd Quarter Combined Efforts Retail Industrial/Office Tourism Total
Leads 14 34 3,787 3835 Prospects 11 10 21
Jobs 70 808 878 Square Footage 13,500 508,288 521,788
Capital Investment $35,300,225 $35,300,225 Retail: During the second quarter, Economic Development Retail staff continues to work with developers, brokers, and shopping center owners on major retail developments while tracking all existing retail centers and tenants, including those projects under construction or planned. Staff continues to work with clients by keeping track of when the construction permits are reviewed and issued. Industrial/Office: During the first quarter, Industrial and Office staff attended several sales missions and prospecting trips to market Chandler’s message to a broader audience and provide insight into existing development opportunities in the City of Chandler. Sales missions, trade shows, and prospecting trips provide staff with the chance to discern the type of data and resources the brokerage and development community needs, thereby facilitating the attraction of quality stores, restaurants, companies, and recreational opportunities to Chandler. For Q2, Industrial/Office staff participated in the following activities:
Activity Location Date GPEC NY Sales Mission New York, NY October 9-10, 2012
NBAA Trade Show Orlando, FL October 28 - November 2, 2012
TechEDge Chandler, AZ December 12,2012 Tourism: Tourism staff conducted the following trade and media activities for Q2:
Activity Location Date Tourism Stakeholders Meeting Chandler, AZ 25-Sep-12 Arizona Showcase and Hermosillo Media Mission Hermosillo, Sonora October 1-5, 2012
AAA Grand Canyon Railway Pre-FAM Chandler and Tempe, AZ October 23-24, 2012
3 Economic Development Division June 2, 2014
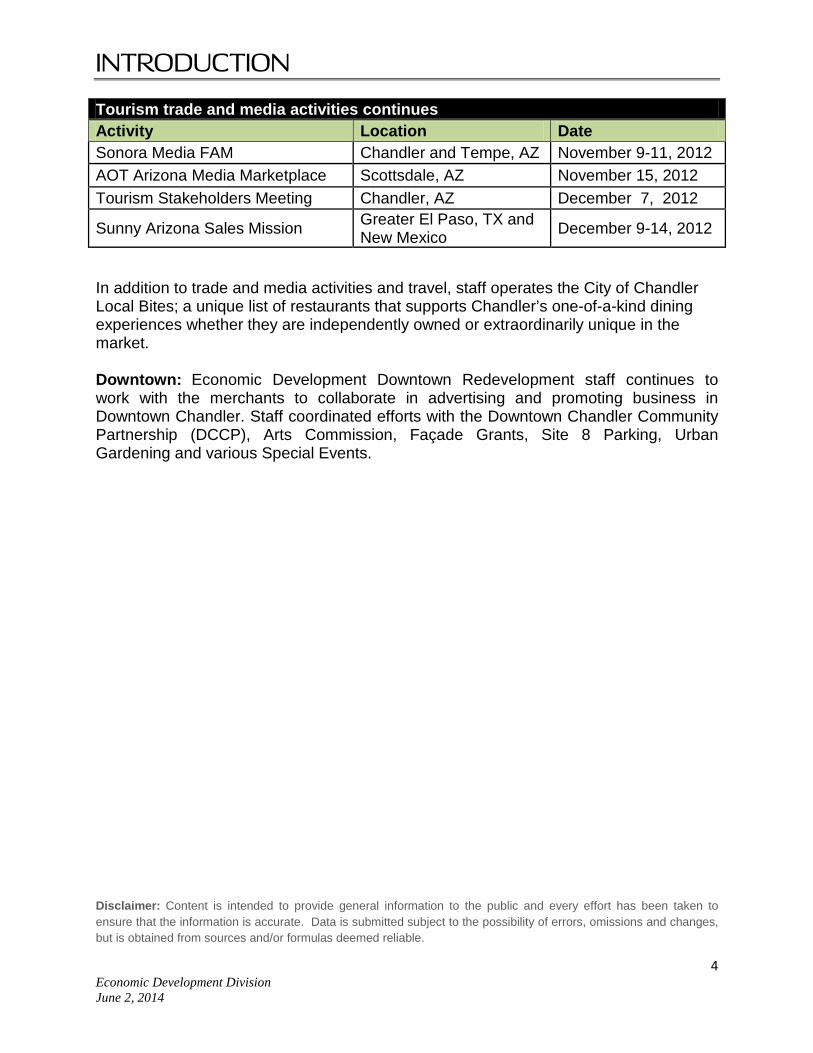
INTRODUCTION Tourism trade and media activities continues Activity Location Date Sonora Media FAM Chandler and Tempe, AZ November 9-11, 2012 AOT Arizona Media Marketplace Scottsdale, AZ November 15, 2012 Tourism Stakeholders Meeting Chandler, AZ December 7, 2012
Sunny Arizona Sales Mission Greater El Paso, TX and New Mexico December 9-14, 2012
In addition to trade and media activities and travel, staff operates the City of Chandler Local Bites; a unique list of restaurants that supports Chandler’s one-of-a-kind dining experiences whether they are independently owned or extraordinarily unique in the market. Downtown: Economic Development Downtown Redevelopment staff continues to work with the merchants to collaborate in advertising and promoting business in Downtown Chandler. Staff coordinated efforts with the Downtown Chandler Community Partnership (DCCP), Arts Commission, Façade Grants, Site 8 Parking, Urban Gardening and various Special Events.
Disclaimer: Content is intended to provide general information to the public and every effort has been taken to ensure that the information is accurate. Data is submitted subject to the possibility of errors, omissions and changes, but is obtained from sources and/or formulas deemed reliable.
4 Economic Development Division June 2, 2014
ECONOMIC DEVELOPMENT OUTLOOK
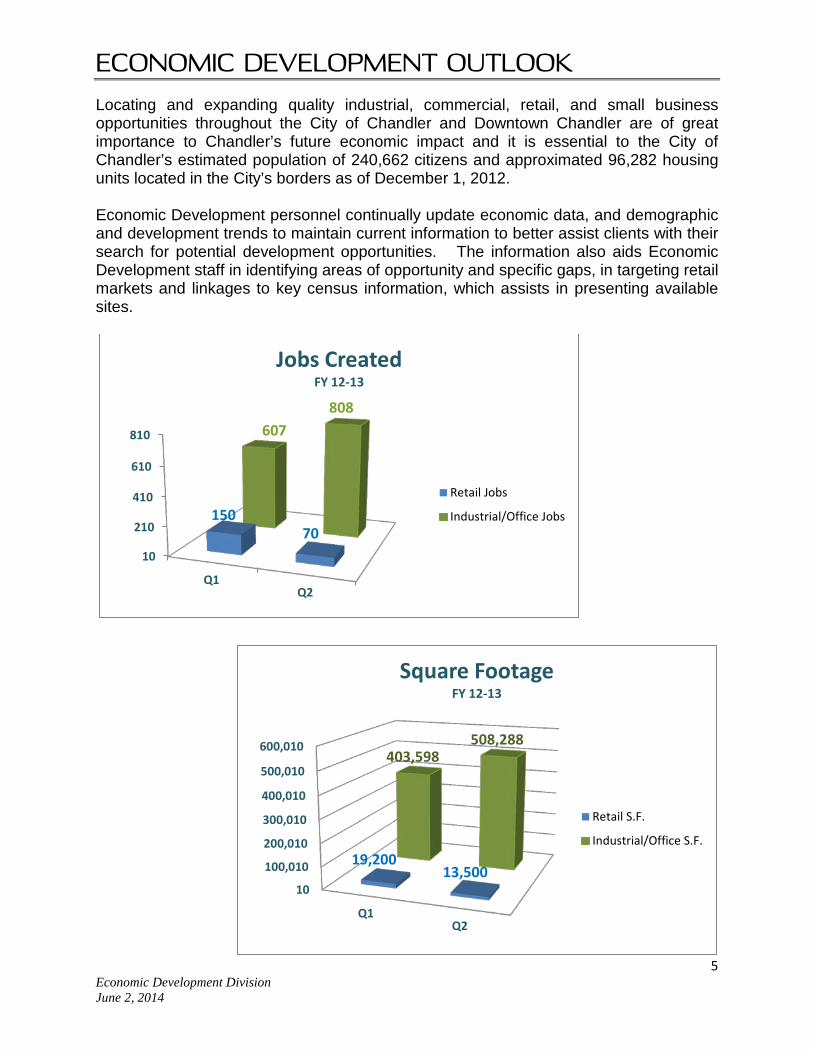
Locating and expanding quality industrial, commercial, retail, and small business opportunities throughout the City of Chandler and Downtown Chandler are of great importance to Chandler’s future economic impact and it is essential to the City of Chandler’s estimated population of 240,662 citizens and approximated 96,282 housing units located in the City’s borders as of December 1, 2012. Economic Development personnel continually update economic data, and demographic and development trends to maintain current information to better assist clients with their search for potential development opportunities. The information also aids Economic Development staff in identifying areas of opportunity and specific gaps, in targeting retail markets and linkages to key census information, which assists in presenting available sites.
10
210
410
610
810
Q1Q2
150 70
607 808
Jobs Created FY 12-13
Retail Jobs
Industrial/Office Jobs
10
100,010
200,010
300,010
400,010
500,010
600,010
Q1Q2
19,200 13,500
403,598 508,288
Square Footage FY 12-13
Retail S.F.
Industrial/Office S.F.
5 Economic Development Division June 2, 2014

ECONOMIC DEVELOPMENT OUTLOOK The economic vitality of the City of Chandler relies on job growth and demographic factors.
The influx of educated workers, sustainable increases in population, high education choices and a pro-business record, lay the groundwork for healthy job creation and employment opportunities during the first quarter.
Source: City of Chandler Planning Division December 1, 2012
Population Growth
Q1 Population 239,538 239,652 239,813
Jul. Aug Sep
Q2 Population 239,935 240,133 240,662
Oct Nov Dec
Source: City of Chandler Planning Division
Source: City of Chandler, Sales Tax & Licenses
6 Economic Development Division June 2, 2014

ECONOMIC TRENDS According to the Arizona Department of Commerce, by the end of Q2, the City of Chandler’s average unemployment rate is 5.6% while the City of Phoenix has a 7.1% unemployment rate and the state of Arizona has an 8.0% unemployment rate.
Employment Occupation Data identifies and analyzes total employee counts per establishment within various industries.
0.2%
15.8%
39.5%
7.8%
27.6% 8.3
Employment By Occupation FY 12-13
Farming, Forestry & Fishing
Service & Occupation
Managerial & Professional Service
Production, Transport, Material Moving
Technical Sales & Administrative Support
Construction, Extraction, MaintenanceSource: Claritas
July Aug Sep Oct Nov Dec
Q1 Q2
Quarter Unemployment Rate FY 12-13
Arizona
Phoenix
Chandler
Source: Arizona Department of Commerce Source: Arizona Department of Commerce
7 Economic Development Division June 2, 2014
ECONOMIC TRENDS
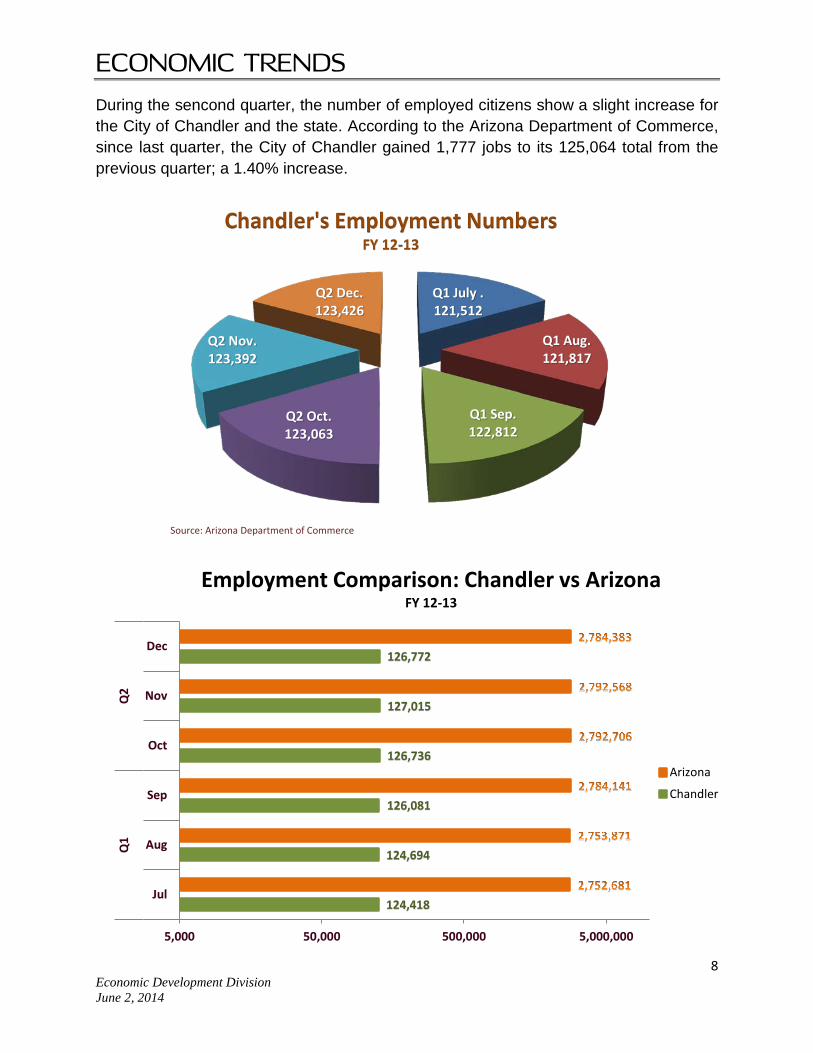
During the sencond quarter, the number of employed citizens show a slight increase for the City of Chandler and the state. According to the Arizona Department of Commerce, since last quarter, the City of Chandler gained 1,777 jobs to its 125,064 total from the previous quarter; a 1.40% increase.
Q1
Q1
Q2
Q2
Q2
Q1 July . 121,512
Q1 Aug. 121,817
Q1 Sep. 122,812
Q2 Oct. 123,063
Q2 Nov. 123,392
Q2 Dec. 123,426
Chandler's Employment Numbers FY 12-13
Source: Arizona Department of Commerce
124,418
124,694
126,081
126,736
127,015
126,772
5,000 50,000 500,000 5,000,000
Jul
Aug
Sep
Oct
Nov
Dec
Q1
Q2
Employment Comparison: Chandler vs Arizona FY 12-13
Arizona
Chandler
8 Economic Development Division June 2, 2014
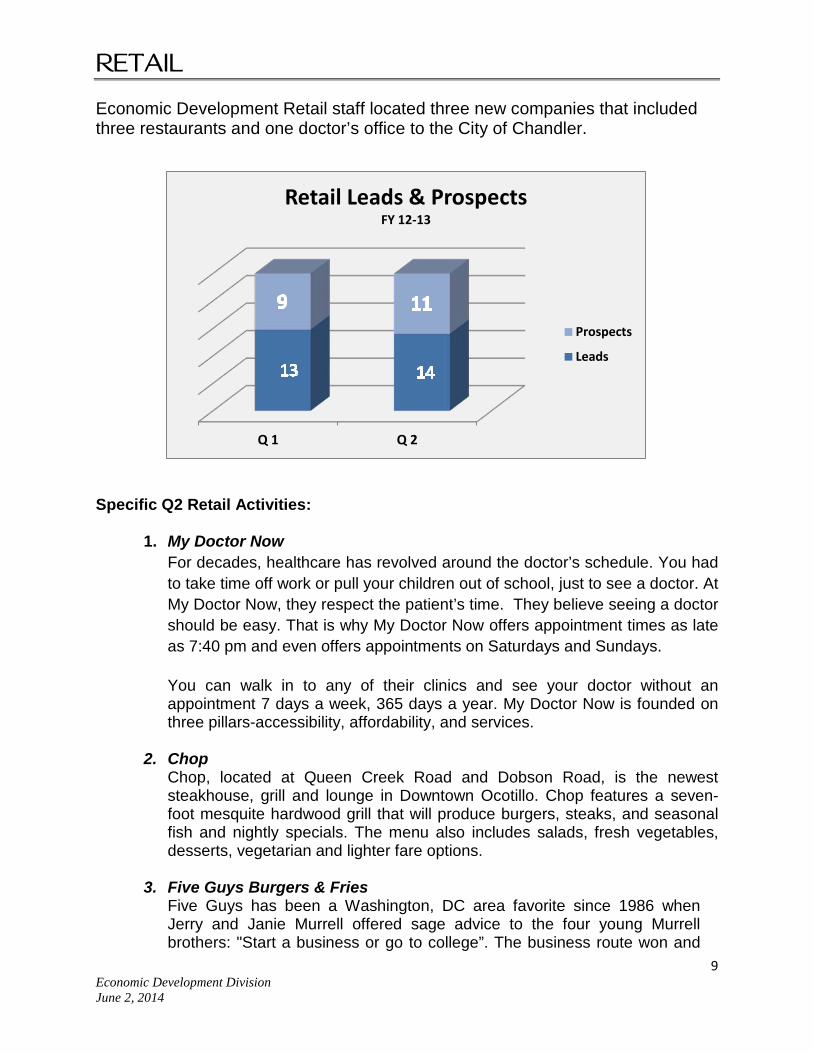
RETAIL Economic Development Retail staff located three new companies that included three restaurants and one doctor’s office to the City of Chandler.
Specific Q2 Retail Activities:
1. My Doctor Now For decades, healthcare has revolved around the doctor’s schedule. You had to take time off work or pull your children out of school, just to see a doctor. At My Doctor Now, they respect the patient’s time. They believe seeing a doctor should be easy. That is why My Doctor Now offers appointment times as late as 7:40 pm and even offers appointments on Saturdays and Sundays. You can walk in to any of their clinics and see your doctor without an appointment 7 days a week, 365 days a year. My Doctor Now is founded on three pillars-accessibility, affordability, and services.
2. Chop Chop, located at Queen Creek Road and Dobson Road, is the newest steakhouse, grill and lounge in Downtown Ocotillo. Chop features a seven-foot mesquite hardwood grill that will produce burgers, steaks, and seasonal fish and nightly specials. The menu also includes salads, fresh vegetables, desserts, vegetarian and lighter fare options.
3. Five Guys Burgers & Fries
Five Guys has been a Washington, DC area favorite since 1986 when Jerry and Janie Murrell offered sage advice to the four young Murrell brothers: "Start a business or go to college”. The business route won and
Q 1 Q 2
Retail Leads & Prospects FY 12-13
Prospects
Leads
9 Economic Development Division June 2, 2014

RETAIL
the Murrell family opened the first carryout burger joint in Arlington, Virginia. Under the guidance of Jerry and Janie, the Murrell family served only hand-formed burgers cooked to perfection on a grill along with fresh-cut fries cooked in pure peanut oil. The little burger joint quickly developed a cult-like following and customers voted their burger "#1" in the metro area. During the 1980’s and 1990’s the business grew, and they opened four more restaurants to accommodate the growing clientele while Jerry and Janie added a fifth brother to the family. Early in 2003, Jerry and Janie, together with the five “guys" began offering franchise opportunities. In just under 18 months, Five Guys Enterprises sold options for 300 units. More than 20 years after Five Guys first opened, there are over 1,000 locations nationwide and over 1,500 units in development.
Reta
il
NAME LOCATION JOBS S.F. 1st Quarter Locates
US Egg Kyrene Rd. & Chandler Blvd 50 6,500 Anytime Fitness Alma School Road & Chandler Blvd 15 5,100 Longhorn Steakhouse 54th Street & Ray Rd 50 3,500 Firehouse Subs Gilbert Rd & Germann 20 2,100 Panchero's Dobson Rd & Chandler Blvd 15 2,000
Reta
il
NAME LOCATION JOBS S.F 2nd Quarter Locates
My Doctor Now Alma School and Elliot 25 7,000 Chop Dobson Rd & Queen Creek Rd 20 4,000 Five Guys Burgers & Fries Arizona Ave & Ocotillo 25 2,500
Economic Development and job creation accompany one another and job creation offers ways to advance the economic security of the city’s population. Staff efforts in this quarter produced a combined 220 new jobs and occupied 32,700 square feet of retail space.
10 Economic Development Division June 2, 2014

RETAIL
150
70
Q1 Q2
Retail Total Jobs Created
FY 12-13
19,200
13,500
Q1 Q2
Retail Total Square Feet FY 12-13
11 Economic Development Division June 2, 2014

INDUSTRIAL & OFFICE Economic Development Industrial and Office staff efforts located eight new companies to the City of Chandler with a wide range of office and industrial retention and expansion sites.
Specific Q2 Industrial/Office Activities:
1. Energaia Energaia is a tenant at the City of Chandler Innovations Science and Technology Incubator. Energaia is a research and development company specializing in the packaging metallization industry for wafer production. They offer a unique solution by combining low cost manufacturing with high material quality.
2. Simpson Strong-Tie For more than 50 years, Simpson Strong-Tie has focused on creating structural products that help people build safer and stronger homes and buildings. Simpson Strong-Tie is one of the largest suppliers of structural building products in the world. The company provides full-service engineering and field support, product testing and training. Simpson Strong-Tie works closely with industry professionals to provide code-listed, field-tested products, and structures that help resist high winds, hurricanes, and seismic forces. Its product lines include:
• Structural Connectors and Fasteners • Steel Strong-Wall® prefabricated shearwalls • Anchor Tiedown Systems for multi-story buildings • Quik Drive® auto-feed screw driving systems • Anchor Systems for concrete and masonry
Q 1 Q 2
Industrial & Office Leads & Prospects
FY 12-13
Prospects
Leads
12 Economic Development Division June 2, 2014
INDUSTRIAL & OFFICE
3. Invoy Technologies, LLC Invoy Technologies, LLC is a tenant at the City of Chandler Innovations Science and Technology Incubator. Invoy is engaged in the development and commercialization of breath analysis devices for a broad range of applications. Invoy’s plan is to offer patients the ability to monitor their health in the convenience of their own home – with a prescription-based breath analysis device called the Voyager. The process is pain-free and the results are quick and accurate, giving the patient’s peace of mind and confidence in using the new-to-the-market device.
4. InfusionSoft InfusionSoft helps entrepreneurs rethink how to get organized, grow sales and save time. Their extensive ecosystem of products, services and local partners is focused on simplifying sales and marketing so that entrepreneurs can spend more time doing what they love. InfusionSoft understands the joys and pains of entrepreneurship. Over half of Infusion soft staff have owned and operated a small business, so they understand how to fight for small business success.
5. Brycon Brycon is one of the Southwest's largest industrial contractors. With over two decades of experience in the Industrial/Manufacturing industry, Brycon has built a talented team of professionals capable of constructing complex projects in complex environments. Consumer goods manufacturing, pharmaceuticals, and semiconductor manufacturing are just a few of the demanding industries that BRYCON specializes in.
6. Element Payment Services, Inc. Element Payment Services, Inc. is the industry-leading provider of fully integrated PC IDSS compliant payment processing solutions for merchants and business management software providers. Element's Express Processing Platform allows for easy integration and supports advanced technologies. They process an estimated $10 billion in annual transaction volume for merchants. Element's PCI DSS compliant Express Processing Platform supports credit, debit, and ACH processing solutions.
7. Recondition Systems Inc. Recondition Systems Inc. (RSI) was founded in Tempe, AZ in 1987. RSI’s Echo Systems product line is comprised of approximately 70 percent recycled content. RSI starts with a recycled steel panel core, originally manufactured by Haworth, Inc. and then adds new and remanufactured components and fabrics milled from recycled fabrics and plastics. By utilizing the recycled parts, they save over 1,000 tons of needless waste from landfills every year.
13 Economic Development Division June 2, 2014

INDUSTRIAL & OFFICE
Today RSI continues to develop and evolve. In 2012, RSI introduced the Engage Desking System. Engage offers flexible, open collaborative office solutions perfectly suited for today’s interactive, fast-paced work environments. .
8. Santan Brewing Company SanTan Brewing Company was born in Historic Downtown Chandler, Arizona in the old Valley National Bank Building. Open since 2007, SanTan Brewing Company has made a name for itself as Arizona’s favorite craft beer destination, operating with a commitment to advance the culture of craft beer. SanTan Brewing Company accomplishes this goal through beer production, using the highest quality ingredients and methods. Brewmaster and owner Anthony Canecchia is dedicated to the culture of Craft Beer paired with Craft Food to be enjoyed with the art of Conversation.
Indu
stria
l/O
ffice
NAME LOCATION JOBS S.F. CAPITAL INVESTMENT
1st Quarter Locates AKO Engineering Price Rd Y Willis Rd 15 2,500 $0 Healthtell McClintock Dr & Chandler Bvld 6 3,300 $2,401,525 Southwest CFO McClintock Dr & Chandler Blvd 1 136 $750,000 Phacil GSA Kyrene Rd & Chandler Blvd 120 38,000 $17,500,000 Phacil Corporate Office Price Rd & Willis Rd 0 1,200 $1,793,700 St. Clair Technologies Price Rd & Frye Rd 25 9,500 $3,135,000 Intel R & D Chandler Blvd & Rural Rd 350 300,000 $2,220,000 Aero Zone Gilbert Rd & Germann Rd 30 30,000 $7,500,000 Eaton I-10 & 54th St 60 18,962 $0
Indu
stria
l/O
ffice
NAME LOCATION JOBS S.F. CAPITAL INVESTMENT
2nd Quarter Locates Energaia McClintock Dr & Chandler Blvd 3 1,014 $0 Simpson Strong Tie Arizona Ave & Elliot Rd 15 18,687 $2,401,525 Invoy Technologies McClintock Dr & Chandler Blvd 12 2,500 $750,000 InfusionSoft 202 Santan & Price Rd 350 92,000 $17,500,000 Brycon 56th St & Frye Rd 35 16,187 $1,793,700 Elements Payment Services Inc. McClintock Dr & Chandler Blvd 150 238,500 $3,135,000
Recondition Systems Inc. I-10 & Chandler Blvd 208 104,400 $2,220,000 Santan Brewing Co. Warner Rd & Arizona Ave 35 35,000 $7,500,000
14 Economic Development Division June 2, 2014

INDUSTRIAL & OFFICE
The City of Chandler Economic Development staff efforts in this quarter produced 610 new jobs and occupied 236,386 square feet of industrial and office space, in addition to a projected capital investment of $35.3 million.
Economic Development Industrial and Office staff first and second quarter combined efforts created 1,415 new job, occupied 911,886 square feet of office and industrial space in addition to a projected capital investment of $358.0 million.
607
808
0100200300400500600700800900
403,598
508,288
Q1 Q20
100,000
200,000
300,000
400,000
500,000
600,000
Industrial/Office Total Sqare Feet
FY 2012-2013
$0
$50,000,000
$100,000,000
$150,000,000
$200,000,000
$250,000,000
$300,000,000
$350,000,000
Q1 Q2
$322,797,150
$35,300,225
Capital Investment FY 12-13
15 Economic Development Division June 2, 2014

TOURISM Chandler continued to see an occupancy decline as a direct result of the slowdown associated with the Intel expansion, which had driven occupancy during the same period last year. However, the community continued to experience positive growth with the Average Daily Rate (ADR).
Staff was active in a number of events this quarter including the Arizona Showcase fashion show in Hermosillo, Sonora Mexico which attracted more than 800 consumers and showcased Chandler Fashion Center as one of the feature Arizona shopping malls. One hotel partner, the Hampton Inn & Suites Phoenix, joined staff for the trade show. In addition, staff partnered with the Tempe Tourism Office to conduct various media appointments in an effort to generate editorial coverage during the fiscal year and to represent Chandler and Tempe on a mid-morning Telemax show. Several projects were outlined with several publications including a high fashion shoot to appear in the March 2013 issue of Fashionista. As a direct result of the October media appointments, a media FAM was held in November to expose editors and journalists to various story ideas for their respective publications.
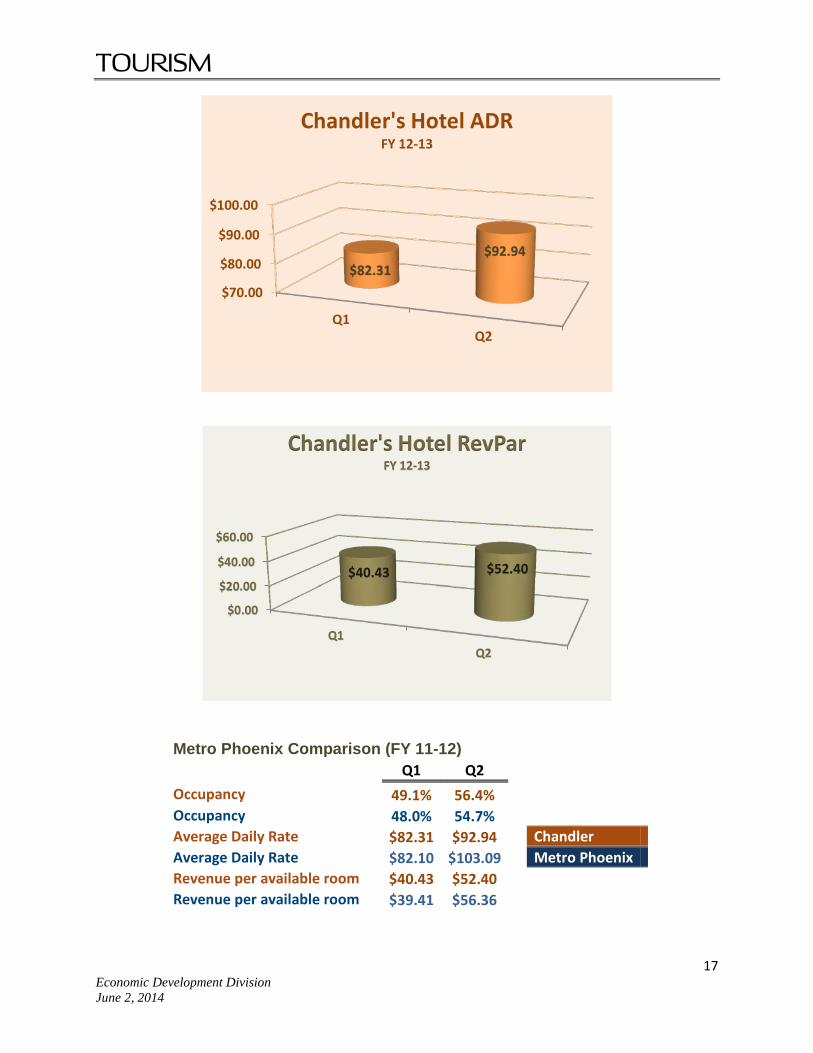
Smith Travel Research, Inc. (STR) has developed the specific Q2 Chandler and metro Phoenix hotel industry occupancy, average daily rate (ADR), and revenue per available room (RevPar) as a custom set for the Chandler market that are represented in the charts below:
16
Economic Development Division June 2, 2014
45.0%
50.0%
55.0%
60.0%
Q1Q2
Chandler's Occupancy Rate FY 12-13
TOURISM
Metro Phoenix Comparison (FY 11-12)
Q1 Q2
Occupancy 49.1% 56.4% Occupancy 48.0% 54.7% Average Daily Rate $82.31 $92.94
Chandler Average Daily Rate $82.10 $103.09
Metro Phoenix
Revenue per available room $40.43 $52.40 Revenue per available room $39.41 $56.36
$0.00
$20.00
$40.00
$60.00
Q1Q2
$40.43 $52.40
Chandler's Hotel RevPar FY 12-13
17 Economic Development Division June 2, 2014
$70.00
$80.00
$90.00
$100.00
Q1Q2
$82.31 $92.94
Chandler's Hotel ADR FY 12-13
TOURISM
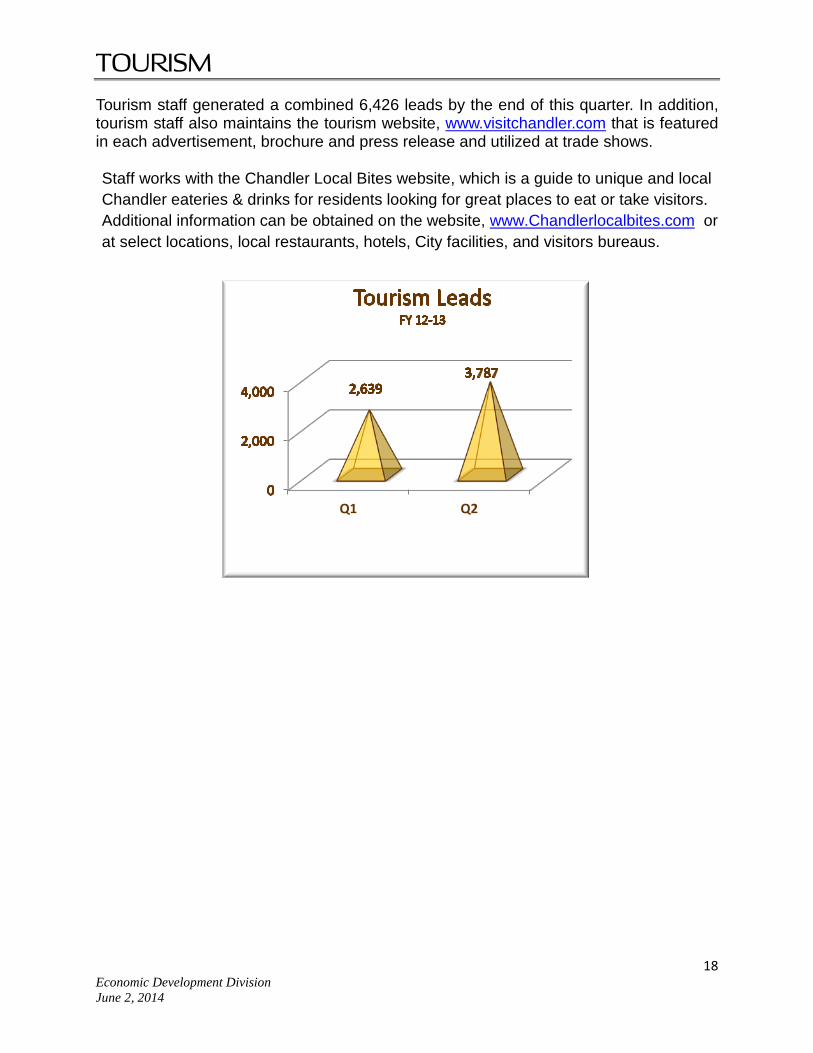
Tourism staff generated a combined 6,426 leads by the end of this quarter. In addition, tourism staff also maintains the tourism website, www.visitchandler.com that is featured in each advertisement, brochure and press release and utilized at trade shows. Staff works with the Chandler Local Bites website, which is a guide to unique and local Chandler eateries & drinks for residents looking for great places to eat or take visitors. Additional information can be obtained on the website, www.Chandlerlocalbites.com or at select locations, local restaurants, hotels, City facilities, and visitors bureaus.
Q1 Q2
18 Economic Development Division June 2, 2014