Quarterly Report 3/2013 · versity of Vienna won in the overall standings with its design “Living...
50
Quarterly Report 3/2013
Transcript of Quarterly Report 3/2013 · versity of Vienna won in the overall standings with its design “Living...

Quarterly Report 3/2013

Summary of Group results
3U Group (IFRS) 9-months comparisonJanuary 1–September 30
2013 2012
Sales (in EUR million) 28.64 52.07
EBITDA (earnings before interest, taxes and amortisation) (in EUR million) –2.84 –6.74
EBIT (earnings before interest and taxes) (in EUR million) –4.31 –7.43
EBT (earnings before tax) (in EUR million) –4.02 –6.99
Net income/loss for the period (in EUR million) –3.59 –6.29
Earnings per share total (undiluted) (in EUR) –0.10 –0.18
Earnings per share total (diluted) (in EUR) –0.10 –0.16
Equity ratio (in %) 79.97 82.01
3U Group (IFRS) Quarterly comparisonJuly 1–September 302013 2012
Sales (in EUR million) 10.36 11.32
EBITDA (earnings before interest, taxes and amortisation) (in EUR million) –0.39 –3.58
EBIT (earnings before interest and taxes) (in EUR million) –0.84 –3.31
EBT (earnings before tax) (in EUR million) –0.84 –3.13
Net income/loss for the period (in EUR million) –0.92 –2.82
Earnings per share total (undiluted) (in EUR) –0.03 –0.08
Earnings per share total (diluted) (in EUR) –0.03 –0.07
Equity ratio (in %) 79.97 82.01

2
2
4
7
8
8
24
28
28
30
31
32
34
36
44
45
45
45
46
46
47
To our shareholders
Letter to our shareholders
The 3U share
Corporate governance report
Interim Group Management Report
Report on business development
Outlook
Interim Consolidated Financial Statements
Balance sheet as of September 30, 2013
Income statement
Statement of income and accumulated earnings
Statement of changes in equity
Cash flow statement
Explanatory notes to the consolidated financial statements as of September 30, 2013
Responsibility statement
Further Information
Financial calendar
Contact
Imprint
Disclaimer
3U Group
Contents 1
2
TO OUR SHAREHOLDERS | INTERIM GROUP MANAGEMENT REPORT | INTERIM CONSOLIDATED FINANCIAL STATEMENTS | FURTHER INFORMATION
Letter to our shareholders
Dear shareholders,
The measures we have taken to return the 3U Group back to profitability begin to take effect. The financial ratios reflect this
clearly. Consolidated sales, which continued to decline from quarter to quarter in 2012 and reached its low point in the first quar-
ter of 2013, increased in the second quarter in a row. The turnaround becomes even more apparent when looking at operating
profits. Since the low point was reached in the third quarter of 2012 at EUR –3.58 million, EBITDA has improved each quarter and
approaches break even with long strides.
Although this development is encouraging, we are far from being satisfied. While the segment Telephony performed very suc-
cessfully in 2013 and the segment Renewable Energies after a long dry spell achieved a positive operating result for the first time
in 2013, the segment Services fell short of our goals. Nevertheless, signs of a significant improvement are here apparent as well.
Although labour costs are planned to be reduced by around EUR 1.0 million in this segment in 2014, the external sales should
increase by at least EUR 1.0 million, which would have a correspondingly positive impact on the overall result.
Although the described progress provides reason for optimism, the Management Board has no choice but to re-adjust the fore-
cast. This is due to the fact that we will have expenses for the development of some promising business areas, which will be
explained hereafter and which have no corresponding income in the short term. On the other hand, the partial or entire sale of
Subsidiaries is also part of the corporate purpose of 3U HOLDING AG as a holding company and can lead to positive special effects.
However, there are limitations to plan net income therefrom and will therefore be disregarded in the following prognosis.
That said the Management Board of 3U HOLDING AG expects Group sales of about EUR 38 million to EUR 40 million and EBITDA of
EUR –3.5 million to EUR –2.5 million. The earnings forecast of between EUR –4.5 million and EUR –3.0 million remains unchanged.
For 2014, the Management Board anticipates sales of between EUR 44 million and EUR 49 million, EBITDA between EUR –0.5 million
and EUR 1.5 million and earnings of between EUR –3.5 million to EUR –1.5 million.
Expansion of the business field Data Centre Services
After the acquisition of a data centre in Berlin was published on July 8, 2013, a further acquisition of a data centre was announced
October 24, 2013: The Subsidiary 3U TELECOM with its product and service portfolio 3U DCS (Data Centre Services) takes over a data
centre with an area of approx. 600 square meters in Hanover.
With the redundant network of multiple data centres and intelligent backup solutions 3U DCS offers customers more protection
and higher reliability than a standalone data centre. With the integration of the new data centre in Hanover, we expand the cross-
border infrastructure for IT services and data transfer and optimize them. At the same time we strengthen our expertise in the
field of IaaS (Infrastructure-as-a-Service) and PaaS (Platform-as-a-Service) services with this acquisition.
The new data centre ensures, like all 3U data centres, highly available connectivity to all major telecom and IP networks from
national and international carriers. Solutions in data centres, collocation, cloud computing, virtualization, network transmission
services as well as building and infrastructure management are offered. Supplementary services in the field of telecommunica-
tions and fixed-line telephony round out the portfolio.
3
TO OUR SHAREHOLDERS | INTERIM GROUP MANAGEMENT REPORT | INTERIM CONSOLIDATED FINANCIAL STATEMENTS | FURTHER INFORMATION
With this acquisition, we expand our data centre portfolio to four locations (Berlin, Hanover, Frankfurt/Main and Marburg); a further
increase in the coming years is planned. 3U thus opens up a new business field that complements the traditional telecommuni-
cations business very well.
Product Quality matters
ClimaLevel Energiesysteme contributes to victory in the Solar Decathlon 2013
On October 13, 2013, the U.S. Department of Energy announced the winner of the Solar Decathlon 2013. The aim of the international
competition was to build a residential building as self-sufficient as possible for life in the future. The team from the Technical Uni-
versity of Vienna won in the overall standings with its design “Living Inspired by Sustainable Innovation” (LISI). During the plan-
ning and development team Austria was supported by ClimaLevel Energiesysteme, whose eponymous ClimaLevel® Multi Floor HCV
for heating, cooling and ventilation was used in LISI.
The eco-house is made almost entirely of wood and produces more energy than its inhabitants consume in general. For the finale,
which was held in Irvine, California, 19 teams qualified, which were selected from nearly 200 applicants.
RISIMA wins high-profile partners
RISIMA Consulting provides comprehensive consulting services, products and services to increase the efficiency and safety of cor-
porate governance and IT security processes. In September 2013, RISIMA was able to conclude a framework agreement with TÜV
Süd. In the future RISIMA will receive orders by TÜV Süd, in which it will act as “external data protection officer”, or will perform
“privacy audits” or “IT penetration tests”.
In addition, RISIMA convinced one of the leading U.S. IT security companies with its consulting concept and highly skilled profes-
sionals to select RISIMA as a partner for Germany.
Dear shareholders,
We have achieved some important milestones towards profitability, but we are still facing a number of challenges in the coming
months. We are confident to master these to finally be back where you rightly expect us: On a path of profitable growth.
We would appreciate if you continue coming along with us.
Marburg, in November 2013
The Management Board
Michael Schmidt Christoph Hellrung Andreas Odenbreit

The 3U share
The shares of 3U HOLDING AG are no-par bearer shares listed in the Prime Standard of the Frankfurt Stock Exchange. Besides
trading in Frankfurt on Xetra and the floor, the stock is also traded on the OTC markets in Berlin, Dusseldorf, Munich and Stuttgart.
General market development
Global financial markets saw bright spells and cloudy periods during the third quarter of 2013. The European financial and
sovereign-debt crisis seems to have become somewhat less acute in the eyes of many market participants. Moreover, the Federal
Reserve and the European Central Bank intend to maintain their low-interest-rate policies for the foreseeable future. Both these
aspects have helped create some relief for stock markets. On the other hand, the conflicts in Arab countries such as Syria and
Egypt have noticeably increased the risks to the world economy. Also the recurring controversy over the U.S. federal budget
burdens the stock markets. Leading indicators such as order intakes, business confidence and consumer confidence led to a
positive mood at the German stock market.
Development of the 3U share
The shares of 3U HOLDING AG started in fiscal year 2013 with a quotation of EUR 0.51. Following a brief increase to EUR 0.60 at Mid-
January the share gave up its gains and reached its low for the year in August. Since then, the share price has recovered
significantly and with EUR 0.50 at the end of the reporting period almost reached the level of the beginning of the year. The Prime
All Share Index started the business year 2013 at 2,913.57 points and closed at 3,294.55 and was therefore able to gain roughly 13 %.
The 3U share at a glance
International Securities Identification Number (ISIN) DE0005167902
Wertpapierkennnummer (WKN) [Securities Identification Number] 516790
Stock exchange symbol UUU
Transparency level Prime Standard
Designated sponsor BankM — Repräsentanz der biw Bank für Investments und Wertpapiere AG
Initial listing November 26, 1999
Registered share capital in EUR at September 30, 2013 EUR 35,314,016.00
Registered share capital in shares at September 30, 2013 35,314,016
Share price at September 30, 2013* EUR 0.50
Share price high in period from January 1 to September 30, 2013* EUR 0.60 (January 14, 2013)
Share price low in period from January 1 to September 30, 2013* EUR 0.36 (August 2, 2013)
Market capitalisation at September 30, 2013 EUR 17,657,008.00
Earnings per share (undiluted) at September 30, 2013 EUR –0.10
*On Xetra
TO OUR SHAREHOLDERS | INTERIM GROUP MANAGEMENT REPORT | INTERIM CONSOLIDATED FINANCIAL STATEMENTS | FURTHER INFORMATION
4

5
TO OUR SHAREHOLDERS | INTERIM GROUP MANAGEMENT REPORT | INTERIM CONSOLIDATED FINANCIAL STATEMENTS | FURTHER INFORMATION
January 2013 February 2013 March 2013 April 2013 May 2013 June 2013 July 2013 August 2013 September 2013
Source: EquityStory AG/Interactive Data Managed Solutions AGPrime All Share3U HOLDING adj.
70
80
90
100
110
120
Share price
Share price performance of the 3U shares* from January 1, 2013 to September 30, 2013 vs. Prime All Share Index
Shareholder structure as at September 30, 2013
Michael Schmidt 25.49 % 8,999,995 shares
Andreas Odenbreit 0.06 % 20,500 shares
Gerd Simon 0.03 % 10,000 shares
(Supervisory Board)
Roland Thieme 5.58 % 1,971,232 shares
(associated person)
3U HOLDING AG 1.04 % 368,012 shares
(own shares)
Remaining free float 67.80 % 23,944,277 shares
*Daily closing price Xetra
Investor relations
An open dialogue with our shareholders is a top priority for us. We want to continue promoting the awareness of 3U HOLDING AG
on the capital market. The 3U share shall be perceived as an attractive long-term investment. We want to convey the development
of the Group and our strategy in an open, continuous and reliable way to further strengthen the trust of the investors and to
achieve a fair assessment on the capital market.
The liquidity of the stock has only slightly decreased compared to the prior year. The average daily number of traded 3U shares
in Frankfurt decreased in 2013 compared to the previous year to approximately 28,000 units, after trading in the year 2012
amounted to a daily average of approximately 30,000 3U shares.
The Management Board of 3U HOLDING AG has decided on the basis of the authorisation granted by the Annual General Meeting
of May 31, 2012 to repurchase up to 10 % of its own shares (up to 3,531,401 shares) on the stock exchange during the period from
May 1, 2013 until not later than May 30, 2017. 368,012 shares at an average price of EUR 0.44 were repurchased by September 30, 2013.
3U HOLDING AG reports weekly on the progress of the share buy-back program on its website at http://www.3u.net/en/investor-
relations/the-share/share-buyback.html.
TO OUR SHAREHOLDERS | INTERIM GROUP MANAGEMENT REPORT | INTERIM CONSOLIDATED FINANCIAL STATEMENTS | FURTHER INFORMATION
6

Declaration of conformity
The Management and Supervisory Boards of 3U HOLDING AG continuously discussed the contents of the Corporate Governance
Code at length and decided that the recommendations are largely observed.
3U HOLDING AG submitted the most current declaration of conformity required according to the German Stock Corporation Act
on March 22, 2013. It can be viewed permanently on its website (www.3u.net) under the path “Investor Relations/Corporate
Governance”.
Deviations from the recommendations
Deductible D&O insurance
The D&O insurance of the Company does not contain deductibles for the Supervisory Board. Regarding this, 3U HOLDING AG is of
the opinion that the responsibility and motivation with which the members of the Supervisory Board of the Company perform their
tasks cannot be improved by such deductibles.
Diversity
The Management Board bases the allocation of managerial functions on the requirements of the respective function and searches
for the person who fulfils these requirements in the best possible way. If several candidates of similar qualification are available,
the Management Board looks for diversity and an appropriate consideration of women in the Company in the allocation without
elevating those criteria to an overriding principle.
Executive remuneration
The Supervisory Board has not stipulated a cap for compensation to be paid to Members of the Management Board (max. 2 years’
salary) because the contracts only have a limited period of 3 years. Accordingly, the proposed limit of possible compensation
claims of Board Members as intended by 4.2.3 is already inherently included in the employment contracts of the Board Members.
Age limits & diversity for members of the Management Board and Supervisory Board
The Supervisory Board chooses the members of the Management Board according to suitability and qualification and looks for
the best composition possible for management positions. The Company is of the opinion that the special weighting of further
criteria predetermined by the code would restrict the choice of possible candidates for the Management Board. Furthermore it
has to be considered that the Management Board consists of just three members at this time.
The cast of the Supervisory Board is chosen according to suitability, experience and qualification as well. To follow other guide-
lines for choosing suitable members would restrict the flexibility without gaining other advantages for the Company. This is true
all the more since the Supervisory Board currently consists of only three members.
Corporate governance report
TO OUR SHAREHOLDERS | INTERIM GROUP MANAGEMENT REPORT | INTERIM CONSOLIDATED FINANCIAL STATEMENTS | FURTHER INFORMATION
7
Earnings
Group sales declined significantly from EUR 52.07 million by EUR 23.43 million to EUR 28.64 million compared to the previous year.
In particular the sales shortfall in the segment Telephony is responsible for this. In this segment, sales declined by EUR 24.24 mil-
lion compared to the corresponding period (first 9 months of 2012), while in the segment Renewable Energies sales compared to
the first 9 months of 2012 were expanded by EUR 1.21 million. Despite the decline in the segment Telephony, earnings could be
improved, especially since only the low-margin sales in the wholesale/value-added services have declined significantly.
Comparing the first, second and third quarter of 2013, consolidated sales in the third quarter of EUR 10.36 million are EUR 0.63 mil-
lion, or approximately 6 % higher than in the second quarter and EUR 1,82 million or about 21 % higher than in to the first quarter.
The earnings situation of the first nine months 2013 is substantially influenced by the higher gross profit compared to the corres -
ponding period 2012. Both the relative and the absolute margins were significantly increased compared to the previous period.
Personnel expenses and other operating expenses amounted to EUR 12.73 million and were well below the level of the first nine
months of 2012 with EUR 14.61 million. The cost savings potential from the 4-points target achievement strategy 2013, introduced
in the middle of November 2012, will fully engage in the course of 2013. Thus, the personnel expense amounted to EUR 2.95 mil-
lion in the first quarter, EUR 2.89 million in the second quarter and was reduced to EUR 2.51 million in the third quarter.
EBITDA for the first nine months of 2013 increased by EUR 3.9 million to EUR –2.84 million compared to the same period of the pre-
vious year (EUR –6.74 million). In the third quarter of 2013, EBITDA amounted to EUR –0.39 million, while in the first quarter of 2013
it was reported at EUR –1.61 million and in the second quarter of 2013 at EUR –0.84 million.
With EUR 0.29 million the financial result is below the level of the same period last year (EUR 0.44 million).
Income tax in the amount of EUR 0.22 million (previous year : tax charge EUR –0.05 million) relates to current taxes on income in
the amount of EUR –0.24 million (previous year : EUR –0.07 million) and with EUR 0.02 million (previous year : EUR 0.02 million)
deferred taxes.
As a consequence, Group’s earnings in the first nine months of 2013 with EUR –3.59 million are EUR 2.70 million higher than the
Group’s earnings of the comparable period 2012 (EUR –6.29 million).
In accordance with internal reporting, 3U Group covers the segments Telephony, Services, Renewable Energies and Holding/Con-
solidation within its segment reporting.
TO OUR SHAREHOLDERS | INTERIM GROUP MANAGEMENT REPORT | INTERIM CONSOLIDATED FINANCIAL STATEMENTS | FURTHER INFORMATION
8 Report on business development
–5
0
5
10
15
Earnings*EBITDASales
Q3 2012 Q4 2012 Q1 2013 Q2 2013 Q3 2013 *After share of non-controlling shareholders
–2.82 –3.09
–1.73–0.94 –0.92
–3.58–3.19
–1.61–0.84
–0.39
11.32
8.918.54
9.7310.36
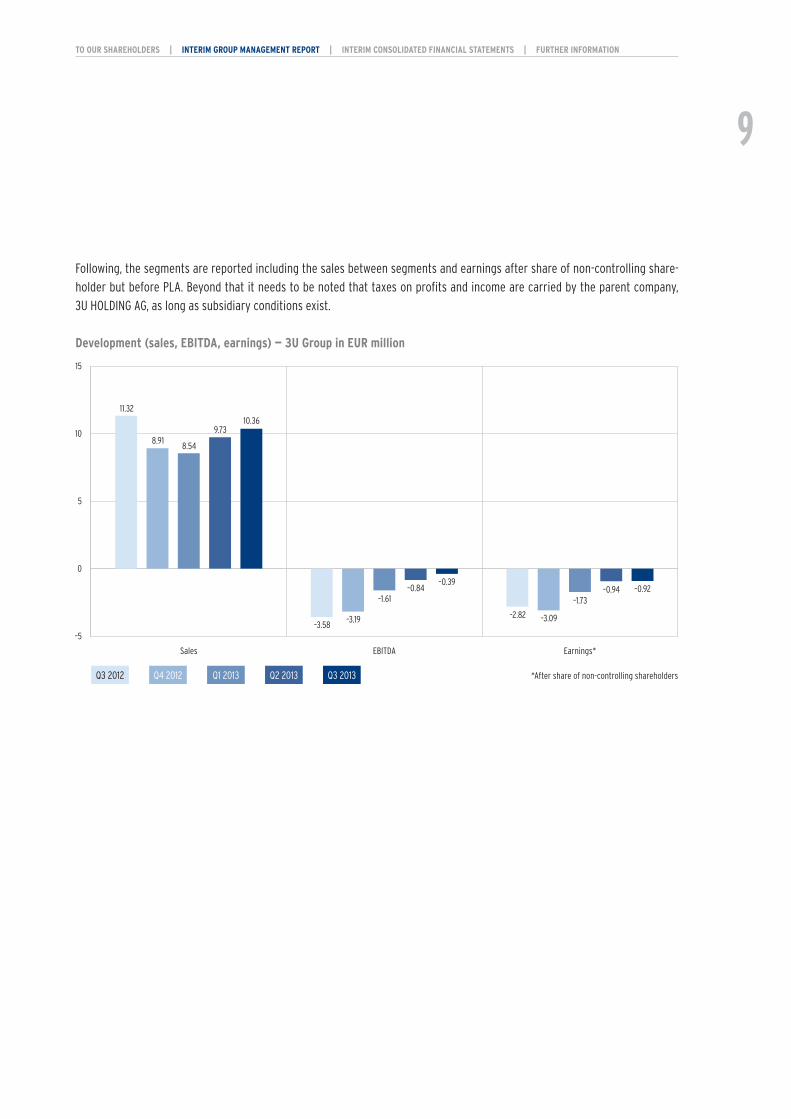
Following, the segments are reported including the sales between segments and earnings after share of non-controlling share-
holder but before PLA. Beyond that it needs to be noted that taxes on profits and income are carried by the parent company,
3U HOLDING AG, as long as subsidiary conditions exist.
Development (sales, EBITDA, earnings) — 3U Group in EUR million
TO OUR SHAREHOLDERS | INTERIM GROUP MANAGEMENT REPORT | INTERIM CONSOLIDATED FINANCIAL STATEMENTS | FURTHER INFORMATION
9

–5
0
5
10
Earnings*EBITDASales
Q3 2012 Q4 2012 Q1 2013 Q2 2013 Q3 2013 *Segment income before profit transfer
0.15
–0.88
0.57 0.38 0.53
–0.40 –0.23
0.64 0.43 0.59
6.46
4.87
6.096.42
6.03
Segment Telephony
The very intense competition and the cuts by the Amendment to the Telecommunications Act and the associated additional margin
declines have left their mark in the segment Telephony. Compared to the second quarter of 2013 sales decreased while margins
increased considerably and resulted in overall increased earnings.
Sales in the segment Telephony decreased in the reporting period compared to the second quarter 2013 from EUR 6.42 million to
EUR 6.03 million and were thus approximately on the level of the first quarter. The market continues to be very difficult, due to
the highly competitive conditions which have worsened since fiscal 2012 and the continuous shrinking of the open call-by-call
market.
In the first nine months of fiscal year 2013, the gross profit of EUR 4.92 million (previous year : EUR 6.04 million) amounted to
approximately 27 % of sales. In the previous year this figure was around 15 % and around 14 % in the same period last year due
to the high proportion of sales in the wholesale/value added services. Due to the significant decline in other operating expenses
and due to lower depreciation and amortization, EBITDA and EBIT increased significantly in this segment. EBITDA increased by
EUR 1.39 million to EUR 1.66 million (previous period : EUR 0.27 million). Compared to the first nine months of 2012 earnings increased
by EUR 0.56 million from EUR 0.92 million to EUR 1.48 million in the first nine months of 2013.
Development (sales, EBITDA, earnings) — Segment Telephony in EUR million
TO OUR SHAREHOLDERS | INTERIM GROUP MANAGEMENT REPORT | INTERIM CONSOLIDATED FINANCIAL STATEMENTS | FURTHER INFORMATION
10
Segment Services
The segment Services is comprised of IT consulting and development, business consulting and the distribution and marketing
resources, which are utilized Group-wide for several Group Companies.
82 % of the sales of EUR 1.75 million (previous year : EUR 3.57 million) reported in this segment for the first nine months of the busi-
ness year 2013 were still generated within the Group. The decrease in sales resulted primarily from the reduction of intra-group
services of this segment.
In recent quarters, especially the topic of cloud computing has been advanced. Cloud computing enables the realization of cost
advantages over conventional systems, especially if, for example, the payment is determined by the duration of use of the service
and the service is used only occasionally. This can save a considerable degree of local resources. Increasingly, this resource
efficiency is brought in connection with the sustainable use of ICT systems.
The workforce reduction in particular in the area of internal corporate services and in the area of IT development over the same
period last year led to a decrease in personnel expenses of EUR 0.83 million from EUR 3.51 million to EUR 2.68 million. Other
operating expenses increased slightly compared to the same period last year by EUR 0.05 million to EUR 1.14 million. These expenses
comprise also external development and sales resources.
EBITDA was at EUR –1.85 million (previous year : EUR –1.04 million). In particular, lower sales while increased by the special effects
of staff reductions still high labour costs and higher other operating expenses have contributed to this. Earnings were negative
with EUR –1.49 million (previous year : EUR –0.89 million). Compared to last half year of 2012, the impact of cost reductions is
already apparent, despite the significantly lower sales.
TO OUR SHAREHOLDERS | INTERIM GROUP MANAGEMENT REPORT | INTERIM CONSOLIDATED FINANCIAL STATEMENTS | FURTHER INFORMATION
11

–1.0
–0.5
0.0
0.5
1.0
1.5
Earnings*EBITDASales
Q3 2012 Q4 2012 Q1 2013 Q2 2013 Q3 2013
–0.42
–0.61–0.53 –0.55
–0.41
–0.55
–0.81
–0.68 –0.67
–0.50
1.161.11
0.680.56
0.51
*After share of non-controlling shareholders
Development (sales, EBITDA, earnings) — Segment Services in EUR million
TO OUR SHAREHOLDERS | INTERIM GROUP MANAGEMENT REPORT | INTERIM CONSOLIDATED FINANCIAL STATEMENTS | FURTHER INFORMATION
12

–2
0
2
4
6
Earnings*EBITDASales
Q3 2012 Q4 2012 Q1 2013 Q2 2013 Q3 2013 *After share of non-controlling shareholders
–0.38
–1.12–0.80
–0.15 –0.04
–0.46
–0.87
–0.47
0.380.56
4.86
3.74
2.56
3.40
4.39
Segment Renewable Energies
The segment Renewable Energies is a well diversified area. The trade with solar system technology thereby consists of thermal
solar plants for solar heat generation, regulation, heat storage and heat distribution as well as photovoltaic systems. The service
portfolio ranges from system solutions for single-family homes up to very large solar plants. Furthermore this segment includes,
among others, the development, production and trade of products for the electrical industry and environmental technology goods
for thermal solar plants and plants for electricity generation from heat.
The segment Renewable Energies saw an increase in sales from EUR 9.14 million to EUR 10.35 million in the first nine months of
2013 compared to the previous year.
Gross profit in the segment Renewable Energies is with EUR 4.41 million EUR 2.59 million above the previous year (EUR 1.82 mil-
lion). It makes up roughly 43 % of sales, while in the first nine months of 2012 it accounted for only approximately 20 % of sales.
Slightly decreased personnel expenses and higher other operating costs led to EBITDA, which increased by EUR 2.36 million over
the same period last year and with EUR 0.47 million is positive for the first time in this segment.
Higher depreciation on fixed assets and a higher negative financial result (an increase of EUR 0.74 million compared to the previous
year) — both primarily due to the depreciation and the financial needs of the project Adelebsen — have contributed to the segment
Renewable Energies’ earnings for the first nine months of 2013 (EUR –0.99 million) being still negative million but EUR 0.83 million
above the level of the previous year (EUR –1.82 million). With EUR –0.04 million earnings were almost balanced in the third quar-
ter of 2013.
Development (sales, EBITDA, earnings) — Segment Renewable Energies in EUR million
TO OUR SHAREHOLDERS | INTERIM GROUP MANAGEMENT REPORT | INTERIM CONSOLIDATED FINANCIAL STATEMENTS | FURTHER INFORMATION
13

Holding/Consolidation
The Holding activities together with the necessary Group consolidations are pooled in Holding/Consolidation.
Holding/Consolidation reported sales of EUR –2.00 million (previous year : EUR –3.42 million) in the reporting period. These com-
prise of the sales of the Holding and sales consolidations. These sales consolidations result mainly from the consolidation of the
sales between the segments as well as from the consolidation of services within the Group.
EBITDA in the first half year amounts to EUR –3.12 million (previous year : EUR –4.08 million) and is substantially shaped by staff
costs in the amount of EUR 2.53 million (previous year : EUR 2.11 million) and other operating income/expenses in the amount of
EUR 1.36 million (previous year : EUR 1.34 million). Concerning personnel costs it has to be considered that employees from the
finance and legal sector as well as from the Competence Centre Renewable Energies are assigned to the parent company. The
largest percentage within other operating income/expenses refers to legal and consulting costs and the inter-company billing of
services.
Starting from EBITDA higher depreciation and a lower financial result have contributed to the negative earnings of EUR –2.60 mil-
lion in the first nine months of 2013 compared to EUR –4.51 million in the corresponding period last year.
TO OUR SHAREHOLDERS | INTERIM GROUP MANAGEMENT REPORT | INTERIM CONSOLIDATED FINANCIAL STATEMENTS | FURTHER INFORMATION
14

–2.5
–2.0
–1.5
–1.0
–0.5
0.0
0.5
Earnings*EBITDASales
Q3 2012 Q4 2012 Q1 2013 Q2 2013 Q3 2013
–2.19
–0.49
–0.97
–0.63
–1.00
–2.18
–1.28
–1.10–0.97
–1.05–1.16
–0.81 –0.78–0.65
–0.57
*Group earnings Holding/Consolidation before profit transfer
Development (sales, EBITDA, earnings) — Holding/Consolidation in EUR million
TO OUR SHAREHOLDERS | INTERIM GROUP MANAGEMENT REPORT | INTERIM CONSOLIDATED FINANCIAL STATEMENTS | FURTHER INFORMATION
15
0
10
20
30
40
50
60
70
80
90
December 31, 2008 December 31, 2009 December 31, 2010 December 31, 2011 December 31, 2012 September 30, 2013
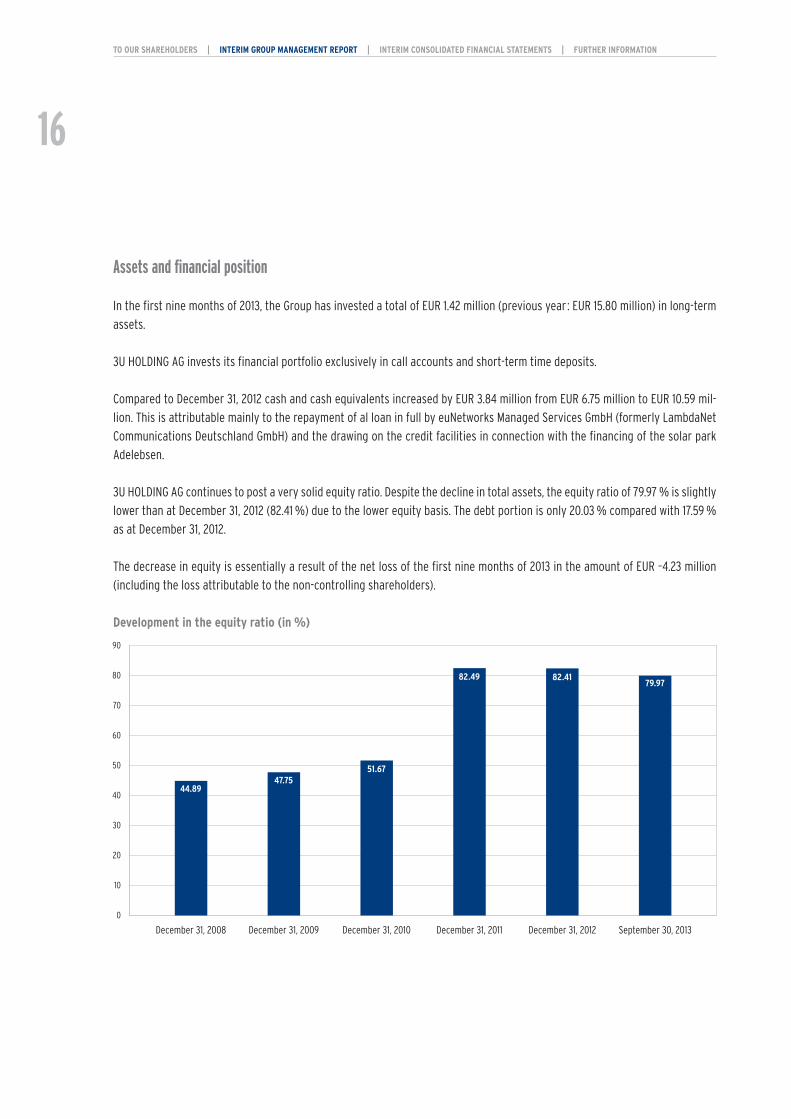
44.8947.75
51.67
82.49 82.4179.97
Assets and financial position
In the first nine months of 2013, the Group has invested a total of EUR 1.42 million (previous year : EUR 15.80 million) in long-term
assets.
3U HOLDING AG invests its financial portfolio exclusively in call accounts and short-term time deposits.
Compared to December 31, 2012 cash and cash equivalents increased by EUR 3.84 million from EUR 6.75 million to EUR 10.59 mil-
lion. This is attributable mainly to the repayment of al loan in full by euNetworks Managed Services GmbH (formerly LambdaNet
Communications Deutschland GmbH) and the drawing on the credit facilities in connection with the financing of the solar park
Adelebsen.
3U HOLDING AG continues to post a very solid equity ratio. Despite the decline in total assets, the equity ratio of 79.97 % is slightly
lower than at December 31, 2012 (82.41 %) due to the lower equity basis. The debt portion is only 20.03 % compared with 17.59 %
as at December 31, 2012.
The decrease in equity is essentially a result of the net loss of the first nine months of 2013 in the amount of EUR –4.23 million
(including the loss attributable to the non-controlling shareholders).
Development in the equity ratio (in %)
TO OUR SHAREHOLDERS | INTERIM GROUP MANAGEMENT REPORT | INTERIM CONSOLIDATED FINANCIAL STATEMENTS | FURTHER INFORMATION
16

Overview balance sheet items September 30, 2013 December 31, 2012
TEUR % TEUR %
Long-term assets 36,918 63.6 43,438 70.6
Fixed assets 36,040 62.1 42,473 69.0
Deferred tax assets 574 1.0 599 1.0
Other non-current assets 304 0.5 366 0.6
Current assets 21,124 36.4 18,122 29.4
Inventories 2,240 3.9 2,000 3.2
Trade receivables 6,169 10.6 6,255 10.2
Other current assets 2,126 3.7 3,121 5.1
Cash and cash equivalents 10,589 18.2 6,746 10.9
Assets 58,042 100.0 61,560 100.0
Long-term liabilities 50,425 86.9 54,408 88.4
Equity attributable to 3U HOLDING AG shareholders 47,694 82.2 52,795 85.8
Interests of non-controlling shareholders –1,275 –2.2 –2,065 –3.4
Provisions and liabilities 4,006 6.9 3,678 6.0
Current liabilities 7,617 13.1 7,152 11.6
Trade payables 2,293 3.9 3,201 5.2
Other provisions and liabilities 5,324 9.2 3,951 6.4
Liabilities 58,042 100.0 61,560 100.0
The balance sheet total as at September 30, 2013 amounted to EUR 58.04 million (December 31, 2012 : EUR 61.56 million) and
decreased thus by EUR 3.52 million compared to change of fiscal year. The reasons for the changes compared to December 31, 2012
relate primarily to the decline of fixed assets partly due to write-downs and to the reduction of financial assets due to the full
repayment of a loan in the first nine months of fiscal year 2013. An opposite effect had the increase in cash and cash equivalent.
Fixed assets in the amount of EUR 36.04 million (December 31, 2012 : EUR 42.47 million) comprises besides intangible assets
(EUR 0.72 million resp. EUR 0.84 million as at December 31, 2012), fixed assets (EUR 29.56 million resp. EUR 29.66 million as at
December 31, 2012) and financial assets (EUR 0.00 million resp. EUR 6.86 million as at December 31, 2012) also investment proper-
ties in the amount of EUR 5.22 million (December 31, 2012 : EUR 5.11 million). These relate to the parts of the properties to be rented
TO OUR SHAREHOLDERS | INTERIM GROUP MANAGEMENT REPORT | INTERIM CONSOLIDATED FINANCIAL STATEMENTS | FURTHER INFORMATION
17

out in Adelebsen and Montabaur. EUR 6.26 million of the financial assets consisted of a loan granted to the former subsidiary
LambdaNet Communications Deutschland GmbH, which was fully repaid prematurely.
As at September 30, 2013 current assets are approximately EUR 3.00 million higher than at December 31, 2012. Besides the liquid
funds another major addition to the current assets are receivables from goods and services, which have decreased from
EUR 6.26 million to EUR 6.17 million, compared to December 31, 2012. In addition, other current assets are significantly reduced due
to tax refunds.
On the liabilities side, next to the reduction in equity due to the loss of the first nine months of fiscal year 2013, the liabilities from
trade accounts payable decreased to EUR 2.29 million (December 31, 2012 : EUR 3.20 million).
The long-term debt increased — despite the ongoing scheduled loan repayments — by taking a loan to finance the facility in Linz
to EUR 3.56 million (December 31, 2012 : EUR 3.41 million). The short-term debt in the amount of EUR 1.51 million results from taking
up a loan with a maturity date of four months, which is scheduled to be repaid on November 4, 2013.
Due mainly to the negative result of the period, operating cash flow in the first nine months amounted to EUR –2.50 million (pre-
vious year : EUR –10.62 million) while it was EUR –2.92 million after the first six months of 2013 (previous year : EUR –8.48 million).
Cash flow from investing activities is influenced by the costs of investment in tangible assets as well as received loan repayments
in the amount of EUR 6.26 million. Cash flow from investing activities in the amount of EUR 4.85 million (previous year :
EUR –13.95 million) is EUR 18.80 million higher than in the previous year. In the same period last year, investments in tangible fixed
assets were characterized by the investment in the solar park Adelebsen.
Cash flow from financing activities is positive with EUR 1.47 million (previous year : EUR 0.36 million). It results primarily from the
proceeds from the loan taken for the property at the site in Linz and the raising of credit with a fixed maturity in the scope of
financing the solar park Adelebsen.
The 3U Group was in a position to meet its payment obligations at all times. The liquidity situation is comfortable as at Septem-
ber 30, 2013 and has substantially improved since June 30, 2013. On February 28, 2013 a framework credit agreement to finance
the PV project in Adelebsen was signed. From that the Group will accrue up to EUR 14.0 million. This will improve the liquidity
position of the Group significantly. Until September 30, 2013, these funds were only accessed as part of a forward loan in the
amount of EUR 1.50 million.
TO OUR SHAREHOLDERS | INTERIM GROUP MANAGEMENT REPORT | INTERIM CONSOLIDATED FINANCIAL STATEMENTS | FURTHER INFORMATION
18

The following cash flow statement shows the change in cash and has been prepared in accordance with the Company’s reported
cash flows (without correction in funds).
Cash flow statement (in TEUR) Sep 30, 2013 Sep 30, 2012
Cash flow 3,822 –24,214
Cash flows from operating activities –2,500 –10,618
Cash flows from investing activities 4,848 –13,951
Cash flows from financing activities 1,474 355
Exchange rate changes 5 –1
Consolidation-related change 16 63
Changes in cash and cash equivalents 3,843 –24,152
Cash and cash equivalents at beginning of period* 6,746 31,872
Cash and cash equivalents at end of period* 10,589 7,720
*Incl. fixed deposits as collateral in the amount of EUR 1.5 million
Statement concerning the financial situation
The Management Board views the financial situation of the Company at the time of drawing up of this report as unsatisfactory
overall; however, the restructuring program initiated in 2012 is starting to show results, so that the economic situation of the
Company has improved considerably at the end of the third quarter. After personnel adjustments were made in the first half of
2013, the Management Board had decided on a further extensive downsizing at the beginning of the third quarter which has been
implemented in the meantime.
Not the least due to those recently approved personnel actions, the personnel costs are significantly reduced, and the Group is
on track to continue the turnaround in the current year.
Sales in the Group are below expectations at the end of the reporting period, mainly because the order postponements in the seg-
ment Renewable Energies due to the unusually severe and long winter have not been completely caught up in the second half. In
addition, the sales in the segment Services are below the budgeted figures as well.
Looking at sales one has to notice that sales in the segment Telephony dropped by EUR 24.24 million compared to the previous
year due to the decrease in sales in the low-margin area of wholesale/value-added services. Since the beginning of the year, how-
ever, sales have stabilized in this segment. After recording a sales increase of 5.4 % in the second quarter compared to the first
quarter 2013, sales in the third quarter decreased by 6.1 % compared to the second quarter.
The changes in the segments Telephony and Renewable Energies confront the Group as a whole with new challenges. To meet these
challenges, it is necessary to re-align the two segments and make appropriate adjustments. Due to the restructuring program
TO OUR SHAREHOLDERS | INTERIM GROUP MANAGEMENT REPORT | INTERIM CONSOLIDATED FINANCIAL STATEMENTS | FURTHER INFORMATION
19

0
2
4
6
8
10
12
2013*2012201120102009
Services Renewable Energies Holding/ConsolidationTelephony
0.59 0.520.240.060.13
10.289.39
0.340.07
7.95
2.51
0.130.17 0.50
3.40
0.040.16 0.00
2.07
0.29
*Until September 30, 2013
initiated in 2012 the Group should be able to achieve an almost balanced operational result for the second half of the year 2013
and to be profitable again in 2014.
Investments/Divestments
Investments of EUR 1.42 million (previous year : EUR 15.80 million) in intangible assets, property and equipment were made within
the Group during the first nine months of 2013.
EUR 0.59 million were invested in the segment Telephony (previous year : EUR 0.33 million). The investments in the segments
Services and Renewable Energies add up to EUR 0.06 million resp. EUR 0.24 million after EUR 0.12 million resp. EUR 6.68 million in
the responding time period of 2012. Investments in tangible assets of the Holding amounted to EUR 0.52 million in the first nine
months of 2013 (previous year : EUR 8.97 million).
Investments of roughly EUR 2.41 million in the existing business segments are planned for the financial year 2013. Thereof,
EUR 1.06 million will be invested in the segment Telephony, EUR 0.15 million in the segment Services, EUR 0.32 million in the seg-
ment Renewable Energies and EUR 0.88 million in the holding company.
Development of investments in EUR million
Non-financial performance indicators
It is above all the men and women that work for 3U HOLDING AG and its portfolio companies that are responsible for business
success. Their identification with the 3U Group and commitment to its goals is therefore a top priority.
TO OUR SHAREHOLDERS | INTERIM GROUP MANAGEMENT REPORT | INTERIM CONSOLIDATED FINANCIAL STATEMENTS | FURTHER INFORMATION
20

0
20
40
60
80
100
120
140
160
180
January to September 2013: 151 employeesJanuary to September 2012: 166 employees
Services Renewable Energies HoldingTelephony
32
51
47
21
33
47
71
15
*Full-time equivalents
Staff*
On the financial statement date the 3U Group employed 131 people (previous year : 184) after 187 staff as at December 31, 2012. On
average the staff count amounted to 151 (previous year : 166). The decrease in the number of employees in 2013 is primarily attribut -
able to the reduction in staff in the loss causing Subsidiaries and fluctuation within the Group. Within the segment Renewable
Energies the staff count increased at the Subsidiaries ClimaLevel Energiesysteme and Selfio. The average number of employees
in the individual divisions is made up as follows :
Our employees contribute decisively with their ideas to greater efficiency and competitiveness. Therefore, a cooperative com-
munication aiding climate in the Group is encouraged, as all employees are motivated to make suggestions for the optimization
of products and processes synergies and other improvements within the Group. The remuneration system is broken down into fixed
and variable elements depending on the job, so that superior performance can be rewarded accordingly.
Promoting employee health
We understand health as defined by the World Health Organization (WHO) as psychic, physical and social wellbeing. To preserve
and promote the health of our employees, we have implemented selective measures in the Group. Thus the Group supports the
health care of its employees, for example, with subsidized sports offers, free flu shots and with training to prevent stress.
Employees also have the opportunity to attend internal and external training and educational events. Their bond with 3U is
reinforced by a series of measures in which social aspects are at centre-stage.
Safety at the workplace is enhanced by appropriate training. Like in 2012, no employee was significantly harmed by an accident
at work in 2013 as well.
TO OUR SHAREHOLDERS | INTERIM GROUP MANAGEMENT REPORT | INTERIM CONSOLIDATED FINANCIAL STATEMENTS | FURTHER INFORMATION
21

Detailed information on stock option plan
By way of resolution dated August 19, 2010, the Annual General Meeting authorised contingent capital of up to EUR 4,684,224.00
for issuing stock options to members of the Management Board, executives and employees in the context of a stock option plan
and authorised the Management Board accordingly. With the approval of the Supervisory Board, the Management Board made use
of this authorisation on February 7, 2011 and established a stock option plan for 2011.
Stock option plan 2011
The stock option plan (SOP) 2011 has the following key details :
The following are beneficiaries :
Group 1 : Members of the Company’s Management Board
Group 2 : Employees of the Company and affiliated companies in Germany and abroad in key positions at the first level of
management below the Management Board as well as members of the management of affiliated companies in Germany
and abroad (Article 15 of the German Stock Corporation Act)
Group 3 : All other employees of the Company and of the affiliated companies in Germany and abroad (Article 15 of the German
Stock Corporation Act)
A total of 4,602,500 stock options were issued within the scope of the SOP 2011. The distribution between the individual groups is
as follows (the value in parentheses indicates the maximum number of shares to possibly be issued) :
Group 1 : 400,000 (of 468,422) stock options
Group 2 : 2,800,000 (of 2,810,535) stock options
Group 3 : 1,402,500 (of 1,405,267) stock options
Total : 4,602,500 (of 4,684,224) stock options
The SOP 2011 has a term of five years. The non-transferable option rights can be exercised after a four-year qualifying period on
February 7, 2015 at the earliest and no later than February 6, 2016. The option rights may only be exercised within a period of fifteen
banking days in Frankfurt am Main following the publication of the annual financial statements and/or consolidated financial
statements, the Annual General Meeting or the publication of a quarterly report and/or the annual report. The options are not trans-
ferable. Each option right authorizes the purchase of a share in the company at the exercise price. The exercise price for the
options is EUR 1.00 per share. At the time of inception of the SOP on February 7, 2011 the share was quoted at EUR 0.66, the premium
thus amounted to 51.5 %. The beneficiary may only sell shares received through the exercise of stock options within a month of
the publication of the quarterly reports or after the publication of periodical reporting.
Of the 4,602,500 options issued in the framework of the SOP 1,282,500 options were forfeited at the balance sheet date.
Forfeited are in:
• 2011 : 582,500 stock options
• 2012: 365,000 stock options
• 2013: 335,000 stock options (until September 30, 2013)
TO OUR SHAREHOLDERS | INTERIM GROUP MANAGEMENT REPORT | INTERIM CONSOLIDATED FINANCIAL STATEMENTS | FURTHER INFORMATION
22

Related parties report
There were no extraordinary changes or developments in business relations with related parties in the first nine months of the
current financial year as against December 31, 2012. Please refer to our presentation in the Annual Report 2012. All transactions
with related parties were conducted on usual market conditions.
Report on risks and opportunities
As of September 30, 2013 there were no material changes in risks and their assessment as reported in detail in the Annual Report
2012.
Significant events since the end of the interim reporting period
On October 24, 2013 3U TELECOM GmbH announced the acquisition of a data centre in Hanover with an area of approx. 600 square
meters. In this promising field of business 3U plans to acquire additional data centres to meet the demand of the customers.
There have been no other significant events since the end of the interim reporting period.
TO OUR SHAREHOLDERS | INTERIM GROUP MANAGEMENT REPORT | INTERIM CONSOLIDATED FINANCIAL STATEMENTS | FURTHER INFORMATION
23

Outlook
Economic outlook
According to the Projektgruppe Gemeinschaftsdiagnose (joint prognosis by leading German economic institutions) the world
economy picked up in the first half year of 2013. Not seen in a long time; the recovery was lead by the advanced economies.
The slightly faster pace of world economic growth in the first half of 2013 will be sustained in the second half of the year, as well
as in 2014. Thus, the indicators for the expectations of firms and households have increased significantly in almost all advanced
economies lately.
The relevant sentiment indicators also point to a gradual economic recovery in the Euro zone. The economic sentiment indicator
calculated by the European Commission has improved significantly since October 2012. An important reason for the rising senti-
ment is that doubts concerning the cohesion of the monetary union have decreased. Due to lower uncertainty, the willingness to
consume and invest should continue to strengthen.
However, a strong recovery is not in sight in the Euro zone. At least, the economic performance in most member countries will
increase moderately in the coming months. Due to the decline in recent quarters there should be a decrease of 0.4 % in production
in the Euro zone, while in 2014 it should increase by 0.9 %, under the assumption that the crisis in the Euro zone does not intensify
again. There are no guarantees, however, that re-forms will be rigorously and successfully implemented in the crisis-afflicted
countries. Should there be a noticeable slowdown, or even a failure in the structural adjustment processes in the crisis states of
the Euro zone, a clear fall in confidence could result that would heavily burden the economy.
The German economy is on the verge of an upturn in autumn 2013. Livelier growth in the world economy and decreasing uncer-
tainty about the crisis in the Euro zone are creating an environment in which favourable domestic economic conditions have a
greater bearing. Rising employment and considerable increases in wages have been responsible for a robust development in
private consumption for some time. The leading economic institutes in Germany expect gross domestic product to increase by
0.4 % this year. Gross domestic product is expected to increase by 1.8 % in the year ahead. The labour market is expected to
improve further. Due to the considerable immigration, the number of employees will rise faster than the number of unemployed
will decrease.
The inflation rate, which should be around 1.6 % in the current year, is predicted to rise to 1.9 % in 2014.
Outlook Telephony
According to a study by the (German) Association of Telecommunications and Value-Added Services (VATM) and Dialog Consult
regarding the telecommunications market in Germany 2013, the telecommunications sector has shrunk by EUR 0.6 billion to
EUR 59.6 billion. This represents a year on year decline of 1 %. Sales in the mobile sector will rise slightly by around EUR 0.3 billion
to EUR 25.1 billion (+1.2 %), the fixed-line telecommunications will decrease by EUR 1.3 billion to EUR 29.7 billion. Cable operators
increase their sales significantly by EUR 0.4 billion (+9.1 %).
TO OUR SHAREHOLDERS | INTERIM GROUP MANAGEMENT REPORT | INTERIM CONSOLIDATED FINANCIAL STATEMENTS | FURTHER INFORMATION
24
Alternative telecommunications providers recorded an overall slight decline by 1.9 % to EUR 15.2 billion (EUR –0.3 billion) in the
fixed line segment. Sales of Deutsche Telekom dropped by 6.5 % to EUR 14.5 billion in this area. In the mobile sector the competitors
stay on the level of 2012 with sales of EUR 17.6 billion.
The level of capital expenditures increases by 6.7 % and amounts to EUR 6.4 billion (2012 : EUR 6.0 billion). Competitors of Deutsche
Telekom again carried more than half of the total investments of EUR 3.4 billion with 53 %. Alternative providers have invested
almost EUR 58.2 billion since the market liberalization began.
Because of the volatility of the call-by-call market, a mid-term market forecast is difficult. As in previous years, the market is
likely to shrink, even if this process may slow down. After the market declined by 33 % resp. 34 % in the years 2010 and 2011, the
market decreased by around 10 % in 2012. A similar decrease is expected for 2013. Thus, the relevant market for us has shrunk to
around a quarter since 2008.
It is therefore all the more important that the diversification of the Group in the other segments is advanced but to occupy new
niches in the segment Telephony as well. The expansion in the business field operation of own data centres will play a significant
role in the future.
Against this background, the Management Board expects a positive contribution of the segment Telephony both in 2013 and in 2014.
Outlook Services
Especially with the topics cloud computing as well as IT and business consulting external customers are addressed. In cloud
computing, IT services are provided in the right quantities and flexible in real-time as a service via the Internet and billed accord-
ing to use. In cloud computing various technical improvements and innovations converge and create the potential for a base
innovation in the business field. Cost reduction, cost structure changes, cost variability, flexibility and entirely new business
models are other important arguments. It is expected that cloud computing will change the entire information economy, its tech-
nologies and its business and therefore the relationship between suppliers and consumers for the long term. With a rapid adoption
of cloud computing in business, the demand for technical infrastructure expertise decreases. For software vendors the traditional
licensing business will shift in the direction of “Software-as-a-Service”.
Market experts attest good growth prospects for the respective 3U service offers such as IT services, cloud computing, consulting
services and marketing and distribution support.
According to a current study by Verband der deutschen Internetwirtschaft eco (Association of the German Internet Industry) and
the consultancy Arthur D. Little, providers of internet services and applications are expected to experience sales growth to around
EUR 9.6 billion by 2016. Given today’s volume of approx. EUR 3.7 billion, this is an overall rise of more than 150 %, or an annual growth
rate of 37 %. Cloud computing in particular is growing in importance, because there is a growing acceptance of outsourcing data
processing. It is becoming easier to use since more and more apps on mobile devices are accessing cloud services.
TO OUR SHAREHOLDERS | INTERIM GROUP MANAGEMENT REPORT | INTERIM CONSOLIDATED FINANCIAL STATEMENTS | FURTHER INFORMATION
25
Since the protection of key corporate assets, data and information is becoming increasingly important, the market acceptance
of the products from the segment Services increases.
Outlook Renewable Energies
The importance of renewable energies as an economic factor is increasing not only in Germany, but also globally. With the segment
Renewable Energies, the Group participates in the progressive change in energy sustainability and the trend towards saving
resources and thus improving energy efficiency. In addition to expanding the businesses already active in the market an increase
of the activities around the subject of heating, cooling and ventilation of buildings, which already perform well, look promising.
The framework conditions are largely determined in this business field by the Renewable Energy Sources Act (EEG). CDU/CSU and
SPD plan in the event of a grand coalition the reform of the EEG to slow the increase in electricity prices. Should there be a grand
coalition a reform is aimed to Easter 2014, so that the law could be passed by the summer of 2014 by the Bundestag and the
Bundesrat and to come into force early 2015 at the latest. Both CDU/CSU and SPD aim to ensure that the new EEG is created as a
long-term fundamental regulatory framework, which gives planning reliability to all involved. Depending on how the EEG is
designed, the chances-/risk-profile of renewable energy projects will change. Accordingly, the development is monitored closely
by us.
Due to the already existing diversification of the segment, 3U is well positioned and therefore the Management Board anticipates
further growth in this segment and from 2014 positive earnings contributions.
Strategic direction
Lasting operative profitability in the segments is the top priority for the Group. Due to the unsatisfactory business development
since 2012 a number of measures had to be implemented to counteract this development in the last quarters. For this purpose,
among others, especially the sales and marketing resources for Telephony and Renewable Energies were reduced in the segment
Services. It also came to staff reductions in the segment Renewable Energies in the field services and consultancy. The aim of these
measures is a significant cost reduction and a focus on higher-margin sales.
While the segment Telephony will continue to shrink, the segments Services and Renewable Energies are expanded. In addition
to expanding the business through organic growth the comfortable level of capital and the associated good credit rating allows
the Group also inorganic growth especially in the segment Renewable Energies. The 3U Group pursues a strategy to retain success -
ful businesses in the long term, but also to sell them if attractive offers arise.
TO OUR SHAREHOLDERS | INTERIM GROUP MANAGEMENT REPORT | INTERIM CONSOLIDATED FINANCIAL STATEMENTS | FURTHER INFORMATION
26
Outlook 3U Group
The 3U Group has launched a series of measures in the current year that have resulted in the Group being better positioned at
the end of the third quarter to meet the challenges ahead. For this purpose it was necessary to separate from loss-making activities
and in some instances also from staff. The already implemented resp. initiated activities also shape the end of the fiscal year 2013.
Since 3U HOLDING AG had approximately 30 % less staff at the balance sheet date than at the beginning of the year, it has become
necessary to adjust the forecast for the current fiscal year and 2014. It should be noted that the forecast quality is
subject to the influence of the very dynamic development of the individual business field.
That said the Management Board of 3U HOLDING AG expects for the fiscal year 2013 consolidated sales of between EUR 38 million
to EUR 40 million and EBITDA of EUR –3.5 million to EUR –2.5 million. The earnings forecast of between EUR –4.5 million and
EUR –3.0 million remains unchanged. For 2014, the Management Board anticipates sales of between EUR 44 million and EUR 49 mil-
lion, EBITDA between EUR –0.5 million and EUR 1.5 million and earnings of between EUR –3.5 million to EUR –1.5 million. With this
forecast it should be noted that the partial or entire sale of Subsidiaries belongs to the corporate purpose of 3U HOLDING AG as
a holding company and can lead to positive special effects. However, there are limitations to plan net income therefrom and is
therefore disregarded in the preceding prognosis. In addition, 3U HOLDING AG plans to grow inorganically through acquisitions in
2014. Resulting effects from this are also disregarded in the prognosis.
The goal of all activities is to sustainably enhance the value of the 3U Group for the shareholders, but also for our employees. The
success of those efforts will be reflected in a positive price trend for the 3U share.
With regard to the estimates and expectations presented, we point out that the actual future events can differ significantly from
our expectations concerning the probable development.
Marburg, in November 2013
The Management Board
Michael Schmidt Christoph Hellrung Andreas Odenbreit
TO OUR SHAREHOLDERS | INTERIM GROUP MANAGEMENT REPORT | INTERIM CONSOLIDATED FINANCIAL STATEMENTS | FURTHER INFORMATION
27

Balance sheet as of September 30, 2013
Assets September 30, December 31,3U Group (in TEUR) 2013 2012
Long-term assets 36,918 43,438
Intangible assets 722 842
Property, plant and equipment 29,564 29,662
Investment properties 5,216 5,109
Financial assets 0 6,256
Accounted investments using the equity method 538 604
Deferred tax assets 574 599
Other long-term assets 304 366
Current assets 21,124 18,122
Inventories 2,240 2,000
Trade receivables 6,169 6,255
Other current assets 2,126 3,121
Cash and cash equivalents 10,589 6,746
Total assets 58,042 61,560
TO OUR SHAREHOLDERS | INTERIM GROUP MANAGEMENT REPORT | INTERIM CONSOLIDATED FINANCIAL STATEMENTS | FURTHER INFORMATION
28

Shareholders’ equity and liabilities September 30, December 31,3U Group (in TEUR) 2013 2012
Shareholders’ equity 46,419 50,730
Issued capital (conditional capital TEUR 4,684 / December 31, 2012: TEUR 4,684) 35,314 35,314
Capital reserve 25,145 25,037
Own shares –159 0
Retained earnings 692 692
Adjustment item for currency difference 9 2
Profit/loss carried forward –9,713 1,132
Net income/loss –3,594 –9,382
Total shareholders’ equity attributable to the shareholders of 3U HOLDING AG 47,694 52,795
Interests of non-controlling shareholders –1,275 –2,065
Long-term provisions and liabilities 4,006 3,678
Long-term provisions 363 158
Long-term liabilities due to banks 3,556 3,413
Deferred taxes 87 107
Current provisions and liabilities 7,617 7,152
Current provisions 569 528
Short-term tax liabilities 163 23
Short-term liabilities due to banks 1,510 13
Trade payables 2,293 3,201
Other current liabilities 3,082 3,387
Total shareholders’ equity and liabilities 58,042 61,560
TO OUR SHAREHOLDERS | INTERIM GROUP MANAGEMENT REPORT | INTERIM CONSOLIDATED FINANCIAL STATEMENTS | FURTHER INFORMATION
29
Income statement
3U Group (in TEUR) 3-months report 9-months reportJuly 1– September 30 January 1– September 302013 2012 2013 2012
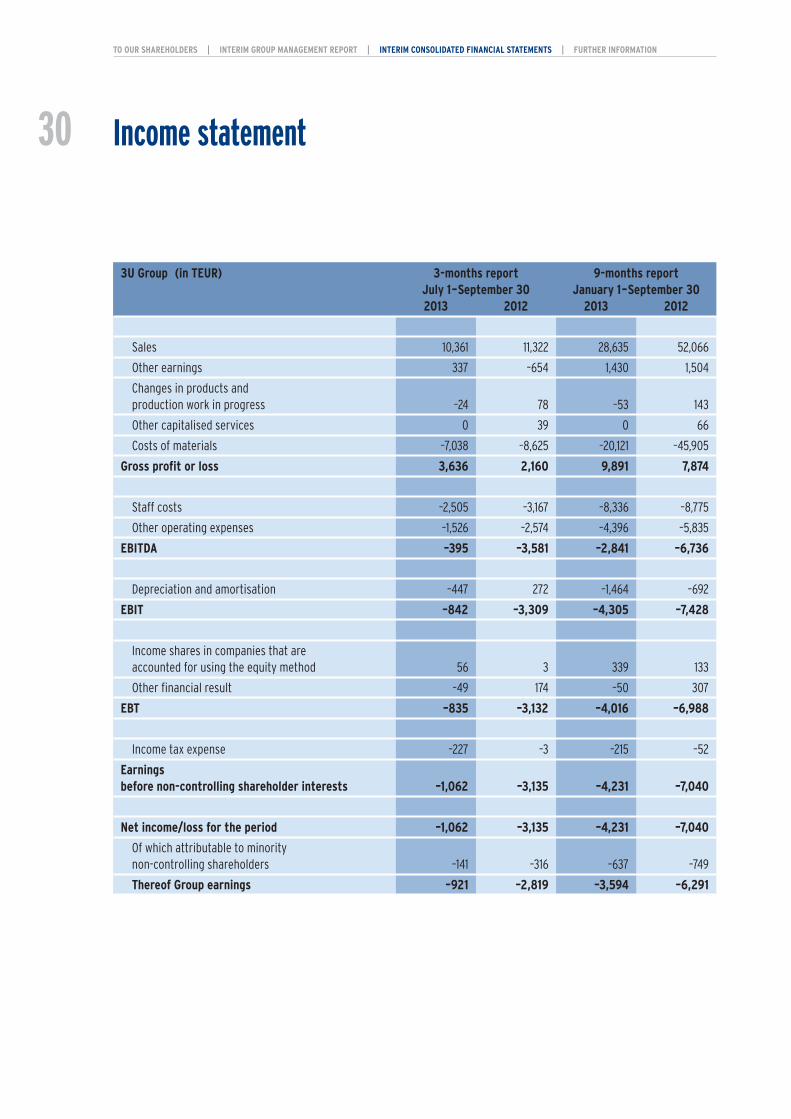
Sales 10,361 11,322 28,635 52,066
Other earnings 337 –654 1,430 1,504
Changes in products and production work in progress –24 78 –53 143
Other capitalised services 0 39 0 66
Costs of materials –7,038 –8,625 –20,121 –45,905
Gross profit or loss 3,636 2,160 9,891 7,874
Staff costs –2,505 –3,167 –8,336 –8,775
Other operating expenses –1,526 –2,574 –4,396 –5,835
EBITDA –395 –3,581 –2,841 –6,736
Depreciation and amortisation –447 272 –1,464 –692
EBIT –842 –3,309 –4,305 –7,428
Income shares in companies that are accounted for using the equity method 56 3 339 133
Other financial result –49 174 –50 307
EBT –835 –3,132 –4,016 –6,988
Income tax expense –227 –3 –215 –52
Earnings before non-controlling shareholder interests –1,062 –3,135 –4,231 –7,040
Net income/loss for the period –1,062 –3,135 –4,231 –7,040
Of which attributable to minority non-controlling shareholders –141 –316 –637 –749
Thereof Group earnings –921 –2,819 –3,594 –6,291
TO OUR SHAREHOLDERS | INTERIM GROUP MANAGEMENT REPORT | INTERIM CONSOLIDATED FINANCIAL STATEMENTS | FURTHER INFORMATION
30

Statement of income and accumulated earnings
3U Group (in TEUR) January 1– September 302013 2012
Net income/loss for the period –4,231 –7,040
Attributable to 3U HOLDING AG shareholders –3,594 –6,291
Of which attributable to minority non-controlling shareholders –637 –749
Directly in equity comprised changes
Exchange rate differences 7 1
Change of the value comprised in equity 7 1
Total earnings of the period –4,224 –7,039
Attributable to 3U HOLDING AG shareholders –3,587 –6,290
Of which attributable to minority non-controlling shareholders –637 –749
TO OUR SHAREHOLDERS | INTERIM GROUP MANAGEMENT REPORT | INTERIM CONSOLIDATED FINANCIAL STATEMENTS | FURTHER INFORMATION
31

Statement of changes in equity
3U Group (in TEUR) Issued Capital Own Retained Reserve forcapital reserve shares earnings currency
differences
As of January 1, 2013 35,314 25,037 0 692 2
Rebooking Earnings 2012 0 0 0 0 0
Total earnings 0 0 0 0 7
Acquisition of own shares 2013 0 0 –159 0 0
Stock option plan 2011 0 108 0 0 0
Appropriation of net income by non-controlling interests 0 0 0 0 0
Alteration basis of consolidation 0 0 0 0 0
As of September 30, 2013 35,314 25,145 –159 692 9
3U Group (in TEUR) Issued Capital Own Retained Reserve forcapital reserve shares earnings currency
differences
As of January 1, 2012 39,238 24,269 –3,301 692 1
Rebooking Earnings 2011 0 0 0 0 0
Capital reduction of 3,923,770 shares –3,924 623 3,301 0 0
Dividend payment for financial year 2011 0 0 0 0 0
Stock option plan 2011 0 145 0 0 0
Total earnings 0 0 0 0 1
Alteration basis of consolidation 0 0 0 0 0
As of December 31, 2012 35,314 25,037 0 692 2
TO OUR SHAREHOLDERS | INTERIM GROUP MANAGEMENT REPORT | INTERIM CONSOLIDATED FINANCIAL STATEMENTS | FURTHER INFORMATION
32
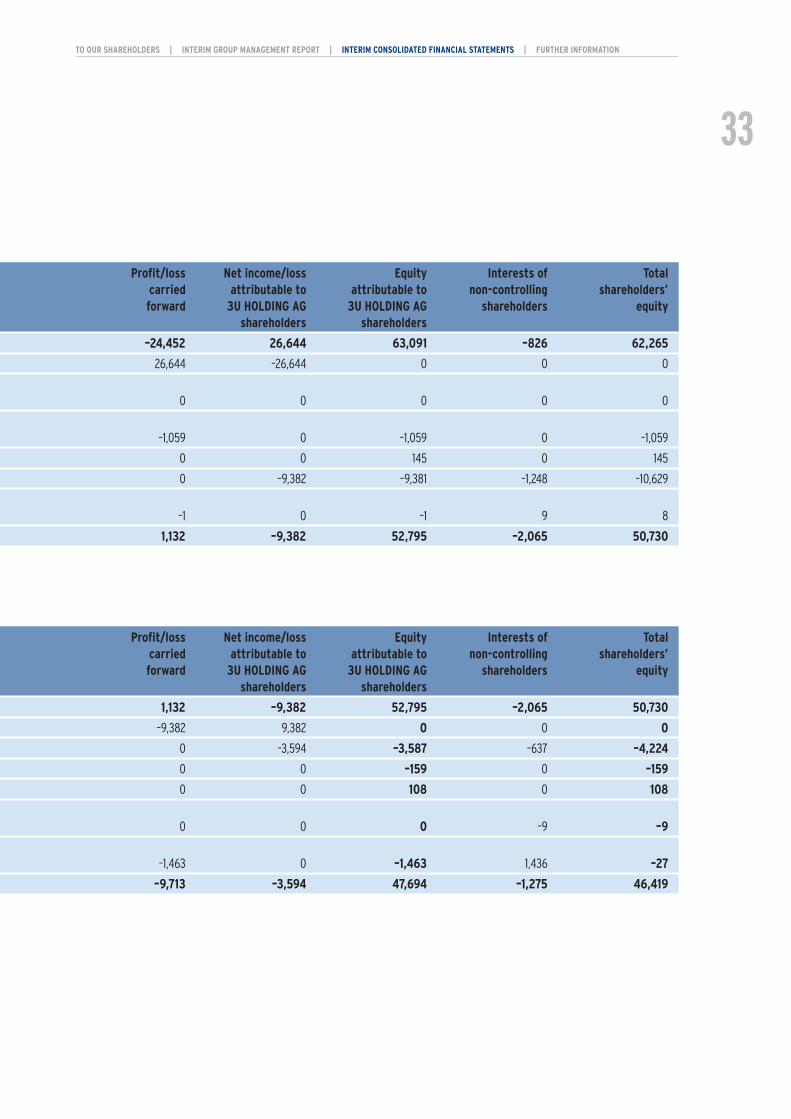
Profit/loss Net income/loss Equity Interests of Totalcarried attributable to attributable to non-controlling shareholders’forward 3U HOLDING AG 3U HOLDING AG shareholders equity
shareholders shareholders
1,132 –9,382 52,795 –2,065 50,730
–9,382 9,382 0 0 0
0 –3,594 –3,587 –637 –4,224
0 0 –159 0 –159
0 0 108 0 108
0 0 0 –9 –9
–1,463 0 –1,463 1,436 –27
–9,713 –3,594 47,694 –1,275 46,419
Profit/loss Net income/loss Equity Interests of Totalcarried attributable to attributable to non-controlling shareholders’forward 3U HOLDING AG 3U HOLDING AG shareholders equity
shareholders shareholders
–24,452 26,644 63,091 –826 62,265
26,644 –26,644 0 0 0
0 0 0 0 0
–1,059 0 –1,059 0 –1,059
0 0 145 0 145
0 –9,382 –9,381 –1,248 –10,629
–1 0 –1 9 8
1,132 –9,382 52,795 –2,065 50,730
TO OUR SHAREHOLDERS | INTERIM GROUP MANAGEMENT REPORT | INTERIM CONSOLIDATED FINANCIAL STATEMENTS | FURTHER INFORMATION
33

Cash flow statement
3U Group (in TEUR) January 1– September 302013 2012
Net income/loss for the period –4,231 –7,040
+/– Depreciation/write-ups of fixed assets 1,464 692
+/– Increase/decrease of provisions 245 1,397
–/+ Profit/loss on disposal of long-term assets 11 1
–/+ Increase/decrease in inventories and trade receivables –154 566
+/– Increase/decrease in trade payables –908 –1,047
+/– Changes to other receivables 1,374 486
+/– Changes to other payables –305 –4,810
+/– Change in tax assets/liabilities including deferred taxes –173 –1,284
+/– Other non-cash changes 177 421
Cash flows from operating activities –2,500 –10,618
+ Inflows from disposals of property, plant and equipment 129 0
– Outflows for investments in property, plant and equipment –1,148 –7,197
+ Inflows from disposals of intangible assets 1 0
– Outflows for investments in intangible assets –136 –104
– Outflows for investments properties –133 –8,423
+ Payments from earnings of associated companies 0 0
+ Inflows from disposal of financial assets 6,256 1,560
– Outflows from additions to financial assets 0 20
+ Cash inflow from the disposal of consolidated companies and other business units 0 205
– Cash outflow from the purchase of consolidated companies and other business units –121 –12
Cash flows from investing activities 4,848 –13,951
Sum carried forward* 2,348 –24,569
*Refer to followowing page
TO OUR SHAREHOLDERS | INTERIM GROUP MANAGEMENT REPORT | INTERIM CONSOLIDATED FINANCIAL STATEMENTS | FURTHER INFORMATION
34

3U Group (in TEUR) January 1– September 302013 2012
Sum carried forward 2,348 –24,569
– Cash outflow to companies’ owner and minority partners (dividends, equity capital payback, purchase of own shares, other disbursements) –168 –1,060
+ Cash inflow from the issuance of debit and borrowing of money 1,820 1,500
– Outflows from the repayment of bonds and (finance) loans –178 –85
– Repayment of lease liabilities 0 0
Cash flows from financing activities 1,474 355
Total cash flows 3,822 –24,214
+/– Change of restrictions on cash and cash equivalents 0 0
+/– Changes in cash and cash equivalents due to exchange rate changes 5 –1
+/– Consolidation-related change in cash and cash equivalents 16 63
Cash and cash equivalents at beginning of period 5,246 31,872
Cash and cash equivalents at end of period 9,089 7,720
Total change in cash and cash equivalents 3,843 –24,152
TO OUR SHAREHOLDERS | INTERIM GROUP MANAGEMENT REPORT | INTERIM CONSOLIDATED FINANCIAL STATEMENTS | FURTHER INFORMATION
35

General information about the Group
3U HOLDING AG (subsequently also referred to as 3U or Company), headquartered in Marburg, is the holding company of the
3U Group and a listed stock corporation. It is registered in the Marburg Main District Court in the Register of Companies under HRB
number 4680.
The business activities of 3U HOLDING AG and its Subsidiaries comprise also the provision of telecommunication services in the
segment Telephony. In addition 3U expanded its activities in the field of Renewable Energies and Services. These are reported in
the segments Renewable Energies and Services.
The address of the registered office of the Company is : Frauenbergstraße 31–33, 35039 Marburg, Germany
Accounting principles
The interim financial report was prepared in accordance with the provisions of the International Financial Reporting Standards (IFRS).
The present interim report has not been reviewed by auditors.
Supplementary disclosures in accordance with IAS 34
The accounting policies and methods of calculation used in the consolidated financial statements as of December 31, 2012 were
applied unchanged for the interim statements as of September 30, 2013.
For details of the order situation and the development of costs and prices please refer to the section “Report on business
development” in the interim Group management report.
For details of the stock option program carried out at the beginning of 2011, we refer to the section “Detailed information on stock
option plan” of this interim report.
For details to the number of employees please refer to the section “Staff” in the interim Group management report.
For details to significant events since the end of the interim reporting period we refer to the section “Significant events since the
end of the interim reporting period” in the interim Group management report.
There were no extraordinary developments in business with related parties and the Company in the first nine months of 2013 as
against the previous year. For information about individual business relations, please refer to our Annual Report of December 31,
2012, Section 8.3.
Explanatory notes to the consolidated financial statements as of September 30, 2013
TO OUR SHAREHOLDERS | INTERIM GROUP MANAGEMENT REPORT | INTERIM CONSOLIDATED FINANCIAL STATEMENTS | FURTHER INFORMATION
36

Basis of consolidation
Compared with December 31, 2012 the following changes to the basis of consolidation have arisen :
The segment Services expanded in early 2013 through the incorporation of a company in USA. weclapp Inc., based in Delaware, USA
and a branch office in San Francisco which should promote the development of the American market. The sales strategy for the
USA provides for direct sales online via www.weclapp.com and indirect sales via sales and service partners.
EuroSun Vacuum Solar Systems GmbH assumed all remaining shares of Tianjin EuroSun Solar Energy Technology Co., Ltd. from the
former joint venture partner Beijing Yongdong Brilliant Heat-pipe Solar Energy Technology Co., Ltd. on January 24, 2013. The com-
pany is thus 100 % owned by EuroSun Vacuum Solar Systems GmbH.
On February 18, 2013, the shareholders of 3U ENERGY AG agreed on a share purchase and transfer agreement. Content of the agree-
ment is the purchase of 12,500 shares (equals 25 % of the shares of the Company) in addition to all subsidiary rights by
3U HOLDING AG for a purchase price totalling EUR 1.00. Thus the share of 3U HOLDING AG in 3U ENERGY AG increases to 99.998 %.
As at September 30, 2013 in addition to 3U HOLDING AG 27 (December 31, 2012: 25) subsidiary companies both within the country
and outside its borders in which 3U HOLDING AG has a direct or indirect majority of votes or the ability to control, are comprised.
TO OUR SHAREHOLDERS | INTERIM GROUP MANAGEMENT REPORT | INTERIM CONSOLIDATED FINANCIAL STATEMENTS | FURTHER INFORMATION
37

Earnings per share
3U Group (in TEUR) 3-months report 9-months reportJuly 1– September 30 January 1– September 302013 2012 2013 2012
Number of shares
As of January 1 resp. September 30 35,189,219 35,314,016 35,314,016 35,314,016
Buyback of own shares in May 2013 — — –55,742 —
Buyback of own shares in June 2013 — — –69,055 —
Buyback of own shares in July 2013 –81,732 — –81,732 —
Buyback of own shares in August 2013 –81,223 — –81,223 —
Buyback of own shares in September 2013 –80,260 — –80,260 —
As of September 30 34,946,004 35,314,016 34,946,004 35,314,016
Weighted average number of ordinary shares for basic earnings per share 34,946,004 35,314,016 35,149,746 35,314,016
Effect of dilutive potential of ordinary shares: options 0 3,700,000 0 3,700,000
Weighted average number of ordinary shares for diluted earnings 34,946,004 39,014,016 35,149,746 39,014,016
Earnings per share
Earnings per share, undiluted (in EUR) –0.03 –0.08 –0.10 –0.18
Earnings per share, diluted (in EUR) –0.03 –0.07 –0.10 –0.16
TO OUR SHAREHOLDERS | INTERIM GROUP MANAGEMENT REPORT | INTERIM CONSOLIDATED FINANCIAL STATEMENTS | FURTHER INFORMATION
38

Segment reporting
In accordance with the regulations of IFRS 8, business segments, the segment reporting of 3U HOLDING AG applies the “Manage-
ment Approach” regarding segment identification.
The information that is regularly made available to the Management Board and Supervisory Board is therefore regarded to be
relevant for the segment presentation.
In accordance with internal reporting, 3U HOLDING AG covers the segments Telephony, Services, Renewable Energies and Holding/
Consolidation within its segment reporting.
The segment Telephony, which consists of the products call-by-call, preselection, added-value services and termination services
in the wholesale sector, is comprised of the original 3U bread and butter business Telephony.
The segment Services consists of IT services, systems development, marketing and consulting
In the segment Renewable Energies all activities of this sector are summarised. It consists of the development, production, trading
and operation of components from the renewable energies area as well as heating and cooling technology.
In addition to the segments described above, both the holding company activities and the required consolidation entries are
collectively reported in holding/consolidation.
Segment reporting follows the intra-segment consolidation, while the inter-segment consolidation occurs on holding level.
A detailed description of the segments is available in the interim Group management report in the business performance
presentation.
TO OUR SHAREHOLDERS | INTERIM GROUP MANAGEMENT REPORT | INTERIM CONSOLIDATED FINANCIAL STATEMENTS | FURTHER INFORMATION
39

Segment reporting (in TEUR) Telephony Services Renew- Subtotal Holding/ GroupJanuary 1–September 30, 2013 able Consoli-
Energies dation
Total sales 22,546 1,861 13,349 37,756 –1,997 35,759
Intercompany sales (intra-segment sales) –4,005 –116 –3,003 –7,124 0 –7,124
Segment sales 18,541 1,745 10,346 30,632 –1,997 28,635
Other operating income 454 242 208 904 526 1,430
Change in inventory 0 0 –53 –53 0 –53
Other capitalised services 0 0 0 0 0 0
Costs of materials –14,078 –9 –6,087 –20,174 53 –20,121
Gross profit or loss 4,917 1,978 4,414 11,309 –1,418 9,891
Staff costs –1,167 –2,684 –1,954 –5,805 –2,531 –8,336
Other operating expense –2,095 –1,141 –1,989 –5,225 829 –4,396
EBITDA 1,655 –1,847 471 279 –3,120 –2,841
Depreciation –180 –19 –902 –1,101 –363 –1,464
EBIT 1,475 –1,866 –431 –822 –3,483 –4,305
EBIT (earnings before interest and income taxes) –4,305
Financial result 289
Profit/loss of companies included at equity 339
Other financial result –50
Income tax –215
Earnings for the period –4,231
Thereof attributable to the shareholders of 3U HOLDING AG –3,594
Of which attributable to minority non-controlling shareholders –637
TO OUR SHAREHOLDERS | INTERIM GROUP MANAGEMENT REPORT | INTERIM CONSOLIDATED FINANCIAL STATEMENTS | FURTHER INFORMATION
40

Segment reporting (in TEUR) Telephony Services Renew- Subtotal Holding/ GroupJanuary 1–September 30, 2012 able Consoli-
Energies dation
Total sales 49,165 3,752 20,131 73,048 –3,420 69,629
Intercompany sales (intra-segment sales) –6,387 –184 –10,992 –17,563 0 –17,563
Segment sales 42,778 3,568 9,139 55,485 –3,419 52,066
Other operating income 1,453 86 205 1,744 –240 1,504
Change in inventory 0 0 143 143 0 143
Other capitalised services 0 0 0 0 66 66
Costs of materials –38,191 –93 –7,663 –45,947 42 –45,905
Gross profit or loss 6,040 3,561 1,824 11,425 –3,551 7,874
Staff costs –1,093 –3,510 –2,065 –6,668 –2,107 –8,775
Other operating expense –4,682 –1,088 –1,644 –7,414 1,579 –5,835
EBITDA 265 –1,037 –1,885 –2,657 –4,079 –6,736
Depreciation –185 –101 –165 –451 –241 –692
EBIT 80 –1,138 –2,050 –3,108 –4,320 –7,428
EBIT (earnings before interest and income taxes) –7,428
Financial result 440
Profit/loss of companies included at equity 133
Other financial result 307
Income tax –52
Earnings for the period –7,040
Thereof attributable to the shareholders of 3U HOLDING AG –6,291
Of which attributable to minority non-controlling shareholders –749
TO OUR SHAREHOLDERS | INTERIM GROUP MANAGEMENT REPORT | INTERIM CONSOLIDATED FINANCIAL STATEMENTS | FURTHER INFORMATION
41

42
TO OUR SHAREHOLDERS | INTERIM GROUP MANAGEMENT REPORT | INTERIM CONSOLIDATED FINANCIAL STATEMENTS | FURTHER INFORMATION
The Management Board of 3U stipulates sales and the consolidated segment result before financing and income taxes as major
performance indicators for a segment’s business success, since it considers them crucial to a sector’s success.
Below EBIT, the transition to the Group result is included in the column Group. The financial result is composed of interest income
and interest expenses as well as the share in profits and losses of companies included according to the at-equity method. The
interest income is the result of investments of liquidity that are not allocated to the segments. The taxes on income are also not
included in the segment result, since income tax can not be allocated to individual segments due to the fiscal unity concept.
The following cash flow data were produced for the 3U Group (all amounts in TEUR):
Cash flow data 2013 (in TEUR) Tele- Services Renew- Holding/ GroupJanuary 1–September 30, 2013 phony able Consoli-
Energies dation
Cash flows from operating activities 2.299 –2.584 17 –2.232 –2.500
Cash flows from investing activities –590 –64 –234 5.736 4.848
Cash flows from financing activities –1.762 2.236 2.902 –1.902 1.474
Cash flow data 2012 (in TEUR) Tele- Services Renew- Holding/ GroupJanuary 1–September 30, 2012 phony able Consoli-
Energies dation
Cash flows from operating activities –7,643 –1,254 –4,518 2,797 –10,618
Cash flows from investing activities 3,459 –118 –6,651 –10,641 –13,951
Cash flows from financing activities –330 980 10,485 –10,780 355
For the purposes of monitoring earnings power and allocating resources between the segments, the Management Board scruti-
nizes the financial assets allocated to the individual segment. Liquid funds are not allocated to any segment.

43
TO OUR SHAREHOLDERS | INTERIM GROUP MANAGEMENT REPORT | INTERIM CONSOLIDATED FINANCIAL STATEMENTS | FURTHER INFORMATION
(In TEUR) Sep 30, 2013 Dec 31, 2012
Assets
Segment Telephony 10,232 9,935
Segment Services 369 439
Segment Renewable Energies 22,257 25,720
Holding/Consolidation 14,595 18,720
Total segment assets 47,453 54,814
Assets not allocated 10,589 6,746
Total consolidated assets 58,042 61,560
Liabilities
Segment Telephony 2,291 1,306
Segment Services 4,985 3,227
Segment Renewable Energies 32,725 33,702
Holding/Consolidation –28,378 –27,405
Total segment liabilities 11,623 10,830
Reconciliation (shareholder’s equity/interests of non-controlling shareholders) 46,419 50,730
Total consolidated liabilities/shareholder’s equity 58,042 61,560
The uniform Group accounting policies and methods of calculation were applied in the segment reporting. Services between
segments are subject to adherence of the arm’s length principle and therefore Group wide calculated at prices that would be
agreed with third parties. Essentially the cost plus method is applied. Administrative services are calculated as cost allocations.
Long-term assets are located primarily within the country.
(In TEUR) Depreciation and amortisation InvestmentsJan 1–Sep 30 Jan 1–Sep 30
2013 2012 2013 2012
Segment Telephony 180 185 590 33
Segment Services 19 101 63 118
Segment Renewable Energies 902 165 244 6,680
Holding/Consolidation 363 241 520 8,970
Total 1,464 692 1,417 15,801

44
TO OUR SHAREHOLDERS | INTERIM GROUP MANAGEMENT REPORT | INTERIM CONSOLIDATED FINANCIAL STATEMENTS | FURTHER INFORMATION
Responsibility statement according to § 37y WpHG i. V.m. § 37w Abs. 2 Nr. 3 WpHG
To the best of our knowledge, and in accordance with the applicable reporting principles for interim financial reporting, the interim
consolidated financial statements give a true and fair view of the assets, liabilities, financial position and profit or loss of the group,
and the interim management report of the Group includes a fair review of the development and performance of the business and
the position of the Group, together with a description of the principal opportunities and risks associated with the expected develop-
ment of the Group for the remaining months of the financial year.
Marburg, November 8, 2013
The Management Board
Michael Schmidt Christoph Hellrung Andreas Odenbreit
Responsibility statement

45
TO OUR SHAREHOLDERS | INTERIM GROUP MANAGEMENT REPORT | INTERIM CONSOLIDATED FINANCIAL STATEMENTS | FURTHER INFORMATION
Contact
Company address
3U HOLDING AG
Frauenbergstraße 31–33
35039 Marburg
Postal address
3U HOLDING AG
Postfach 22 60
35010 Marburg
Investor relations
Peter Alex
Tel.: +49 (0) 6421 999-1200
Fax: +49 (0) 6421 999-1222
www.3u.net
Financial calendar
• Analysts’ conference
November 18, 2013
• Publication of the 2013 Annual Report
March 31, 2014
• Publication of report on Q1 2014
May 15, 2014
• Publication of report on Q2 2014
August 15, 2014
• Publication of report on Q3 2014
November 14, 2014
Imprint Disclaimer
Published by
3U HOLDING AG
Frauenbergstraße 31–33
35039 Marburg
Photographs
Fotolia — viktor Cap 2011 (title)
Font
Interstate by Tobias Frere-Jones
(manufacturer: The Font Bureau)
© 2013 3U HOLDING AG, Marburg
Printed in Germany
This quarterly report contains statements relating to the future which
are subject to risks and uncertainties and which are assessments of the
management of 3U HOLDING AG and reflect its current opinions with
regard to future events. Such predictive statements can be recognised by
the use of terms such as “expect”, “assume”, “estimate”, “anticipate”,
“intend”, “can”, “plan”, “project”, “will” and similar expressions. State-
ments relating to the future are based on current and valid plans, esti-
mates and expectations. Such statements are subject to risks and uncer-
tainties, most of which are difficult to estimate and which are generally
beyond the control of 3U HOLDING AG.
The following are — by no means exhaustive — examples of factors
that may trigger or affect a deviation: the development of demand for
our services, competitive factors — including price pressure —, techno-
logical changes, regulatory measures, risks in the integration of newly
acquired companies. If any of these or other risks and uncertain factors
occur, or if the assumptions on which the statements are based prove to
be incorrect, the actual results of 3U HOLDING AG may differ materially
from those outlined or implied in these statements. The company does
not undertake to update predictive statements of this nature.
This quarterly report contains a range of figures which are not part of
commercial regulations and the International Financial Reporting Stan-
dards (IFRS), such as EBT, EBIT, EBITDA and EBITDA adjusted for special
influences, adjusted EBITDA margin, investments (capex). These figures
are not intended to substitute the information for 3U HOLDING AG in
accordance with the German Commercial Code (HGB) or IFRS. It should be
noted that the figures for 3U HOLDING AG which are not part of commer-
cial regulations and the IFRS, can only be compared to the correspon-
ding figures of other companies to a certain extent.
TO OUR SHAREHOLDERS | INTERIM GROUP MANAGEMENT REPORT | INTERIM CONSOLIDATED FINANCIAL STATEMENTS | FURTHER INFORMATION
46

TO OUR SHAREHOLDERS | INTERIM GROUP MANAGEMENT REPORT | INTERIM CONSOLIDATED FINANCIAL STATEMENTS | FURTHER INFORMATION
3U Group
3U HOLDING AG
Telephony Services Renewable Energies
010017 Telecom GmbHMarburg, Germany
3U TELECOM GmbHMarburg, Germany
Discount Telecom S&V GmbHMarburg, Germany
LineCall Telecom GmbHMarburg, Germany
Spider Telecom GmbH*Marburg, Germany
Triast GmbHKreuzlingen, Switzerland
TriTelA GmbHVienna, Austria
ACARA Telecom GmbHMarburg, Germany
3U MOBILE GmbHMarburg, Germany
OneTel Telecommunication GmbHMarburg, Germany
3U TELECOM GmbHVienna, Austria
3U DYNAMICS GmbHMarburg, Germany
myFairPartner Limited**London, Great Britain
RISIMA Consulting GmbHMarburg, Germany
weclapp GmbHMarburg, Germany
weclapp Inc.Delaware, USA
EuroSun Vacuum-Solar-Systems GmbH
Marburg, Germany
EEPB Erneuerbare Energien Planungs- und Beratungsgesellschaft mbH
Dransfeld, Germany
Tianjin EuroSun SolarenergyTechnology Co. Ltd.
Tianjin, China
Sanhe EuroSolar Solar EnergyTechnology Ltd.*
Sanhe, China
ClimaLevel Energiesysteme GmbHCologne, Germany
Selfio GmbHLinz am Rhein, Germany
Windpark DBF GmbHMarburg, Germany
3U ENERGY AGMarburg, Germany
3U Einkauf & Logistik GmbHMontabaur, Germany
Immowerker GmbHMarburg, Germany
3U SOLAR (PTY) Ltd.Somerset West, South Africa
*“At equity” included investments
**Other investments
Exacor GmbHMarburg, Germany
fon4U Telecom GmbHMarburg, Germany
Solarpark Adelebsen GmbHAdelebsen, Germany

3013
/103
2
3U HOLDING AGPostfach 22 6035010 Marburg
Tel.: +49 (0) 6421 999-1200Fax: +49 (0) 6421 999-1222
[email protected] www.3u.net