QUARTERLY MOBILE INDEX - Automation Solutions for Digital …€¦ · ®2017 PUBMATIC, INC. ALL...
12
QUARTERLY MOBILE INDEX Q4 2016 & Full Year Look Back
Transcript of QUARTERLY MOBILE INDEX - Automation Solutions for Digital …€¦ · ®2017 PUBMATIC, INC. ALL...

QUARTERLY MOBILE INDEXQ4 2016 & Full Year Look Back

® 2 0 1 7 P U B M AT I C , I N C . A L L R I G H T S R E S E R V E D Q 4 2 0 1 6 Q U A R T E R LY M O B I L E I N D E X A N D F U L L Y E A R L O O K B A C K / 2
PubMatic’s QUARTERLY MOBILE INDEX (QMI) REPORT was created to provide both publishers and advertisers with key insights into the mobile advertising industry.
By analyzing the billions of digital impressions that flow through PubMatic’s platform, SEVEN, each day, we at PubMatic can observe real-time developments in the mobile space that allude to broader digital industry trends. We can then compare this information to other published data to further understand changes in the mobile landscape. We are committed to providing best-in-class mobile tools and services, and we believe that information sharing is crucial in
aligning the digital industry towards best practices and, ultimately, growth in mobile advertising.
In our Q4 2016 report, we have expanded our scope from quarterly analysis to a full year look back and have added several benchmarks for mobile advertising performance around pricing, volume and growth.
Note that directional data might not be comparable with prior reports.
About PubMatic’s Quarterly Mobile Index (QMI):

® 2 0 1 7 P U B M AT I C , I N C . A L L R I G H T S R E S E R V E D Q 4 2 0 1 6 Q U A R T E R LY M O B I L E I N D E X A N D F U L L Y E A R L O O K B A C K / 3
IN Q4 2016, THE FOLLOWING SIX KEY TRENDS HAVE EMERGED:
KEY TREND #1: Header bidding remained one of the biggest success stories of 2016, as mobile monetized header bidding impressions from the tactic grew nearly 50X year over year in Q4.
KEY TREND #2: Mobile PMP impression volume grew over 200% YOY in Q4 2016 and eCPMs nearly doubled, reflecting brand buyers’ shift to programmatic advertising channels in 2016.
KEY TREND #3: Automotive and technology verticals drove Mobile PMP spend during the holiday shopping season, continuing year-long growth trends in 2016.
KEY TREND #4: Mobile app monetization opportunity continues to mature, reducing the impression gap with mobile web while garnering nearly 60% higher eCPMs.
KEY TREND #5: Android app monetized inventory volumes caught up with iOS in 2016 and will likely surpass iOS in 2017, while Android app eCPMs exceeded their Apple counterparts for the first time.
KEY TREND #6: Mobile provides significant opportunities across the globe; APAC currently represents the fastest-growing opportunity while EMEA leads the world in mobile eCPMs.

1. Publishers continue to realize benefits from header bidding tactics as mobile growth exceeds the pace of digital advertising growth1. The proliferation of header bidding technology for programmatic monetization has moved to the mainstream. Adoption by publishers and app developers is hard to pass up given the value that this pace of growth represents to both. With multi-format header bidding, publishers can better capture the true value of their inventory through auction dynamics available via RTB pipes. Publishers who have not implemented header bidding would see benefits from doing so, while markets can benefit from understanding the increased control and scale available to them through the democratization of inventory access.
2. The shift of brand advertising to programmatic is buoyed by mobile PMP opportunities whereby a marketer gains transparency and control over an open RTB environment. By targeting specific content and audiences via private marketplace packages, brand marketers are able to lock down inventory quality while header bidding provides scale by allowing significant access to inventory. Mobile PMP grew substantially, supported by PMP direct and guaranteed demand. Publishers who focus on developing and merchandising PMP opportunities should be rewarded with increased demand at attractive eCPMs. Advertisers who excel at PMP buying techniques will experience the benefits of programmatic while maintaining the transparency and control they require.
3. Consumer buying patterns are developing for mobile as they did for display. Seasonal and category advertising growth reflects consumer behavior on mobile devices as opposed to those trends established via desktop access to inventory. The automation of digital media selling and buying does not diminish the value of understanding consumer behavior to capitalize on seasonal trends, vertical marketing strategies, and time based activity.
4. Mobile app advertising opportunities are becoming on par with mobile web. Mobile app paid impressions and eCPMs are on the rise. Publishers who rely solely on mobile web monetization strategies would benefit from considering the available opportunities while marketers discover definitive audience targeting opportunities available via this channel.
® 2 0 1 7 P U B M AT I C , I N C . A L L R I G H T S R E S E R V E D Q 4 2 0 1 6 Q U A R T E R LY M O B I L E I N D E X A N D F U L L Y E A R L O O K B A C K / 4
WHAT DOES THIS MEAN FOR PUBLISHERS AND ADVERTISERS?

® 2 0 1 7 P U B M AT I C , I N C . A L L R I G H T S R E S E R V E D Q 4 2 0 1 6 Q U A R T E R LY M O B I L E I N D E X A N D F U L L Y E A R L O O K B A C K / 5
KEY TREND #1:Header bidding remained one of the biggest success stories of 2016, as mobile monetized header bidding impressions from the tactic grew nearly 50X year over year in Q4.2016 was the year that header bidding matured from a new technological innovation to become known as a standard method of digital advertising transaction. Publishers identified higher CPMs as the greatest benefit of bidding adoption2, while buyers relished the increased access to quality inventory across both desktop and mobile web platforms. Over the course of 2016, global mobile web impressions monetized via header bidding technology increased over 4,800% versus the year prior, when the tactic was relatively new to the industry, particularly in markets outside of the United States.
During 2016, header bidding on mobile was limited almost exclusively to mobile web, where it saw a significant acceleration of adoption over the year. Monetized mobile impression volumes transacted
via the technology rose steadily each quarter, nearly doubling between Q3 2016 and Q4 2016. The popularity of header bidding became a global trend, with EMEA emerging as a major market for header bidding while APAC came onboard in Q2 2016.
Header bidding enabled impressions represented three quarters of PubMatic’s total available impression pool by the end of 2016. This share, as well as the volume of mobile impressions transacted via header bidding, should continue to rise as more mobile web publishers adopt the technology. Innovations in header bidding technology, such as its introduction into the mobile app monetization market, should further enhance the impact that header bidding has on publisher monetization strategies going into 2017.
+341% +7%
+99%
2016 Mobile Web Header Bidding Impression Volume and QoQ Change (by Quarter)
Q1 2016 Q2 2016 Q3 2016 Q4 2016
Mobile Web Header Bidding Impression Share, By Region
(Q4 2015 vs. Q4 2016)
Q4 2016
Q4 2015
+50X YOY Volume
Growth
Americas: 86%EMEA: 13%APAC: 1%
Americas: 94%EMEA: 6%
+426%

® 2 0 1 7 P U B M AT I C , I N C . A L L R I G H T S R E S E R V E D Q 4 2 0 1 6 Q U A R T E R LY M O B I L E I N D E X A N D F U L L Y E A R L O O K B A C K / 6
KEY TREND #2:Mobile PMP impression volume grew over 200% in Q4 2016 and eCPMs nearly doubled YOY, reflecting brand buyers’ shift to programmatic advertising channels in 2016.Advertiser demand is shifting simultaneously toward high-quality inventory and automated transacting, while consumer behavior continues to veer towards mobile-first browsing. The result has led to an increase in popularity for mobile private marketplaces (PMPs). Globally, mobile PMPs reached a historic high in terms of monetized inventory volume in Q4 2016, rising over 200% year over year. This came at the end of a steady increase in year over year volume throughout every quarter of the year.
Mobile web remains the main driver of mobile PMP volume, accounting for three quarters of mobile PMP monetized impressions globally in 2016. The Americas and EMEA both saw app inventory increase in share of monetized impressions. In APAC, however, which remained the smallest portion of the mobile PMP category worldwide with less than 5% of total impressions monetized across our platform, Android app inventory emerged as a
key growth driver, with a more than 40% share in 2016. Android app inventory for private auctions will likely expand in 2017 as advertisers seek to connect with increasingly sophisticated consumers who own devices powered by the leading operating system in the region.
In addition to the growing popularity of programmatic direct transacting, it is clear that the value of the channel to the buy-side is continuing to increase. Mobile PMPs garnered 360% higher eCPMs than the mobile average in Q4 2016, up from a 192% premium a year prior. The increase in pricing differential is a result of a nearly double (92%) year over year increase in mobile PMP eCPMs in Q4 2016. This reflects the shift of more brand direct dollars to programmatic channels; as the quality of demand increases, so too does the quality of the inventory transacted upon, leading to higher eCPMs for PMPs.
2016 Mobile PMP Impression Volume & YOY Change (by Quarter)
Q1 2016 Q2 2016 Q3 2016 Q4 2016
202%295%243%
423%
VOLUME
YOY CHANGE
Mobile PMP eCPMs vs. Average Mobile eCPMs
Q1 2015 Q1 2016
MOBILE AVG
MOBILE PMP
+192% +360%

® 2 0 1 7 P U B M AT I C , I N C . A L L R I G H T S R E S E R V E D Q 4 2 0 1 6 Q U A R T E R LY M O B I L E I N D E X A N D F U L L Y E A R L O O K B A C K / 7
KEY TREND #3:Automotive and technology verticals drove Mobile PMP spend during the holiday shopping season, continuing year-long growth trends in 2016.Monetized mobile PMP impressions within the automotive and technology verticals both grew over 350% year over year in Q4 2016. These verticals typically drive consumer spending during the fourth quarter holiday season, when automotive advertisers historically invest in year-end sales events and consumers are looking for high-tech holiday gifts.
Mobile eCPMs for automotive PMPs rose 24% year over year in Q4 2016. Looking closely at the price and volume data, auto PMP impression volumes show a steady rise in the weeks leading up to Black Friday (November 25) during Week 8, while eCPMs remained steady throughout the quarter.
Technology PMPs also fared well during the holiday season, with mobile eCPMs growing 108%, more than double year over year. Technology PMP eCPMs spiked in Week 5. Monetized mobile PMP impressions in the technology vertical spiked in Week 11 of the quarter, in the days leading up to Christmas (December 25). According to the National Retail Federation, the biggest shopping day of the season was Super Saturday, December 173, and PubMatic’s platform data shows that advertisers took advantage of the prolonged shopping season with an extended spike in mobile PMP spending on the technology vertical.
Automotive Vertical Weekly Mobile PMP Performance By Week (Q4 2016)
BLACK FRIDAY
NOV.25
IMPRESSIONS eCPM
Technology Vertical Weekly Mobile PMP Performance By Week (Q4 2016)
IMPRESSIONS eCPM
SUPERSATURDAY
DEC.17
1 2 3 4 5 6 7 8 9 10 11 12 13
1 2 3 4 5 6 7 8 9 10 11 12 13
BLACK FRIDAY
NOV.25
CHRISTMASDAY
DEC.25
® 2 0 1 7 P U B M AT I C , I N C . A L L R I G H T S R E S E R V E D Q 4 2 0 1 6 Q U A R T E R LY M O B I L E I N D E X A N D F U L L Y E A R L O O K B A C K / 8
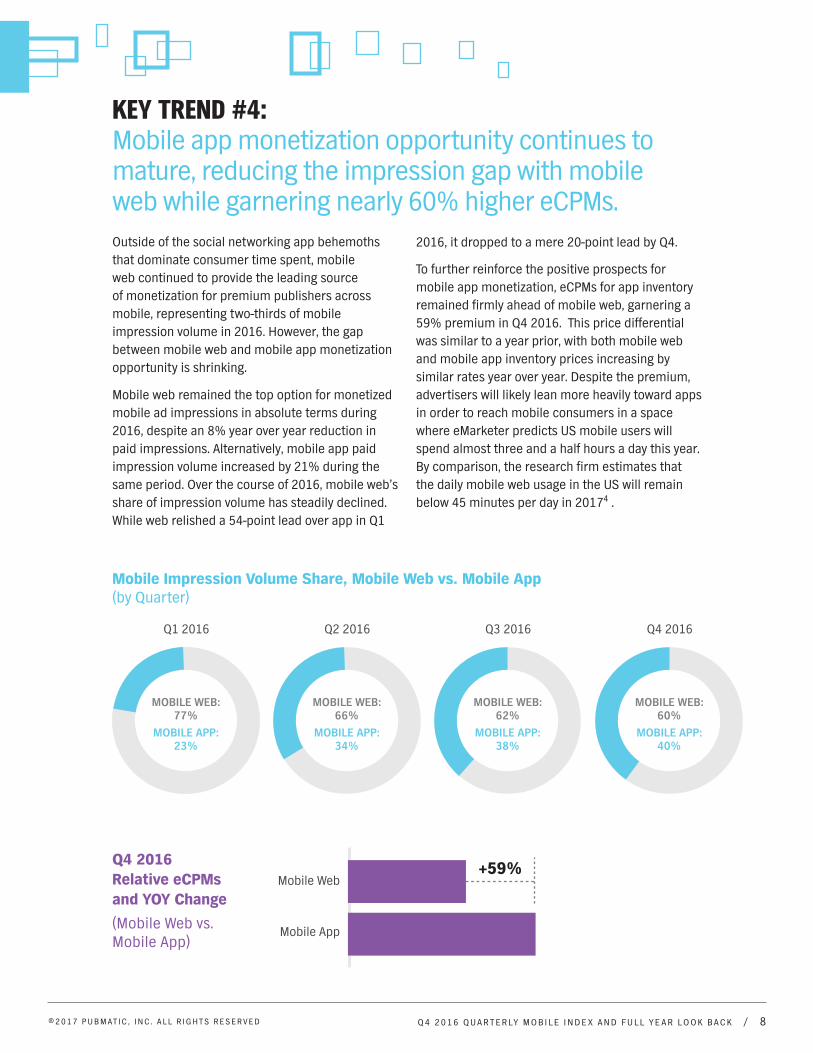
KEY TREND #4:Mobile app monetization opportunity continues to mature, reducing the impression gap with mobile web while garnering nearly 60% higher eCPMs.Outside of the social networking app behemoths that dominate consumer time spent, mobile web continued to provide the leading source of monetization for premium publishers across mobile, representing two-thirds of mobile impression volume in 2016. However, the gap between mobile web and mobile app monetization opportunity is shrinking.
Mobile web remained the top option for monetized mobile ad impressions in absolute terms during 2016, despite an 8% year over year reduction in paid impressions. Alternatively, mobile app paid impression volume increased by 21% during the same period. Over the course of 2016, mobile web’s share of impression volume has steadily declined. While web relished a 54-point lead over app in Q1
2016, it dropped to a mere 20-point lead by Q4.
To further reinforce the positive prospects for mobile app monetization, eCPMs for app inventory remained firmly ahead of mobile web, garnering a 59% premium in Q4 2016. This price differential was similar to a year prior, with both mobile web and mobile app inventory prices increasing by similar rates year over year. Despite the premium, advertisers will likely lean more heavily toward apps in order to reach mobile consumers in a space where eMarketer predicts US mobile users will spend almost three and a half hours a day this year. By comparison, the research firm estimates that the daily mobile web usage in the US will remain below 45 minutes per day in 20174 .
Q1 2016
MOBILE WEB: 77%
MOBILE APP: 23%
Q2 2016
MOBILE WEB: 66%
MOBILE APP: 34%
Q3 2016
MOBILE WEB: 62%
MOBILE APP: 38%
Q4 2016
MOBILE WEB: 60%
MOBILE APP: 40%
Mobile Impression Volume Share, Mobile Web vs. Mobile App(by Quarter)
Q4 2016 Relative eCPMs and YOY Change
(Mobile Web vs. Mobile App)
Mobile App
Mobile Web+59%

® 2 0 1 7 P U B M AT I C , I N C . A L L R I G H T S R E S E R V E D Q 4 2 0 1 6 Q U A R T E R LY M O B I L E I N D E X A N D F U L L Y E A R L O O K B A C K / 9
KEY TREND #5:Android app monetized inventory volumes caught up with iOS in 2016 and will likely surpass iOS in 2017, while Android app eCPMs exceeded their Apple counterparts for the first time.
Mobile app inventory has emerged as a key digital display growth driver globally in 2016, with Android apps leading the charge. Android app eCPMs improved by 79% in Q4 2016 over the same period in 2015, following at least double-digit year over year growth each previous quarter of the year. The growth led to global Android app eCPMs exceeding their iOS counterparts in Q4 for the first quarter in the two years we have been tracking. The story is not bleak for those focused on monetizing iOS apps; the Apple inventory saw price increases as well, with eCPMs rising 5% year over year in Q4.
Android’s leadership in eCPM growth position was consistent across all regions, and the price gap between iOS and Android inventory was virtually
erased globally. In North America, where Apple’s share of smartphone sales grew from parity with Android in December 2014 to a mere 31.8% share in June 20165, iOS app inventory saw a slight decline in average price in Q4 2016. The EMEA region saw the largest rise in mobile app eCPMs across both operating systems, with Android eCPMs rising 110% year over year and iOS eCPMs rising 70% over the same period. In APAC, the world’s largest mobile phone market overall6, both Android- and Apple-powered devices saw rising eCPM’s, with Android leading the charge with 87% growth year over year in Q4 while iOS eCPMs in the region rose 23%.
Mobile App eCPM YOY Change by OS and Region (Q4 2016)
AMERICAS
-4%
EMEA APAC
+70%+78% +110% +23%+87%
AMERICAS EMEA APAC

® 2 0 1 7 P U B M AT I C , I N C . A L L R I G H T S R E S E R V E D Q 4 2 0 1 6 Q U A R T E R LY M O B I L E I N D E X A N D F U L L Y E A R L O O K B A C K / 1 0
KEY TREND #5 CONT.
In addition to pricing changes, the volume gap between Android and iOS inventory across our platform disappeared as well by the end of 2016. The share of paid app impressions across the PubMatic platform that were accessed via Apple devices dropped from two-thirds in 2015 to about half of the total in 2016, with Android consisting of 49% of monetized mobile app impressions last year. A closer look reveals that Android-powered devices served almost two-thirds (62%) of the mobile app paid impressions in Q4 2016. If recent quarterly trends persist, the Android operating system will likely build a considerable lead in the mobile programmatic space in 2017.
Share of Monetized App Impressions (by Year)
Share of Monetized App Impressions (Q4 by Year)
2015ANDROID: 37%
iOS: 63%
2016ANDROID: 49%
iOS: 51%
Q4 2015ANDROID: 44%
iOS: 56%
Q4 2016ANDROID: 62%
iOS: 38%

® 2 0 1 7 P U B M AT I C , I N C . A L L R I G H T S R E S E R V E D Q 4 2 0 1 6 Q U A R T E R LY M O B I L E I N D E X A N D F U L L Y E A R L O O K B A C K / 1 1
KEY TREND #6:Mobile provides significant opportunities across the globe; APAC currently represents the fastest-growing opportunity while EMEA leads the world in mobile eCPMs.Across all global regions, we saw significant year over year increases in mobile monetization. Once again, the Americas represented the largest opportunity, with mobile monetized impression volumes over eight times those in EMEA and nearly 14 times those in APAC though the region experienced a 31% year over year decline in monetized impression volume in Q4 2016. In terms of inventory pricing, the region experiences strong eCPM growth of 36% in Q4 2016 versus Q4 2015. The increase in price is likely due to the advertiser shift in focus towards transacting on higher quality ad inventory programmatically, with 90% of US marketers identifying better targeting as a benefit of programmatic buying7.
Despite the Americas’ leadership position in global mobile monetization, APAC, the smallest market
for mobile monetization, saw the fastest growth rate for monetized mobile impressions in Q4 2016, increasing by 124% year over year and catching up to EMEA in terms of volume. This substantial growth rate offset the APAC region’s eCPM dip of 5% year over year during the same period. The EMEA region, on the other hand, experienced the highest annual growth rate in mobile inventory price, with eCPMs rising 122% in Q4 2016 year over year.
The result of these trends for buyers and sellers of digital media represent that major growth opportunities exist across all regions. A recent eMarketer study projects that mobile phone user penetration will reach 62.6% worldwide by 20208, and Zenith’s Media Consumption Forecasts claims that 70% of internet use is now on a mobile device9.
Q4 2016 Monetized Impression Volume(by Global Region)
Q4 2016 Monetized Impression YOY Change(by Global Region)
Americas
Americas: 67%
EMEA: 17%
APAC: 16%
-31%
EMEA +44%
APAC +124%
Q4 2016 eCPM YOY Change (by Global Region)
Americas +36%
EMEA +122%
APAC-5%
PubMatic is a registered trademark of PubMatic, Inc. Other trademarks are the property of their respective owners.
Disclaimer: This QMI may include inaccuracies or typographical errors, and is based on operational data that has not been audited or reviewed by a third party. It may contain forward-looking statements about future results and other events that have not yet occurred. Actual results may differ materially from PubMatic’s expressed expectations due to future risks and uncertainties, and past performance or trends are no guarantee of future results. PubMatic does not intend to update the information contained in this QMI if any information or statement contained herein later turns out to be inaccurate.
1 “Digital Ad Spending Growth in the US and Worldwide, by Device, 2014-2020,” eMarketer, Dec 20162 “US Digital Display Advertising Trends 2017: Nine Things Changing the Way Buyers and Sellers Do Business,” eMarketer, Jan 20173 “The Busiest Shopping Day of the Holiday Season Isn’t Black Friday,” Phil Wahba, Fortune, Dec 16, 20174 “US Time Spend with Mobile: A Deep Dive into Mobile App and Web Time,” Catherine Boyle, eMarketer, Jan 26, 20175 “Global Mobile Landscape 2016: A Country-by-Country Look at Mobile Phone and Smartphone Usage,” Jasmine Enberg, eMarketer, Nov 16, 20166 ibid7 “ANA/Forrester Q1 2016 US Programmatic Media Buying Online Survey,” Forrester, Aug 20168 “Global Mobile Landscape 2016: A Country-by-Country Look at Mobile Phone and Smartphone Usage,” Jasmine Enberg, eMarketer, Nov 16, 20169 “How Mobile is Overtaking Desktop for Global Media Consumption, in 5 Charts,” Jemma Brackebush, Digiday, June 14 2016, http://digiday.com/publishers/mobile-overtaking-desktops-around-world-5-charts/
QMI Methodology PubMatic’s yield and data analytics team analyzes billions of impressions on a daily basis, utilizing the
company’s best-in-class analytics capabilities. The Q4 2016 QMI incorporates impressions, revenue
and eCPM data from these daily reports to provide a high-level glimpse of key trends within the mobile
advertising industry. Data is from the fourth quarter of 2016 (i.e. October 1, 2016 through December
31, 2016) and calendar year 2016 (i.e. January 1, 2016 through December 31, 2016), as well as the
corresponding prior year periods. “Monetized impressions” or “paid impressions” are defined as
impressions that were sold through the PubMatic platform, and “eCPM” is defined as the cost per one
thousand impressions.
About PubMaticPubMatic is the automation solutions company for an open digital media industry. Featuring the
leading omni-channel revenue automation platform for publishers and enterprise-grade programmatic
tools for media buyers, PubMatic’s publisher-first approach enables advertisers to access premium
inventory at scale. Processing nearly one trillion ad impressions per month, PubMatic has created a
global infrastructure to activate meaningful connections between consumers, content and brands.
Since 2006, PubMatic’s focus on data and technology innovation has fueled the growth of the
programmatic industry as a whole. Headquartered in Redwood City, California, PubMatic operates 11
offices and six data centers worldwide.
PubMatic Contacts:
OSBALDO FRANCODirector, Marketing Research
JOHANNA BAUMANSr. Director, Marketing Communications
Sales Contacts:
MICHAEL ADAIRVice President, Publisher Development,
Americas
CRAIG CHINNVice President, Customer Success,
Americas
KYLE DOZEMANVice President, Advertiser Solutions,
Americas
BILL SWANSONVice President, EMEA
JASON BARNESVice President, APAC
Press Contacts:
PAIGE F. MACGREGORDirector, Corporate Communications